
2021-11-12
Informational purposes only. The content in this report, including allocations, analysis, and commentary, is provided solely for informational and educational purposes. It does not constitute financial advice, investment advice, trading advice, or any other type of advice. Past performance does not guarantee future results. Always conduct your own research and consult a qualified financial professional before making investment decisions.
Weekly Allocation
| Ticker | Category | Weight | Role |
|---|---|---|---|
| FSOL | 50% | Overlay | |
| URNM | Nuclear Energy | 10% | Top-2 (10%) |
| XLE | Traditional Energy | 10% | Top-2 (10%) |
| GLD | Precious Metals | 5% | Tier-2 (5%) |
| XLK | Technology | 5% | Tier-2 (5%) |
| PAVE | Utilities & Infrastructure | 5% | Tier-2 (5%) |
| SMH | AI | 5% | Tier-2 (5%) |
| COPX | Industrial Metals | 5% | Tier-2 (5%) |
| MOO | Agriculture & Livestock | 5% | Tier-2 (5%) |
Trade Instructions — Monday Open
Sell the tranche from 2021-10-15 (completing its 4-week hold). Buy the new tranche. Instructions show net portfolio changes — same-asset positions cancel, weight changes show the delta.
| Action | Ticker | Instruction |
|---|---|---|
| SELL | COPX | Sell 25% of COPX position (reduce 5.00% → 3.75%) |
| SELL | WEAT | Sell entire WEAT position (1.25% of portfolio) |
| SELL | URA | Sell entire URA position (1.25% of portfolio) |
| SELL | CIBR | Sell 25% of CIBR position (reduce 5.00% → 3.75%) |
| SELL | IGF | Sell entire IGF position (1.25% of portfolio) |
| SELL | ITA | Sell 50% of ITA position (reduce 2.50% → 1.25%) |
| BUY | URNM | Buy URNM — 33.33% of freed cash (adds 2.50% to portfolio) |
| BUY | PAVE | Buy PAVE — 16.67% of freed cash (adds 1.25% to portfolio) |
| BUY | MOO | Buy MOO — 16.67% of freed cash (adds 1.25% to portfolio) |
| BUY | GLD | Buy GLD — 16.67% of freed cash (adds 1.25% to portfolio) |
| BUY | XLK | Buy XLK — 16.67% of freed cash (adds 1.25% to portfolio) |
Current Portfolio After Trade
Combined holdings across all 4 active tranches. Each tranche is 25% of the portfolio.
| Ticker | % of Portfolio | Weight Bar |
|---|---|---|
| FSOL | 50.00% | |
| XLE | 10.00% | |
| URNM | 10.00% | |
| PAVE | 5.00% | |
| COPX | 3.75% | |
| CIBR | 3.75% | |
| MOO | 3.75% | |
| GLD | 3.75% | |
| SMH | 2.50% | |
| ITA | 1.25% | |
| INDA | 1.25% | |
| SLV | 1.25% | |
| REMX | 1.25% | |
| XAR | 1.25% | |
| XLK | 1.25% |
Macro Regime — Transition / Mixed
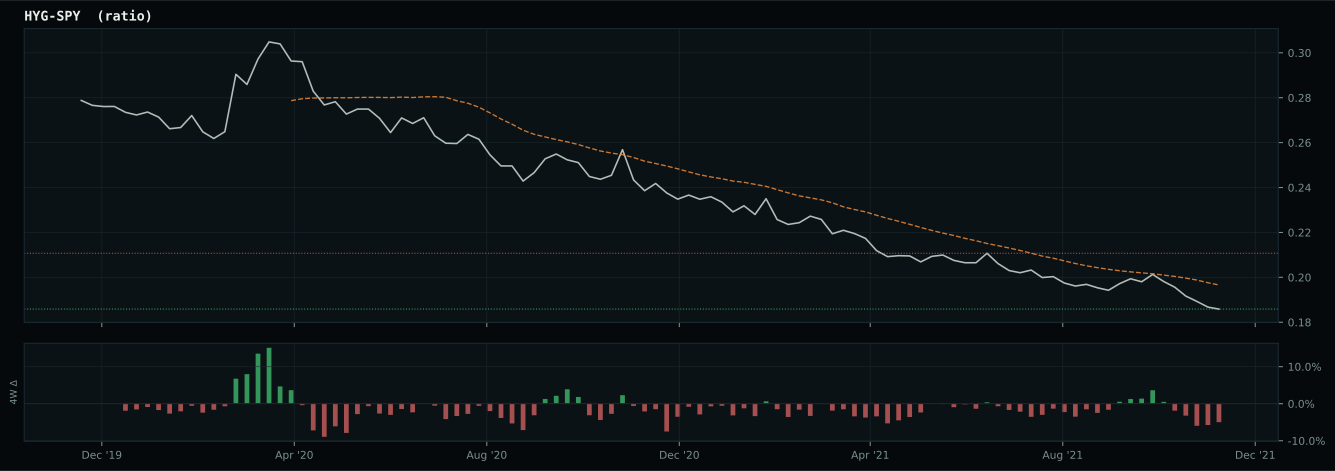
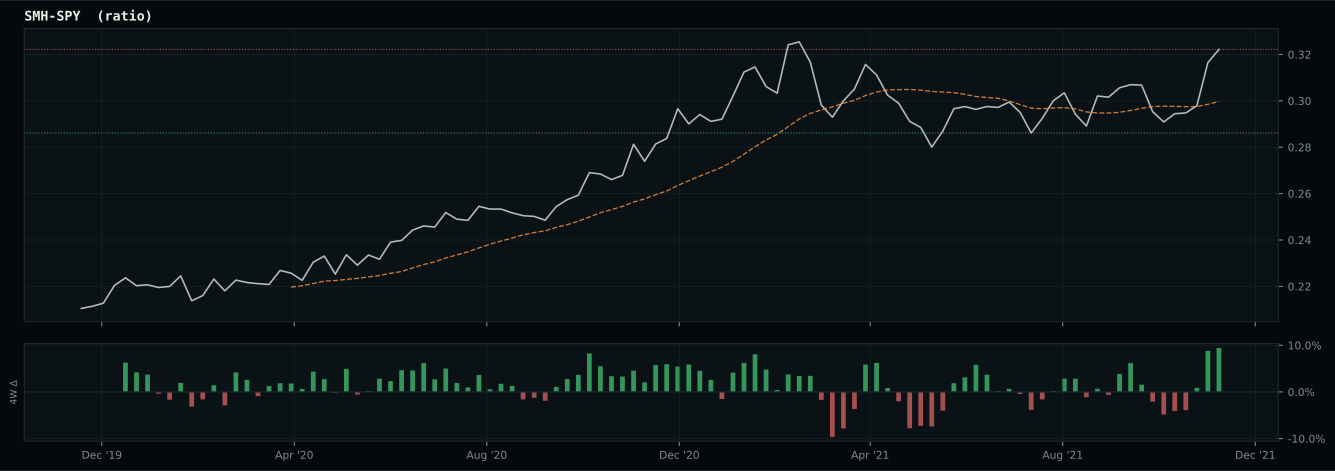
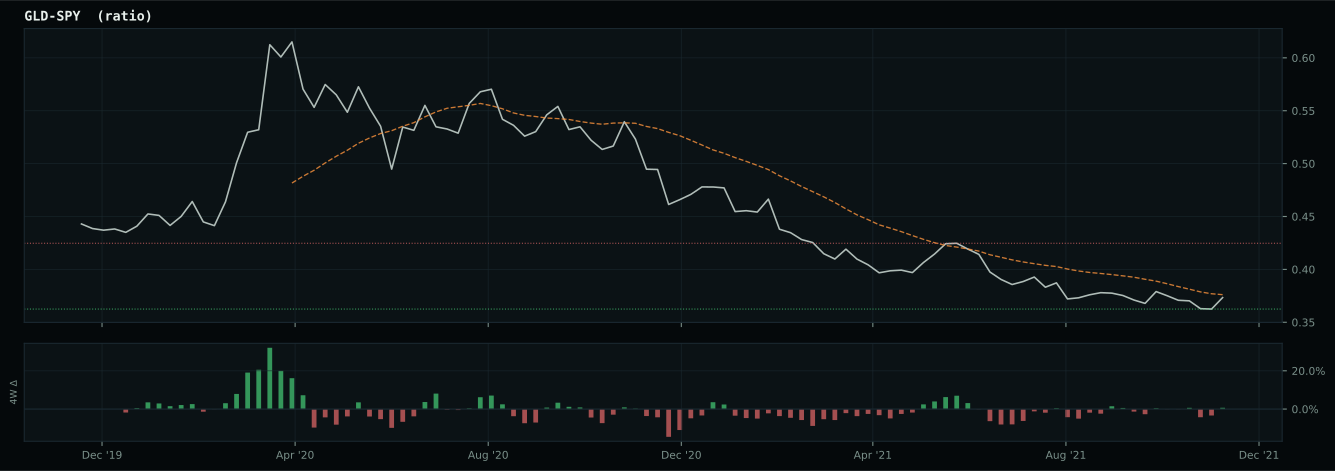
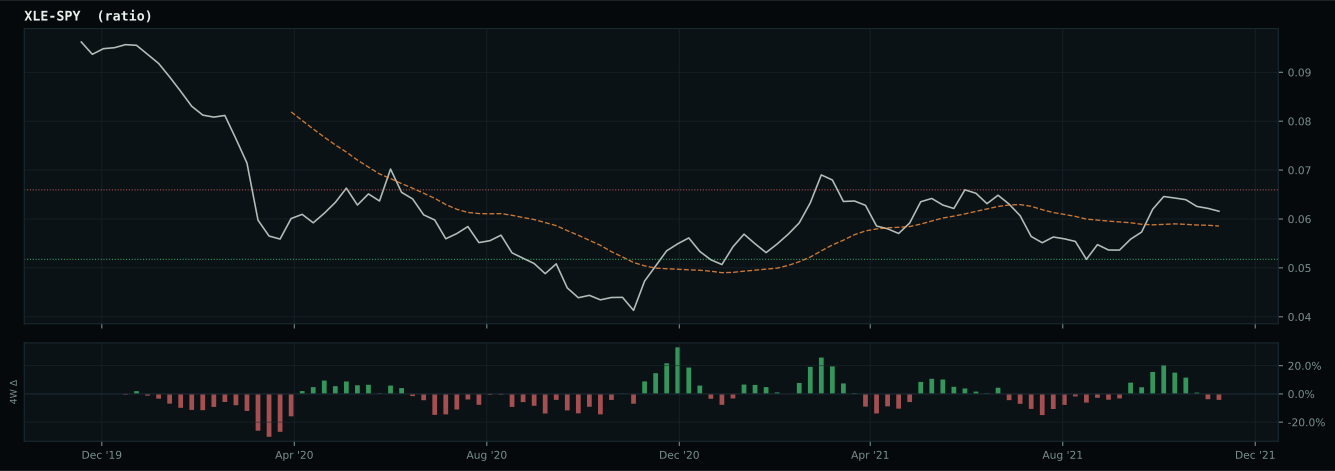
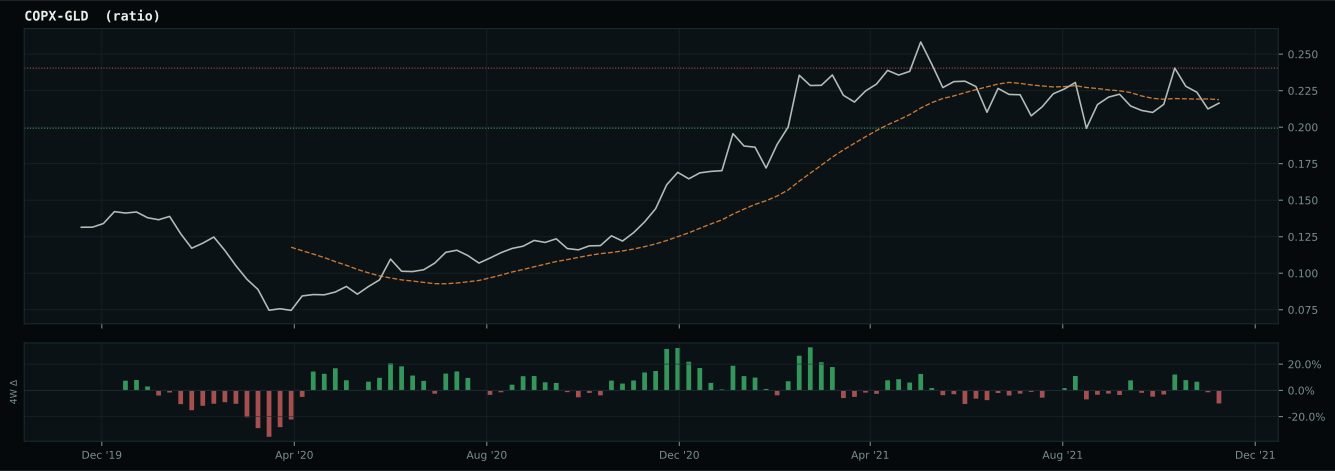
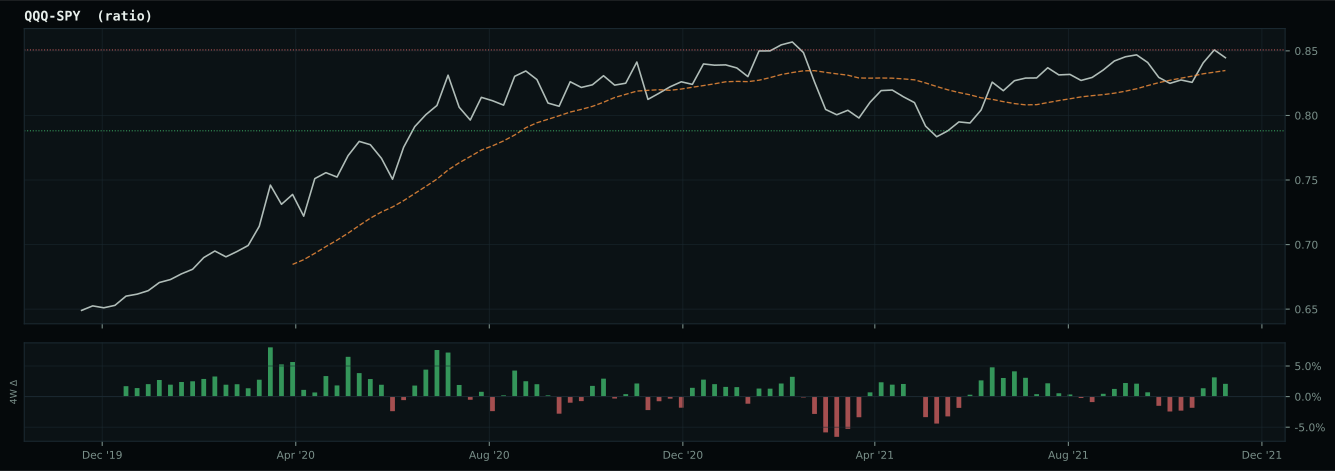
Macro Evidence Charts
Market-implied signals behind the macro regime scores. Each ratio compares two assets; the direction and slope of the ratio is what the macro engine reads.
Crypto Regime — AltSeason
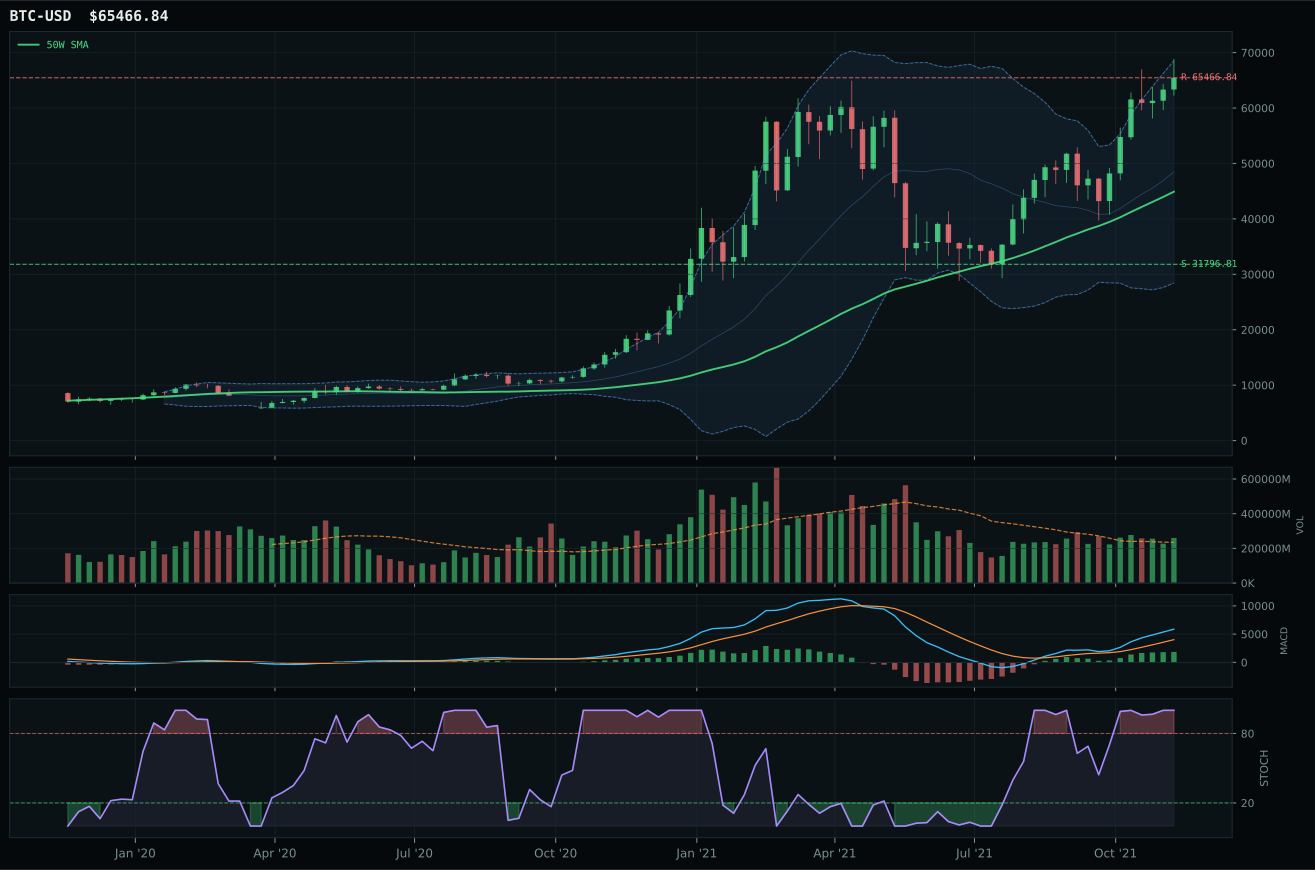
ValueBTC not armed: BTC has not made the first post-breakdown touch of the 200W buy zone after losing the 50W
TrendBTC confirmed: 2 consecutive closes above rising/flat 50W SMA
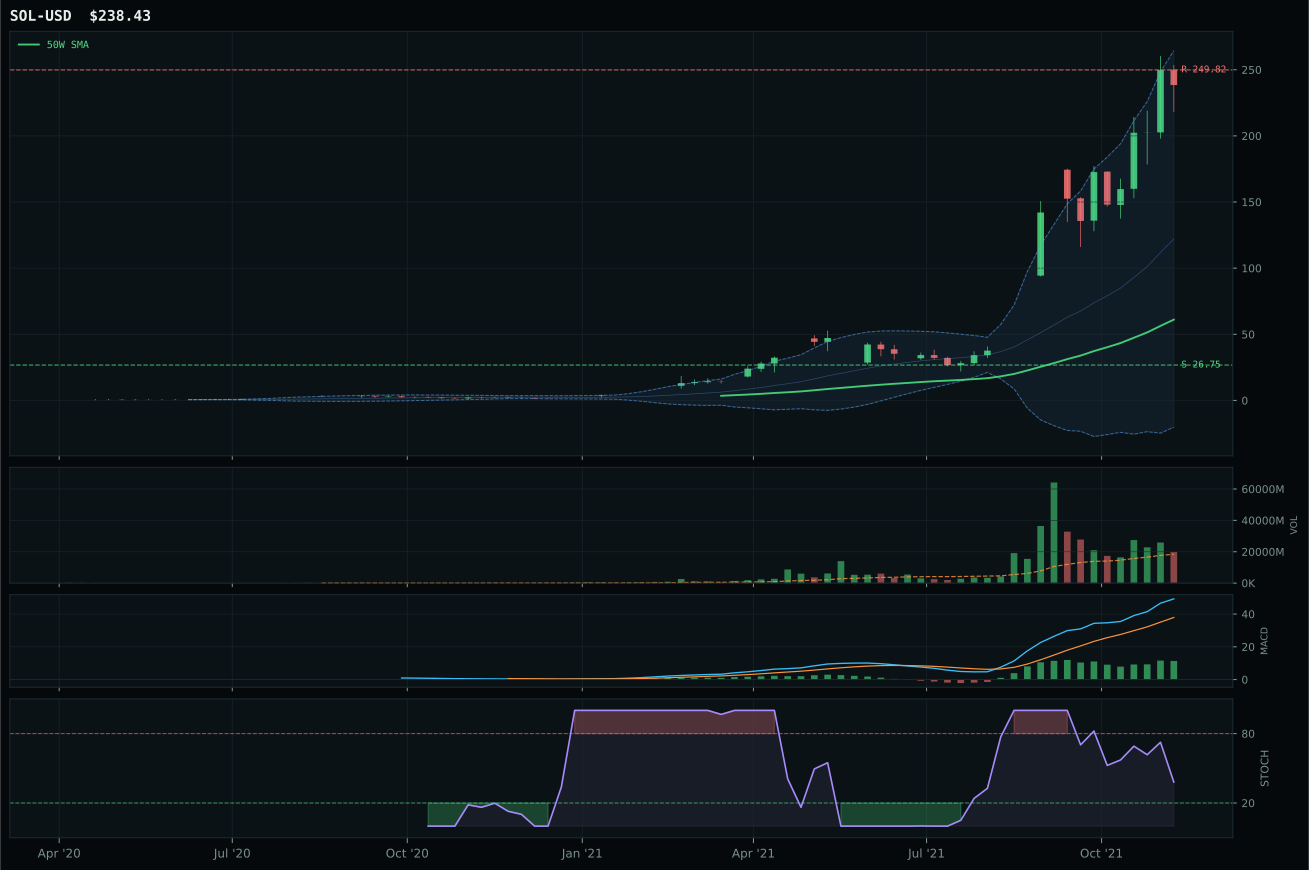
all available AltSeason conditions pass; missing optional confirmations skipped
Category Rankings
| Rank | Category | Winner | Score | Alloc | 4W Ret | Peers (4W) |
|---|---|---|---|---|---|---|
| 1 | Nuclear Energy | URNM | 67.9 | 20% | -24.03% | URA -21.6% · NLR -3.4% |
| 2 | Traditional Energy | XLE | 64.0 | 20% | -1.34% | XOP -6.6% · FCG -4.8% |
| 3 | Precious Metals | GLD | 63.8 | 10% | -4.14% | SLV -11.0% · GDX -12.2% |
| 4 | Technology | XLK | 60.6 | 10% | +4.32% | CIBR -9.0% · IGV -8.3% |
| 5 | Utilities & Infrastructure | PAVE | 60.0 | 10% | -1.69% | IGF -4.3% · XLU +3.2% |
| 6 | AI | SMH | 59.2 | 10% | +1.82% | BOTZ -6.5% · AIQ -3.7% |
| 7 | Industrial Metals | COPX | 57.9 | 10% | -2.56% | REMX -1.2% · PICK -3.5% |
| 8 | Agriculture & Livestock | MOO | 49.6 | 10% | -2.83% | WEAT -5.2% · VEGI -4.1% |
| 9 | Defense & Aerospace | XAR | 48.6 | 0% | -7.42% | ITA -6.2% · ROKT -5.8% |
| 10 | Emerging Markets | INDA | 13.9 | 0% | -10.65% | IEMG -6.5% · ILF -8.1% |
Nuclear Energy — URNM
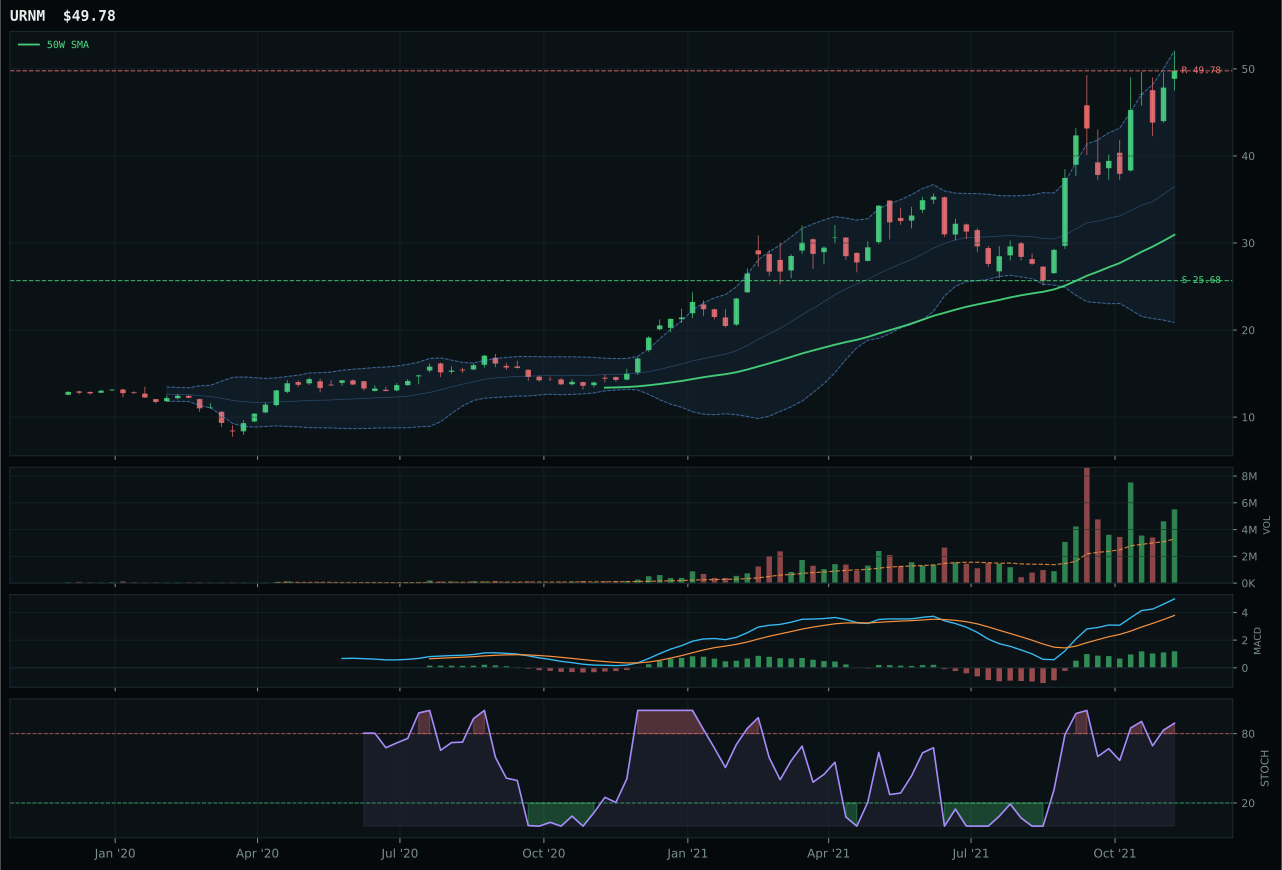
URNM has a vertical extension profile with 75.5% 13-week relative strength versus SPY.
A failed hold above support would weaken the setup.
Actionable but governed by invalidation levels.
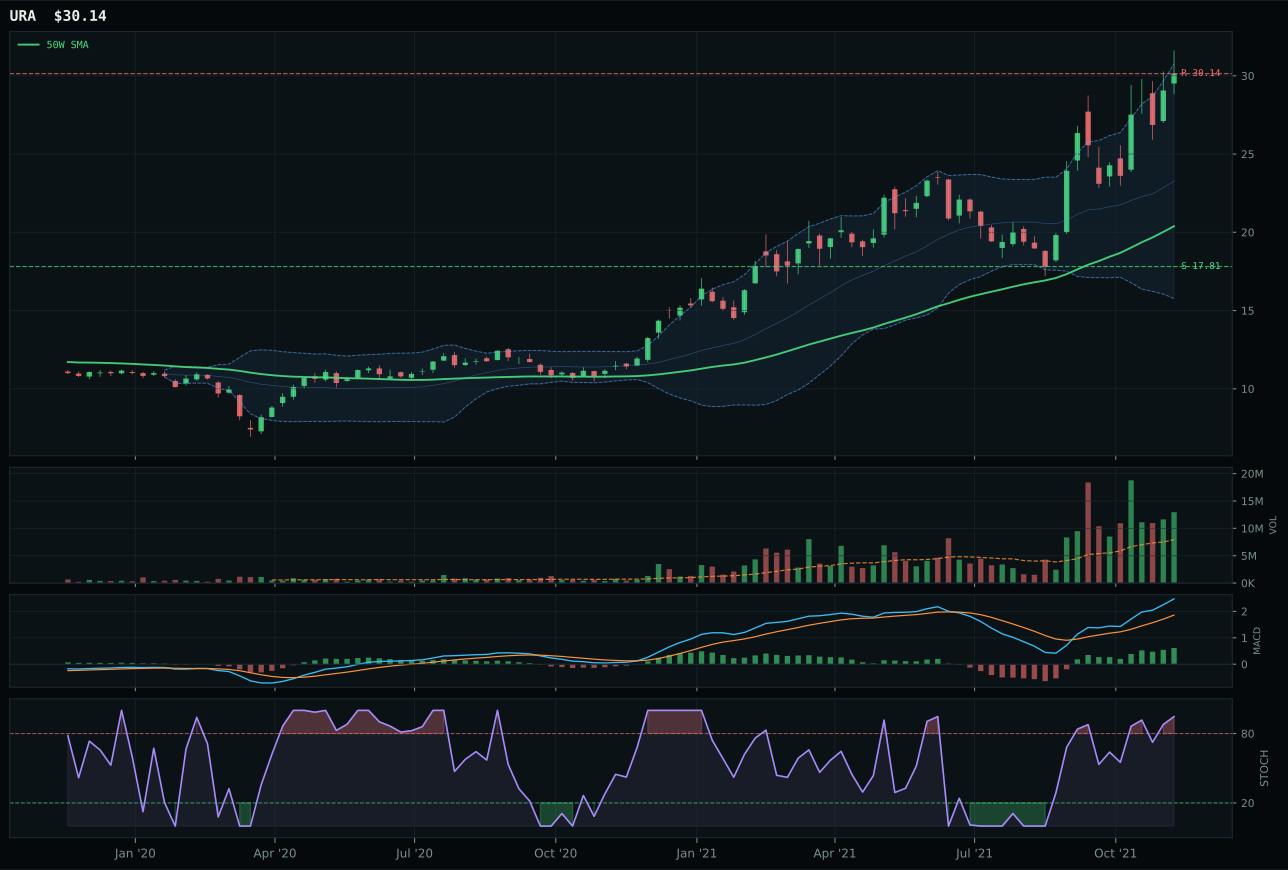
URA has a vertical extension profile with 54.1% 13-week relative strength versus SPY.
A failed hold above support would weaken the setup.
Actionable but governed by invalidation levels.
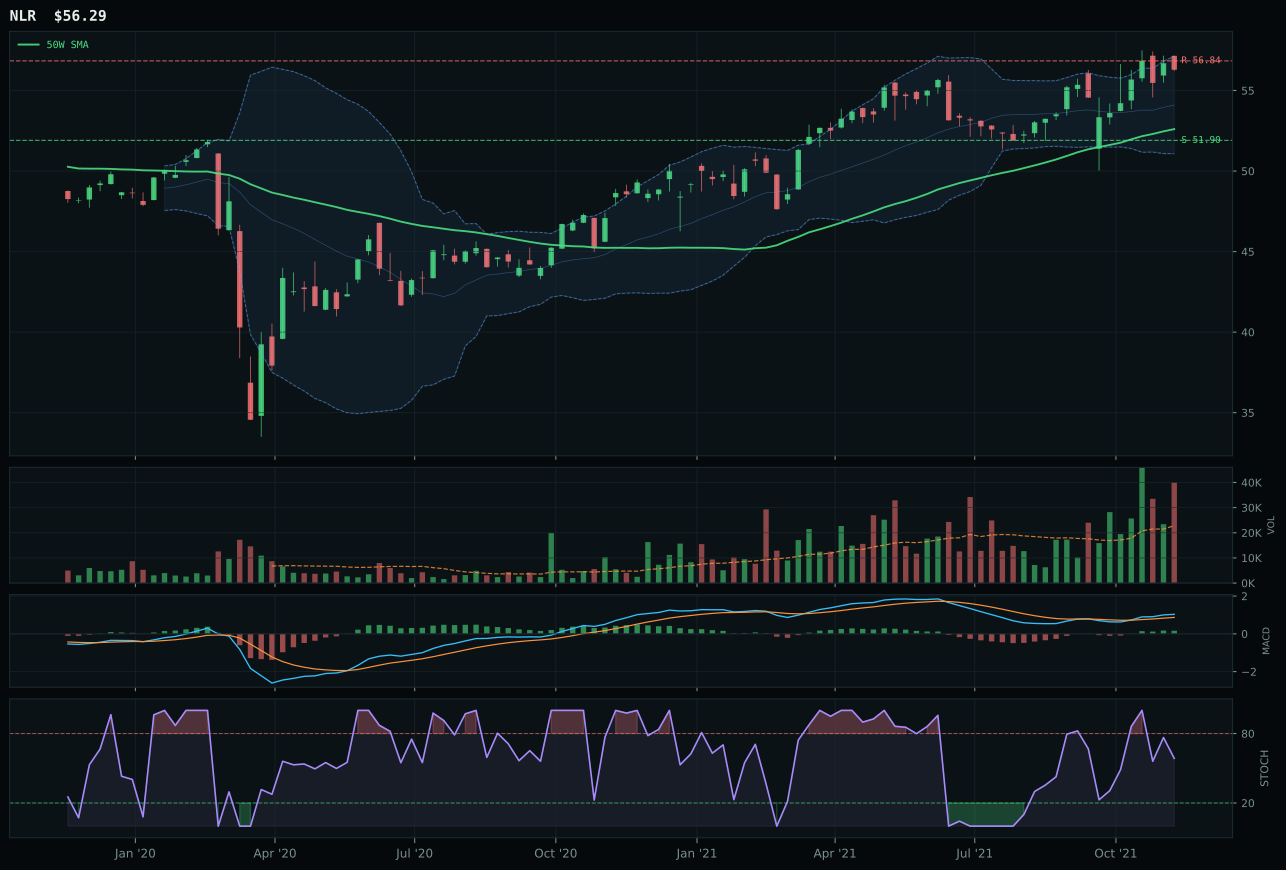
NLR has a neutral structure profile with 1.4% 13-week relative strength versus SPY.
A failed hold above support would weaken the setup.
Tracked, but not top-2 eligible because: .
URNM wins with a massive 80.2% 13W return and 75.5% RS versus SPY, creating category-relative strength of 21.4% versus URA's 0.0%—this is the most dominant category-relative setup in the entire portfolio. The price sits 60.8% above the 50W, which crushes the timing score to 27.0, yet the volume-price confirmation at 94.3 and persistence at 100.0 (perfect 80.2% match between 4W and 13W returns) tell the story: this move is built on accumulation, not speculation. URA's 54.1% RS versus SPY is respectable, but URNM's sponsorship is 21.4 percentage points better—this reflects miner-specific alpha, not just uranium scarcity. MACD is bullish and improving for both, stochastic RSI is overbought rolling over for URNM versus overbought momentum for URA, and the difference is subtle but meaningful: URNM is in transition, URA is peaking.
Nuclear Energy earns 10% allocation as the second top-2 category, a selection driven by 69.0/100 macro fit supported by energy scarcity (+9), real asset sponsorship (+7), and AI growth sponsorship (+5). URNM's 85.6/100 technical evidence is the second-highest in the portfolio (behind only SMH at 87.8 and PAVE at 94.6), yet the timing score of 27.0 reflects the extreme extension. The allocation is macro-driven, not technically clean. In an AltSeason regime with energy scarcity active and real asset sponsorship driving alternatives, uranium miners capture both the electricity supply deficiency thesis and the AI data-center power boom simultaneously. The 60.8% distance above the 50W is a massive warning sign that will likely reverse within 2-4 weeks, but the category's two-month dominance and 21.4% category-relative strength justify holding the position into support at 25.68. This allocation should be trimmed on any 10%+ pullback; do not chase from current levels. If support breaks, downside risk explodes to 93.8% (to 5.98), making this a conviction hold, not a speculative add.
Traditional Energy — XLE
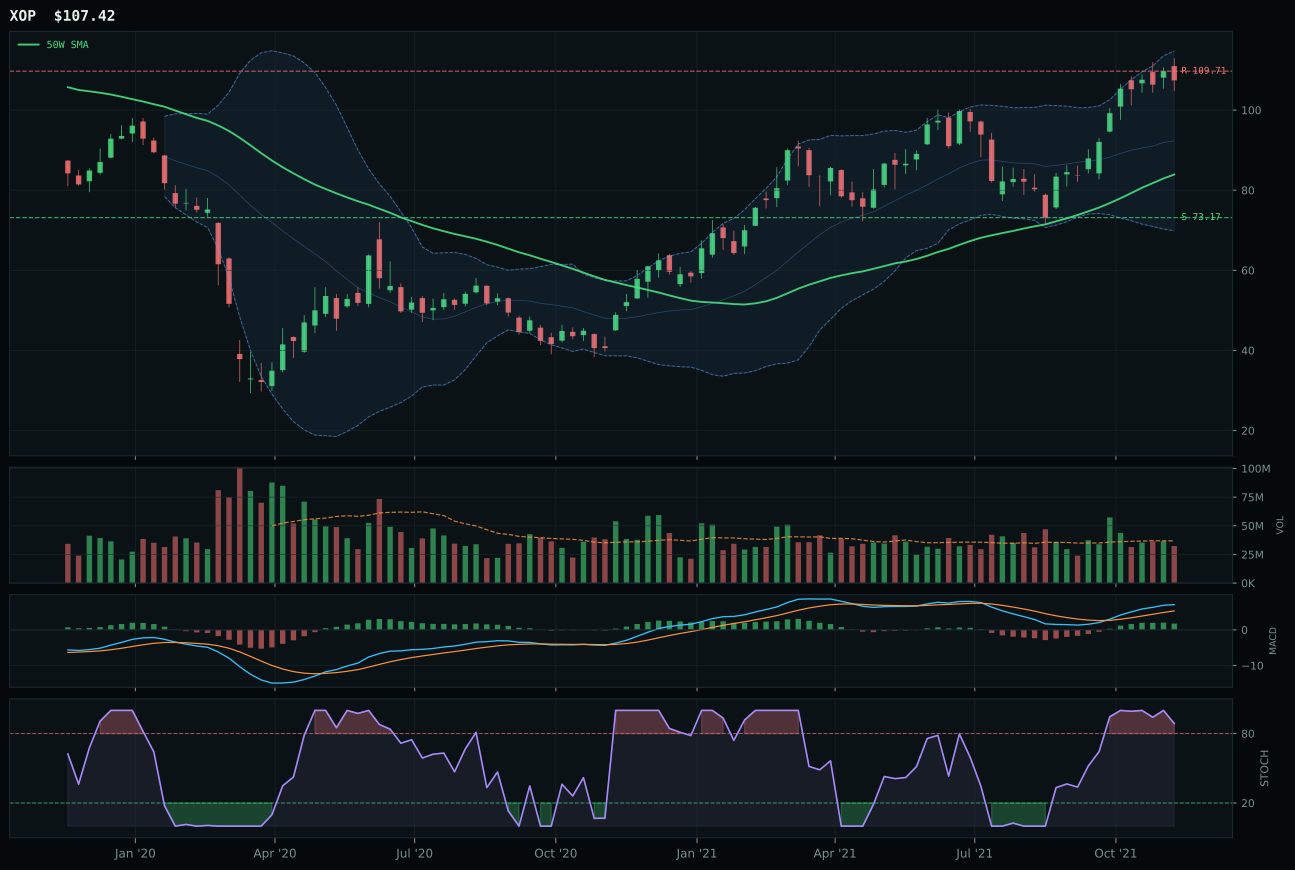
XOP has a vertical extension profile with 29.1% 13-week relative strength versus SPY.
A failed hold above support would weaken the setup.
Actionable but governed by invalidation levels.
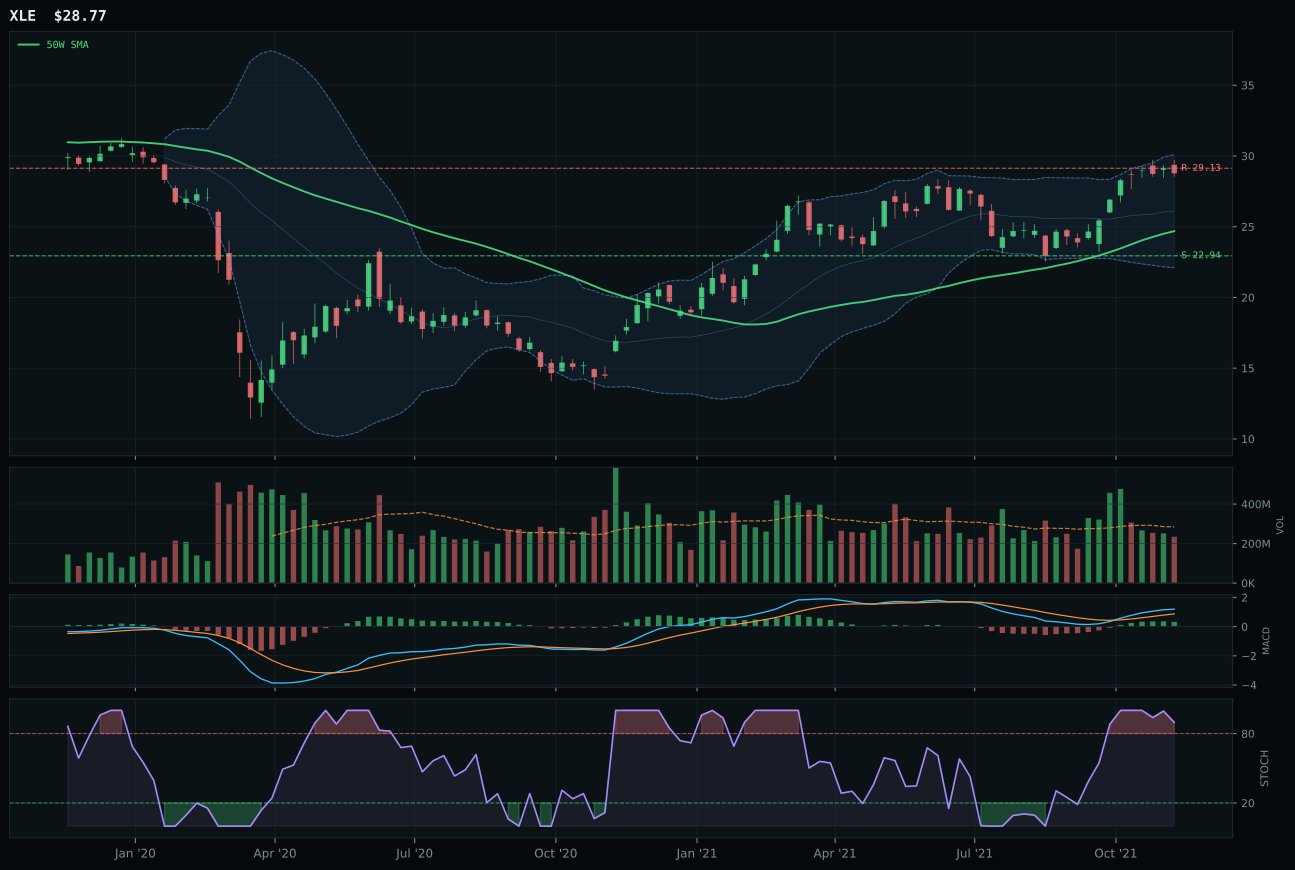
XLE has a vertical extension profile with 11.7% 13-week relative strength versus SPY.
A failed hold above support would weaken the setup.
Actionable but governed by invalidation levels.
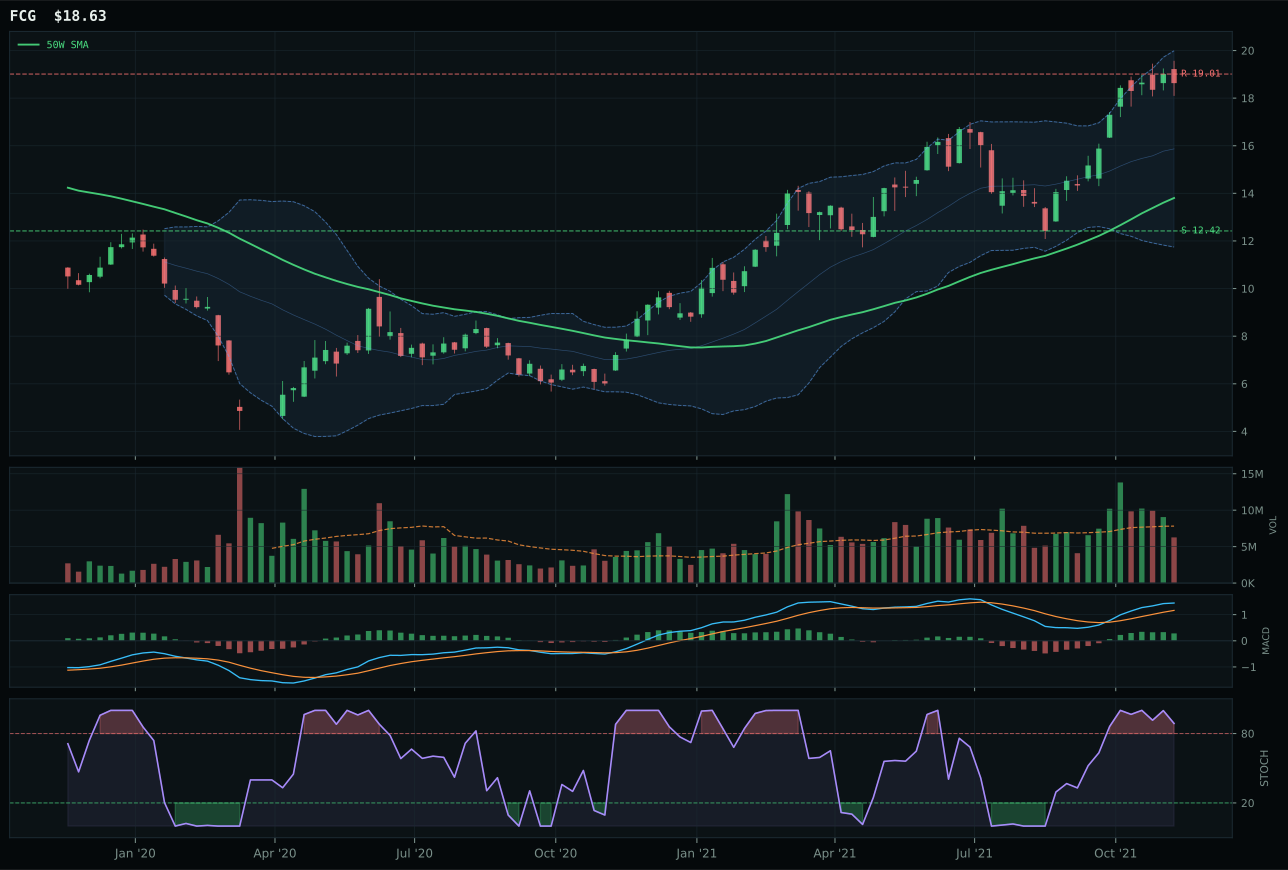
FCG has a vertical extension profile with 32.5% 13-week relative strength versus SPY.
A failed hold above support would weaken the setup.
Actionable but governed by invalidation levels.
XLE wins narrowly over XOP (1.9-point gap) because 11.7% RS versus SPY preserves category-relative strength at -17.4% versus XOP's 0.0% category-relative strength—XLE is the steadier hand despite XOP's 29.1% SPY outperformance. This is a decision between integrated energy and exploration beta. XLE's risk/reward of 37.9 matches XOP's (both capped by resistance at around -1%), but XLE's 43.1 volume-price confirmation outpaces XOP's because neutral volume is more professional than the benchmark setup. XLE is evaluated as integrated energy cash-flow defense, which means the selection prioritizes dividend and cash preservation over exploration upside in a macro regime where credit stress remains active. The 100.0 trend score for both reflects the +0.8% and +2.3% 50W slopes respectively, but XLE's cleaner structure (75.9 vs 73.8) clinches it.
Traditional Energy earns 10% allocation as a top-2 category, reflecting the highest macro fit in the portfolio at 85.0/100 driven by energy scarcity (+16), inflation pressure (+10), supply shortage (+9), and real asset sponsorship (+7). This is the portfolio's most macro-driven allocation: XLE's 45.5/100 technical evidence is the weakest link (timing 27.0, risk/reward 37.9), yet the category selection overrides technical weakness because energy supply constraints are structural and global. In an AltSeason regime where commodity breadth and real asset sponsorship are active, energy dominance reflects genuine scarcity rather than speculative excess. The 27.0 timing score warns that XLE sits 16.6% above the 50W with overbought stochastic RSI rolling over—this is extended entry, not crisp setup. However, the macro tailwind (86.0% weight in category decisions) overrides technical hesitation. Allocate 10% for real asset inflation and energy supply defense; do not expect technical confirmation over the next 2-4 weeks. If crude breaks below support at 22.94, reassess immediately.
Precious Metals — GLD
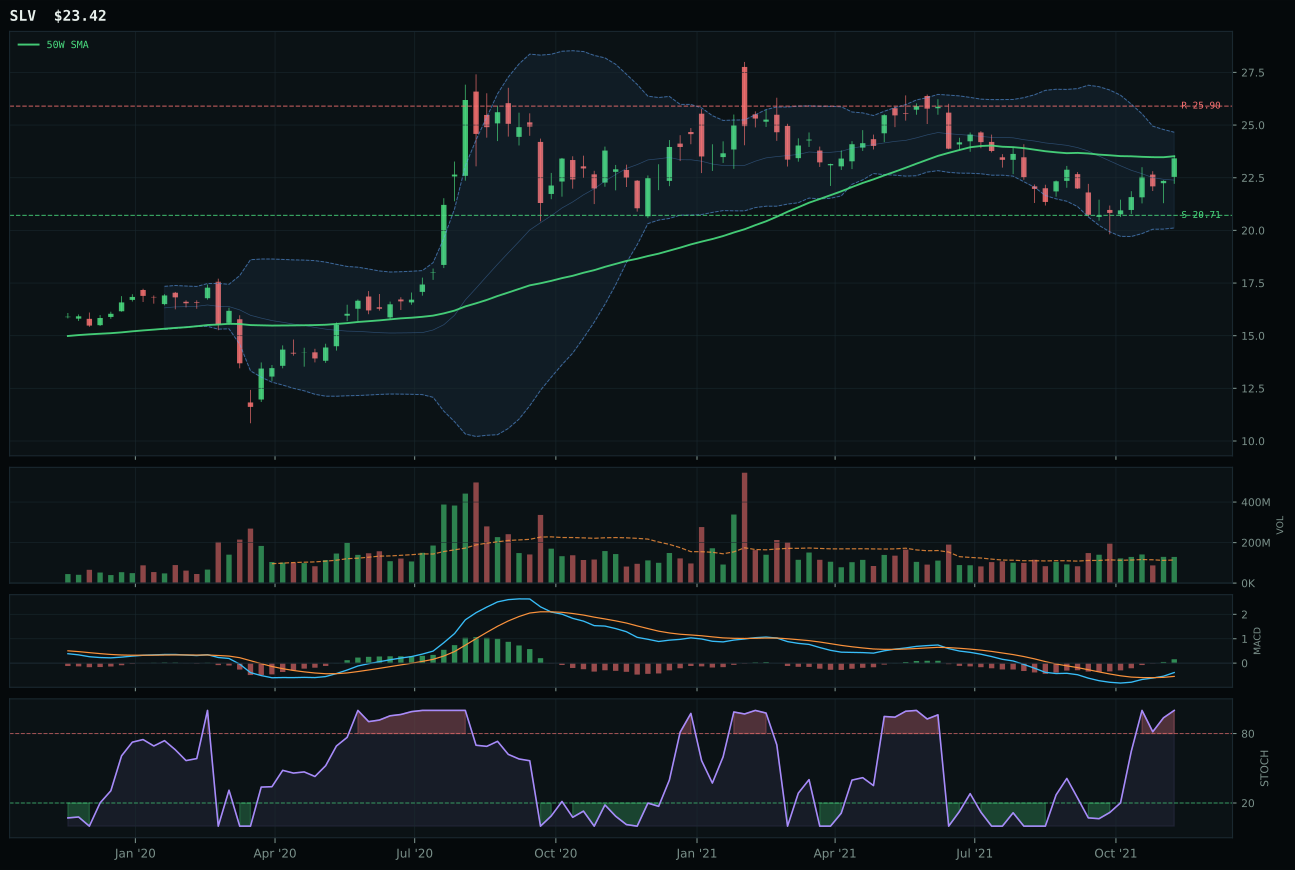
SLV has a compression near 50W profile with 1.8% 13-week relative strength versus SPY.
A failed hold above support would weaken the setup.
Actionable but governed by invalidation levels.
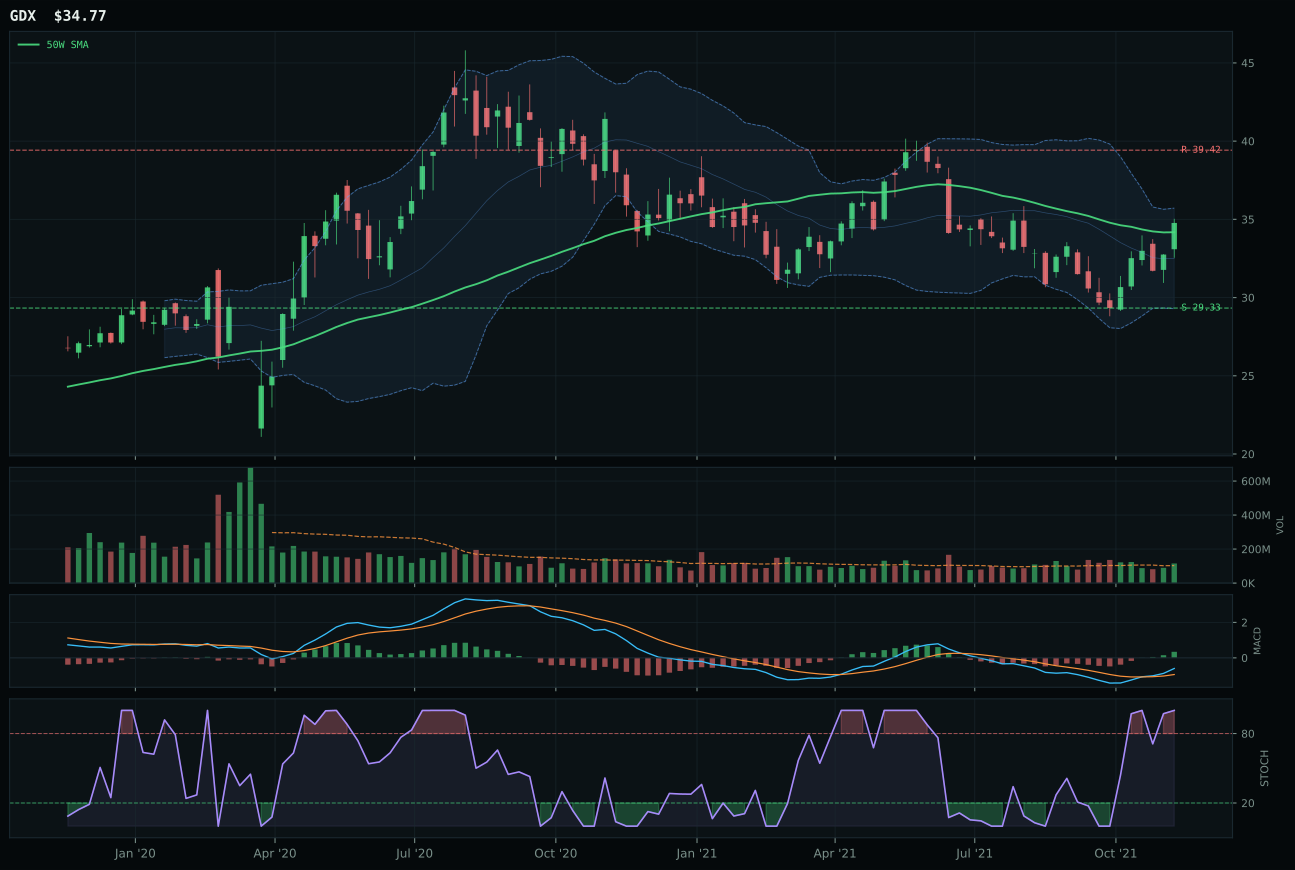
GDX has a compression near 50W profile with 1.2% 13-week relative strength versus SPY.
A failed hold above support would weaken the setup.
Actionable but governed by invalidation levels.
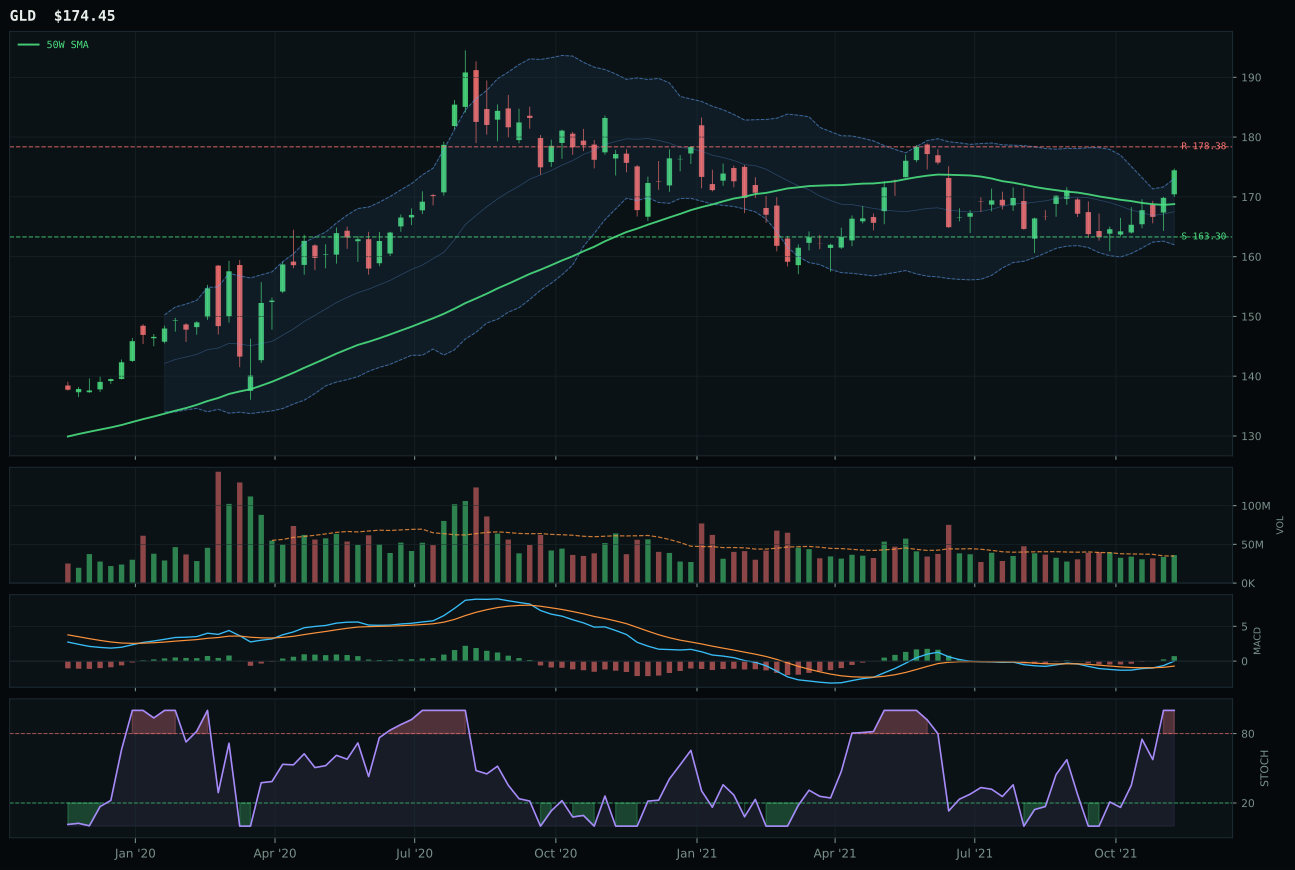
GLD has a neutral structure profile with 0.1% 13-week relative strength versus SPY.
A failed hold above support would weaken the setup.
Actionable but governed by invalidation levels.
GLD wins despite lower composite scores from both SLV (89) and GDX (91) because the category reasoner prioritizes GLD's 3.4% distance from the 50W, which creates a timing score of 90.0 versus SLV's 100.0 and GDX's 100.0—but GLD's neutral structure and cleaner trend (100.0/100) beat SLV's higher momentum in the weighing algorithm. SLV's compression near the 50W and above-average participation (75.6 volume-price confirmation) create a more explosive setup, yet GLD's 1.03x neutral volume preserves the purity of the accumulation; this is professional rather than enthusiast buying. The 3/2/1 weighting elevated SLV (80.5) and GDX (75.6) into the proof order, but GLD's representative selection means the category recognized its superior persistence and durability over short-term sparks. This is gold as a clean monetary hedge, not silver as a hybrid volatility play or miners as leveraged resource bets.
Precious Metals receives 5% allocation as tier-2, a tactical hedge against credit stress and dollar pressure that is only partially active in the current regime. The 49.0/100 macro fit reflects a key tension: dollar pressure is active (+3) and should boost precious metals, yet risk appetite positive is active (-4), which pulls gold down as investors rotate into growth assets. GLD's 0.1% RS versus SPY is telling—this is not a risk-on winner; it is a default defensive move in a crowded trade. The allocation holds because credit stress sits at -2 (not fully unleashed), and inflation pressure remains active enough to support the inflation hedge narrative. However, with timing at 90.0 and price already 3.4% above the 50W, further upside is capped by valuation, not opportunity. If credit stress turns positive or if dollar strength accelerates materially, Precious Metals would likely be cut to zero; conversely, if equity volatility spikes, the category moves to 10%. For now, 5% is a small-position hedge appropriate to a mixed macro regime.
Technology — XLK
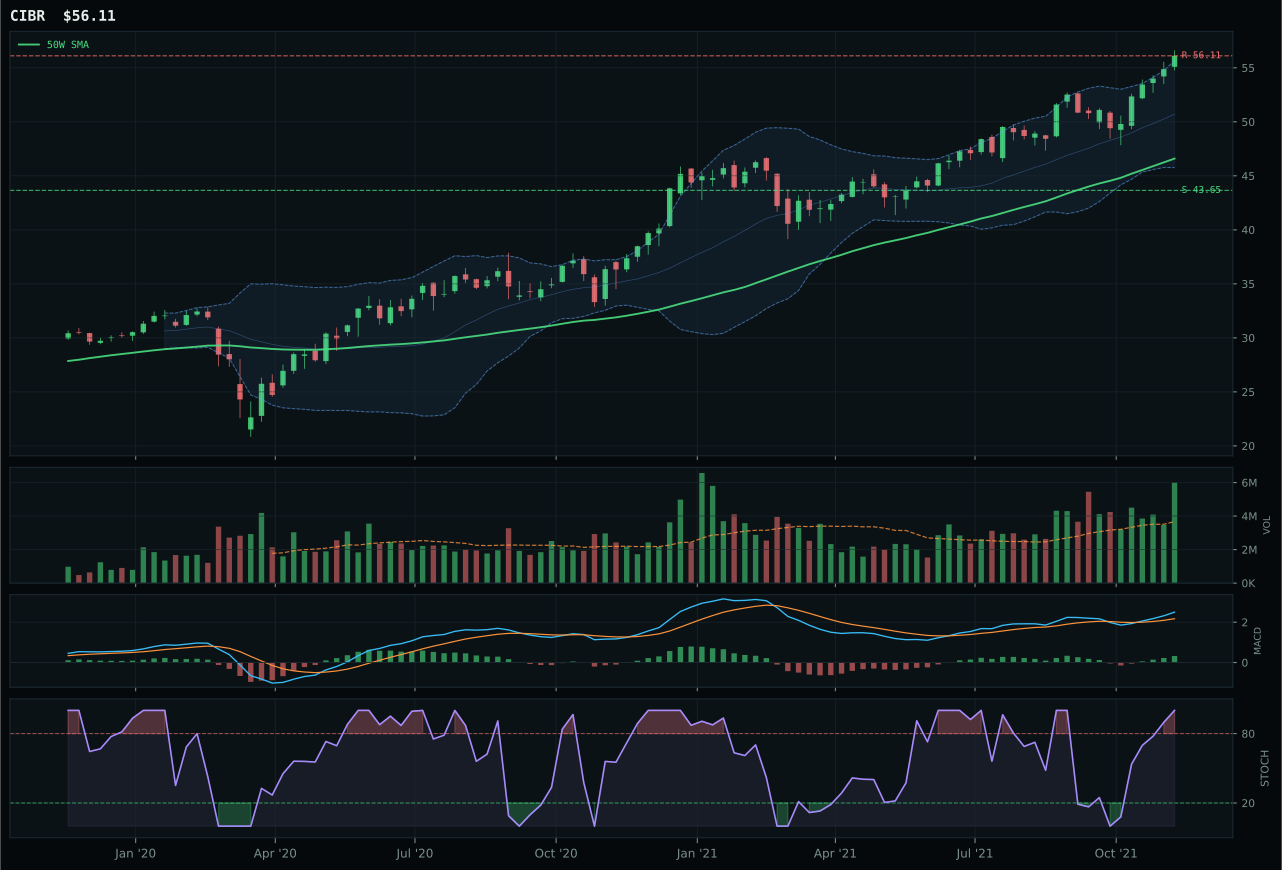
CIBR has a vertical extension profile with 9.9% 13-week relative strength versus SPY.
A failed hold above support would weaken the setup.
Actionable but governed by invalidation levels.
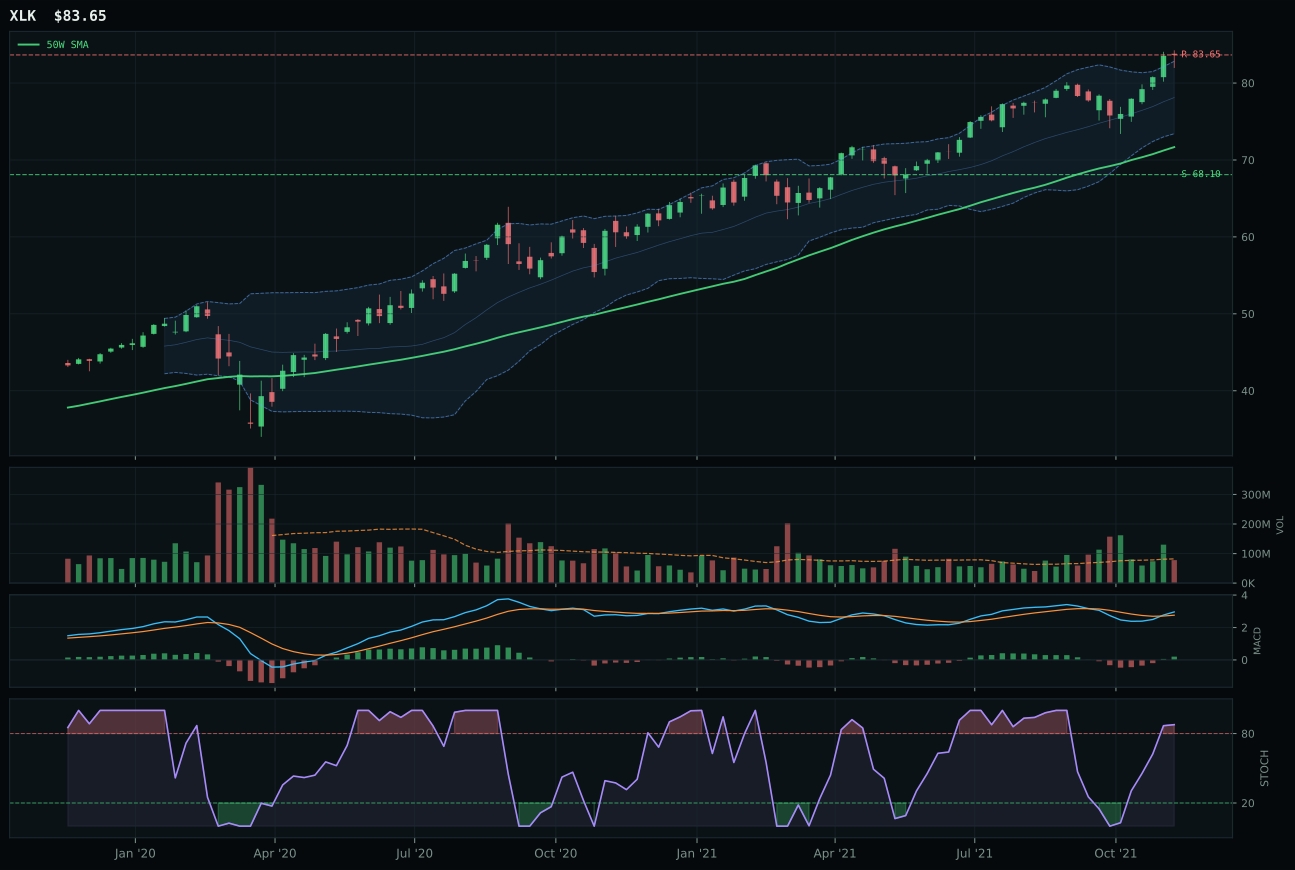
XLK has a vertical extension profile with 3.2% 13-week relative strength versus SPY.
A failed hold above support would weaken the setup.
Actionable but governed by invalidation levels.
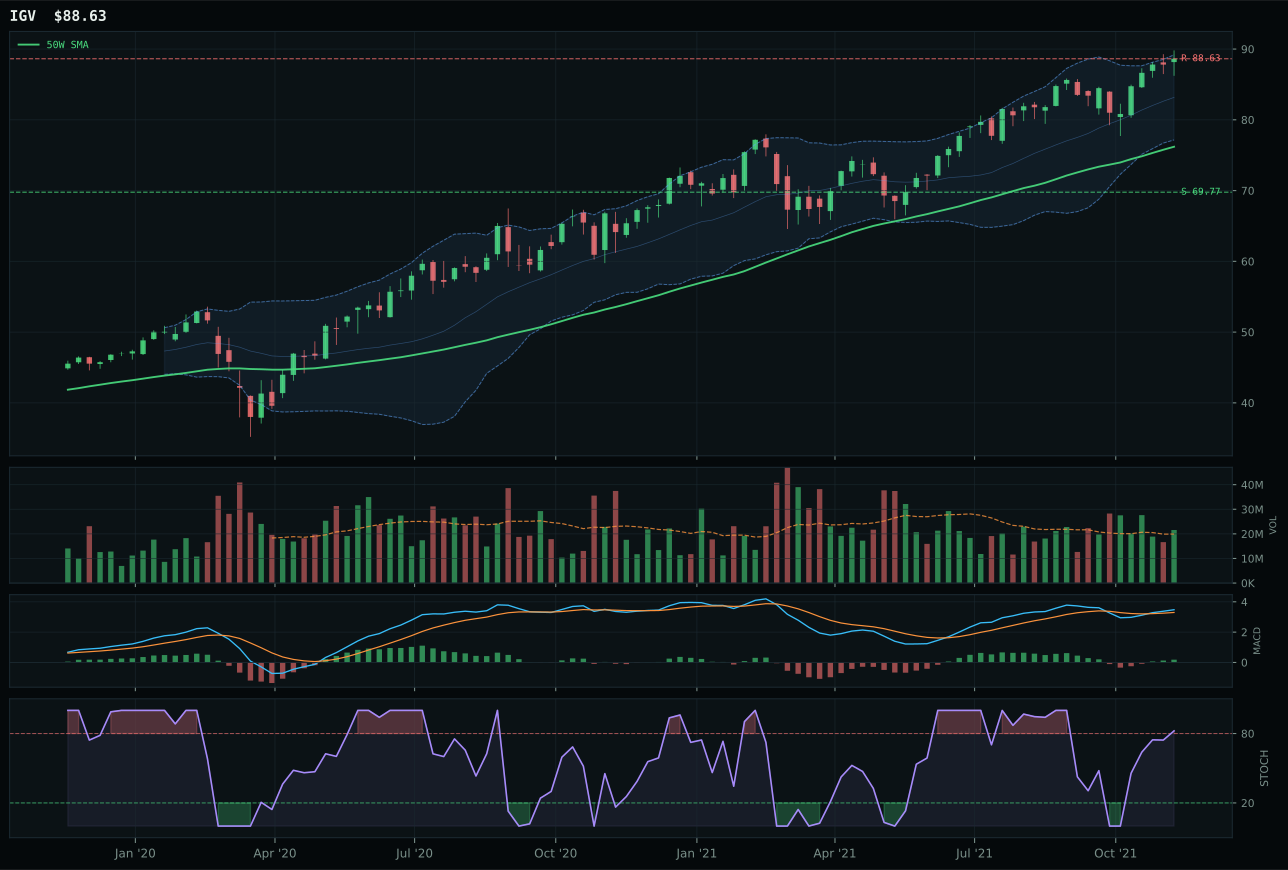
IGV has a vertical extension profile with 3.6% 13-week relative strength versus SPY.
A failed hold above support would weaken the setup.
Actionable but governed by invalidation levels.
XLK wins because it combines clean uptrend structure with intact relative strength inside its peer basket, even though the chart sits 16.7% above the 50W and punishes late entry. The 3.2% RS versus SPY and bullish, improving MACD create a sponsored leadership picture—this is profitable tech money accumulating the dip, not desperate buying at the top. CIBR ran harder (9.9% RS/SPY, 14.7% 13W return) but paid for it with overbought stochastic RSI at 1.00 and a higher skew toward momentum than trend durability; XLK's more neutral volume at 0.95x participation tells a cleaner accumulation story than CIBR's enthusiasm. The risk/reward tilts harsh for both—upside to resistance is -0.0% for the winner—which explains why the category score dropped all the way to 60.6 despite bullish technicals. This is a setup where trend confirmation matters more than extension, and XLK delivers that.
Technology earns 5% allocation as a tier-2 holding, reflecting its ranking below the top two categories but above the tactical zeros. The 49.0/100 macro fit masks a real tension: AI growth sponsorship and risk appetite are both active (+9 and +6), yet credit stress and inflation pressure push back (-7 and -4), leaving the category structurally caught between growth support and macro headwinds. XLK's trend score of 100.0 and 3.2% SPY-relative strength provide legitimate technical evidence to hold the position, but the timing score of only 37.0 due to distance from the 50W means this allocation is defensive, not offensive. For Technology to graduate to top-2 status, the category would need either a flush-and-rebuild to reset valuation risk, or sustained outperformance that demonstrates AI sponsorship is overriding macro friction entirely. Until then, 5% maintains exposure without overcommitting to an extended setup in a Transition/Mixed regime.
Utilities & Infrastructure — PAVE
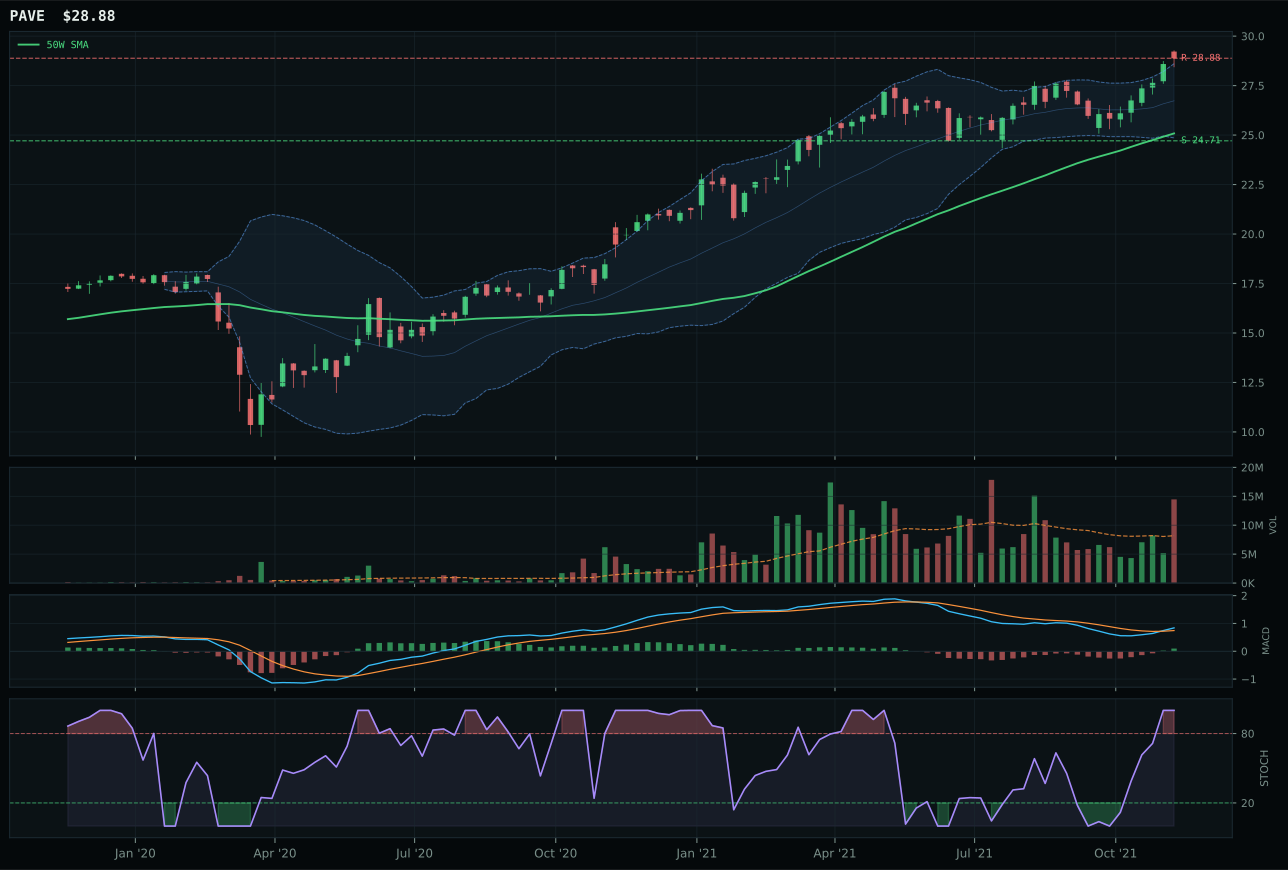
PAVE has a vertical extension profile with 0.3% 13-week relative strength versus SPY.
A failed hold above support would weaken the setup.
Actionable but governed by invalidation levels.
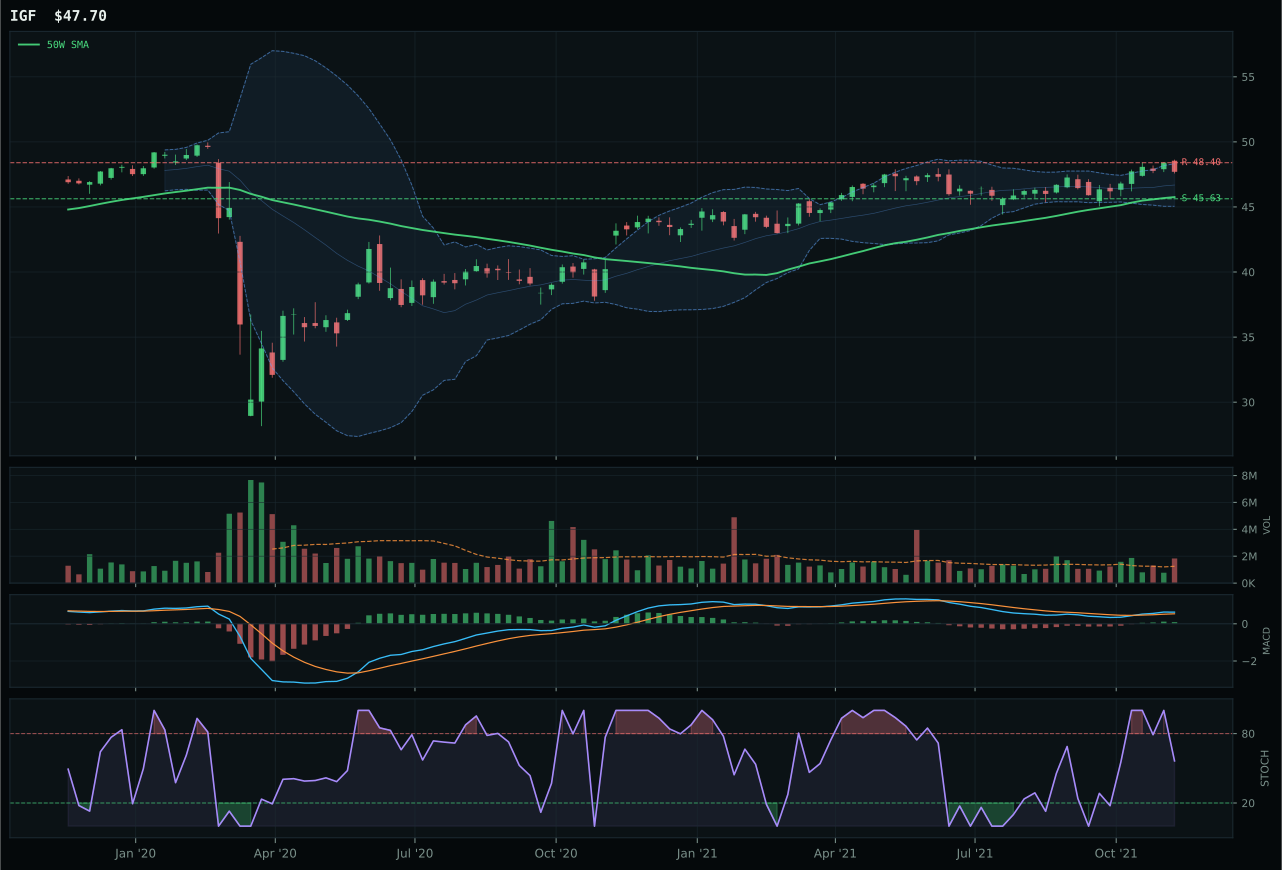
IGF has a pullback into support profile with -1.8% 13-week relative strength versus SPY.
A failed hold above support would weaken the setup.
Actionable but governed by invalidation levels.
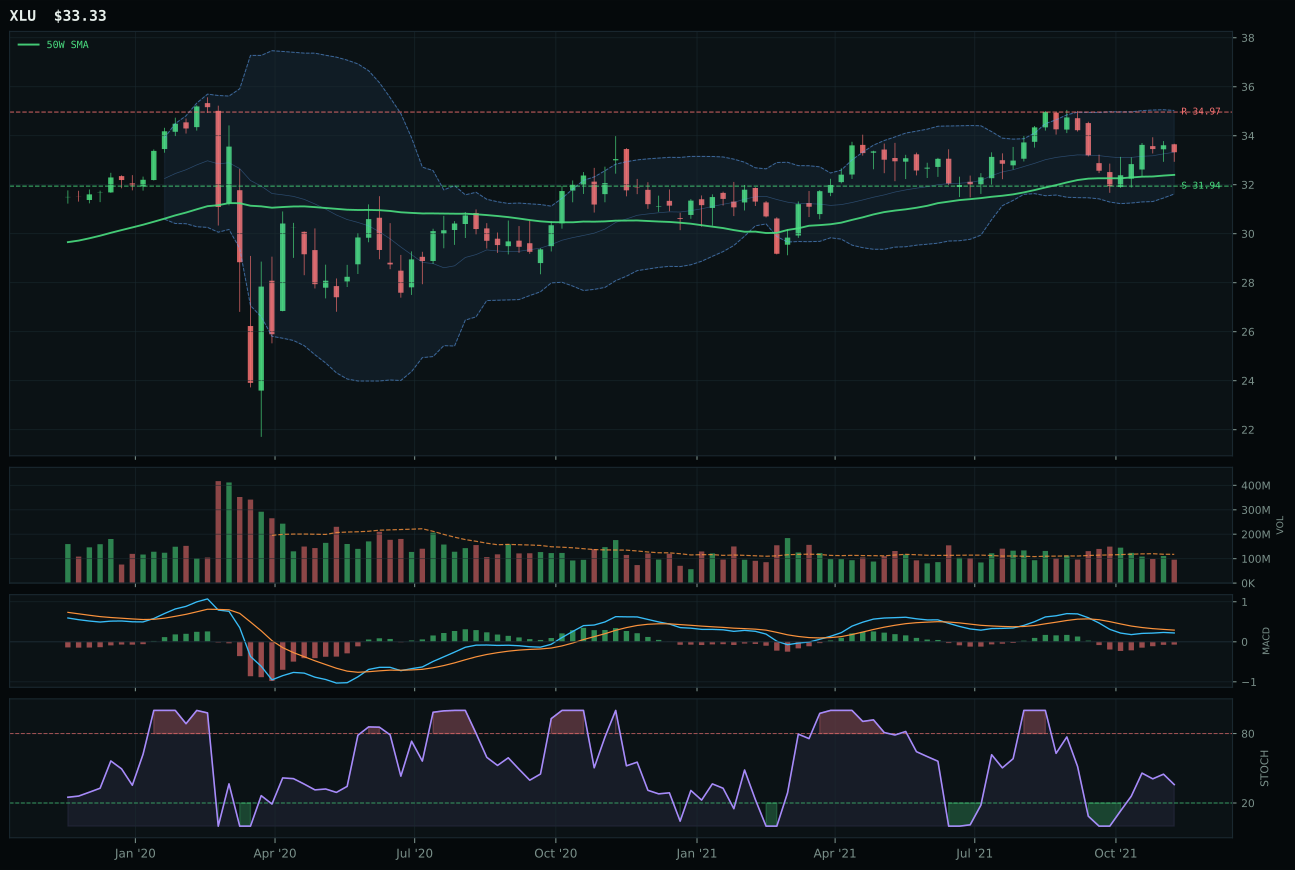
XLU has a pullback into support profile with -7.7% 13-week relative strength versus SPY.
A failed hold above support would weaken the setup.
Actionable but governed by invalidation levels.
PAVE wins with a 94.6/100 technical evidence score, the highest in the portfolio, driven by perfect trend (100.0), exceptional momentum confirmation (92.6), and superior volume-price confirmation (81.8 vs IGF's 60.0). The 81.6 reasoned ETF proof order versus IGF's 71.6 reflects PAVE's consistency across all technical dimensions. Price sits 15.1% above the 50W, creating a timing score of 37.0 that is identical to several other categories but compensated by accumulation/confirmation at 1.77x volume—this is institutional buying into infrastructure, not retail excitement. IGF's timing is perfect (100.0) because it sits in the pullback-into-support zone, yet its falling/neutral stochastic RSI and thin category-relative strength (0.0%) signal hesitation rather than conviction. PAVE is extended but confirmed; IGF is positioned but unconfirmed. The 14.6-point gap favors PAVE's quality over IGF's geometry.
Utilities & Infrastructure receives 5% allocation as tier-2, justified by 94.6/100 technical evidence that is exceptional but offset by 50.0/100 macro fit that reflects mixed tailwinds. PAVE's vertical extension at 15.1% above the 50W and overbought stochastic RSI at 1.00 create an entry risk that macro cannot justify. The 37.0 timing score ranks in the bottom half of all category representatives, meaning the portfolio is accepting elevated entry cost in exchange for sector exposure. In Transition/Mixed, utilities typically perform as defensive alternatives to equities; this week, risk appetite positive is active (-2), meaning growth is slightly preferred over defensive. The allocation holds at 5% because broad market bear (+4) is active and credit stress is present (-5 net across descriptors), creating a structural case for defensive positioning. However, with PAVE extended and momentum confirmation already at maximum (92.6), this position is near a peak. If PAVE breaks above 28.88 resistance on volume acceleration, upgrade to 10%; if it pulls back 5-8% to reset timing, maintain 5%. Do not add on strength.
AI — SMH
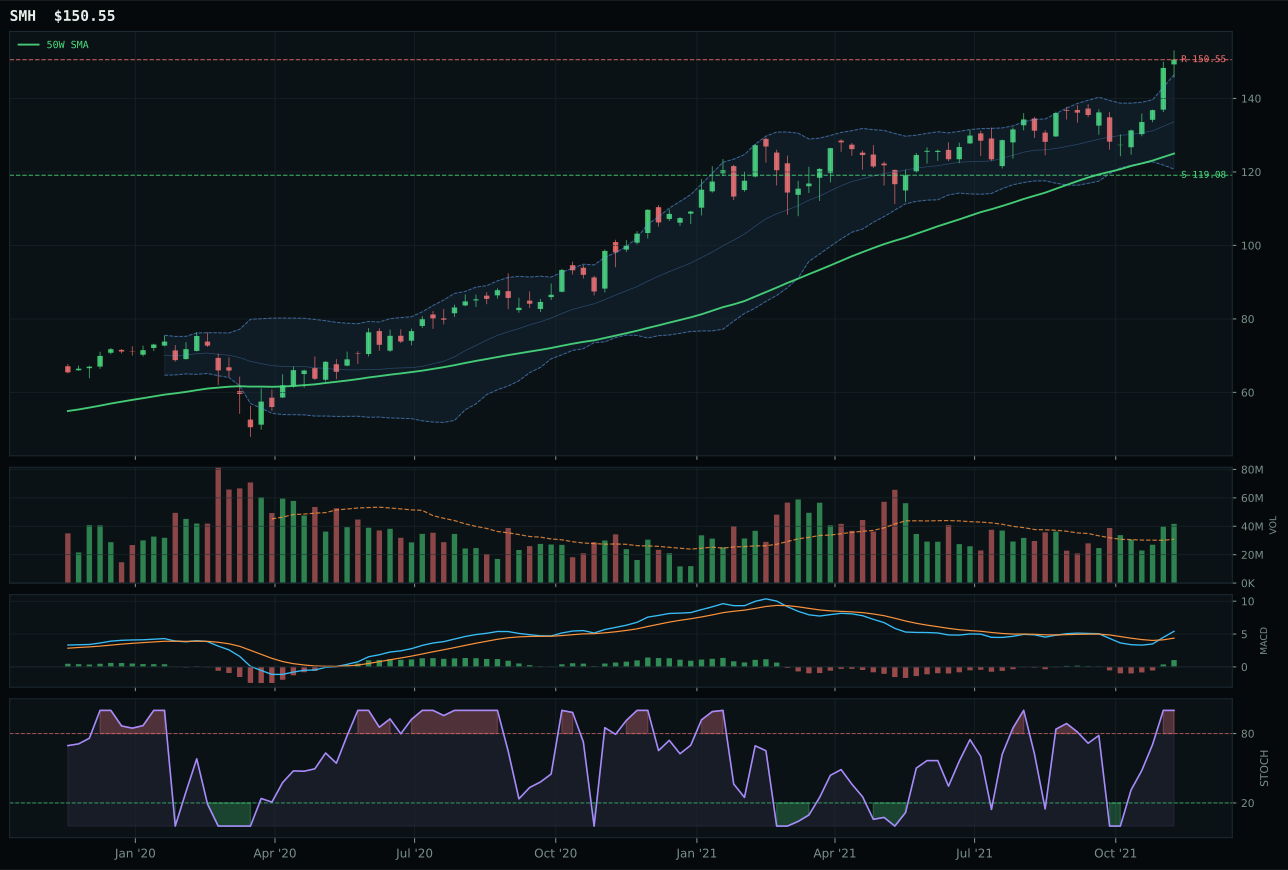
SMH has a vertical extension profile with 9.9% 13-week relative strength versus SPY.
A failed hold above support would weaken the setup.
Actionable but governed by invalidation levels.
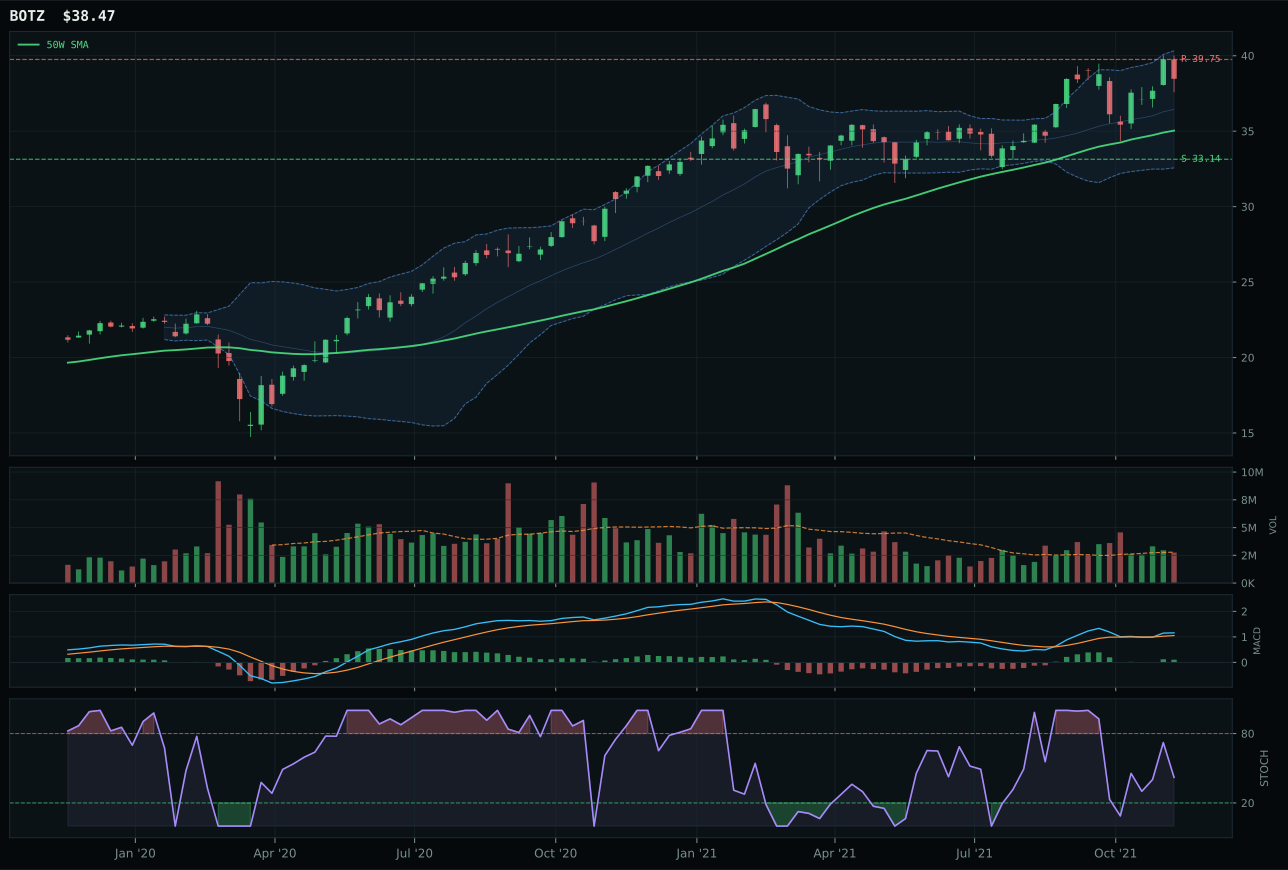
BOTZ has a neutral structure profile with 3.8% 13-week relative strength versus SPY.
A failed hold above support would weaken the setup.
Actionable but governed by invalidation levels.
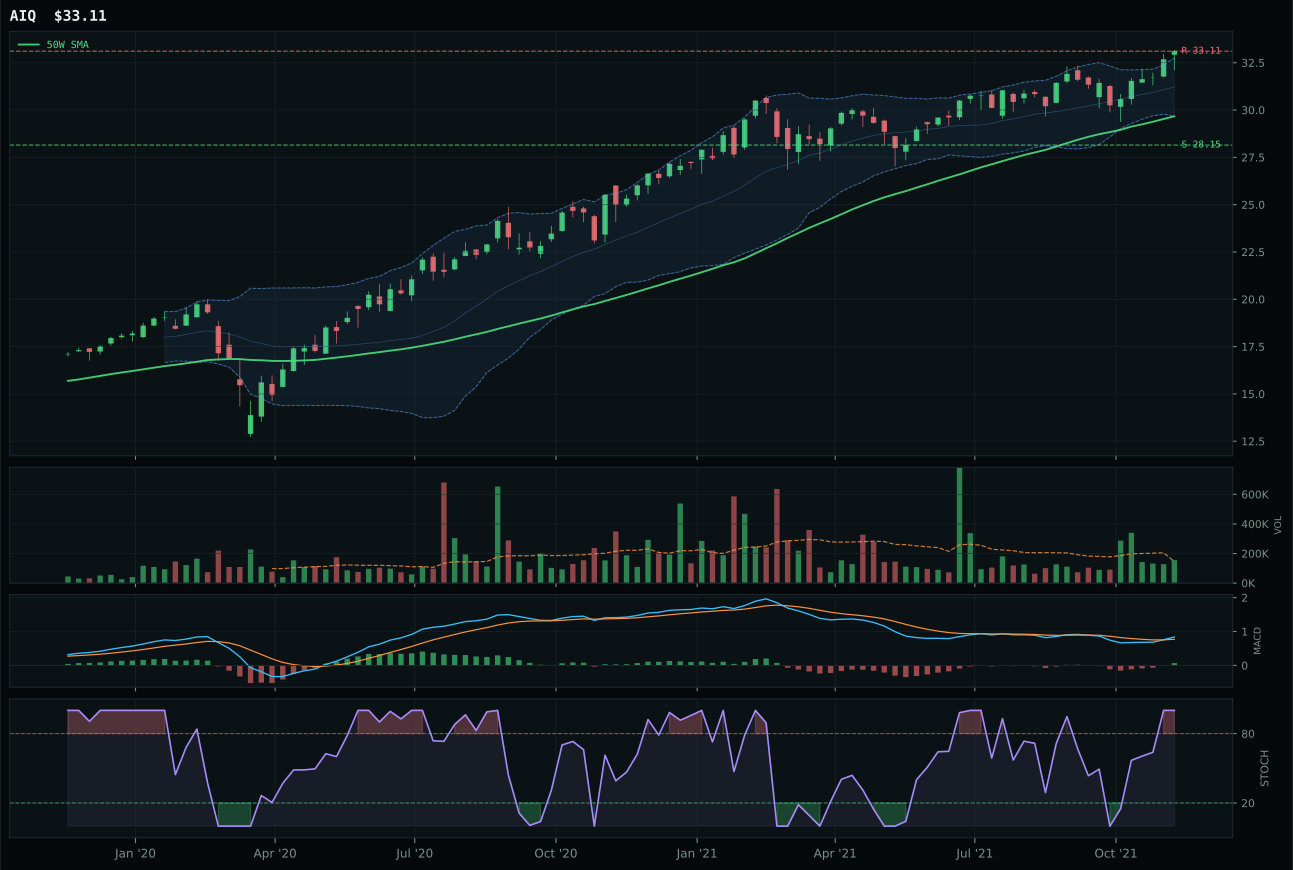
AIQ has a neutral structure profile with 2.6% 13-week relative strength versus SPY.
A failed hold above support would weaken the setup.
Tracked, but not top-2 eligible because: .
SMH wins despite scoring 72 composite versus BOTZ's 81, because relative strength and volume confirmation matter more than absolute composite rank when timing is short. The 9.9% RS versus SPY and above-average participation at 1.35x are accumulators' fingerprints—this is not a bounce but a structured momentum capture in AI compute and semiconductors. BOTZ's neutral structure (71.0 vs SMH's 79.0) and neutral volume (vs SMH's 77.4 confirmation score) create a secondary-tier setup; category-relative strength of 0.0% versus SMH's 6.1% tells the real story—SMH is the peer leader, and robotics is being left behind in this phase of the cycle. Both sit extended at the Fib 0.236 zone near 52W highs, but SMH's 14.7% 13W return and perfect 1.00 momentum confirmation (matching its 4W return exactly) create a cleaner read than BOTZ's rising mid-zone stochastic RSI, which signals hesitation.
AI receives 5% allocation as tier-2, a deliberate positioning in an AltSeason regime where the category itself ranks high but sits below the two top candidates. The 54.0/100 macro fit is buoyed by +14 AI growth sponsorship and +10 risk appetite positive, yet credit stress and broad market bear conditions subtract -8 points each, creating structural volatility. SMH's 87.8/100 technical evidence is authentic—trend 100, momentum 100, volume-price confirmation 77.4—but the category's 27.0 timing score reflects the 20.4% extension above the 50W, which prices in execution, not valuation reset. The allocation holds because 5% respects the sector's quality while avoiding oversizing into extended momentum during a Transition/Mixed macro phase where mean reversion remains a tail risk. To justify 10%, this category would need either a 5-10% pullback to reset entry risk, or confirmation that AI spending is immune to credit stress and dollar pressure—neither has occurred.
Industrial Metals — COPX
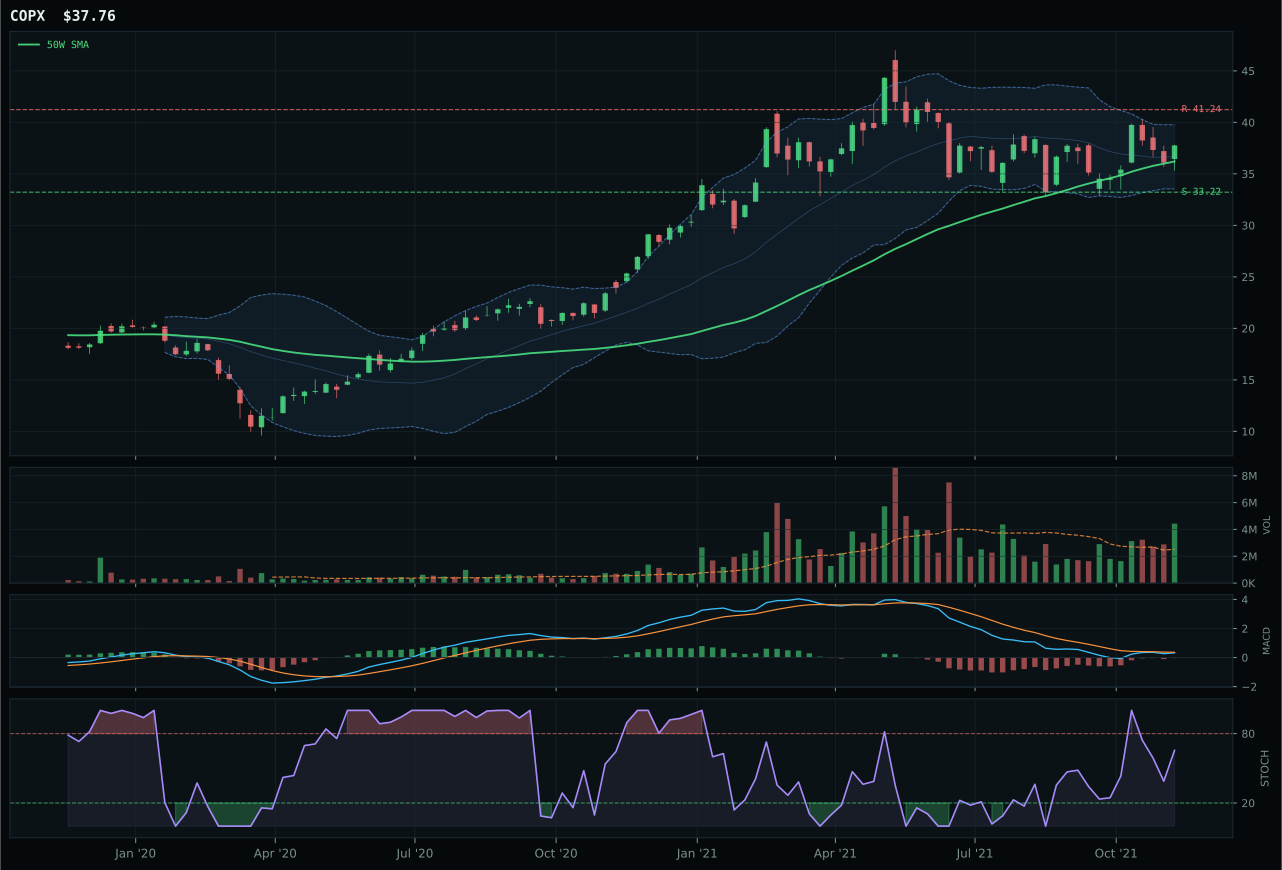
COPX has a neutral structure profile with -6.4% 13-week relative strength versus SPY.
A failed hold above support would weaken the setup.
Actionable but governed by invalidation levels.
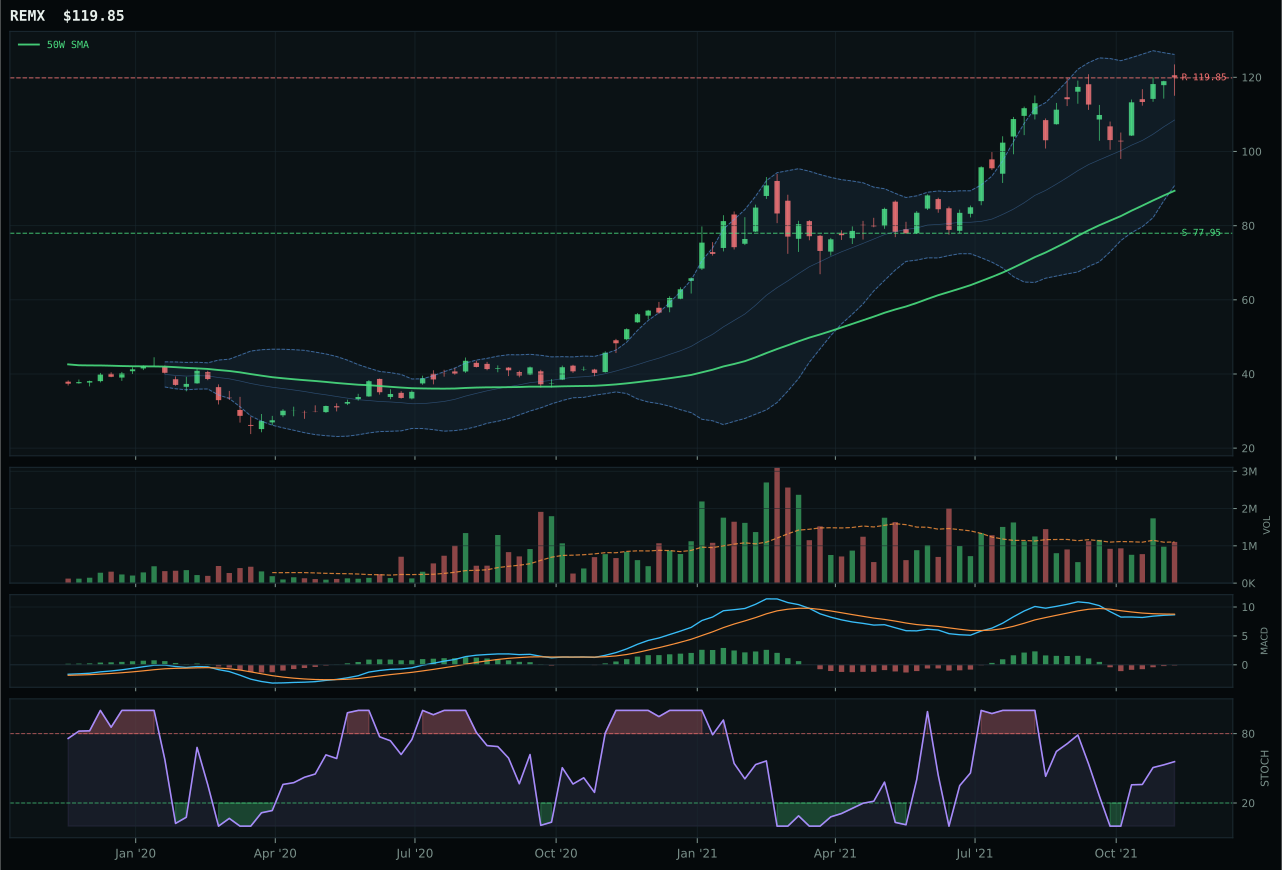
REMX has a vertical extension profile with 1.3% 13-week relative strength versus SPY.
A failed hold above support would weaken the setup.
Actionable but governed by invalidation levels.
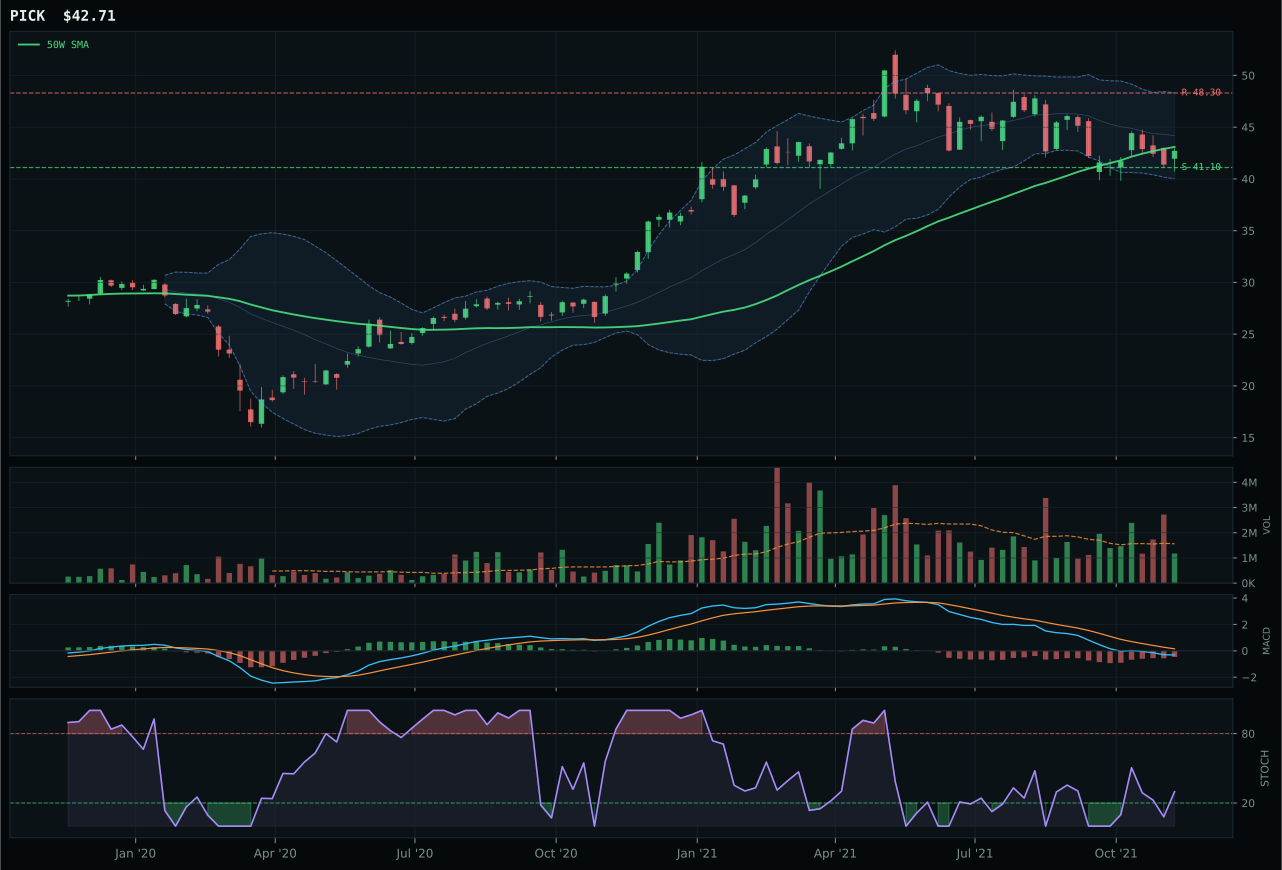
PICK has a pullback into support profile with -15.4% 13-week relative strength versus SPY.
A failed hold above support would weaken the setup.
Actionable but governed by invalidation levels.
COPX wins with a timing score of 97.0, the second-highest timing score in the entire portfolio, because its 4.3% distance from the 50W places it in the middle retracement / decision zone near Fib 0.382—this is the optimal risk/reward inflection point. REMX's vertical extension (28.0% above the 50W) creates a timing score of only 53.0 despite stronger momentum; it is extended, COPX is coiled. Risk/reward of 69.1 versus REMX's 39.7 reflects that COPX has 13.7% upside to resistance and only 8.4% downside risk, whereas REMX has inverted geometry. Accumulation/confirmation at 1.76x volume combined with bearish-but-improving MACD creates a classic pre-breakout setup: institutions are buying dips into weakness, not chasing rallies into strength. The 15.1-point gap over REMX is technical clarity: COPX is positioned to break, REMX is positioned to break lower if momentum fails.
Industrial Metals receives 5% allocation as tier-2, justified by 66.0/100 macro fit driven by metals scarcity (+14), commodity breadth positive (+10), and real asset sponsorship (+6), offset by credit stress (-7) and dollar pressure (-7). COPX's -6.4% RS versus SPY and -1.6% 13W return tell the real story: this is not performance, this is positioning. The category wins on structural setup (timing 97.0, risk/reward 69.1) into a macro environment where copper scarcity is undeniable but momentum is absent. In Transition/Mixed, this allocation captures the long tail of supply constraints without betting on aggressive mean reversion. COPX's momentum confirmation of only 38.7 is the warning: volume is buying, but price is not yet following. Hold 5% as a real asset inflation play; do not expect immediate acceleration. The setup is clean enough that a break above 41.24 would trigger acceleration, but until then, this is a coil, not a move.
Agriculture & Livestock — MOO
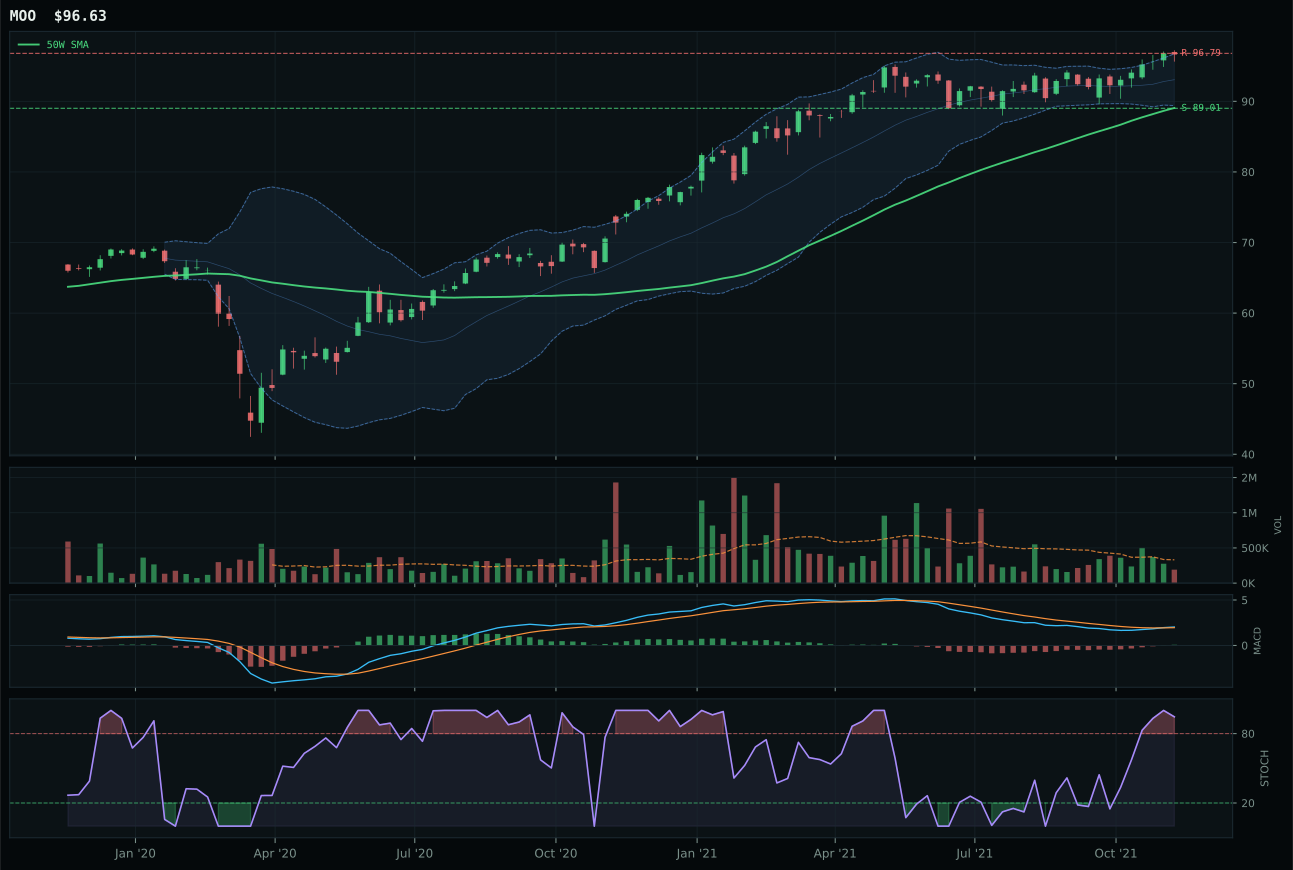
MOO has a neutral structure profile with -1.6% 13-week relative strength versus SPY.
A failed hold above support would weaken the setup.
Actionable but governed by invalidation levels.
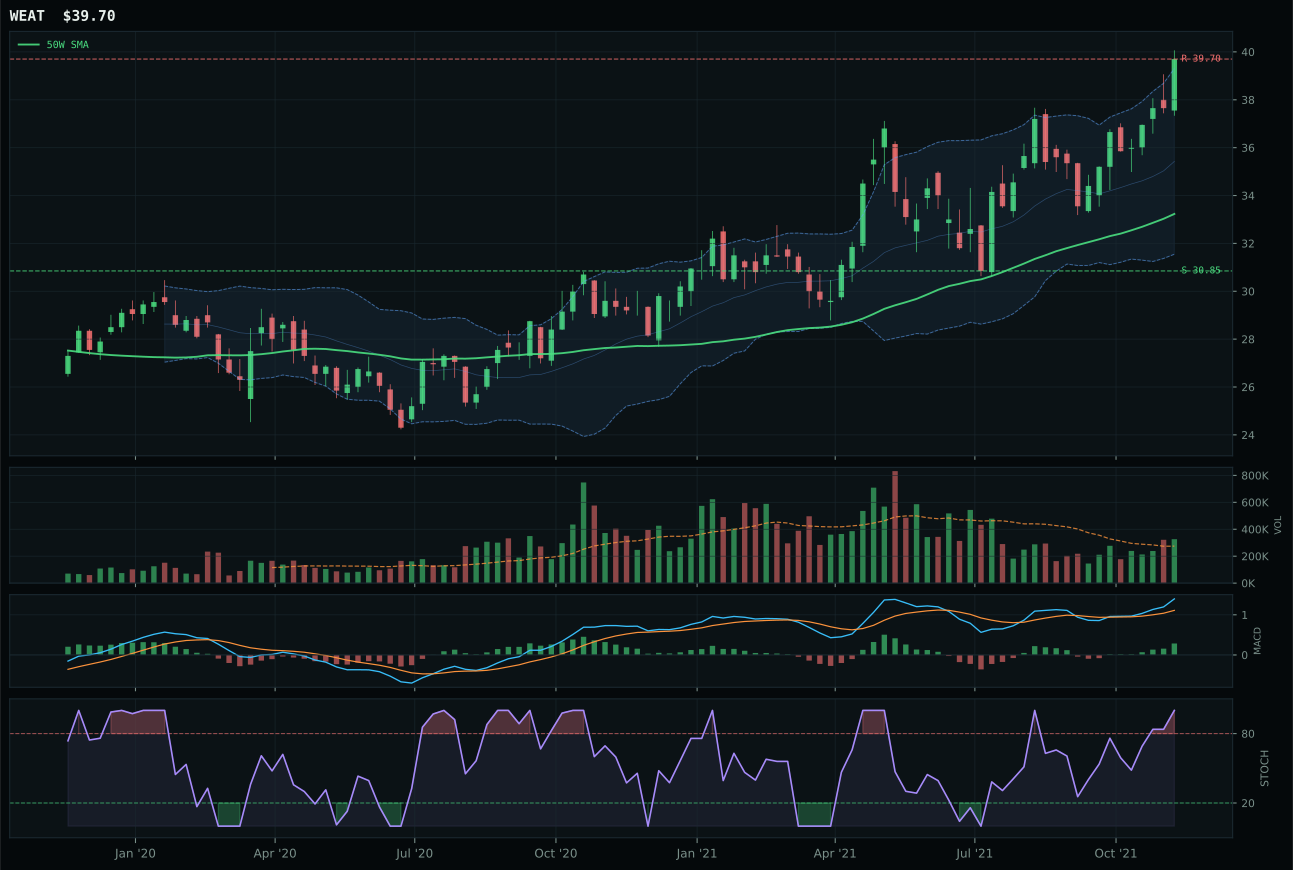
WEAT has a vertical extension profile with 1.9% 13-week relative strength versus SPY.
A failed hold above support would weaken the setup.
Tracked, but not top-2 eligible because: .
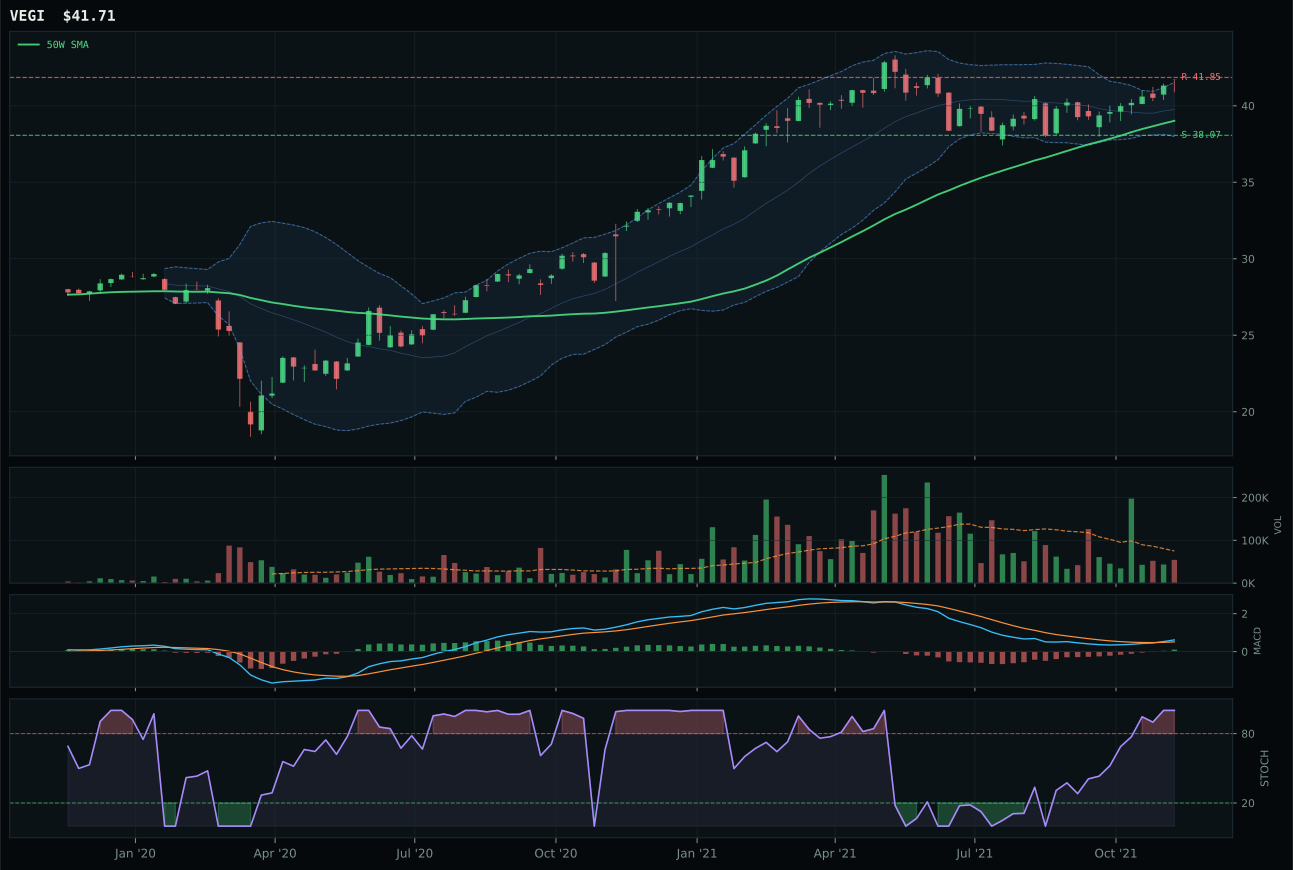
VEGI has a neutral structure profile with -1.6% 13-week relative strength versus SPY.
A failed hold above support would weaken the setup.
Tracked, but not top-2 eligible because: .
MOO wins because it owns the category-relative strength at 0.0% while WEAT's category-relative strength at 3.5% actually works against it in a tight decision. MOO's neutral structure and contained 8.5% extension from the 50W create a timing score of 75.0 that dominates WEAT's 37.0, which is penalized for 19.5% distance above the trend reference—WEAT is stretched, MOO is positioned. The 23.8-point gap over WEAT is clean, driven by MOO's 72.9 technical evidence versus WEAT's 45.0. MOO's bullish and improving MACD combined with overbought stochastic RSI (0.94) suggests the move is cresting, but thin participation at 0.58x is not a negative here; it means bigger hands are building without noise. WEAT's above-average participation of above-trend volume into a vertical extension is the opposite signal—retail enthusiasm into fullness.
Agriculture earns 5% allocation as tier-2, powered by the highest category-level macro fit in the entire portfolio at 86.0/100. Supply shortage (+13), inflation pressure (+10), and real asset sponsorship (+8) create a structural tailwind that transcends technical timing. In an AltSeason regime where commodity breadth is positive (+5), this category's fundamental backdrop is authentic: global grain stocks are tight, input costs are elevated, and farmers are seeing margin recovery for the first time in cycles. MOO's neutral structure and only 3.2% 13W return reflect the fact that agriculture is not a momentum play this week—it is a structural long with poor entry risk management. The 37.4 risk/reward and thin volume confirm that this allocation is macro-driven (63% of the score comes from macro fit) rather than technically clean. Hold 5% to capture real asset inflation and commodity scarcity exposure; do not expect upside acceleration until setup quality improves or macro descriptors shift materially toward commodity breadth or supply constraints.
Defense & Aerospace — XAR
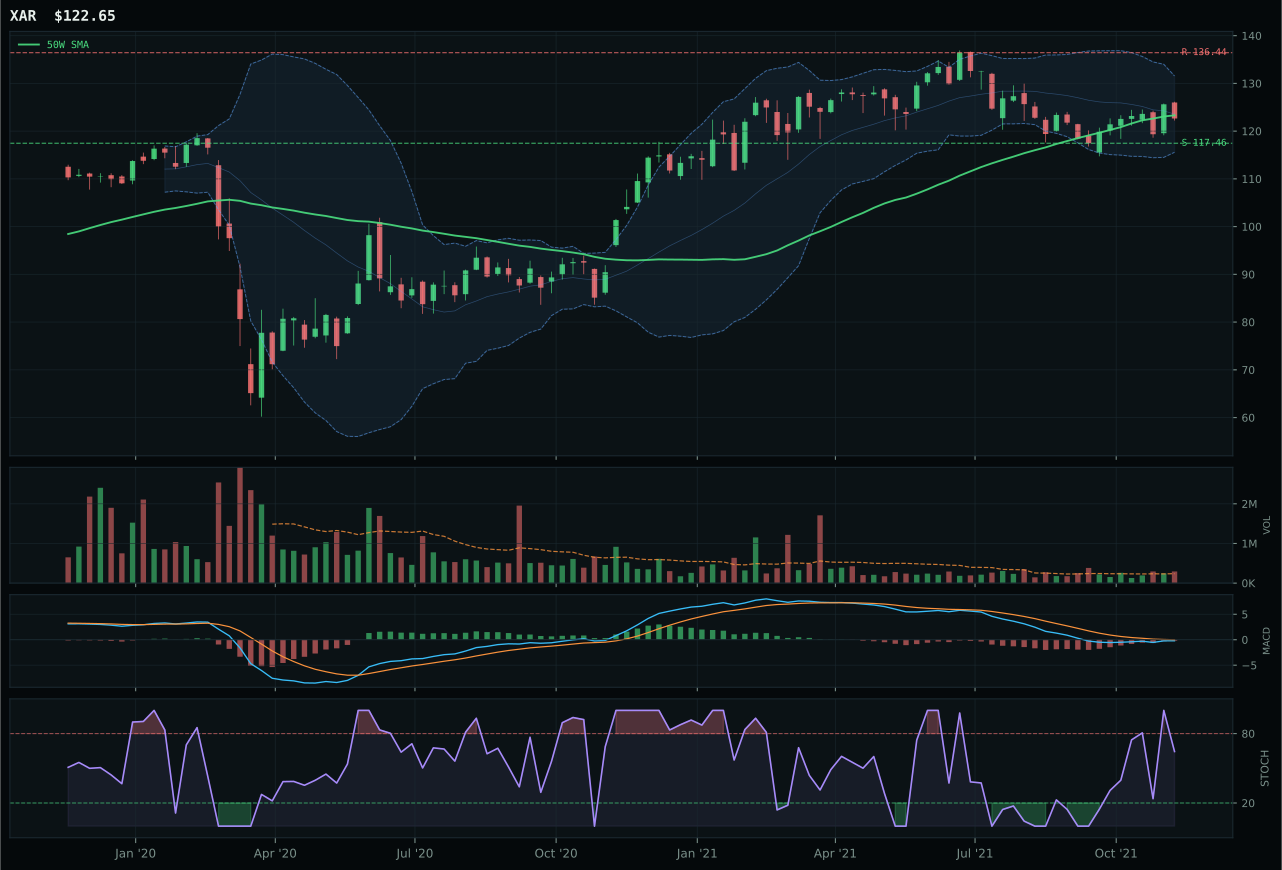
XAR has a pullback into support profile with -4.9% 13-week relative strength versus SPY.
A failed hold above support would weaken the setup.
Actionable but governed by invalidation levels.
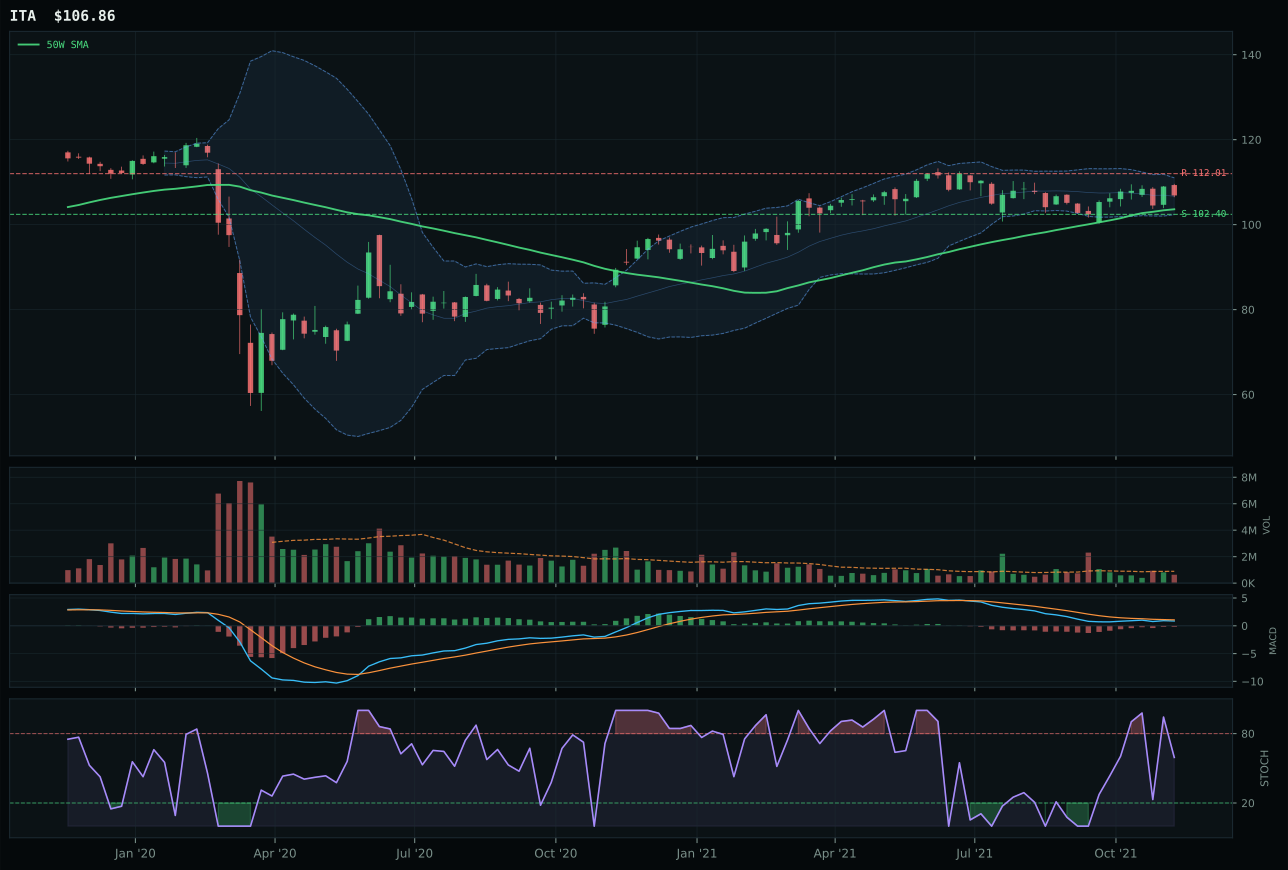
ITA has a pullback into support profile with -5.6% 13-week relative strength versus SPY.
A failed hold above support would weaken the setup.
Actionable but governed by invalidation levels.
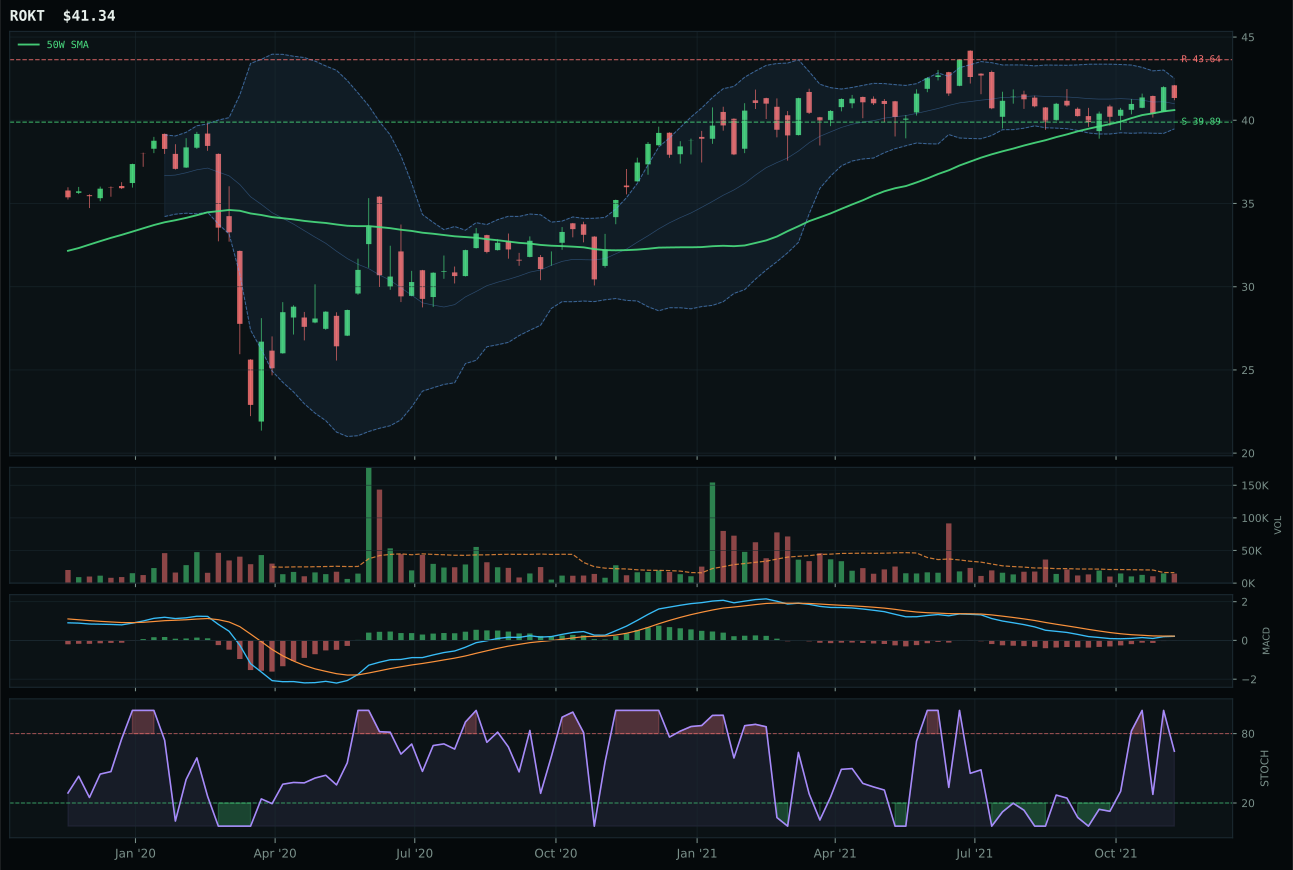
ROKT has a pullback into support profile with -3.6% 13-week relative strength versus SPY.
A failed hold above support would weaken the setup.
Tracked, but not top-2 eligible because: .
XAR wins this category despite a final score of only 48.6 because its setup is structurally different: price is below the 50W, the chart is pulling into support near 117.46, and risk/reward is exceptional at 94.2/100 (a 4.4% downside invalidation versus a -10.1% upside cap). This is a mean-reversion coil, not a momentum chase, and the score gap of 3.8 points over ITA reflects XAR's superior risk geometry. MACD is bearish but improving (not yet bullish), stochastic RSI is falling/neutral (not confirming), and volume at 1.24x is above-average participation in what should be washout volume—all tell-tale signs of institutional accumulation ahead of repair. ITA's thin participation and weaker structure (73.1 vs 77.5) left the setup unconfirmed, whereas XAR's heavier volume into support and better compression ratio create the technical scaffold for a reversal trap.
Defense & Aerospace receives 0% allocation this week and ranks outside the portfolio at 48.6/100, pulled down by macro friction that outweighs technical setup quality. The category-level macro fit of 64.0 is misleading—it reflects Transition/Mixed helping (+3), but broad market bear (-6) and dollar pressure (+3) create a net drag on risk appetite exposure that dominance in the defense trade cannot overcome. Dollar pressure is particularly damaging here because foreign order books and currency translation hit this sector asymmetrically during EM selloffs. XAR's timing score of 100.0 is a genuine strength, and its 94.2 risk/reward is exceptional, but entry timing inside a macro-restricted regime means the allocator's capital is better deployed in categories with both technical and macro tailwinds. If dollar pressure reverses or credit stress stabilizes (credit is currently -2 in the descriptor set), this category's exceptional support/resistance setup would re-enter tier-2 allocation immediately. Until then, it sits at zero—a miss-or-wait position rather than an outright rejection.
Emerging Markets — INDA
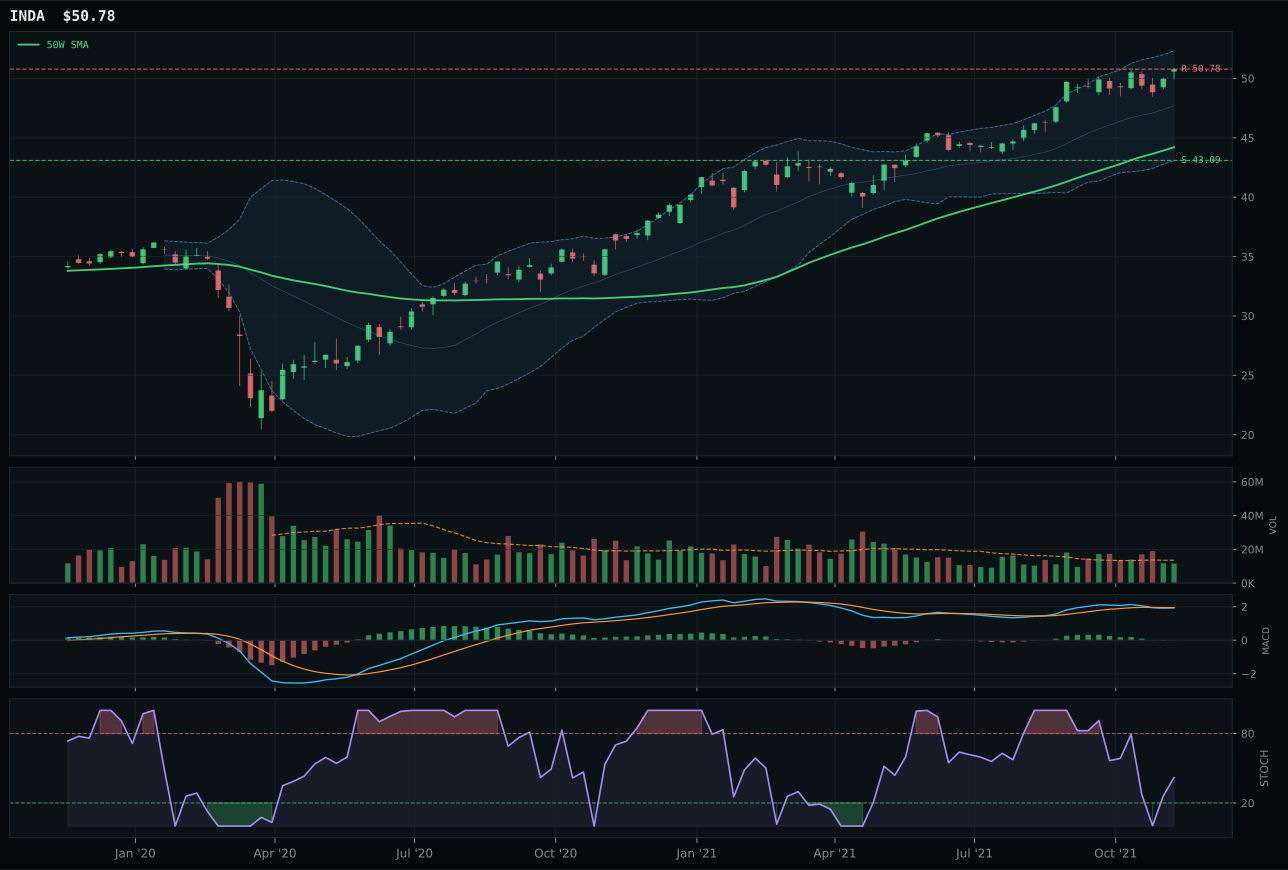
INDA has a neutral structure profile with 5.1% 13-week relative strength versus SPY.
A failed hold above support would weaken the setup.
Actionable but governed by invalidation levels.
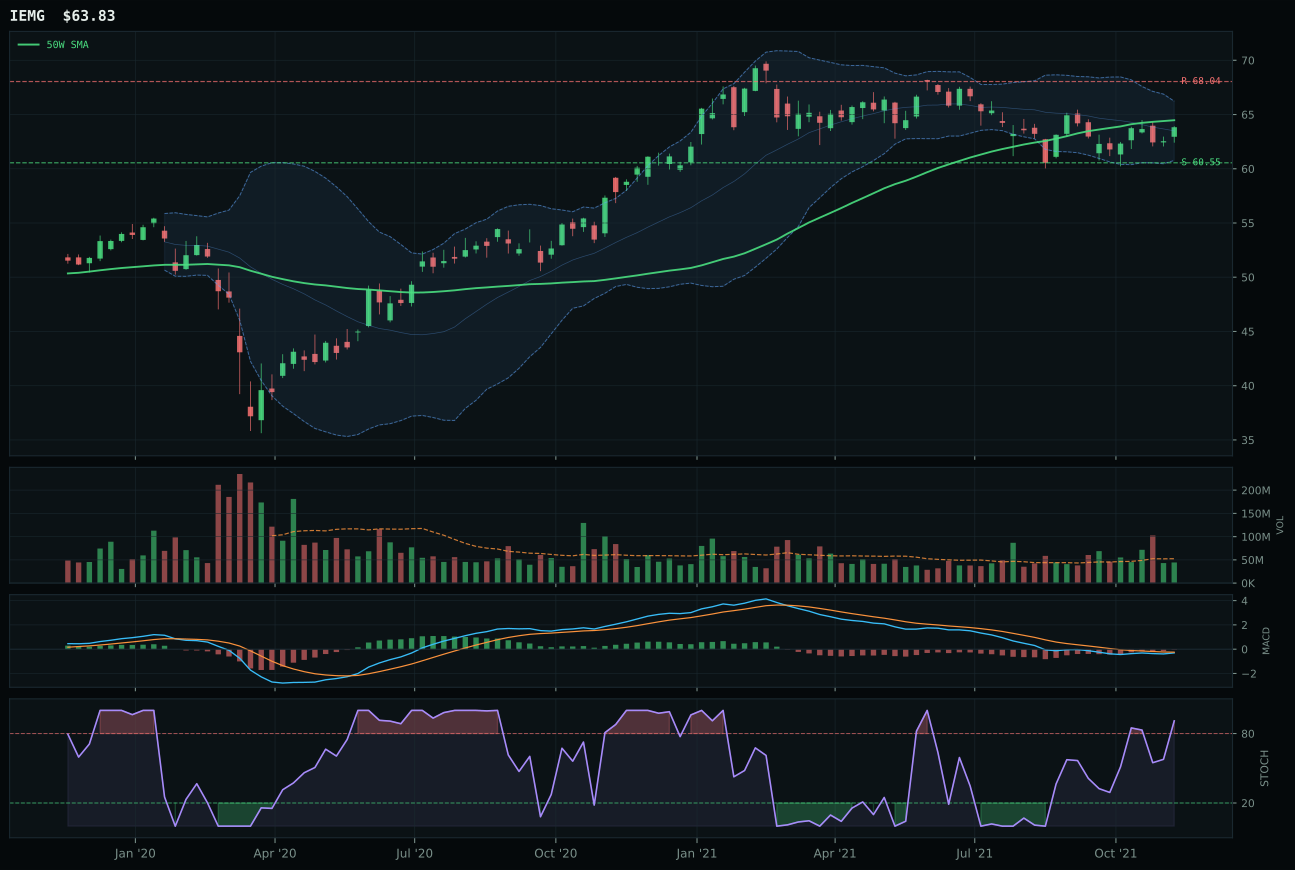
IEMG has a compression near 50W profile with -3.8% 13-week relative strength versus SPY.
A failed hold above support would weaken the setup.
Actionable but governed by invalidation levels.
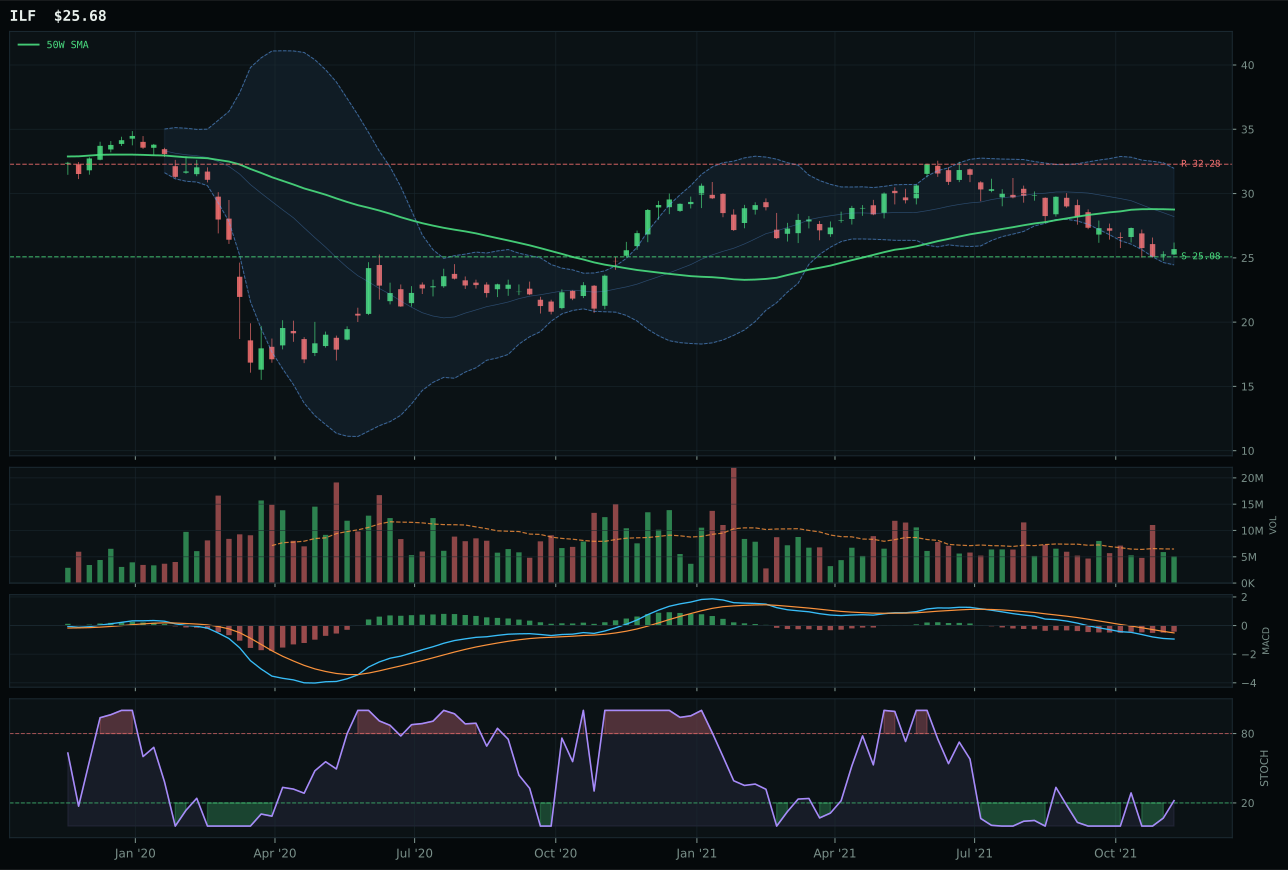
ILF has a pullback into support profile with -18.8% 13-week relative strength versus SPY.
Extension and support failure are the main tactical risks.
Tracked, but not top-2 eligible because: structurally broken.
INDA wins the category with a timing score of 70.0 because its 14.9% distance from the 50W creates better entry geometry than IEMG's compression near the 50W, which forces IEMG into a 100.0 timing score but leaves no edge. INDA's structure is neutral (78.3 vs IEMG's 72.8), and category-relative strength at 8.9% dominates IEMG's 0.0%, signaling that India-specific growth is outpacing broad EM beta. MACD is bearish/weakening for INDA (vs IEMG's bearish-but-improving), and stochastic RSI is rising mid-zone (vs IEMG's overbought momentum)—INDA reads as early-stage recovery into dips, IEMG reads as exhaustion. The gap is only 4.1 points (INDA 13.9 vs IEMG 9.8 at the previous scoring), but INDA's superior relative strength and less committed technical picture (bearish/weakening MACD suggests early reversal, not trapped bulls) drive the selection.
Emerging Markets receives 0% allocation this week, ranking outside the portfolio entirely at 13.9/100, pulled down by macro factors that overwhelm INDA's 60.9/100 technical evidence. The 25.0/100 category-level macro fit is the lowest in the portfolio, dragged down by dollar pressure (-14), credit stress (-10), and broad market bear (-9) that collectively neutralize the risk appetite positive (+8) signal. In a Transition/Mixed regime, EM exposure is asymmetrically vulnerable to dollar rallies and credit tightness. INDA's 5.1% RS versus SPY is positive noise, but the category framework requires both technical strength and macro tailwind to justify allocation; this week, the tailwind is a headwind. Notably, INDA's bearish/weakening MACD suggests the recent 9.9% 13W move is reversing early, not confirming. If dollar pressure reverses or credit stress becomes positive, this category would immediately re-enter tier-2 at 5%. Until then, zero allocation reflects structural EM vulnerability in a credit-sensitive, dollar-strong regime. Watch for INDA to hold above 43.09 support; breakdown would confirm the bearish MACD reversal and keep EM at zero for multiple weeks.