
2021-11-05
Informational purposes only. The content in this report, including allocations, analysis, and commentary, is provided solely for informational and educational purposes. It does not constitute financial advice, investment advice, trading advice, or any other type of advice. Past performance does not guarantee future results. Always conduct your own research and consult a qualified financial professional before making investment decisions.
Weekly Allocation
| Ticker | Category | Weight | Role |
|---|---|---|---|
| FSOL | 50% | Overlay | |
| XLE | Traditional Energy | 10% | Top-2 (10%) |
| URNM | Nuclear Energy | 10% | Top-2 (10%) |
| SMH | AI | 5% | Tier-2 (5%) |
| CIBR | Technology | 5% | Tier-2 (5%) |
| PAVE | Utilities & Infrastructure | 5% | Tier-2 (5%) |
| GLD | Precious Metals | 5% | Tier-2 (5%) |
| REMX | Industrial Metals | 5% | Tier-2 (5%) |
| XAR | Defense & Aerospace | 5% | Tier-2 (5%) |
Trade Instructions — Monday Open
Sell the tranche from 2021-10-08 (completing its 4-week hold). Buy the new tranche. Instructions show net portfolio changes — same-asset positions cancel, weight changes show the delta.
| Action | Ticker | Instruction |
|---|---|---|
| SELL | FCG | Sell entire FCG position (2.50% of portfolio) |
| SELL | WEAT | Sell 67% of WEAT position (reduce 3.75% → 1.25%) |
| SELL | IGF | Sell 50% of IGF position (reduce 2.50% → 1.25%) |
| SELL | ITA | Sell 33% of ITA position (reduce 3.75% → 2.50%) |
| SELL | COPX | Sell 20% of COPX position (reduce 6.25% → 5.00%) |
| SELL | GDX | Sell entire GDX position (1.25% of portfolio) |
| BUY | URNM | Buy URNM — 12.50% of freed cash (adds 1.25% to portfolio) |
| BUY | XLE | Buy XLE — 25.00% of freed cash (adds 2.50% to portfolio) |
| BUY | SMH | Buy SMH — 12.50% of freed cash (adds 1.25% to portfolio) |
| BUY | PAVE | Buy PAVE — 12.50% of freed cash (adds 1.25% to portfolio) |
| BUY | GLD | Buy GLD — 12.50% of freed cash (adds 1.25% to portfolio) |
| BUY | REMX | Buy REMX — 12.50% of freed cash (adds 1.25% to portfolio) |
| BUY | XAR | Buy XAR — 12.50% of freed cash (adds 1.25% to portfolio) |
Current Portfolio After Trade
Combined holdings across all 4 active tranches. Each tranche is 25% of the portfolio.
| Ticker | % of Portfolio | Weight Bar |
|---|---|---|
| FSOL | 50.00% | |
| XLE | 10.00% | |
| URNM | 7.50% | |
| CIBR | 5.00% | |
| COPX | 5.00% | |
| PAVE | 3.75% | |
| ITA | 2.50% | |
| SMH | 2.50% | |
| MOO | 2.50% | |
| GLD | 2.50% | |
| WEAT | 1.25% | |
| IGF | 1.25% | |
| URA | 1.25% | |
| INDA | 1.25% | |
| SLV | 1.25% | |
| REMX | 1.25% | |
| XAR | 1.25% |
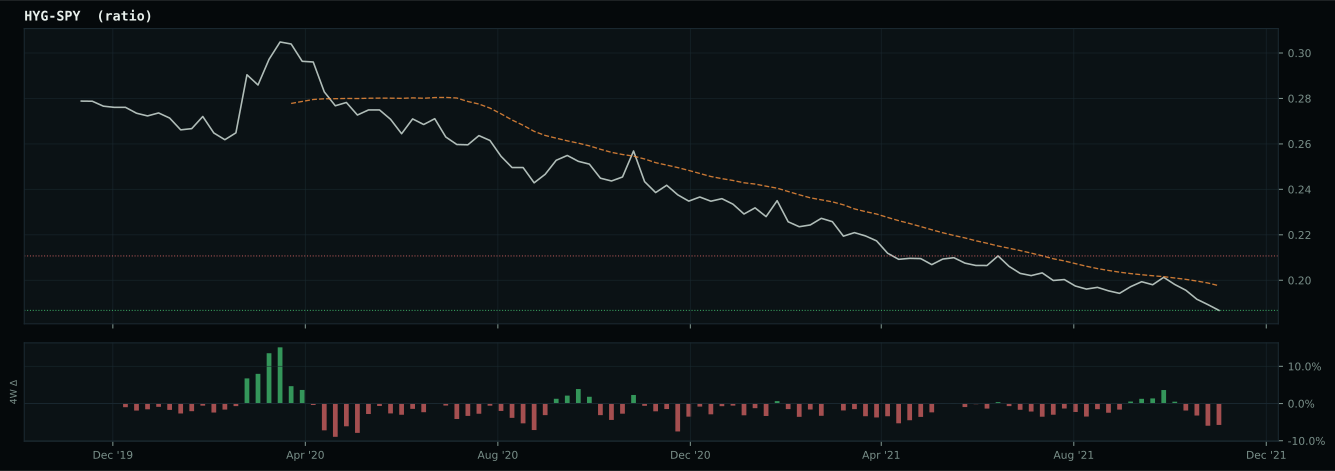
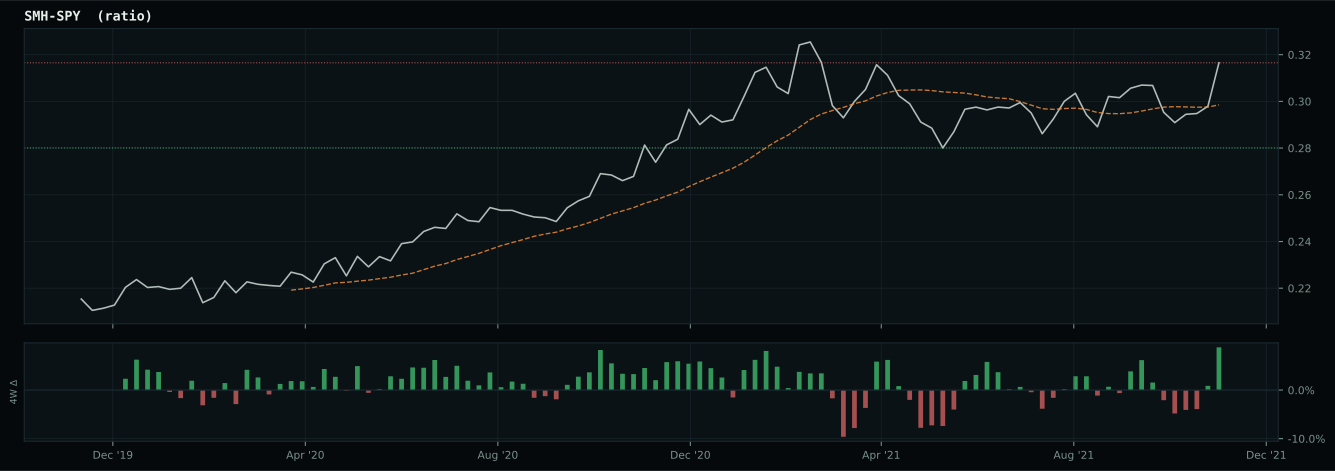
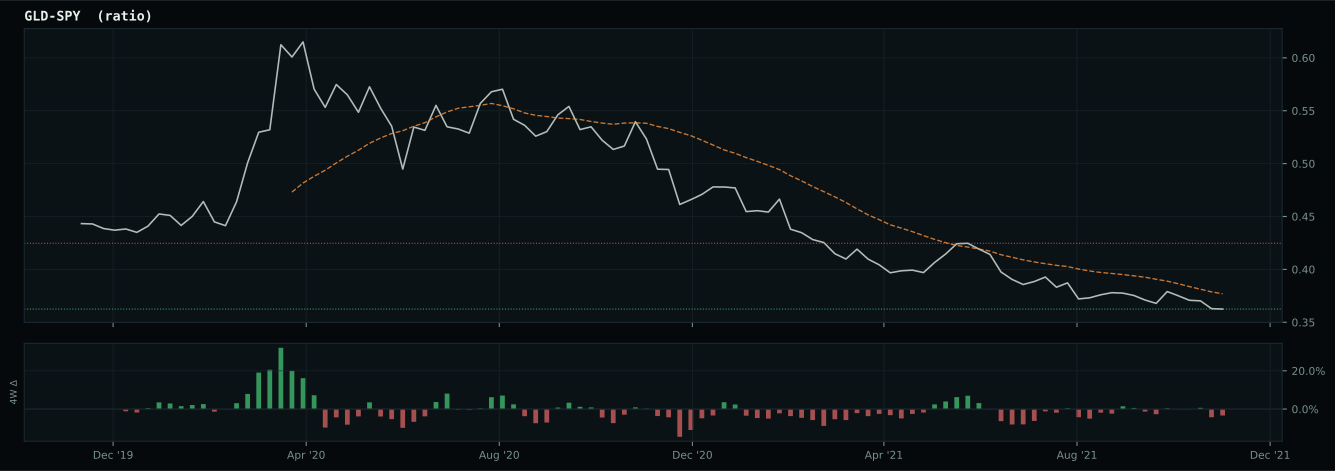
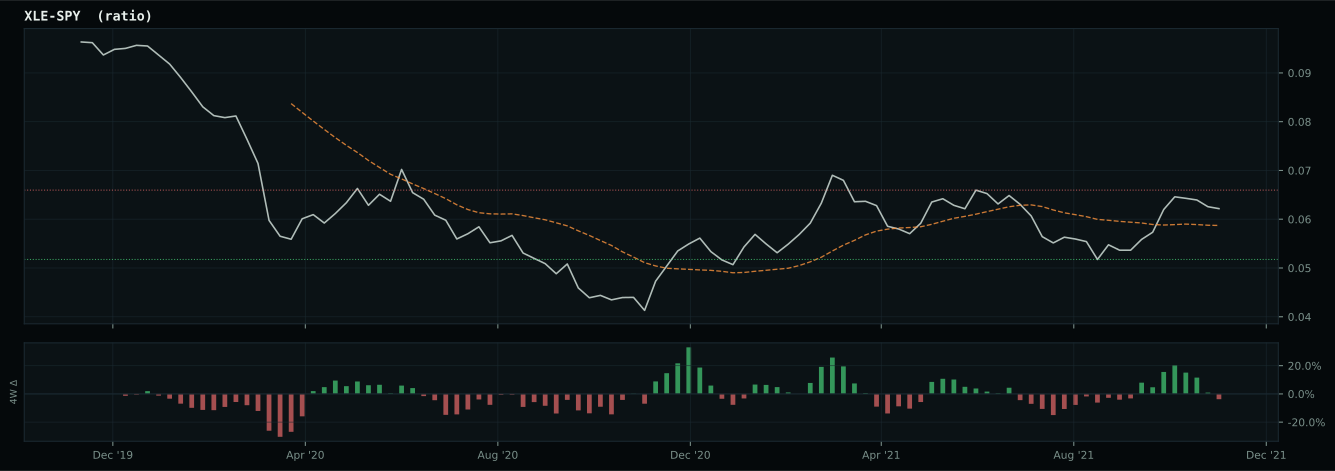
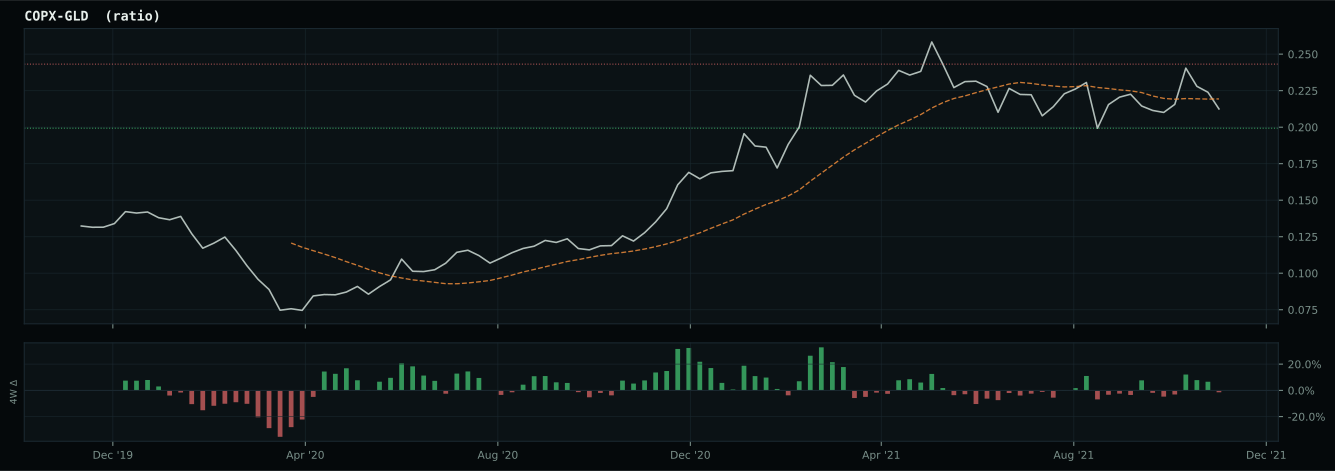
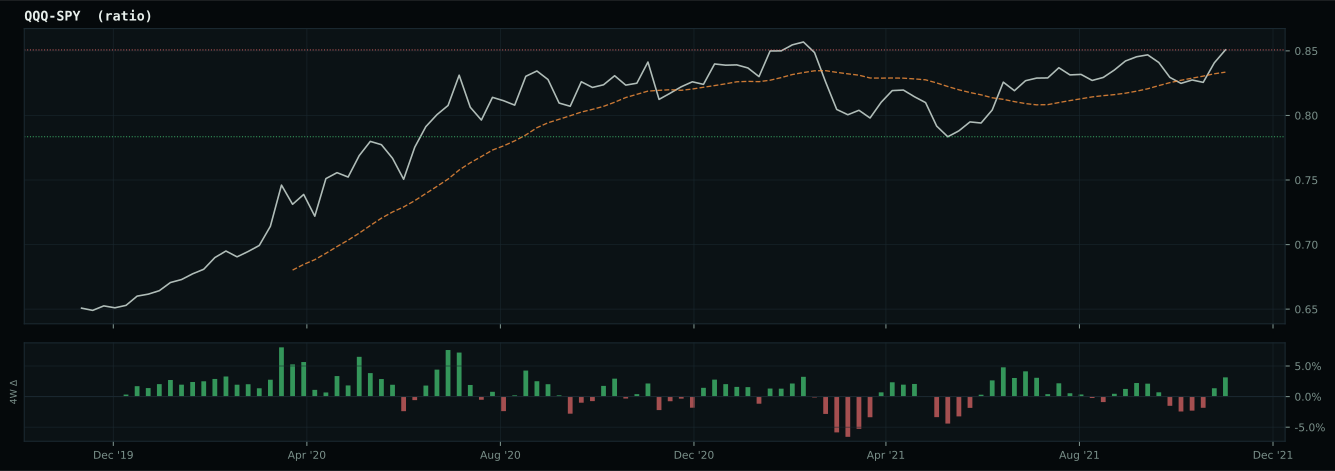
Macro Regime — Transition / Mixed
Macro Evidence Charts
Market-implied signals behind the macro regime scores. Each ratio compares two assets; the direction and slope of the ratio is what the macro engine reads.
Crypto Regime — AltSeason
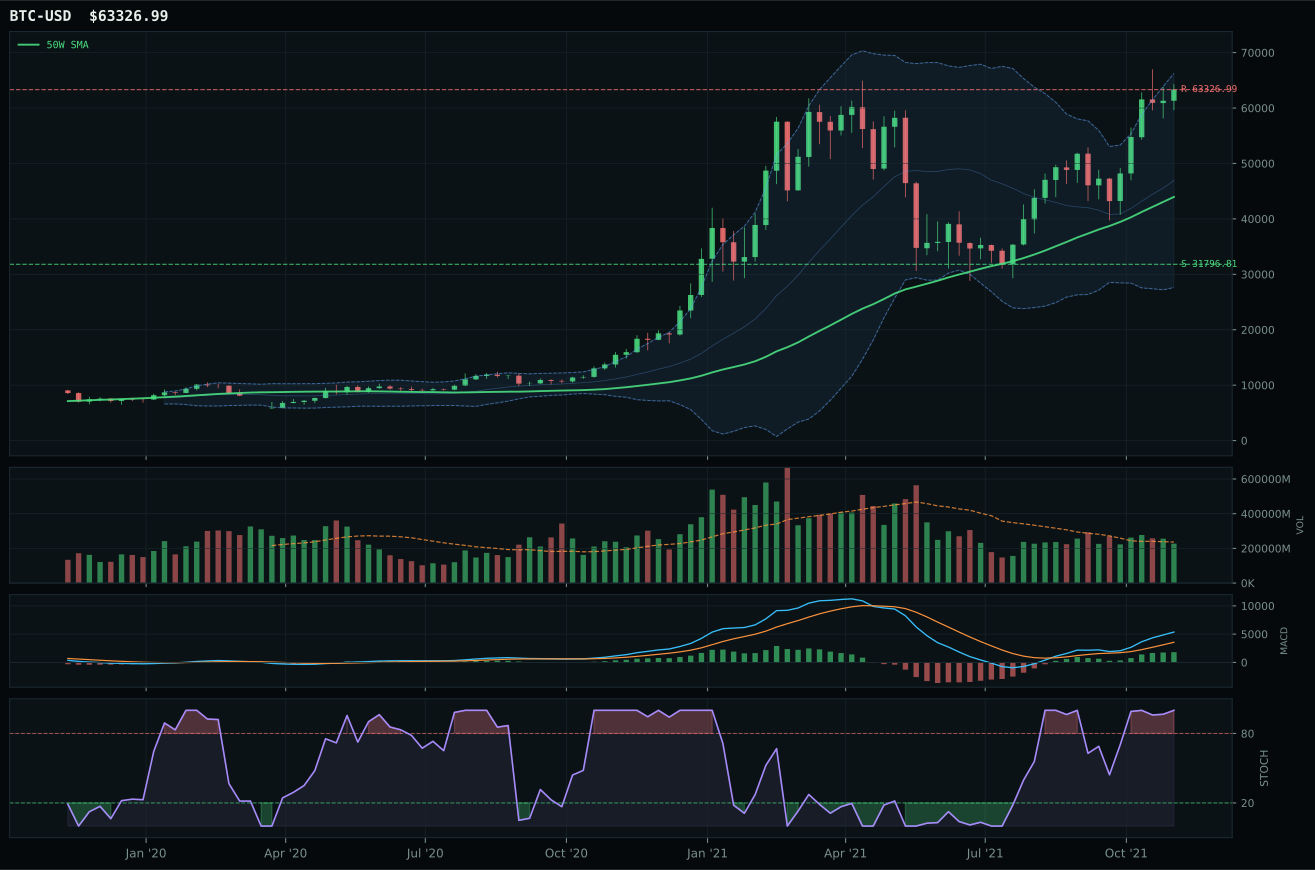
ValueBTC not armed: BTC has not made the first post-breakdown touch of the 200W buy zone after losing the 50W
TrendBTC confirmed: 2 consecutive closes above rising/flat 50W SMA
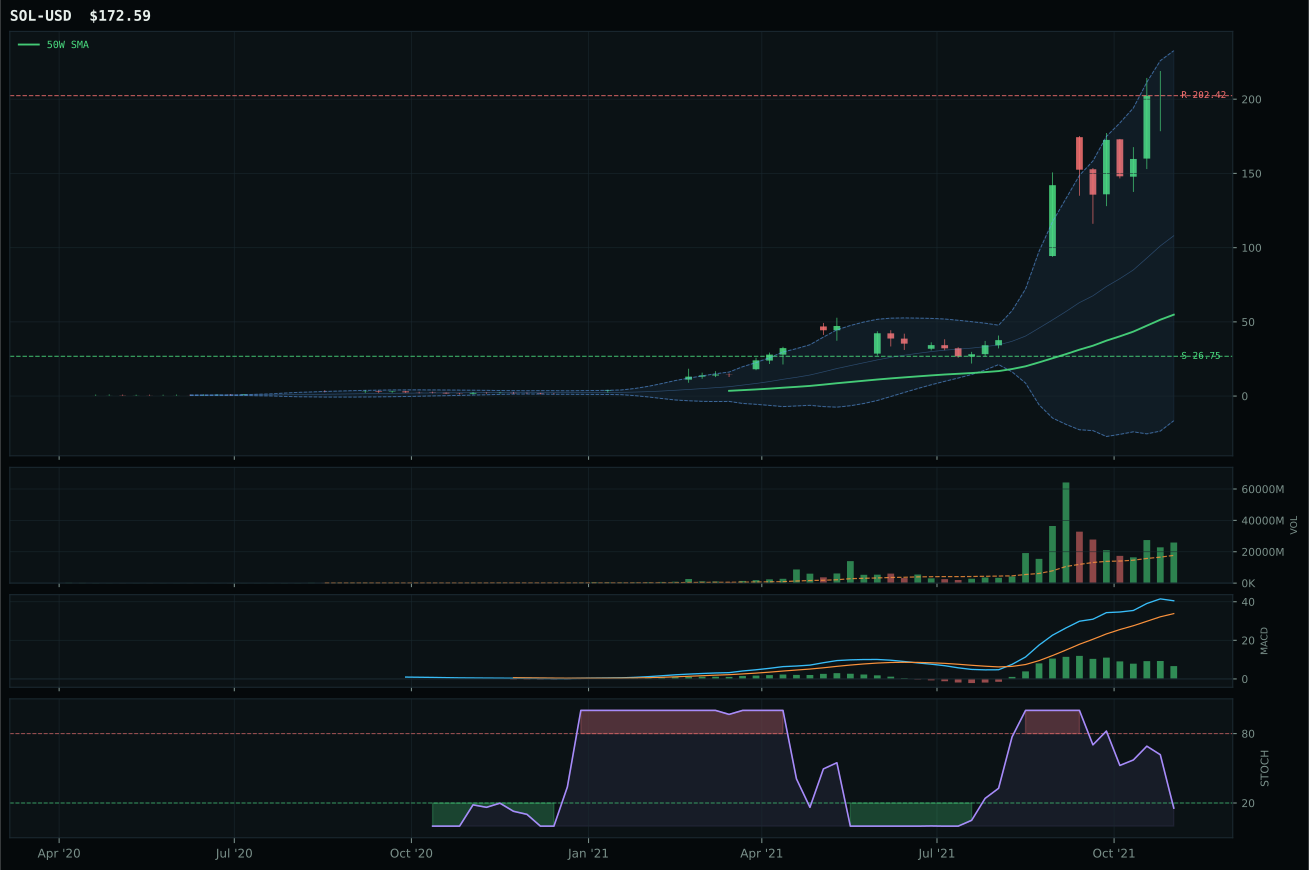
all available AltSeason conditions pass; missing optional confirmations skipped
Category Rankings
| Rank | Category | Winner | Score | Alloc | 4W Ret | Peers (4W) |
|---|---|---|---|---|---|---|
| 1 | Traditional Energy | XLE | 80.0 | 20% | -4.70% | FCG -11.6% · XOP -12.9% |
| 2 | Nuclear Energy | URNM | 68.4 | 20% | -21.04% | URA -20.2% · NLR -5.0% |
| 3 | AI | SMH | 67.4 | 10% | +0.35% | BOTZ -10.8% · AIQ -6.3% |
| 4 | Technology | CIBR | 64.7 | 10% | -9.77% | XLK -1.2% · IGV -11.7% |
| 5 | Utilities & Infrastructure | PAVE | 55.4 | 10% | -4.86% | IGF -5.3% · XLU +0.8% |
| 6 | Precious Metals | GLD | 54.6 | 10% | -2.52% | SLV -8.9% · GDX -7.6% |
| 7 | Industrial Metals | REMX | 53.1 | 10% | -4.65% | COPX -2.5% · PICK -2.0% |
| 8 | Defense & Aerospace | XAR | 49.8 | 10% | -10.80% | ITA -9.6% · ROKT -7.0% |
| 9 | Agriculture & Livestock | MOO | 48.9 | 0% | -5.65% | WEAT +2.3% · VEGI -5.4% |
| 10 | Emerging Markets | INDA | 42.6 | 0% | -7.06% | IEMG -4.4% · ILF -2.6% |
Traditional Energy — XLE
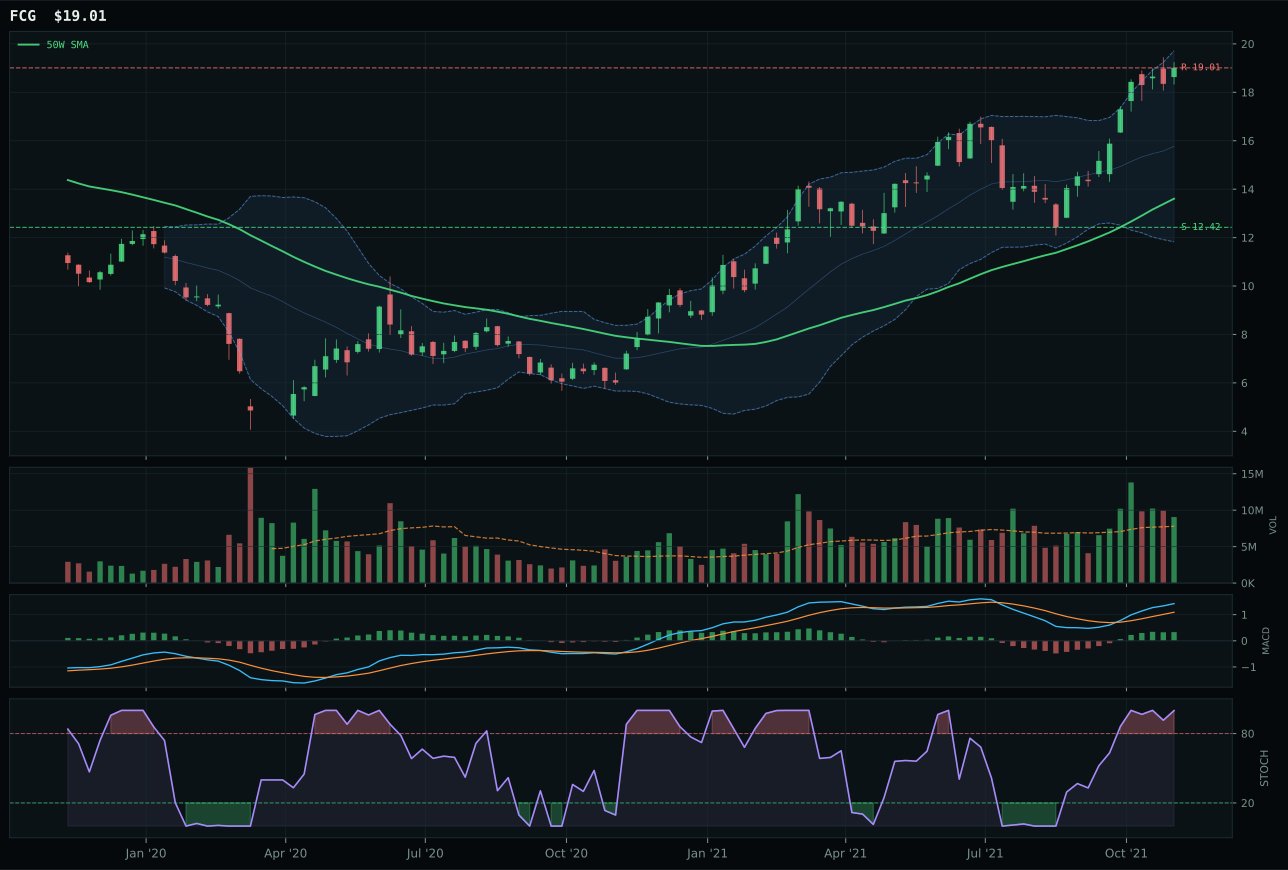
FCG has a vertical extension profile with 31.0% 13-week relative strength versus SPY.
A failed hold above support would weaken the setup.
Actionable but governed by invalidation levels.
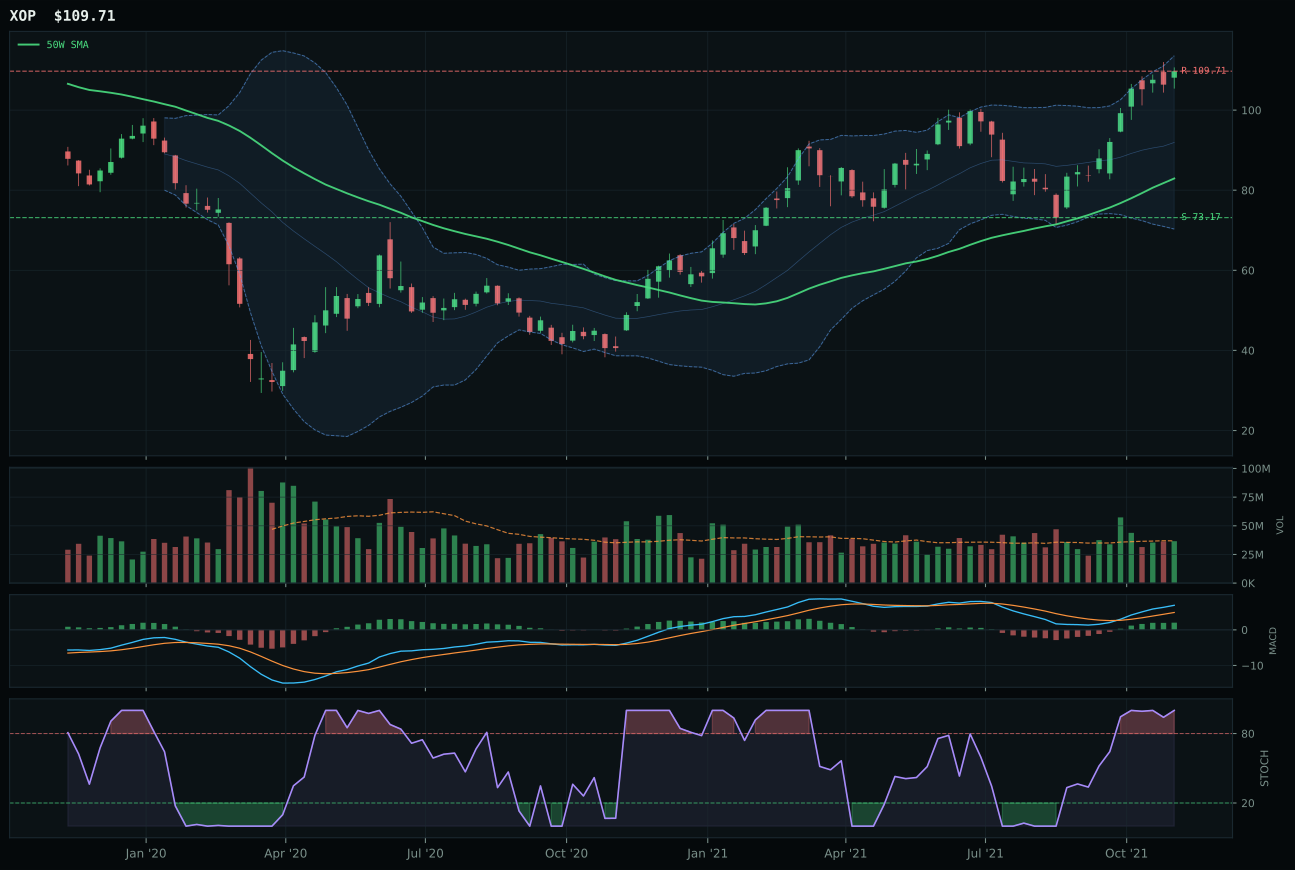
XOP has a vertical extension profile with 27.7% 13-week relative strength versus SPY.
A failed hold above support would weaken the setup.
Actionable but governed by invalidation levels.
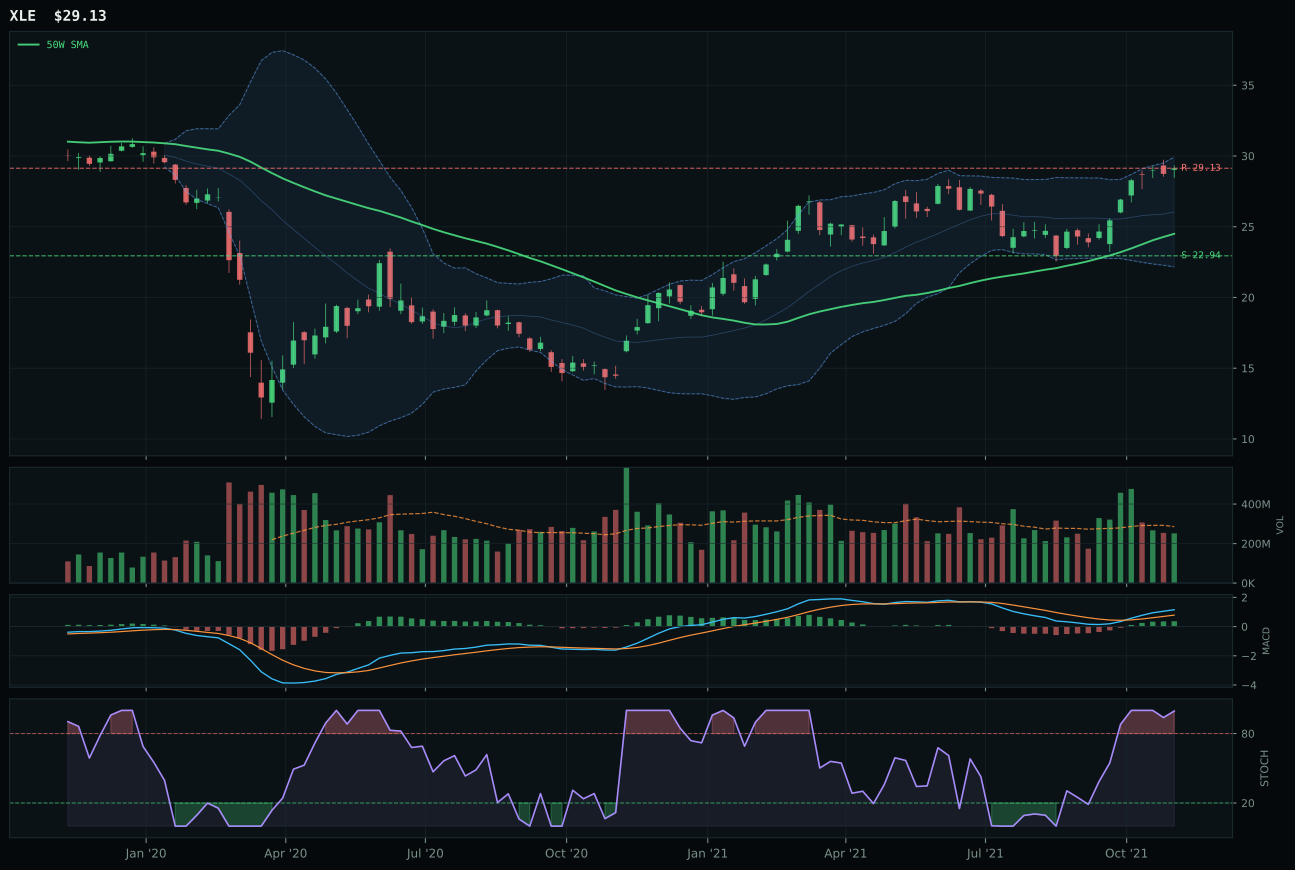
XLE has a vertical extension profile with 11.8% 13-week relative strength versus SPY.
A failed hold above support would weaken the setup.
Actionable but governed by invalidation levels.
XLE wins Traditional Energy on balanced risk management rather than technical purity: while FCG boasts superior technical evidence at 82.1/100 and leads the category on macro narrative, XLE's more conservative positioning earns the representative slot. XLE's 13W return of 17.7% trails FCG's 36.9%, but that restraint reflects XLE's closer proximity to the 50W (18.9% versus 39.7%), offering better risk control in an overbought environment. XLE's risk/reward of 42.3 versus FCG's 39.7 favors the integrated major, and stochastic RSI is rolling over at 0.99 rather than spiking into pure momentum at 1.00. Both show vertical extension and improving MACD, but XLE's 11.8% SPY relative strength, while trailing FCG's 31.0%, still commands respect and suggests institutional positioning. The 1.5-point final-score gap reveals a close call decided by timing discipline and volume structure (neutral for XLE versus above-average participation for FCG, which indicates late buying).
Traditional Energy earns 10% allocation as a top-2 overweight, reflecting its exceptional 80.0 final category score and macro dominance. Energy scarcity is active at +16, inflation pressure at +10, supply shortage at +9, and real asset sponsorship at +7—a consensus bet on upstream capacity constraints and geopolitical risk. XLE's trend score is perfect at 100.0, and the fund benefits from integrated cash-flow defensiveness in a Transition/Mixed regime where credit stress is a live concern. Yet the timing component remains challenged at only 27.0/100; XLE sits extended at 18.9% above the 50W, and volume-price confirmation is weak at 46.3/100, suggesting the move has outrun participation. The top-2 allocation reflects conviction on the macro thesis, not technical perfection. A decisive consolidation and reconfirmation above the 50W with sustained above-average volume would solidify this position; any reversal below support at 22.94 with increased distribution would promptly trigger a reassessment. For now, the energy allocation trades macro macro strength against near-term timing risk.
Nuclear Energy — URNM
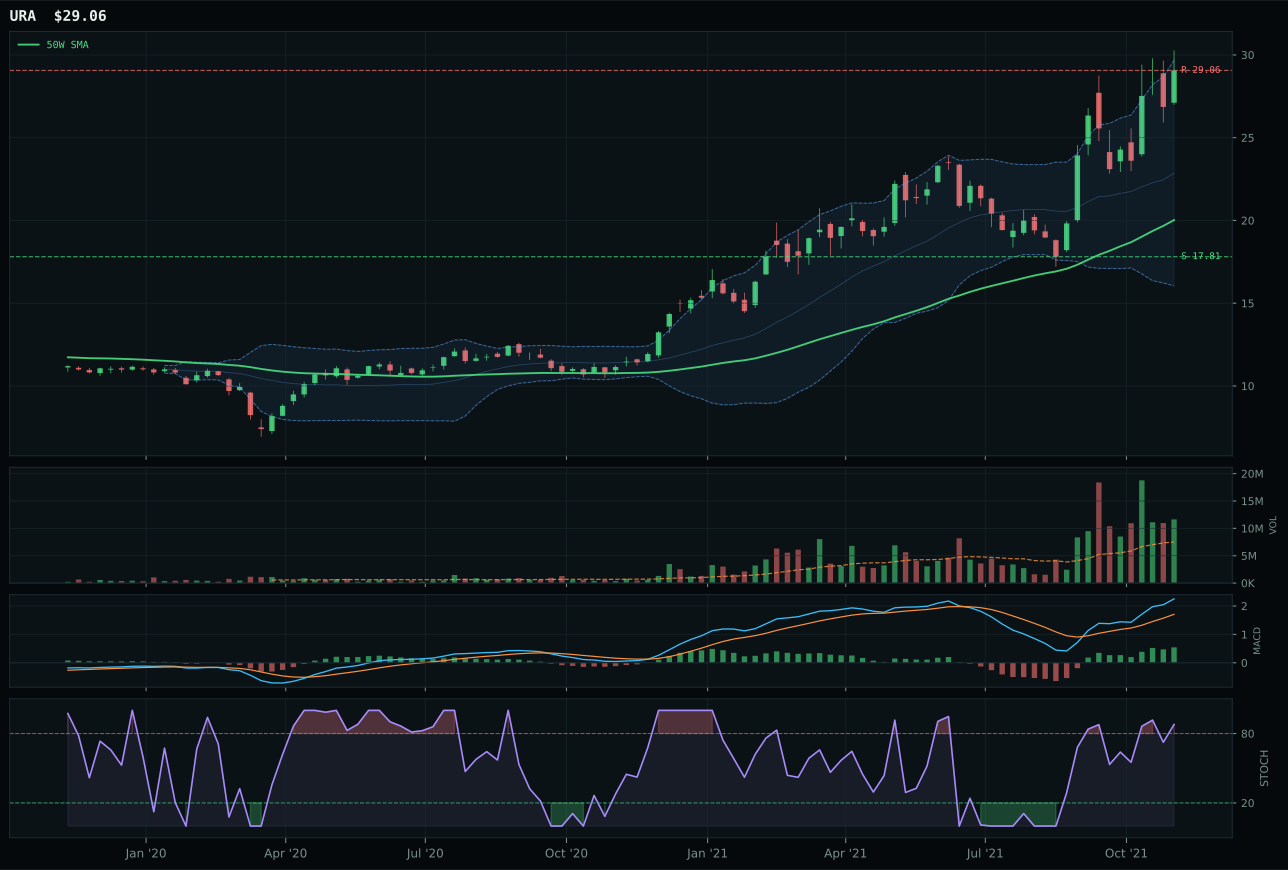
URA has a vertical extension profile with 43.9% 13-week relative strength versus SPY.
A failed hold above support would weaken the setup.
Actionable but governed by invalidation levels.
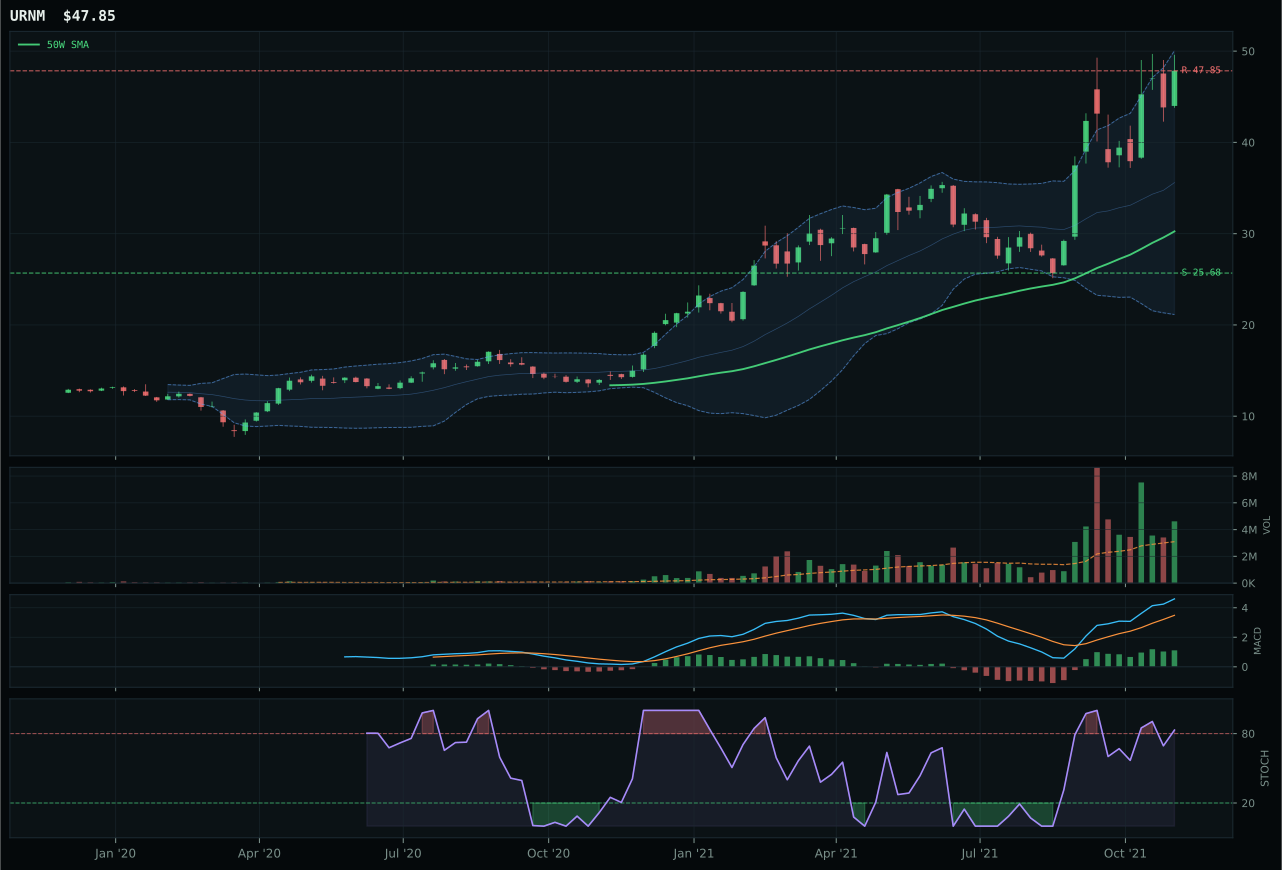
URNM has a vertical extension profile with 62.6% 13-week relative strength versus SPY.
A failed hold above support would weaken the setup.
Actionable but governed by invalidation levels.
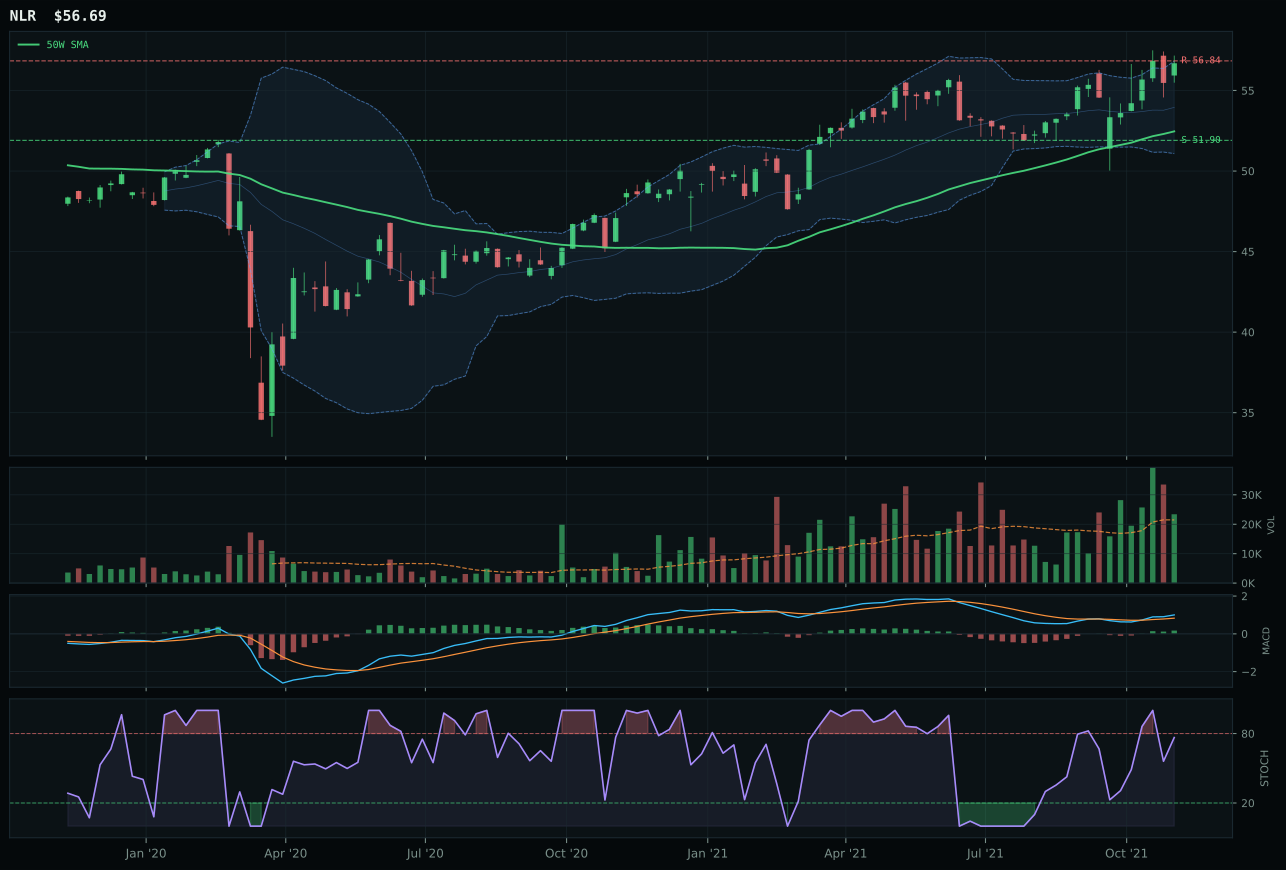
NLR has a neutral structure profile with 2.6% 13-week relative strength versus SPY.
A failed hold above support would weaken the setup.
Tracked, but not top-2 eligible because: .
URNM wins Nuclear Energy on explosive momentum confirmation despite being priced well below the technical ideal. The fund's 68.5% 13W return and 62.6% SPY relative strength are unmatched in the portfolio, backed by category-relative strength of 18.7% versus URA's 0.0% and above-average volume participation at 1.49x average. MACD is bullish and improving, persistence is a perfect 100.0, and volume-price confirmation is strong at 79.2/100—the uranium mining complex is in a sustained uptrend powered by both supply scarcity and re-rating around energy security. The penalty is timing: URNM sits 58.2% above the 50W, extended well beyond the Fib 0.236 zone, with downside-to-support risk of 86.3% versus zero upside to resistance. URA technically superior (91.6/100 technical evidence) but lacks the internal basket leadership that URNM possesses, making it a laggard despite a stronger risk/reward profile.
Nuclear Energy earns 10% allocation as the second top-2 overweight, competing with Traditional Energy for the portfolio's macro conviction. Energy scarcity is active at +9, real asset sponsorship at +7, and inflation pressure at +4, all supporting the nuclear tailwind. URNM's macro fit of 69.0/100 and explosive momentum confirmation (100.0/100) make it a compelling tactical hold despite extreme extension. The 50% overlay halves the 10% tier-2 slot to 5%, but the system still allocates a full 10% to Nuclear, signaling that the supply-scarcity thesis overrides timing risk. Persistence at 100.0 is the critical edge: URNM is not a dead-cat bounce but a sustained trend powered by sustained volume and sustained relative strength. Risk is binary: if uranium scarcity narratives deteriorate or equities enter a sharp correction, the 86.3% downside to support becomes material. The allocation holds as long as energy-scarcity macro remains active and volume participation stays above average; a reversal below support at 25.68 combined with a MACD rollover would trigger rapid rebalancing.
AI — SMH
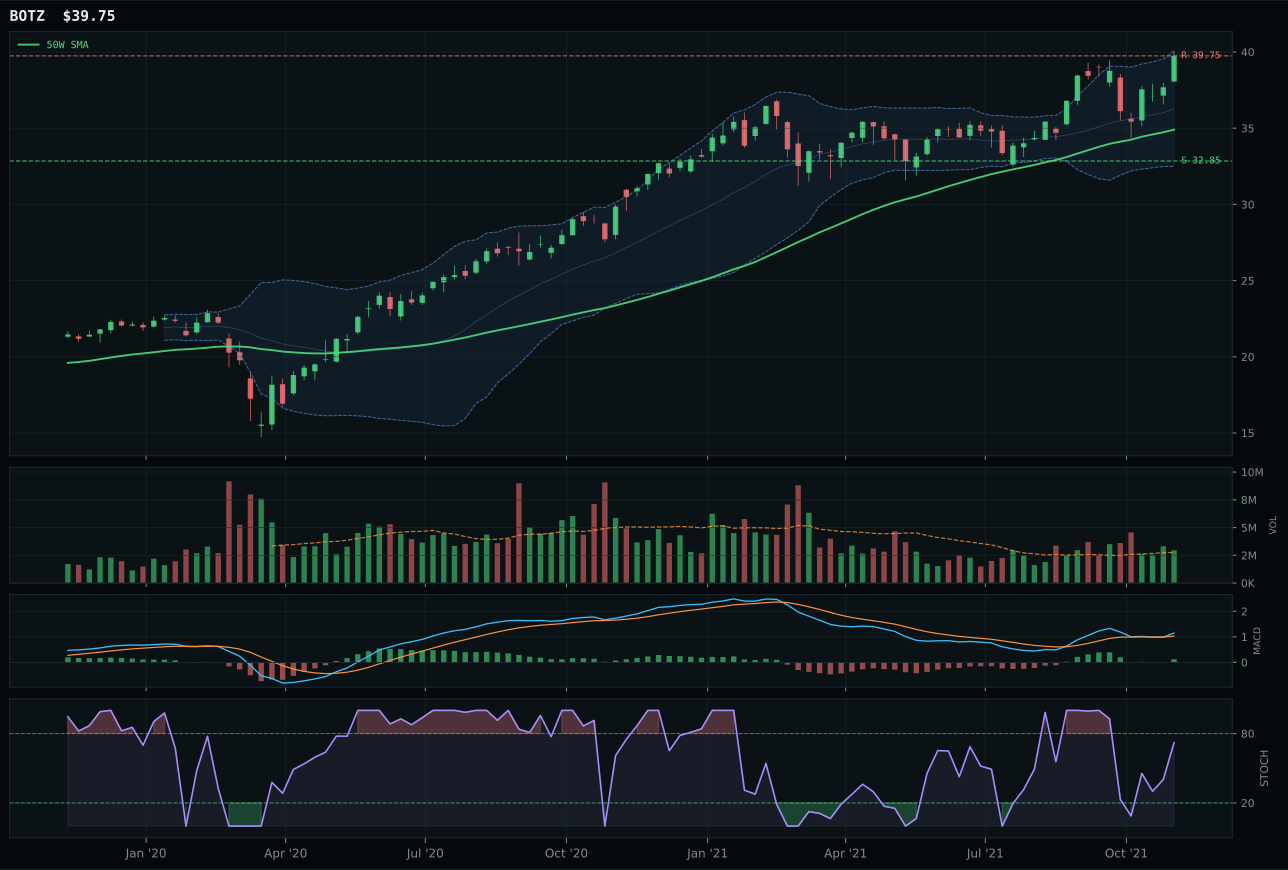
BOTZ has a neutral structure profile with 9.8% 13-week relative strength versus SPY.
A failed hold above support would weaken the setup.
Actionable but governed by invalidation levels.
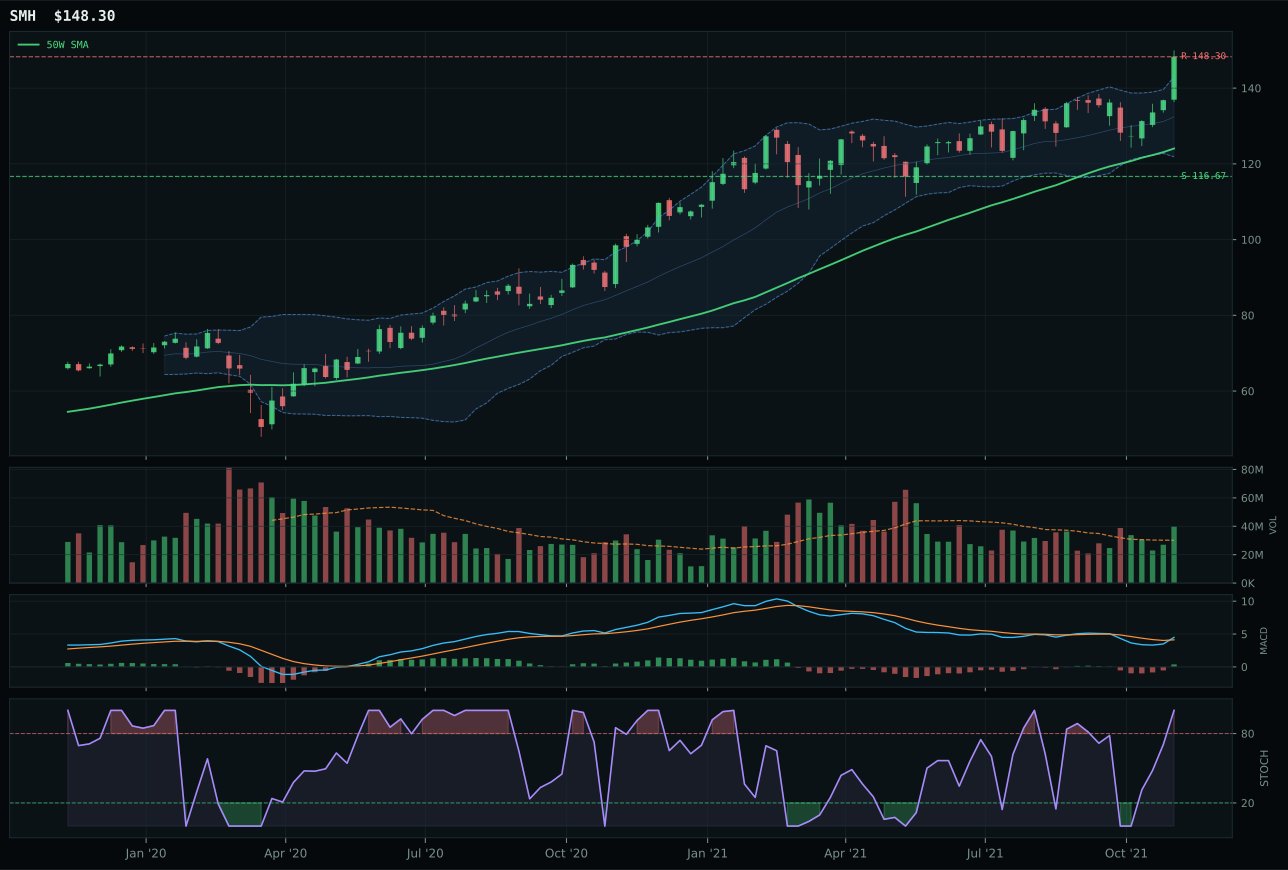
SMH has a vertical extension profile with 4.6% 13-week relative strength versus SPY.
A failed hold above support would weaken the setup.
Actionable but governed by invalidation levels.
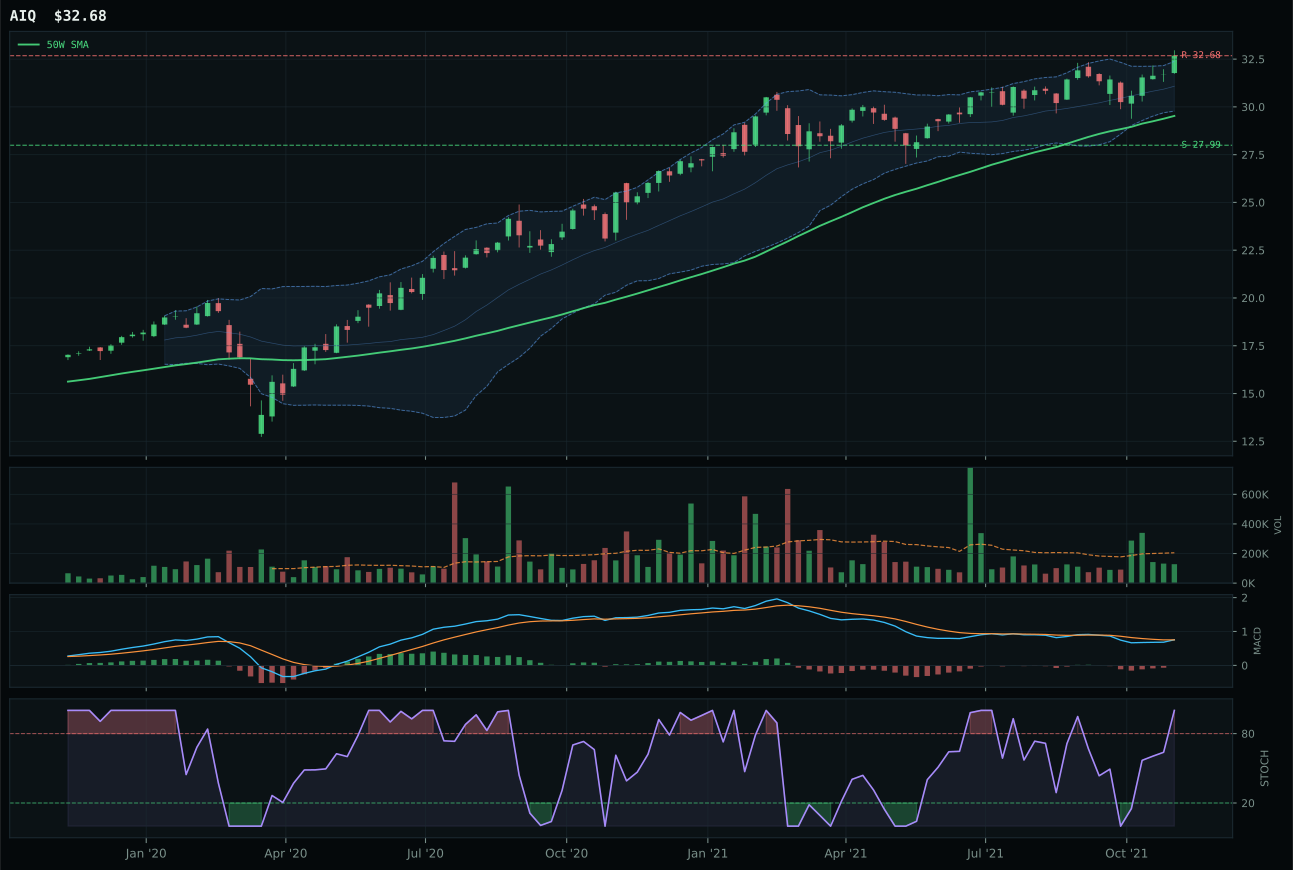
AIQ has a neutral structure profile with -0.0% 13-week relative strength versus SPY.
A failed hold above support would weaken the setup.
Tracked, but not top-2 eligible because: .
SMH wins despite a composite score that trails runner-up BOTZ by 13.0 points—a stark inversion that reveals the power of category-relative strength in the selection model. BOTZ carries superior technical evidence (91.5/100 versus 84.1/100) and stronger near-term momentum (15.7% over 13W), but it lags in the one metric that separates leadership from mere breadth: BOTZ posted 5.3% RS within the AI basket while SMH posted zero, yet SMH's macro fit (68.0/100) punches 13.0 points higher because AI growth sponsorship is active at +14. The semiconductor play's 4.6% SPY-relative return and neutral volume structure pale beside BOTZ's robotics outperformance, but when macro conditions privilege compute and industrial AI scarcity, the semiconductor entry holds priority. Both charts are vertical extensions 19–20% above their 50W, both are overbought, and both show improving MACD; SMH simply wins the category-relative proof test.
AI receives 5% allocation as tier-2, holding a mid-portfolio position despite its respectable 67.4 final score. The category's macro fit is robust at 66.0/100, powered by AI growth sponsorship (+14) and risk appetite (+10), but credit stress (-8) gnaws at the setup and limits upside. BOTZ's superior technical evidence (91.5/100) and SMH's emerging leadership within the basket are both overshadowed by the fact that neither representative can command sustained above-average volume—SMH trades at 1.32x average participation while BOTZ sits neutral. Entry risk is also material: SMH at 19.5% above the 50W and BOTZ at similar extremes leave little room for follow-through. The category would need to see either a consolidation-and-reconfirmation pattern or a macro shift that elevates its scoring above the 70+ range to earn a top-2 slot. For now, AI merits its allocation as a conviction play on scarcity themes, but the extended timing profile keeps it disciplined in tier-2.
Technology — CIBR
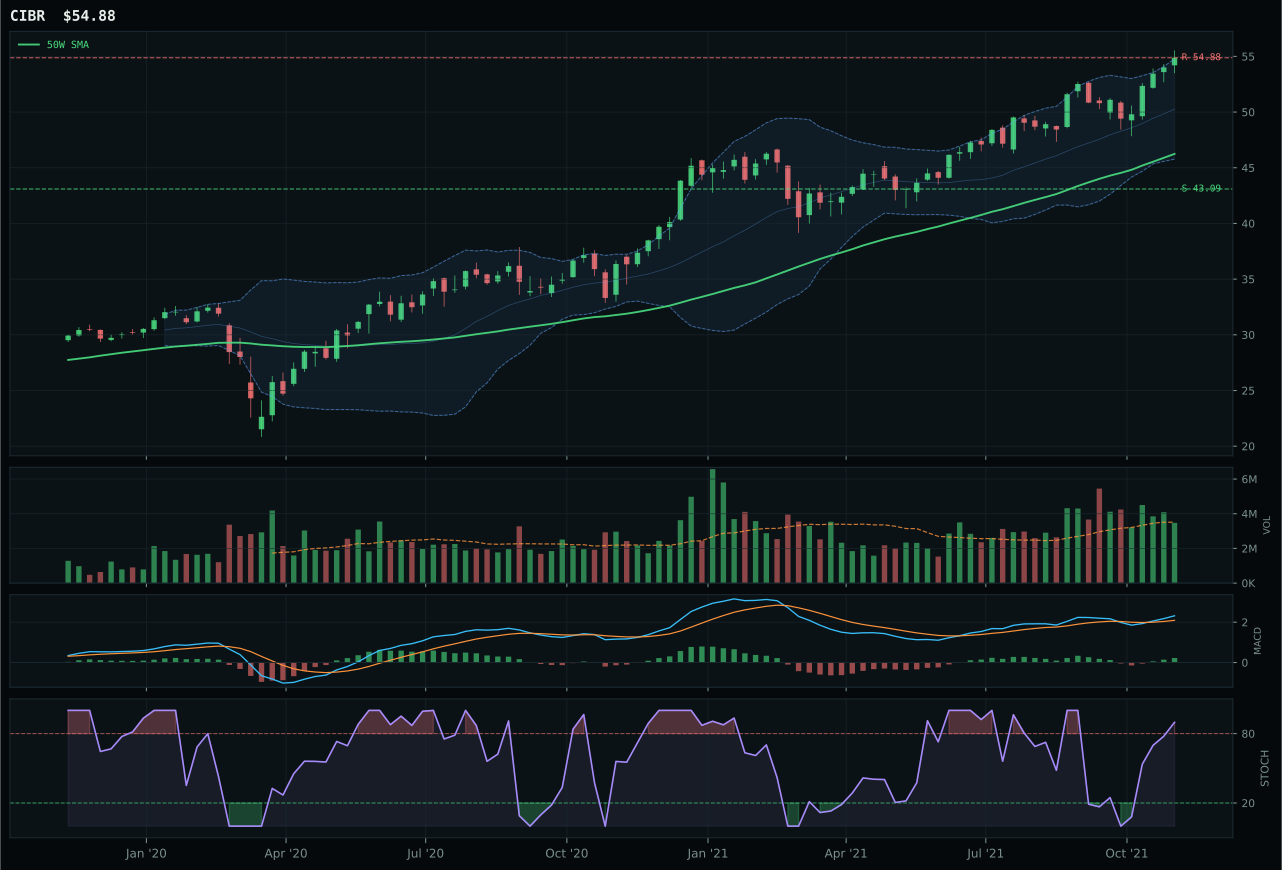
CIBR has a vertical extension profile with 6.8% 13-week relative strength versus SPY.
A failed hold above support would weaken the setup.
Actionable but governed by invalidation levels.
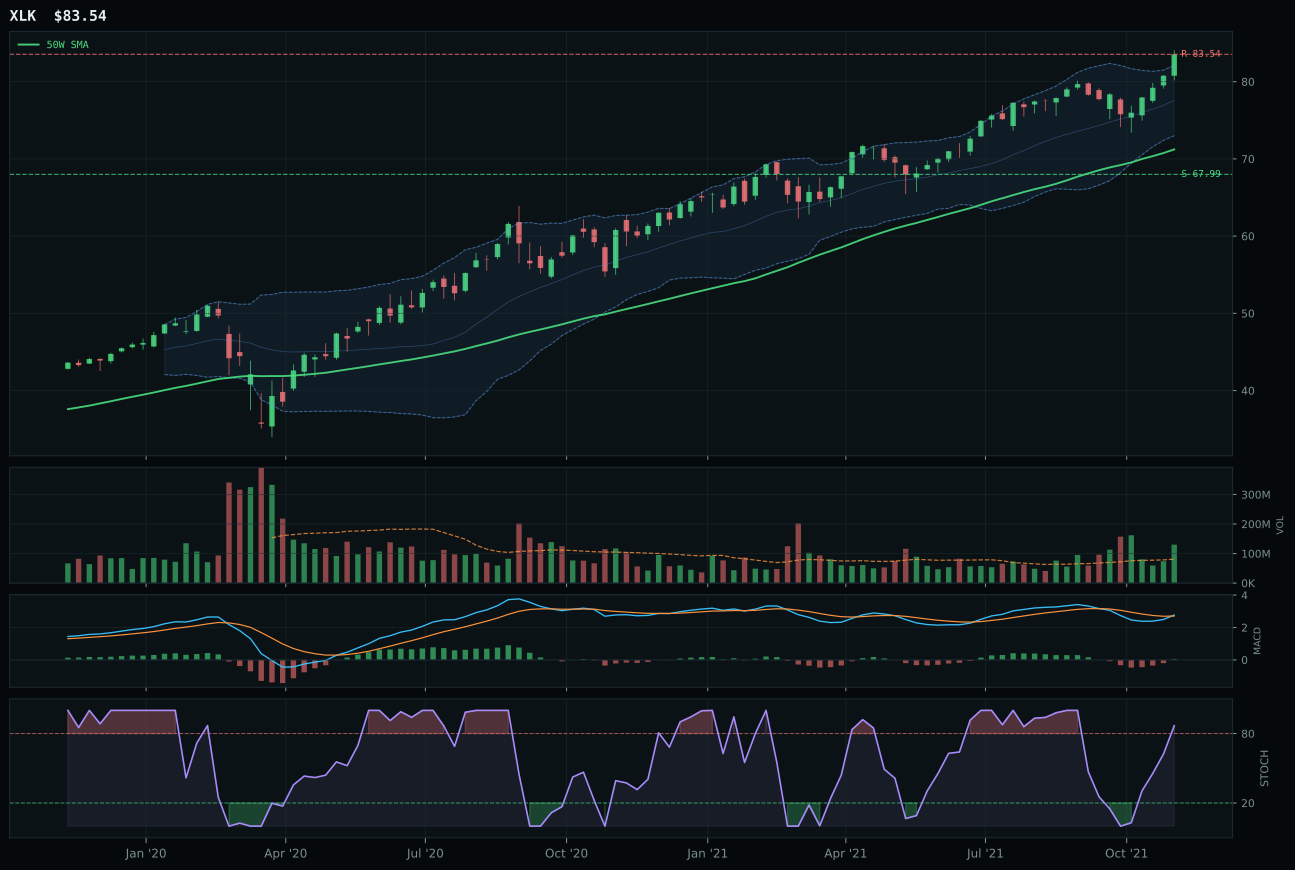
XLK has a vertical extension profile with 2.0% 13-week relative strength versus SPY.
A failed hold above support would weaken the setup.
Actionable but governed by invalidation levels.
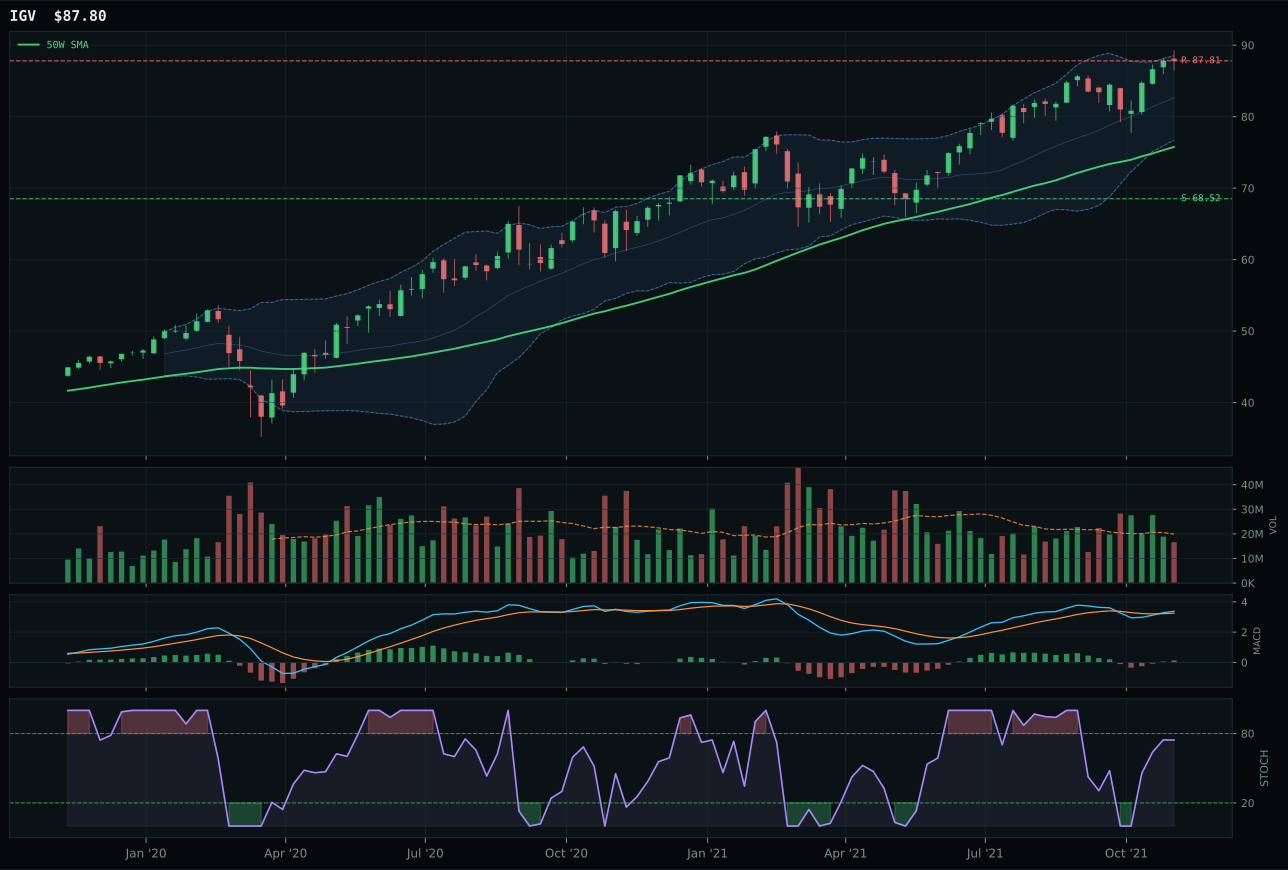
IGV has a vertical extension profile with 1.3% 13-week relative strength versus SPY.
A failed hold above support would weaken the setup.
Actionable but governed by invalidation levels.
CIBR wins the category on relative strength inside the basket: its 4.8% RS versus the category median edges XLK's 0.0%, a decisive gap when both charts show similar vertical extensions and overbought stochastic signals. While XLK posted stronger absolute momentum (7.9% over 13W versus 12.7% for CIBR), XLK's 2.0% SPY-relative return trails CIBR's 6.8%, meaning cybersecurity specialists are attracting incremental capital flows where broad tech leadership is not. Both setups are extended 18–19% above the 50W with neutral volume, but CIBR's structure score of 77.1 edges XLK's 75.0, reflecting tighter compression and cleaner price action into resistance. The timing penalty is symmetric—both sit in the overbought/extension zone—but CIBR's leadership within its peer set justifies the selection.
Technology receives 5% allocation as a tier-2 category, reflecting its mid-portfolio rank this week amid a mixed macro regime. The category's 54.0/100 macro fit lags the energy and nuclear leaders, hamstrung by active credit stress (-7) and inflation pressure (-4) that offset positive risk appetite (+9) and AI sponsorship signals (+6). CIBR's technical evidence score of 74.7/100 is solid but not exceptional; the setup remains extended, and volume is neutral rather than accumulative. What keeps Technology in the allocation at all is its absolute trend strength (100/100 across the representative) and the clear relative-strength win over XLK—discipline demands honoring the basket's leadership signal even when entry risk is elevated. For this category to graduate to top-2 status, macro conditions would need to shift sharply toward risk appetite and away from credit stress, or the representative would need to consolidate and confirm its extension with above-average volume participation.
Utilities & Infrastructure — PAVE
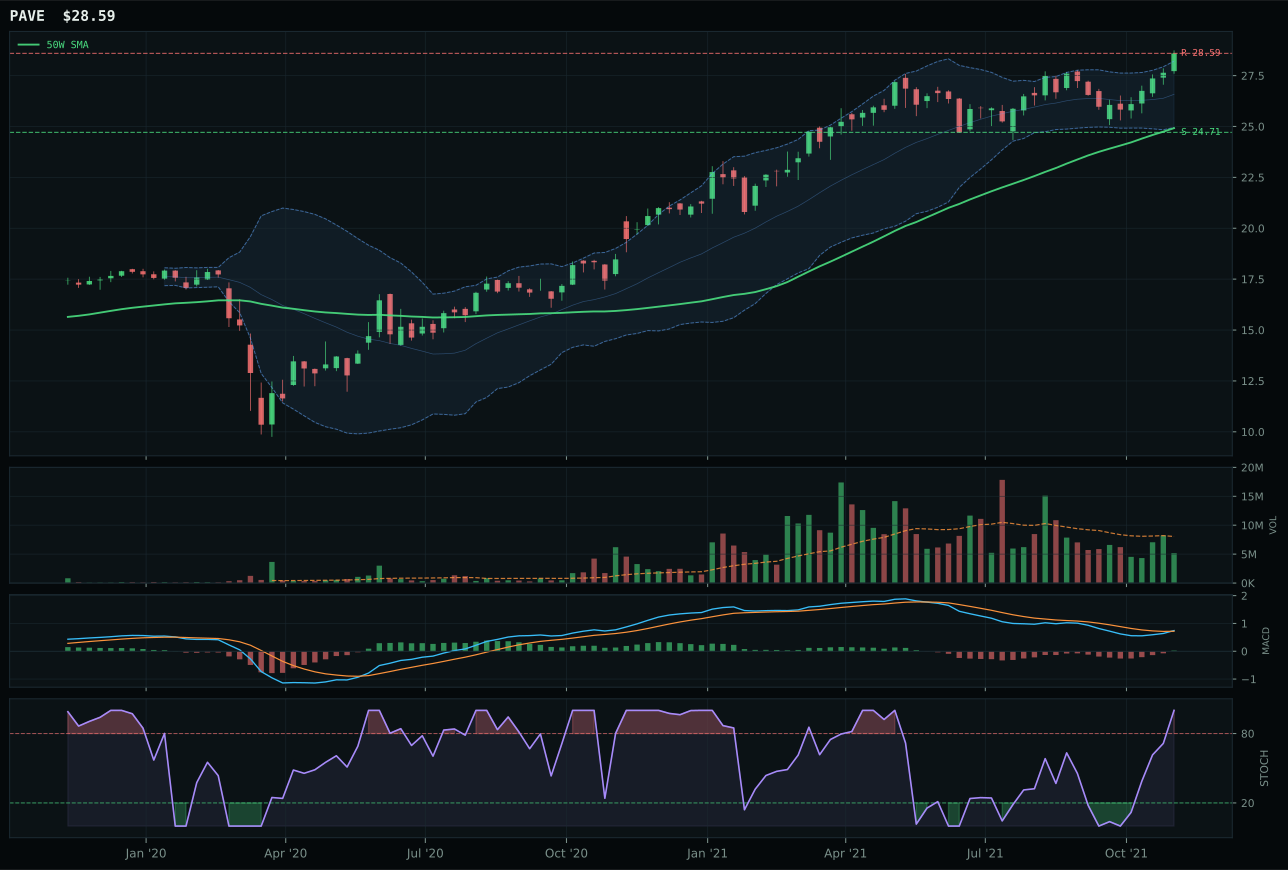
PAVE has a neutral structure profile with 1.9% 13-week relative strength versus SPY.
A failed hold above support would weaken the setup.
Actionable but governed by invalidation levels.
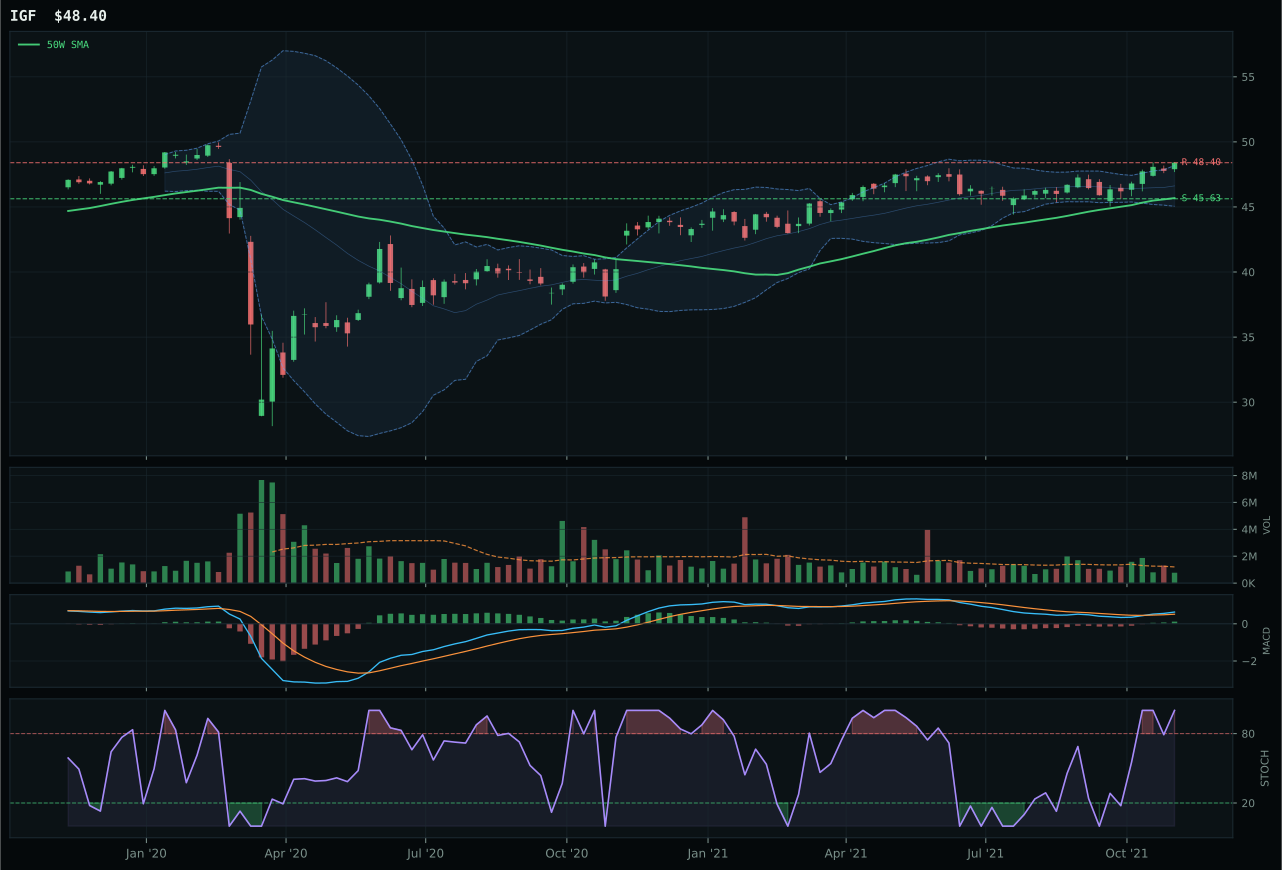
IGF has a neutral structure profile with -1.2% 13-week relative strength versus SPY.
A failed hold above support would weaken the setup.
Actionable but governed by invalidation levels.
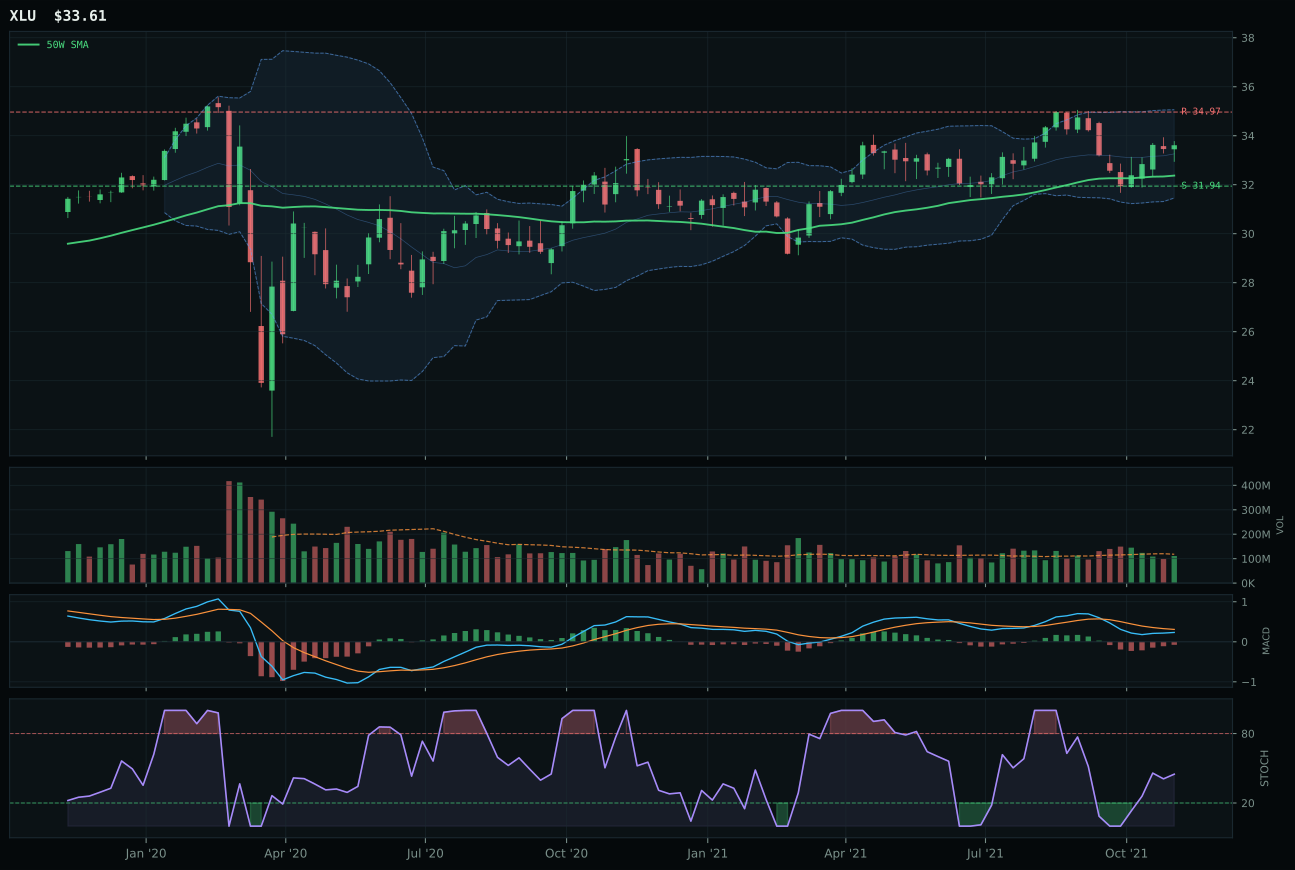
XLU has a neutral structure profile with -6.2% 13-week relative strength versus SPY.
A failed hold above support would weaken the setup.
Actionable but governed by invalidation levels.
PAVE wins Utilities & Infrastructure by a hair (55.4 versus IGF's 55.3 final score), a margin so narrow that the selection pivots on category-relative strength of 3.0% versus 0.0%. Both funds sit in neutral structures above their 50W, both show overbought stochastic RSI and improving MACD, and both trade at thin volume participation (0.64x average). PAVE's trend score is perfect at 100.0 versus IGF's 98.0, and its timing score is slightly better (59.0 versus 75.0), reflecting PAVE's positioning at 14.7% above the 50W versus IGF's near-52W high. The deciding factor is momentum confirmation: PAVE's 88.9/100 versus IGF's 65.0, driven by PAVE's 7.8% 13W return and 9.5% 4W return, which signal domestic infrastructure interest despite global headwinds.
Utilities & Infrastructure receives 5% allocation as tier-2, a modest slot reflecting a crowded middle tier where five categories compete for 5% each. The category's macro fit is weak at 46.0/100, pinched by inflation pressure being active at -6 (rate-sensitive exposure) and risk appetite at -2; Transition/Mixed regime offers a modest +4 benefit. PAVE's technical evidence is solid at 71.1/100, but timing remains challenged: the fund sits extended 14.7% above the 50W with only 1.9% SPY relative strength and thin volume confirmation. The allocation reflects infrastructure's role as a capex beneficiary in a Transition regime where supply-chain and energy-security spending may accelerate, but the entry is not favorable. To graduate to a higher tier, Utilities & Infrastructure would require either macro conditions that reward defensive infrastructure assets amid credit stress, or a volume-driven consolidation-and-reconfirmation that signals institutional conviction at current levels. Currently, the category is a structural hold—acceptable but uninspiring.
Precious Metals — GLD
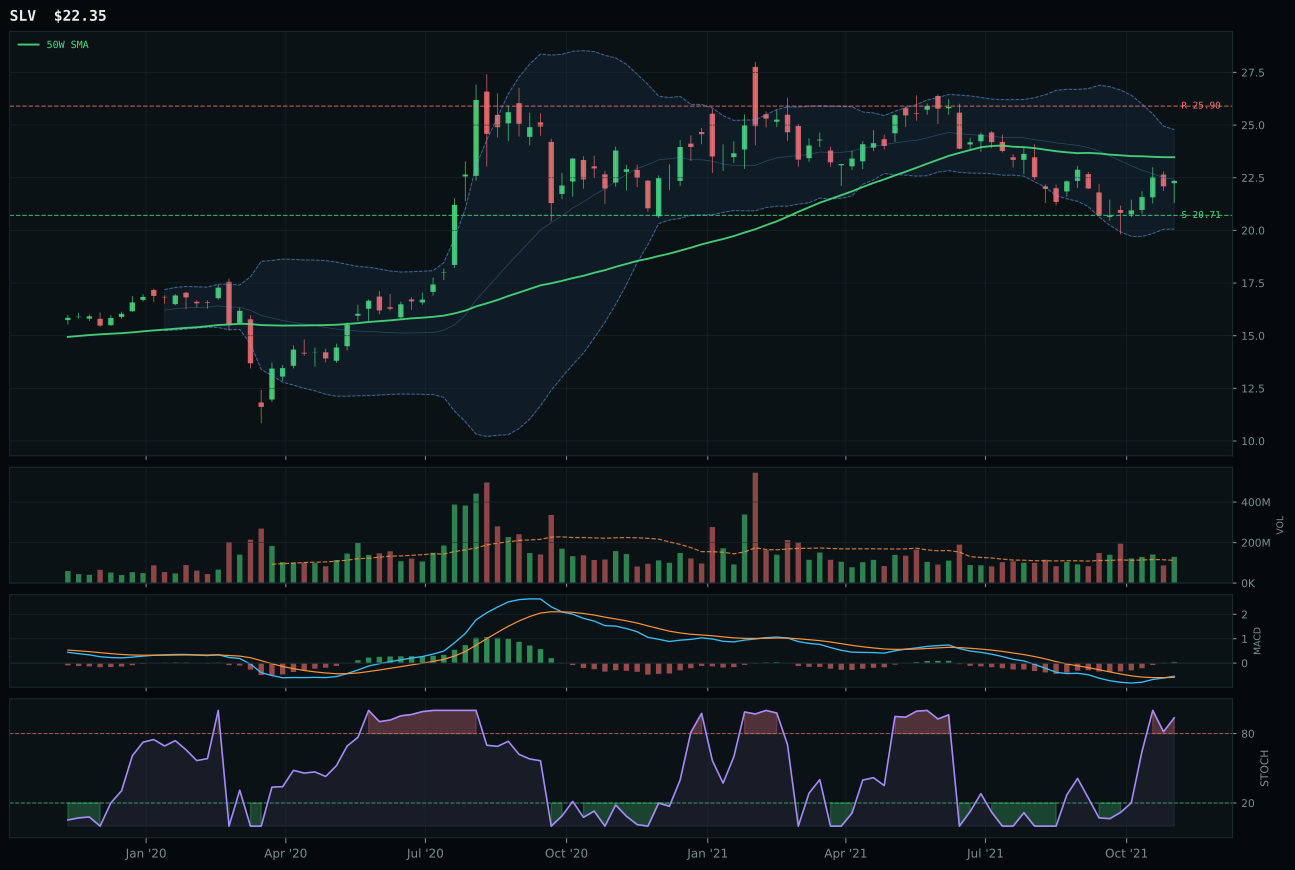
SLV has a neutral structure profile with -6.6% 13-week relative strength versus SPY.
A failed hold above support would weaken the setup.
Actionable but governed by invalidation levels.
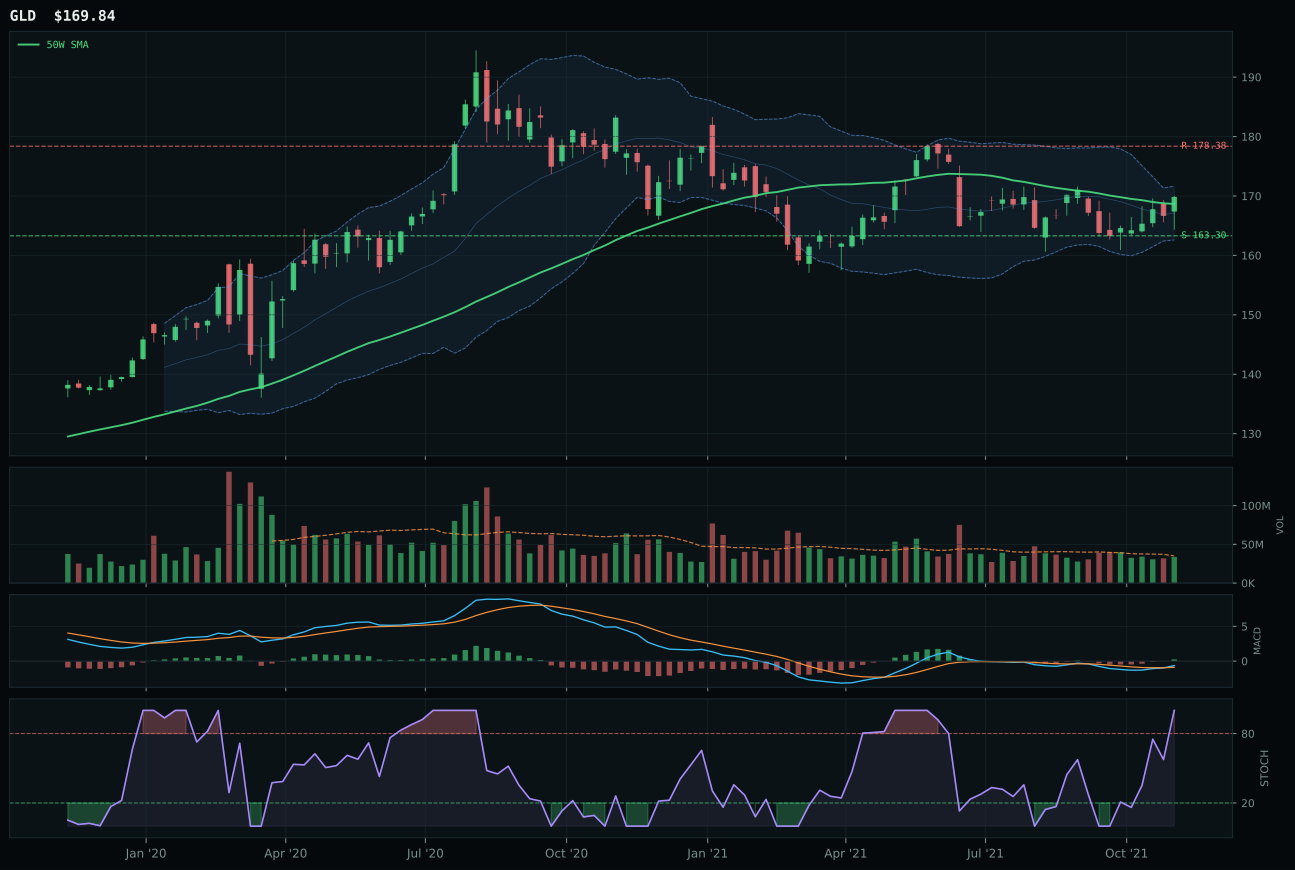
GLD has a pullback into support profile with -2.7% 13-week relative strength versus SPY.
A failed hold above support would weaken the setup.
Actionable but governed by invalidation levels.
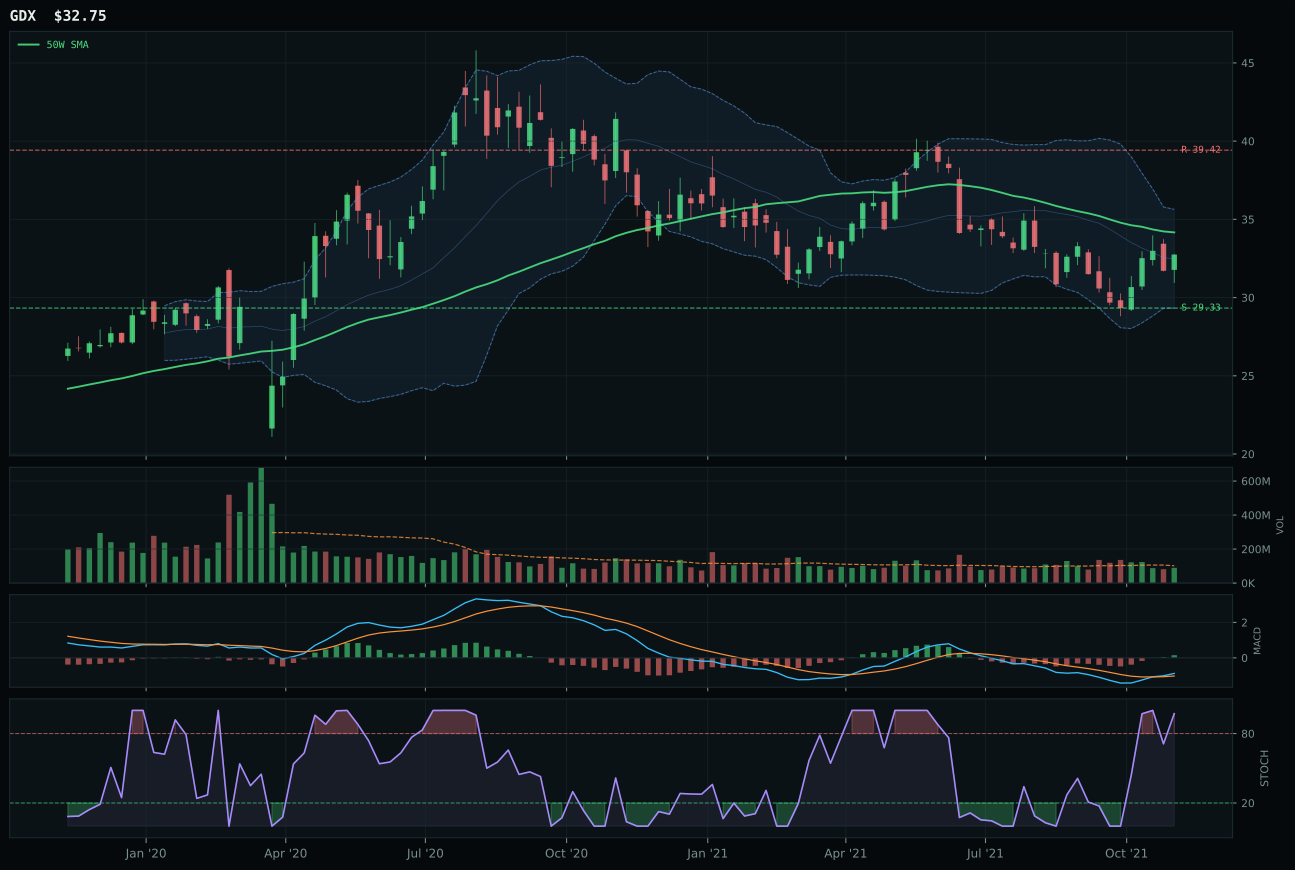
GDX has a neutral structure profile with -7.4% 13-week relative strength versus SPY.
A failed hold above support would weaken the setup.
Actionable but governed by invalidation levels.
GLD wins Precious Metals on timing superiority: at 0.7% from the 50W, the fund offers a textbook pullback-into-support setup with MACD bullish and improving and stochastic RSI overbought. This proximity to the moving average and the defined support level at 163.30 give GLD a superior risk/reward score of 74.5 versus SLV's 84.0—GLD's tighter range and cleaner entry eclipse SLV's larger absolute downside buffer. SLV's 13W return of -0.8% versus GLD's 3.2%, combined with GLD's 3.9% category-relative strength versus SLV's 0.0%, confirm that gold is outpacing silver in this cycle. Both sit in overbought momentum, but GLD's structure is cleaner (75.7 versus 75.6), and its position near the 50W offers better entry discipline than SLV's deeper retracement into the -6.6% SPY-relative zone.
Precious Metals receives 5% allocation as tier-2, a defensive hedge ranked below the commodity-scarcity winners (energy, nuclear, industrial metals). The category's macro fit is weak at 46.0/100, dragged down by risk appetite being active at -4—a headwind that makes gold less attractive in periods of equity optimism. GLD's technical evidence is strong at 85.0/100, but timing remains constrained; the fund sits in the decision zone at Fib 0.500, neither deeply oversold nor clearly extended, and volume is neutral throughout. The allocation reflects a modest rebalancing need rather than conviction; gold's correlation to inflation and real rates makes it valuable insurance against regime shift, but macro currently does not support aggressive positioning. To upgrade to tier-1, precious metals would need either a credit stress event to drive safe-haven demand or a sharp inflation acceleration that breaks gold above resistance at 178.38 with sustained above-average volume. For now, the 5% slot keeps dry powder for defensive rotation without overcommitting to a stalled setup.
Industrial Metals — REMX
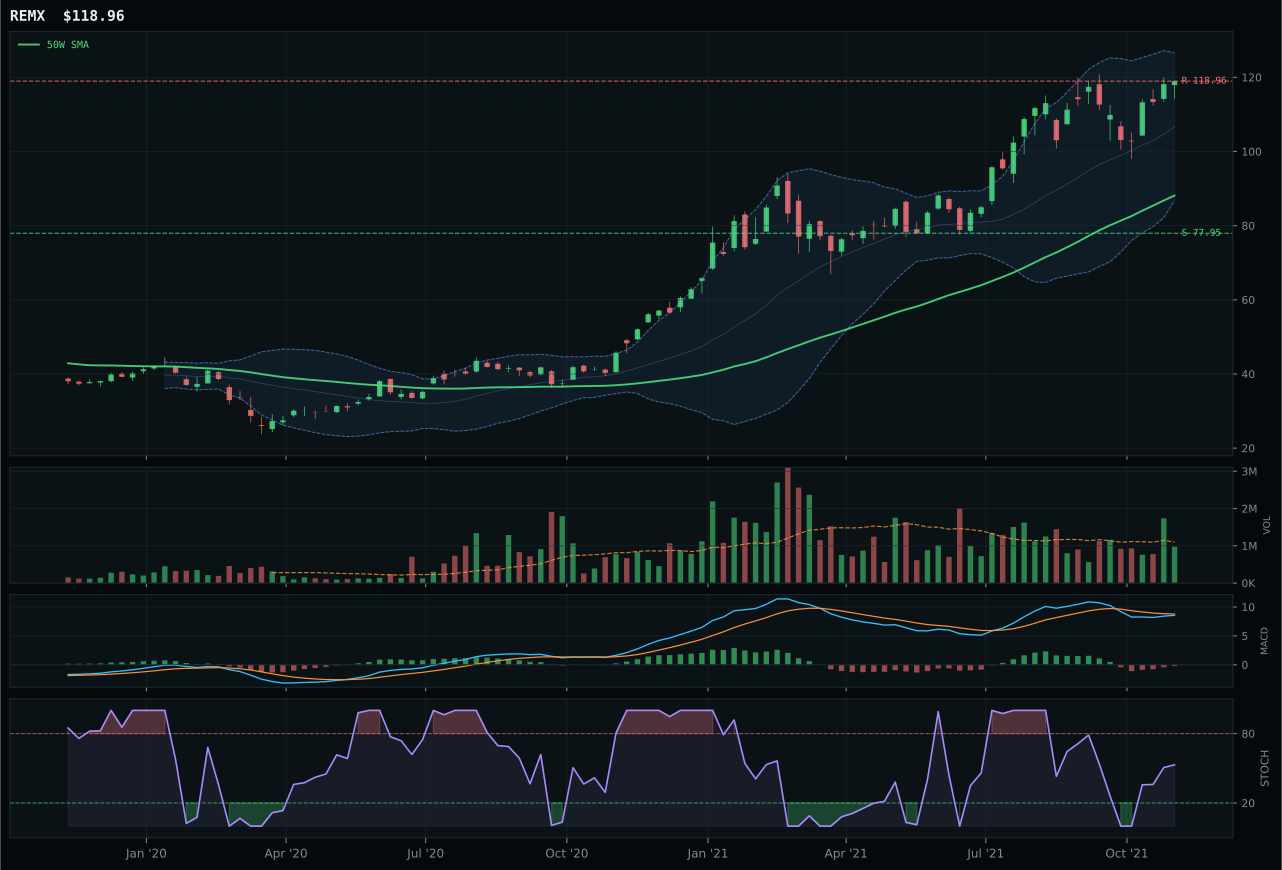
REMX has a vertical extension profile with 0.6% 13-week relative strength versus SPY.
A failed hold above support would weaken the setup.
Actionable but governed by invalidation levels.
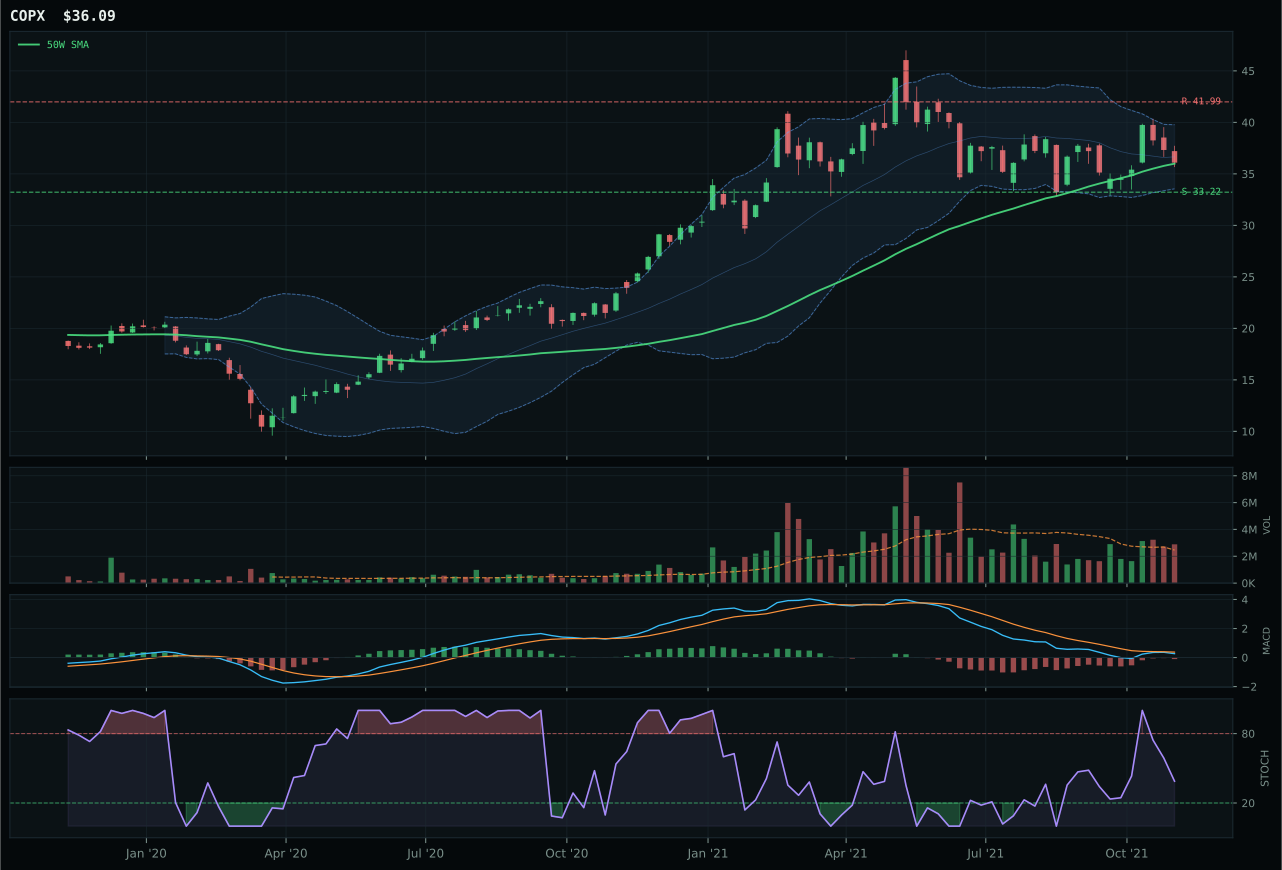
COPX has a compression near 50W profile with -8.9% 13-week relative strength versus SPY.
A failed hold above support would weaken the setup.
Actionable but governed by invalidation levels.
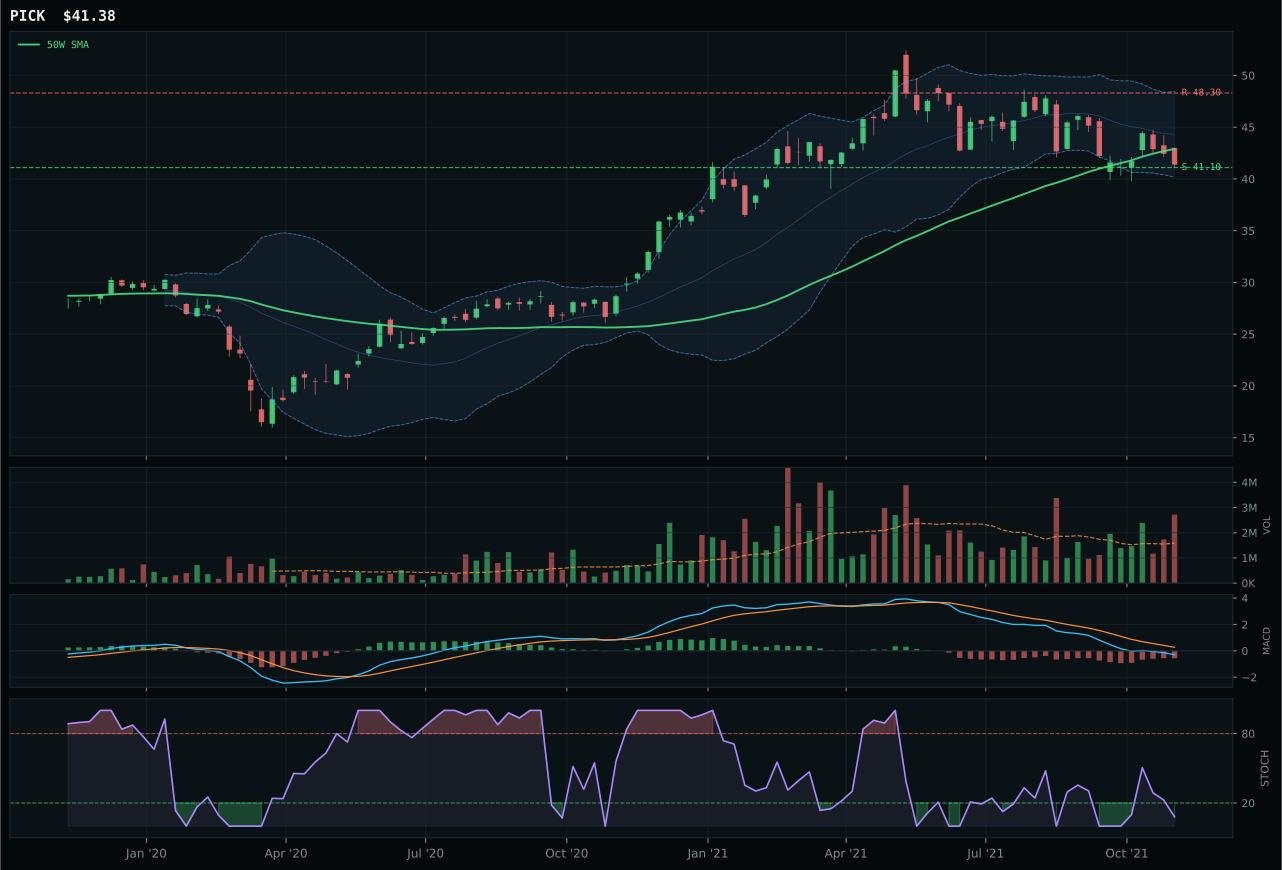
PICK has a pullback into support profile with -17.2% 13-week relative strength versus SPY.
A failed hold above support would weaken the setup.
Actionable but governed by invalidation levels.
REMX wins Industrial Metals despite a score that significantly lags runner-up COPX (53.1 versus 71.7 composite), a result driven by category-relative strength dominance rather than absolute technical superiority. REMX's 9.6% RS within the basket towers over COPX's 0.0%, signaling that rare-earth scarcity is attracting incremental capital where copper does not. REMX's 13W return of 6.5% is modest, and its extension at 35.0% above the 50W is punishing for entry risk, yet the 4W momentum of 15.8% and bullish MACD improvement justify the selection. COPX offers tighter timing (at compression near the 50W) and superior structure (68.2), but its falling stochastic RSI and flat -3.1% 13W return expose dead money. The 18.6-point gap between COPX's composite score and REMX's rank reversal underscores the model's emphasis on peer leadership over absolute score magnitude.
Industrial Metals receives 5% allocation as tier-2, benefiting from exceptional macro fit at 73.0/100 but held back by weak technical entry. Metals scarcity is active at +14, commodity breadth at +10, and real asset sponsorship at +6, creating a powerful tailwind for supply-constrained themes. Yet REMX's technical evidence is only 63.0/100, and its risk/reward score of 39.7 reflects the brutal downside-to-support ratio of 52.6% against zero upside to resistance—the fund is extended and precarious. The 50% overlay halves the 10% tier-2 slot to 5%, making Industrial Metals a smaller conviction play than either Energy or Nuclear. To justify a top-2 upgrade, the category would need REMX to consolidate and reconfirm its 35% extension with above-average volume, signaling institutional accumulation rather than retail chase. Currently, the macro thesis is stronger than the technical setup warrants, making Industrial Metals a tactical hold pending better entry structure.
Defense & Aerospace — XAR
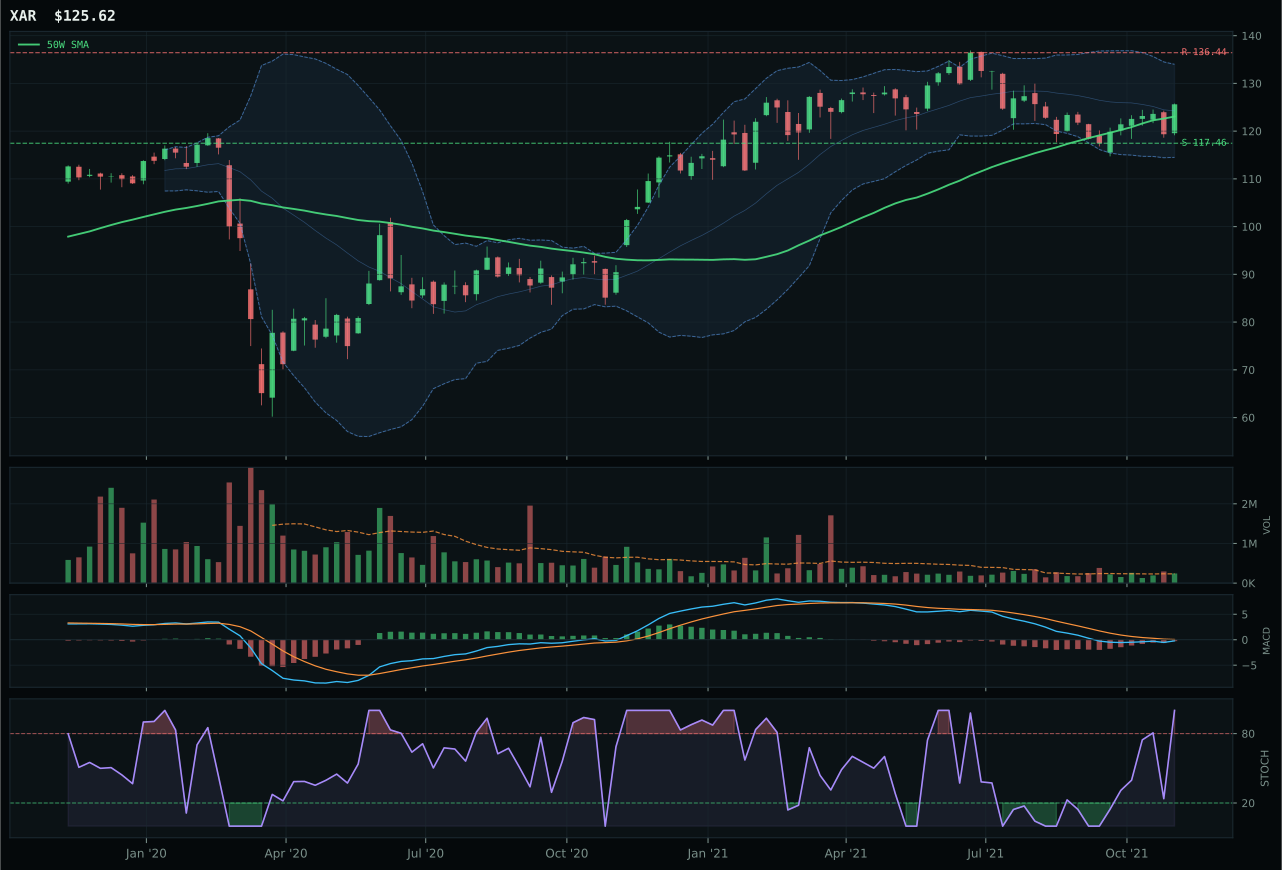
XAR has a compression near 50W profile with -5.9% 13-week relative strength versus SPY.
A failed hold above support would weaken the setup.
Actionable but governed by invalidation levels.
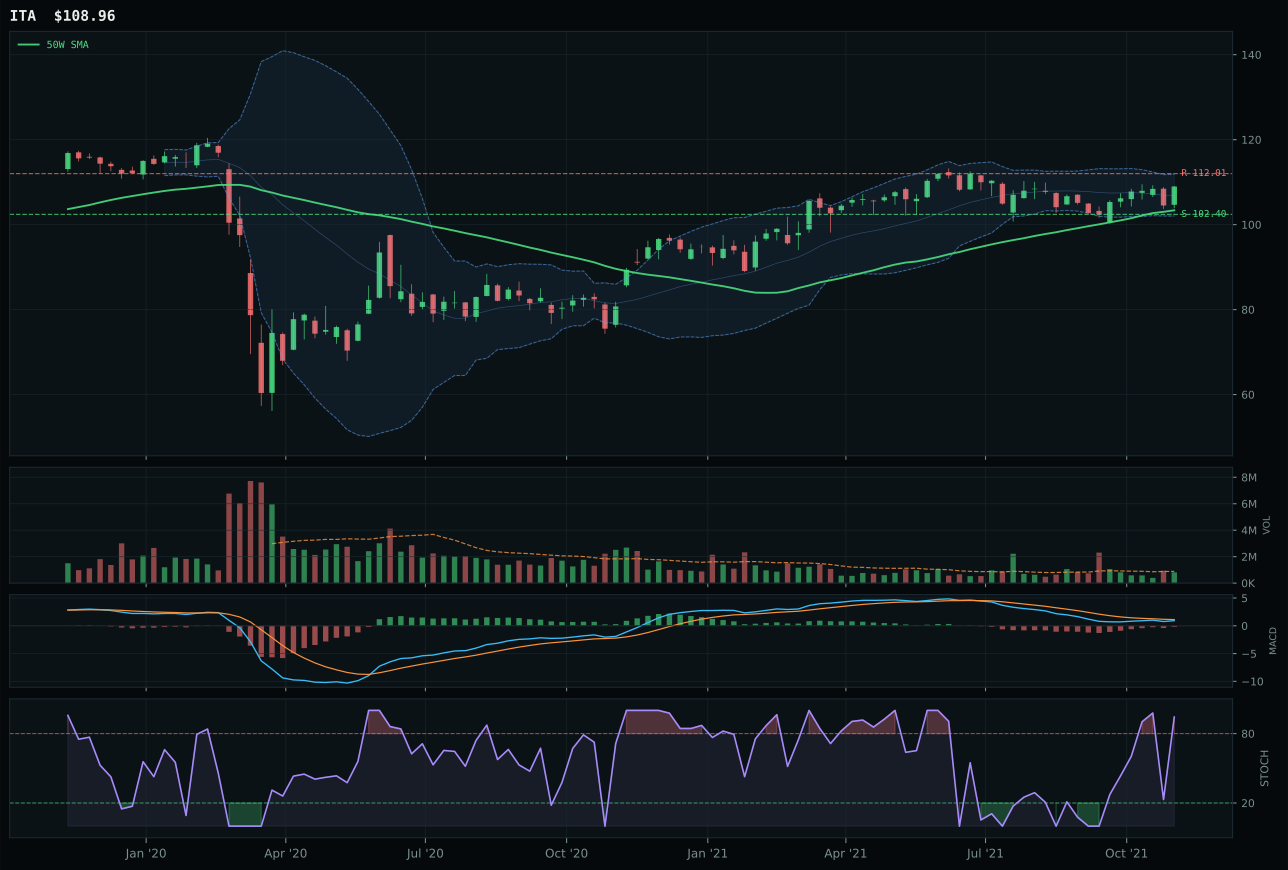
ITA has a neutral structure profile with -5.4% 13-week relative strength versus SPY.
A failed hold above support would weaken the setup.
Actionable but governed by invalidation levels.
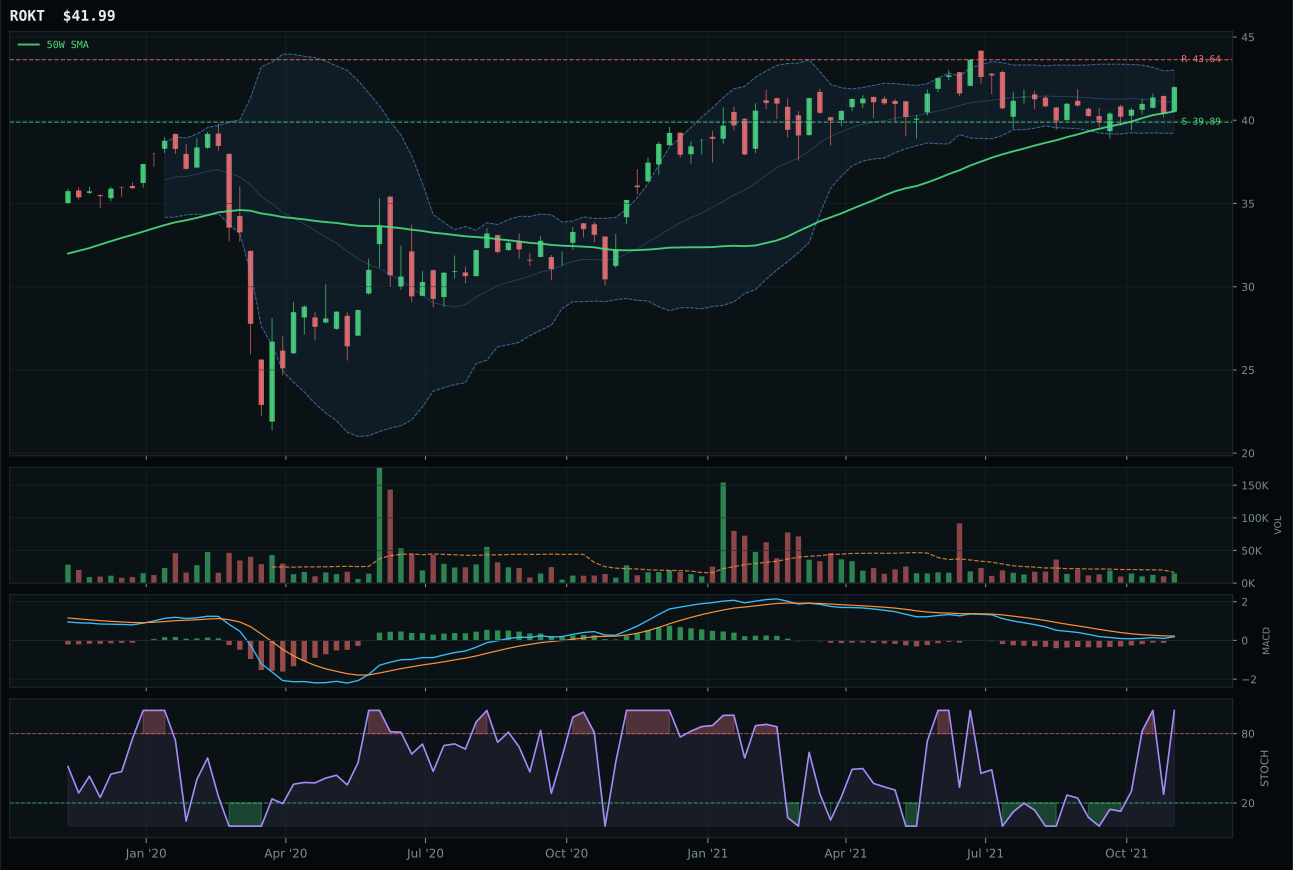
ROKT has a neutral structure profile with -4.1% 13-week relative strength versus SPY.
A failed hold above support would weaken the setup.
Tracked, but not top-2 eligible because: .
XAR wins a weak category on timing precision: at just 2.1% above the 50W with compression near support, XAR offers a defined coil setup where MACD is bearish but improving and stochastic RSI is overbought—a textbook mean-reversion trigger. ITA, the runner-up, sits at similar price levels but its neutral structure lacks the compression advantage, and its timing score of 75.0 trails XAR's perfect 100.0 on the near-term positioning metric. Risk/reward also favors XAR at 65.5 versus 52.6, reflecting ITA's tighter margin between support and resistance. Both names show minimal SPY relative strength (around -5.4% to -5.9%), and neither momentum confirmation nor MACD provides bullish sponsorship—the category is correcting, not advancing. XAR's narrow win reflects a choice between two defensive holds rather than a strong accumulation signal.
Defense & Aerospace earns 5% allocation as tier-2, ranked well below the energy and nuclear leaders despite its 49.8 final score. Macro fit is neutral at 50.0/100, with no category-specific descriptors driving conviction; the Transition/Mixed regime offers a modest +3 bump, but credit stress at +2 barely offsets the headwind. XAR's technical evidence is modest at 62.5/100, and the representative shows weak momentum confirmation (45.6/100) with a flat 13W return (-0.0%) and negative SPY relative strength (-5.9%). The category survives in the allocation only because its MACD is improving and price is holding the 50W—a defensive anchor rather than an offensive play. To earn tier-1 status, this category would require either a decisive macro shift toward defense spending and de-risking, or a breakout above resistance with sustained volume accumulation. Currently, Defense & Aerospace is a placeholder for risk management, not a growth or scarcity bet.
Agriculture & Livestock — MOO
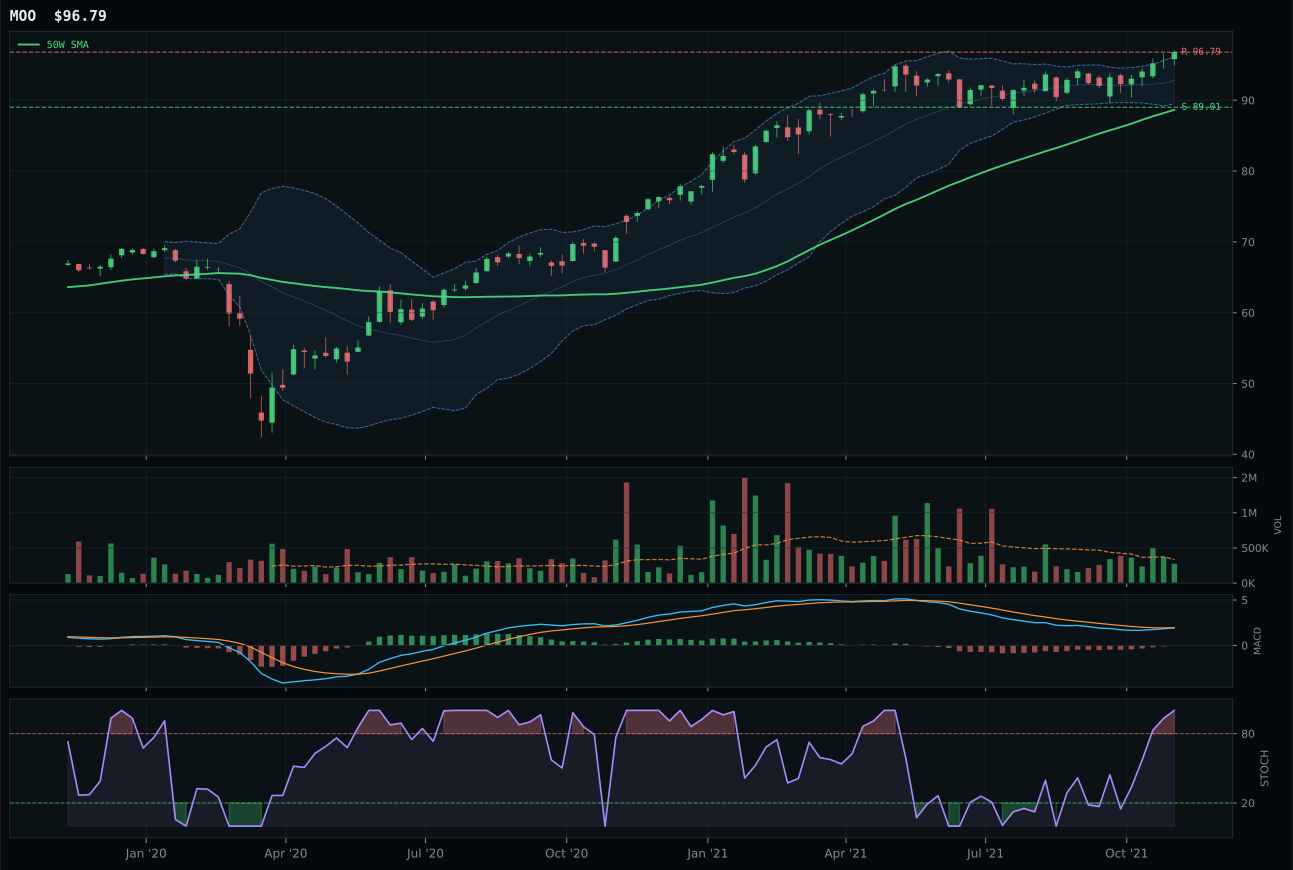
MOO has a neutral structure profile with -0.2% 13-week relative strength versus SPY.
A failed hold above support would weaken the setup.
Actionable but governed by invalidation levels.
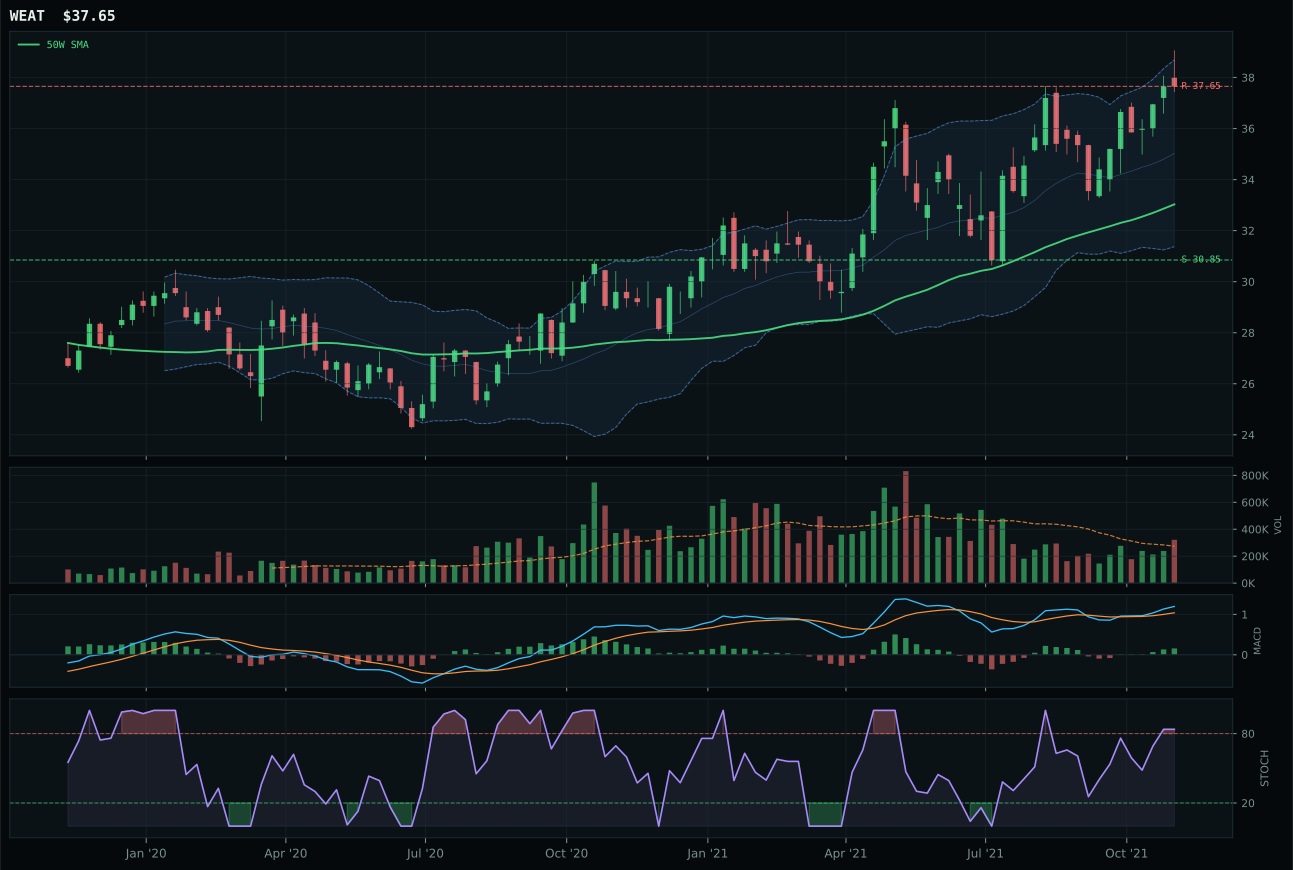
WEAT has a neutral structure profile with -0.3% 13-week relative strength versus SPY.
A failed hold above support would weaken the setup.
Tracked, but not top-2 eligible because: .
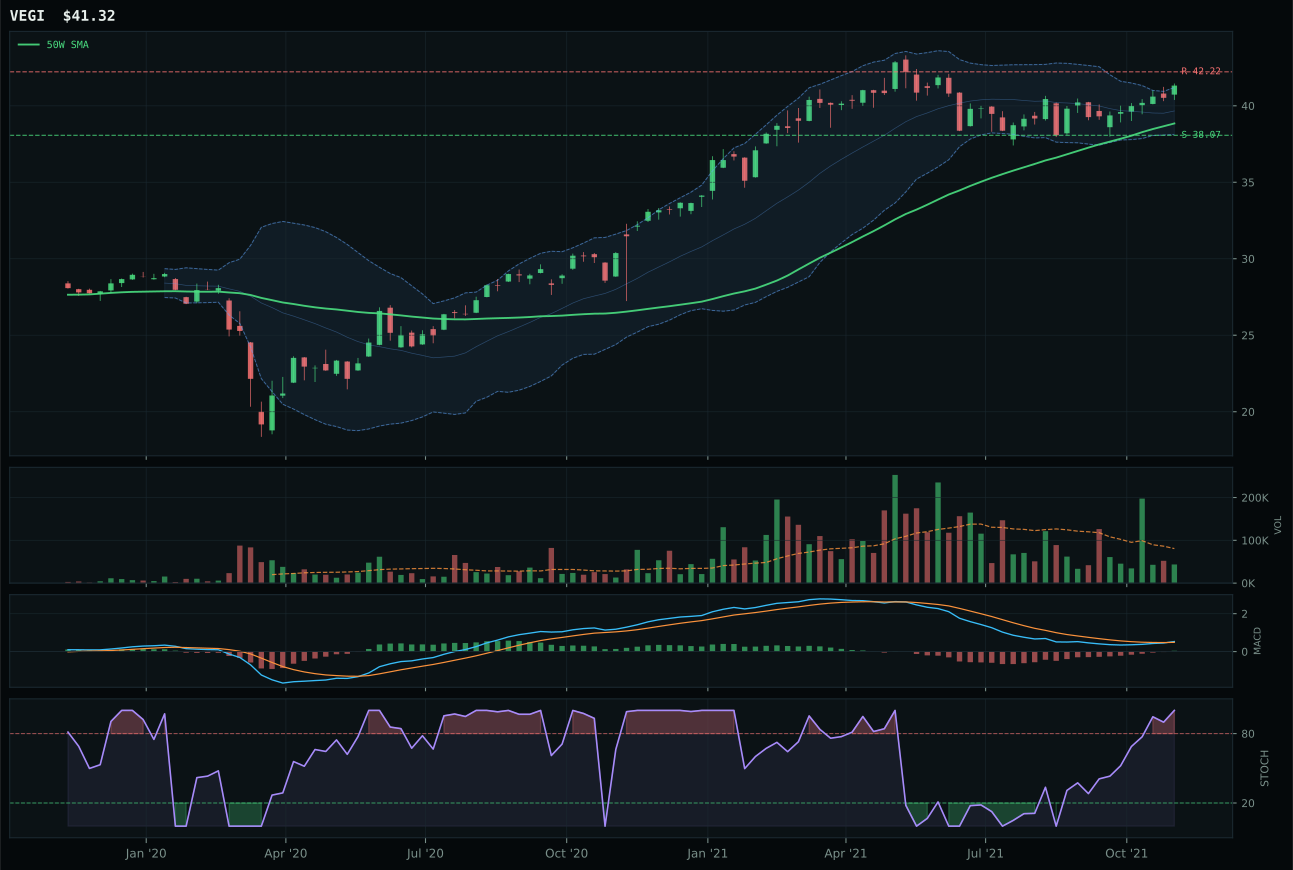
VEGI has a neutral structure profile with -0.4% 13-week relative strength versus SPY.
A failed hold above support would weaken the setup.
Tracked, but not top-2 eligible because: .
MOO wins Agriculture on absolute trend strength (99.8/100) despite the category's exclusion from portfolio allocation. The fund sits above both moving averages with a clean 50W slope of 0.5%, compressing in a neutral structure near the 50W, and stochastic RSI is overbought at 1.00 with MACD bullish and improving. Its 5.7% 13W return and 0.1% category-relative edge over WEAT establish leadership, though that leadership is thin—MOO's RS versus SPY is actually flat at -0.2%, meaning agricultural equities have not participated in the broader rally. WEAT and VEGI both offer similar setups and similar weakness, making this a category where the best name is merely the least bad. Volume across the three ETFs is neutral to thin, and the near-52W high positioning leaves no margin for entry error.
Agriculture & Livestock earns 0% allocation this week, ranked 9th or 10th and excluded entirely from the portfolio despite a category-level macro fit score of 86.0/100—the highest in the allocation. Supply shortage is active at +13 and inflation pressure at +10, creating powerful narrative support for real assets and commodity breadth. Yet the technical evidence lags: MOO's 78.0/100 is respectable but not exceptional, and the representative shows weak momentum confirmation (74.3/100) with thin volume participation (0.82x average). The final category score of 48.9 reflects the tension between compelling macro fundamentals and uninspiring technicals; every ETF in the basket shows near-overbought momentum and near-term extension without confirmed breakout volume. To earn allocation, this category needs either a consolidation-and-reconfirmation pattern or a volume surge that signals fresh accumulation rather than trapped-longs exhaustion. The macro case is strong, but entry timing is poor.
Emerging Markets — INDA
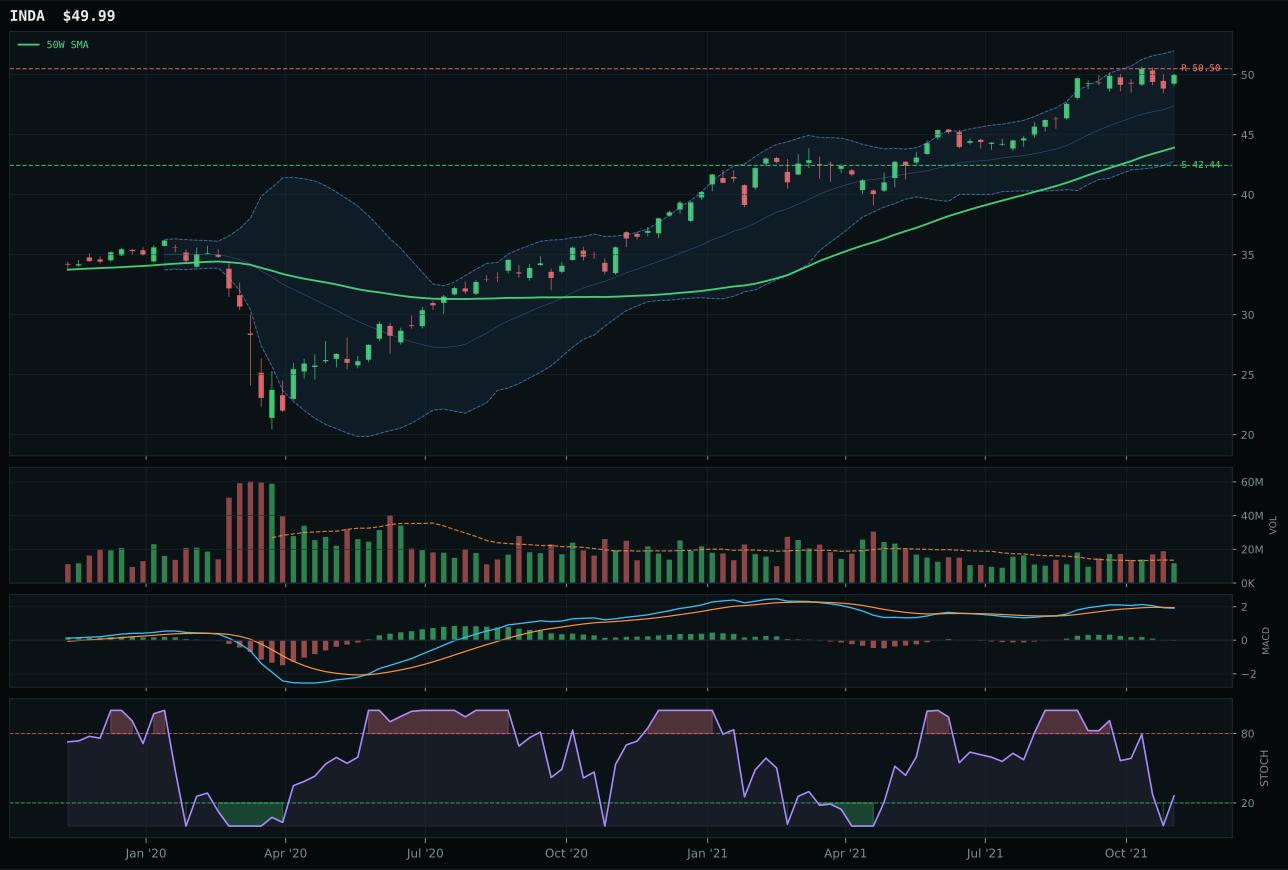
INDA has a neutral structure profile with 3.6% 13-week relative strength versus SPY.
A failed hold above support would weaken the setup.
Actionable but governed by invalidation levels.
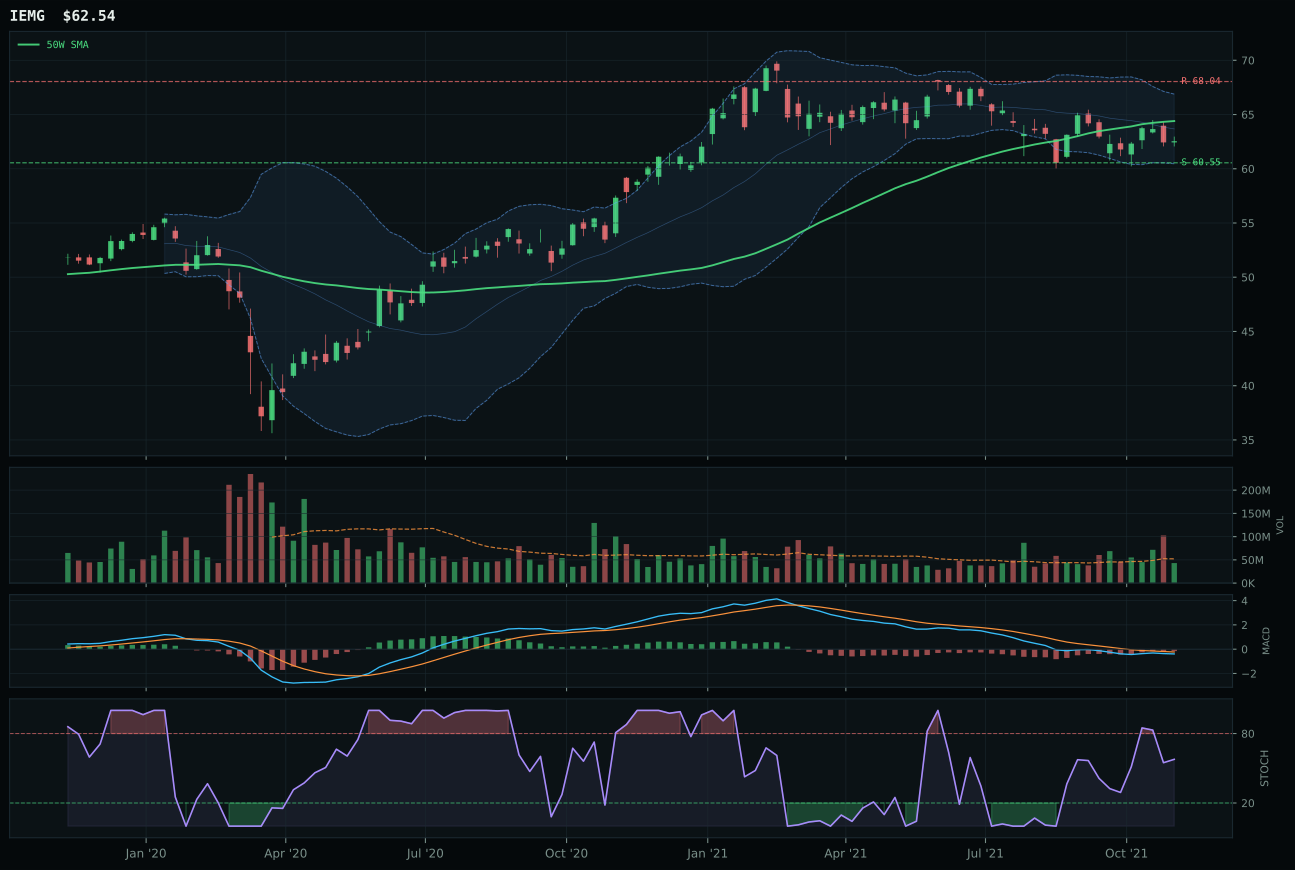
IEMG has a pullback into support profile with -7.5% 13-week relative strength versus SPY.
A failed hold above support would weaken the setup.
Actionable but governed by invalidation levels.
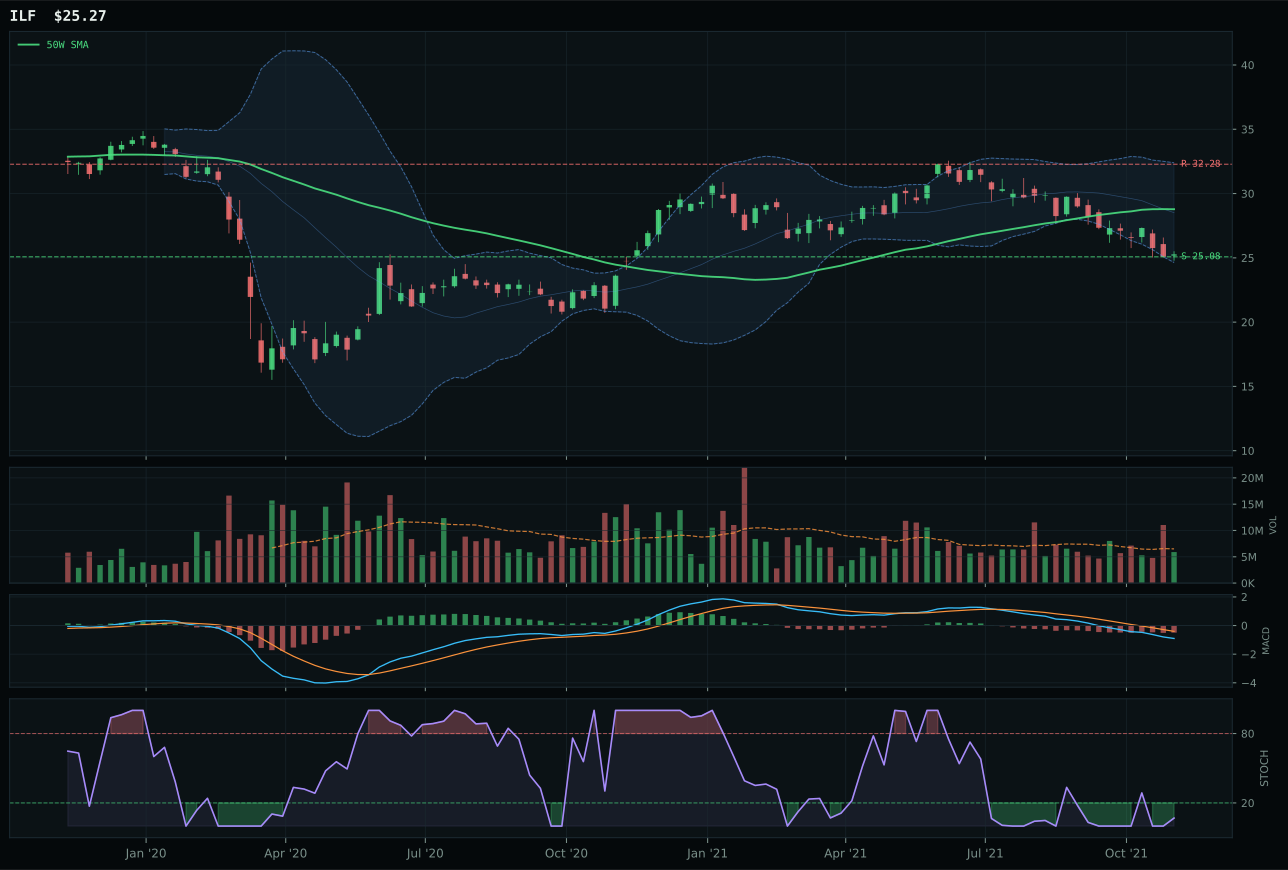
ILF has a pullback into support profile with -21.2% 13-week relative strength versus SPY.
Extension and support failure are the main tactical risks.
Tracked, but not top-2 eligible because: structurally broken.
INDA wins Emerging Markets on category-relative strength (11.0% versus 0.0% for IEMG) despite a narrow technical edge and outright weakness versus equities. INDA's 9.5% 13W return and 3.6% SPY relative strength are modest, but they represent leadership within a category where broad EM beta (IEMG) is actually negative at -7.5% SPY-relative. INDA's structure is cleaner (78.2 versus 70.2), and its timing score is stronger (62.0 versus IEMG's 100.0, which appears paradoxical until noting that IEMG's near-52W high positioning is less favorable than INDA's 13.8% retracement). Both MACD are bearish or weakening, both stochastic RSI are falling/neutral, and both volume profiles are thin—this is a category where every ETF is correcting. INDA's modest relative strength edge reflects India's relative shelter from EM stress, but that shelter is not strong enough to generate conviction.
Emerging Markets receives 0% allocation, ranked 9th or 10th and entirely excluded despite INDA's tight win over IEMG. The category's macro fit is respectable at 62.0/100, driven by EM liquidity support at +14 and risk appetite at +8, yet credit stress at -10 creates a headwind that overwhelms fundamental support. INDA's technical evidence is weak at 56.1/100, with momentum confirmation at only 69.8/100 and risk/reward at 38.0/100—the fund lacks conviction on either technical or macro grounds. The final score of 42.6 places the category decisively outside the portfolio allocation. To earn a tier-2 slot (5%), Emerging Markets would need both a deterioration in credit conditions that drives EM risk premiums wider (paradoxically) and a technical setup that shows clear accumulation rather than distribution—currently, neither INDA nor IEMG displays above-average volume participation or bullish momentum confirmation. The category sits on a watch list; any sustained move below the 50W with increased volume distribution would extend the exclusion, while a consolidation near support with improving MACD and rising stochastic RSI could eventually earn a reallocation slot.