
2021-10-29
Informational purposes only. The content in this report, including allocations, analysis, and commentary, is provided solely for informational and educational purposes. It does not constitute financial advice, investment advice, trading advice, or any other type of advice. Past performance does not guarantee future results. Always conduct your own research and consult a qualified financial professional before making investment decisions.
Weekly Allocation
| Ticker | Category | Weight | Role |
|---|---|---|---|
| FSOL | 50% | Overlay | |
| XLE | Traditional Energy | 10% | Top-2 (10%) |
| URNM | Nuclear Energy | 10% | Top-2 (10%) |
| COPX | Industrial Metals | 5% | Tier-2 (5%) |
| PAVE | Utilities & Infrastructure | 5% | Tier-2 (5%) |
| CIBR | Technology | 5% | Tier-2 (5%) |
| MOO | Agriculture & Livestock | 5% | Tier-2 (5%) |
| GLD | Precious Metals | 5% | Tier-2 (5%) |
| ITA | Defense & Aerospace | 5% | Tier-2 (5%) |
Trade Instructions — Monday Open
Sell the tranche from 2021-10-01 (completing its 4-week hold). Buy the new tranche. Instructions show net portfolio changes — same-asset positions cancel, weight changes show the delta.
| Action | Ticker | Instruction |
|---|---|---|
| SELL | FCG | Sell 50% of FCG position (reduce 5.00% → 2.50%) |
| SELL | WEAT | Sell 25% of WEAT position (reduce 5.00% → 3.75%) |
| SELL | INDA | Sell 50% of INDA position (reduce 2.50% → 1.25%) |
| SELL | XLK | Sell entire XLK position (1.25% of portfolio) |
| SELL | SMH | Sell 50% of SMH position (reduce 2.50% → 1.25%) |
| BUY | CIBR | Buy CIBR — 16.67% of freed cash (adds 1.25% to portfolio) |
| BUY | XLE | Buy XLE — 33.33% of freed cash (adds 2.50% to portfolio) |
| BUY | PAVE | Buy PAVE — 16.67% of freed cash (adds 1.25% to portfolio) |
| BUY | MOO | Buy MOO — 16.67% of freed cash (adds 1.25% to portfolio) |
| BUY | GLD | Buy GLD — 16.67% of freed cash (adds 1.25% to portfolio) |
Current Portfolio After Trade
Combined holdings across all 4 active tranches. Each tranche is 25% of the portfolio.
| Ticker | % of Portfolio | Weight Bar |
|---|---|---|
| FSOL | 50.00% | |
| XLE | 7.50% | |
| URNM | 6.25% | |
| COPX | 6.25% | |
| CIBR | 5.00% | |
| WEAT | 3.75% | |
| ITA | 3.75% | |
| FCG | 2.50% | |
| IGF | 2.50% | |
| PAVE | 2.50% | |
| MOO | 2.50% | |
| INDA | 1.25% | |
| SMH | 1.25% | |
| GDX | 1.25% | |
| URA | 1.25% | |
| SLV | 1.25% | |
| GLD | 1.25% |
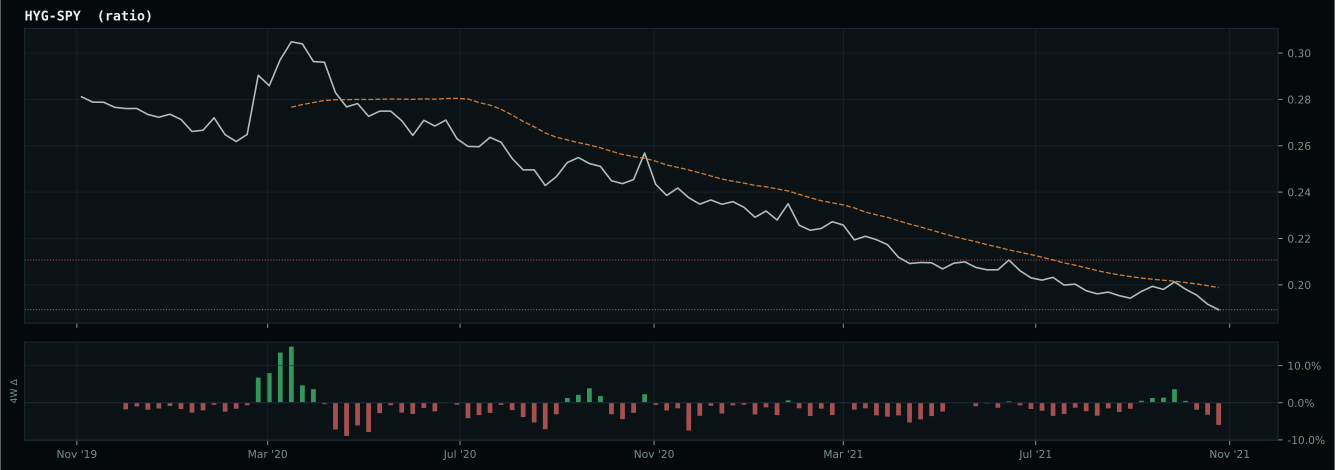
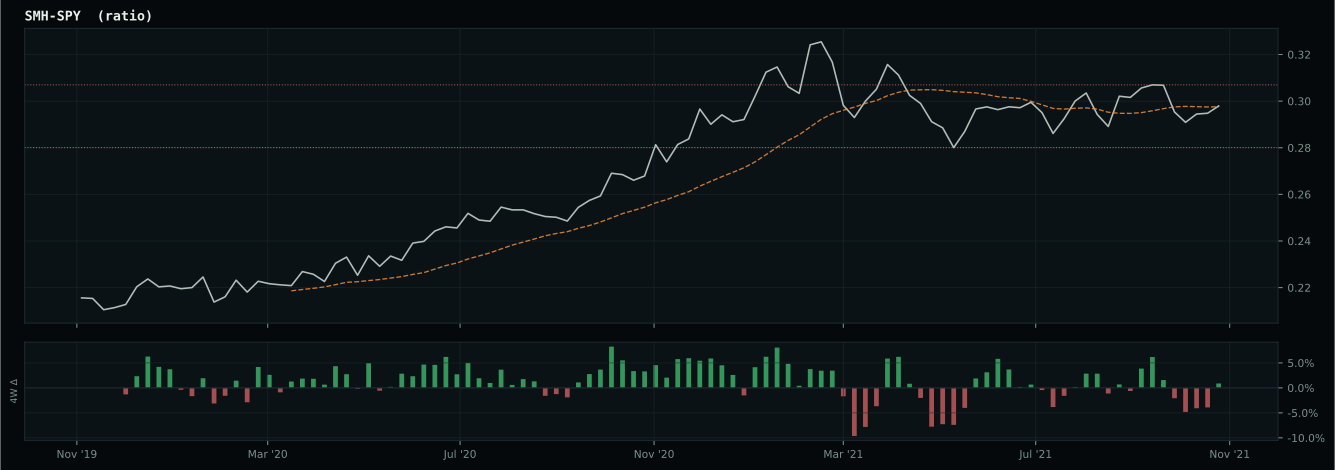
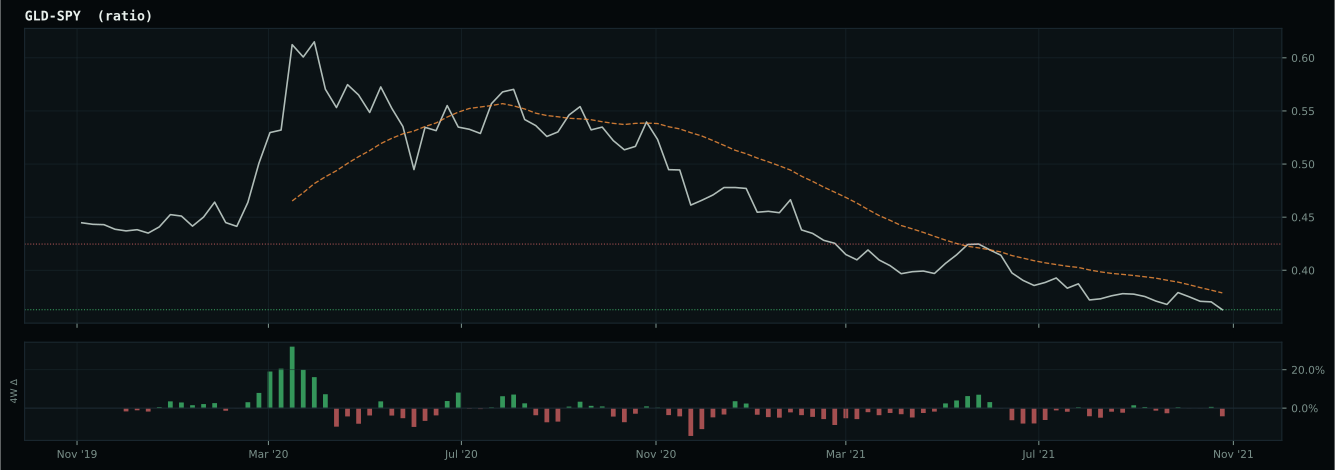
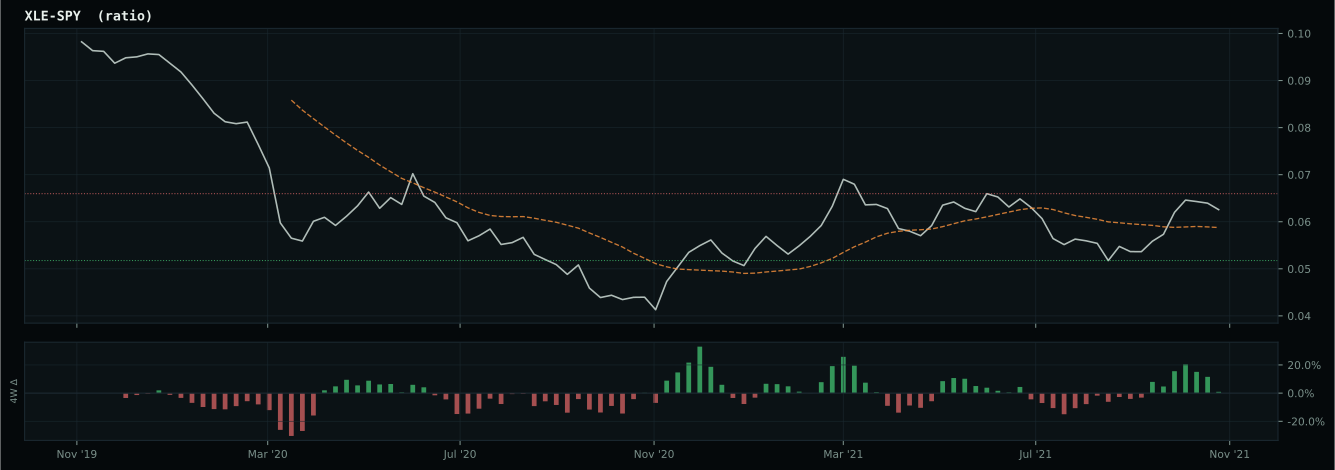
Macro Regime — Transition / Mixed
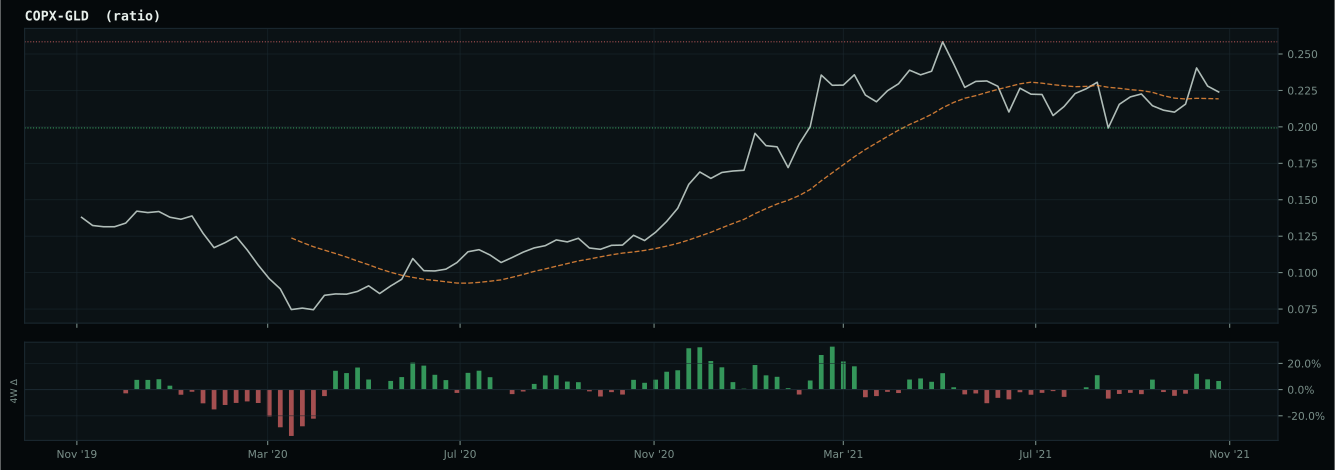
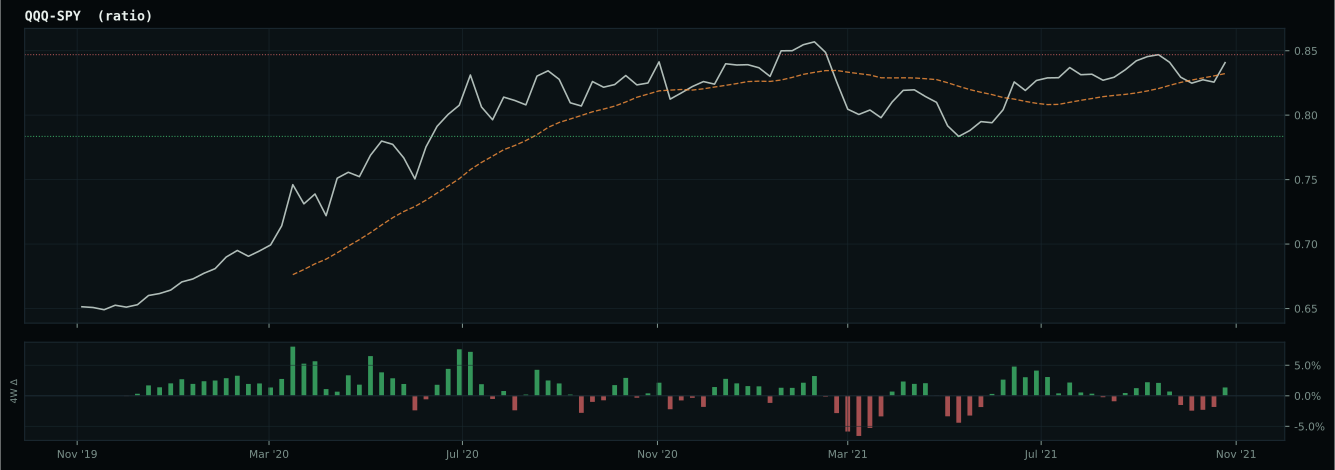
Macro Evidence Charts
Market-implied signals behind the macro regime scores. Each ratio compares two assets; the direction and slope of the ratio is what the macro engine reads.
Crypto Regime — AltSeason
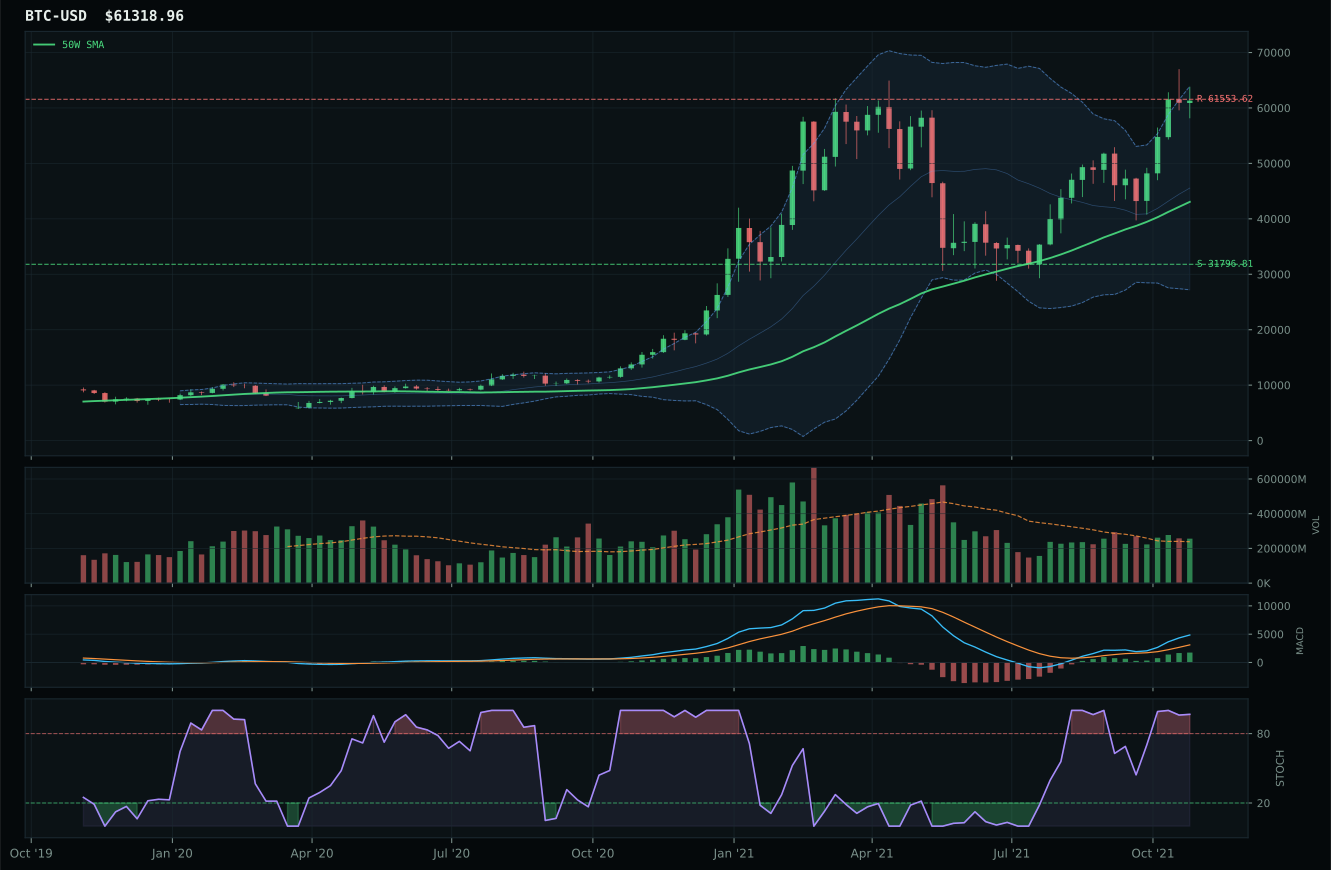
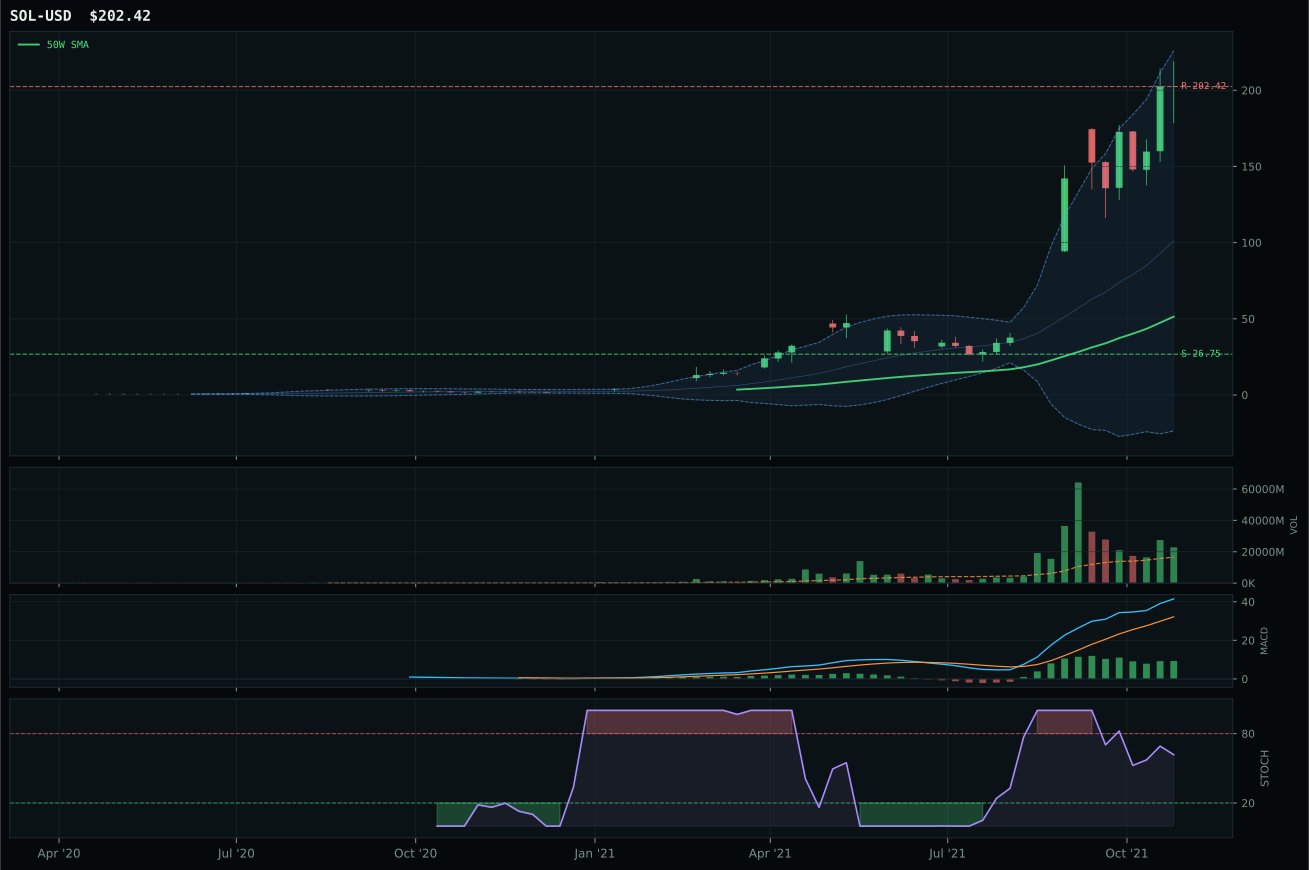
ValueBTC not armed: BTC has not made the first post-breakdown touch of the 200W buy zone after losing the 50W
TrendBTC confirmed: 2 consecutive closes above rising/flat 50W SMA
all available AltSeason conditions pass; missing optional confirmations skipped
Category Rankings
| Rank | Category | Winner | Score | Alloc | 4W Ret | Peers (4W) |
|---|---|---|---|---|---|---|
| 1 | Traditional Energy | XLE | 77.0 | 20% | -2.15% | FCG -3.2% · XOP -5.8% |
| 2 | Nuclear Energy | URNM | 66.4 | 20% | -2.15% | URA -2.8% · NLR -1.0% |
| 3 | Industrial Metals | COPX | 64.0 | 10% | -5.21% | REMX +3.9% · PICK -4.4% |
| 4 | Utilities & Infrastructure | PAVE | 60.5 | 10% | +2.38% | IGF -3.8% · XLU +0.6% |
| 5 | Technology | CIBR | 55.3 | 10% | -2.58% | IGV -4.5% · XLK +4.3% |
| 6 | Agriculture & Livestock | MOO | 50.6 | 10% | -2.56% | WEAT +6.1% · VEGI -0.6% |
| 7 | Precious Metals | GLD | 50.1 | 10% | -0.32% | GDX +0.8% · SLV -4.2% |
| 8 | Defense & Aerospace | ITA | 42.4 | 10% | -3.27% | XAR -3.4% · ROKT -2.0% |
| 9 | AI | SMH | 28.4 | 0% | +11.18% | BOTZ -3.4% · AIQ +1.2% |
| 10 | Emerging Markets | INDA | 4.5 | 0% | -3.01% | IEMG -3.2% · ILF -3.9% |
Traditional Energy — XLE
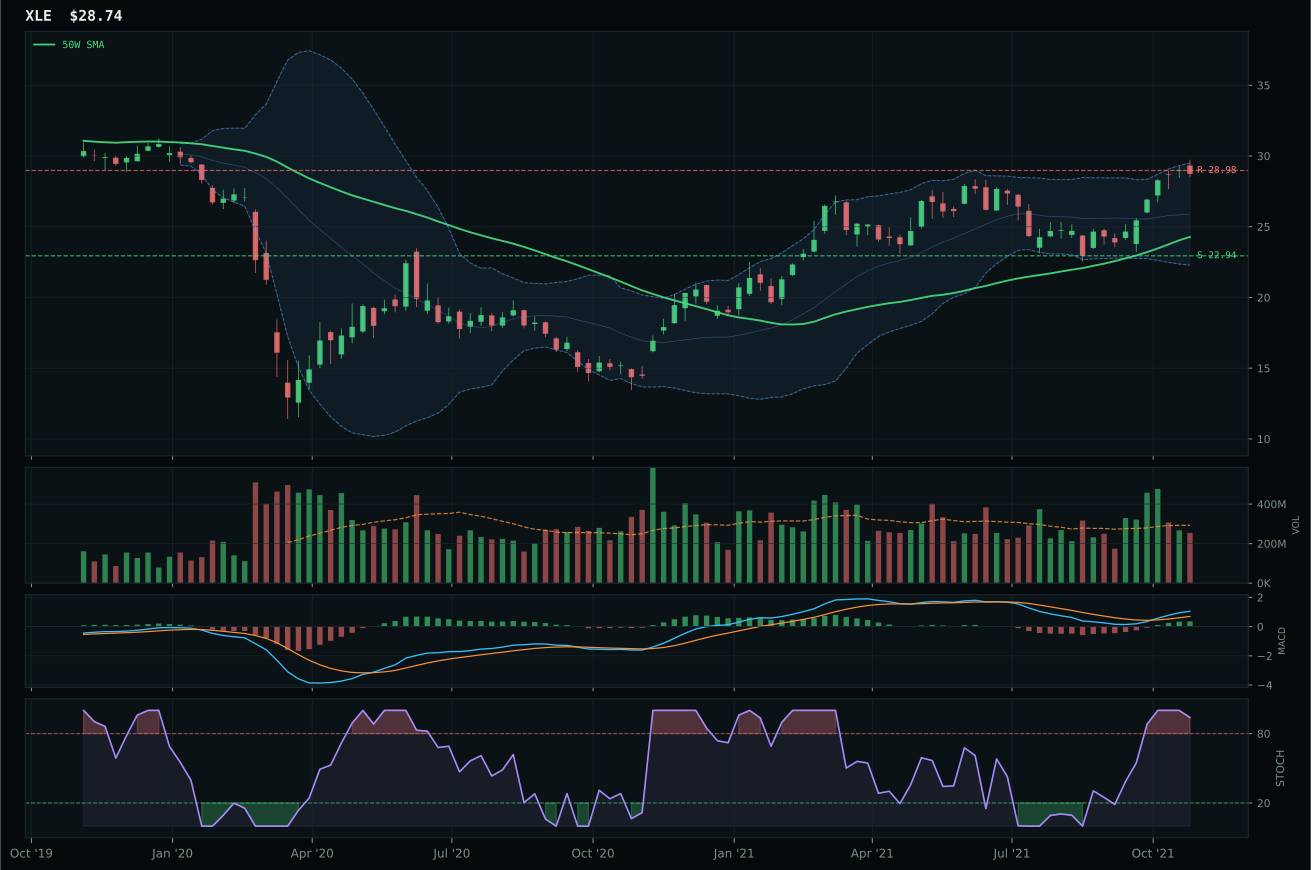
XLE has a vertical extension profile with 11.6% 13-week relative strength versus SPY.
A failed hold above support would weaken the setup.
Actionable but governed by invalidation levels.
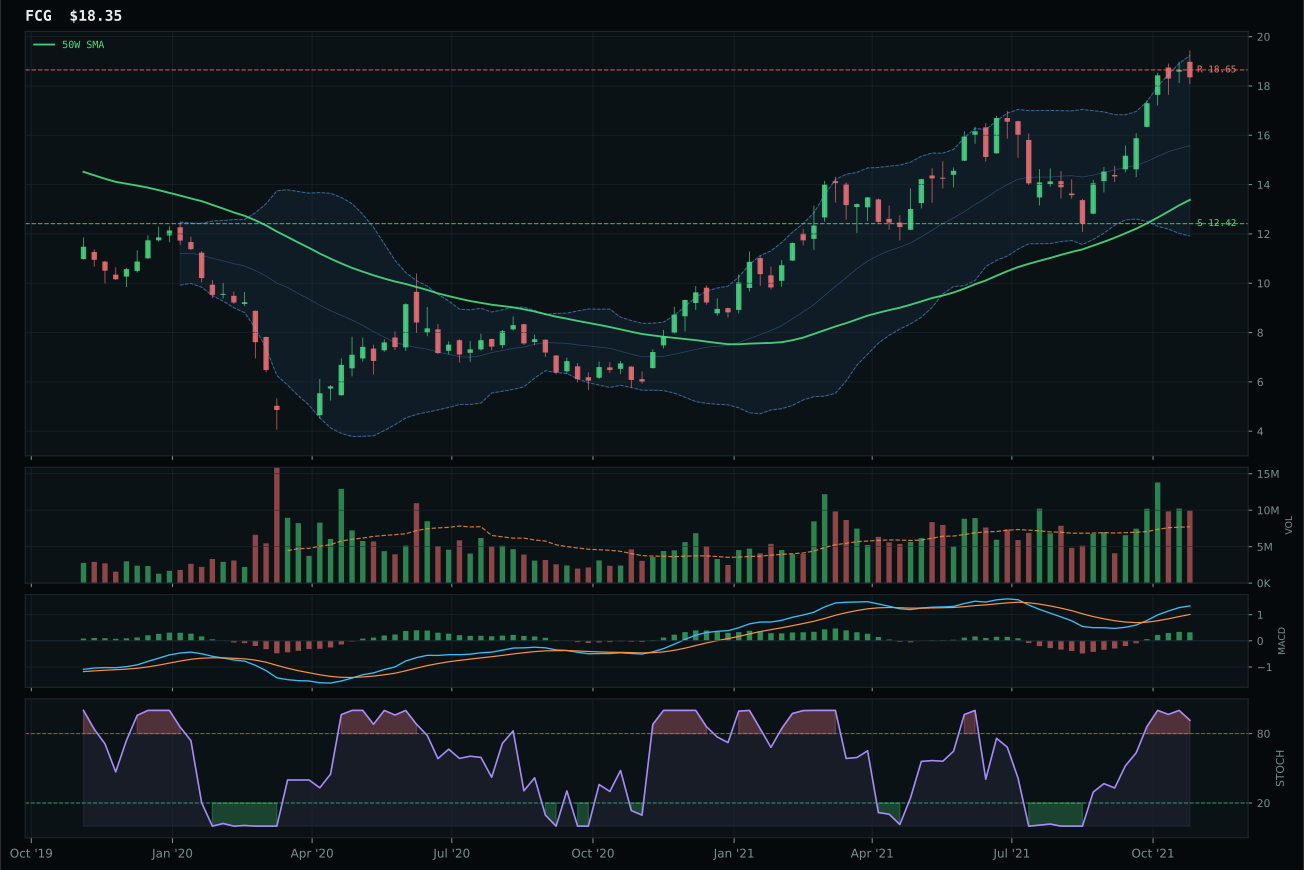
FCG has a vertical extension profile with 25.1% 13-week relative strength versus SPY.
A failed hold above support would weaken the setup.
Actionable but governed by invalidation levels.
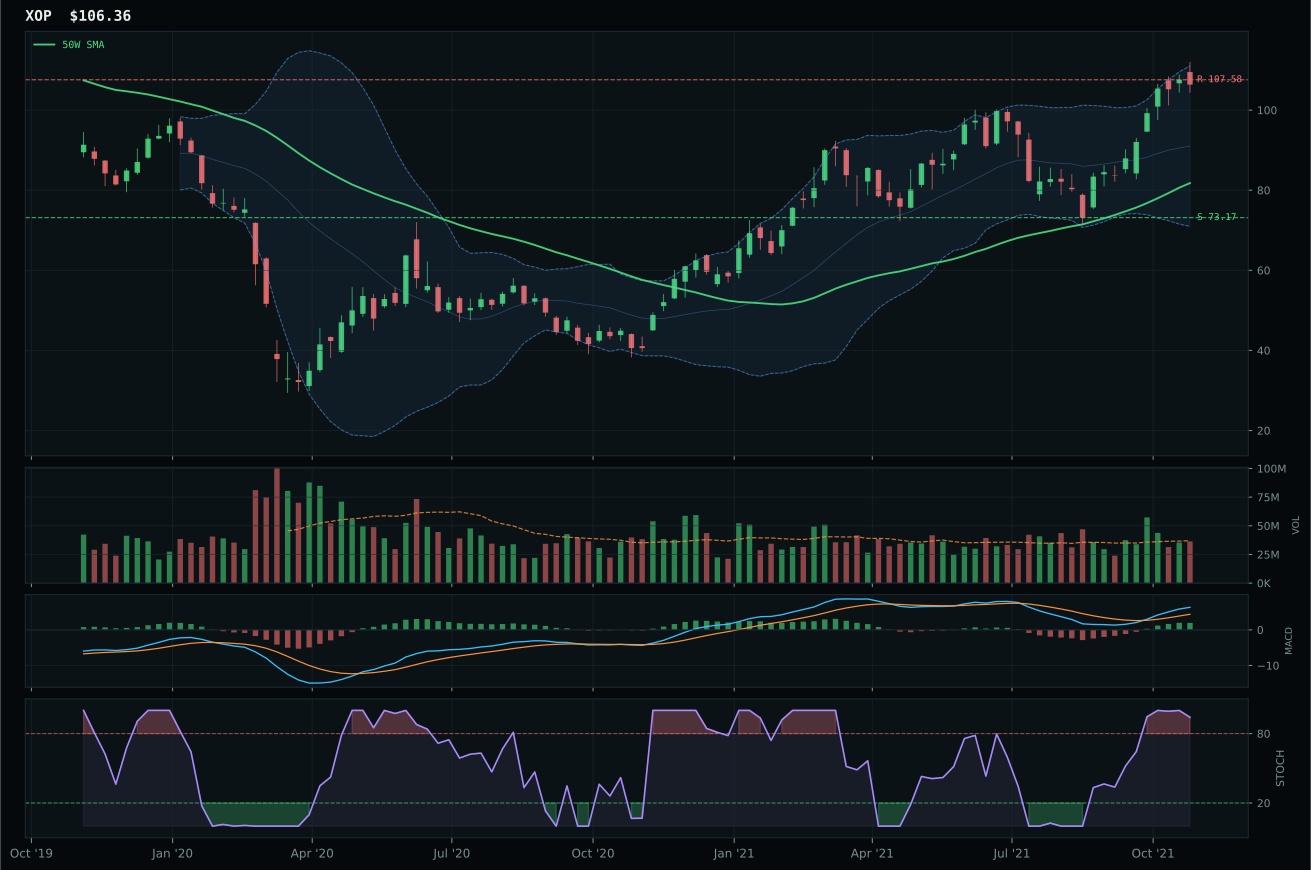
XOP has a vertical extension profile with 23.7% 13-week relative strength versus SPY.
A failed hold above support would weaken the setup.
Actionable but governed by invalidation levels.
XLE wins the top-2 overweight slot with a 77.0 category score reflecting dominant momentum and macro alignment, though the chart itself warns of entry risk. Price sits 18.4% above the 50-week moving average in a vertical extension near the 52-week high, with MACD bullish and improving but stochastic RSI overbought and rolling over at 0.94 — a classic topping structure for the time-frame. The 16.4% thirteen-week return and 11.6% relative strength to SPY justify the category-level allocation, yet the timing score of 27.0/100 reflects that this is a chase-not-a-setup. XLE wins over FCG and XOP not on cleaner positioning but on slightly better relative strength positioning inside the energy basket and -0.8% upside to resistance versus competitors that extend further. The volume sits neutral at 0.87x the 20-week average despite the vertical move, meaning participation is not confirming the price action — a subtle but important caution flag on persistence.
Traditional Energy earns 10% as a top-2 overweight on the back of an exceptional 77.0 category score driven primarily by macro narrative: energy scarcity (+16), inflation pressure (+10), supply shortage (+9), and real asset sponsorship (+7) create a four-descriptor confluence that dominates the portfolio regime. The category-level macro fit reaches 85.0/100, second only to agriculture among all ten sleeves. XLE's technical evidence is a modest 51.3/100, revealing that this is an allocation decision driven entirely by macro conviction, not technical setup quality. The 10% slot reflects a portfolio manager's bet on energy cycle extension despite overbought technicals, justified by supply-side constraints and demand resilience in a transition economy. The positioning carries elevated drawdown risk if energy prices mean-revert; the allocation persists because the macro tailwind is deemed structural, not cyclical. Risk management requires strict monitoring of the MACD rollover and stochastic decline; any weakening of energy scarcity descriptors should trigger rebalancing.
Nuclear Energy — URNM
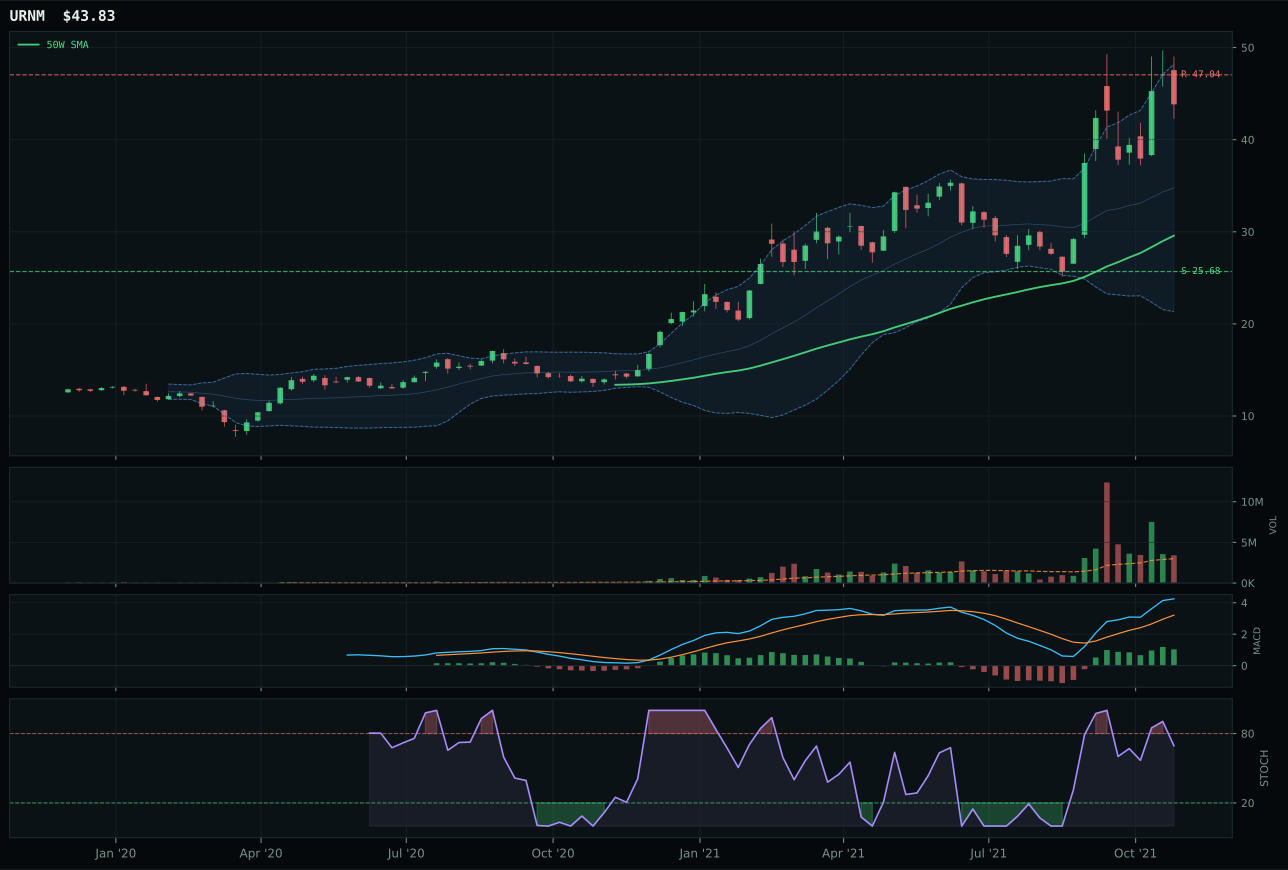
URNM has a vertical extension profile with 43.3% 13-week relative strength versus SPY.
A failed hold above support would weaken the setup.
Actionable but governed by invalidation levels.
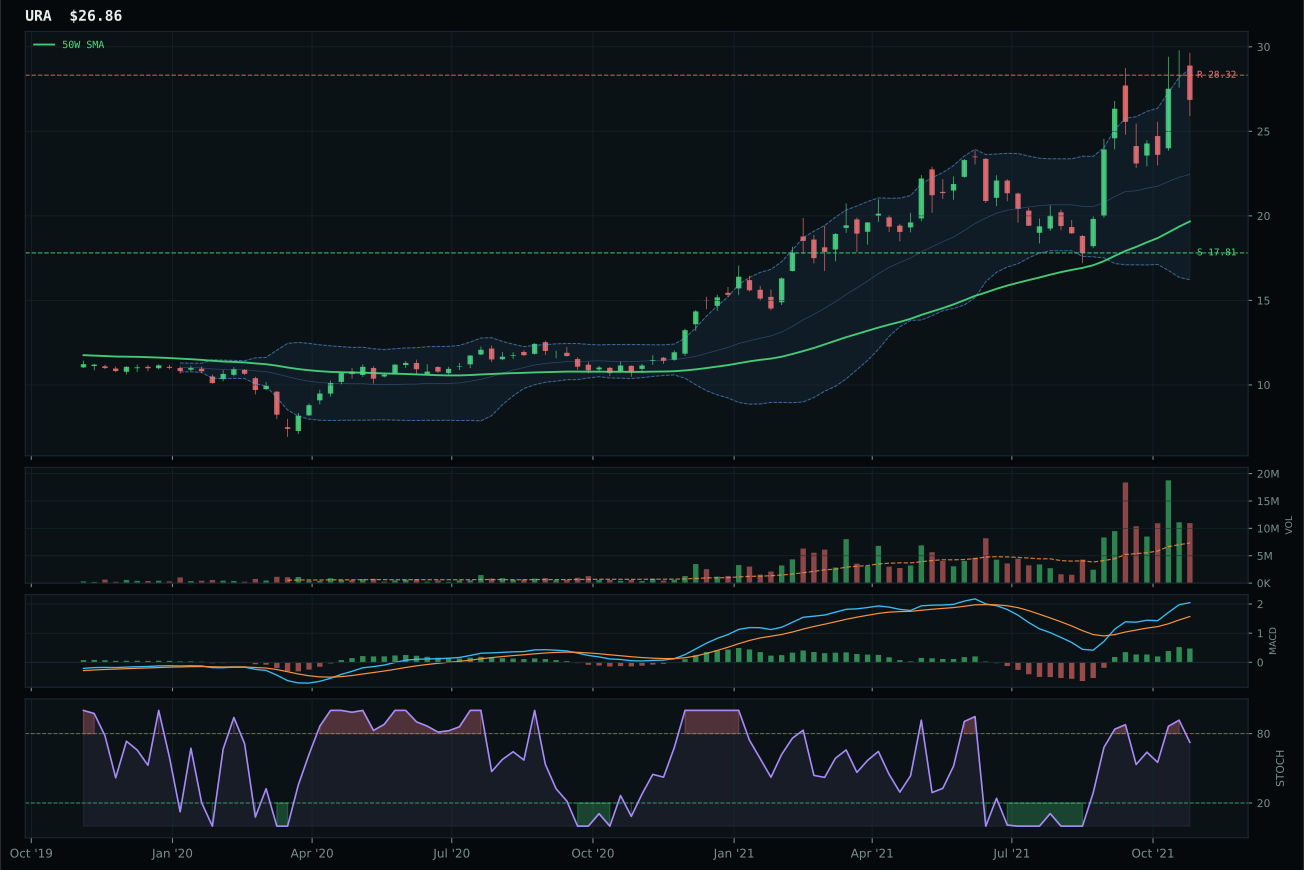
URA has a vertical extension profile with 29.5% 13-week relative strength versus SPY.
A failed hold above support would weaken the setup.
Actionable but governed by invalidation levels.
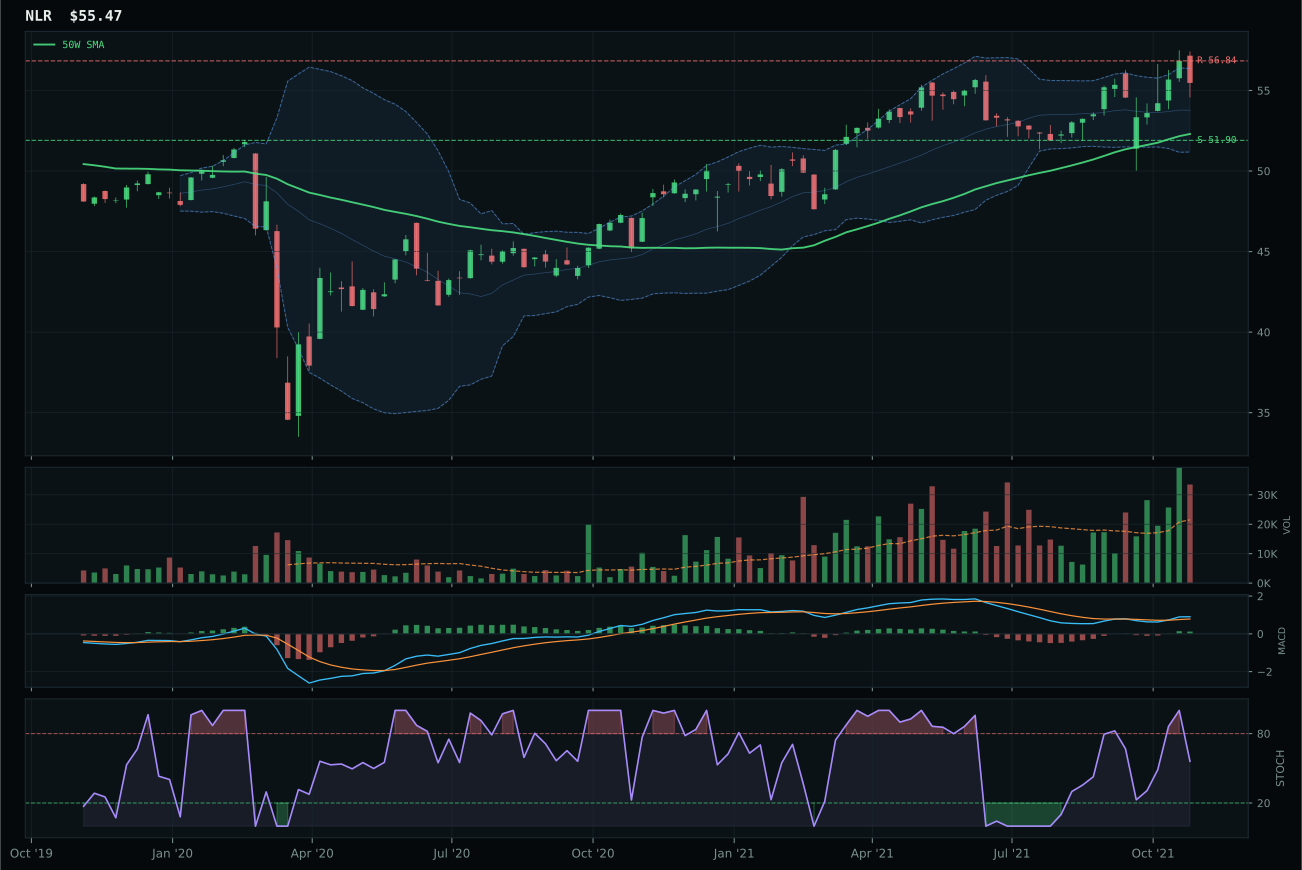
NLR has a neutral structure profile with 2.1% 13-week relative strength versus SPY.
A failed hold above support would weaken the setup.
Tracked, but not top-2 eligible because: .
URNM claims the nuclear category representative on extraordinary relative strength that overwhelms its extended positioning. The 48.2% extension above the 50-week moving average is severe — one of the deepest in this week's portfolio — yet the 48.1% thirteen-week return and 43.3% relative strength to SPY, paired with 13.8% category-relative strength, signal that every subsequent buyer has been rewarded. Volume registers at 1.14x the 20-week average (above-average participation) despite the extension, meaning capital continues flowing into uranium miners as a conviction trade, not a momentum chase. URA, the runner-up, posts a superior technical evidence score of 85.3 versus URNM's 84.5 and carries trend 100.0 versus URNM's 90.0, yet loses on the margin because URNM's category-relative strength of 13.8% versus URA's 0.0% proves that the uranium complex is rotating capital specifically into miner leverage. URNM's persistence score reaches 100.0/100, confirming that volume and price confirmation remain in lockstep despite the extended entry.
Nuclear Energy earns 10% as the portfolio's second top-2 overweight, justified by a 66.4 category score that reflects balanced technical conviction (84.5 for the representative) and strong macro support (64.0/100 category fit from energy scarcity +9, real asset sponsorship +7, inflation pressure +3). This is the rare allocation where technical strength and macro narrative align: URNM's vertical extension and above-average volume participation confirm that capital genuinely believes in uranium supply scarcity and long-cycle demand recovery. The 10% slot represents a conviction bet that energy transition demand and reactor cycle dynamics justify the 48%+ premium to the 50-week moving average. The allocation carries significant drawdown risk if risk appetite falters or if uranium spot prices mean-revert; the system is implicitly accepting that volatility in exchange for exposure to a multi-year supply shortage narrative. Close monitoring of the support level at 25.68 and any deterioration in category-relative strength would warrant tactical trimming.
Industrial Metals — COPX
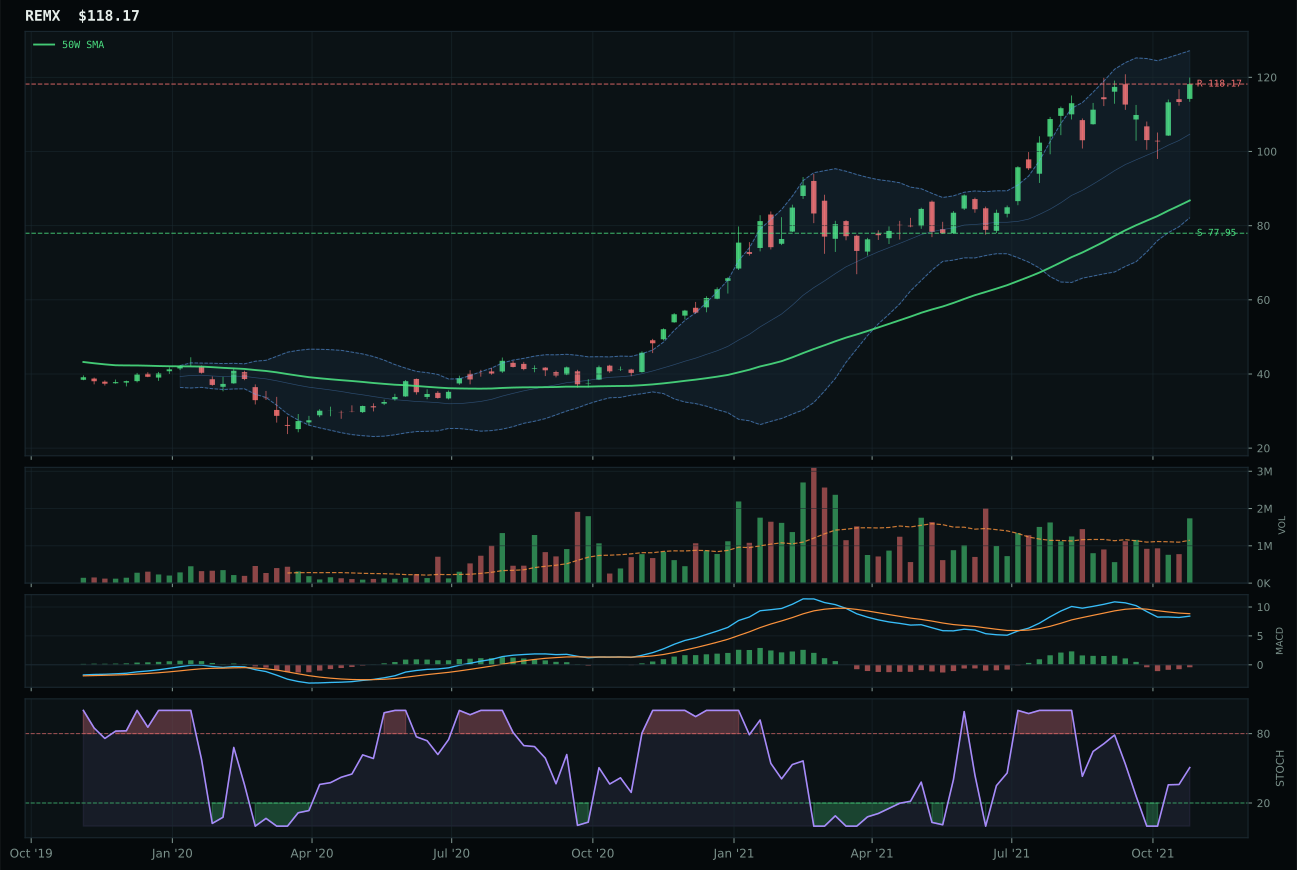
REMX has a vertical extension profile with 3.9% 13-week relative strength versus SPY.
A failed hold above support would weaken the setup.
Actionable but governed by invalidation levels.
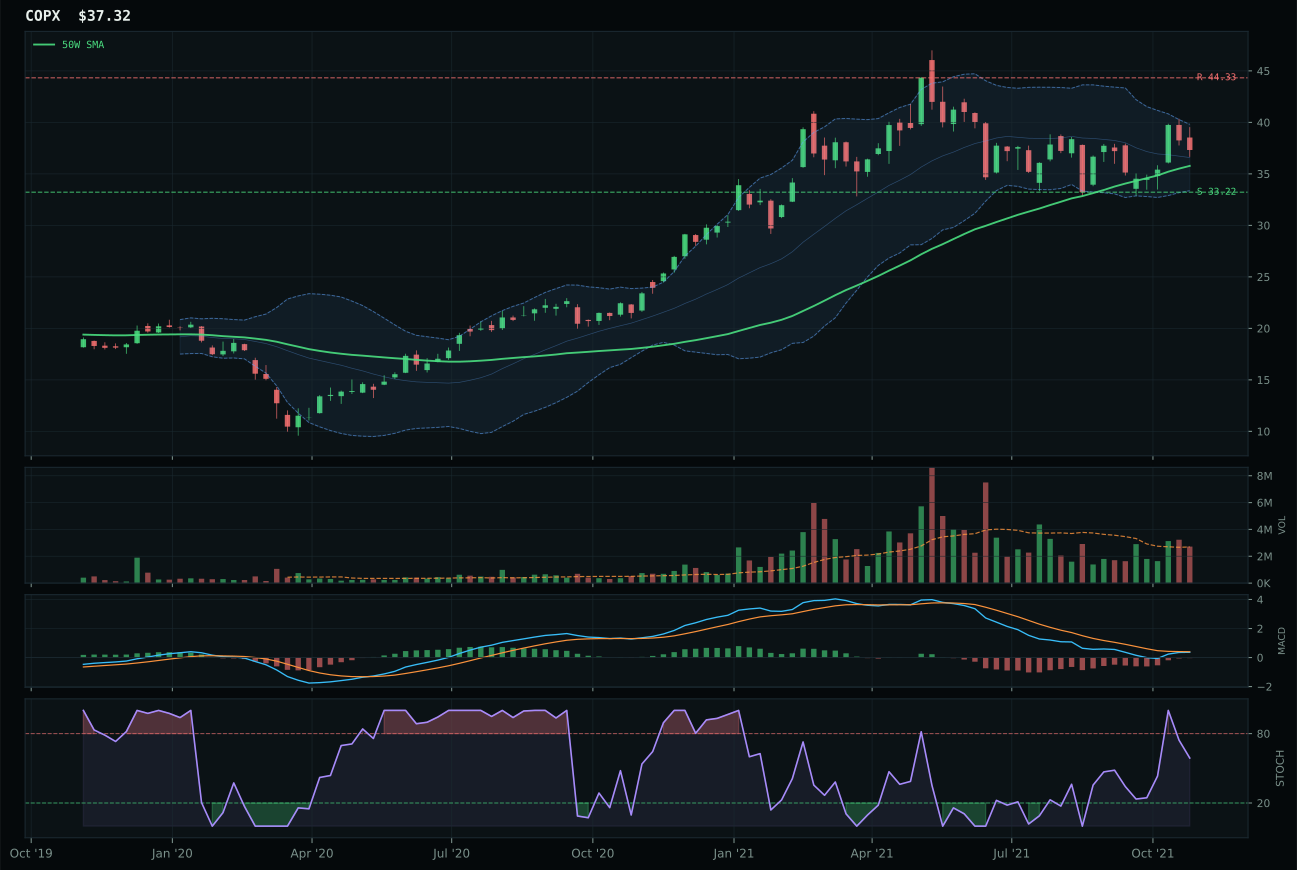
COPX has a neutral structure profile with -6.1% 13-week relative strength versus SPY.
A failed hold above support would weaken the setup.
Actionable but governed by invalidation levels.
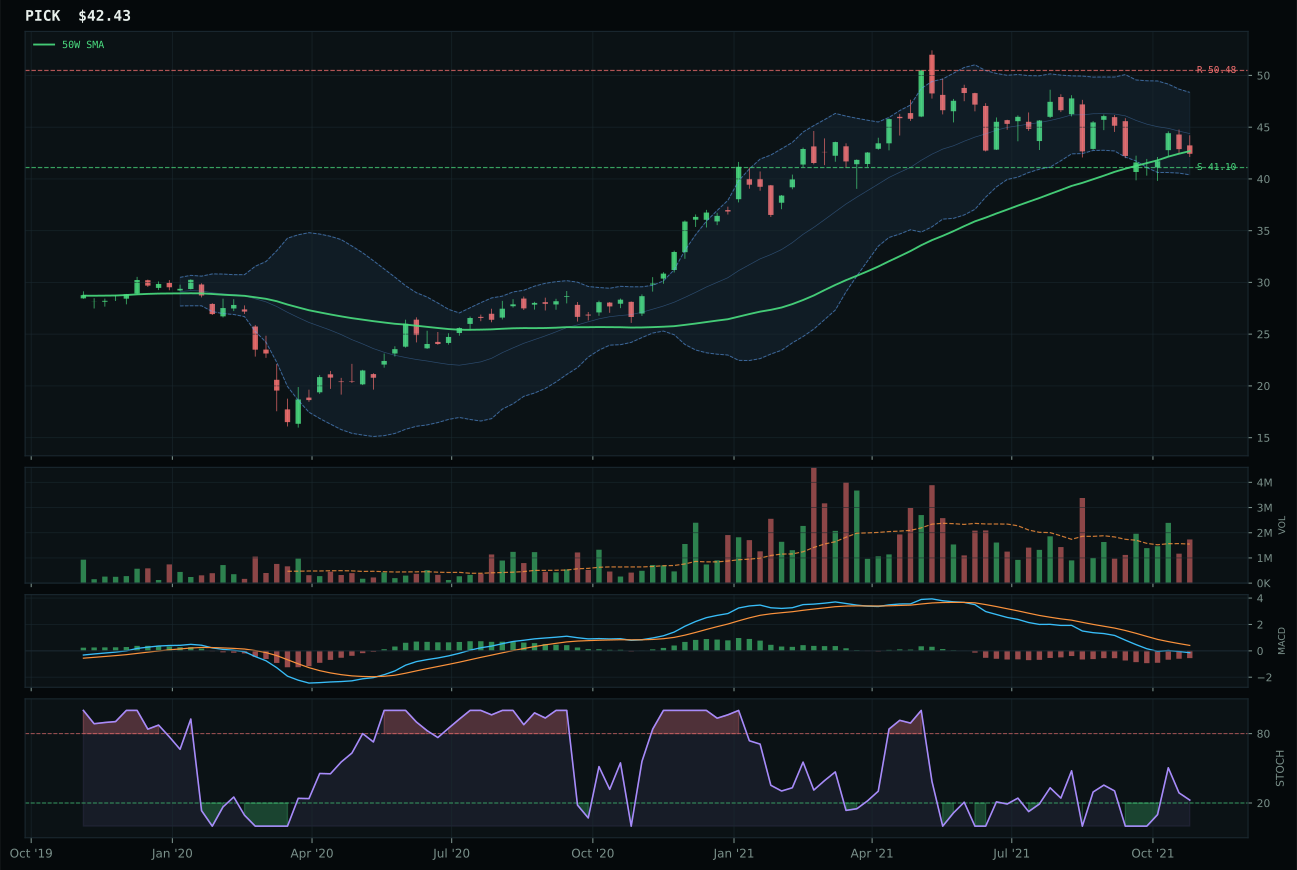
PICK has a pullback into support profile with -15.3% 13-week relative strength versus SPY.
A failed hold above support would weaken the setup.
Actionable but governed by invalidation levels.
COPX claims the industrial metals representative role on a 98.0% timing score and 83.8% trend score that together create a compelling mean-reversion entry point. Copper sits 4.3% above its 50-week moving average in the upper retracement / momentum zone near the 0.382 Fibonacci level, with MACD improving and stochastic RSI rising mid-zone — precisely the positioning where new accumulation prints. REMX, the runner-up, extends 36.2% above its 50-week moving average in a vertical extension setup with MACD already bearish/weakening, meaning every new buyer is late to the move. The risk-reward gap is decisive: COPX offers 68.1/100 with 12.3% downside to support versus REMX's 44.8/100 with likely deeper drawdown from extended levels. COPX's -1.4% thirteen-week return appears weak until contextualized: the 4W return of 7.9% shows recent strength, and the pullback to support creates a lower-risk entry than REMX's extended positioning. Neutral volume at 1.01x the 20-week average confirms that accumulation is unleveraged.
Industrial Metals holds 5% at tier-2, positioned on a 64.0/100 category score that reflects robust macro tailwinds from metals scarcity (+14), commodity breadth positive (+10), and real asset sponsorship (+6). The technical evidence is split: REMX scored higher (67.3 vs 66.5 for COPX) in the reasoned ETF proof order, yet COPX's representative selection reflects the system's weighting toward favorable timing and risk-reward over extended momentum. The category benefits from supply-side constraints and demand resilience in infrastructure buildout, supporting the tier-2 allocation even though technical urgency is modest. To move to top-2, industrial metals would need either REMX to mean-revert and offer a fresh entry signal, or COPX to break above 44.33 resistance on volume, confirming that the scarcity thesis is driving new accumulation. Current positioning is tactical accumulation at a defined support level rather than trend-following aggression.
Utilities & Infrastructure — PAVE
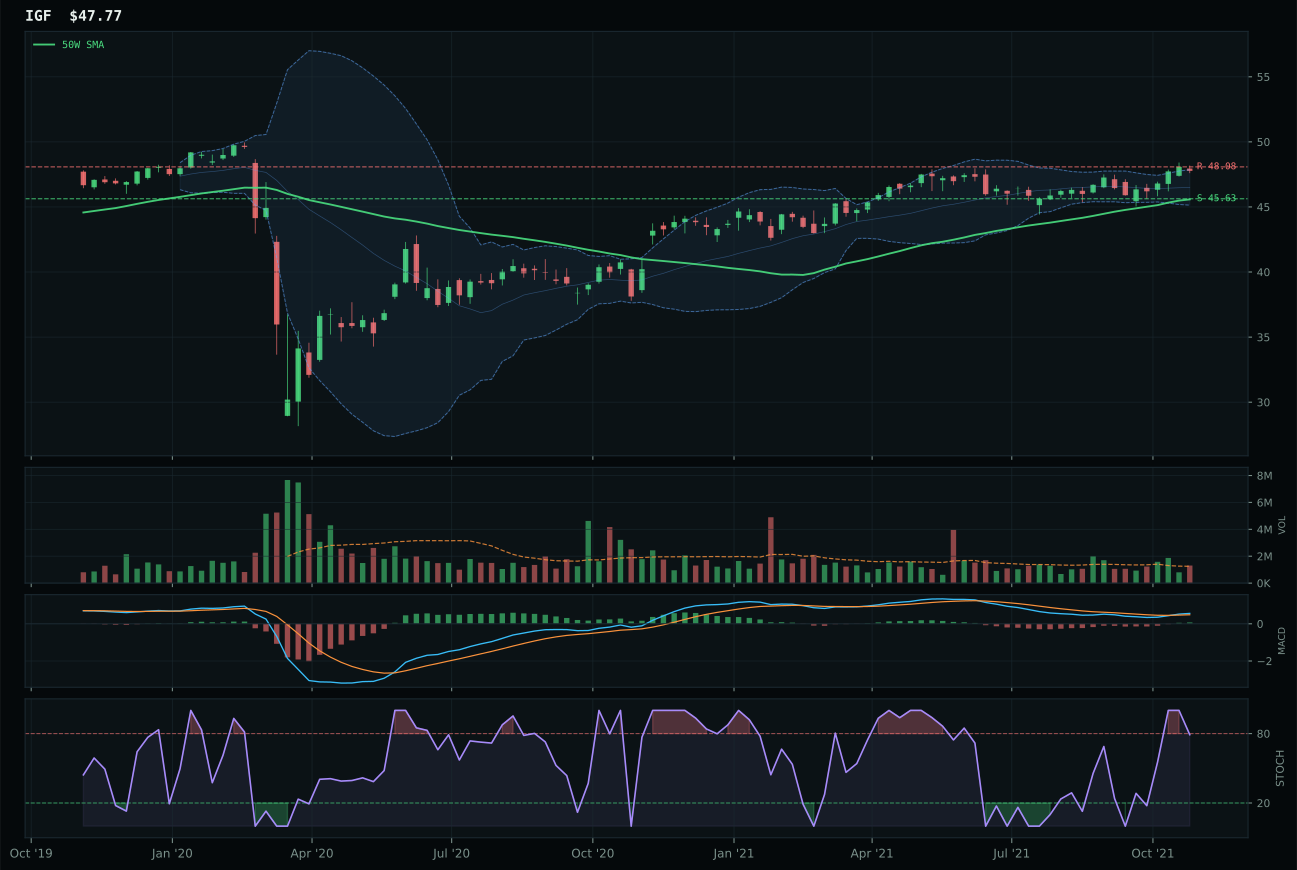
IGF has a pullback into support profile with -0.6% 13-week relative strength versus SPY.
A failed hold above support would weaken the setup.
Actionable but governed by invalidation levels.
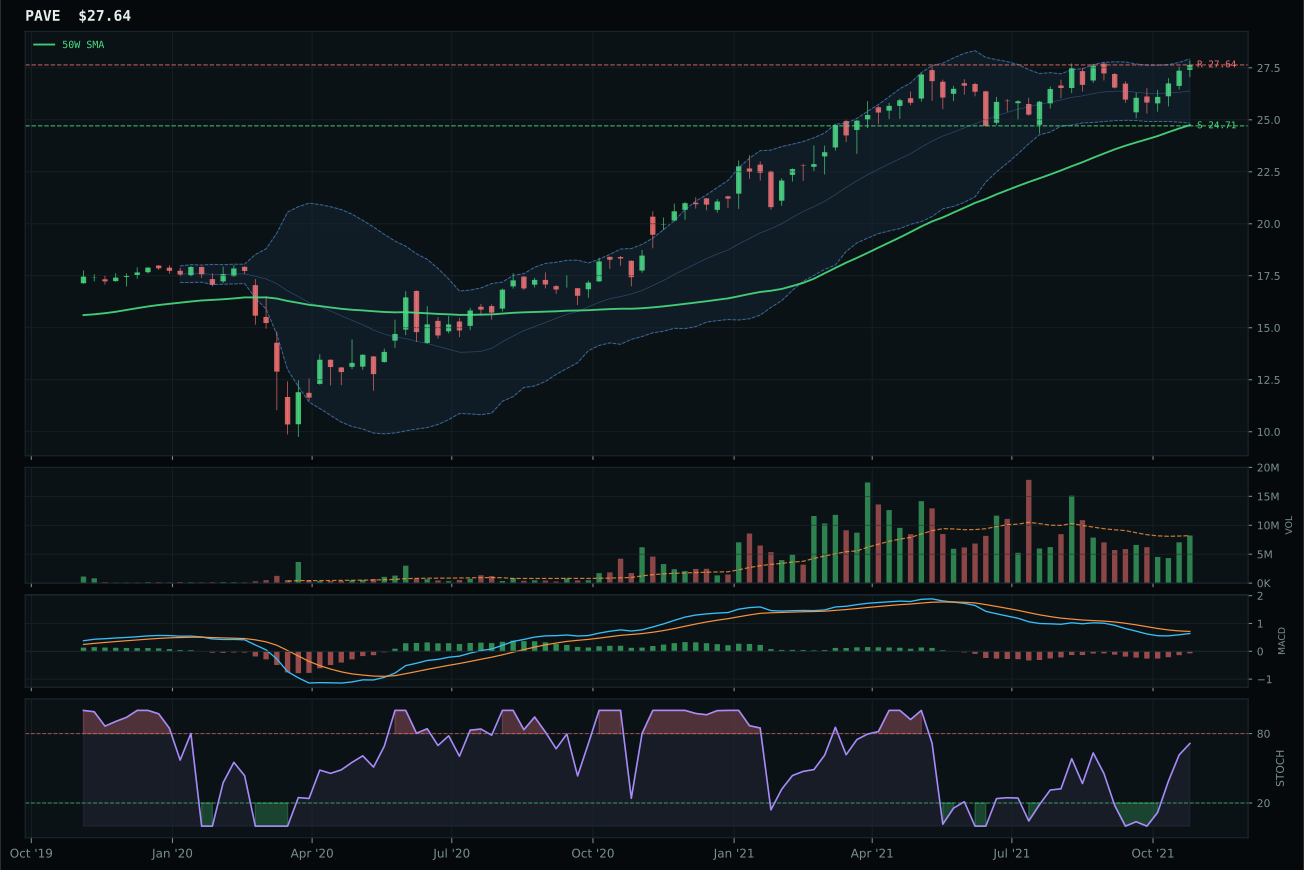
PAVE has a neutral structure profile with -0.3% 13-week relative strength versus SPY.
A failed hold above support would weaken the setup.
Actionable but governed by invalidation levels.
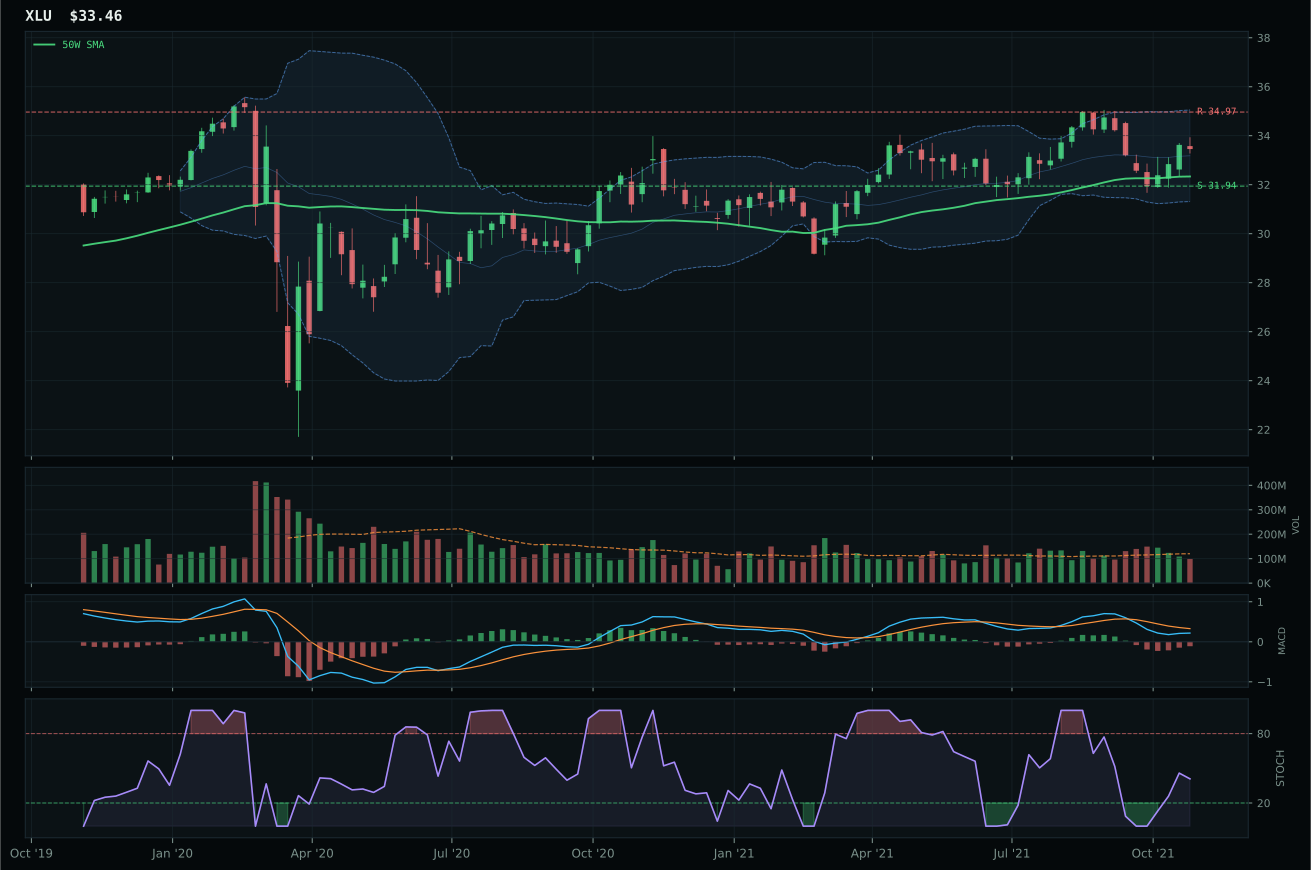
XLU has a pullback into support profile with -3.3% 13-week relative strength versus SPY.
A failed hold above support would weaken the setup.
Actionable but governed by invalidation levels.
PAVE wins the utilities & infrastructure category on a 92.5% trend score and neutral MACD positioning that edges out competitors despite weaker technical evidence scores (71.0 vs 87.7 for IGF). Price sits 11.7% above the 50-week moving average in what amounts to a high-confidence trend hold rather than an aggressive chase — every increment closer to the 27.64 resistance adds risk, yet the structure remains clean with 81.4% compression suggesting internal consolidation. PAVE's category-relative strength of 0.3% versus IGF's 0.0% delivers the margin of victory, combined with a superior risk-reward ratio of 49.1 versus 39.5: the infrastructure play has 11.9% downside to support against modest upside, creating an asymmetry that justifies holding rather than accumulating. IGF's technical evidence of 87.7/100 is genuinely superior — bullish MACD, pullback structure, rising stochastic — yet loses on the composite because it extends further from support and offers less favorable entry geometry.
Utilities & Infrastructure receives 5% at tier-2, held in the portfolio on a 60.5 category score that reflects balanced technical and macro positioning. The category-level macro fit is 52.0/100, modest but positive: the transition regime helps (+4), broad market bear helps (+4), yet inflation pressure penalizes (-6). PAVE's own technical evidence of 71.0/100 aligns with tier-2 conviction — not compelling enough to chase, but solid enough to hold at support. The allocation functions as a defensive equity sleeve within a mixed macro environment where neither growth nor value dominates. To move to top-2, the category would require either a breakout above 27.64 resistance on volume, or a macro shift that elevates infrastructure demand narratives (supply shortage, real asset sponsorship) into the energy or agriculture category weightings. Current positioning is patient accumulation at support levels, providing dividend and stability exposure without aggressive beta.
Technology — CIBR
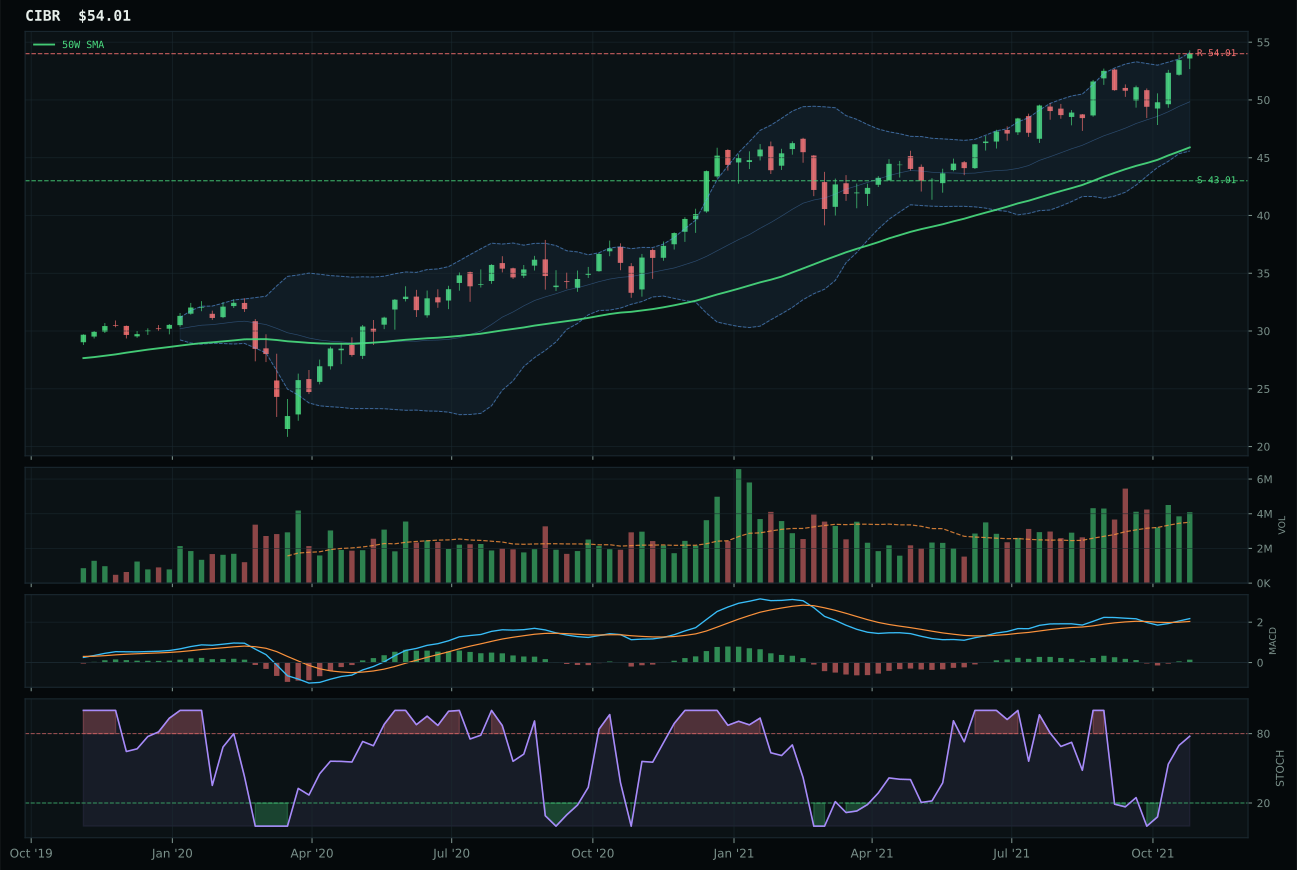
CIBR has a vertical extension profile with 5.4% 13-week relative strength versus SPY.
A failed hold above support would weaken the setup.
Actionable but governed by invalidation levels.
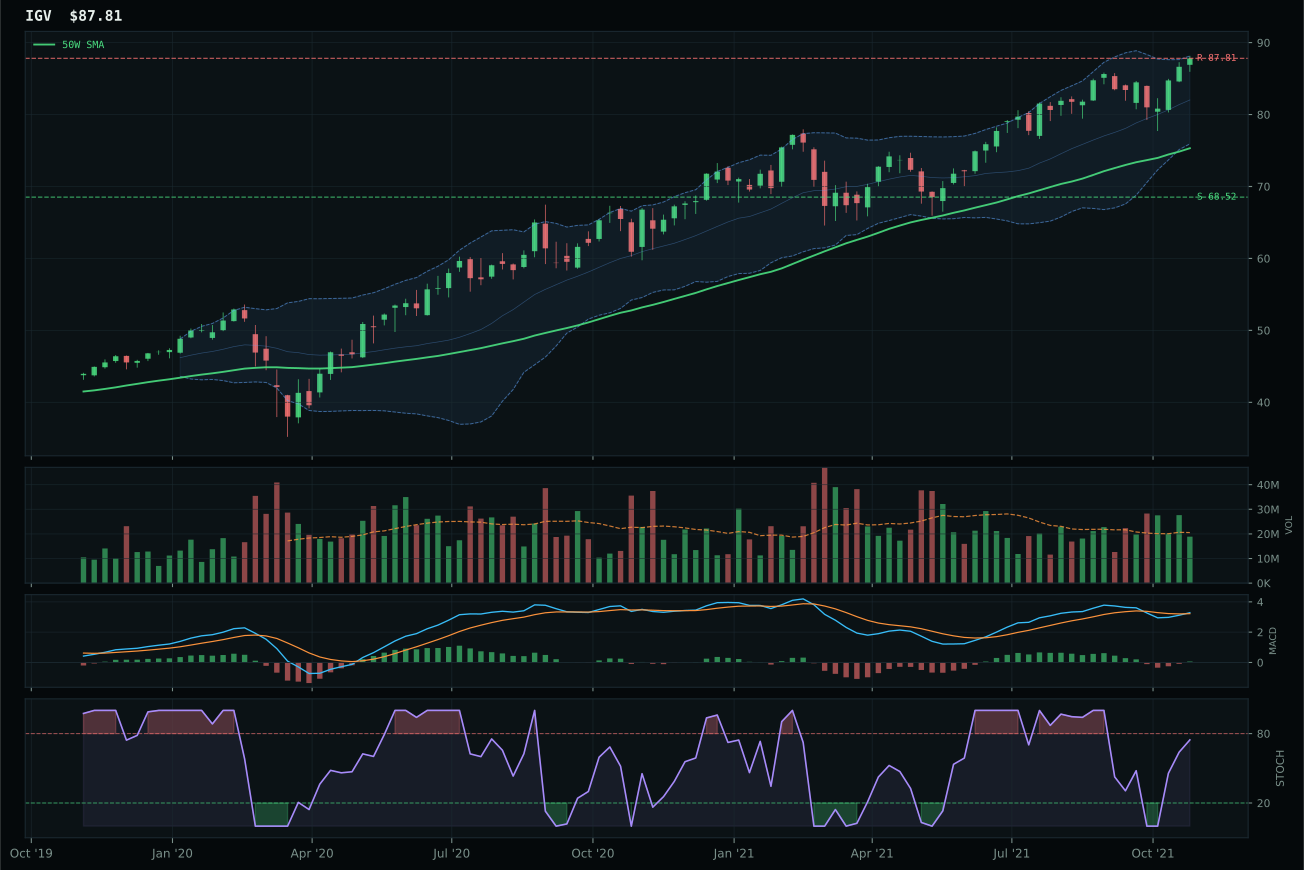
IGV has a vertical extension profile with 4.2% 13-week relative strength versus SPY.
A failed hold above support would weaken the setup.
Actionable but governed by invalidation levels.
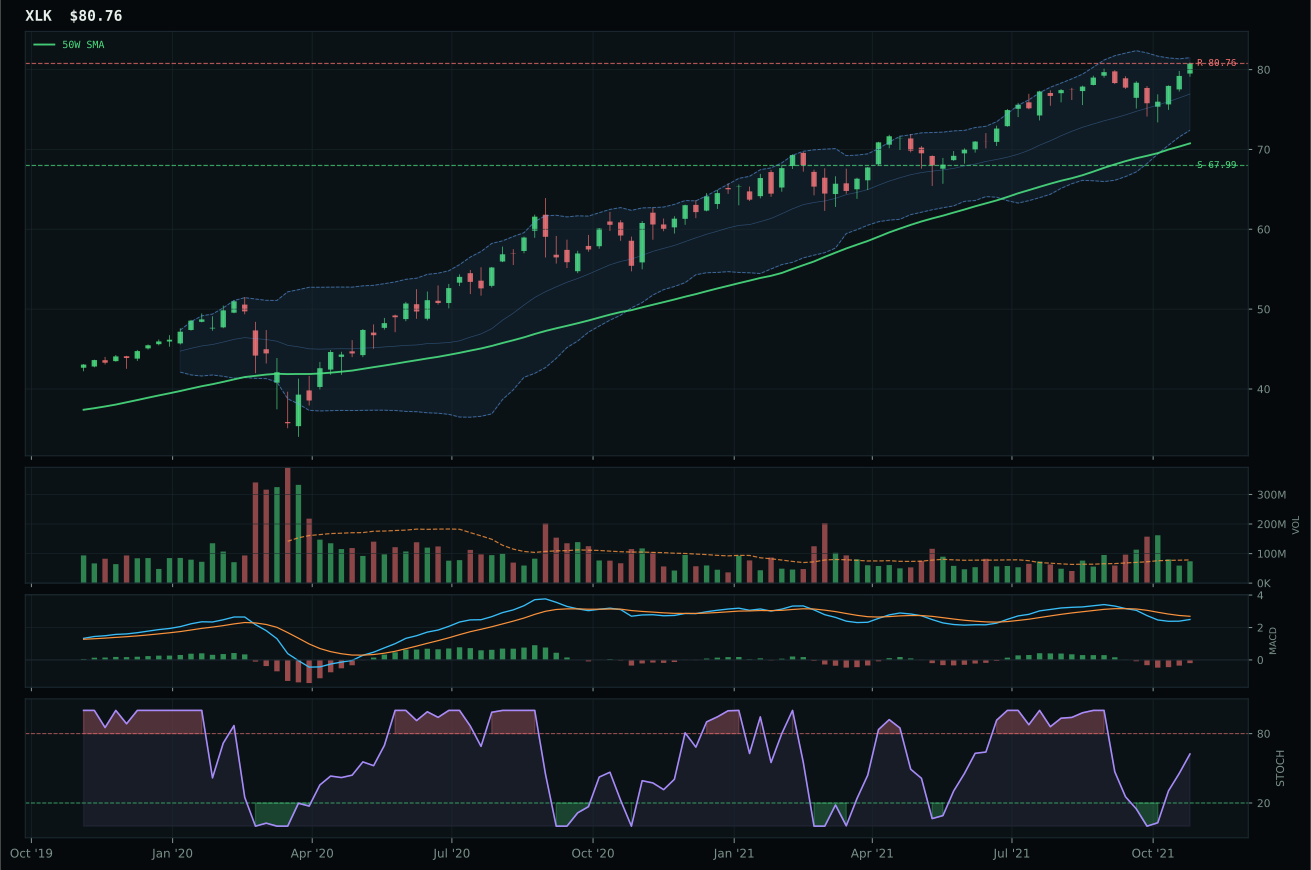
XLK has a neutral structure profile with 0.6% 13-week relative strength versus SPY.
A failed hold above support would weaken the setup.
Actionable but governed by invalidation levels.
CIBR wins on category-relative strength of 1.2% versus IGV's 0.0%, paired with cleaner structure (79.8 vs 74.8) and above-average volume participation that IGV cannot match at neutral levels. The cybersecurity thesis sits 17.7% above its 50-week moving average with a 10.1% thirteen-week return, meaning new capital is being accumulated despite the vertical extension — a signal that breadth and sponsorship remain intact even as price has moved away from the trend line. IGV's 8.9% thirteen-week return and 4.2% relative strength to SPY reveal a lagging performer inside what should be a leadership category, and its MACD, while bullish and improving, carries neutral volume confirmation rather than the accumulation evidence CIBR displays. The gap of 2.8 composite points reflects a clear technical separation: CIBR is a confirmation setup with above-average participation; IGV is a momentum chase with neutral tape.
Technology receives 5% allocation as a tier-2 category, ranked outside the top two opportunities this week despite a 55.3 final score. The category-level macro fit of 34.0/100 reflects active headwinds from credit stress (-7), dollar pressure (-5), and inflation pressure (-4), which together suppress the appeal of duration-sensitive software and compute exposure in a transition regime. While CIBR's own technical evidence scores 90.5/100, the broader ecosystem — enterprise software (IGV) and large-cap tech (XLK) — cannot overcome macro drag. For Technology to earn a top-2 slot, either the credit stress or dollar pressure descriptors would need to flip, or the category's internal technical strength would need to reach the 70+ range. This week, the setup is clean but not compelling enough to displace energy scarcity or uranium scarcity narratives.
Agriculture & Livestock — MOO
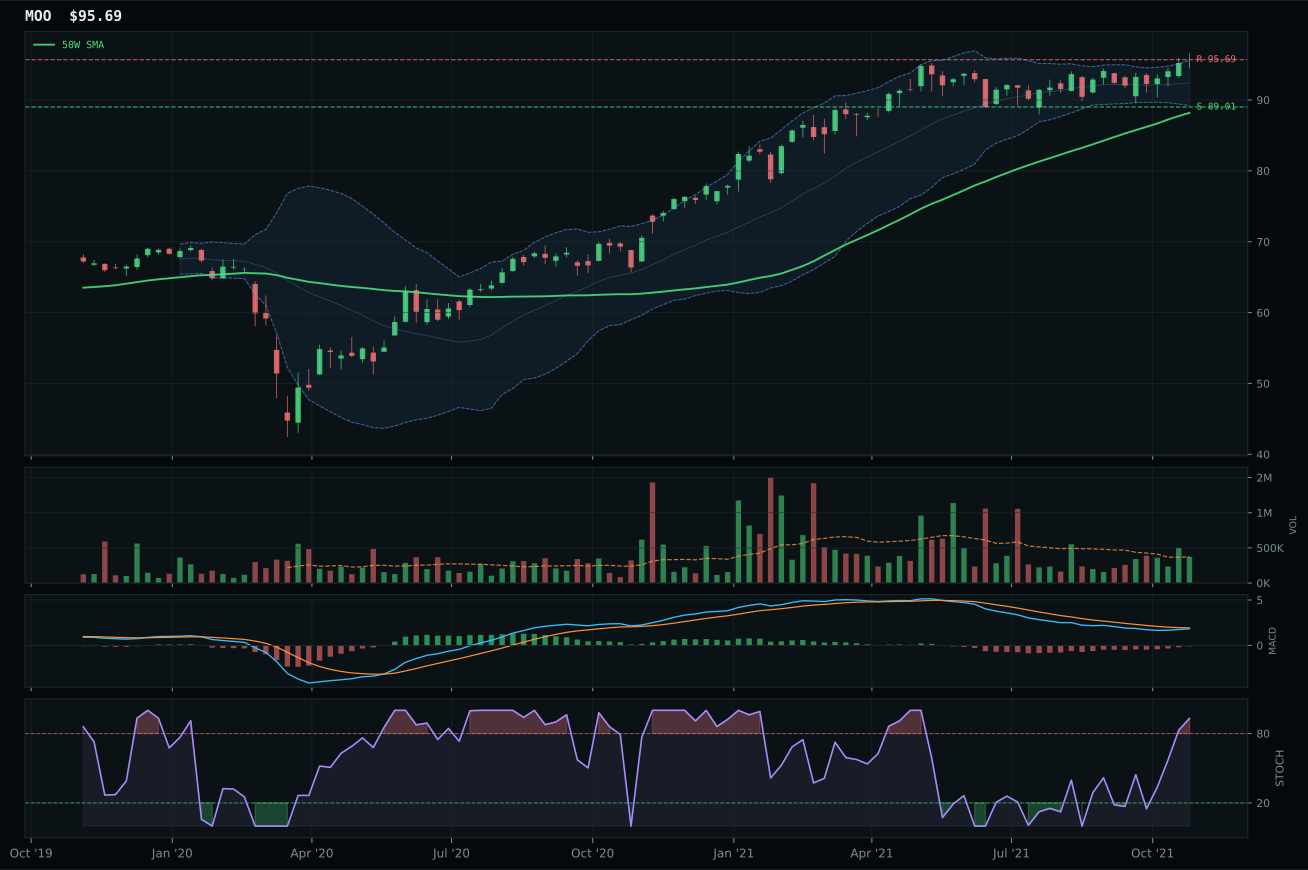
MOO has a neutral structure profile with -0.4% 13-week relative strength versus SPY.
A failed hold above support would weaken the setup.
Actionable but governed by invalidation levels.
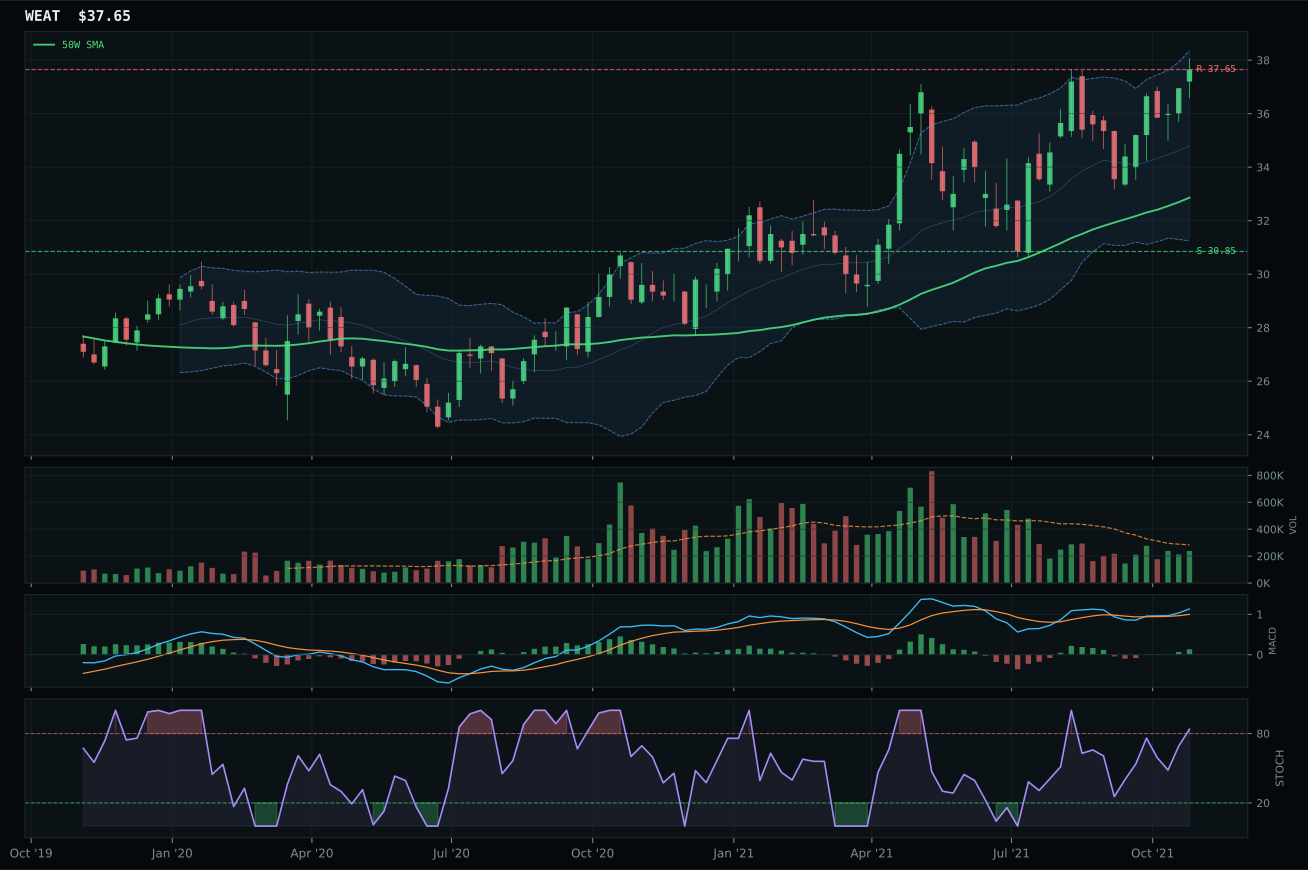
WEAT has a neutral structure profile with 4.2% 13-week relative strength versus SPY.
A failed hold above support would weaken the setup.
Tracked, but not top-2 eligible because: .
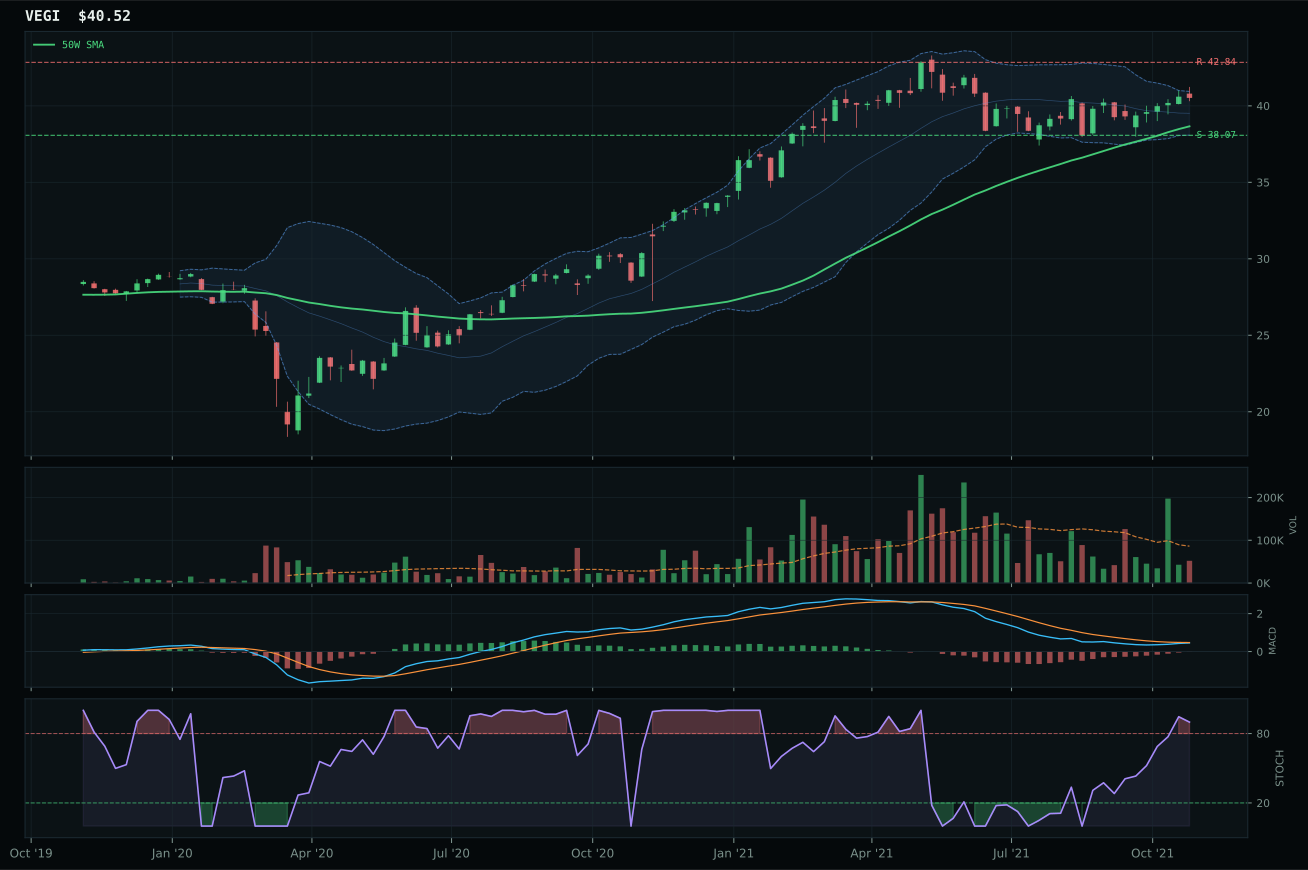
VEGI has a neutral structure profile with -1.2% 13-week relative strength versus SPY.
A failed hold above support would weaken the setup.
Tracked, but not top-2 eligible because: .
MOO wins the agricultural category on a 92.3% trend score and 75.0% timing score that reflects a near-52-week high setup without the excessive extension that dogs competing names. At 8.5% above the 50-week moving average, MOO has room to extend before entering fully exhausted territory, while WEAT sits 14.6% extended — a meaningful difference in mean-reversion risk. MOO's 4.3% thirteen-week return paired with neutral MACD (bearish but improving) and 0.0% category-relative strength signals that the agribusiness equity sleeve is being held at parity, not chased. WEAT's 9.0% thirteen-week performance looks better in isolation, but the structure score gap (78.1 vs 76.0) and risk-reward penalty (56.2 vs 43.5) reveal that WEAT has extended further and left less room for safe accumulation. Volume sits neutral at 0.99x the 20-week average for MOO, meaning participation is unleveraged and sustainable.
Agriculture & Livestock earns 5% at tier-2, supported by the strongest category-level macro fit at 86.0/100 driven by supply shortage (+13), inflation pressure (+10), and real asset sponsorship (+8). The commodity breadth positive descriptor adds another +5, creating a four-descriptor tailwind unique in this portfolio sweep. MOO's own technical evidence is a modest 66.5/100, yet macro narrative strength more than compensates: the category wins not on chart perfection but on the alignment of input costs, food inflation, and structural supply constraints with a transition regime. The 5% slot reflects justified conviction in the agricultural inflation thesis, but not enough technical evidence to push into top-2 equity. A break above 95.69 resistance with volume acceleration would elevate this to a stronger posture; for now, it functions as a real-asset hedge within a mixed macro environment.
Precious Metals — GLD
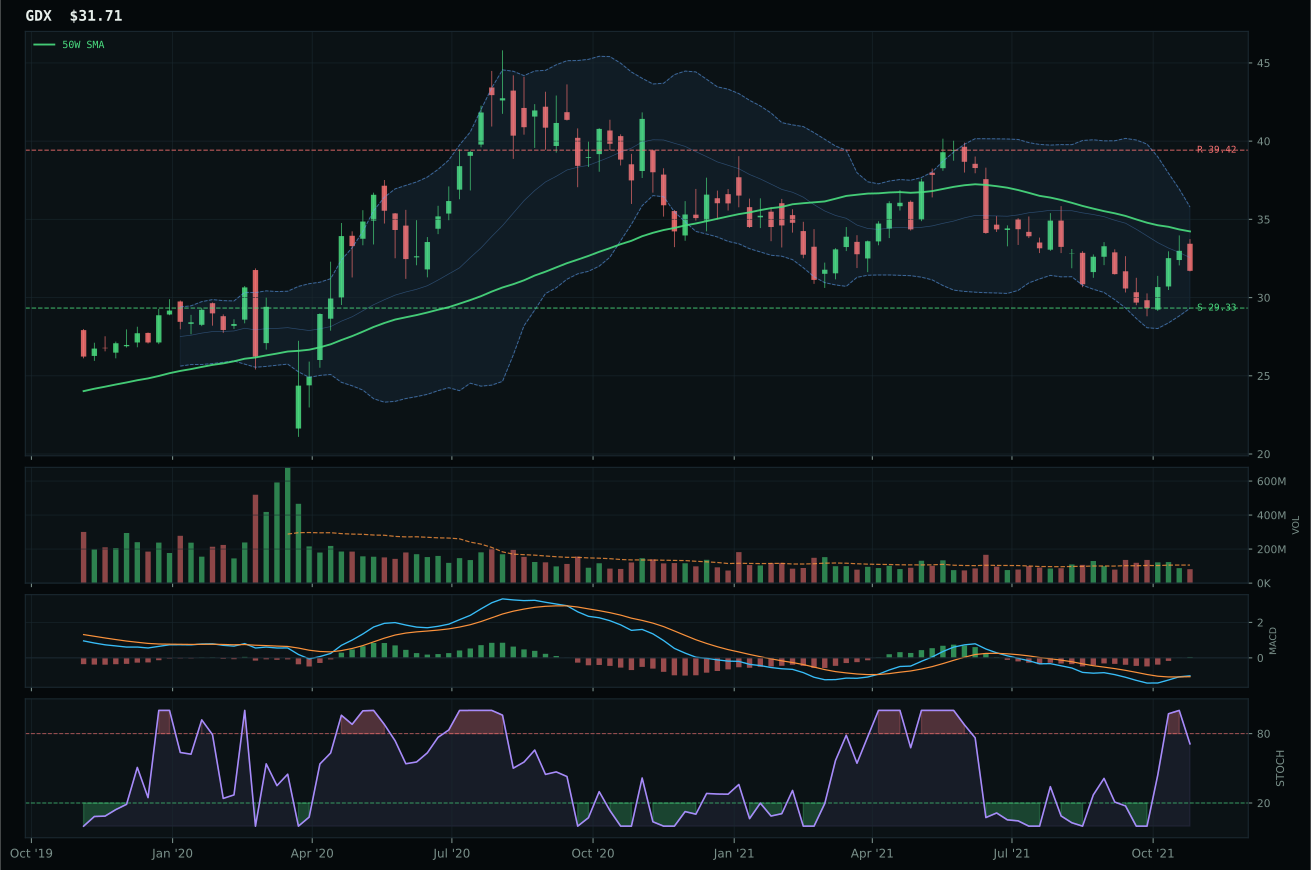
GDX has a neutral structure profile with -13.9% 13-week relative strength versus SPY.
A failed hold above support would weaken the setup.
Actionable but governed by invalidation levels.
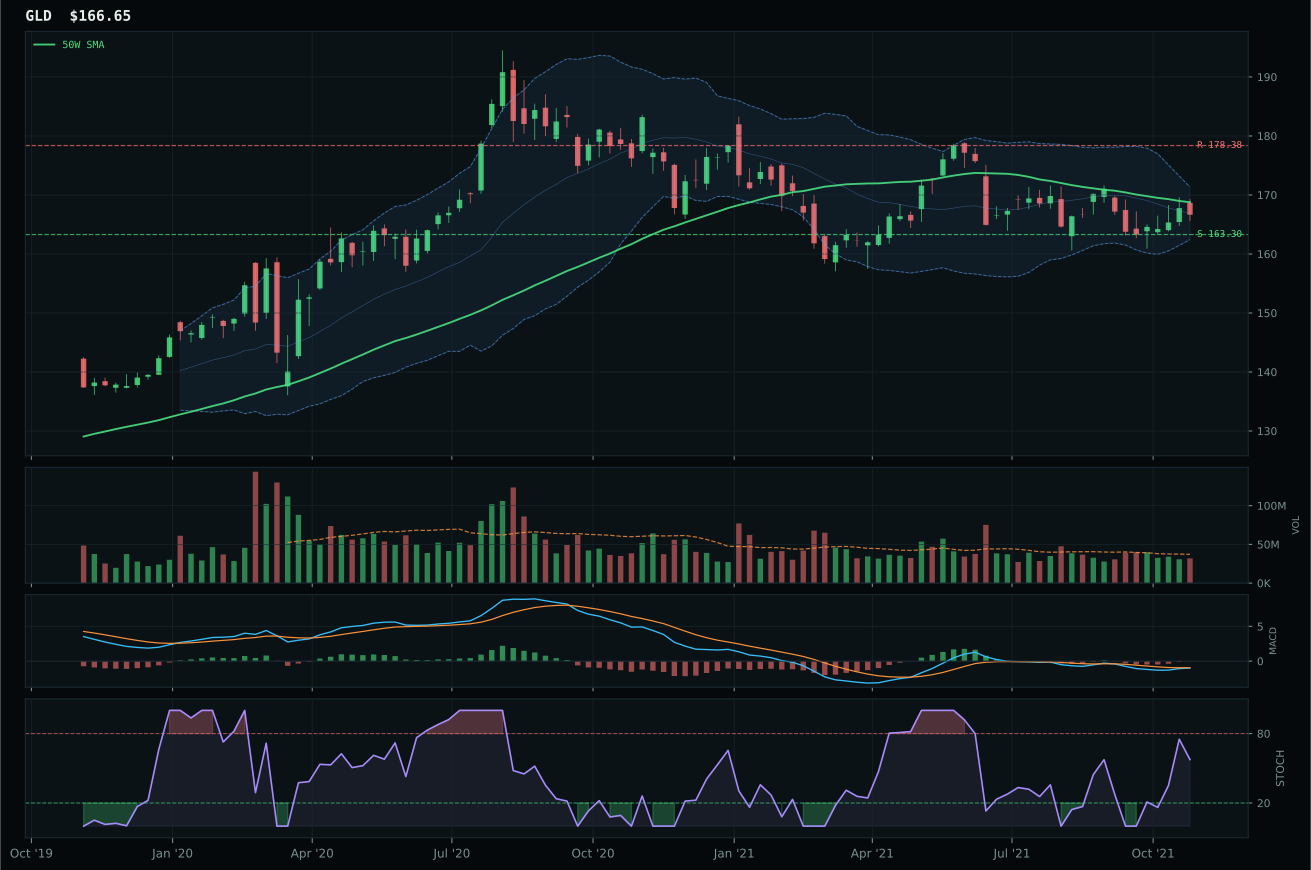
GLD has a pullback into support profile with -6.6% 13-week relative strength versus SPY.
A failed hold above support would weaken the setup.
Actionable but governed by invalidation levels.
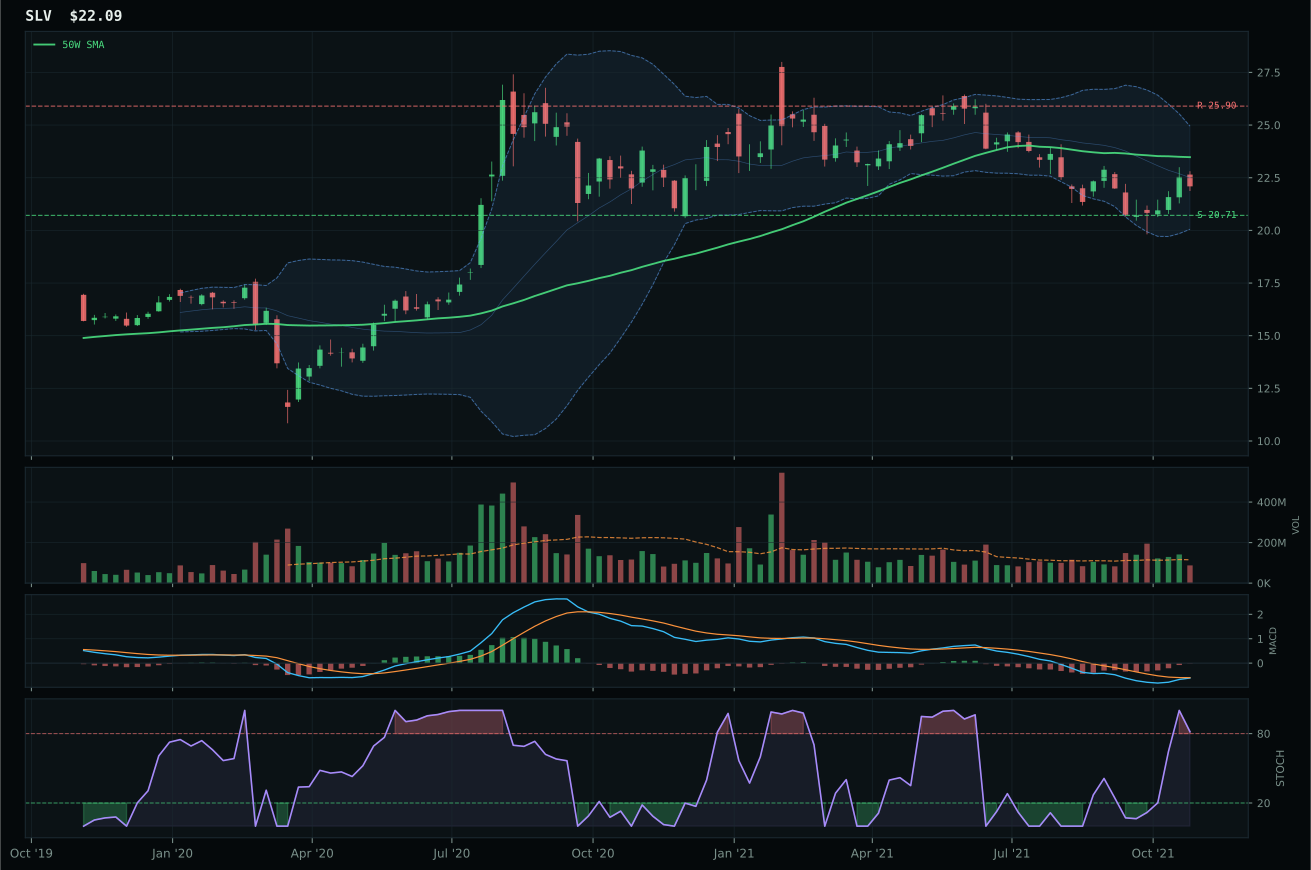
SLV has a neutral structure profile with -11.2% 13-week relative strength versus SPY.
A failed hold above support would weaken the setup.
Actionable but governed by invalidation levels.
GLD defeats GDX by 25.6 composite points on a pullback-into-support setup that creates precision timing and exceptional risk-reward asymmetry. Gold sits 1.3% below its 50-week moving average at a support level of 163.30, placing it in the deep retracement / value zone near the 0.618 Fibonacci level — a textbook repair zone for monetary hedges. GLD's timing score reaches 100.0/100 because price is near the moving average, MACD is improving, and the Fibonacci structure provides a defined invalidation floor. The risk-reward registers at 98.0/100 with just 2.1% downside to support and 6.6% upside to resistance, creating a favorable geometry for capital deployment. GDX, the runner-up, carries a bullish MACD and stronger momentum (100.0/100 score) but sits in a neutral structure near the 52-week low, far from the precision positioning that GLD offers. Category-relative strength favors GLD at 4.7% versus GDX's -2.7%, confirming that the gold equity complex is rotating toward bullion-linked exposure over leveraged miners.
Precious Metals receives 5% at tier-2 despite a 50.1 category score, held in the portfolio largely on macro narrative rather than technical urgency. The category-level macro fit is a modest 53.0/100 with only dollar pressure (+3) as a meaningful tailwind; credit stress and inflation pressure do not activate category-specific descriptors. GLD's own technical evidence is 66.0/100, below the tier-1 threshold, yet the allocation persists because monetary hedges serve a structural portfolio role in transition regimes where credit stress is active. The setup is mean-reversion positioned, not trending accumulation, meaning this slot functions as a defined-risk accumulation point rather than a conviction push. To earn top-2 status, precious metals would require either a credit stress intensification (which would elevate safe-haven demand) or a break below 163.30 that would force a decision. Current weighting reflects patient positioning ahead of potential escalation.
Defense & Aerospace — ITA
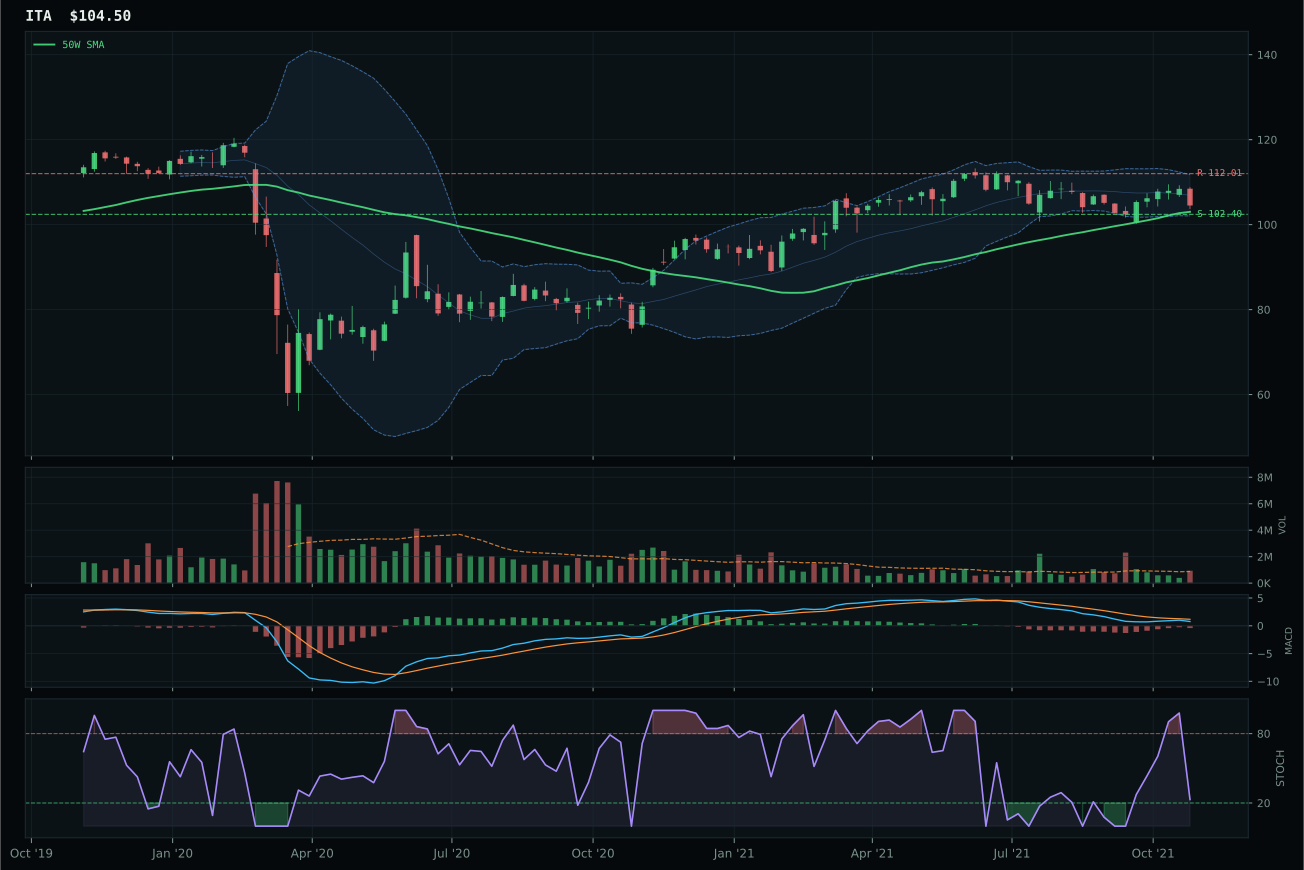
ITA has a pullback into support profile with -7.9% 13-week relative strength versus SPY.
A failed hold above support would weaken the setup.
Actionable but governed by invalidation levels.
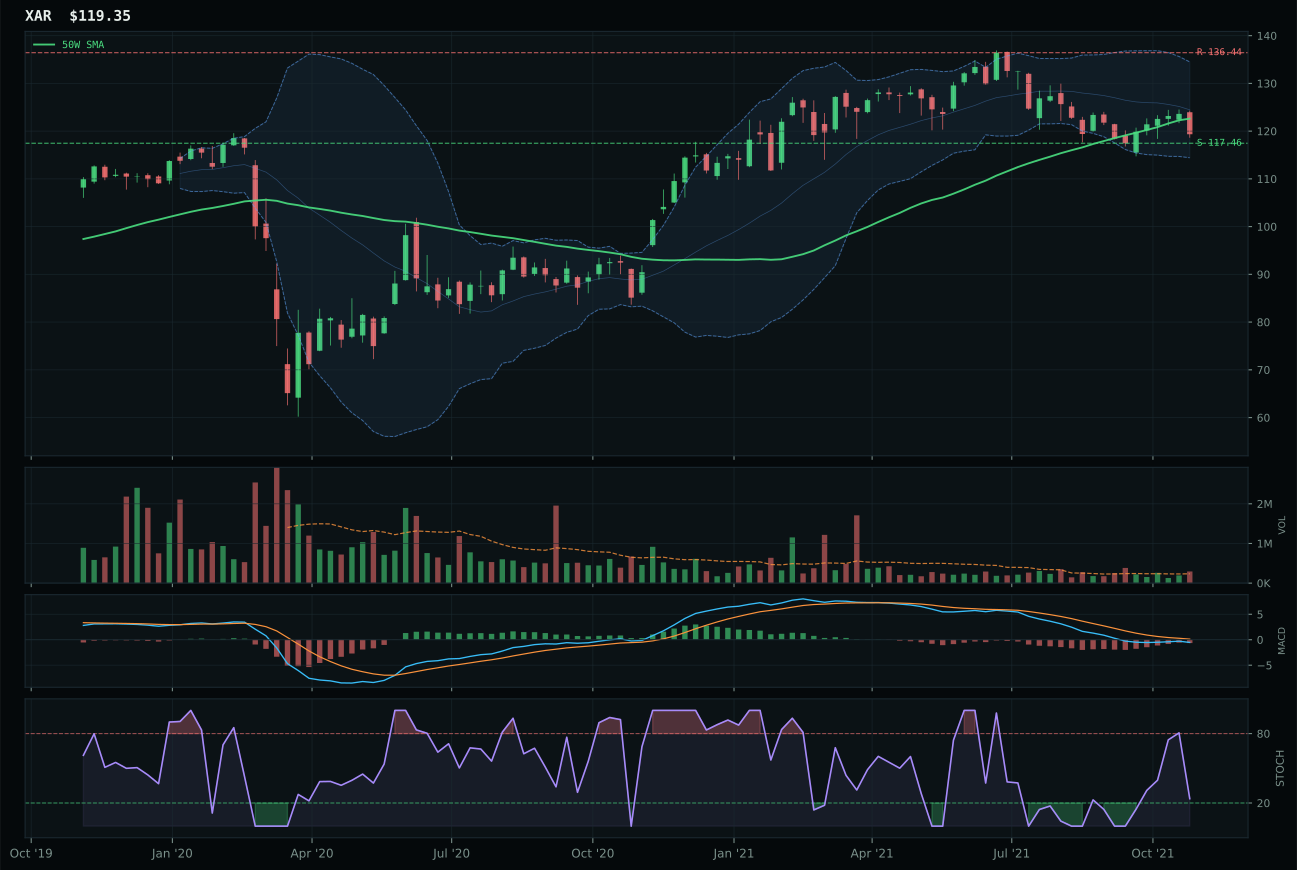
XAR has a pullback into support profile with -11.0% 13-week relative strength versus SPY.
A failed hold above support would weaken the setup.
Actionable but governed by invalidation levels.
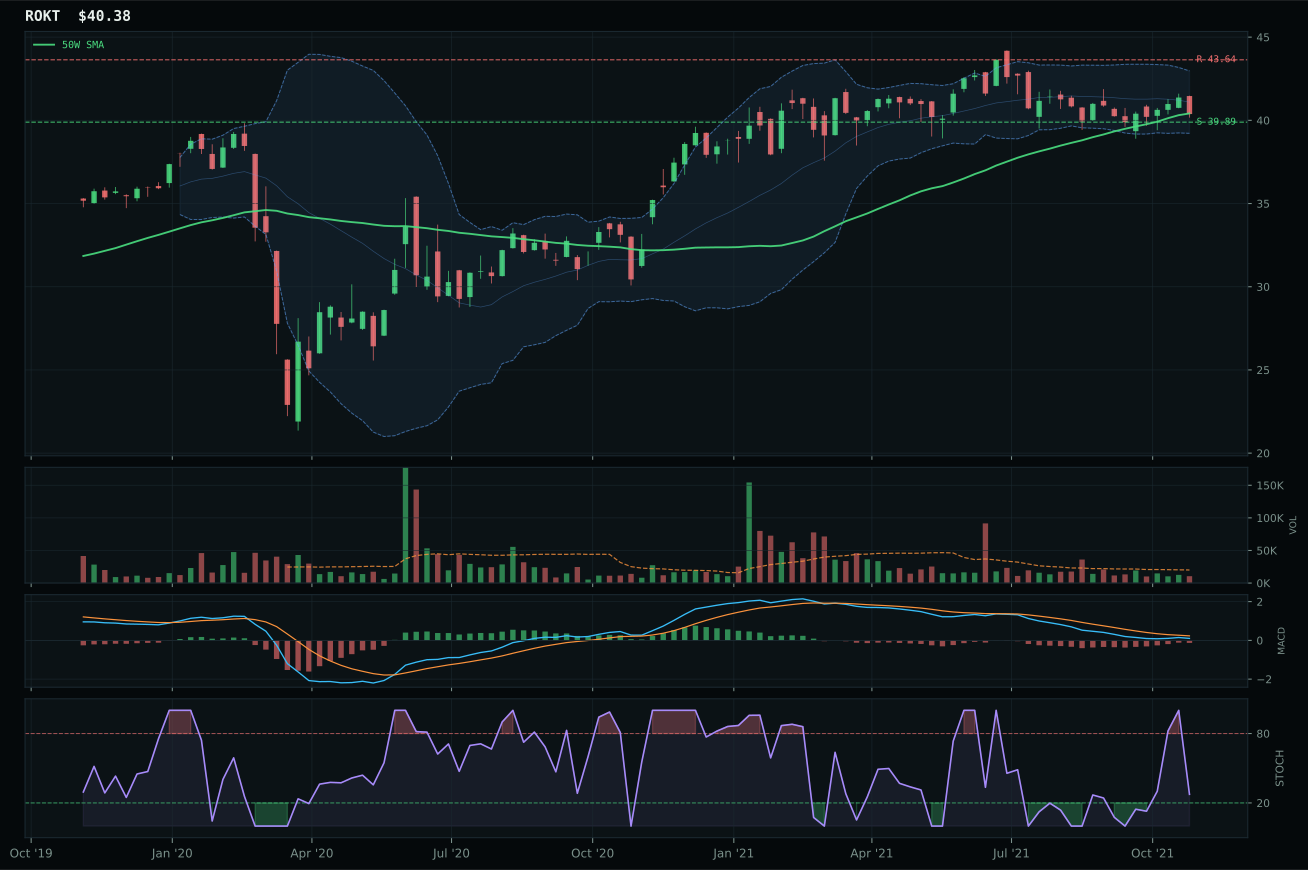
ROKT has a pullback into support profile with -7.3% 13-week relative strength versus SPY.
A failed hold above support would weaken the setup.
Tracked, but not top-2 eligible because: .
ITA claims the category at 42.4 despite a 13W return of -3.2% and -7.9% relative strength to SPY, winning on a textbook mean-reversion setup that competitors cannot replicate. Price has pulled into support near 102.40 — just 1.4% below the 50-week moving average — creating a high-probability invalidation point and a perfect entry-risk asymmetry. The timing score of 100.0/100 reflects this precision: MACD is bearish but improving, stochastic RSI is falling/neutral at 0.23, and Fibonacci geometry places price in the upper retracement zone where reversals often print. ITA's risk-reward reaches 90.0/100 because the upside to 112.01 resistance is modest but the downside to 102.40 support is only 2.1% — a 4:1 favorable asymmetry. XAR lost on category-relative strength (-3.0% vs 0.0%), meaning ITA's peers within the defense basket are rotating away from the broader aero names into the more durable defense-prime positioning.
Defense & Aerospace holds 5% as a tier-2 sleeve, supported by a 64.0/100 macro fit that benefits from the transition regime (+3), broad market bear (+6), and dollar pressure (+3). The category's technical ETF evidence is modest at 66.8 for the representative, yet macro support keeps it funded because military spending and defense cycle dynamics resist dollar strength and equities-bear conditions. The setup is explicitly a pullback into support rather than a trending move, which means the allocation slot functions as a tactical rotation hedge rather than a conviction growth bet. To move into top-2, the category would need either a technical confirmation that the support holds and price re-trends, or a macro shift that elevates defense cycle narratives above energy scarcity or uranium stories. Current positioning is patient accumulation at a defined level, not aggressive overweight.
AI — SMH
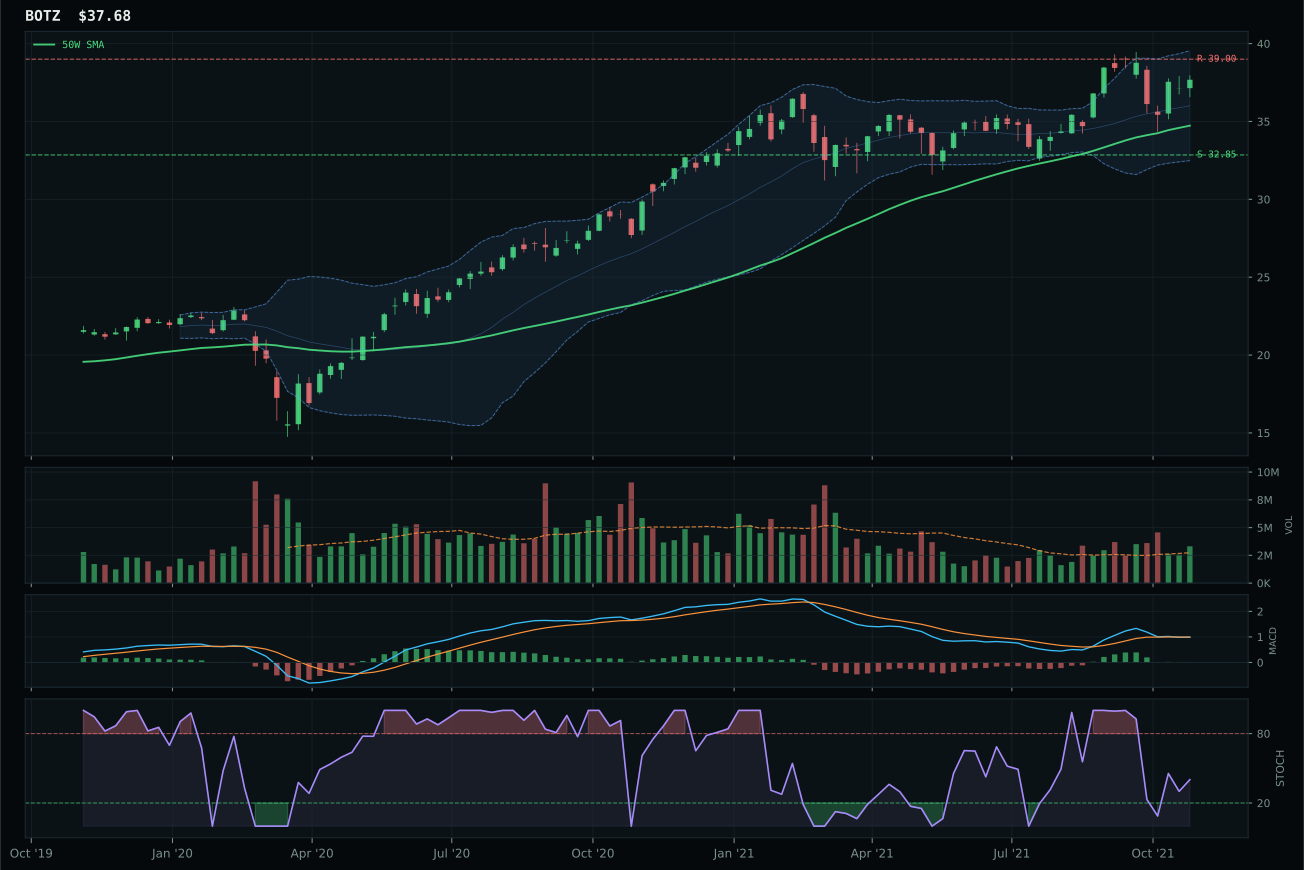
BOTZ has a neutral structure profile with 6.1% 13-week relative strength versus SPY.
A failed hold above support would weaken the setup.
Actionable but governed by invalidation levels.
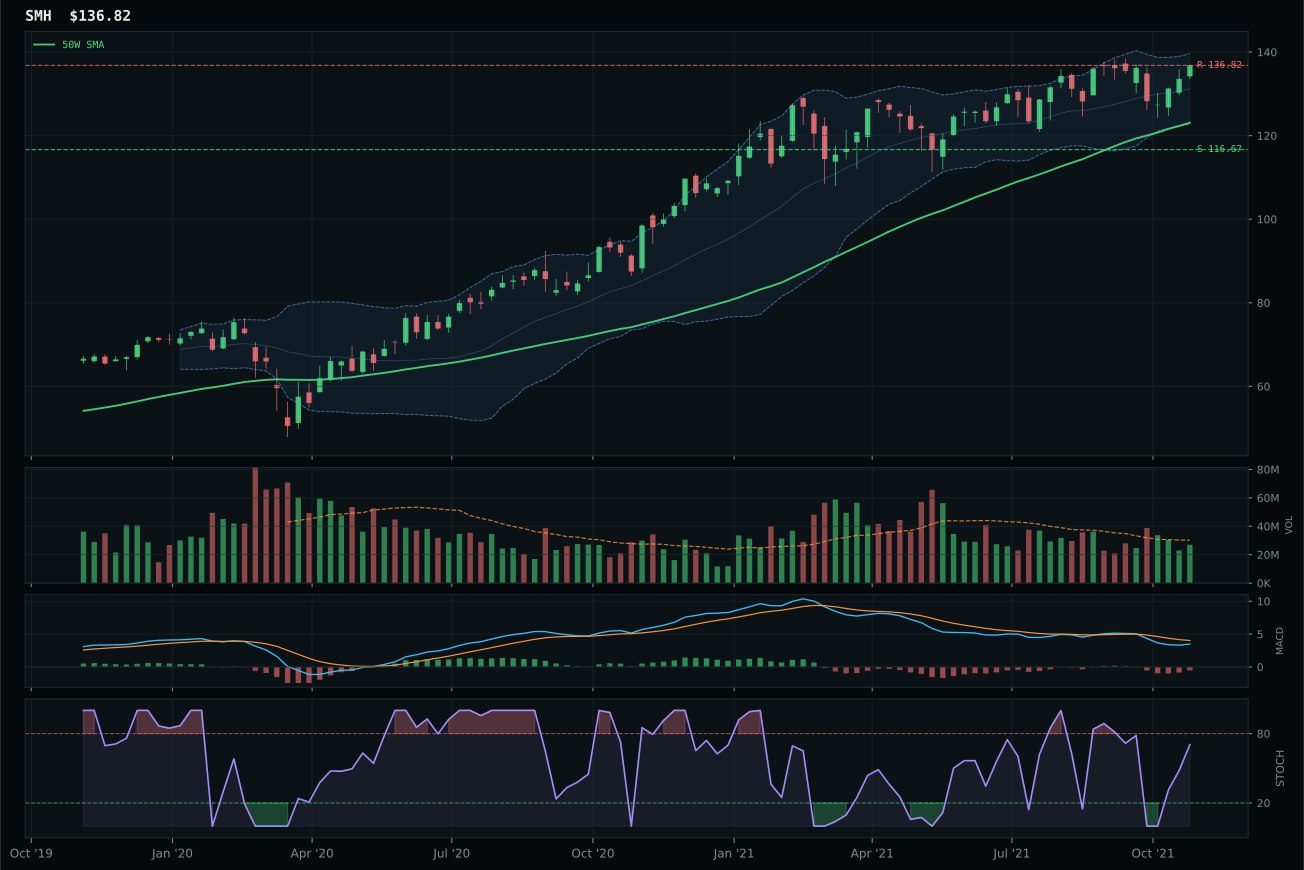
SMH has a neutral structure profile with -0.7% 13-week relative strength versus SPY.
A failed hold above support would weaken the setup.
Actionable but governed by invalidation levels.
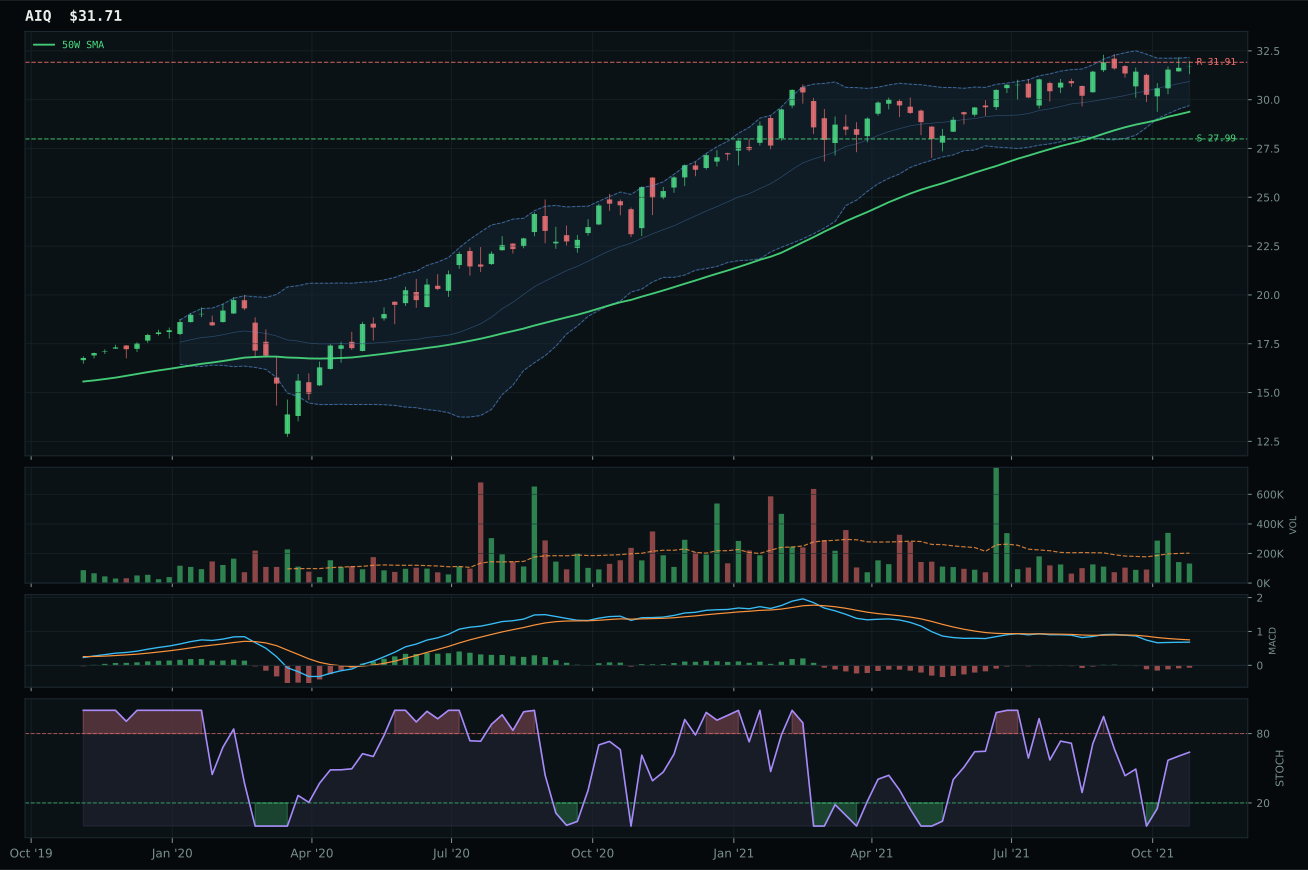
AIQ has a neutral structure profile with -0.5% 13-week relative strength versus SPY.
A failed hold above support would weaken the setup.
Tracked, but not top-2 eligible because: .
SMH emerges as category representative despite a 28.4 final score that reflects broad weakness, not a confident setup. The semiconductor proxy sits above both the 50-week and 200-week moving averages with a 0.6% slope, but its 4.0% thirteen-week return and -0.7% relative strength to SPY signal demand exhaustion rather than accumulation. BOTZ, the runner-up, posted a superior technical evidence score of 67.2 versus SMH's 45.2, delivering 10.8% thirteen-week performance and 6.1% relative strength, yet lost on the margin because SMH's slightly better risk-reward profile (45.3 vs 49.0 on r/r, though both are weak) and timing positioning gave it a 9.7-point edge in the composite ranking. The real story is that neither setup merits capital allocation: MACD is bearish/weakening across the basket, volume is neutral to thin, and stochastic RSI sits in an indecisive mid-zone.
AI is excluded entirely this week at 0% allocation, ranked 9th or 10th within the portfolio framework. The 28.4 category score reflects a macro regime fundamentally hostile to cyclical AI and semiconductor demand: credit stress (-8), broad market bear (-8), and dollar pressure (-4) combine to a -20 descriptor headwind that no amount of technical cleanliness can overcome. Category-level macro fit sits at just 30.0/100, the weakest signal in the portfolio architecture. The technical evidence from BOTZ (67.2) would normally warrant consideration, but the system's macro-first weighting at 38% of category reasoning ensures that without narrative tailwinds — energy scarcity, supply shortage, real asset sponsorship — even strong charts remain unfunded. For AI to re-enter the allocation, credit stress would need to ease or the broad market bear descriptor to flip; neither is imminent given the transition regime.
Emerging Markets — INDA
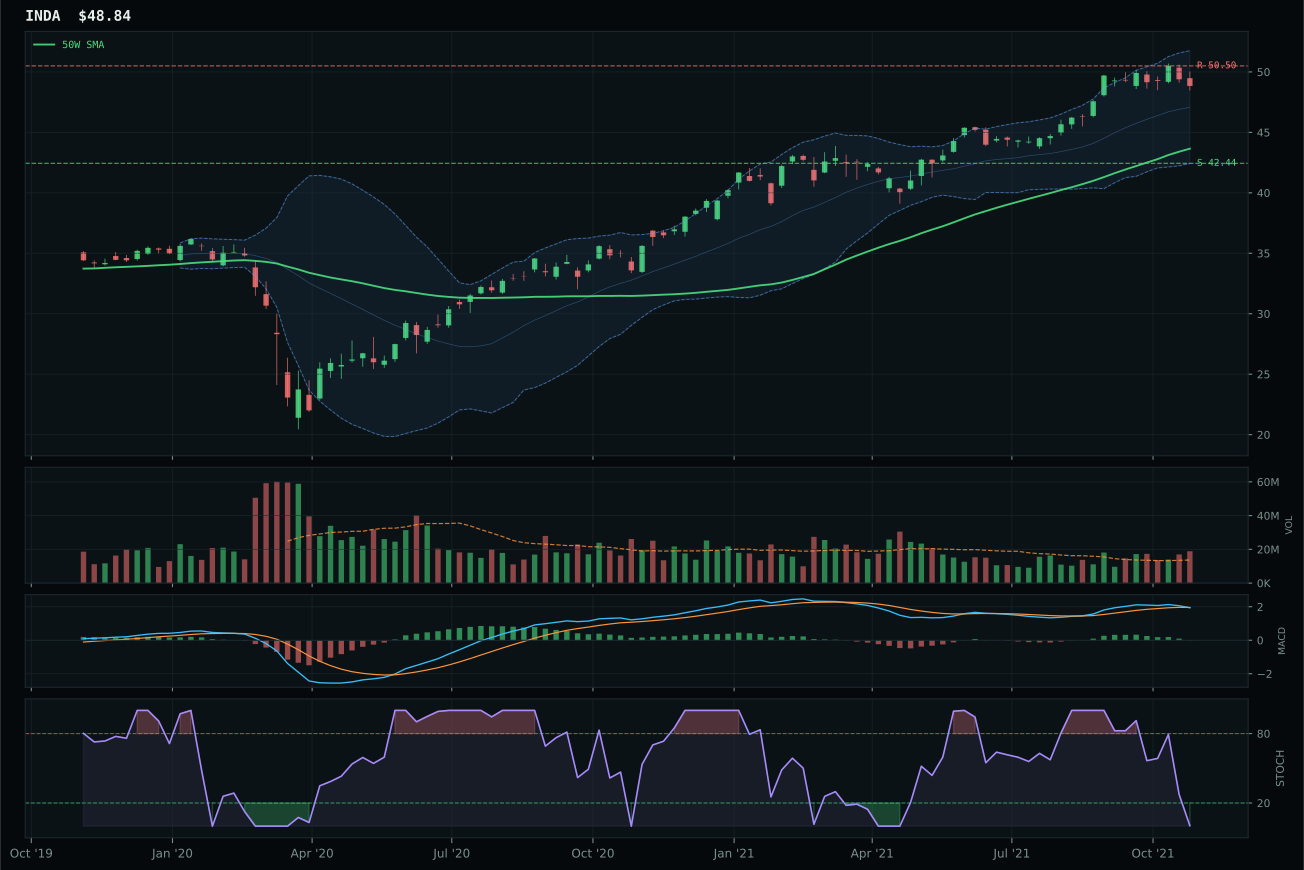
INDA has a neutral structure profile with 4.6% 13-week relative strength versus SPY.
A failed hold above support would weaken the setup.
Actionable but governed by invalidation levels.
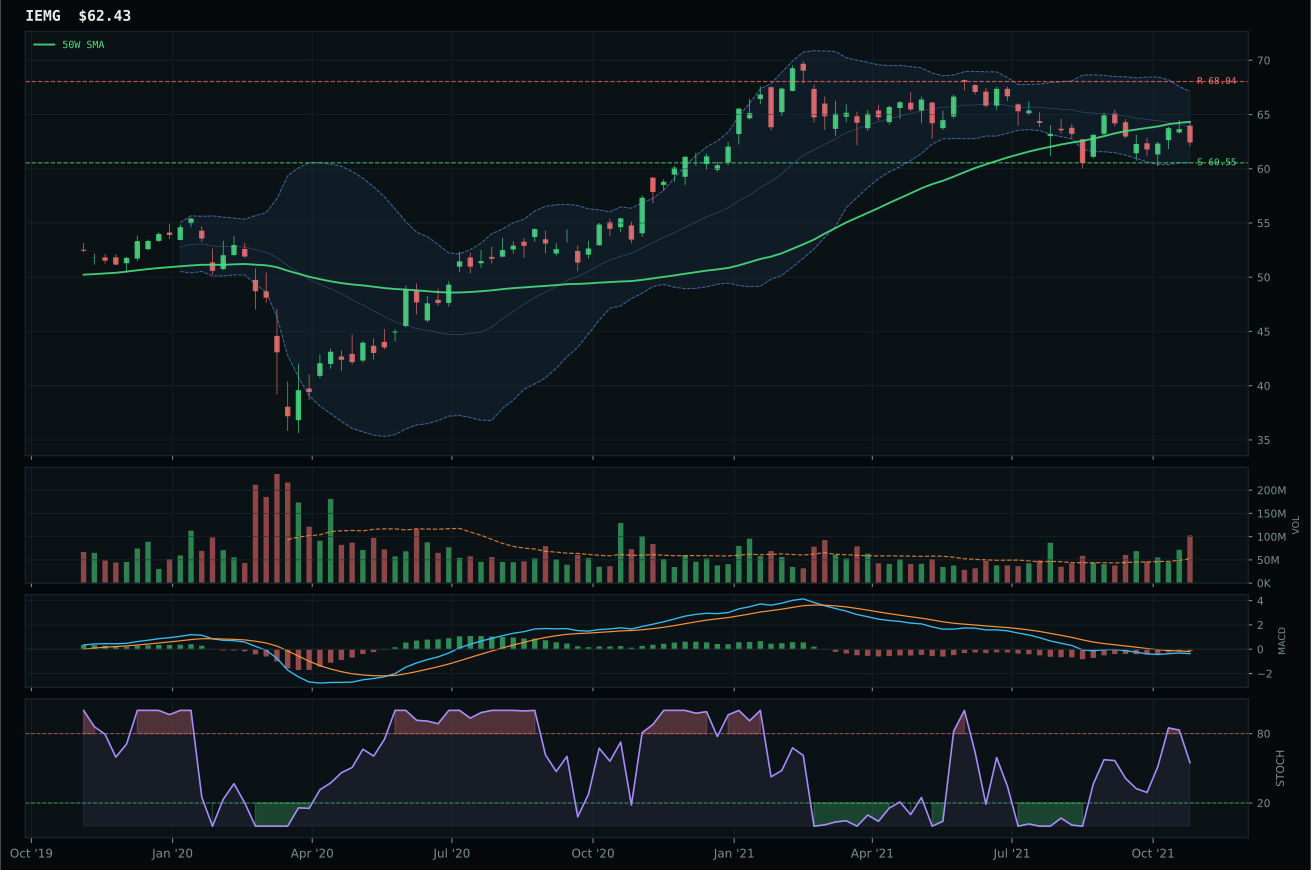
IEMG has a pullback into support profile with -6.0% 13-week relative strength versus SPY.
A failed hold above support would weaken the setup.
Actionable but governed by invalidation levels.
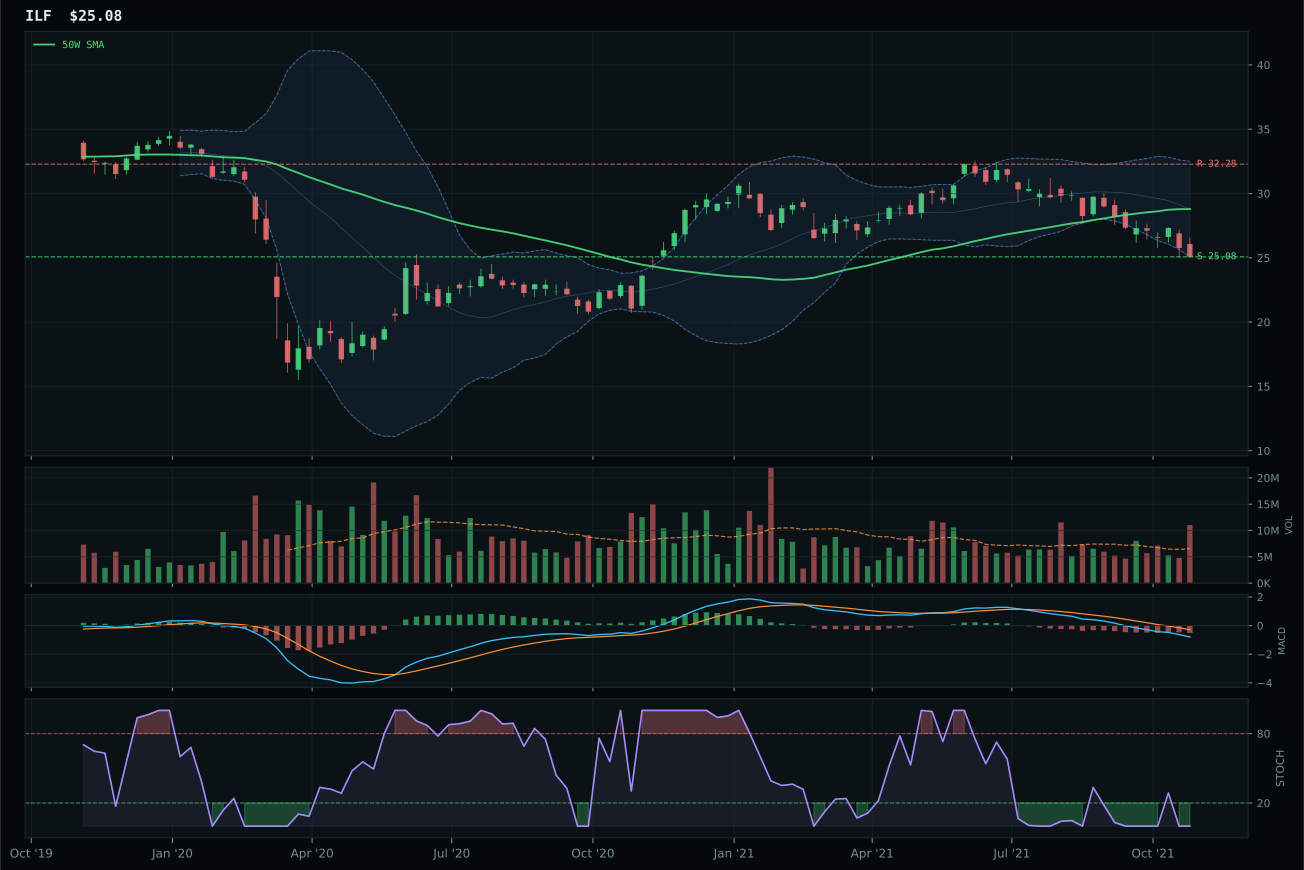
ILF has a pullback into support profile with -20.3% 13-week relative strength versus SPY.
Extension and support failure are the main tactical risks.
Tracked, but not top-2 eligible because: structurally broken.
INDA wins a category score of 4.5 that ranks it 9th or 10th in portfolio priority, defeating IEMG by just 1.7 composite points in what amounts to a consolation prize. India's quality-growth proxy sits 11.9% above its 50-week moving average with 9.3% thirteen-week performance and 4.6% relative strength to SPY, yet carries bearish/weakening MACD and oversold stochastic RSI at 0.00 — a setup that looks like capitulation rather than accumulation. IEMG's pullback-into-support structure and bullish/improving MACD appear technically superior, but the distribution pressure on volume (versus INDA's above-average participation at 1.38x) and -6.0% relative strength to SPY signal demand exhaustion in the broad emerging-market complex. INDA's 10.5% category-relative strength keeps it afloat as the representative, but the margin of victory is meaningless when the entire category is crushed by macro headwinds.
Emerging Markets receives 0% allocation this week, excluded entirely from the portfolio framework due to a catastrophic 4.5 category score driven by hostile macro descriptors: dollar pressure (-14), credit stress (-10), and broad market bear (-9) combine to a -33 descriptor headwind. The category-level macro fit stands at 17.0/100, the weakest signal in the entire ten-category architecture. Even INDA's 57.6% technical evidence cannot overcome the structural weight of dollar strength and credit stress on EM valuations and capital flows. This is not a marginal call or a timing decision; it is an explicit exclusion predicated on macro regime. For Emerging Markets to re-enter the allocation at any tier, either the dollar pressure descriptor must flip (requiring a DXY rollover) or credit stress must ease materially. Current portfolio positioning reflects a view that EM weakness is directional, not cyclical, and that capital should rotate into commodity real assets and energy names rather than cyclical equity exposure in currencies under pressure.