
2021-10-22
Informational purposes only. The content in this report, including allocations, analysis, and commentary, is provided solely for informational and educational purposes. It does not constitute financial advice, investment advice, trading advice, or any other type of advice. Past performance does not guarantee future results. Always conduct your own research and consult a qualified financial professional before making investment decisions.
Weekly Allocation
| Ticker | Category | Weight | Role |
|---|---|---|---|
| FSOL | 50% | Overlay | |
| XLE | Traditional Energy | 10% | Top-2 (10%) |
| URNM | Nuclear Energy | 10% | Top-2 (10%) |
| COPX | Industrial Metals | 5% | Tier-2 (5%) |
| INDA | Emerging Markets | 5% | Tier-2 (5%) |
| PAVE | Utilities & Infrastructure | 5% | Tier-2 (5%) |
| CIBR | Technology | 5% | Tier-2 (5%) |
| SLV | Precious Metals | 5% | Tier-2 (5%) |
| MOO | Agriculture & Livestock | 5% | Tier-2 (5%) |
Trade Instructions — Monday Open
Sell the tranche from 2021-09-24 (completing its 4-week hold). Buy the new tranche. Instructions show net portfolio changes — same-asset positions cancel, weight changes show the delta.
| Action | Ticker | Instruction |
|---|---|---|
| SELL | XLK | Sell 67% of XLK position (reduce 3.75% → 1.25%) |
| SELL | BOTZ | Sell entire BOTZ position (2.50% of portfolio) |
| SELL | IGF | Sell 33% of IGF position (reduce 3.75% → 2.50%) |
| SELL | ITA | Sell 25% of ITA position (reduce 5.00% → 3.75%) |
| BUY | URNM | Buy URNM — 16.67% of freed cash (adds 1.25% to portfolio) |
| BUY | CIBR | Buy CIBR — 16.67% of freed cash (adds 1.25% to portfolio) |
| BUY | XLE | Buy XLE — 33.33% of freed cash (adds 2.50% to portfolio) |
| BUY | PAVE | Buy PAVE — 16.67% of freed cash (adds 1.25% to portfolio) |
| BUY | SLV | Buy SLV — 16.67% of freed cash (adds 1.25% to portfolio) |
Current Portfolio After Trade
Combined holdings across all 4 active tranches. Each tranche is 25% of the portfolio.
| Ticker | % of Portfolio | Weight Bar |
|---|---|---|
| FSOL | 50.00% | |
| COPX | 6.25% | |
| URNM | 6.25% | |
| FCG | 5.00% | |
| WEAT | 5.00% | |
| XLE | 5.00% | |
| ITA | 3.75% | |
| CIBR | 3.75% | |
| IGF | 2.50% | |
| INDA | 2.50% | |
| SMH | 2.50% | |
| XLK | 1.25% | |
| GDX | 1.25% | |
| URA | 1.25% | |
| PAVE | 1.25% | |
| SLV | 1.25% | |
| MOO | 1.25% |
Macro Regime — Transition / Mixed
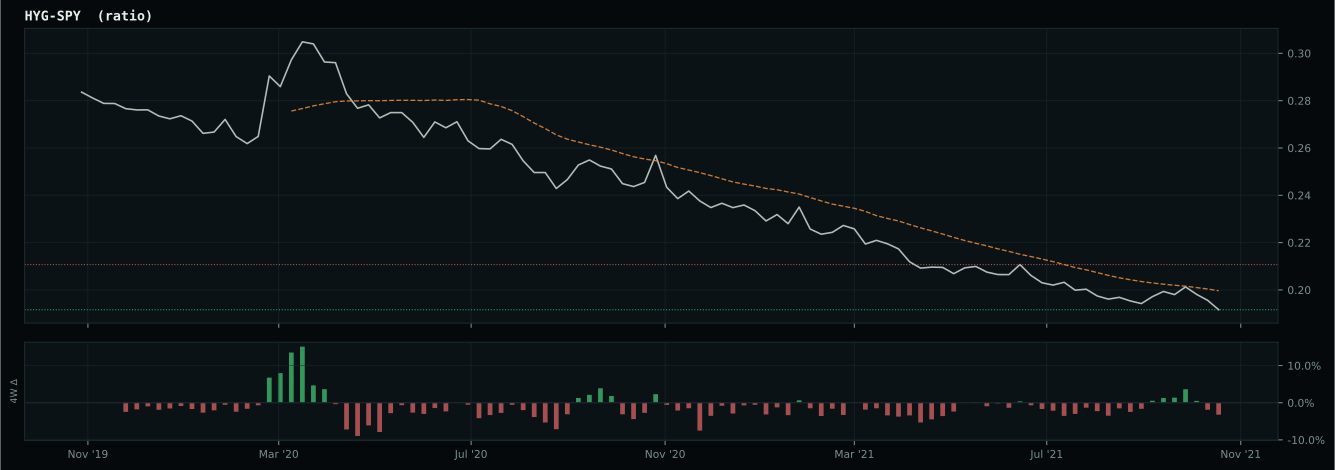
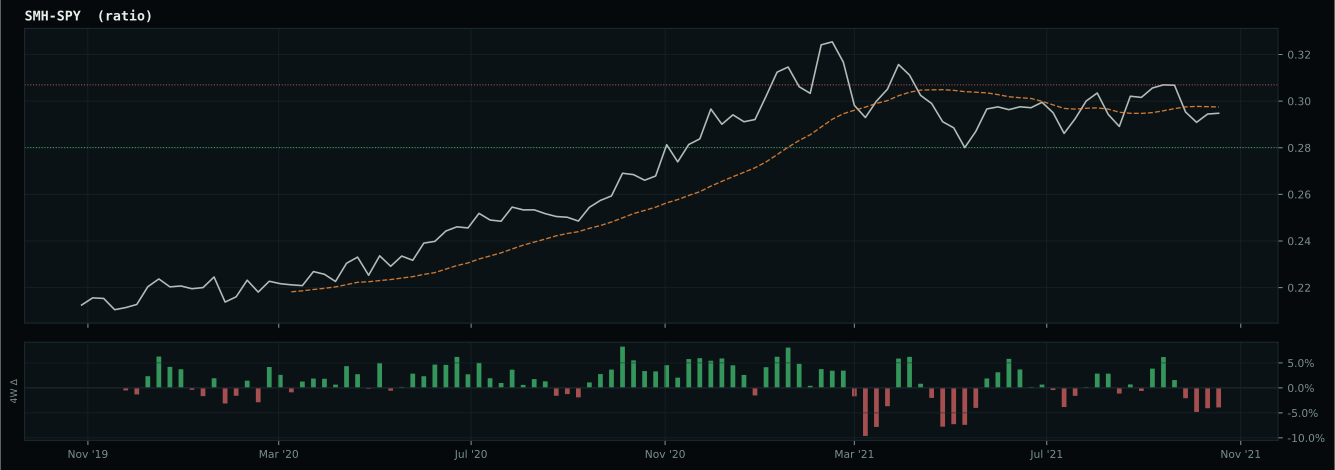
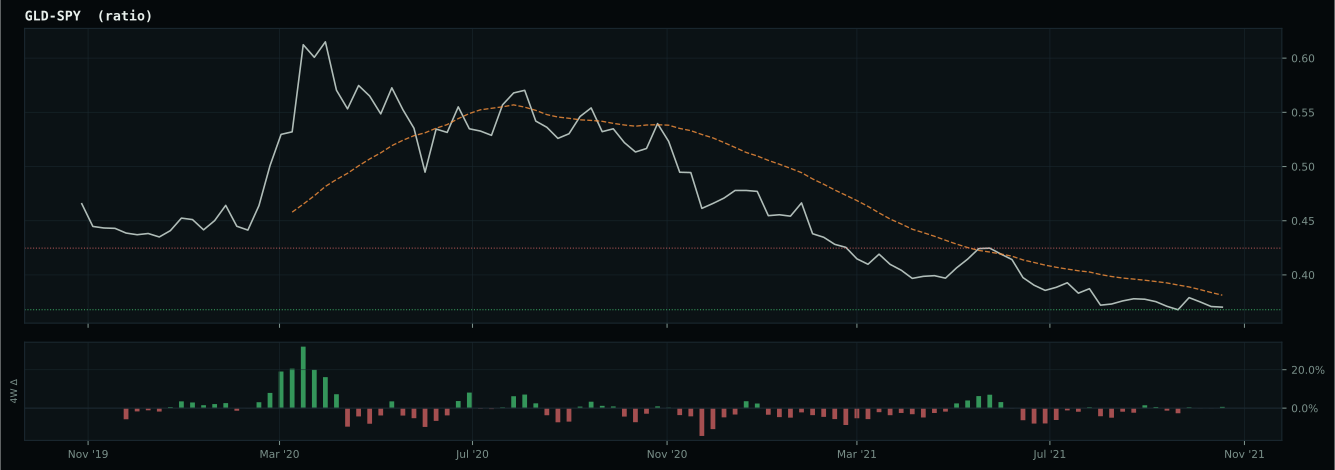
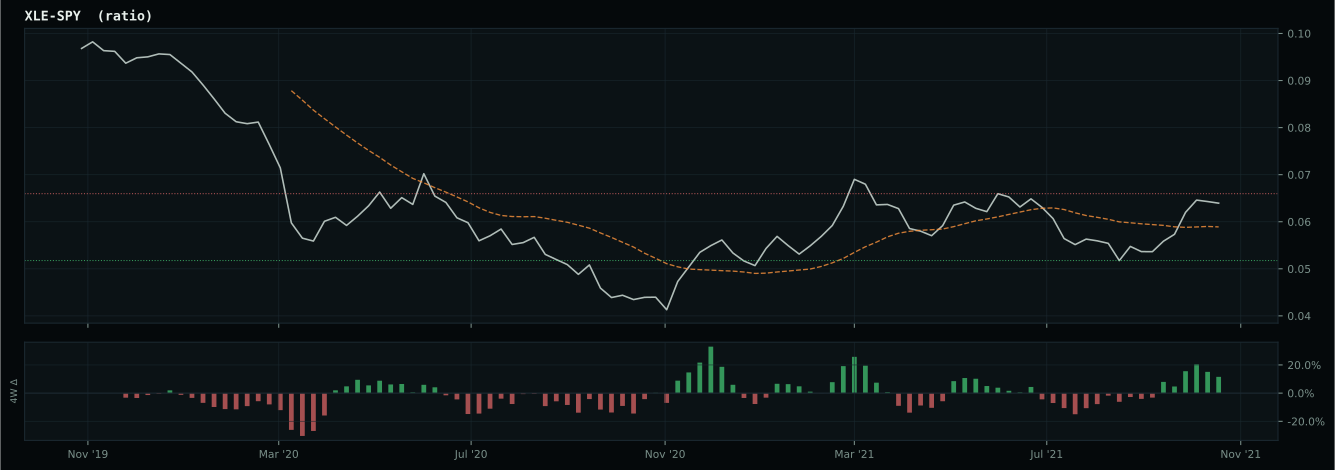
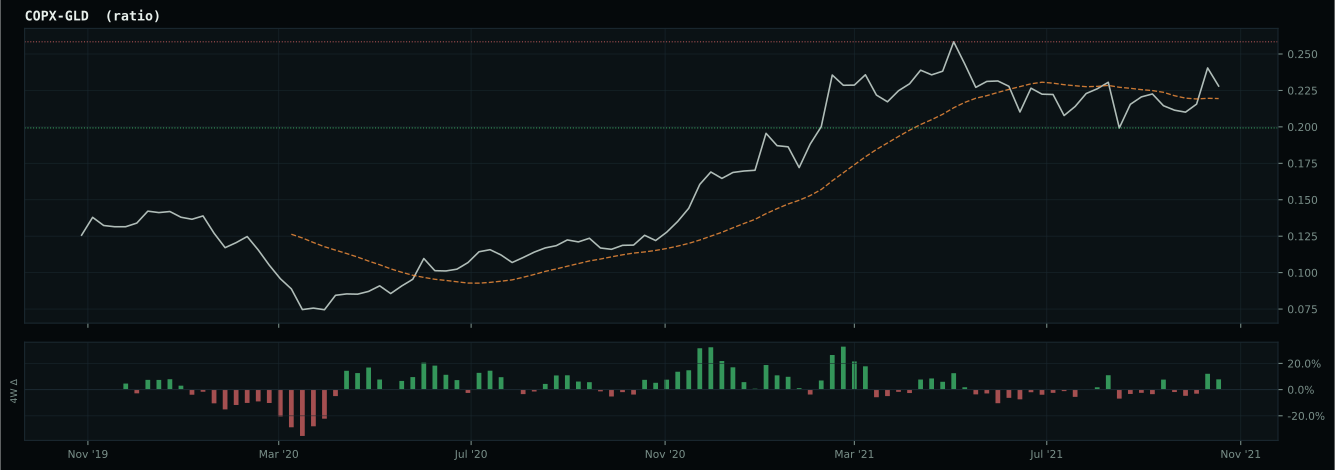
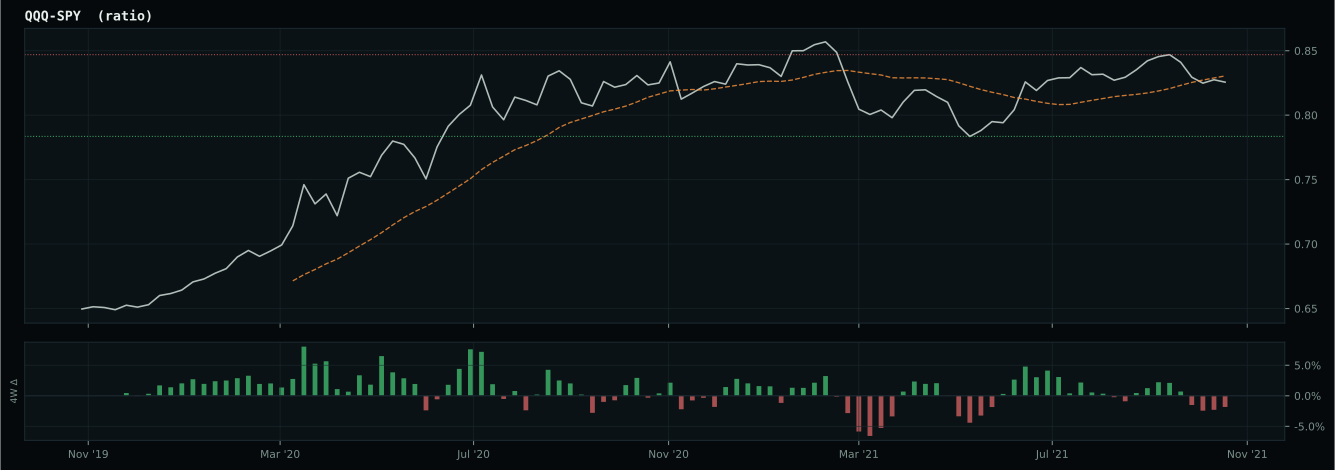
Macro Evidence Charts
Market-implied signals behind the macro regime scores. Each ratio compares two assets; the direction and slope of the ratio is what the macro engine reads.
Crypto Regime — AltSeason
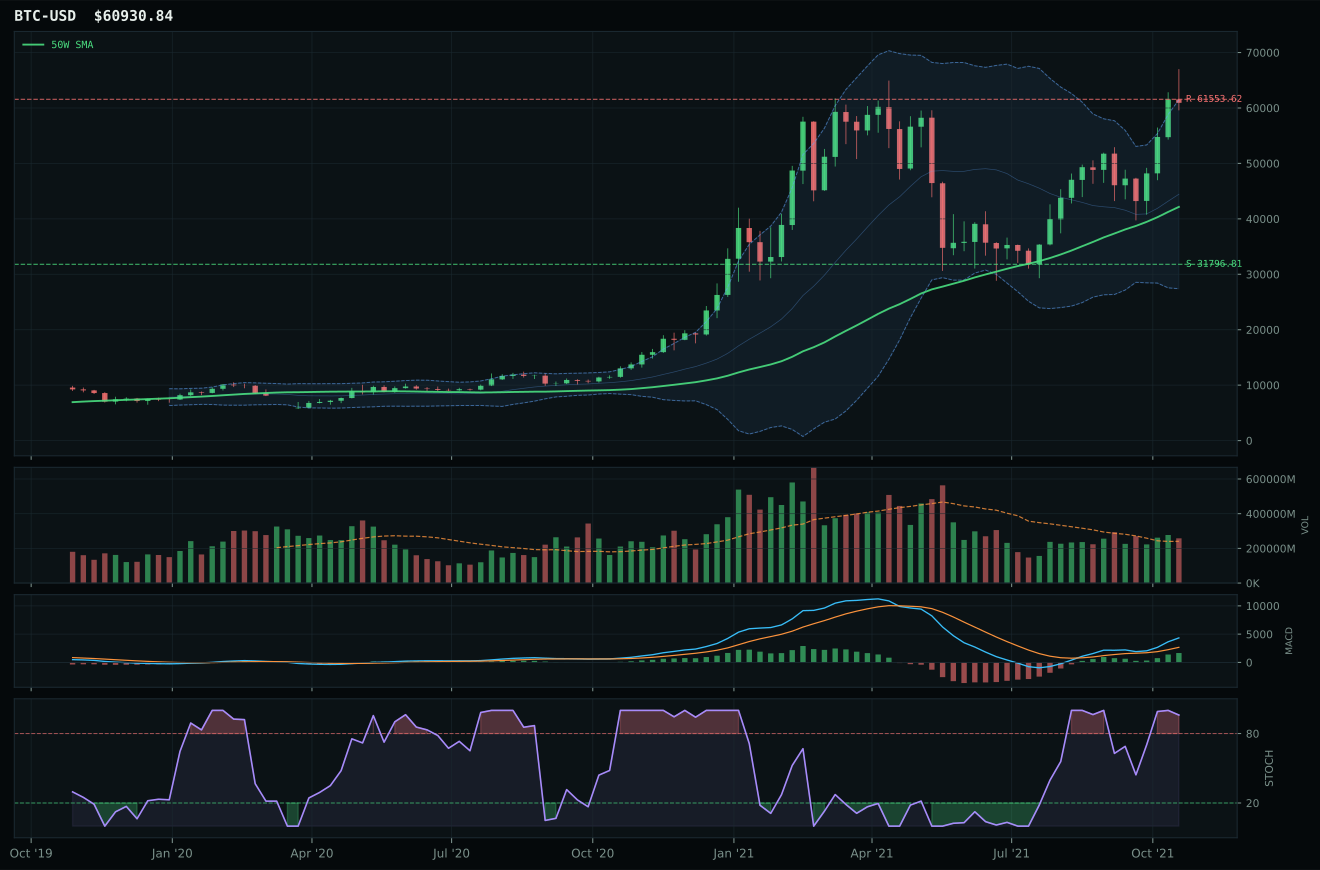
ValueBTC not armed: BTC has not made the first post-breakdown touch of the 200W buy zone after losing the 50W
TrendBTC confirmed: 2 consecutive closes above rising/flat 50W SMA
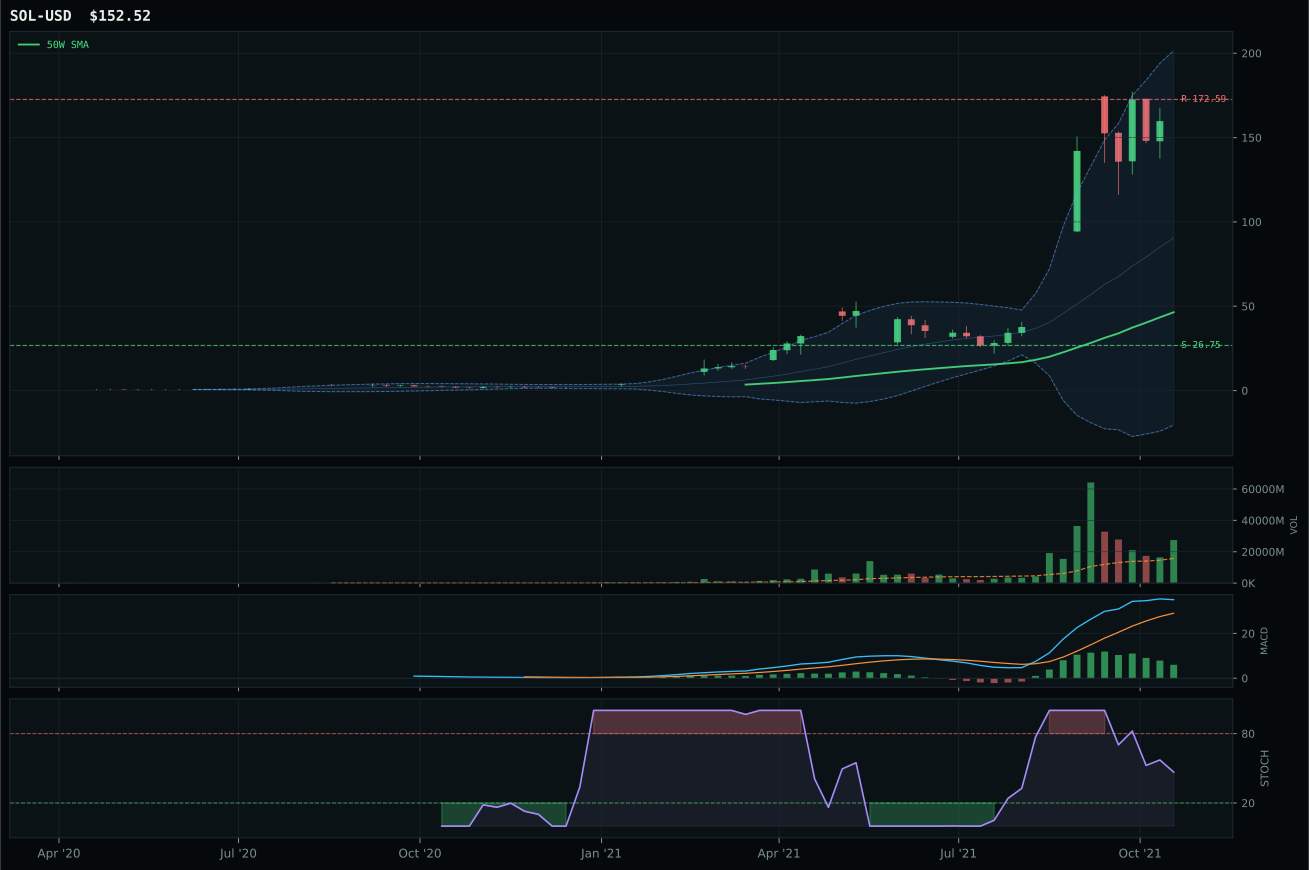
all available AltSeason conditions pass; missing optional confirmations skipped
Category Rankings
| Rank | Category | Winner | Score | Alloc | 4W Ret | Peers (4W) |
|---|---|---|---|---|---|---|
| 1 | Traditional Energy | XLE | 83.1 | 20% | -6.94% | FCG -8.9% · XOP -9.7% |
| 2 | Nuclear Energy | URNM | 68.8 | 20% | -6.99% | URA -5.5% · NLR -3.1% |
| 3 | Industrial Metals | COPX | 59.8 | 10% | -6.57% | PICK -4.6% · REMX +5.8% |
| 4 | Emerging Markets | INDA | 56.0 | 10% | -1.27% | IEMG -2.4% · ILF -6.0% |
| 5 | Utilities & Infrastructure | PAVE | 55.5 | 10% | +5.15% | IGF -3.1% · XLU +0.1% |
| 6 | Technology | CIBR | 52.8 | 10% | +2.09% | IGV +1.3% · XLK +8.2% |
| 7 | Precious Metals | SLV | 52.3 | 10% | +0.09% | GDX -1.3% · GLD +0.7% |
| 8 | Agriculture & Livestock | MOO | 50.6 | 10% | -0.24% | WEAT +9.5% · VEGI +0.1% |
| 9 | Defense & Aerospace | XAR | 50.1 | 0% | -3.73% | ITA -3.7% · ROKT -1.0% |
| 10 | AI | SMH | 46.0 | 0% | +16.85% | BOTZ +3.3% · AIQ +4.7% |
Traditional Energy — XLE
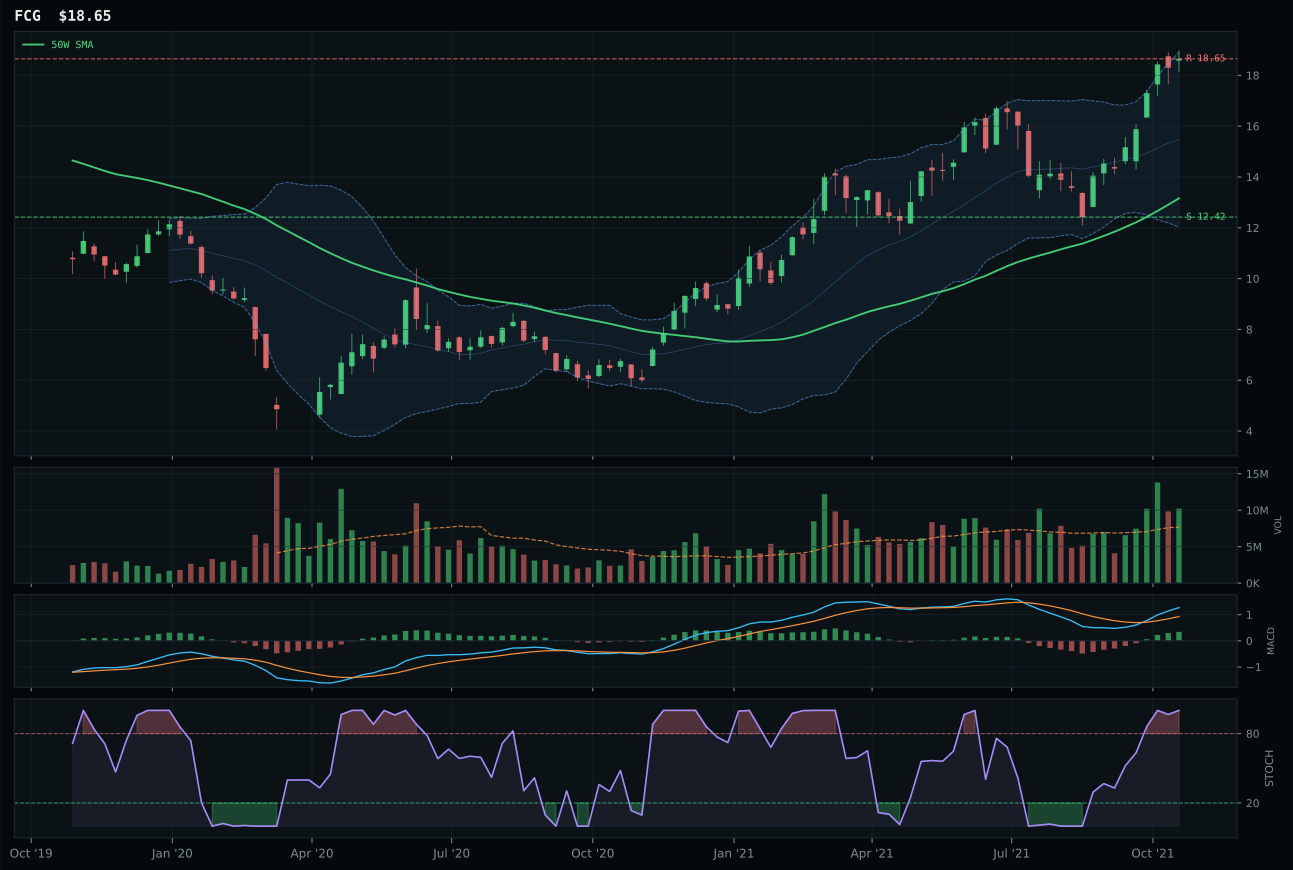
FCG has a vertical extension profile with 29.4% 13-week relative strength versus SPY.
A failed hold above support would weaken the setup.
Actionable but governed by invalidation levels.
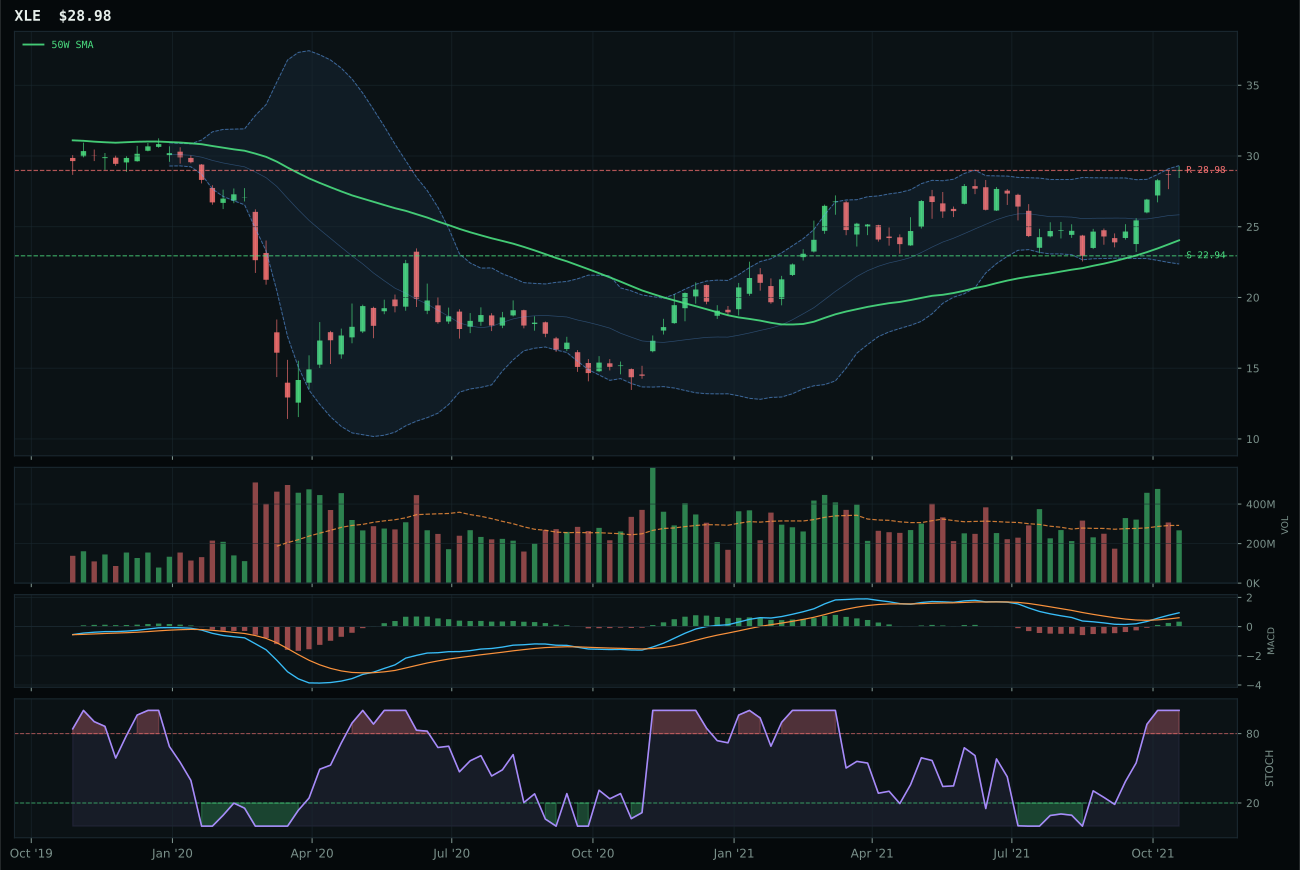
XLE has a vertical extension profile with 16.4% 13-week relative strength versus SPY.
A failed hold above support would weaken the setup.
Actionable but governed by invalidation levels.
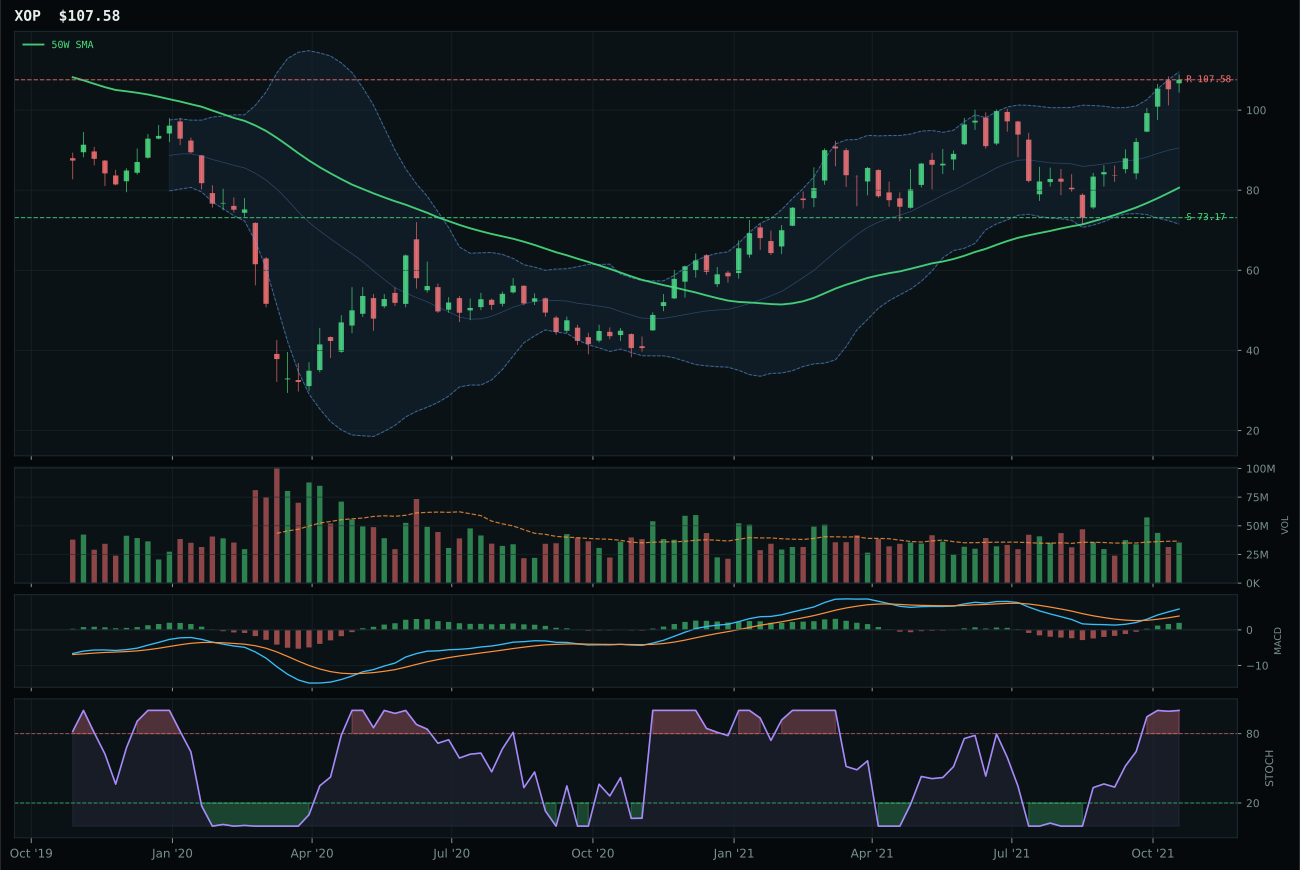
XOP has a vertical extension profile with 27.9% 13-week relative strength versus SPY.
A failed hold above support would weaken the setup.
Actionable but governed by invalidation levels.
XLE captured the Traditional Energy top-2 slot with an 83.1 composite score—the highest category rank in the allocation—by delivering a rare combination of perfect trend confirmation (100/100) and maxed-out momentum (100/100) despite severe extension risk. Its 19.4% 13-week return and 16.4% SPY relative strength reflect the structural energy scarcity narrative now crystallizing in real supply deficits and geopolitical premium, not a technical anomaly. FCG's momentum is equally explosive at 100/100 and its SPY relative strength is superior at 29.4%, but XLE wins because risk-reward is measurably better (42.5/100 versus 39.9/100) and structure is cleaner (75.7/100 versus 74.2/100). Critically, XLE is positioned 20.5% above the 50-week line while FCG is extended 41.7%, a difference that matters when MACD is bullish but entry risk is mountainous—XLE provides slightly more breathing room for tactical pullbacks. Both show overbought stochastic RSI at 1.00, but XLE's neutral volume (0.91x) versus FCG's above-average participation (at higher prices) suggests XLE is capturing late-stage buyers at a more reasonable extraction price.
Traditional Energy earns 10% allocation as a top-2 overweight, reflecting the highest category conviction in the portfolio. The 85/100 macro fit is exceptional, driven by energy scarcity (+16), inflation pressure (+10), supply shortage (+9), and real asset sponsorship (+7), with only credit stress (-7) applying a modest headwind. This category is not a trading bounce; it is a structural reordering of energy markets driven by underinvestment in fossil fuels, renewable transition delays, and geopolitical fragmentation. XLE's perfect trend and momentum scores anchor the position, yet the allocator is pricing in meaningful extension risk (20.5% above 50-week) and offering downside protection at 22.94 support—a 26.3% buffer. The 50% overlay applied to this portfolio halves the effective allocation to 5%, making the true position size 10% at full scale. Energy would maintain or expand its top-2 rank only if XLE respects support on any pullback, confirming institutional holders are accumulating rather than rotating—any breakdown below 22.94 would signal the macro thesis is failing and force reallocation to defensive alternatives.
Nuclear Energy — URNM
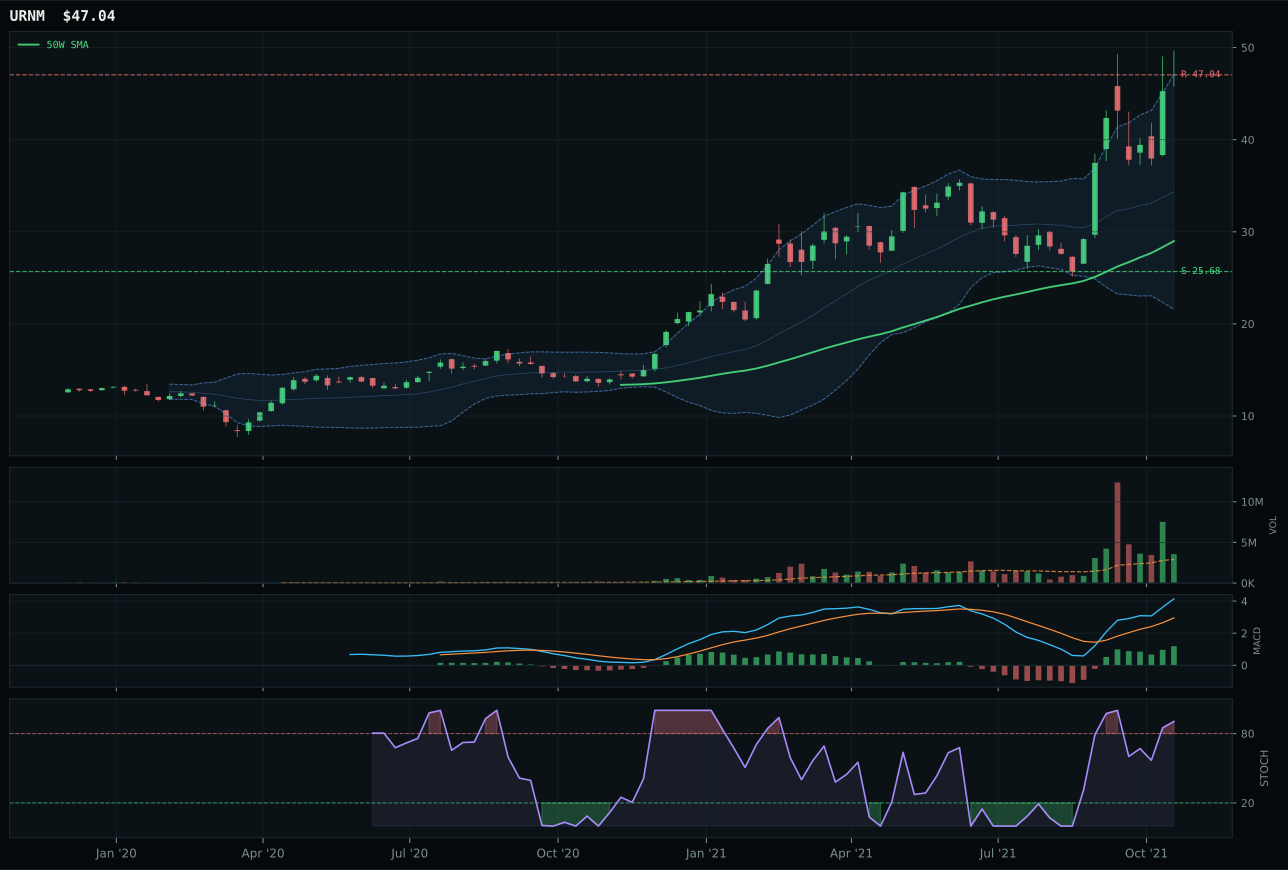
URNM has a vertical extension profile with 62.2% 13-week relative strength versus SPY.
A failed hold above support would weaken the setup.
Actionable but governed by invalidation levels.
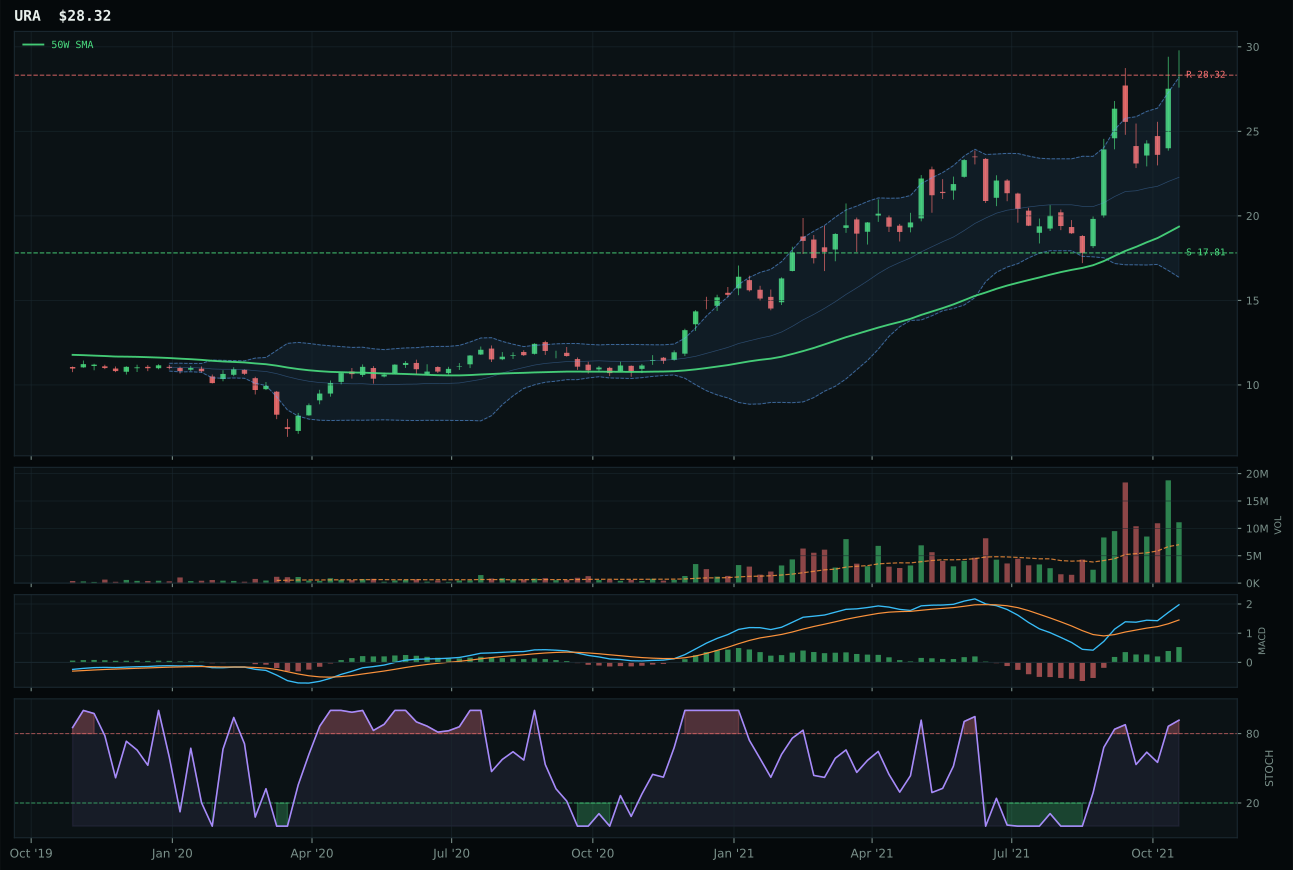
URA has a vertical extension profile with 43.1% 13-week relative strength versus SPY.
A failed hold above support would weaken the setup.
Actionable but governed by invalidation levels.
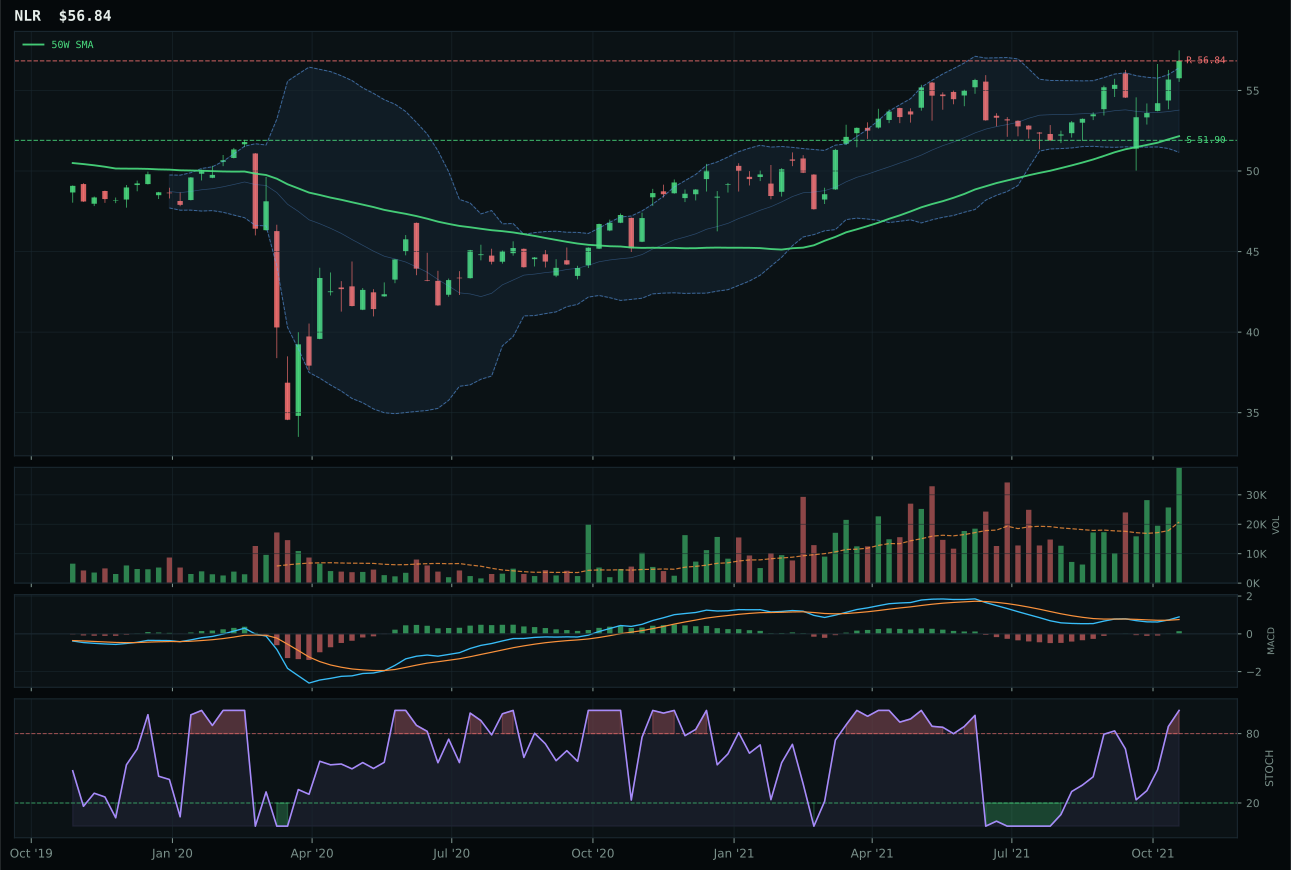
NLR has a neutral structure profile with 5.6% 13-week relative strength versus SPY.
A failed hold above support would weaken the setup.
Tracked, but not top-2 eligible because: .
URNM clinched the Nuclear Energy top-2 position with a 68.8 composite score by showcasing unmatched persistence (100/100 persistence score) and volume-price confirmation (84.7/100) despite being dangerously extended. Its 65.2% 13-week return and 62.2% SPY relative strength are extraordinary, yet they reflect genuine institutional accumulation into uranium supply scarcity, not retail mania. URA's technical evidence score is higher (91.3/100 versus 81.4/100), and its 43.1% SPY relative strength is respectable, yet it trails URNM on the critical category-relative strength measure—0.0% versus URNM's 19.0%—meaning URNM is capturing flows that URA is not. The volume-price confirmation difference is decisive: URNM shows accumulation/confirmation status while URA remains solid, and URNM's persistence of 100/100 (combining trend, RS, MACD, and volume sponsorship) indicates the move has institutional legs, not just passive flows. At 62.3% extension from the 50-week line, URNM is objectively overextended; however, every new buyer is absorbing shares at rising prices, suggesting structural conviction in long-term uranium demand from energy transition and geopolitical factors.
Nuclear Energy earns 10% allocation as a top-2 overweight, tying with Traditional Energy for the highest-conviction positions despite a lower absolute score (68.8 versus 83.1). The macro case is strong: energy scarcity (+9), real asset sponsorship (+7), and inflation pressure (+3) support the allocation, though credit stress (-5) offers a modest headwind. The difference from energy is that nuclear is a smaller, more concentrated bet on a specific regime outcome—decarbonization and energy independence driving decades of uranium demand. URNM's 100/100 persistence score is the highest in the portfolio and signals that this is not a technical anomaly but a conviction trade by large institutions building long positions ahead of supply deficits. The 62.3% extension is genuinely alarming, and the 23.7/100 risk-reward score reflects 83.1% downside to support at 25.68 if confidence breaks, but the allocation assumes near-term energy policy shifts (coal plant retirements accelerating, geopolitical supply constraints) will justify the conviction. Nuclear would hold top-2 status only if volume remains elevated through any pullback toward the 50-week line; if volume evaporates, the setup becomes a liquidation target, not an institutional accumulation.
Industrial Metals — COPX
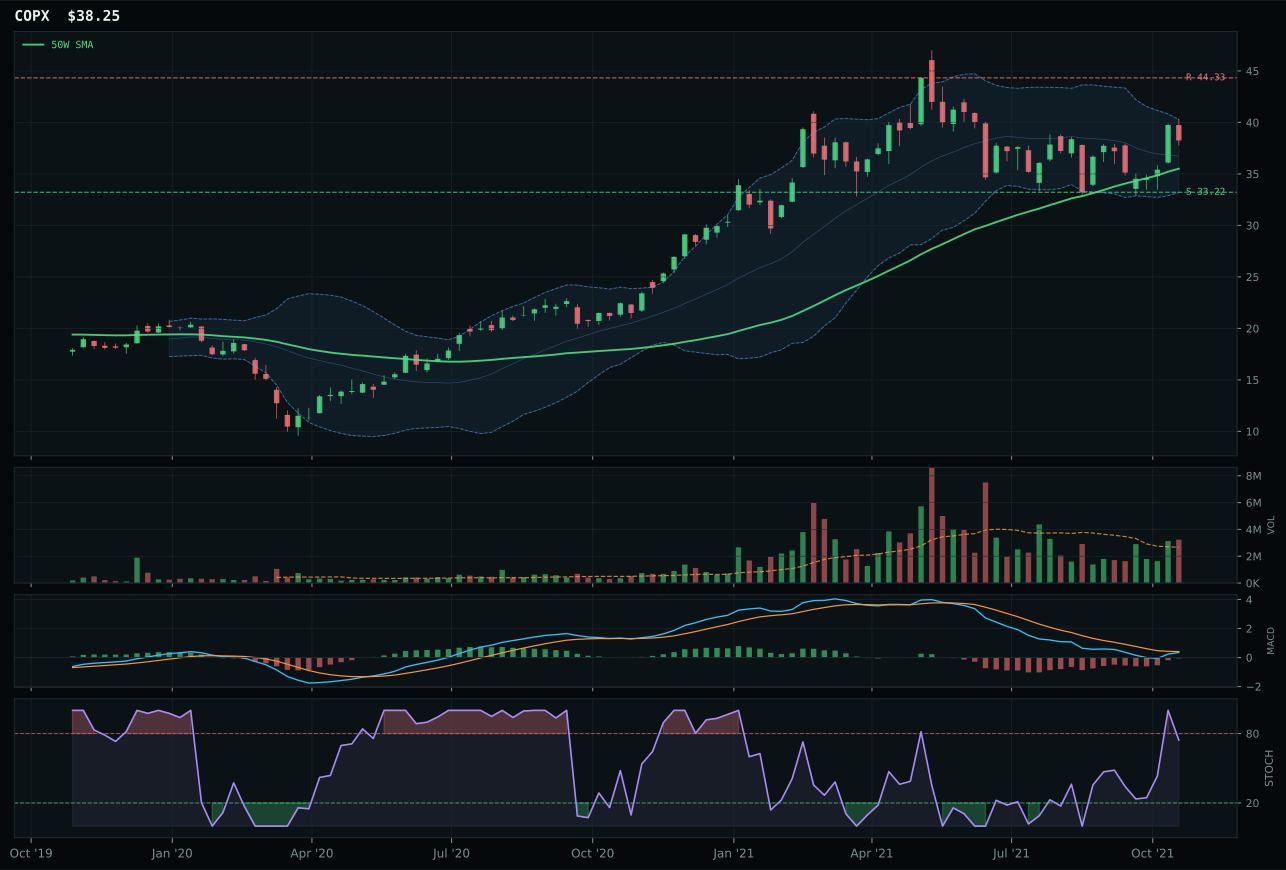
COPX has a neutral structure profile with 3.0% 13-week relative strength versus SPY.
A failed hold above support would weaken the setup.
Actionable but governed by invalidation levels.
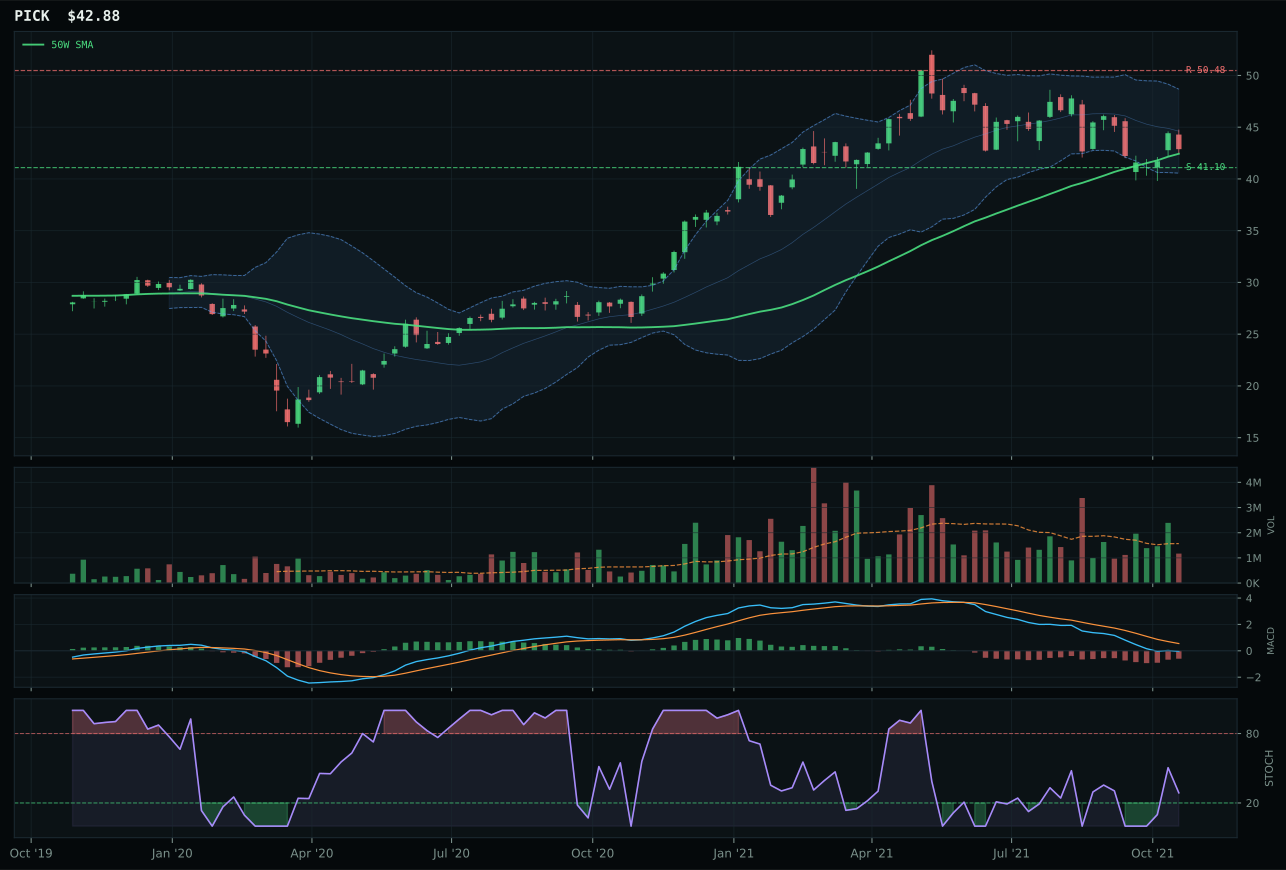
PICK has a pullback into support profile with -9.0% 13-week relative strength versus SPY.
A failed hold above support would weaken the setup.
Actionable but governed by invalidation levels.
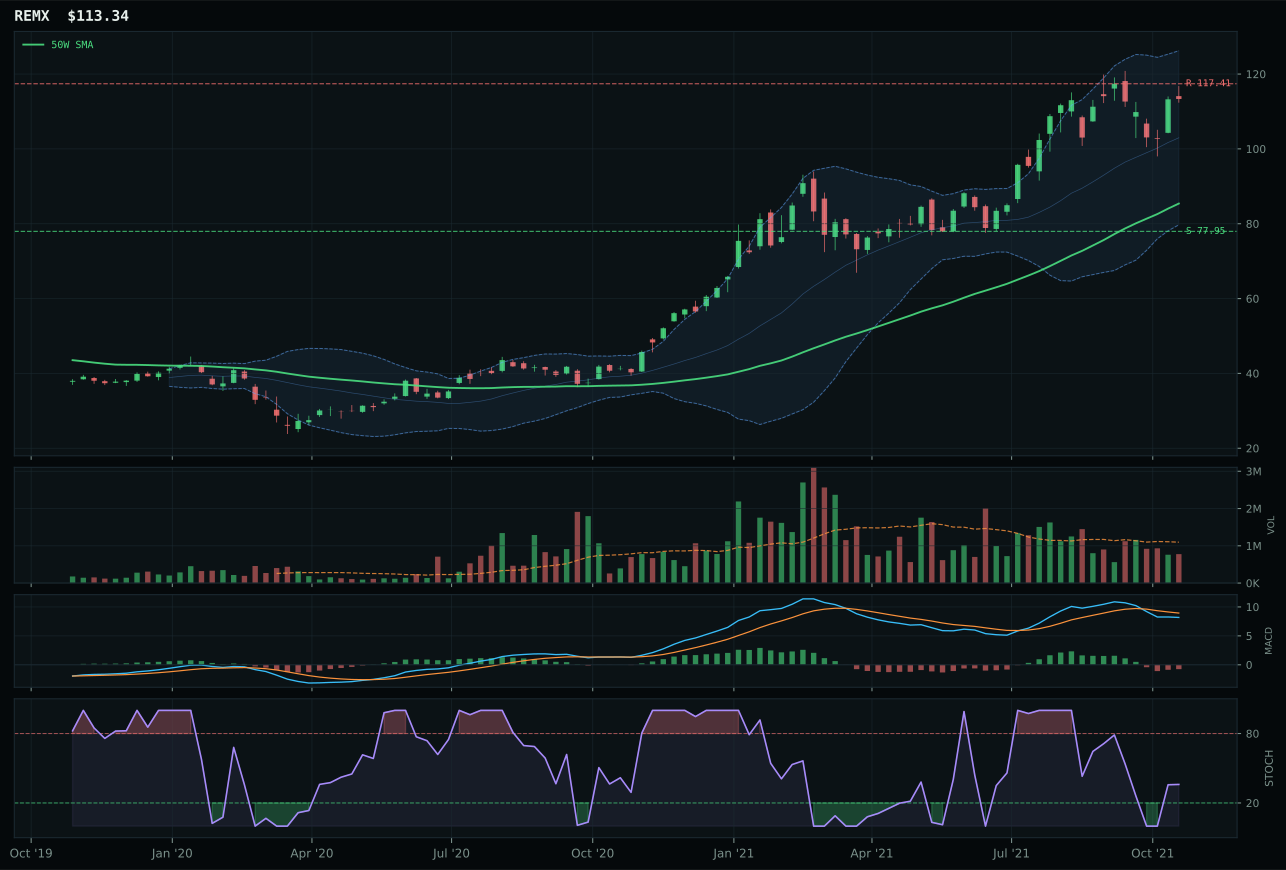
REMX has a vertical extension profile with 7.7% 13-week relative strength versus SPY.
A failed hold above support would weaken the setup.
Actionable but governed by invalidation levels.
COPX dominated the category with an 81-point composite score, the third-highest in the portfolio, by combining flawless trend mechanics (97.6/100) with extraordinary momentum confirmation (86/100) and real volume sponsorship (74.5/100). Its 6.0% 13-week return and 3.0% SPY relative strength reflect clean, sustained demand for copper tied to supply scarcity and infrastructure capex cycles. PICK's timing score of 100/100 matches COPX, but it masks a fatal weakness: category-relative strength of -12.1% indicates PICK is a laggard within its own basket, suggesting diversified mining breadth is failing despite improvements in mining as a macro theme. COPX's structure of 71/100 versus PICK's 65.1/100 reveals the difference—COPX's neutral consolidation is cleaner than PICK's pullback-into-support setup, which usually presages continued weakness unless volume surges. PICK's thin participation (50x average) versus COPX's 1.21x above-average confirms that institutional capital is selective: they are buying copper scarcity, not betting the mining sector broadly.
Industrial Metals earns 5% allocation as tier-2, a position that respects the category's exceptional 59.8 composite score and macro tailwinds (metals scarcity +14, commodity breadth +10, real asset sponsorship +6) while acknowledging that two higher-ranked categories merit larger positions in a constrained allocation. The 73/100 category macro fit is among the strongest, reflecting structural supply mismatches in copper, lithium, and other industrial inputs that will persist for years—this is not a tactical bounce but a structural regime shift. COPX's above-average volume and rising-mid-zone stochastic RSI signal accumulation in progress rather than momentum exhaustion. The category would earn top-2 rank if COPX breaks above 44.33 resistance with volume expansion, confirming that institutional buyers view the scarcity narrative as durable enough to push through current valuation resistance. Until that breakout, industrial metals remain a core tier-2 holding for real-asset diversification, protected by structural supply fundamentals even if tactical momentum softens.
Emerging Markets — INDA
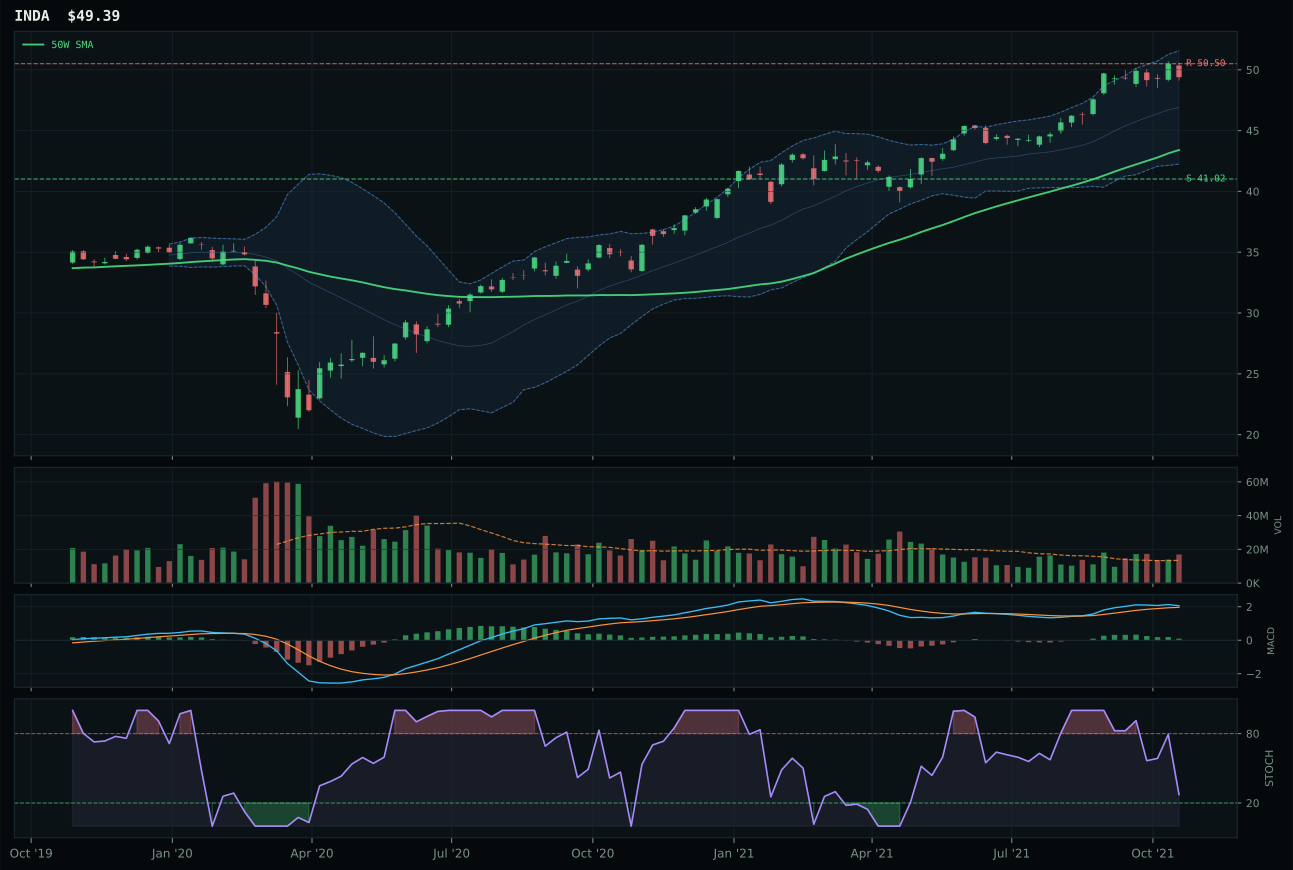
INDA has a neutral structure profile with 7.9% 13-week relative strength versus SPY.
A failed hold above support would weaken the setup.
Actionable but governed by invalidation levels.
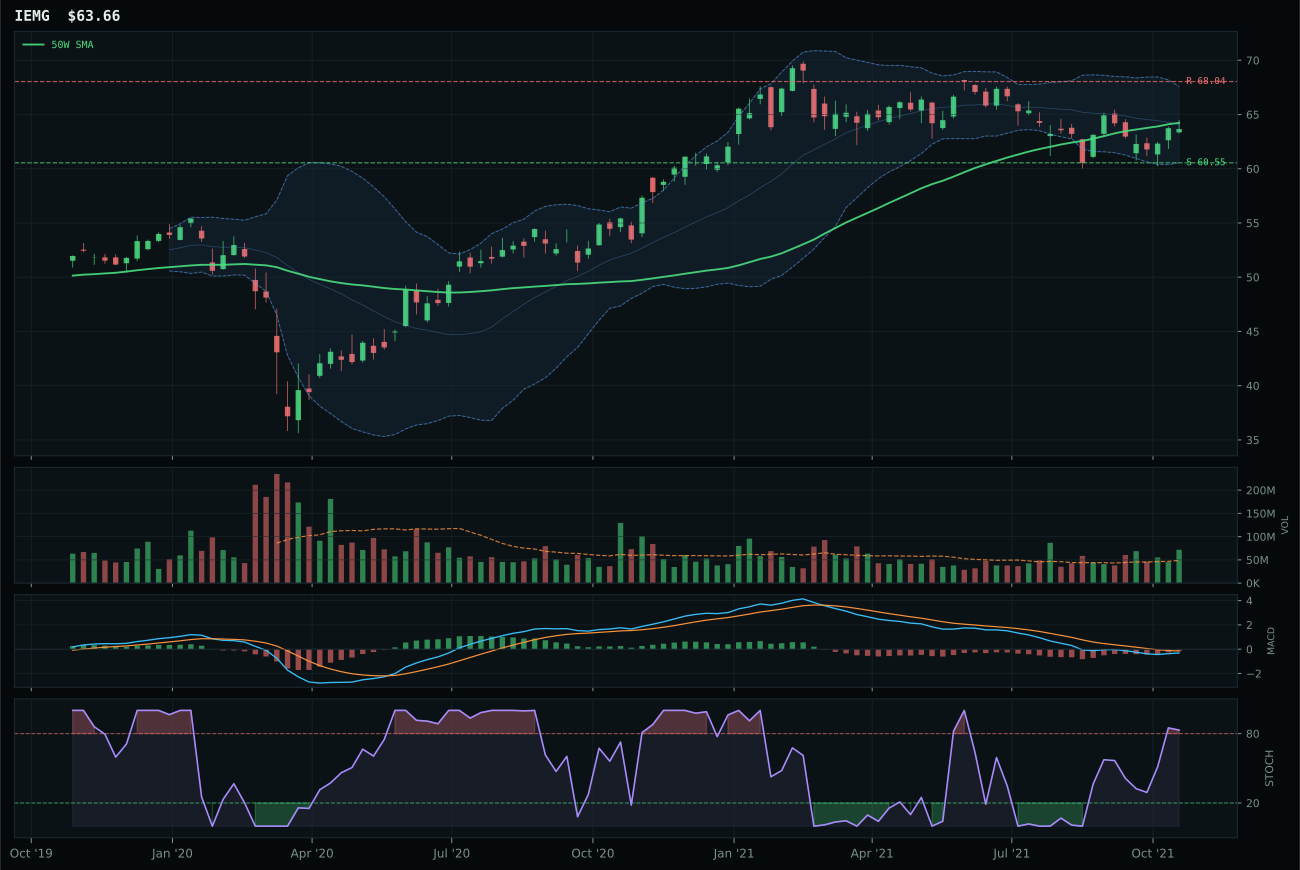
IEMG has a compression near 50W profile with -3.9% 13-week relative strength versus SPY.
A failed hold above support would weaken the setup.
Actionable but governed by invalidation levels.
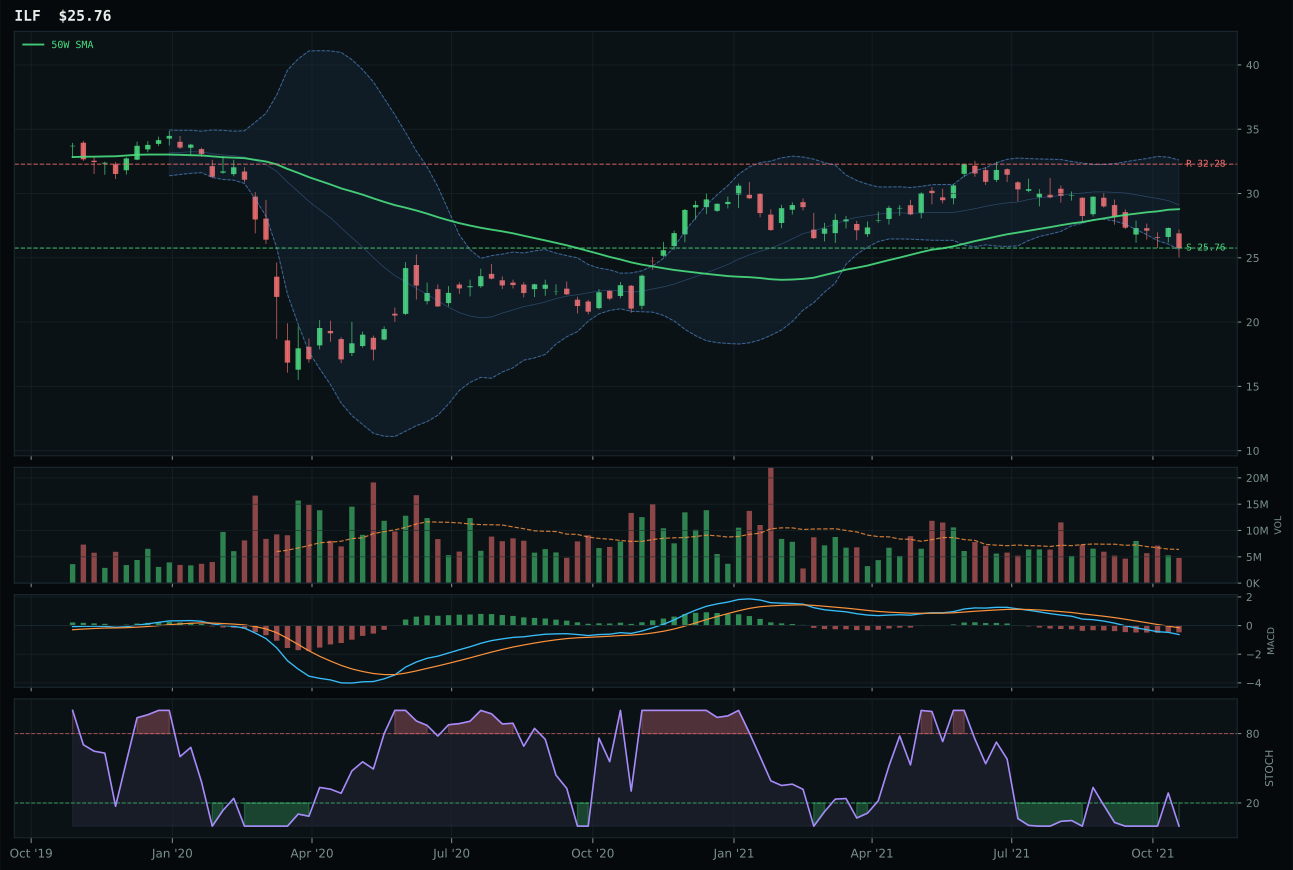
ILF has a pullback into support profile with -17.2% 13-week relative strength versus SPY.
Extension and support failure are the main tactical risks.
Tracked, but not top-2 eligible because: structurally broken.
INDA prevailed over IEMG by a decisive 5.9-point margin, capturing first place through superior structure (83.5/100 versus 72.8/100) and unambiguous MACD confirmation (bullish but flattening versus bearish but improving). The 11.8% category-relative strength advantage is the clincher—it signals that India-focused exposure is capturing flows that broad emerging-market exposure is not, reflecting both the theme specificity of INDA (quality growth in a demographic-tailwind market) and the relative weakness of broad EM baskets. INDA's 1.26x above-average volume participation validates accumulation, while IEMG's above-average participation at the compression level suggests consolidation fatigue. The 13-week return of 10.9% for INDA versus -0.9% for IEMG reveals a fundamental divergence: India is rallying on growth narratives and policy continuity, while broad EM is wrestling with Fed tightening expectations and dollar strength. Both sit extended, but INDA's cleaner compression pattern and bullish MACD (versus IEMG's bearish recovery) indicate directional conviction versus tactical bounce.
Emerging Markets receives 5% allocation as tier-2, reflecting strong technical sponsorship in INDA (82-point composite) but macro headwinds that prevent top-2 elevation. The category macro fit of 62/100 is middling: em liquidity support (+14) and liquidity expansion (+8) are positive, yet credit stress (-10) applies a material headwind that reflects Fed tightening concerns and capital outflows from EM assets. INDA's positioning within India's quality-growth segment sidesteps some of the broad EM fragility, as India's demographics, capex cycle, and policy coherence differentiate it from commodity-dependent or balance-sheet-stressed peers. The 100/100 momentum confirmation score indicates sustained buying, yet the 38.9/100 risk-reward reveals limited upside—INDA is pinned near resistance at 50.50 with a 2.2% extension, forcing a pullback to reset entry risk. For emerging markets to earn top-2 rank, either the Fed would need to pause rate expectations (reducing the credit stress headwind) or EM as a whole would need to show breadth expansion beyond India—currently, INDA is a quality outperform, not a broad EM thesis.
Utilities & Infrastructure — PAVE
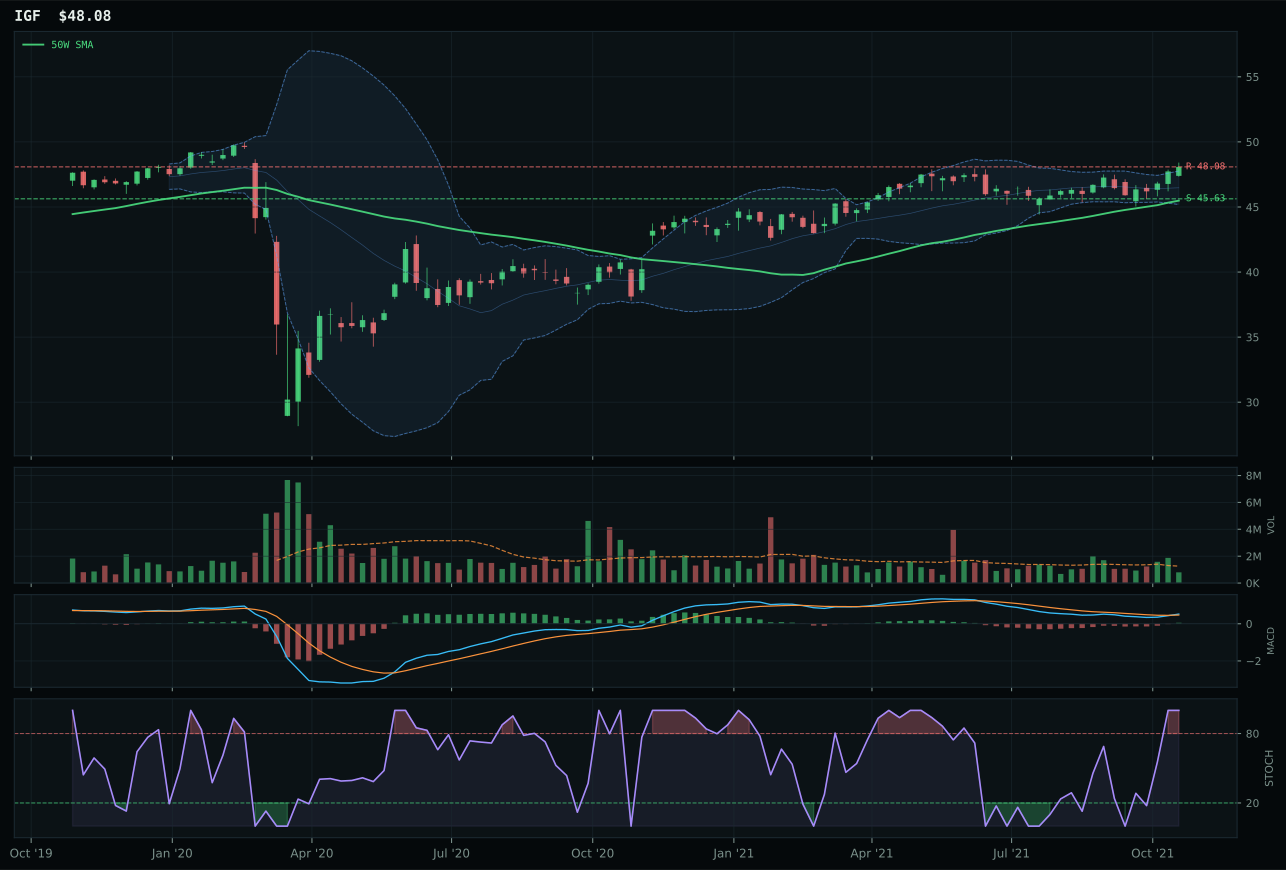
IGF has a neutral structure profile with 2.4% 13-week relative strength versus SPY.
A failed hold above support would weaken the setup.
Actionable but governed by invalidation levels.
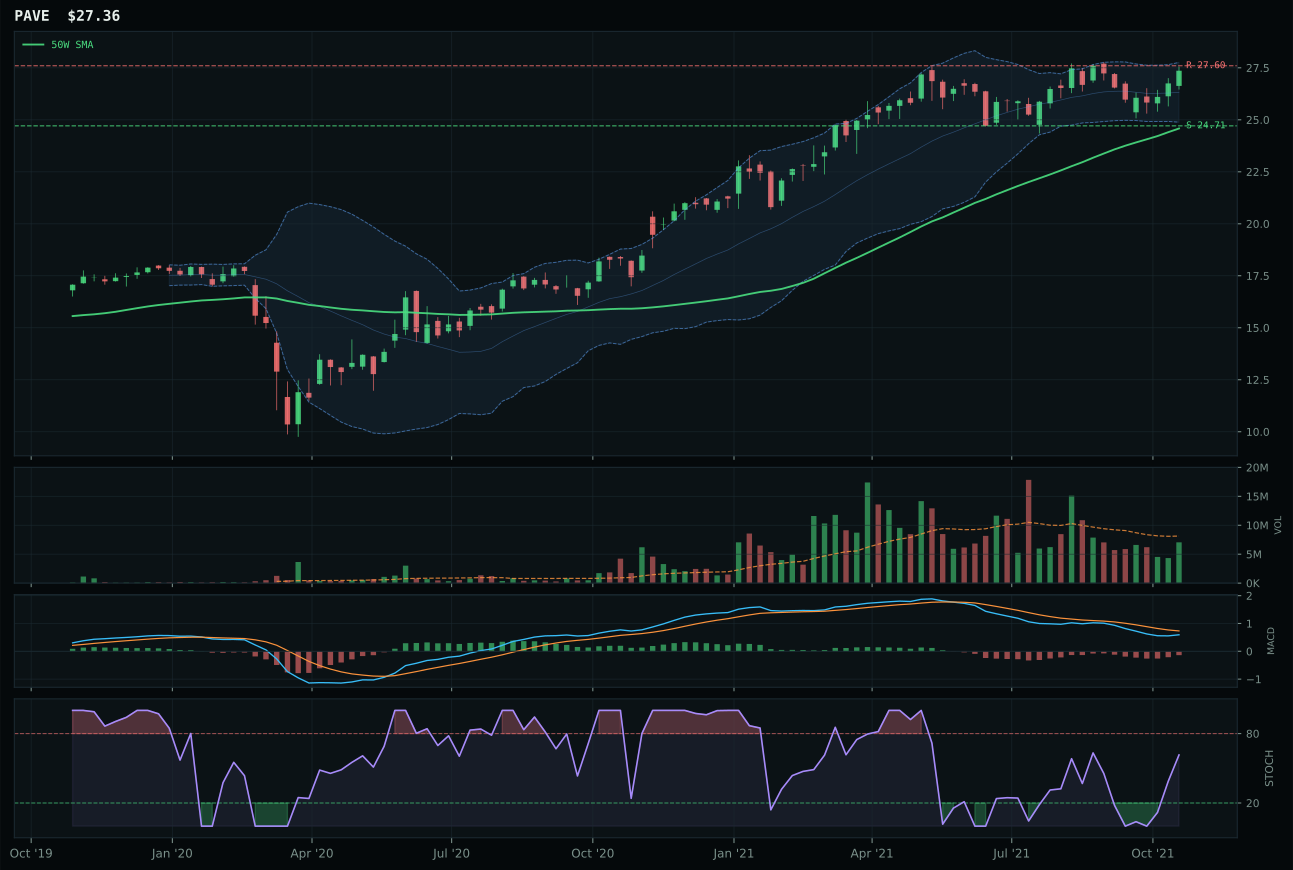
PAVE has a neutral structure profile with 2.8% 13-week relative strength versus SPY.
A failed hold above support would weaken the setup.
Actionable but governed by invalidation levels.
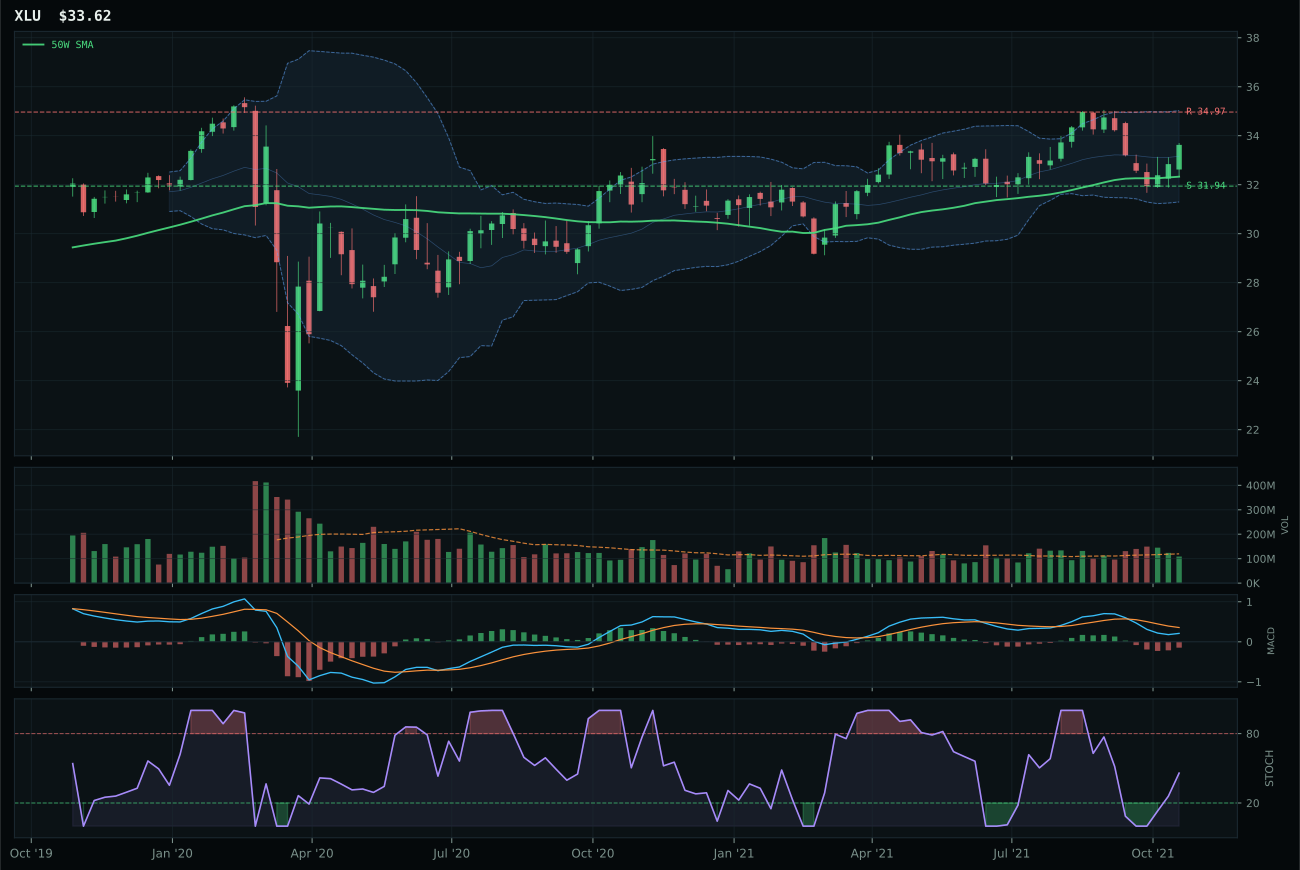
XLU has a neutral structure profile with -0.7% 13-week relative strength versus SPY.
A failed hold above support would weaken the setup.
Actionable but governed by invalidation levels.
PAVE narrowly edged IGF by sidestepping the overbought stochastic RSI trap that has ensnared the runner-up. Both ETFs sit in nearly identical technical positions—97.2% versus 100/100 trend scores, neutral-to-bullish MACD—yet PAVE's rising-mid-zone stochastic (0.62) versus IGF's overbought momentum (1.00) defines the timing difference. IGF's 78.7/100 technical evidence score exceeds PAVE's 72.5/100, yet PAVE's timing score of 75/100 matches IGF's and reflects the more sustainable entry point. Risk-reward is where PAVE's edge is smallest (38.5/100 versus 64/100 for IGF), indicating infrastructure is pressed against resistance on both names, yet PAVE's neutral volume (0.87x) versus IGF's thin participation means PAVE is accumulating while IGF is fading. Category-relative strength is negligible (0.4% versus 0.0%), confirming this is a category-selection call, not a dominant setup—PAVE simply offers a cleaner entry point than IGF for the same exposure.
Utilities & Infrastructure receives 5% allocation as tier-2, a modest position that reflects technical merit tempered by macro headwinds. The 48/100 category macro fit is among the weakest in the portfolio, as inflation pressure (-6) creates duration risk for utility dividend stocks, and the Transition/Mixed regime offers only +4 in broad support. PAVE's infrastructure focus sidesteps some inflation sensitivity compared to traditional utilities, as toll roads and pipelines often have inflation-pass-through mechanisms, yet the category collectively faces valuation pressure if real rates rise further. The 5.8% 13-week return and 2.8% SPY relative strength are modest, indicating utilities are not leading but not crashing either—a classic consolidation during macro uncertainty. Volume is neutral across the category, suggesting neither institutional accumulation nor distribution. For utilities to earn tier-2 at all, the macro regime would need to shift toward risk-off conditions (credit stress, geopolitical shocks) that drive investors into defensive dividend streams; absent that catalyst, this category is a defensive placeholder rather than a growth driver in the allocation.
Technology — CIBR
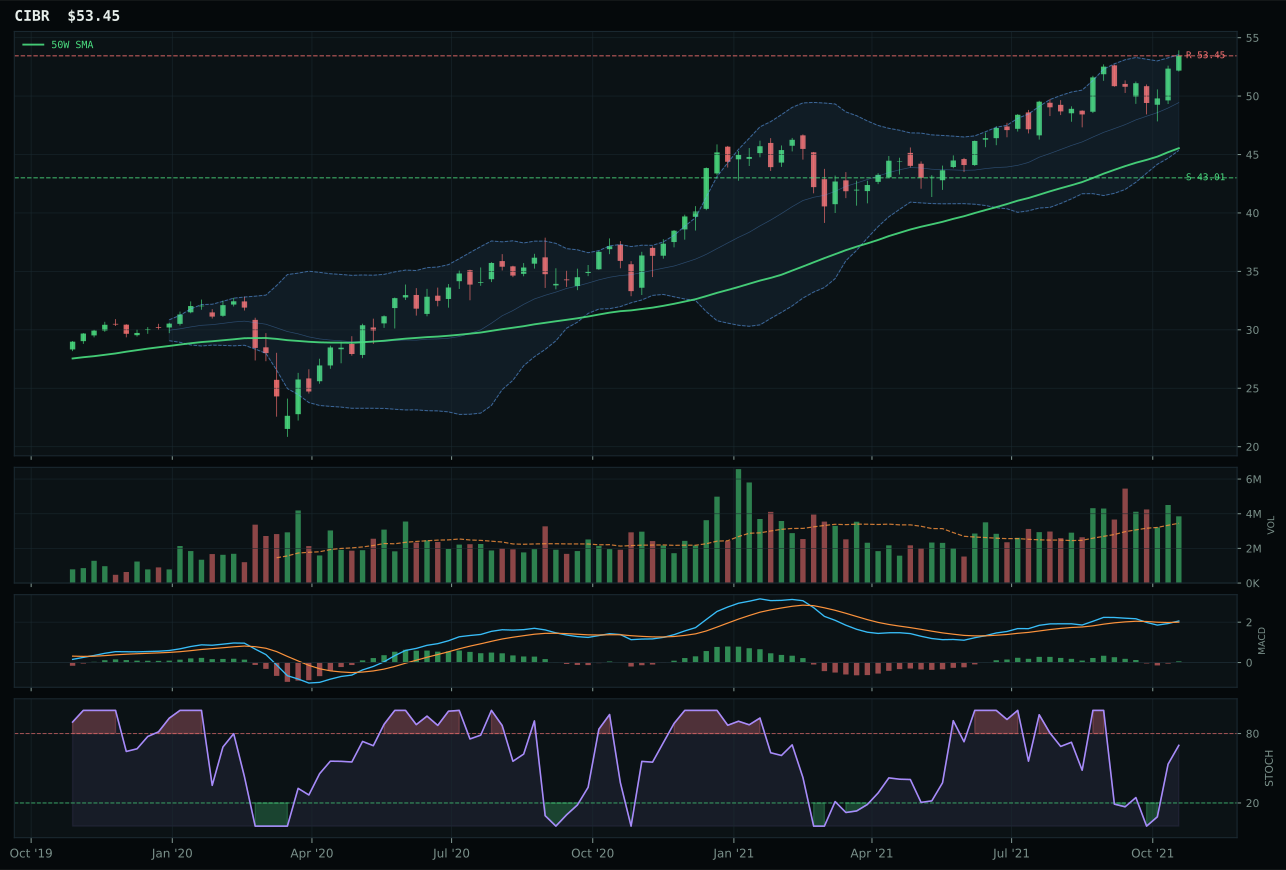
CIBR has a vertical extension profile with 4.9% 13-week relative strength versus SPY.
A failed hold above support would weaken the setup.
Actionable but governed by invalidation levels.
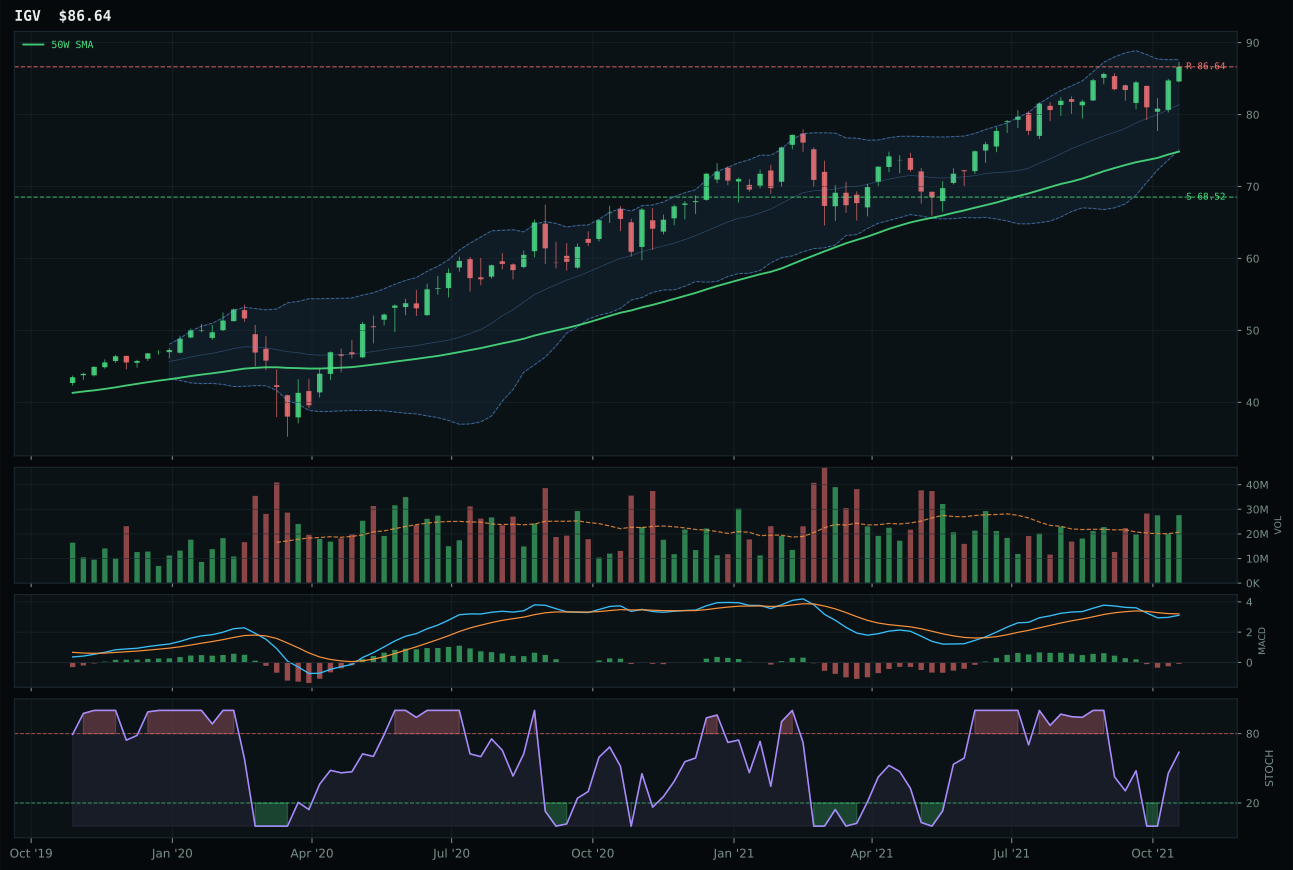
IGV has a vertical extension profile with 3.3% 13-week relative strength versus SPY.
A failed hold above support would weaken the setup.
Actionable but governed by invalidation levels.
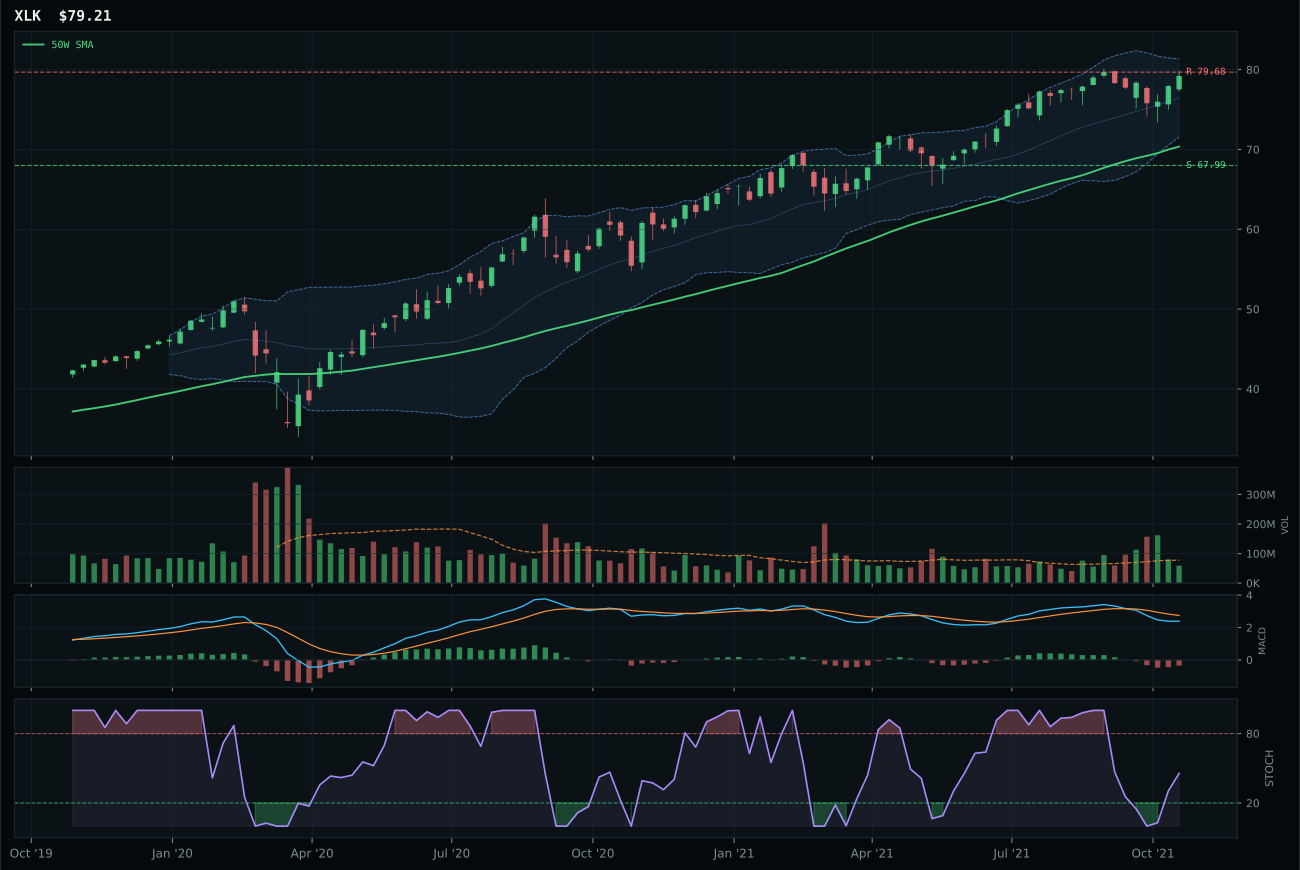
XLK has a neutral structure profile with -0.5% 13-week relative strength versus SPY.
A failed hold above support would weaken the setup.
Actionable but governed by invalidation levels.
CIBR prevailed over IGV by building a clearer mosaic of technical sponsorship: its 4.9% relative strength versus SPY outpaced IGV's 3.3%, and more critically, CIBR's MACD remains bullish—albeit flattening—while IGV has already rolled over to bearish weakness. The 1.7% category-relative strength advantage matters because it signals that cybersecurity is capturing flows within the tech basket that enterprise software has lost. Both sit extended 17%+ above their 50-week lines, but CIBR's volume participation at 1.12x the 20-week average proves accumulation is still active, whereas IGV's setup is deteriorating into a momentum fade. The timing score of 48/100 reflects entry risk, yet CIBR's superior trend construction (100/100) and momentum confirmation (87.3/100) anchor a 10.1-point lead—a decisive margin that reflects real technical separation, not noise.
Technology earns 5% allocation as a tier-2 holding despite a respectable 52.8 composite score, landing outside the top-2 because two higher-ranked categories command the allocator's dry powder this week. The macro environment offers mixed signals: liquidity expansion is active, which normally benefits duration-heavy software, yet credit stress pulls in the opposite direction, and inflation pressure dampens the multiple-expansion narrative that powered tech's summer run. CIBR's cybersecurity positioning sidesteps some duration sensitivity and captures real-economy capex flows tied to supply-chain security, which aligns better with the current regime than pure cloud or SaaS exposure. To earn a top-2 slot, technology would need either sharper SPY outperformance (currently 4.9% at best) or fresh MACD confirmation across the category median—right now the setup reads as extended strength into a macro headwind, not a fresh breakout worthy of concentration.
Precious Metals — SLV
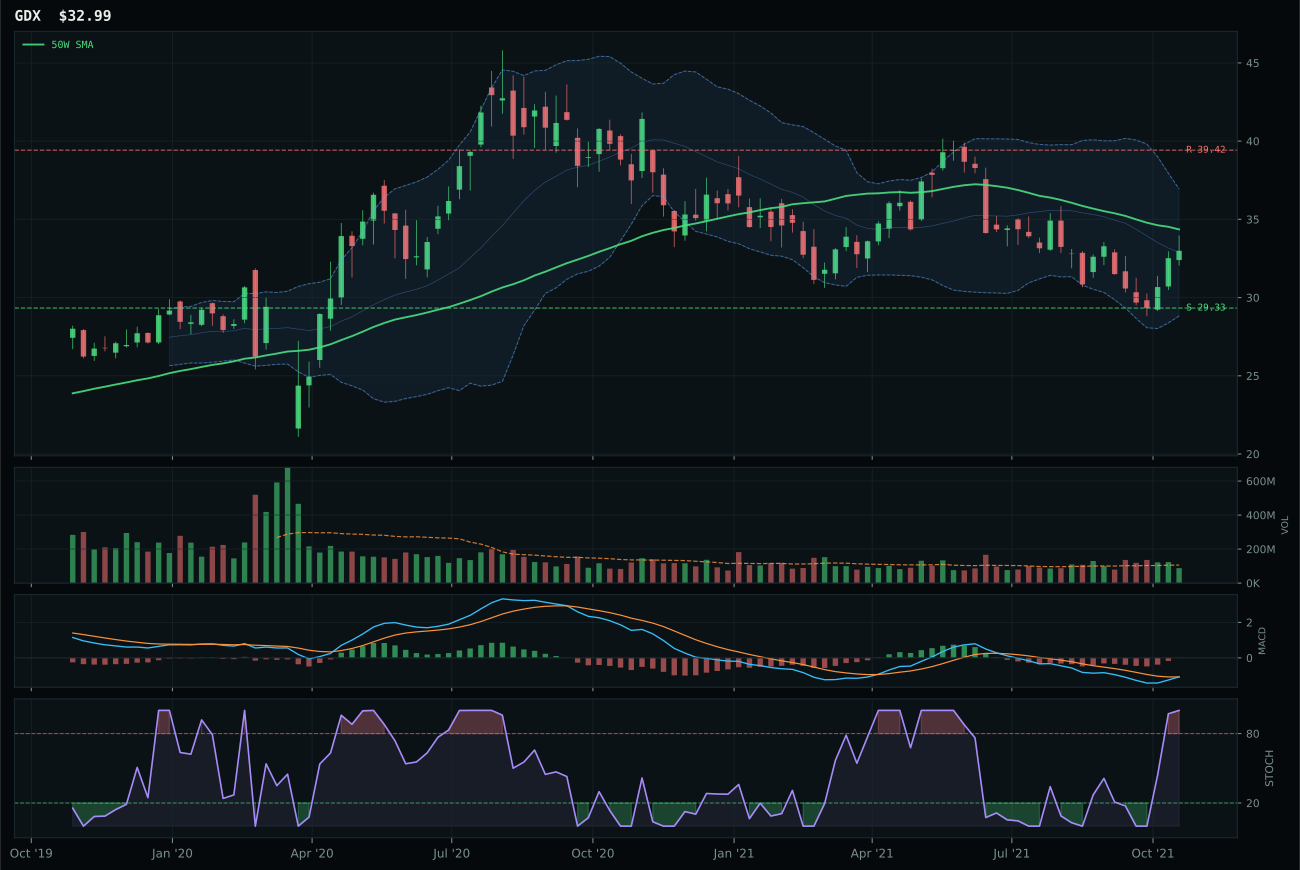
GDX has a neutral structure profile with -3.5% 13-week relative strength versus SPY.
A failed hold above support would weaken the setup.
Actionable but governed by invalidation levels.
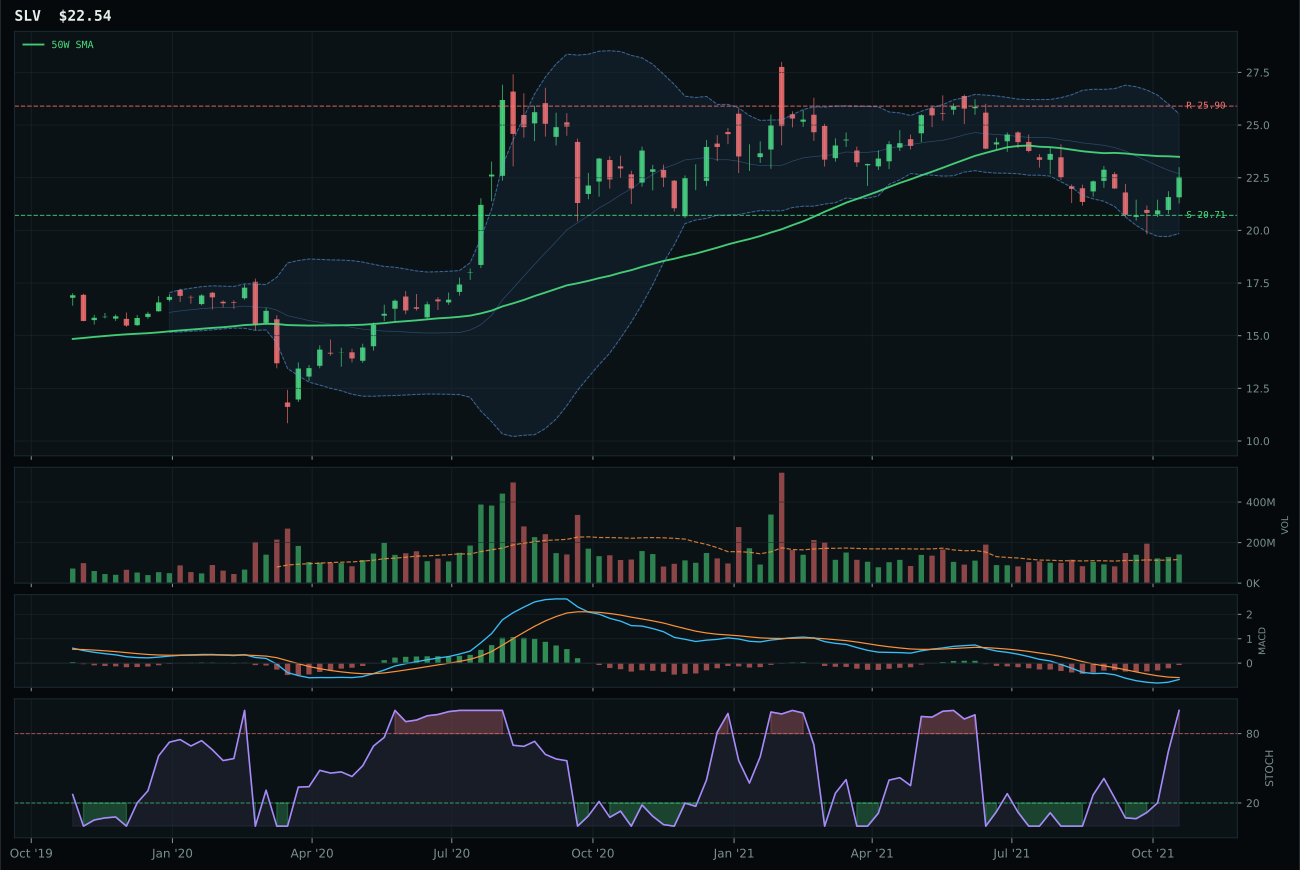
SLV has a neutral structure profile with -6.5% 13-week relative strength versus SPY.
A failed hold above support would weaken the setup.
Actionable but governed by invalidation levels.
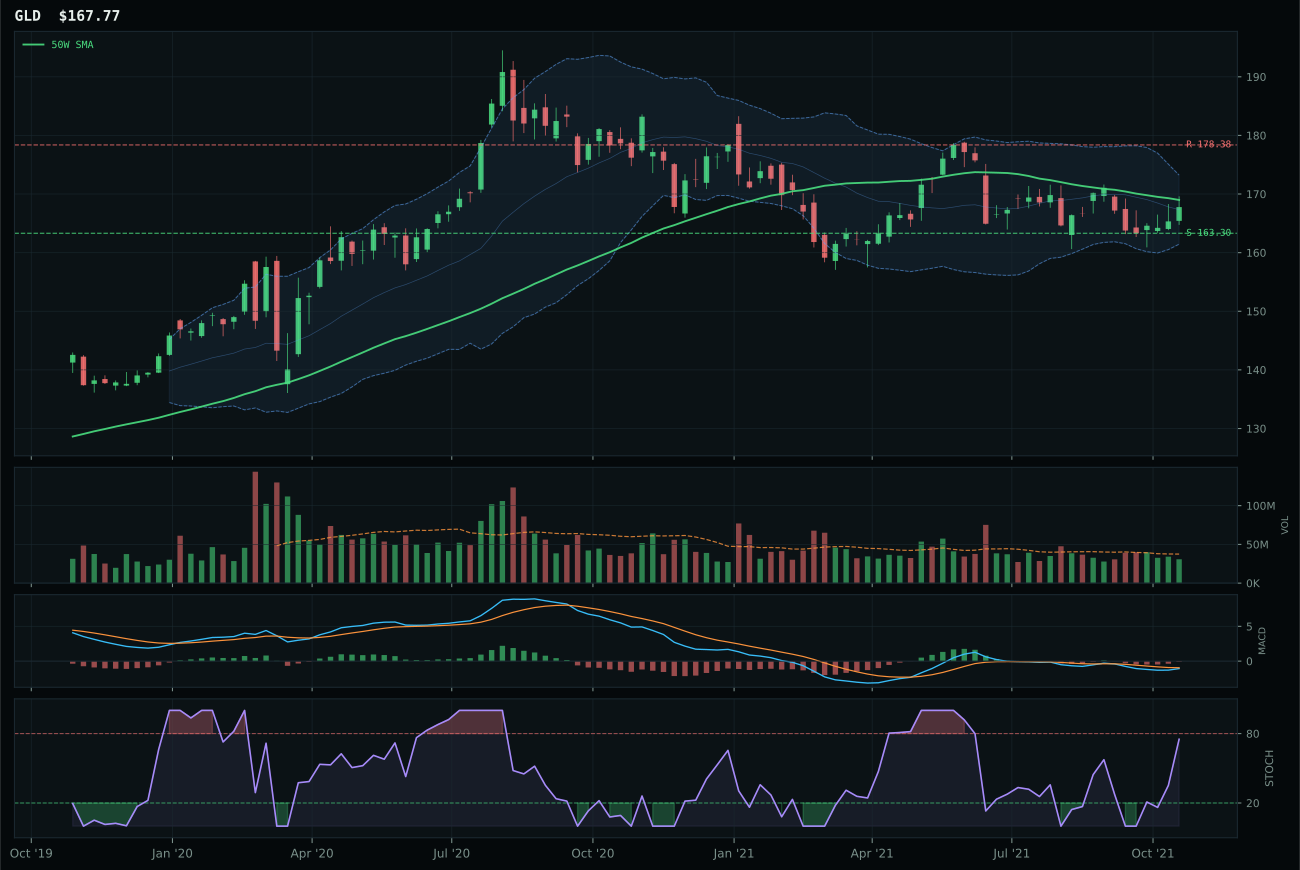
GLD has a pullback into support profile with -3.5% 13-week relative strength versus SPY.
A failed hold above support would weaken the setup.
Actionable but governed by invalidation levels.
SLV edged out GDX in a category that rewarded timing above trend—the inverse of most rallies. SLV's timing score of 97/100 crushes GDX's 97/100 only on the margin, but the real edge lies in risk-reward: SLV's 79.4/100 exceeds GDX's 76.5/100 because silver sits deeper in its retracement (Fib 0.618 versus a shallower zone for gold miners), offering better asymmetry. Volume matters: SLV's 1.22x above-average participation demonstrates accumulation into weakness, whereas GDX's neutral volume means miners are holding gains without fresh sponsorship. Both display bearish-but-improving MACD, signaling reversal intent, yet SLV's structure is cleaner (73.1/100 versus 67.1/100), which usually precedes stronger follow-through. GDX's bullish MACD appears superior superficially, but it is rising from an already weak base and lacks the volume confirmation that SLV has secured. The 13-week return of -3.5% for SLV versus -0.5% for GDX reflects positioning: silver got hit harder, creating the deeper value setup.
Precious Metals receives 5% allocation as tier-2, a modest position that reflects conviction in the metals narrative but caution on near-term entry risk. The category macro fit of 48/100 is below average, hamstrung by liquidity expansion showing a -2 headwind (central banks expanding balance sheets typically pressure precious metals initially) that outweighs the +7 from metals scarcity and +5 from inflation pressure. SLV's setup is fundamentally about mean reversion—it has been hammered (-3.5% in 13 weeks), MACD is improving from deeply bearish levels, and the 22.94 support (Fib 0.618) is holding above the 200-week line. This is a value accumulation play, not a momentum chase. For precious metals to earn top-2 status, they would need sharper evidence that central-bank policy is shifting toward tightening (which would lift real yields and pressure metals) or alternatively, a shock to credit conditions that drives risk-off demand for safe havens—neither scenario is currently active in the macro regime.
Agriculture & Livestock — MOO
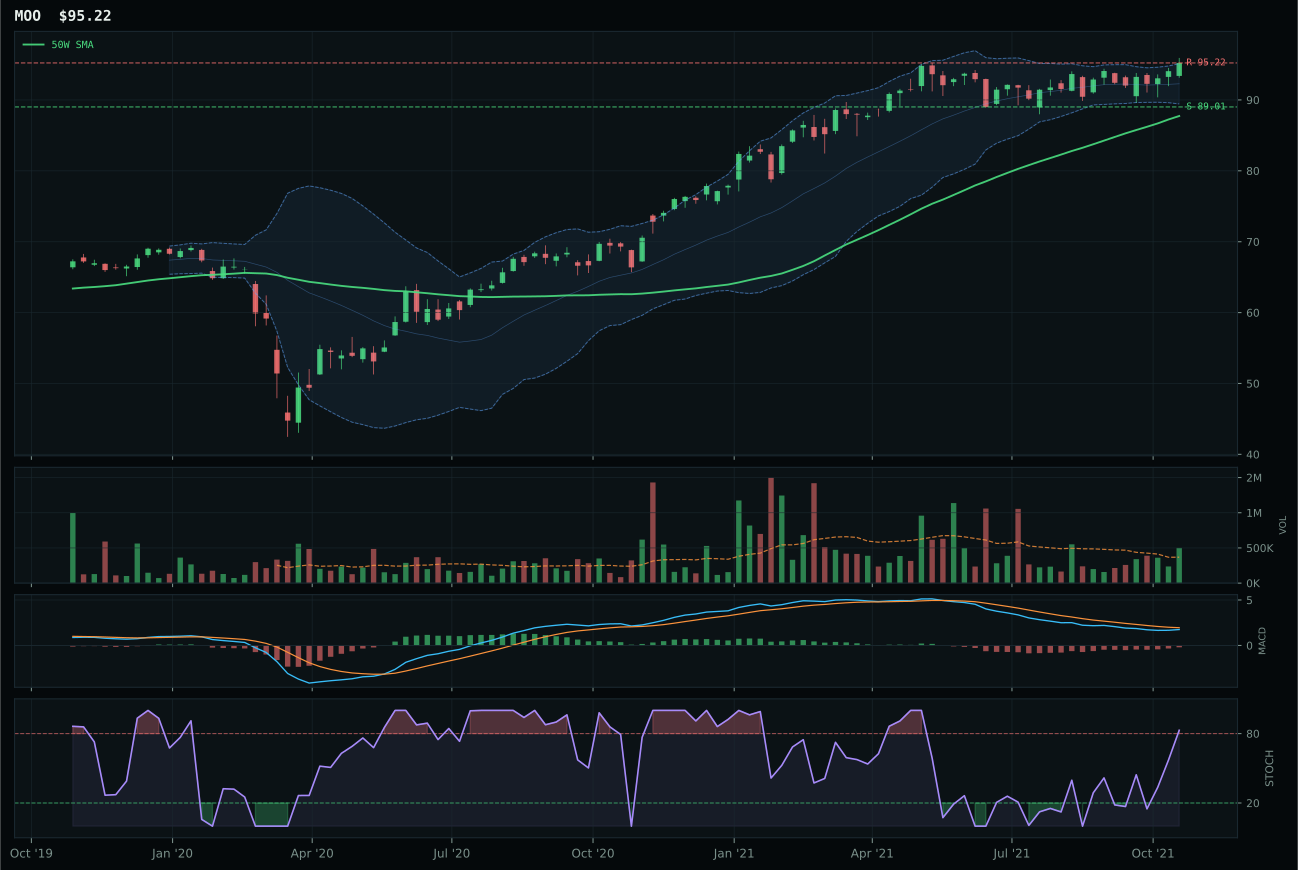
MOO has a neutral structure profile with 1.1% 13-week relative strength versus SPY.
A failed hold above support would weaken the setup.
Actionable but governed by invalidation levels.
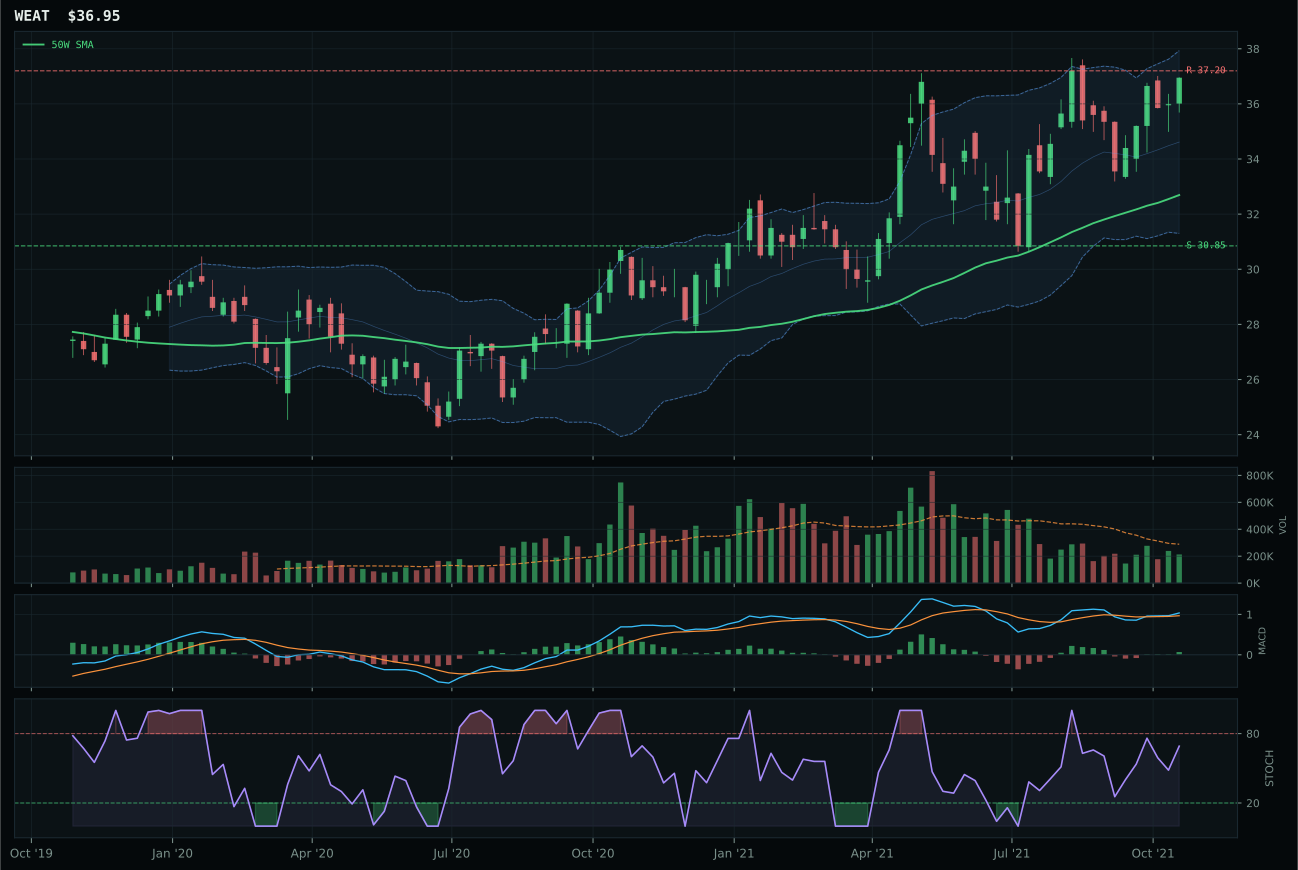
WEAT has a neutral structure profile with 7.1% 13-week relative strength versus SPY.
A failed hold above support would weaken the setup.
Tracked, but not top-2 eligible because: .
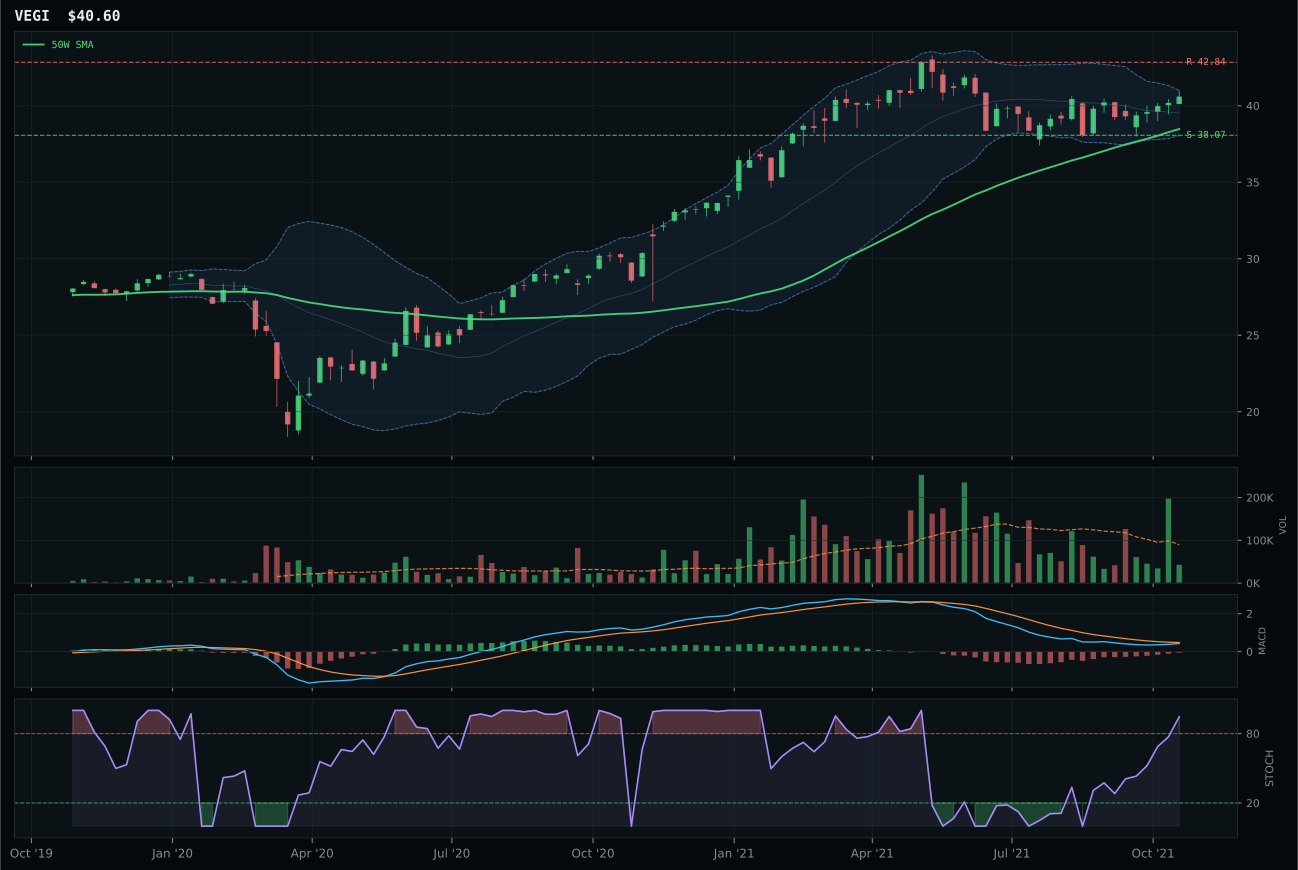
VEGI has a neutral structure profile with 1.8% 13-week relative strength versus SPY.
A failed hold above support would weaken the setup.
Tracked, but not top-2 eligible because: .
MOO defeated WEAT by a 15.4-point margin—a landslide—on three technical foundations: superior timing (75/100 versus 67/100) stemming from an 8.5% pullback versus the 50-week line that resets entry risk; better risk-reward (57.6/100 versus 37.6/100) that offers 7% downside protection while WEAT is pinned at resistance; and critically, above-average volume participation (1.36x) versus WEAT's thin participation. WEAT's 13-week return of 10.1% and SPY relative strength of 7.1% appear attractive, yet both metrics reflect momentum without sponsorship—the stochastic RSI is falling neutral and volume is drying up, classic signs of momentum failure. MOO's structure cleanliness of 78.2/100 versus WEAT's 74.1/100 indicates a healthier consolidation pattern. The category-relative strength advantage of -0.7% for MOO versus WEAT's +5.3% appears counterintuitive until you recognize it reflects breadth: WEAT's spike is concentrated in wheat futures, not agribusiness as a whole.
Agriculture & Livestock earns 5% allocation as tier-2 despite a strong 50.6 score, ceding top-2 rank to two higher-scored categories but securing meaningful exposure because the macro environment is exceptionally favorable. The category macro fit of 86/100 is the second-highest in the portfolio, driven by supply shortage (+13), inflation pressure (+10), real asset sponsorship (+8), and positive commodity breadth (+5). These tailwinds are not temporary technical bounces; they reflect structural supply mismatches and currency debasement that support food-price inflation for quarters ahead. MOO's above-average volume at 1.36x suggests institutional money is rotating into real assets ahead of sustained inflation, and the MACD reading of bearish but improving signals accumulation after a corrective phase. To push agriculture into top-2, MOO would need to clear the 95.22 resistance level with volume confirmation, or the broader commodity complex would need to show sharper breadth expansion—currently, it leads but does not dominate.
Defense & Aerospace — XAR
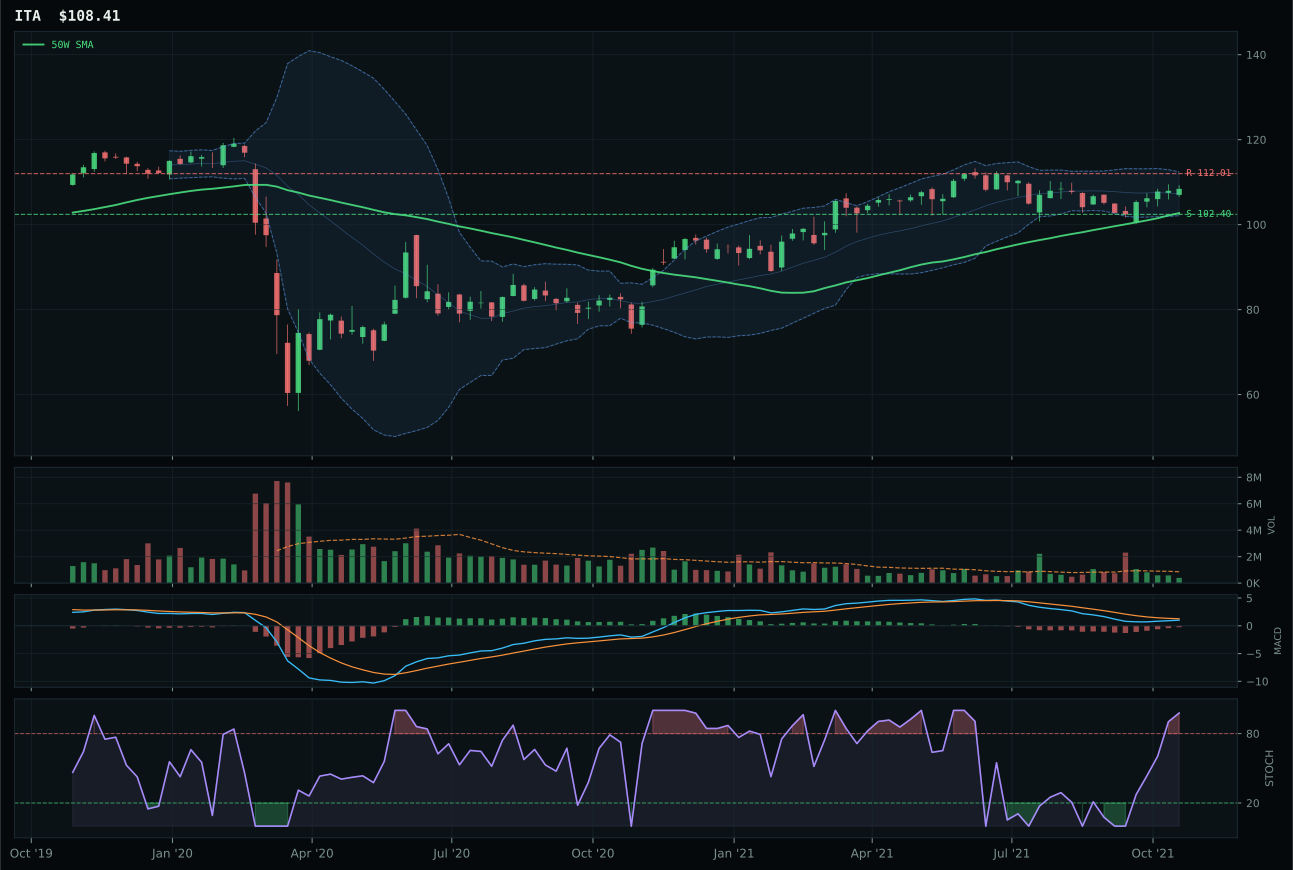
ITA has a neutral structure profile with -1.7% 13-week relative strength versus SPY.
A failed hold above support would weaken the setup.
Actionable but governed by invalidation levels.
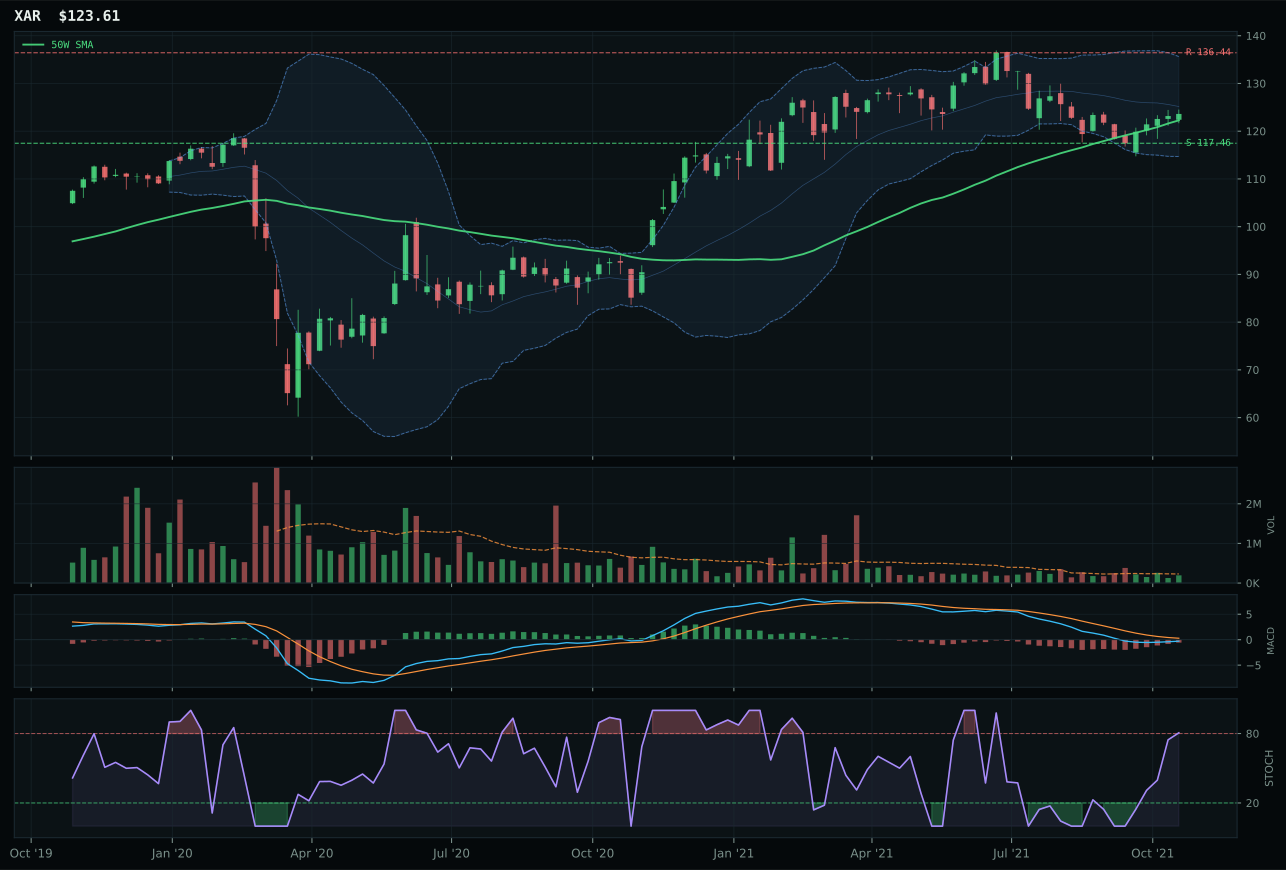
XAR has a compression near 50W profile with -5.6% 13-week relative strength versus SPY.
A failed hold above support would weaken the setup.
Actionable but governed by invalidation levels.
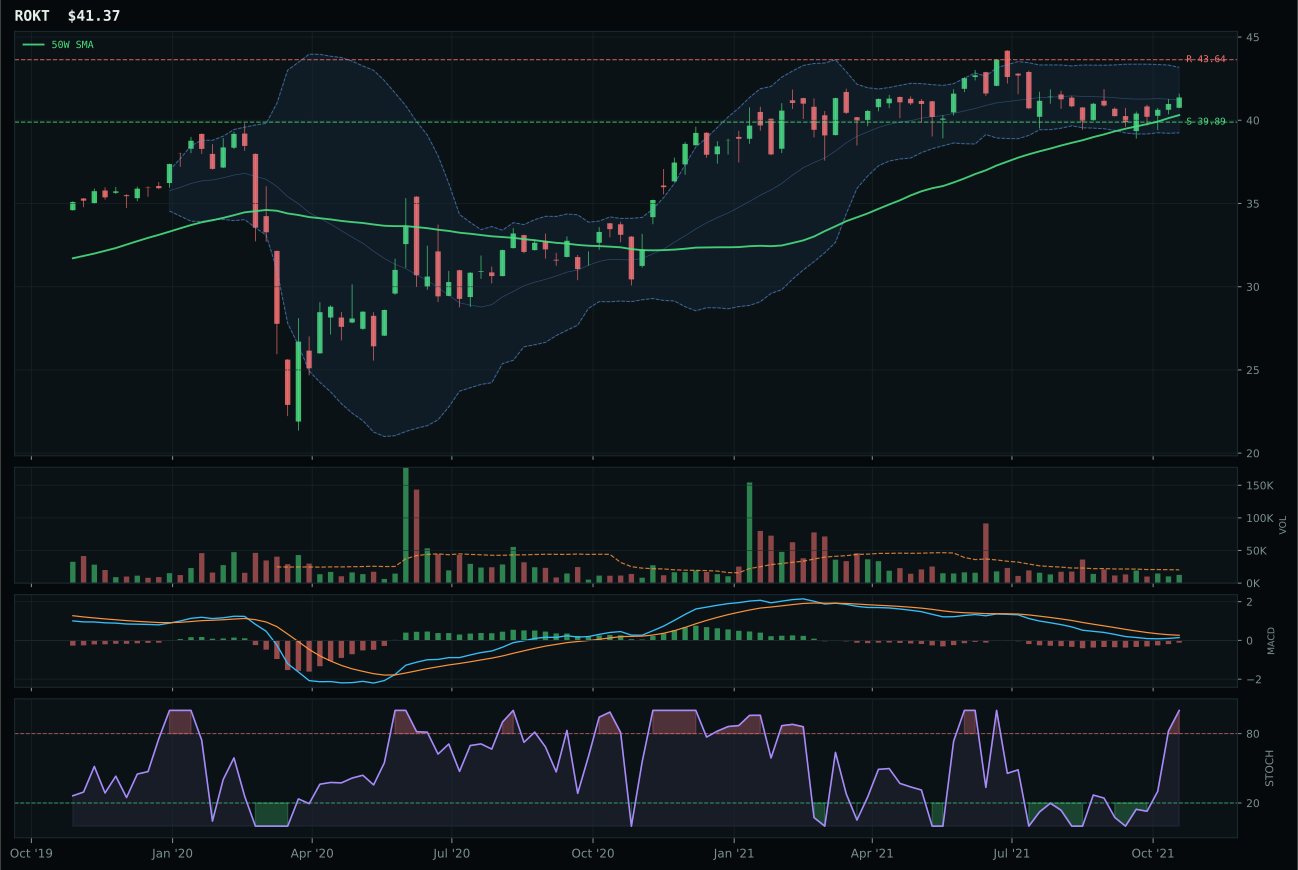
ROKT has a pullback into support profile with -2.5% 13-week relative strength versus SPY.
A failed hold above support would weaken the setup.
Tracked, but not top-2 eligible because: .
XAR clinched the category despite a 50.1 score—the second-lowest in the allocation—by virtue of its exceptional timing score of 100/100, a perfect reading that reflects price compressed just 1.1% from the 50-week line with MACD improving and stochastic RSI overbought. This setup is architecturally superior to ITA's timing of 75/100, which sits further from key moving averages and exhibits thin volume participation that fails to validate the move. XAR's 77.3/100 risk-reward score towers over ITA's 54.9/100 because the compressive structure near the 50-week provides natural support at 117.46 with a 5.2% downside buffer, while resistance is meaningfully elevated, creating asymmetry. Both ETFs are negative on relative strength (XAR -5.6% versus SPY, ITA -1.7%), reflecting sector weakness in a transition macro regime, but XAR's compression setup offers the cleaner entry point if mean-reversion buyers defend the 50-week level.
Defense & Aerospace receives 0% allocation, ranked 9th or 10th with a 50.1 score that fails to justify even tier-2 positioning. The category-level macro fit of 55/100 masks structural headwinds: credit stress provides a +2 boost, and the Transition/Mixed regime offers a modest +3, but the category lacks tailwinds from energy scarcity, supply shortages, or real-asset sponsorship that are fueling top performers. Momentum data is uniformly weak—both XAR and ITA show negative 13-week returns (-2.6% and +1.3% respectively) despite near-term technical compression, suggesting a category-wide air pocket rather than a localized setup issue. Volume is thin across the board, indicating institutional capital is not accumulating on dips. For defense to earn even 5%, XAR would need to hold support and trigger volume confirmation into fresh continuation, plus a macro shift toward risk-off flows that usually favor defensive durability; neither condition exists today.
AI — SMH
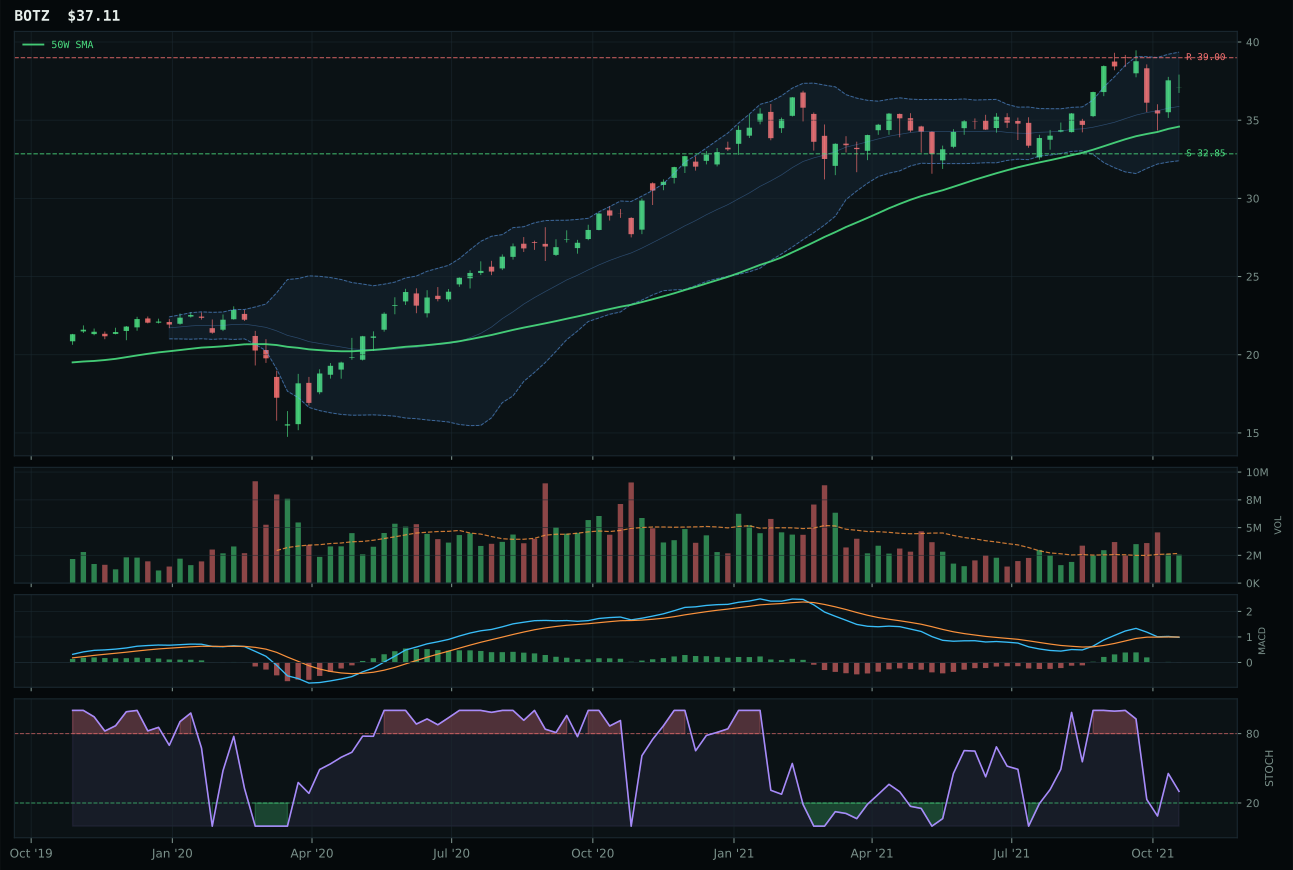
BOTZ has a neutral structure profile with 6.6% 13-week relative strength versus SPY.
A failed hold above support would weaken the setup.
Actionable but governed by invalidation levels.
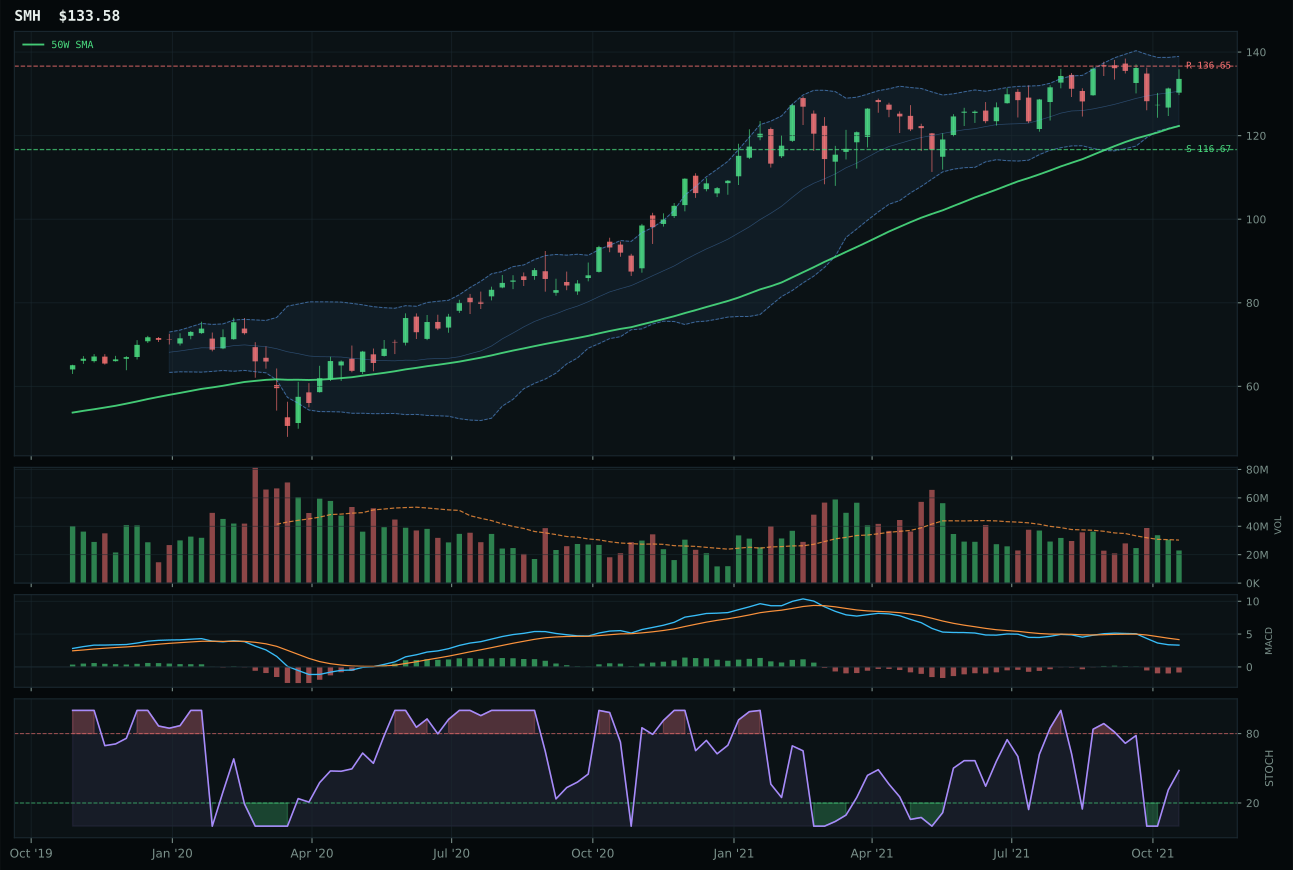
SMH has a neutral structure profile with 0.8% 13-week relative strength versus SPY.
A failed hold above support would weaken the setup.
Actionable but governed by invalidation levels.
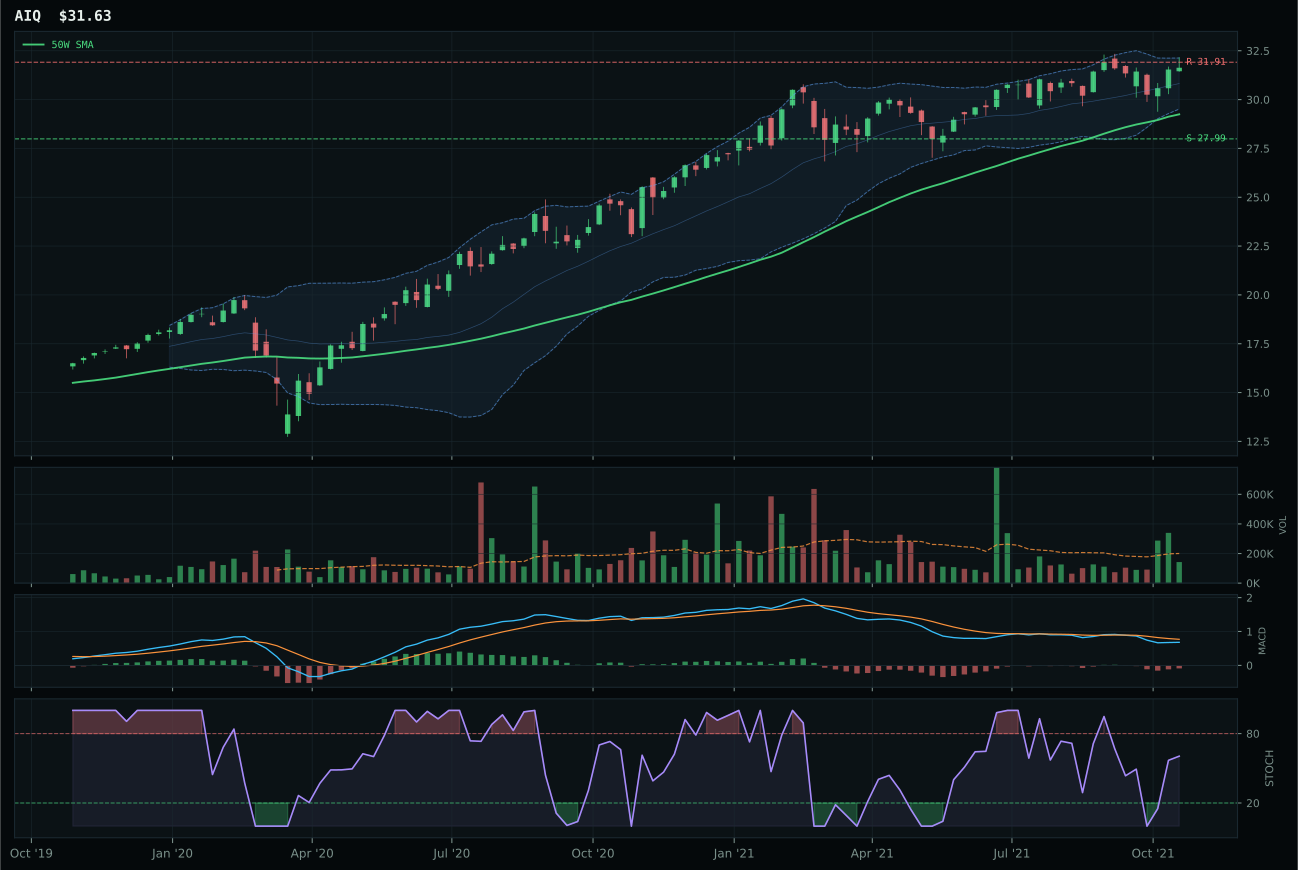
AIQ has a neutral structure profile with -1.1% 13-week relative strength versus SPY.
A failed hold above support would weaken the setup.
Tracked, but not top-2 eligible because: .
SMH captured the category win despite a 46.0 composite score, the lowest of any category in the allocation, by narrowly edging BOTZ on structural and timing grounds even though both share identical bearish/weakening MACD setups and neutral volume. The difference pivots on geography and concentration: BOTZ's 6.6% SPY relative strength and 9.6% 13-week return suggest a more explosive move, yet it originates from thinner category-relative breadth (5.8%) compared to SMH's zero differential, which paradoxically signals a more crowded, consensus trade. SMH's trend score of 83.2/100 combined with a timing score of 78/100 reflects a setup that is closer to equilibrium—9.2% from the 50-week line versus BOTZ's deeper extension—making SMH technically less stretched despite lower absolute momentum. Volume at 0.76x average signals neutral sponsorship rather than rejection, but in a bearish MACD environment, that neutrality is preferable to BOTZ's commitment without conviction.
AI receives 0% allocation this week, excluded from the portfolio entirely as it ranked 9th or 10th among the ten categories. The 46.0 composite score represents the weakest category conviction, driven by a macro fit of only 52/100: while liquidity expansion offers a +10 tailwind, credit stress applies a -8 headwind, and the category lacks the real-asset or scarcity narratives that are powering alternatives. Both SMH and BOTZ display bearish/weakening MACD conditions with overbought stochastic RSI readings, signaling momentum exhaustion rather than fresh accumulation. The neutral volume across the category—0.76x to neutral participation—suggests no new institutional buyers are stepping in. Until AI setups show either fresh MACD confirmation or a sharp pullback into support that resets the timing score above 85, this category remains sidelined; the risk is that new highs are being made on vapor, not real sponsorship.