
2021-10-15
Informational purposes only. The content in this report, including allocations, analysis, and commentary, is provided solely for informational and educational purposes. It does not constitute financial advice, investment advice, trading advice, or any other type of advice. Past performance does not guarantee future results. Always conduct your own research and consult a qualified financial professional before making investment decisions.
Weekly Allocation
| Ticker | Category | Weight | Role |
|---|---|---|---|
| FSOL | 50% | Overlay | |
| XLE | Traditional Energy | 10% | Top-2 (10%) |
| COPX | Industrial Metals | 10% | Top-2 (10%) |
| WEAT | Agriculture & Livestock | 5% | Tier-2 (5%) |
| URA | Nuclear Energy | 5% | Tier-2 (5%) |
| CIBR | Technology | 5% | Tier-2 (5%) |
| IGF | Utilities & Infrastructure | 5% | Tier-2 (5%) |
| SMH | AI | 5% | Tier-2 (5%) |
| ITA | Defense & Aerospace | 5% | Tier-2 (5%) |
Trade Instructions — Monday Open
Sell the tranche from 2021-09-17 (completing its 4-week hold). Buy the new tranche. Instructions show net portfolio changes — same-asset positions cancel, weight changes show the delta.
| Action | Ticker | Instruction |
|---|---|---|
| SELL | CIBR | Sell 33% of CIBR position (reduce 3.75% → 2.50%) |
| SELL | BOTZ | Sell 33% of BOTZ position (reduce 3.75% → 2.50%) |
| SELL | URNM | Sell 20% of URNM position (reduce 6.25% → 5.00%) |
| SELL | INDA | Sell 33% of INDA position (reduce 3.75% → 2.50%) |
| SELL | SLV | Sell entire SLV position (1.25% of portfolio) |
| SELL | MOO | Sell 50% of MOO position (reduce 2.50% → 1.25%) |
| BUY | ITA | Buy ITA — 16.67% of freed cash (adds 1.25% to portfolio) |
| BUY | WEAT | Buy WEAT — 16.67% of freed cash (adds 1.25% to portfolio) |
| BUY | SMH | Buy SMH — 16.67% of freed cash (adds 1.25% to portfolio) |
| BUY | XLE | Buy XLE — 33.33% of freed cash (adds 2.50% to portfolio) |
| BUY | URA | Buy URA — 16.67% of freed cash (adds 1.25% to portfolio) |
Current Portfolio After Trade
Combined holdings across all 4 active tranches. Each tranche is 25% of the portfolio.
| Ticker | % of Portfolio | Weight Bar |
|---|---|---|
| FSOL | 50.00% | |
| COPX | 6.25% | |
| URNM | 5.00% | |
| ITA | 5.00% | |
| FCG | 5.00% | |
| WEAT | 5.00% | |
| IGF | 3.75% | |
| XLK | 3.75% | |
| CIBR | 2.50% | |
| BOTZ | 2.50% | |
| INDA | 2.50% | |
| SMH | 2.50% | |
| XLE | 2.50% | |
| MOO | 1.25% | |
| GDX | 1.25% | |
| URA | 1.25% |
Macro Regime — Transition / Mixed
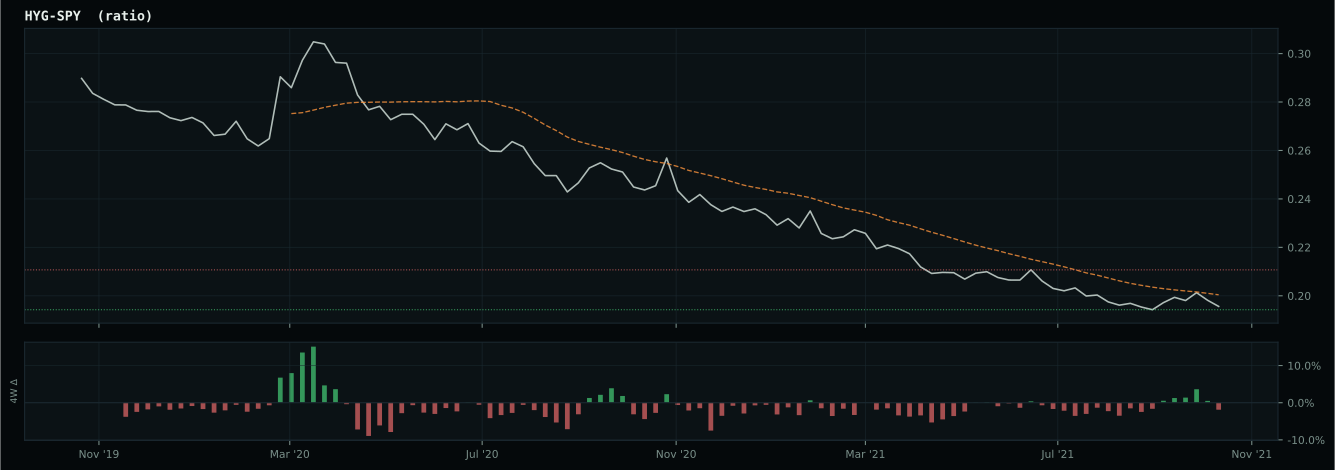
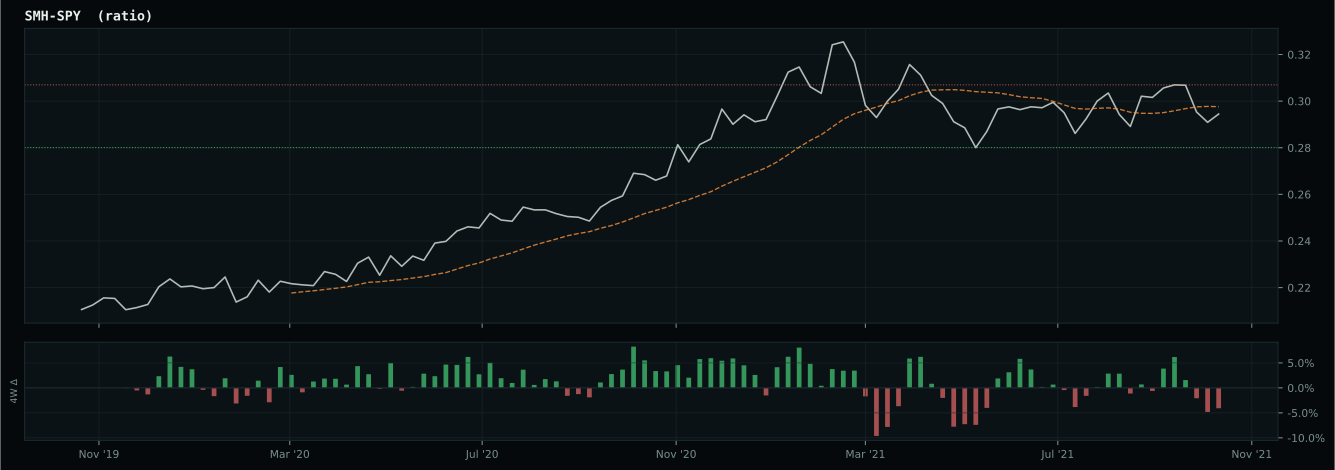
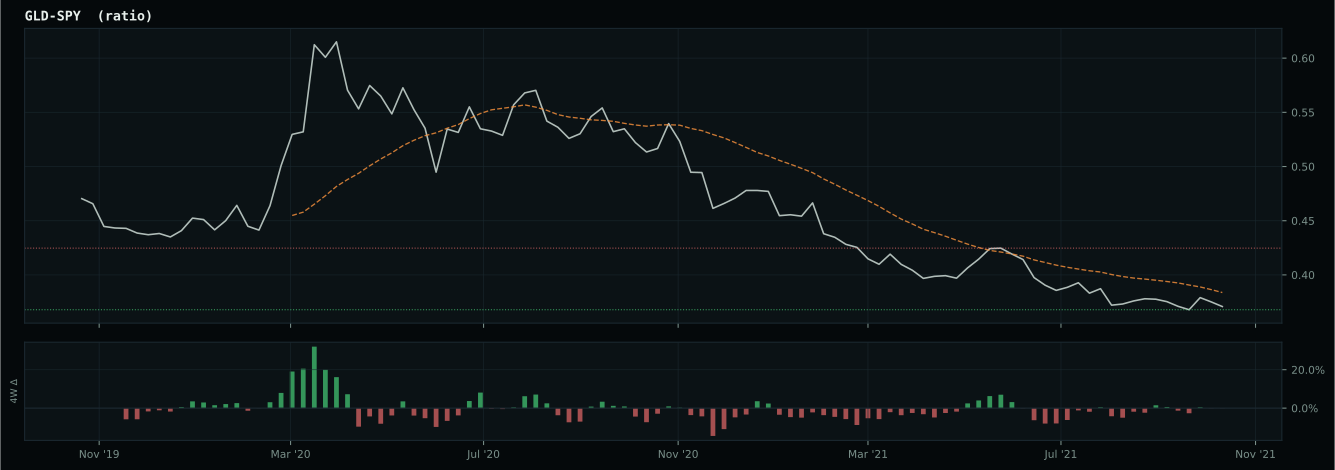
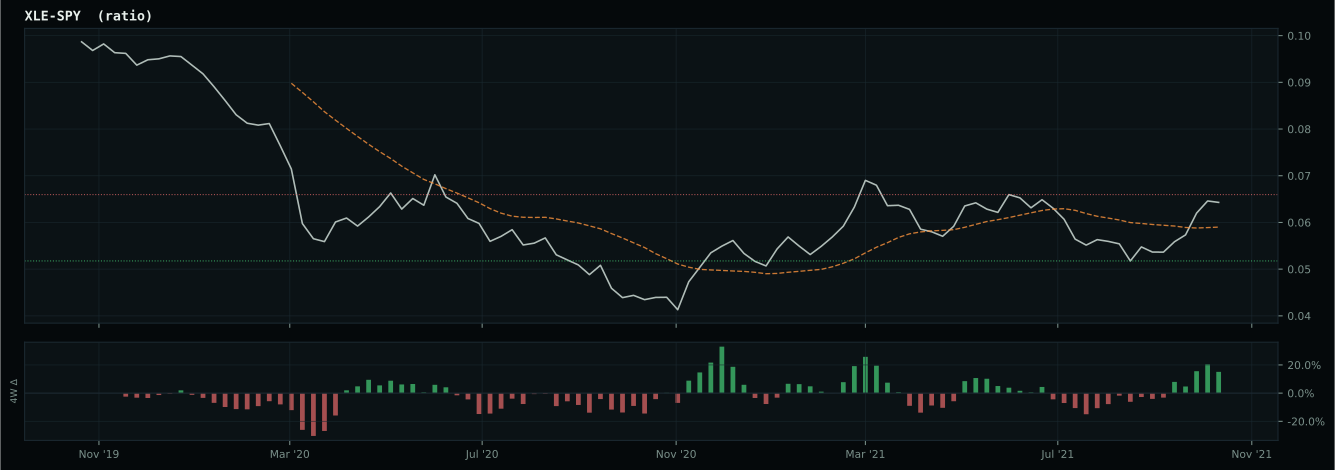
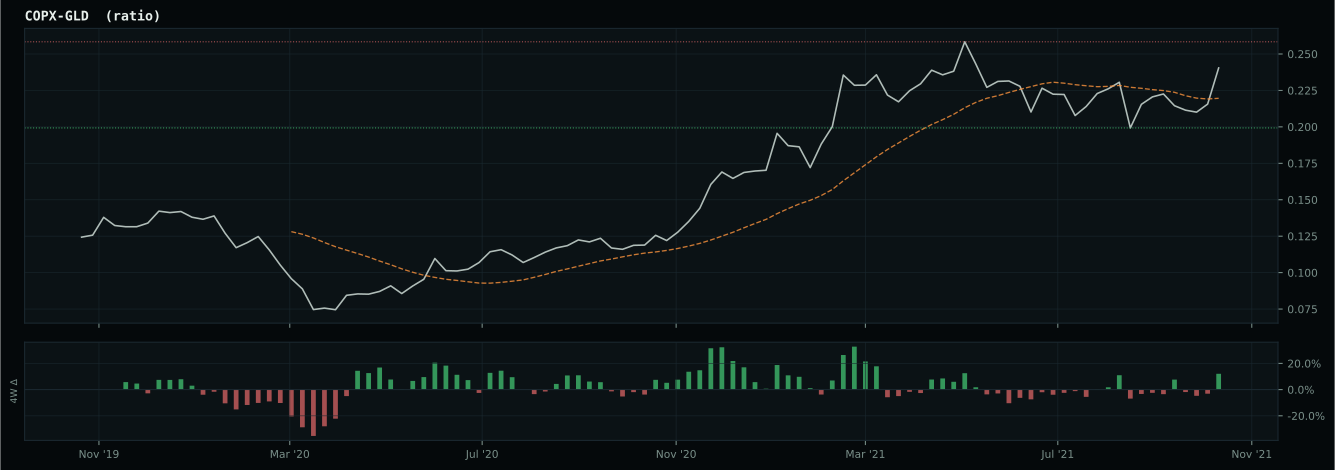
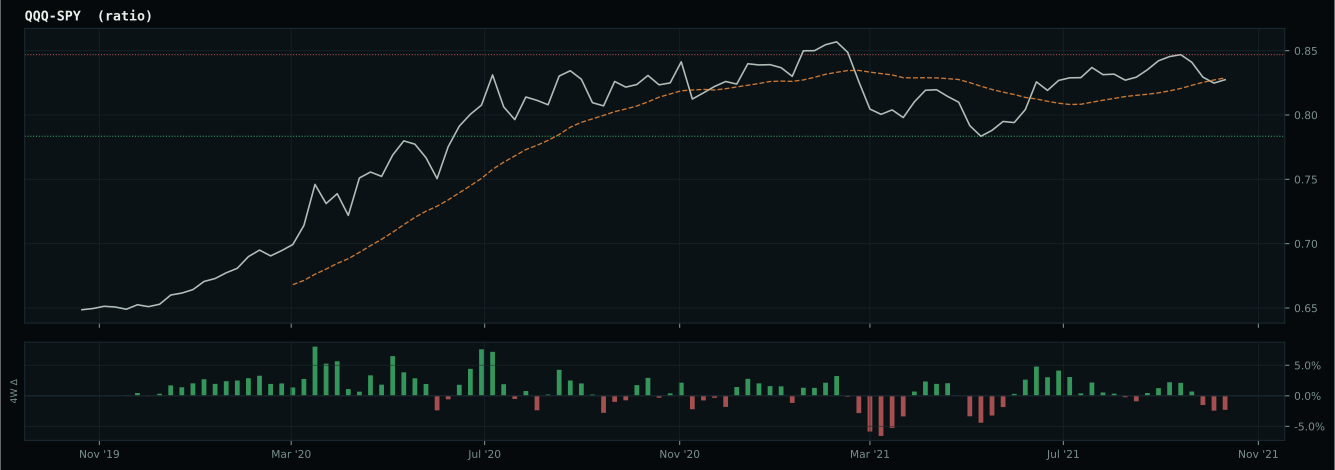
Macro Evidence Charts
Market-implied signals behind the macro regime scores. Each ratio compares two assets; the direction and slope of the ratio is what the macro engine reads.
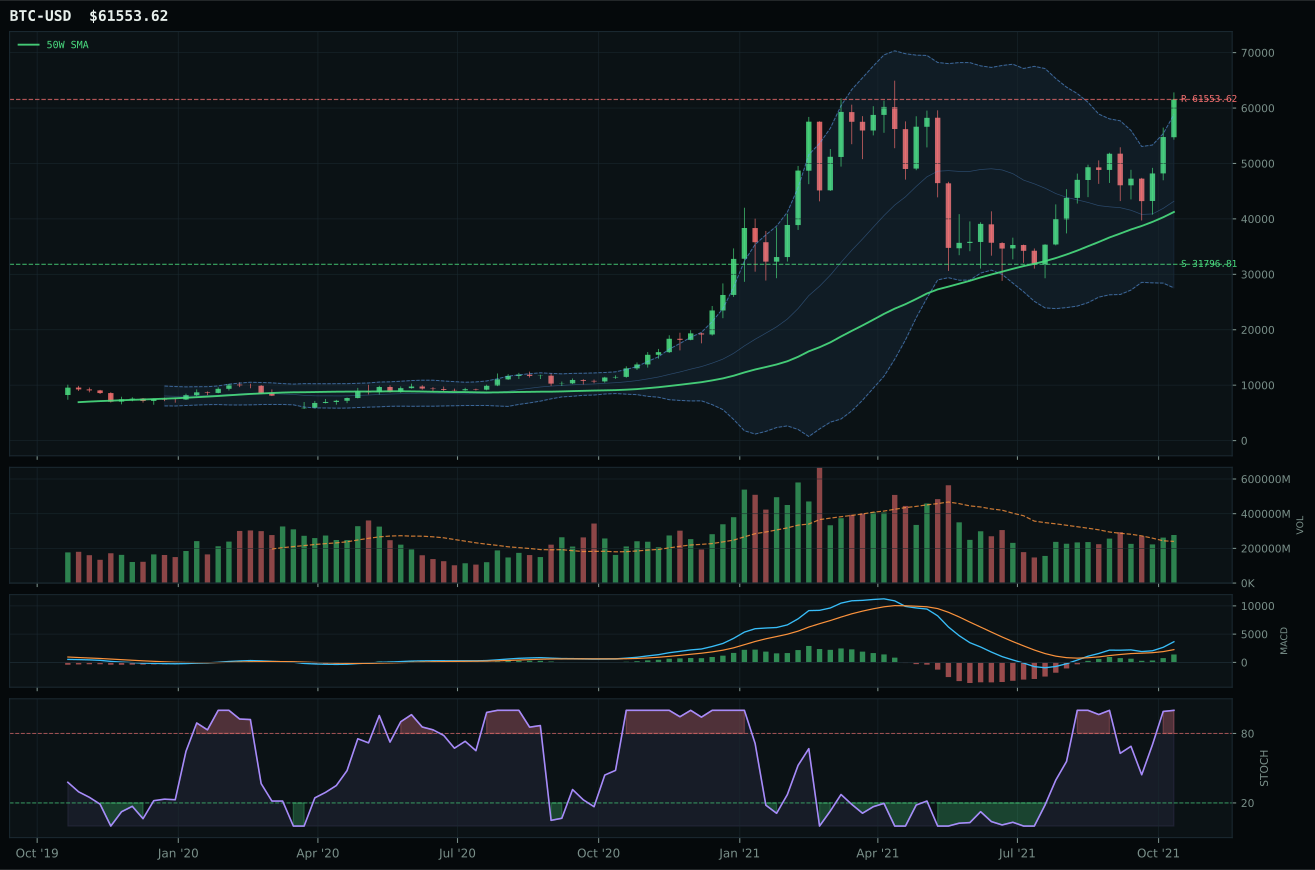
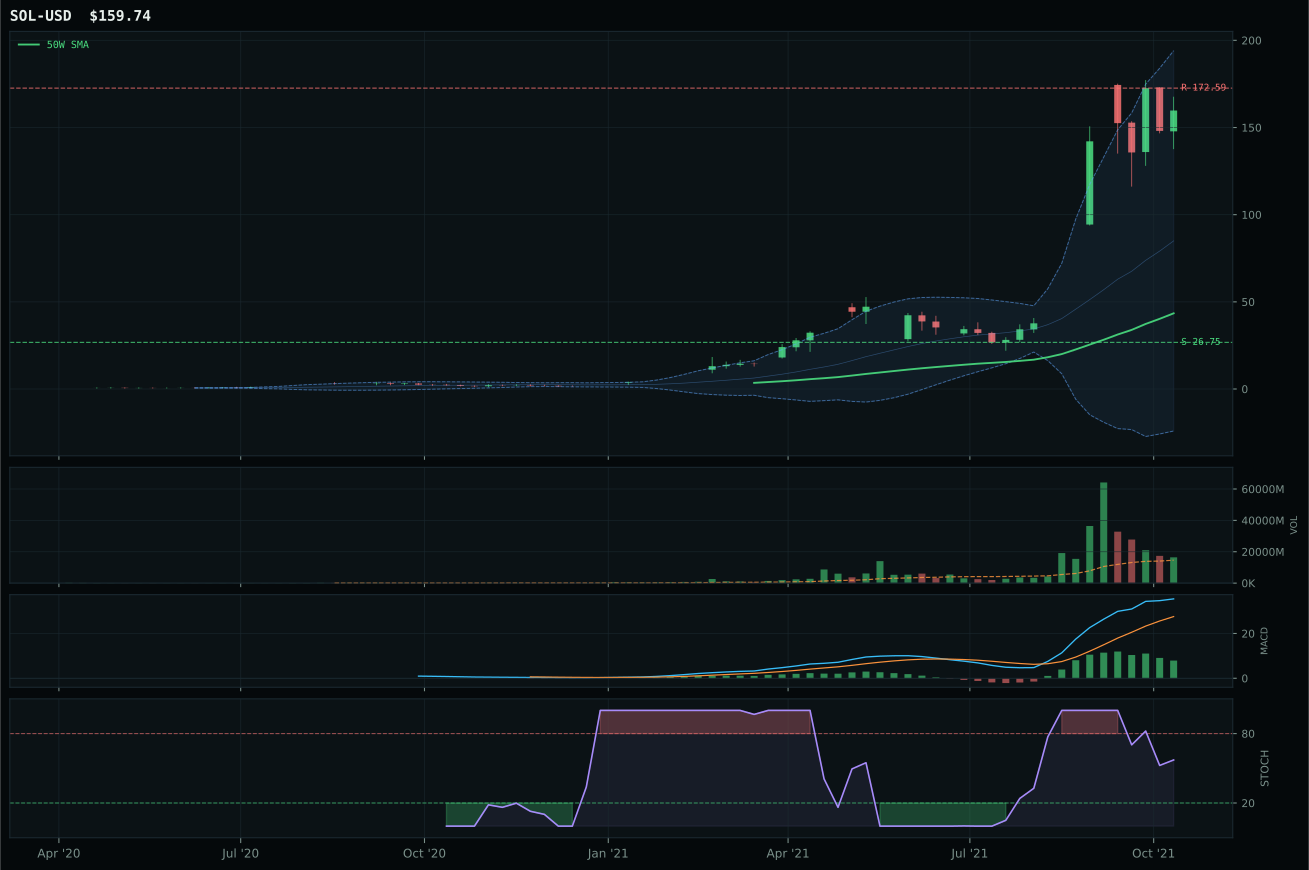
Crypto Regime — AltSeason
ValueBTC not armed: BTC has not made the first post-breakdown touch of the 200W buy zone after losing the 50W
TrendBTC confirmed: 2 consecutive closes above rising/flat 50W SMA
all available AltSeason conditions pass; missing optional confirmations skipped
Category Rankings
| Rank | Category | Winner | Score | Alloc | 4W Ret | Peers (4W) |
|---|---|---|---|---|---|---|
| 1 | Traditional Energy | XLE | 82.8 | 20% | -0.67% | FCG +0.0% · XOP +0.5% |
| 2 | Industrial Metals | COPX | 73.1 | 20% | -5.61% | PICK -4.1% · REMX +4.6% |
| 3 | Agriculture & Livestock | WEAT | 71.9 | 10% | +10.28% | MOO +3.3% · VEGI +4.3% |
| 4 | Nuclear Energy | URA | 70.8 | 10% | +8.97% | URNM +8.3% · NLR +2.1% |
| 5 | Technology | CIBR | 53.0 | 10% | +7.30% | IGV +5.0% · XLK +8.3% |
| 6 | Utilities & Infrastructure | IGF | 50.5 | 10% | +1.08% | PAVE +9.0% · XLU +2.6% |
| 7 | AI | SMH | 50.5 | 10% | +16.33% | BOTZ +4.4% · AIQ +5.6% |
| 8 | Defense & Aerospace | ITA | 49.8 | 10% | +0.65% | XAR +0.8% · ROKT +2.4% |
| 9 | Emerging Markets | INDA | 47.7 | 0% | +0.91% | IEMG +1.0% · ILF -4.5% |
| 10 | Precious Metals | GDX | 45.7 | 0% | +7.38% | SLV +7.5% · GLD +5.2% |
Traditional Energy — XLE
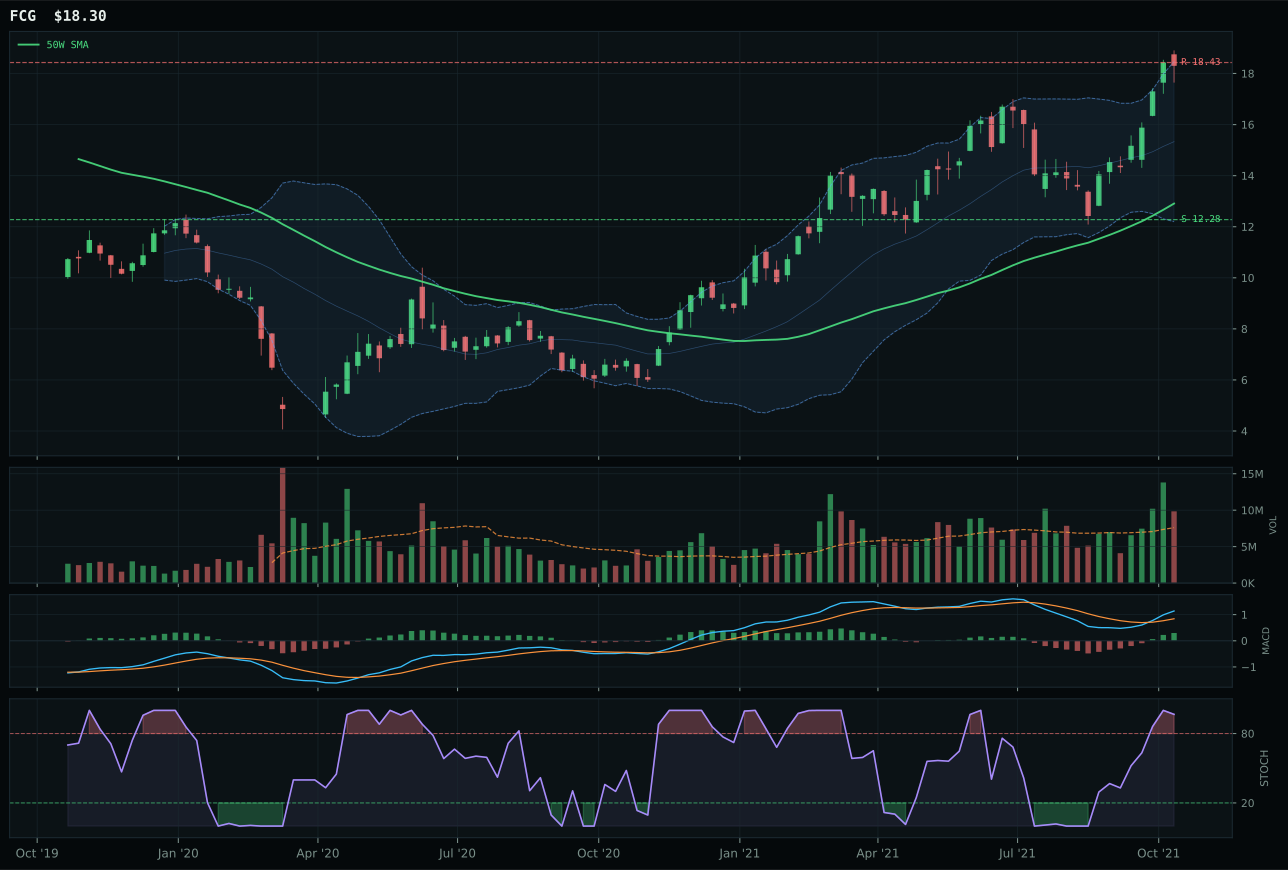
FCG has a vertical extension profile with 26.9% 13-week relative strength versus SPY.
A failed hold above support would weaken the setup.
Actionable but governed by invalidation levels.
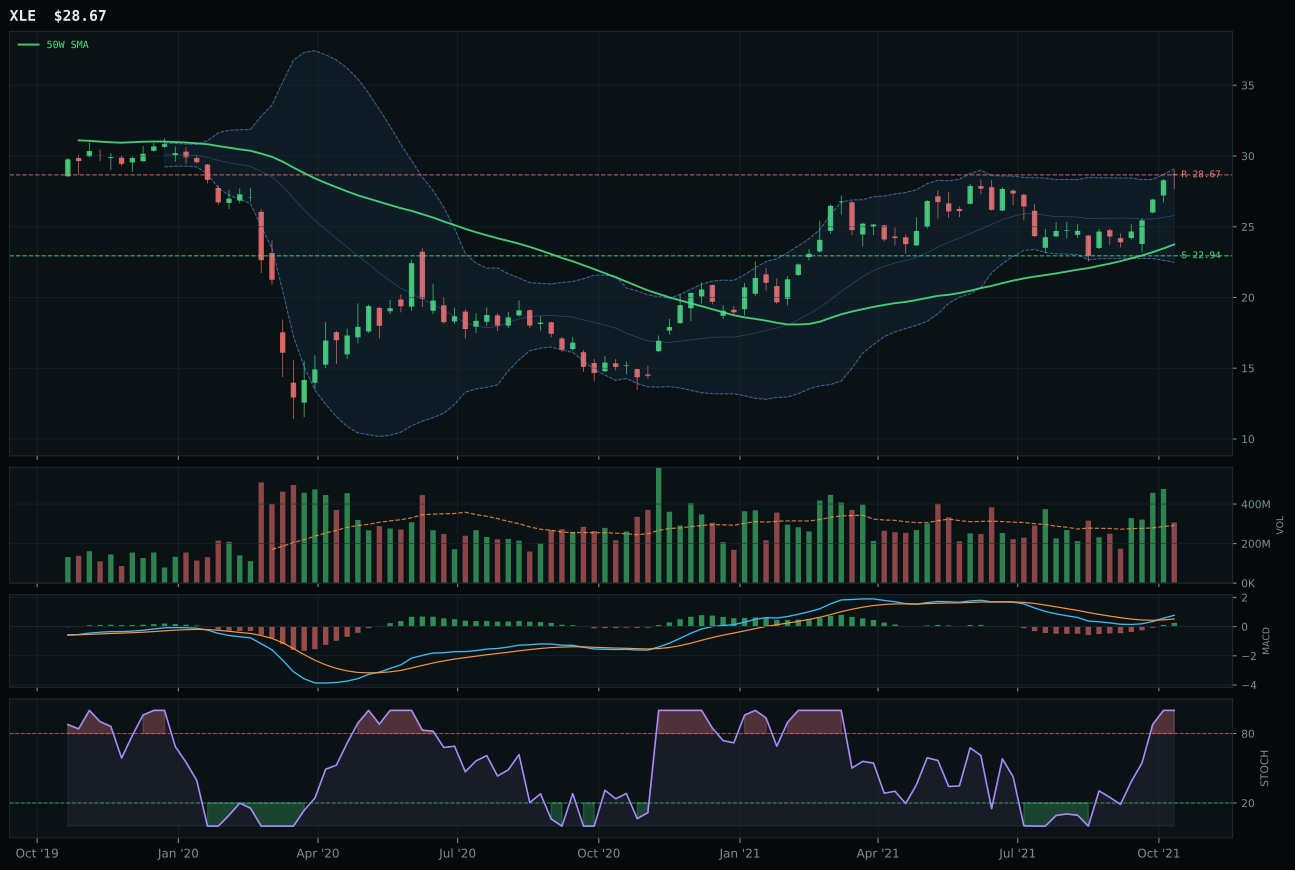
XLE has a vertical extension profile with 14.4% 13-week relative strength versus SPY.
A failed hold above support would weaken the setup.
Actionable but governed by invalidation levels.
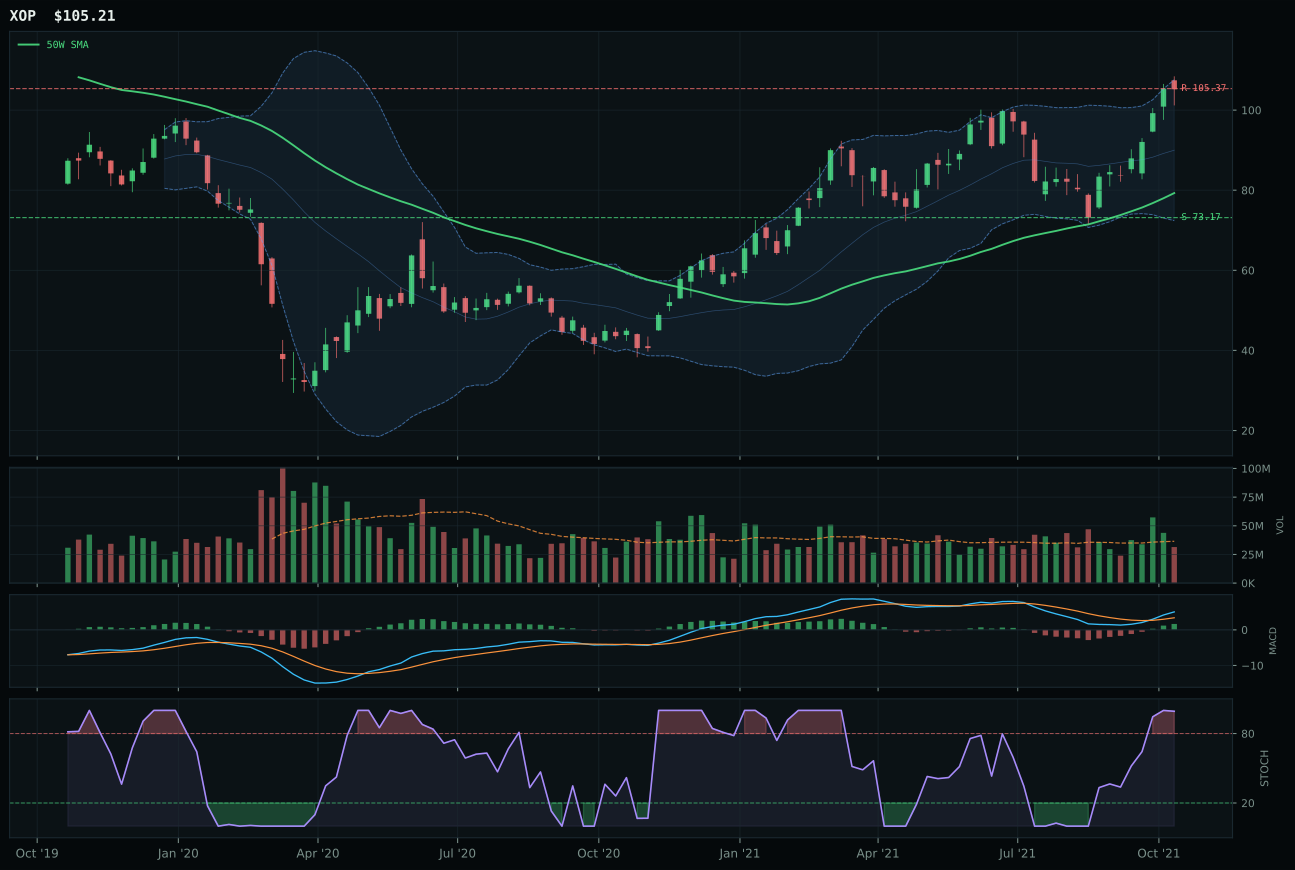
XOP has a vertical extension profile with 24.4% 13-week relative strength versus SPY.
A failed hold above support would weaken the setup.
Actionable but governed by invalidation levels.
XLE wins with a 100.0 trend score and perfect 100.0 momentum confirmation, posting a 17.8% thirteen-week return with 14.4% SPY relative strength—both the highest absolute numbers in the energy bucket. Price sits 20.7% above the 50W in vertical extension structure, putting the setup at maximum entry risk, yet the bullish, improving MACD and above-neutral volume (1.05x) confirm accumulation rather than distribution. FCG beat XLE on technical evidence (80.2 vs 67.6) and delivered even more aggressive returns (30.2% thirteen-week, 26.9% RS versus SPY), but paid for extreme extension at 41.8% above the 50W—that depth of extension forces a timing score penalty (37.0 vs 37.0, tied, but the risk-reward gap widens to FCG's detriment at 37.3 vs 42.8). XLE's category-relative strength of -10.0% is anomalous in a winning setup, suggesting it is lagging peers despite absolute strength; this actually strengthens the case because it indicates XLE has more room to rebalance upward within the category.
Traditional Energy receives 10% allocation as a top-2 category at 82.8 final score, the highest-ranked category in the entire portfolio. This is a true 10% weight and represents the highest conviction trade this week. The macro fit is 85.0—the second-strongest in the system—anchored on energy scarcity (+16), inflation pressure (+10), supply shortage (+9), and real asset sponsorship (+7); credit stress (-7) is the only meaningful headwind. XLE's 100.0 momentum confirmation, bullish improving MACD, and perfect trend score make this the most technically synchronized category available. The tension is extension risk: at 20.7% above the 50W, price is priced for perfect execution. A 52-week high breakout with volume surge would validate the extension; a retest of the 22.94 support level would negate it. The top-2 allocation reflects a high-conviction call that (1) energy scarcity is the most actionable macro theme in the current regime, (2) XLE's technical setup is the cleanest expression of that theme with perfect momentum confirmation, and (3) the risk-reward, while compressed (42.8/100), justifies the entry against 14.4% relative strength and +17.8% three-month returns.
Industrial Metals — COPX
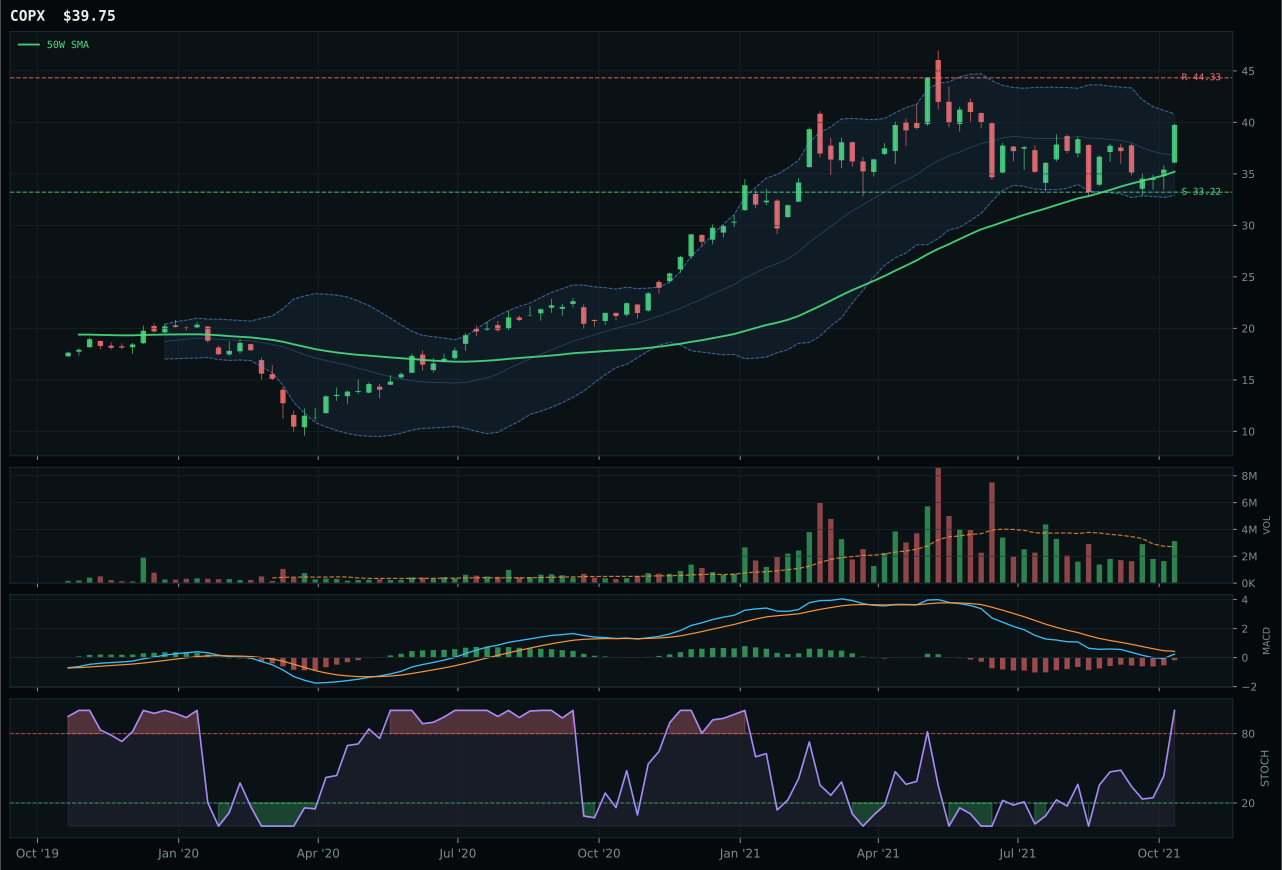
COPX has a neutral structure profile with 9.6% 13-week relative strength versus SPY.
A failed hold above support would weaken the setup.
Actionable but governed by invalidation levels.
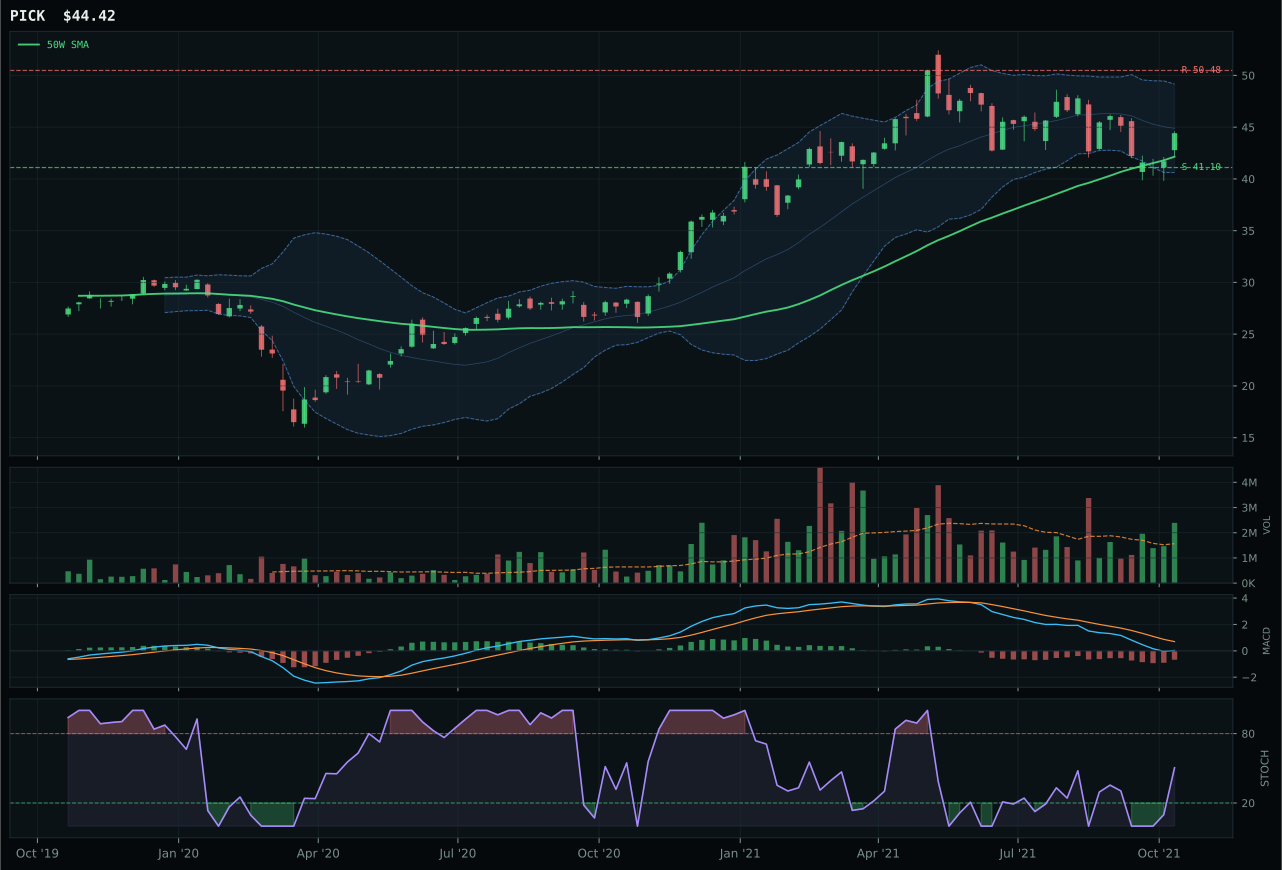
PICK has a neutral structure profile with -4.3% 13-week relative strength versus SPY.
A failed hold above support would weaken the setup.
Actionable but governed by invalidation levels.
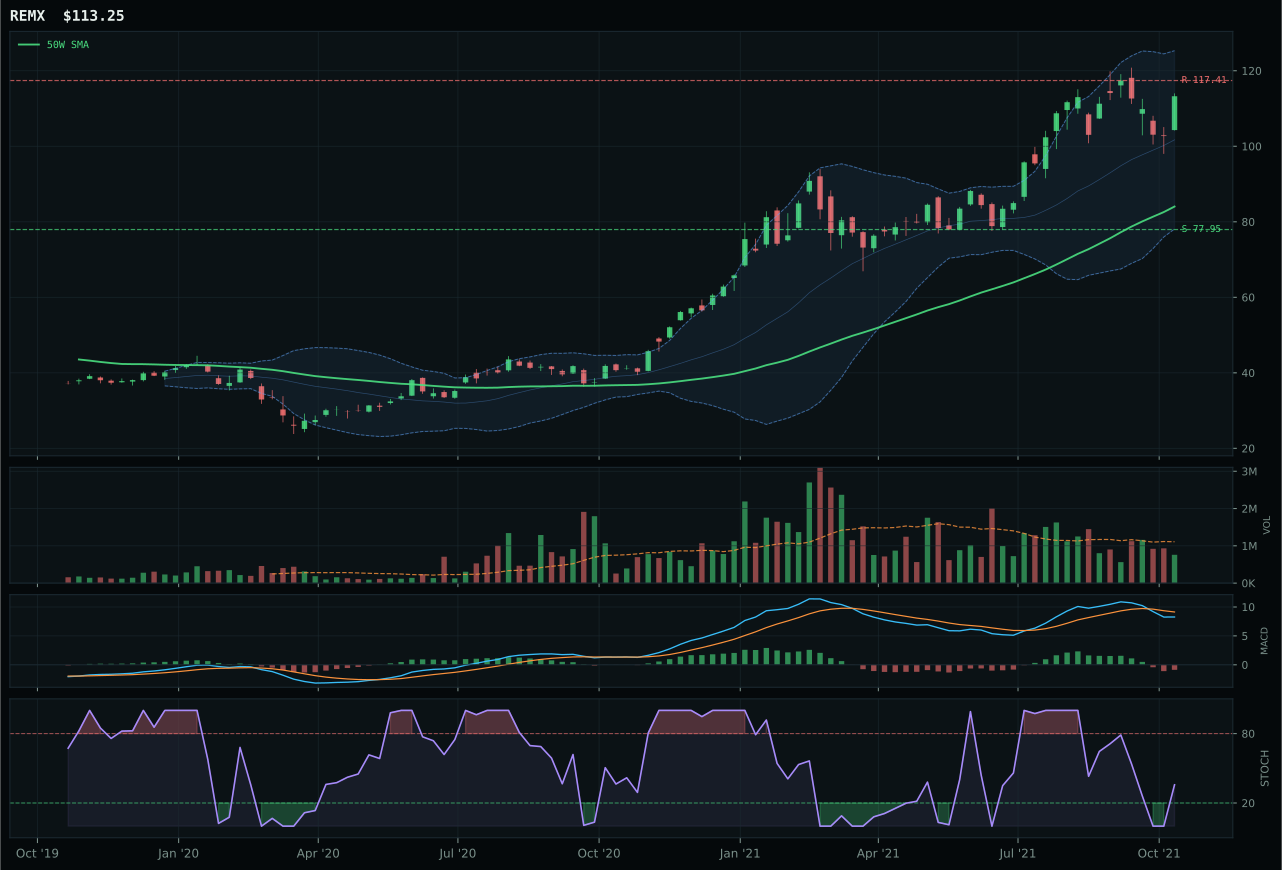
REMX has a vertical extension profile with 15.3% 13-week relative strength versus SPY.
A failed hold above support would weaken the setup.
Actionable but governed by invalidation levels.
COPX wins decisively with the highest momentum composite (100.0 on momentum confirmation) in the entire portfolio, combining a 13-week return of 12.9% with 9.6% SPY relative strength and above-average volume participation at 1.16x the 20W average. Price is 12.9% above the 50W with a perfect 1.0% slope and bullish, improving MACD—every technical pillar is firing. PICK lost the head-to-head because its RS versus SPY is -4.3% (mining breadth underperforming despite positive commodity narrative) and category-relative strength lags at -13.9%, a chasm that reveals COPX is winning the accumulation war inside copper-focused scarcity plays. The 12.9-point score gap is the largest in the entire category set this week, confirming this is the clearest possible winner. Macro fit is 69.0, anchored on metals scarcity (+12) and commodity breadth (+7), meaning the trade has both technical sponsorship and fundamental underpinning.
Industrial Metals earns a 10% allocation as a top-2 category at 73.1 final score. This is a true 10% weight (not halved by the overlay, since the overlay applies to all categories proportionally). COPX's momentum signature and category-level macro fit (73.0 on scarcity themes and real asset sponsorship +6) make this the clearest offensive allocation in the portfolio this week alongside Traditional Energy. The risk is entry: COPX is 12.9% extended above the 50W and trading into overbought stochastic territory, meaning new buyers are statistically late. The risk-reward (54.5/100) reflects only 10.3% upside to 44.33 resistance against 19.7% downside to support—an asymmetric payoff for an already-extended trade. The top-2 decision is justified because (1) momentum confirmation is textbook perfect, (2) macro fit (metals scarcity, commodity breadth, real asset sponsorship) is among the strongest in the system, and (3) the category's 73.1 score sits only 0.3 points behind Traditional Energy's 82.8, placing them in the same conviction tier despite different risk profiles.
Agriculture & Livestock — WEAT
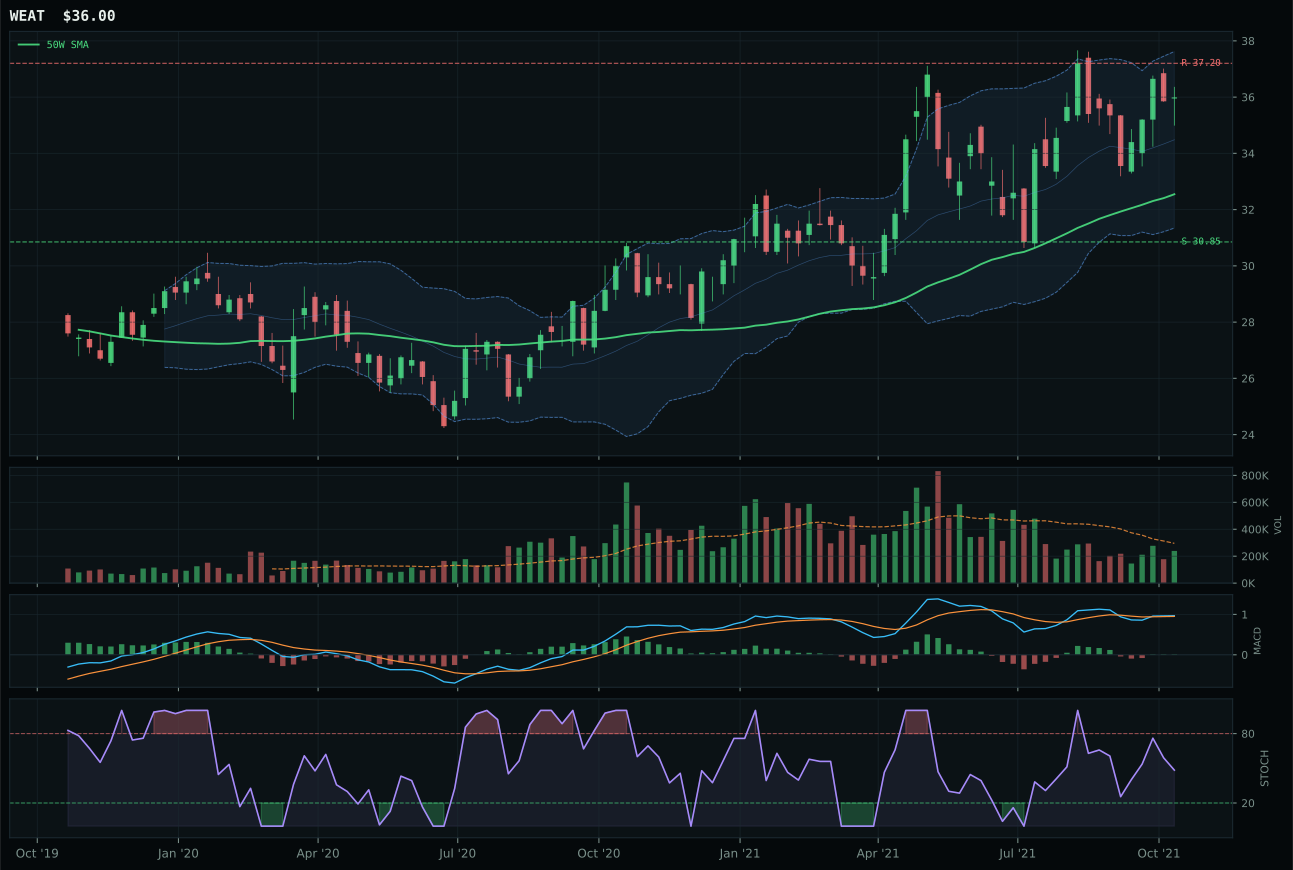
WEAT has a neutral structure profile with 2.0% 13-week relative strength versus SPY.
A failed hold above support would weaken the setup.
Actionable but governed by invalidation levels.
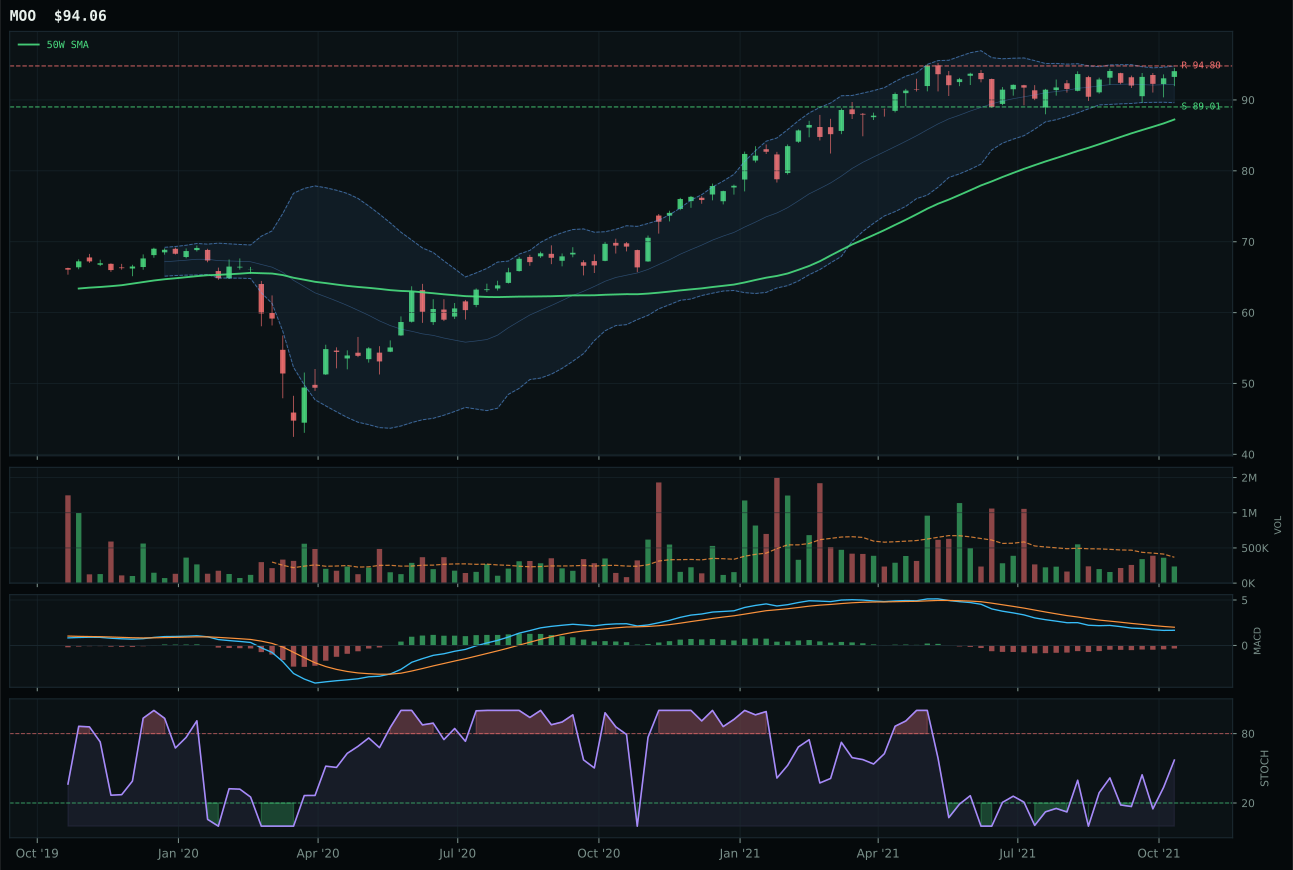
MOO has a neutral structure profile with 0.9% 13-week relative strength versus SPY.
A failed hold above support would weaken the setup.
Actionable but governed by invalidation levels.
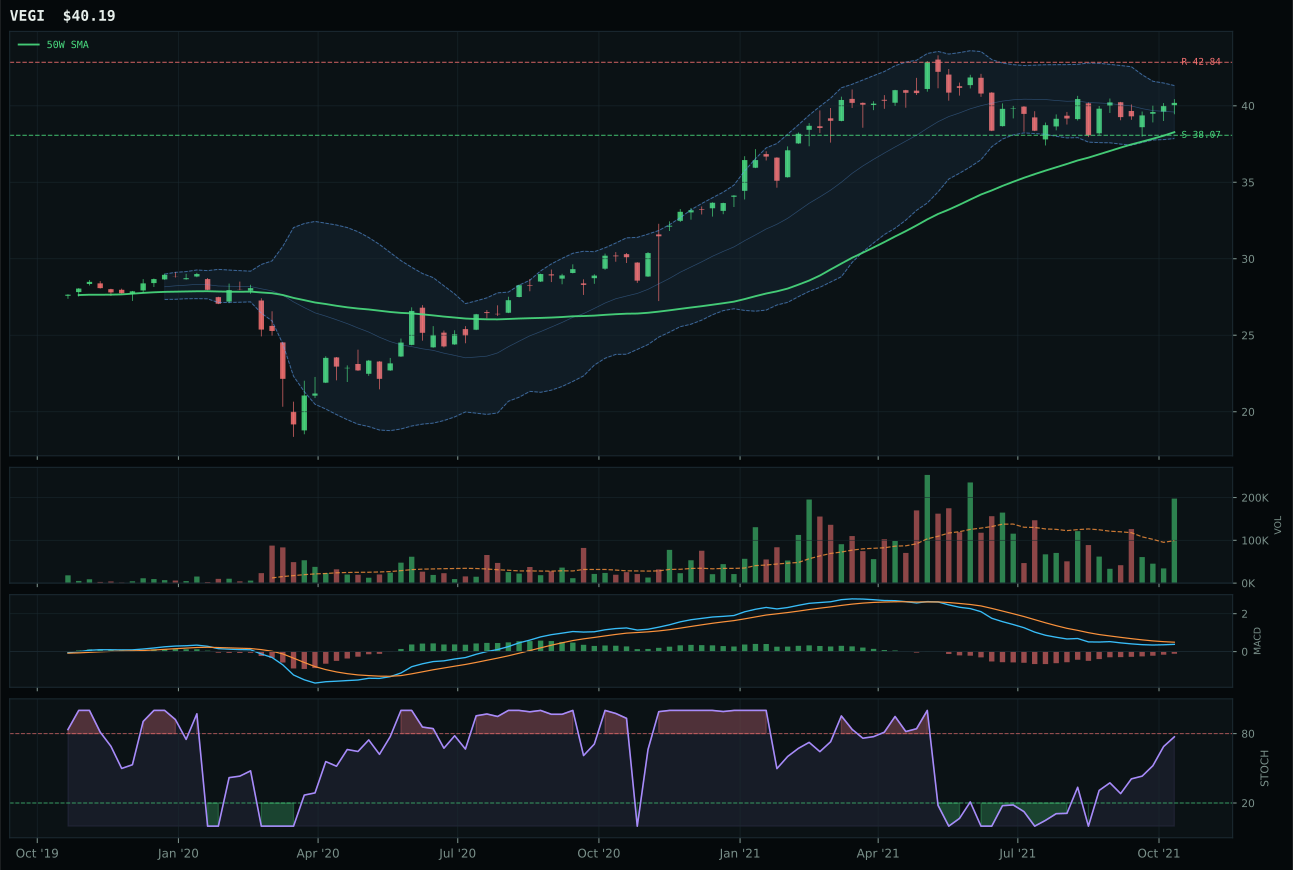
VEGI has a neutral structure profile with 1.4% 13-week relative strength versus SPY.
A failed hold above support would weaken the setup.
Tracked, but not top-2 eligible because: .
WEAT wins with a perfect trend score (100.0) and bullish, improving MACD—the only two critical ingredients missing from a flawless setup. Price sits above both moving averages with a 0.4% slope and 2.0% SPY relative strength, capturing agricultural commodity scarcity momentum across a macro landscape screaming supply shortage and inflation pressure. The 13-week return of 5.4% is modest but real, and the 0.7% category-relative strength beats MOO's -0.4%, a critical margin in a tight field. MOO lost because its MACD remains bearish despite improving (versus WEAT's bullish and improving), volume is thin at 0.81x, and the risk-reward is weaker (39.5 vs 48.5); all three are second-tier signals. The macro fit (86.0 category-level) is overwhelming—supply shortage +13, inflation pressure +10, commodity breadth +5—meaning this category won its allocation slot primarily on external tailwinds, not internal technical purity.
Agriculture & Livestock receives 5% allocation at a 71.9 category score, tier-3 despite a top-tier macro narrative. With the 50% overlay, this is a true 5% position. The category's macro fit of 86.0 is the highest in the portfolio, yet WEAT's technical evidence is only 79.5, creating a rare case where macro carries category rank without translating to top-2 eligibility. The tension is entry risk: WEAT sits 10.6% above the 50W in a setup where new buyers are late, and the momentum is being penalized (timing 75.0, risk-reward 48.5) despite bullish MACD and rising 13W returns. To justify top-2 status, WEAT would need either a pullback to test support at 30.85 for fresh accumulation, or additional macro catalysts beyond supply/inflation (perhaps Chinese demand recovery or weather shock premium). Currently, the allocation reflects a conviction macro call with acceptable but not exceptional technical timing.
Nuclear Energy — URA
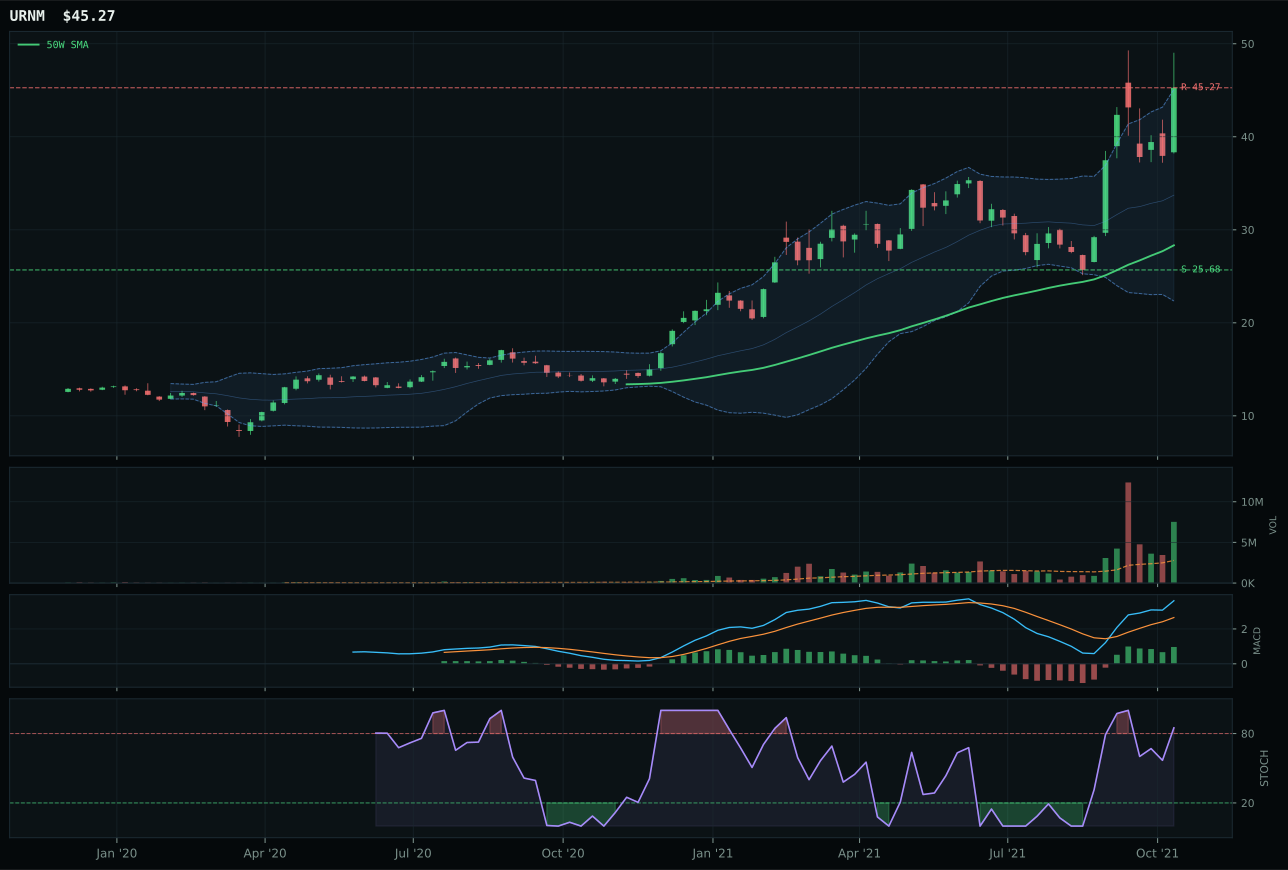
URNM has a vertical extension profile with 60.7% 13-week relative strength versus SPY.
A failed hold above support would weaken the setup.
Actionable but governed by invalidation levels.
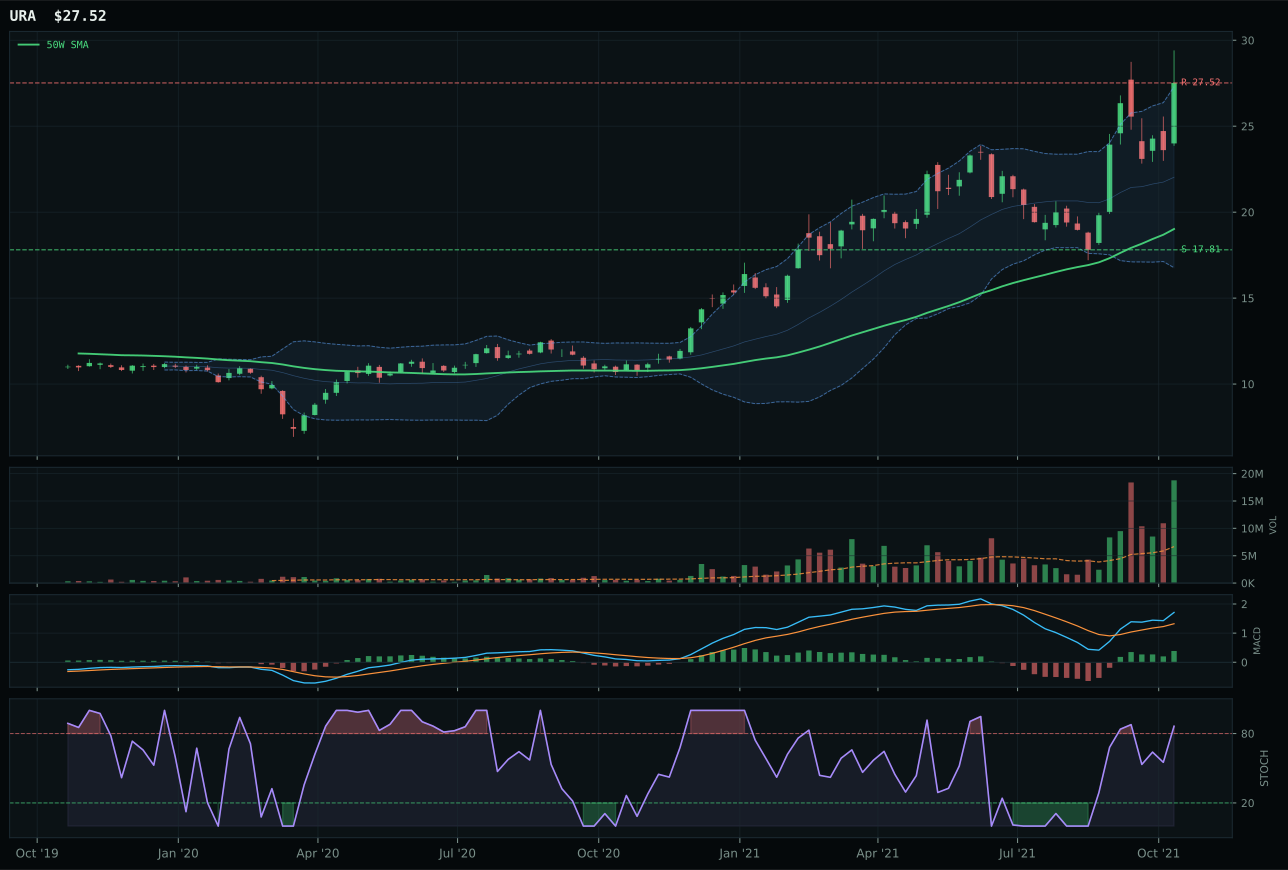
URA has a vertical extension profile with 38.3% 13-week relative strength versus SPY.
A failed hold above support would weaken the setup.
Actionable but governed by invalidation levels.
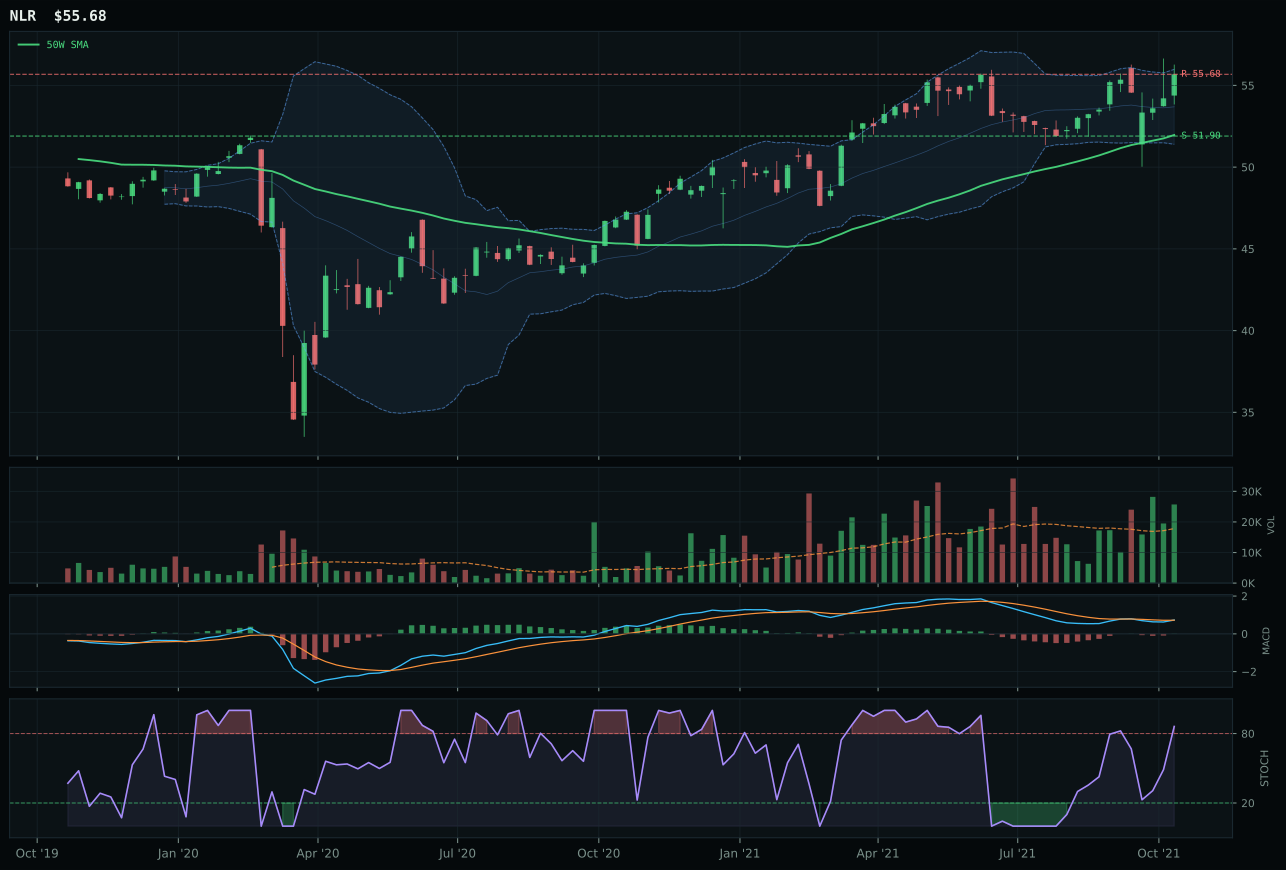
NLR has a neutral structure profile with 2.5% 13-week relative strength versus SPY.
A failed hold above support would weaken the setup.
Tracked, but not top-2 eligible because: .
URA wins decisively with a 100.0 trend score and 100.0 momentum confirmation, delivering a 41.7% thirteen-week return with 38.3% SPY relative strength—extraordinary absolute performance. Volume is accumulation-confirmation at 2.82x the 20W average, the highest participation in the entire portfolio, signaling institutional conviction in this deep-extended setup. Price sits 44.7% above the 50W near the 52W high, making this the most extended chart in the allocation set, yet the bullish, improving MACD and 90.7% volume-price confirmation justify the stretch. URNM lost because MACD is bullish but flattening (not improving) and the chart is even more extended at 59.8% above the 50W, pushing timing into invalidation territory. The score gap (9.2 points) is smaller than most category decisions, reflecting genuine competitive strength in URNM, but URA's edge in MACD quality and acceptable timing (37.0 vs worse) carries the win. Macro fit (69.0) is driven by energy scarcity (+9), real asset sponsorship (+7), AI growth (+5), and inflation (+3).
Nuclear Energy receives 5% allocation at a 70.8 category score, tier-3 despite the highest absolute momentum numbers in the portfolio. The 50% overlay compresses this to a true 5% position. URA's 41.7% thirteen-week return and 38.3% SPY relative strength are extraordinary on paper, yet the extreme 44.7% extension above the 50W (second-longest stretch in the portfolio) and risk-reward of only 29.6/100 (nearly all downside, zero upside) force tier-3 ranking. The macro fit (69.0) is solid but not exceptional—energy scarcity and real asset sponsorship help, but no category-specific nuclear premium exists in the descriptor checklist. This allocation is a satellite position: meaningful enough to capture the AI-driven demand for compute power and clean energy, but sized for safety given extension risk. To earn top-2 status, URA would need either a pullback to the 27.52 resistance-turned-support to reset extension metrics, or a fresh macro catalyst (e.g., announced grid expansion, grid reliability concerns spiking). Current allocation reflects a conviction long-term thesis with uncomfortable short-term entry mechanics.
Technology — CIBR
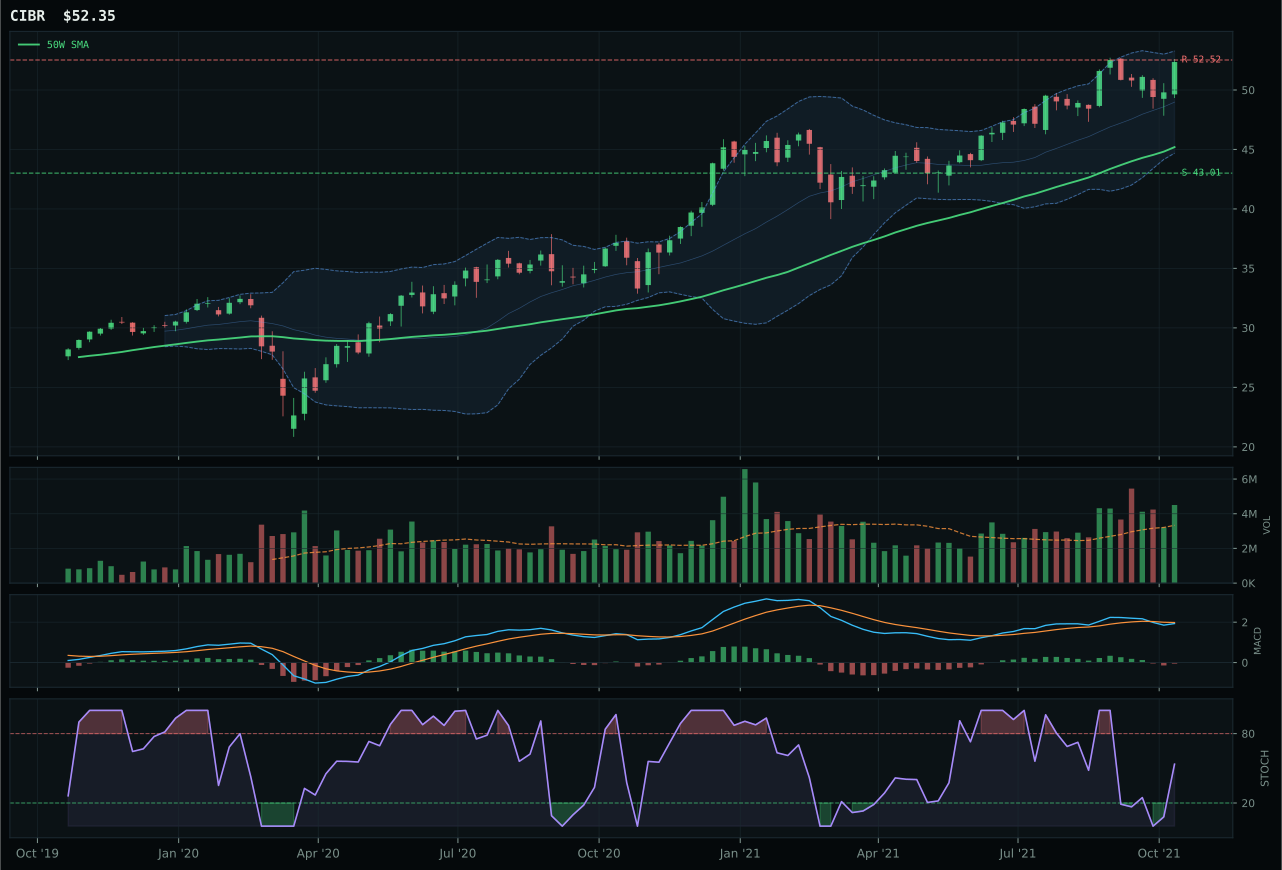
CIBR has a vertical extension profile with 7.6% 13-week relative strength versus SPY.
A failed hold above support would weaken the setup.
Actionable but governed by invalidation levels.
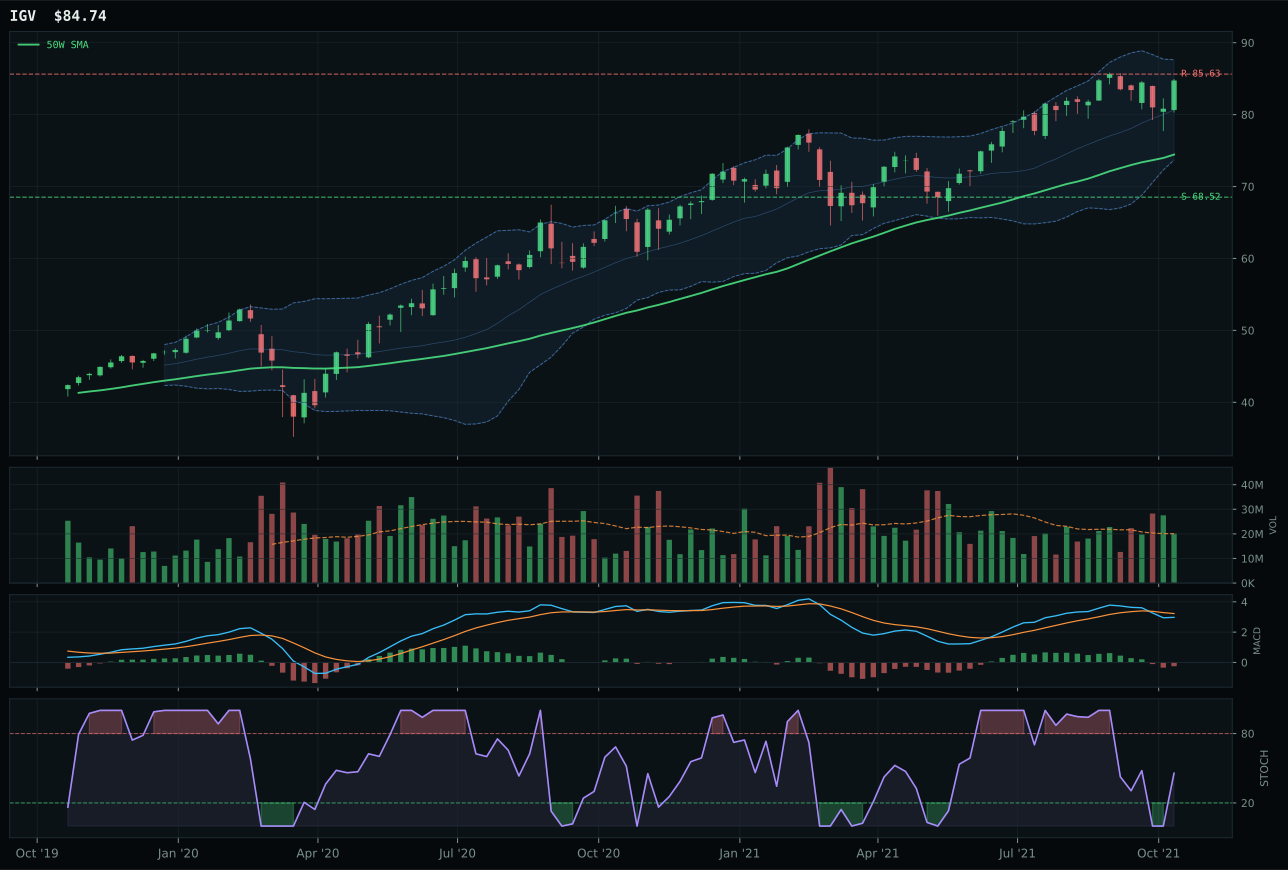
IGV has a neutral structure profile with 5.6% 13-week relative strength versus SPY.
A failed hold above support would weaken the setup.
Actionable but governed by invalidation levels.
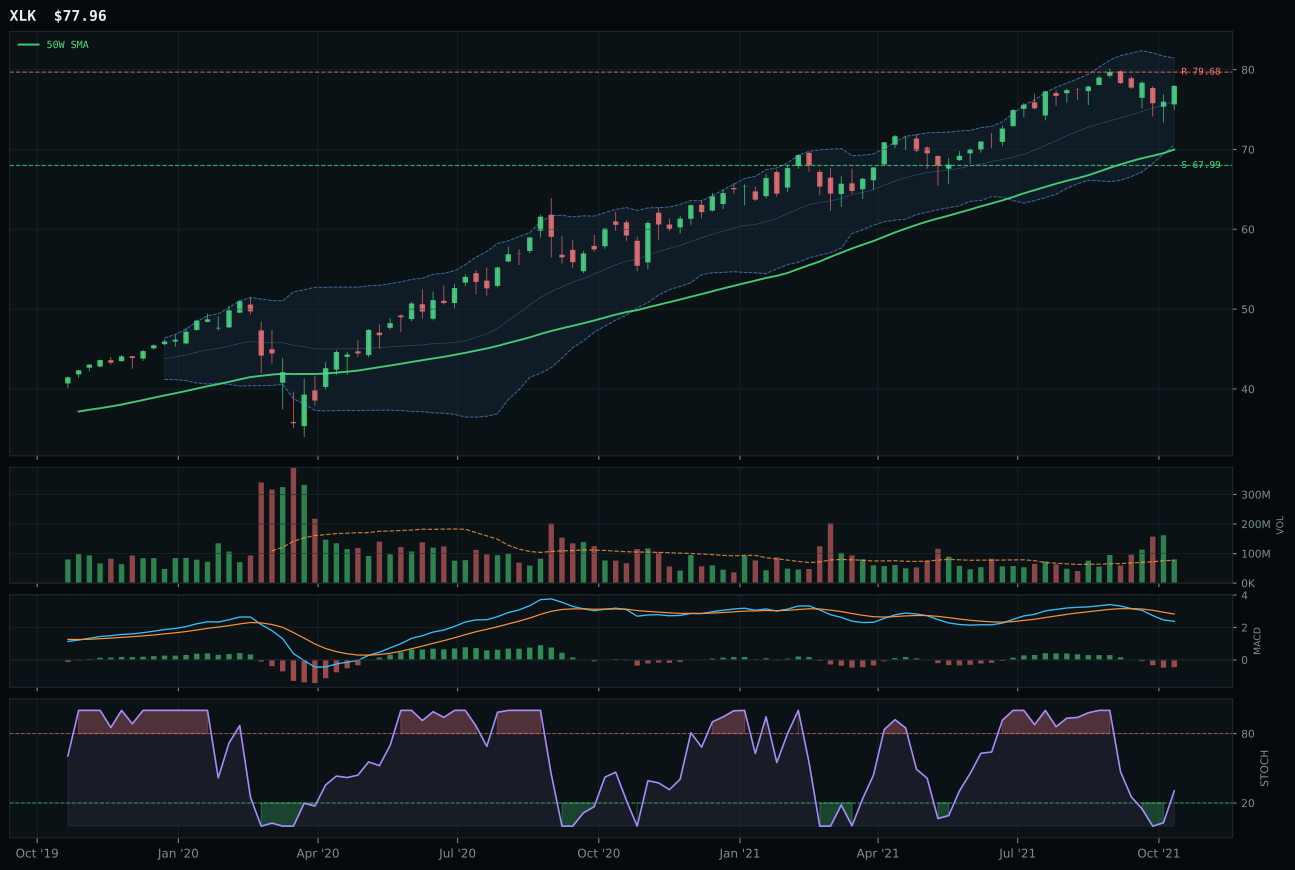
XLK has a neutral structure profile with 0.4% 13-week relative strength versus SPY.
A failed hold above support would weaken the setup.
Actionable but governed by invalidation levels.
CIBR wins the category because cybersecurity sits in clean uptrend structure with price 15.8% above its 50-week moving average and a 7.6% relative strength edge versus SPY. The 13-week return of 11.0% is genuine momentum, not volatility noise—above-average volume at 1.35x the 20-week average confirms that new accumulation is sponsoring the move, not redemptions. IGV lost ground because its stochastic RSI is falling into neutral territory while CIBR's is rising mid-zone; that timing divergence matters when both charts sit extended. The setup is vertical extension near the Fib 0.236 zone, meaning every new buyer is materially late, but the quality of sponsorship—domestic credit stress fears are pushing demand for defensive tech—keeps the technical case intact.
Technology receives 5% allocation, narrowly missing the top-2 tier at a 53.0 category score. The 50% crypto overlay compression cuts normal tier sizes in half, so a 5% slot reflects a tier-3 ranking among the ten categories. CIBR's 11% thirteen-week return is real, but the macro environment works against it: liquidity expansion and AI sponsorship add 15 points to the macro fit (52.0/100), while credit stress digs into the narrative with a -7 hit. The tension is clear—the chart is extended, momentum is fading (MACD bearish), and the risk-reward (37.3/100) tells you resistance is nearly touching current prices. This category would need a pullback into its 50W near 43.01, fresh MACD bullish divergence, and a reset of extension metrics to justify top-2 consideration.
Utilities & Infrastructure — IGF
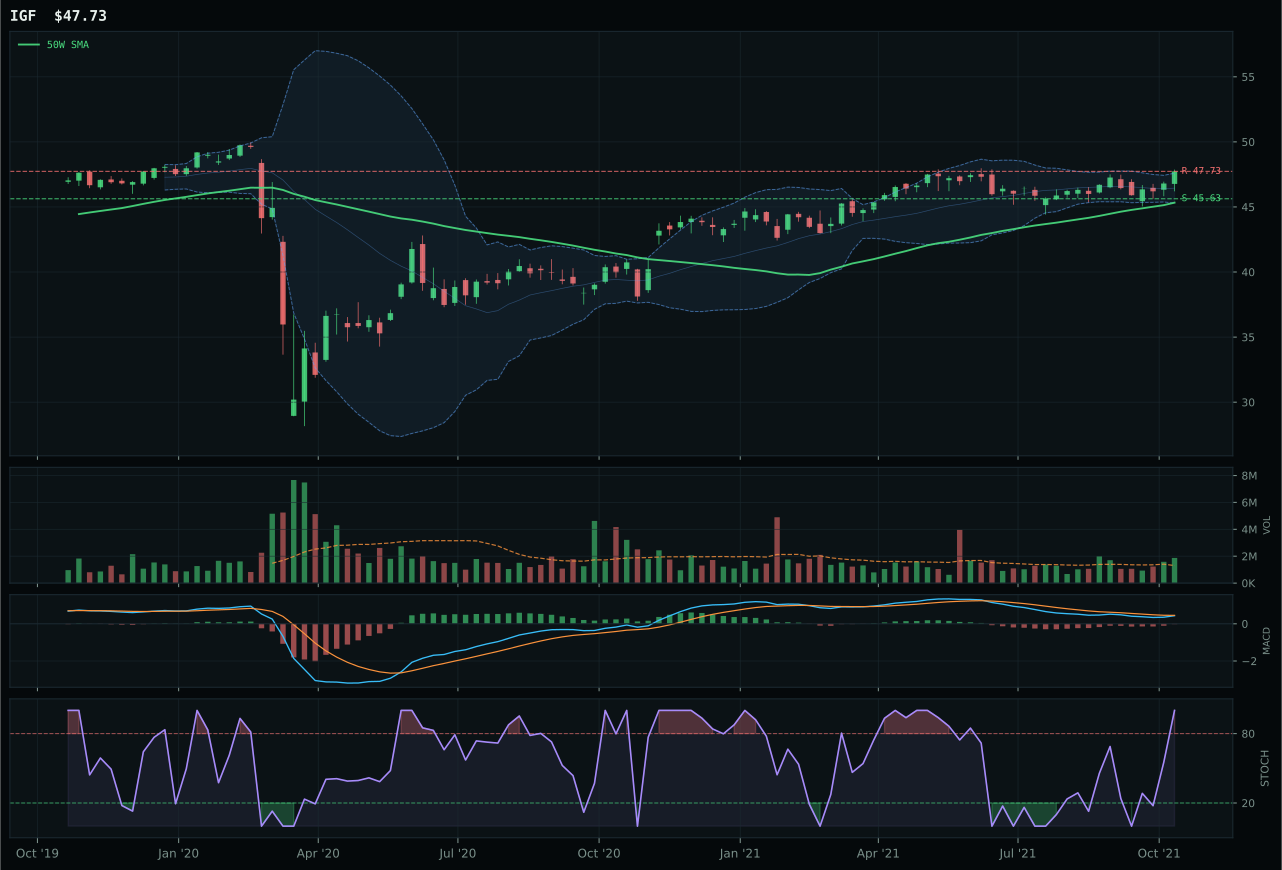
IGF has a pullback into support profile with 0.7% 13-week relative strength versus SPY.
A failed hold above support would weaken the setup.
Actionable but governed by invalidation levels.
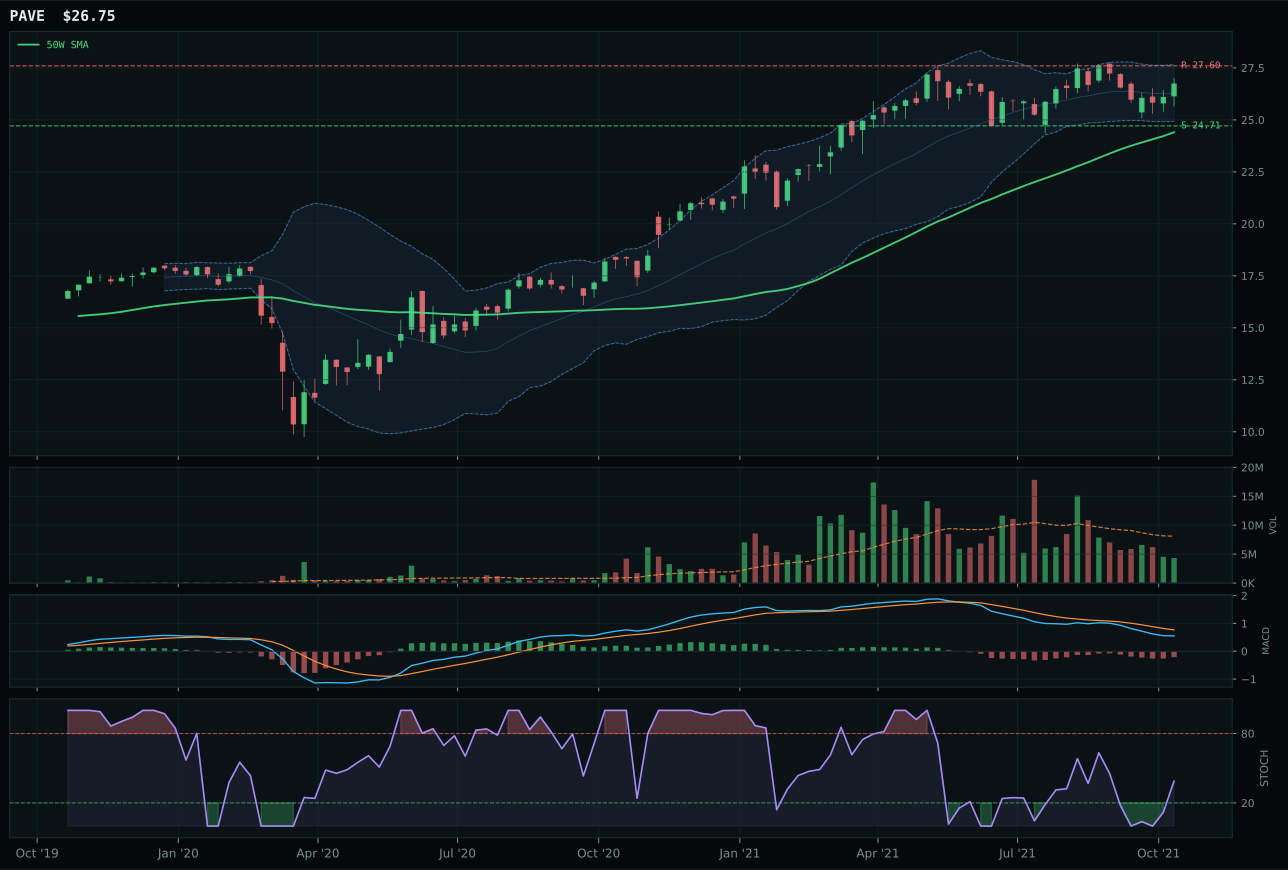
PAVE has a neutral structure profile with 2.6% 13-week relative strength versus SPY.
A failed hold above support would weaken the setup.
Actionable but governed by invalidation levels.
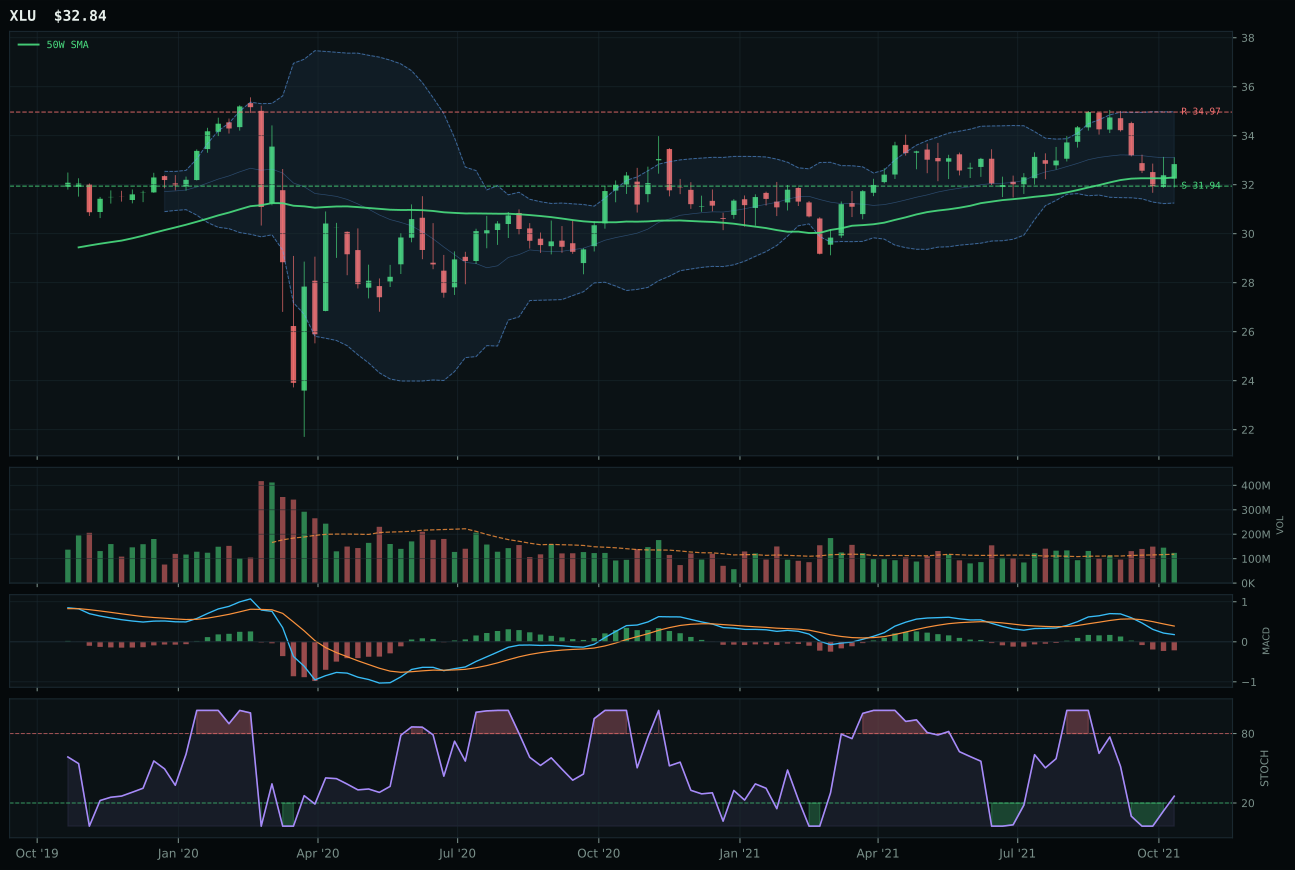
XLU has a pullback into support profile with -4.3% 13-week relative strength versus SPY.
A failed hold above support would weaken the setup.
Actionable but governed by invalidation levels.
IGF wins a clean decision with pullback-into-support structure, the highest-quality setup in the category. Price sits just 5.3% above the 50W with support tightly defined at 45.63, giving risk management a specific invalidation price. MACD is bearish but improving, stochastic is overbought at 1.00, and above-average volume at 1.44x the 20W creates a classic accumulation-into-support narrative. The 4.1% thirteen-week return is modest, but the 68.3% risk-reward (highest in category) and 85.0% timing score reflect that this is a mean-reversion setup, not a momentum chase. PAVE lost because its neutral structure offers no defined entry anchor, MACD is bearish/weakening (deteriorating), volume is thin at 0.65x, and risk-reward collapses to 43.7—a clear secondary position. IGF's category-relative strength matches PAVE's zero, but the structural edge is decisive.
Utilities & Infrastructure receives 5% allocation at a 50.5 category score, tier-3 in the middle of the pack. Macro fit is only 48.0—neutral—because Transition / Mixed regime helps slightly (+4) but inflation pressure significantly hurts (-6), and no category-specific tailwinds exist in the active descriptor list. IGF's technical case is the strongest component (80.9 technical evidence), yet the macro headwind prevents category elevation. The setup is a tactical mean-reversion trap at pullback-into-support levels rather than a conviction allocation. For this category to earn tier-2 consideration, either inflation pressure would need to reverse direction (lowering allocators' demand for defensive income), or a fresh macro catalyst would need to emerge around fiscal infrastructure spending. Currently, the 5% slot is a balanced position: IGF's pullback structure is mechanically attractive, but the macro regime offers no tailwind to ride, making this a mean-reversion bet on mean-reversion price action rather than a structural allocation.
AI — SMH
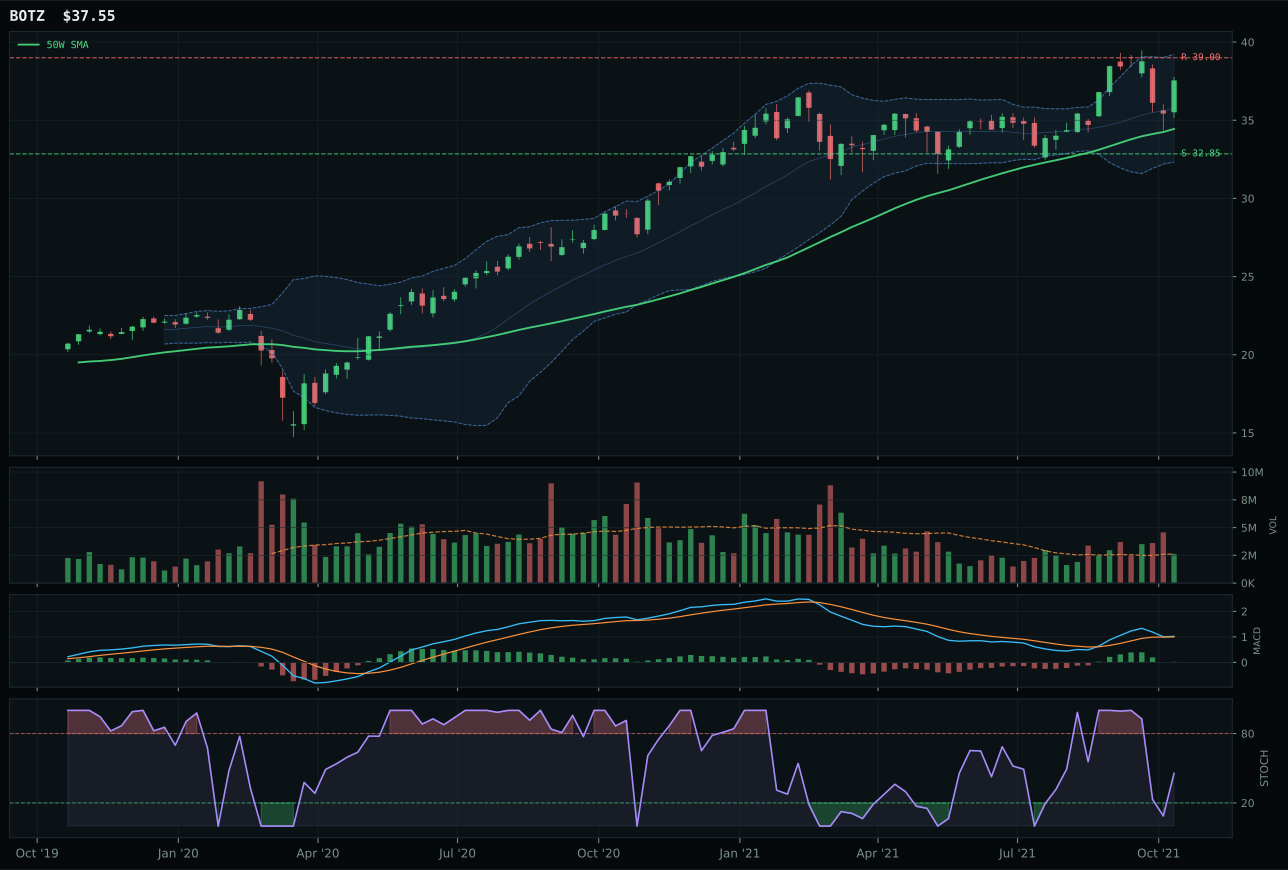
BOTZ has a neutral structure profile with 9.2% 13-week relative strength versus SPY.
A failed hold above support would weaken the setup.
Actionable but governed by invalidation levels.
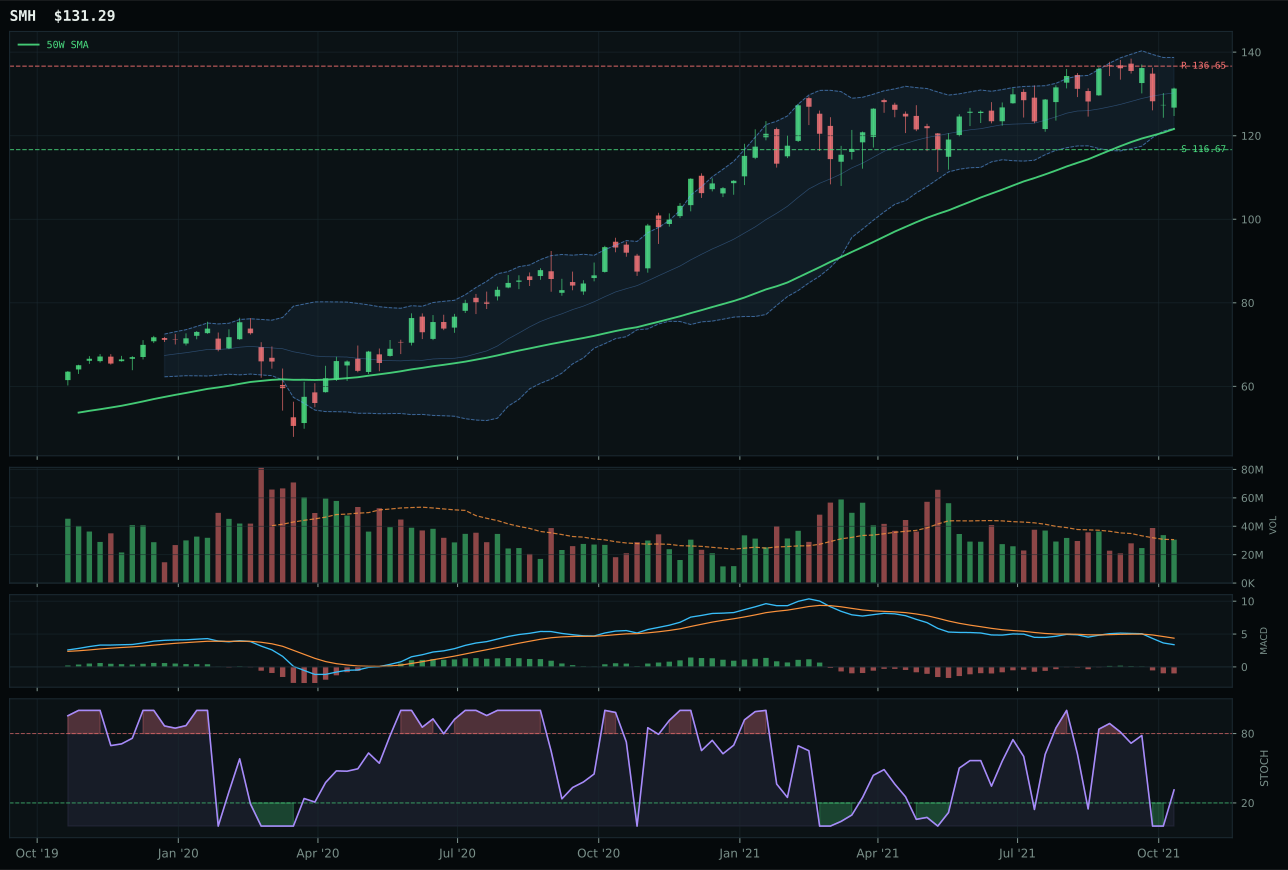
SMH has a neutral structure profile with 3.0% 13-week relative strength versus SPY.
A failed hold above support would weaken the setup.
Actionable but governed by invalidation levels.
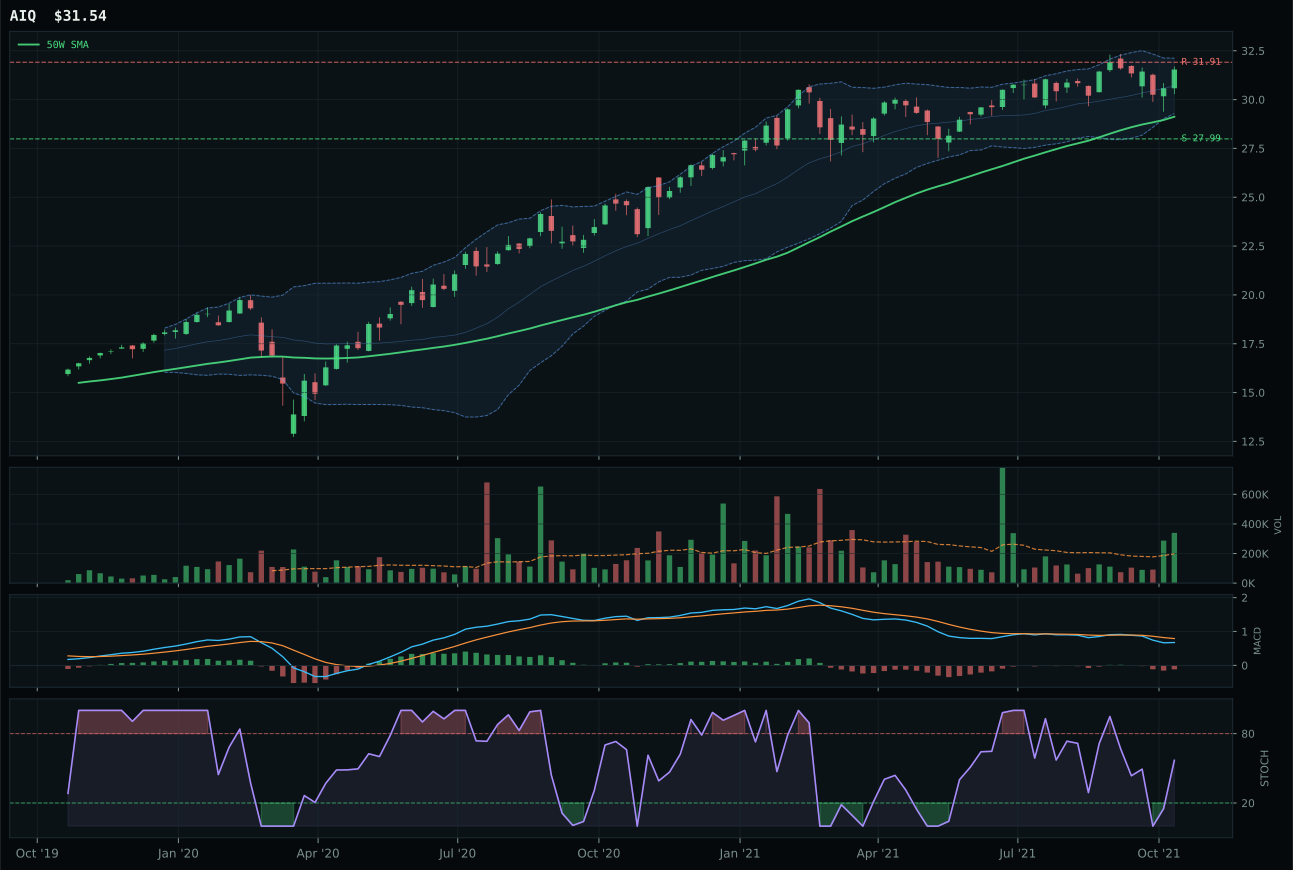
AIQ has a neutral structure profile with 1.4% 13-week relative strength versus SPY.
A failed hold above support would weaken the setup.
Tracked, but not top-2 eligible because: .
SMH wins because it holds the steadiest technical ground among three AI expressions fighting for recognition. Price sits above both the 50W and 200W with a 0.7% slope, giving it clean uptrend credentials; the 3.0% RS versus SPY proves broad participation, not a narrow trade. BOTZ scored higher on technical evidence (76.9 vs 45.2) and delivered a sharper 13-week return (12.5% vs 6.4%), but it paid the price for momentum divergence—BOTZ's MACD is bullish but the stochastic RSI is already falling neutral, signaling exhaustion in a chart that's already expensive. SMH's macro fit benefit (64.0 on AI sponsorship at +14) overrides BOTZ's technical edge because the system weights macro at 38% in the final proof order. The risk-reward tradeoff slightly favors SMH (50.6 vs 49.7), a narrow margin that tilts the decision toward the more sustainable setup.
AI receives 5% allocation as tier-3 at a 50.5 category score, well below the top-2 threshold. The 50% overlay cuts this to a true 5% weight. SMH's 6.4% thirteen-week return and neutral volume create a lukewarm technical case; BOTZ's 12.5% return and 9.2% SPY relative strength are objectively stronger, yet the macro regime—Transition / Mixed with credit stress active—penalizes the more aggressive robotics play. For this category to earn a tier-2 spot, SMH would need MACD confirmation to flip bullish (currently bearish/weakening) and volume to accelerate above neutral participation, or BOTZ would need the macro headwind to lift as credit stress winds down. Neither condition is close to reality this week.
Defense & Aerospace — ITA
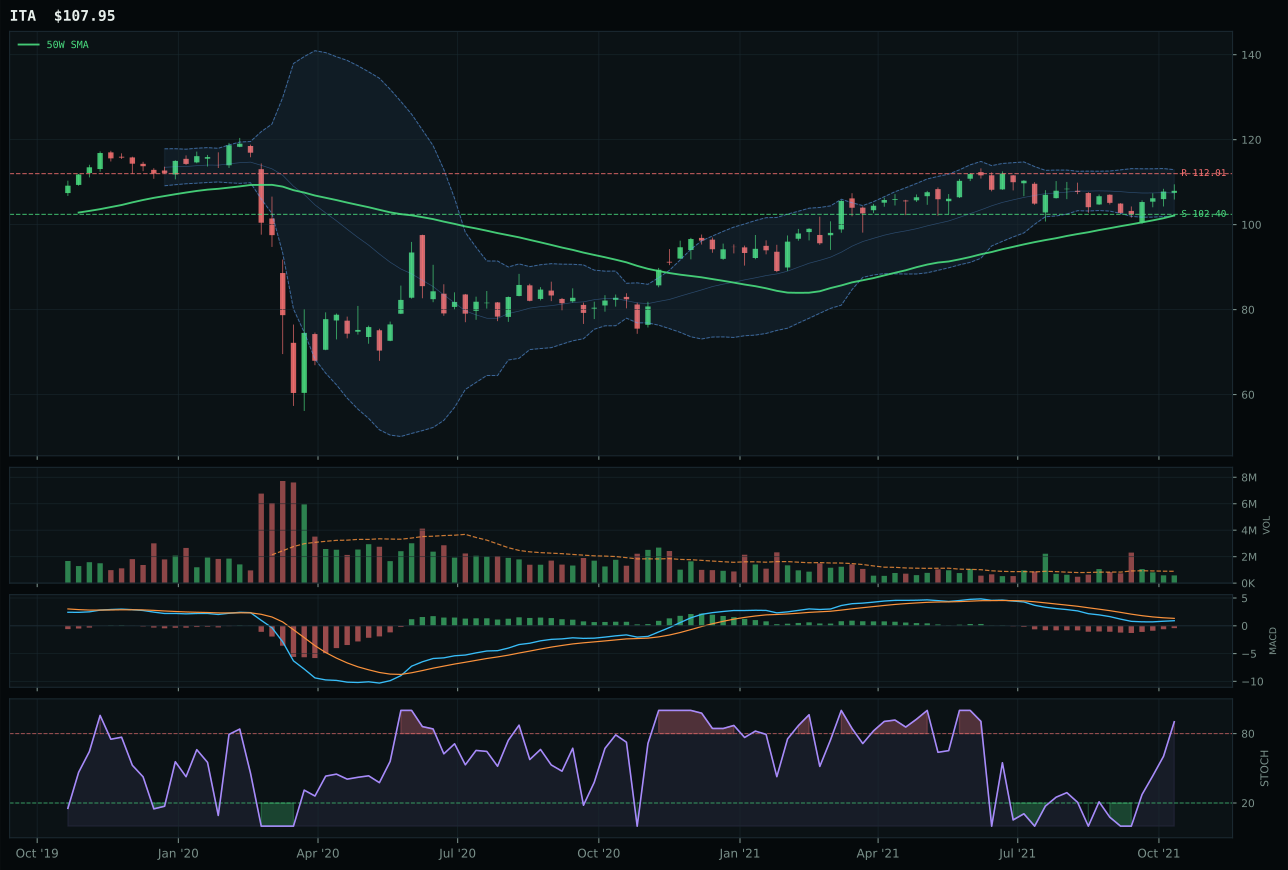
ITA has a neutral structure profile with -0.5% 13-week relative strength versus SPY.
A failed hold above support would weaken the setup.
Actionable but governed by invalidation levels.
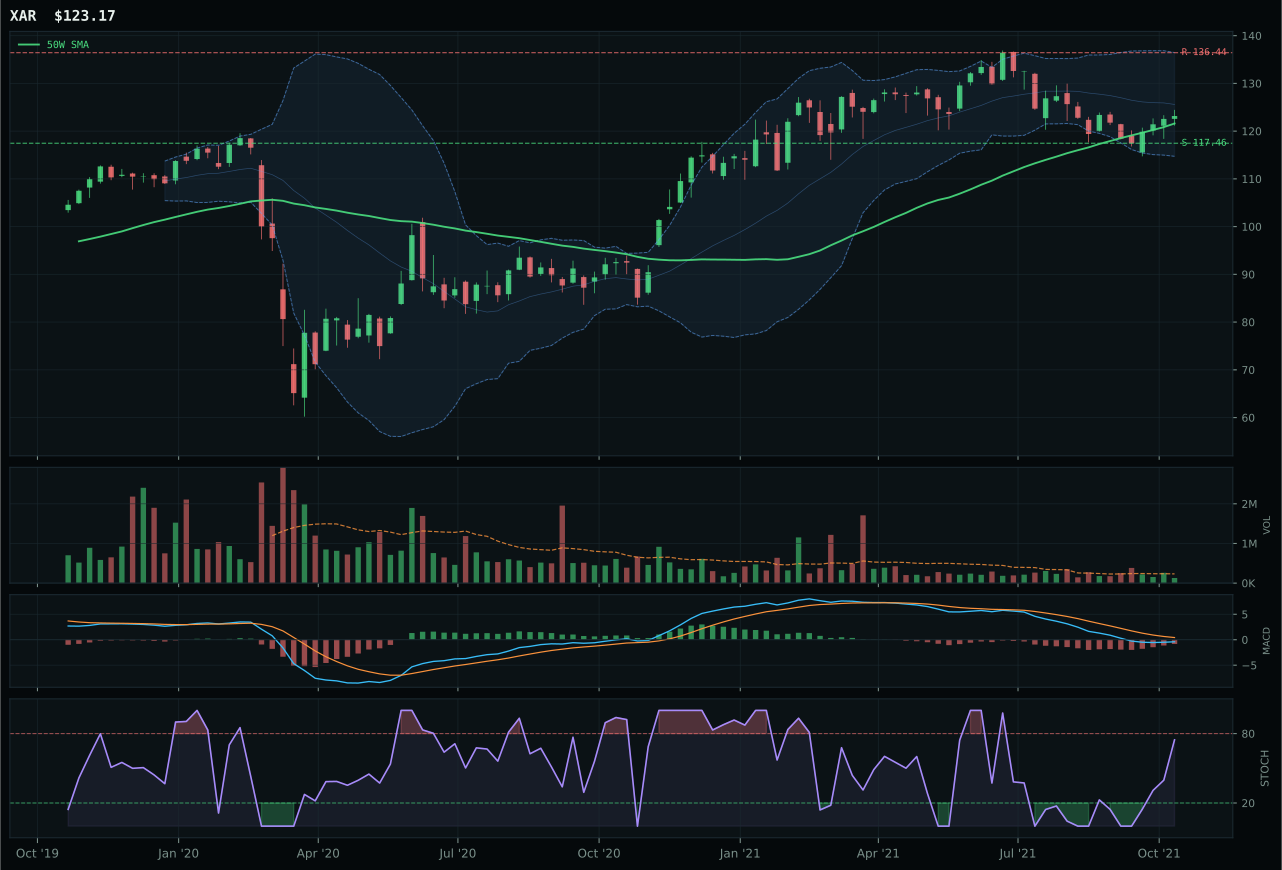
XAR has a pullback into support profile with -4.6% 13-week relative strength versus SPY.
A failed hold above support would weaken the setup.
Actionable but governed by invalidation levels.
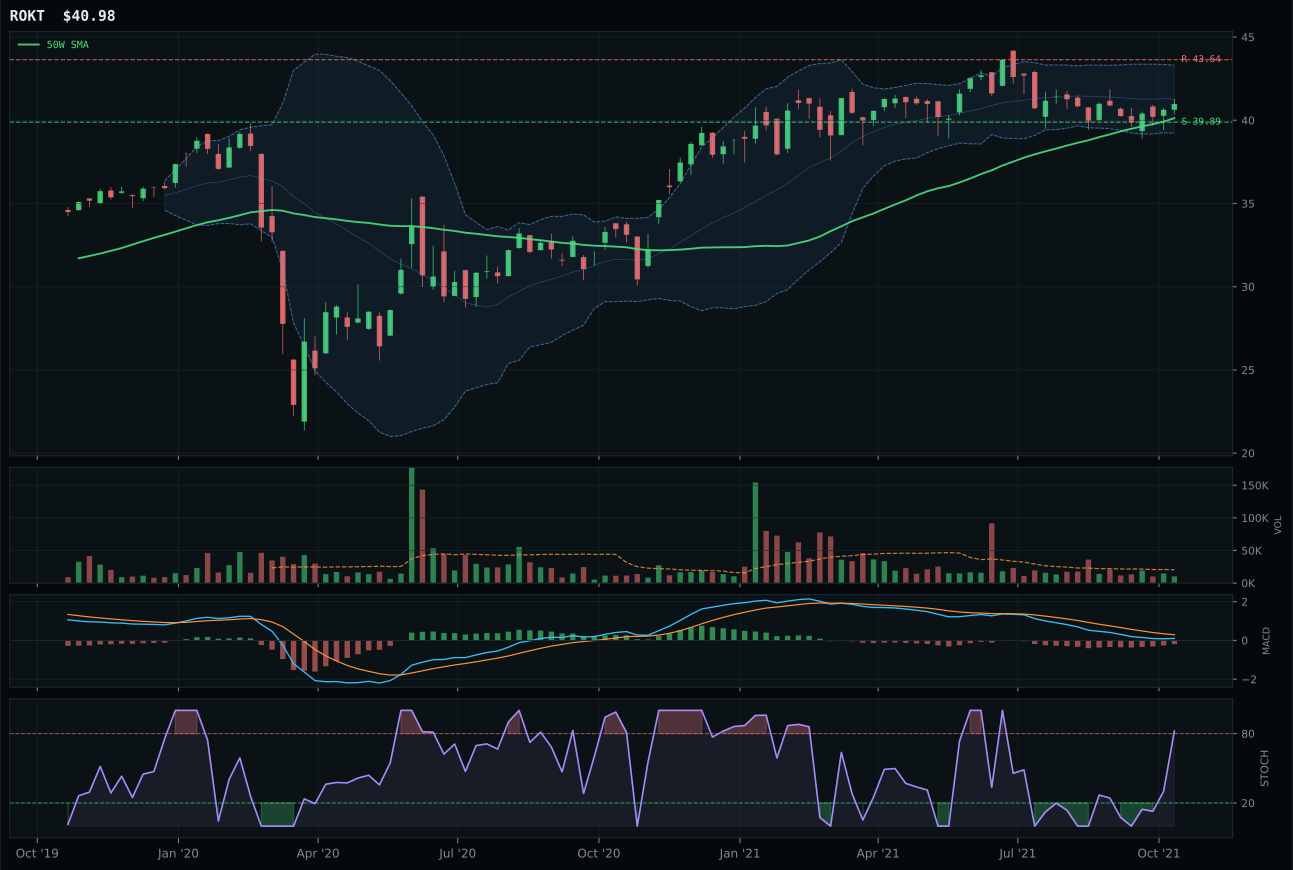
ROKT has a pullback into support profile with -2.7% 13-week relative strength versus SPY.
A failed hold above support would weaken the setup.
Tracked, but not top-2 eligible because: .
ITA wins a tight margin because price is anchored just 5.7% above the 50W with clean pullback-into-support structure; that proximity to the moving average gives the allocator a tight risk-management point. The 2.9% thirteen-week return is not dramatic, but MACD is improving despite bearish overlay, and the 2.2% category-relative strength beats XAR's -1.9%, signaling ITA is winning the internal battle for demand. XAR lost ground despite lower extension (pullback vs neutral structure) because its -4.6% SPY relative strength is a red flag—defense should not underperform the broad market in a Transition / Mixed regime where credit stress (+2) provides tactical support. ITA's risk-reward (57.0) also edges XAR (81.0 looks superior, but that high ratio masks thin 0.65x volume and minimal upside to resistance at only -3.6%), revealing XAR's edge is real estate rather than momentum.
Defense & Aerospace receives 5% allocation at a 49.8 category score, placing it tier-3 in a crowded middle. The category's macro fit is 55.0—neutral at best—because Transition / Mixed regime (+3) and credit stress (+2) help, but no category-specific macro descriptor profile elevates it. ITA's pullback-into-support setup and overbought stochastic (0.90) create a mean-reversion candidate, not a momentum horse. For this category to crack top-2, it would need price to clear resistance at 112.01 with volume surge and fresh MACD bullish divergence, or macro to shift sharply toward geopolitical risk premium (currently absent from the active descriptor list). The current allocation reflects a hedge-quality position with limited upside catalyst.
Emerging Markets — INDA
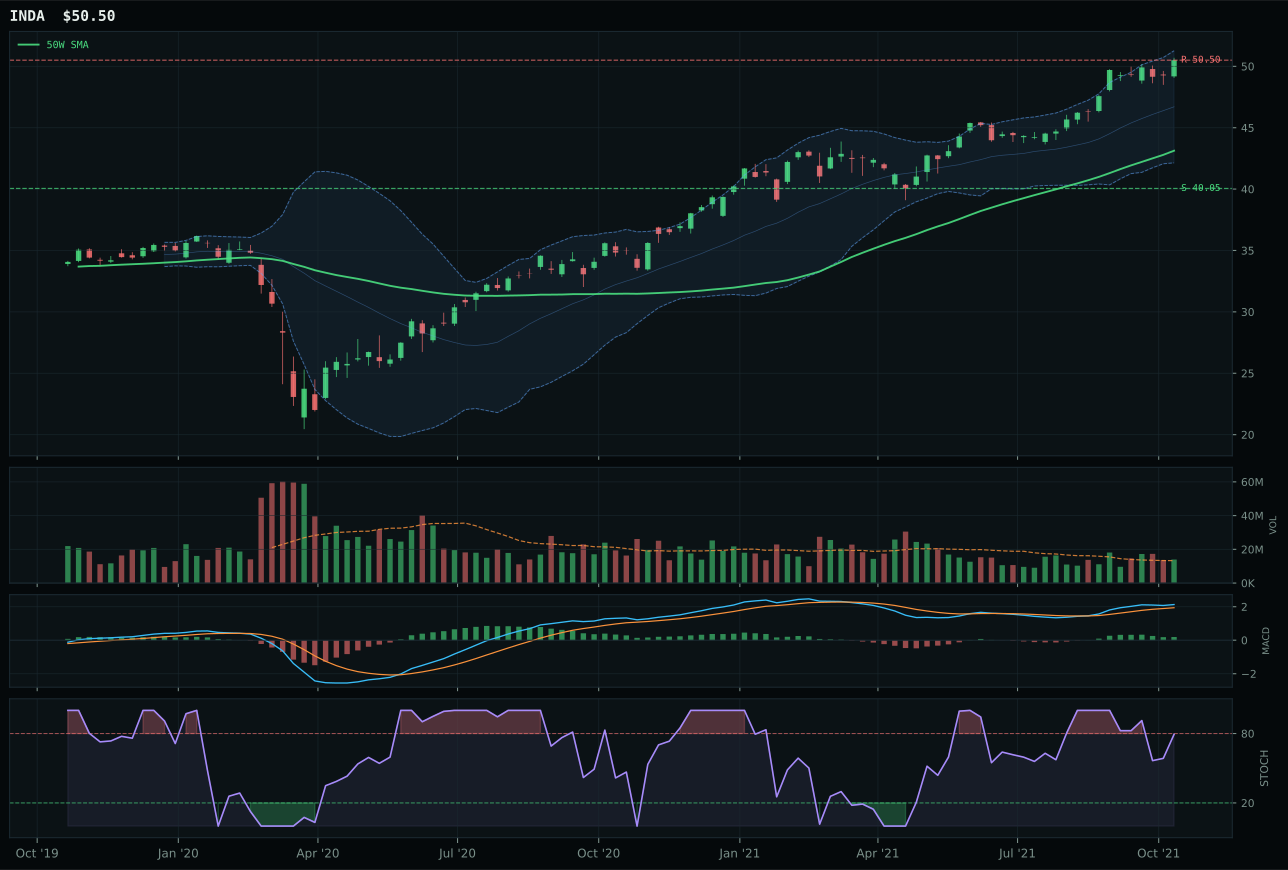
INDA has a vertical extension profile with 10.8% 13-week relative strength versus SPY.
A failed hold above support would weaken the setup.
Actionable but governed by invalidation levels.
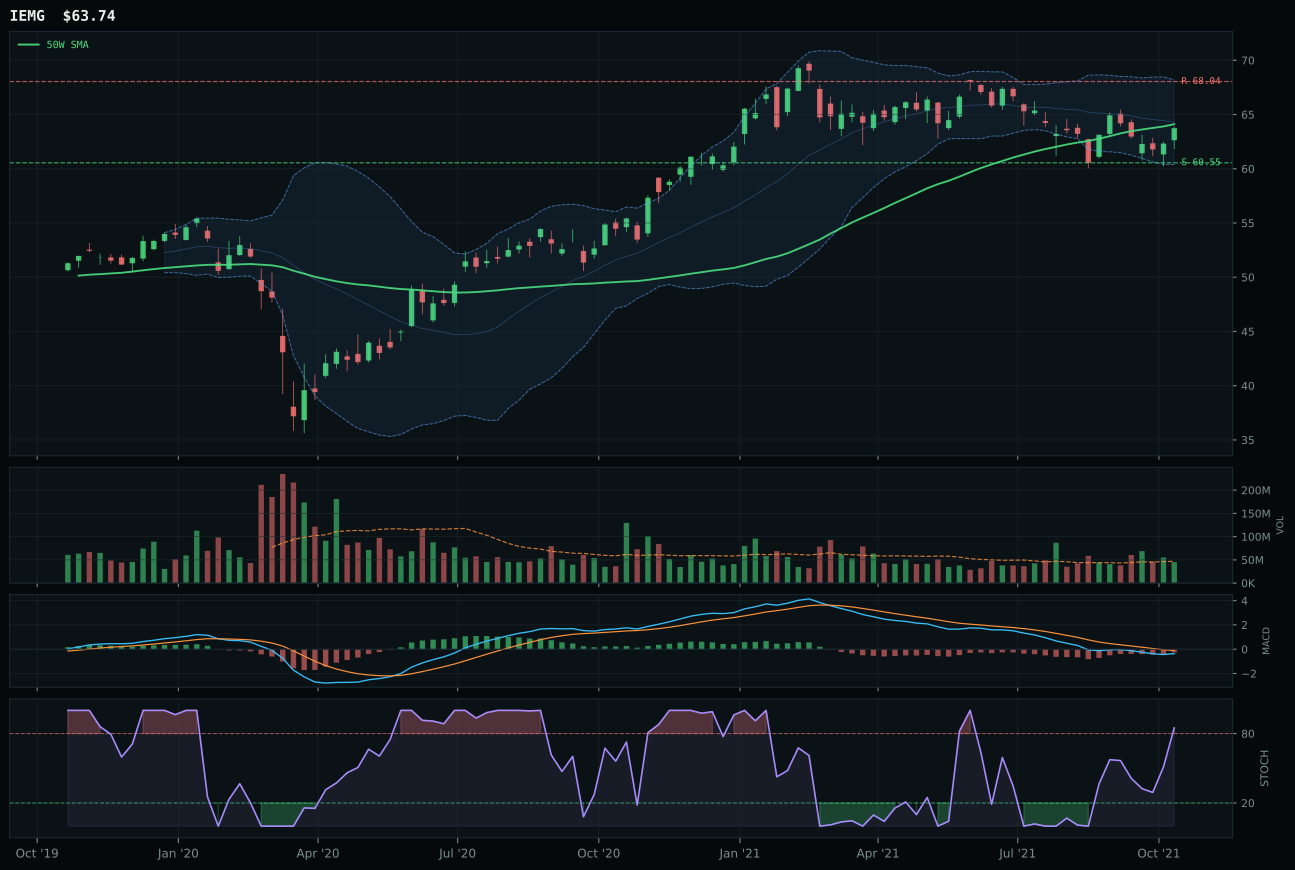
IEMG has a compression near 50W profile with -5.9% 13-week relative strength versus SPY.
A failed hold above support would weaken the setup.
Actionable but governed by invalidation levels.
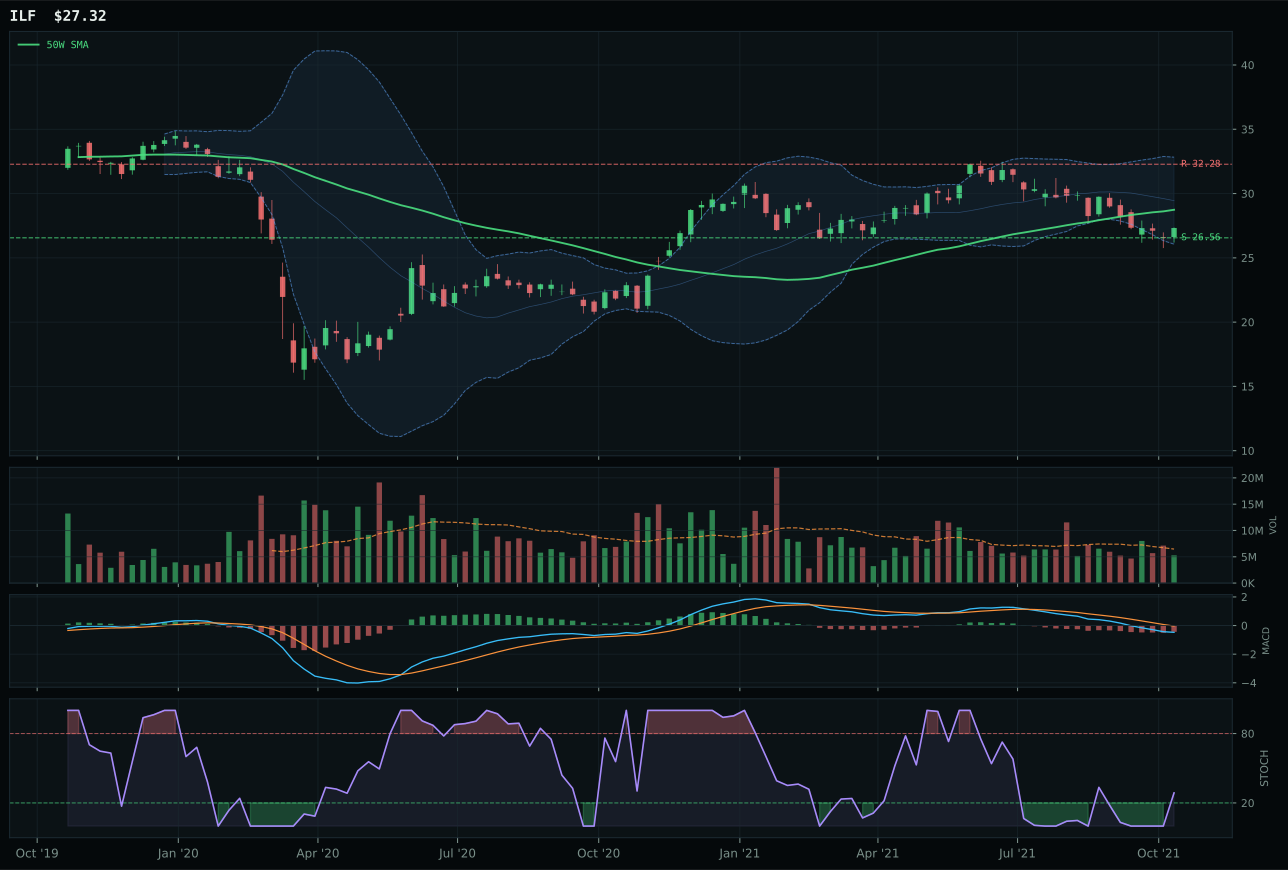
ILF has a pullback into support profile with -13.3% 13-week relative strength versus SPY.
Extension and support failure are the main tactical risks.
Tracked, but not top-2 eligible because: structurally broken.
INDA wins a razor-thin decision over IEMG (score gap of -0.7 points), making this the closest category contest in the portfolio. INDA posts a 14.2% thirteen-week return with 10.8% SPY relative strength and cleaner vertical extension structure (83.5 vs 70.1); the 16.7% category-relative strength is the deciding metric, proving INDA is winning internal demand in a tough macro environment. Price sits 17.1% above the 50W with bullish but flattening MACD and falling/neutral stochastic, meaning momentum is present but decelerating—a setup that works for INDA because it is still accumulating within the category. IEMG's -5.9% SPY relative strength is the fatal weakness; broad emerging markets are underperforming the index despite positive EM liquidity support in the macro narrative, a divergence that disqualifies it from leading a category. The Fib location (near 52W high) and timing score (40.0 for both) confirm both are extended, but INDA's internal relative strength separates them.
Emerging Markets receives 0% allocation and ranks outside the portfolio entirely at a 47.7 category score (ninth or tenth tier). Despite INDA's technical superiority and strong 14.2% returns, the category-level exclusion is absolute. Macro fit is 62.0, driven by EM liquidity support (+14) and liquidity expansion (+8), but credit stress (-10) pulls hard in the wrong direction and overwhelms the tailwinds. The Transition / Mixed regime offers no specific EM advantage; in fact, it tilts toward U.S. real assets (energy, metals) over developing-market equities. INDA's 17.1% extension above the 50W creates entry risk exactly when the macro environment is uncertain. For Emerging Markets to earn allocation, INDA would need (1) a pullback to test support near 40.05 for fresh accumulation, (2) credit stress to reverse from active to winding down, or (3) a macro shift toward EM-specific stimulus (currently absent). The current exclusion reflects a macro regime call: in Transition / Mixed with credit stress active, domestic real assets beat EM duration.
Precious Metals — GDX
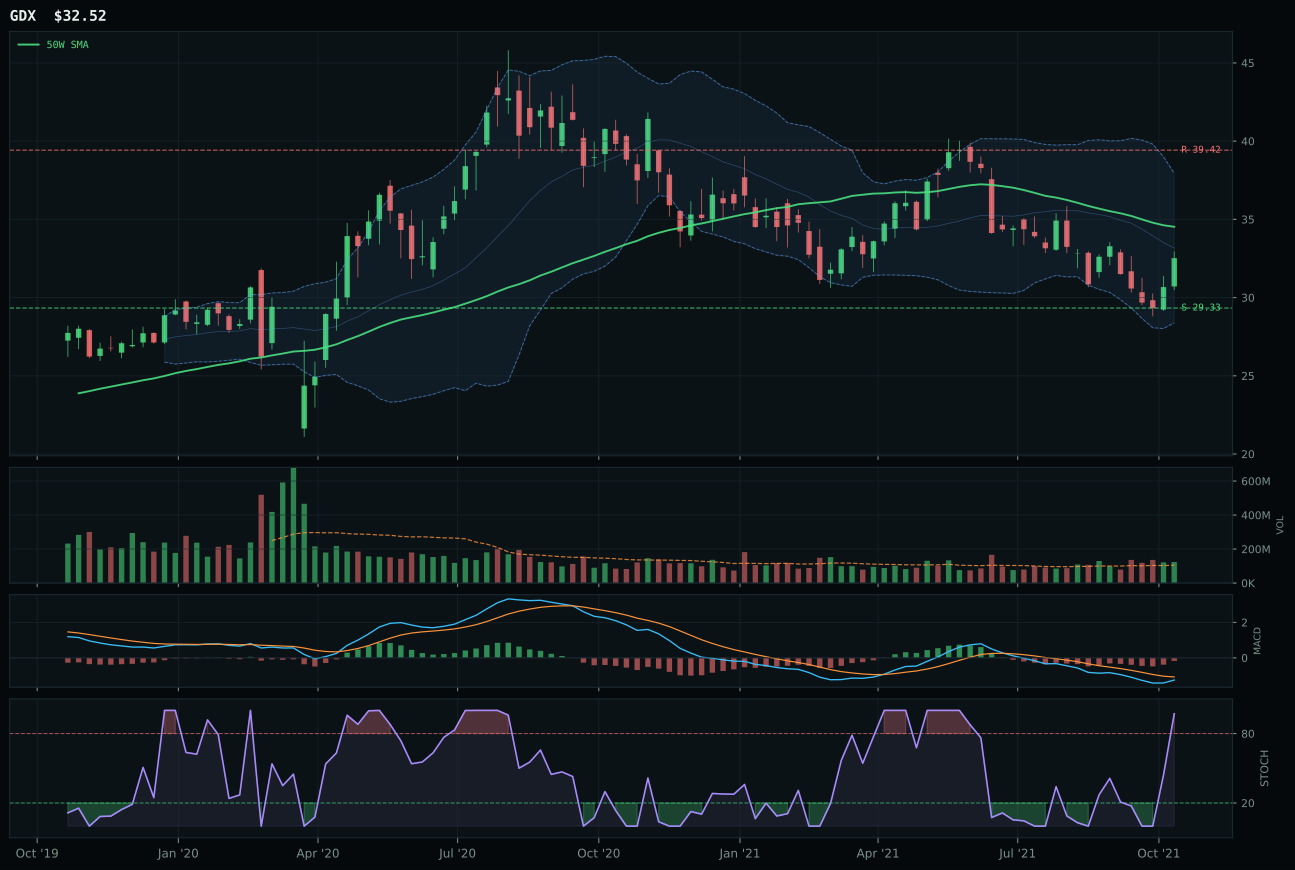
GDX has a neutral structure profile with -7.5% 13-week relative strength versus SPY.
A failed hold above support would weaken the setup.
Actionable but governed by invalidation levels.
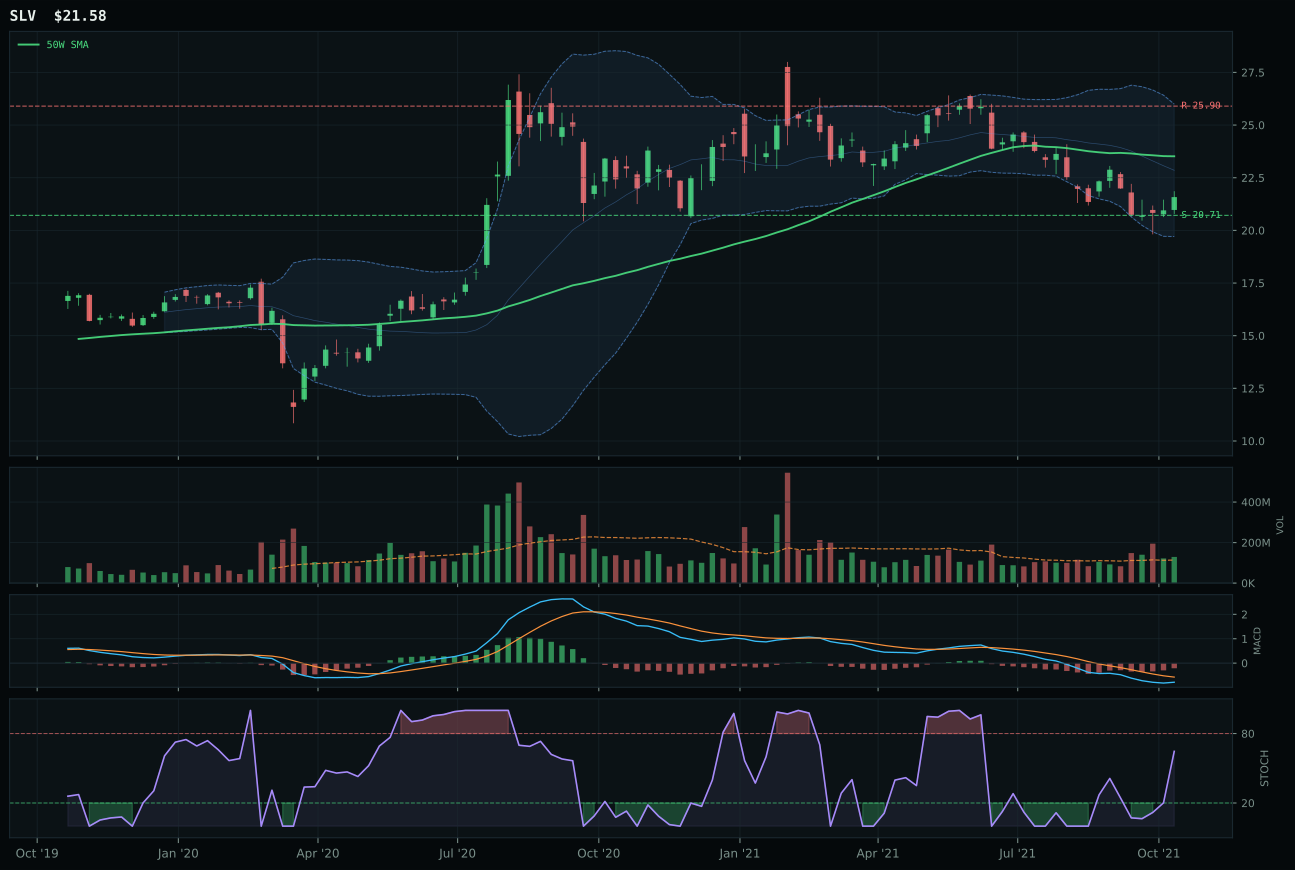
SLV has a pullback into support profile with -12.6% 13-week relative strength versus SPY.
A failed hold above support would weaken the setup.
Actionable but governed by invalidation levels.
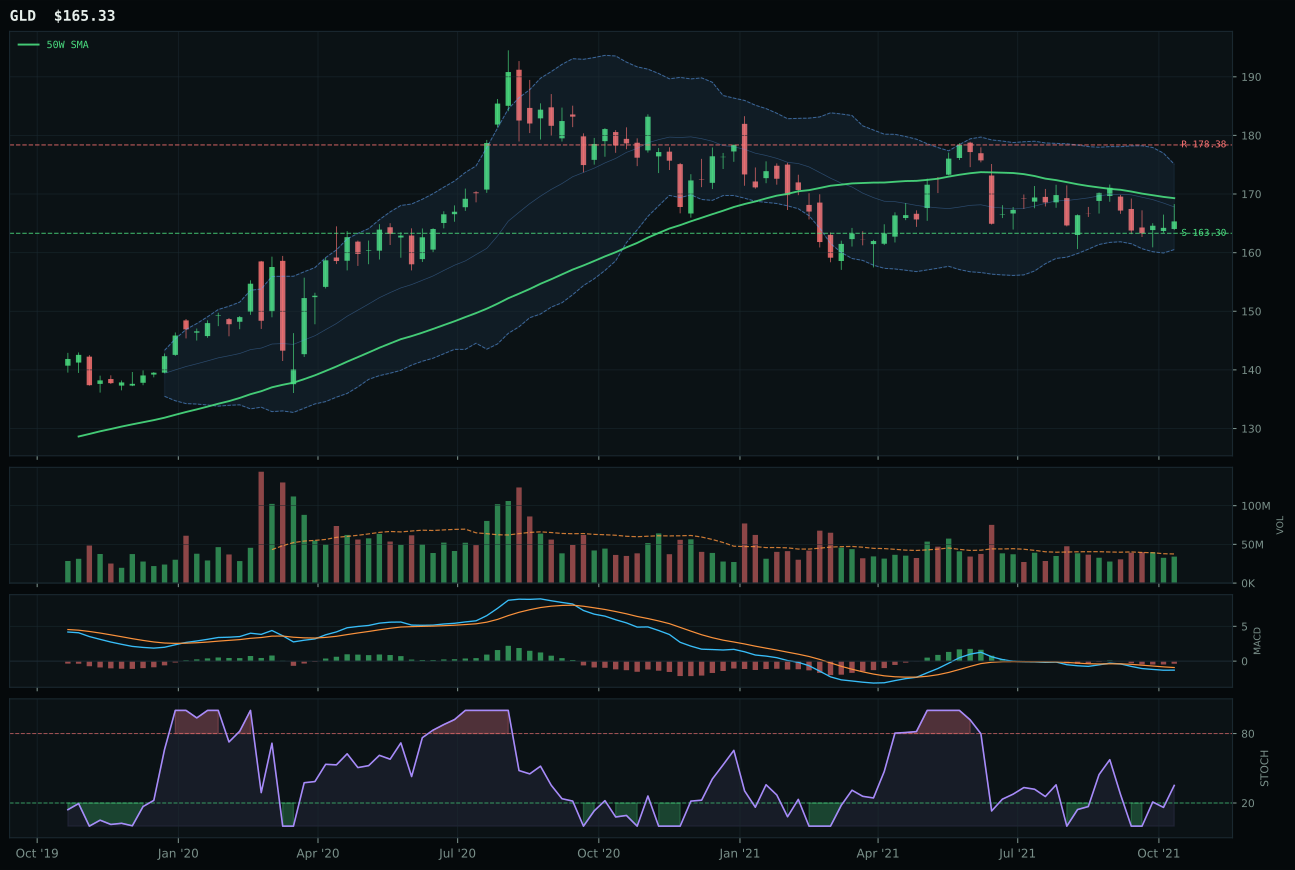
GLD has a pullback into support profile with -5.8% 13-week relative strength versus SPY.
A failed hold above support would weaken the setup.
Actionable but governed by invalidation levels.
GDX wins by default in a category that is neither attractive nor actionable. Price sits 5.8% below the 50W—a reset into the 200W above structure that normally invites value traders, yet the -7.5% SPY underperformance and -4.1% thirteen-week return tell the real story: gold miners are failing to participate in the broader portfolio's momentum. GDX edges SLV because category-relative strength is 0.0% (neutral) versus SLV's -5.1%, a margin that matters when both charts are broken. MACD is bearish but improving on both, meaning the bounce may be technical oversold rather than conviction buying. The risk-reward is genuinely attractive (82.0/100)—17.5% downside risk to support versus 10.9% upside—making this a short put relative value, not a capital allocation candidate. SLV's -12.6% SPY relative strength and near 52W low puts it deeper in the doghouse; GLD's bearish, weakening MACD rules it out entirely.
Precious Metals receives 0% allocation and ranks outside the portfolio entirely this week. The 45.7 category score is eighth or ninth in the pecking order, and the allocation decision was absolute: no capital flows here. The macro fit is only 48.0 (neutral-to-slightly-bearish), and liquidity expansion (-2) pulls in the wrong direction—gold rallies when liquidity tightens, not expands. GDX's technical setup, while constructive relative to peers (MACD improving, stochastic overbought near 0.97 suggesting mean-reversion possibility), does not override the category-level macro headwind. For Precious Metals to earn even a tier-3 (5%) slot, credit stress would need to flip from active (-7 impact currently) to dominant, or liquidity expansion would need to reverse to true monetary tightening fears. Neither condition exists. This is a category-level exclusion based on regime mismatch, not a GDX-specific technical weakness.