
2021-10-08
Informational purposes only. The content in this report, including allocations, analysis, and commentary, is provided solely for informational and educational purposes. It does not constitute financial advice, investment advice, trading advice, or any other type of advice. Past performance does not guarantee future results. Always conduct your own research and consult a qualified financial professional before making investment decisions.
Weekly Allocation
| Ticker | Category | Weight | Role |
|---|---|---|---|
| FSOL | 50% | Overlay | |
| FCG | Traditional Energy | 10% | Top-2 (10%) |
| WEAT | Agriculture & Livestock | 10% | Top-2 (10%) |
| IGF | Utilities & Infrastructure | 5% | Tier-2 (5%) |
| ITA | Defense & Aerospace | 5% | Tier-2 (5%) |
| URNM | Nuclear Energy | 5% | Tier-2 (5%) |
| CIBR | Technology | 5% | Tier-2 (5%) |
| COPX | Industrial Metals | 5% | Tier-2 (5%) |
| GDX | Precious Metals | 5% | Tier-2 (5%) |
Trade Instructions — Monday Open
Sell the tranche from 2021-09-10 (completing its 4-week hold). Buy the new tranche. Instructions show net portfolio changes — same-asset positions cancel, weight changes show the delta.
| Action | Ticker | Instruction |
|---|---|---|
| SELL | CIBR | Sell 25% of CIBR position (reduce 5.00% → 3.75%) |
| SELL | BOTZ | Sell 40% of BOTZ position (reduce 6.25% → 3.75%) |
| SELL | XLU | Sell entire XLU position (1.25% of portfolio) |
| SELL | GLD | Sell entire GLD position (1.25% of portfolio) |
| SELL | MOO | Sell 33% of MOO position (reduce 3.75% → 2.50%) |
| BUY | IGF | Buy IGF — 16.67% of freed cash (adds 1.25% to portfolio) |
| BUY | FCG | Buy FCG — 33.33% of freed cash (adds 2.50% to portfolio) |
| BUY | WEAT | Buy WEAT — 33.33% of freed cash (adds 2.50% to portfolio) |
| BUY | GDX | Buy GDX — 16.67% of freed cash (adds 1.25% to portfolio) |
Current Portfolio After Trade
Combined holdings across all 4 active tranches. Each tranche is 25% of the portfolio.
| Ticker | % of Portfolio | Weight Bar |
|---|---|---|
| FSOL | 50.00% | |
| URNM | 6.25% | |
| COPX | 6.25% | |
| FCG | 5.00% | |
| CIBR | 3.75% | |
| ITA | 3.75% | |
| IGF | 3.75% | |
| INDA | 3.75% | |
| XLK | 3.75% | |
| WEAT | 3.75% | |
| BOTZ | 3.75% | |
| MOO | 2.50% | |
| SLV | 1.25% | |
| SMH | 1.25% | |
| GDX | 1.25% |
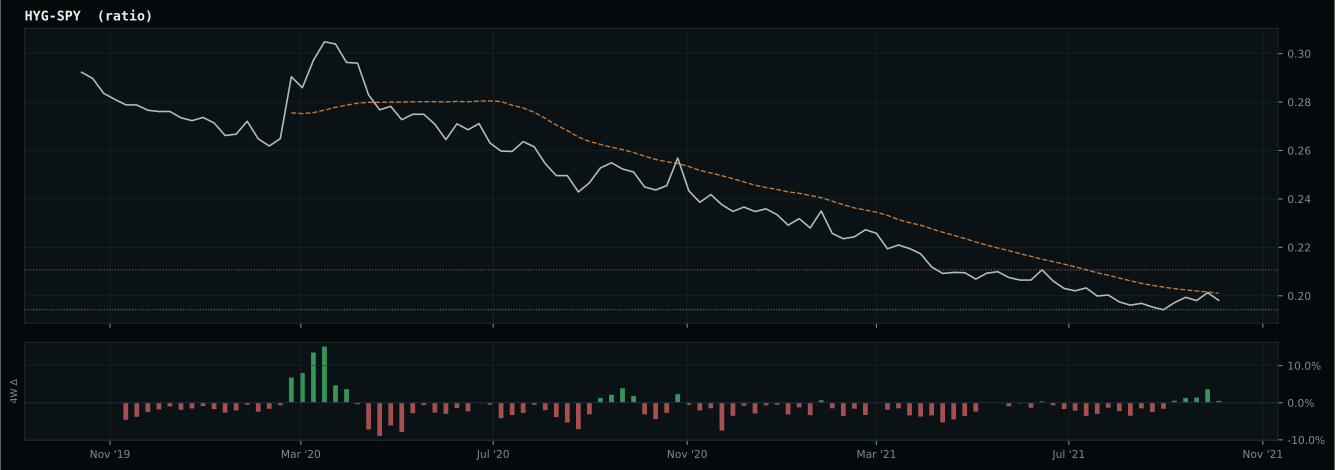
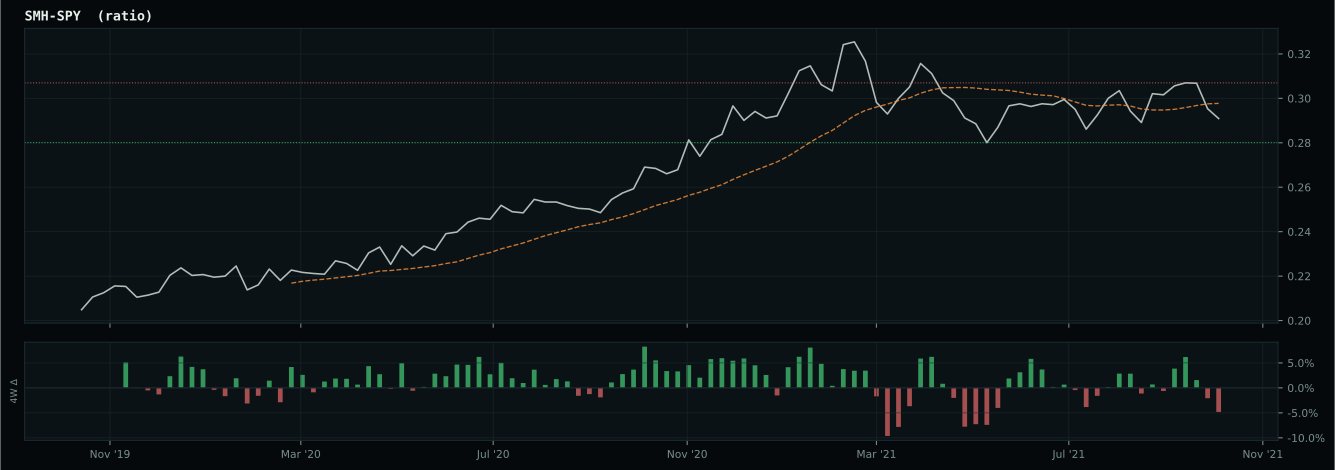
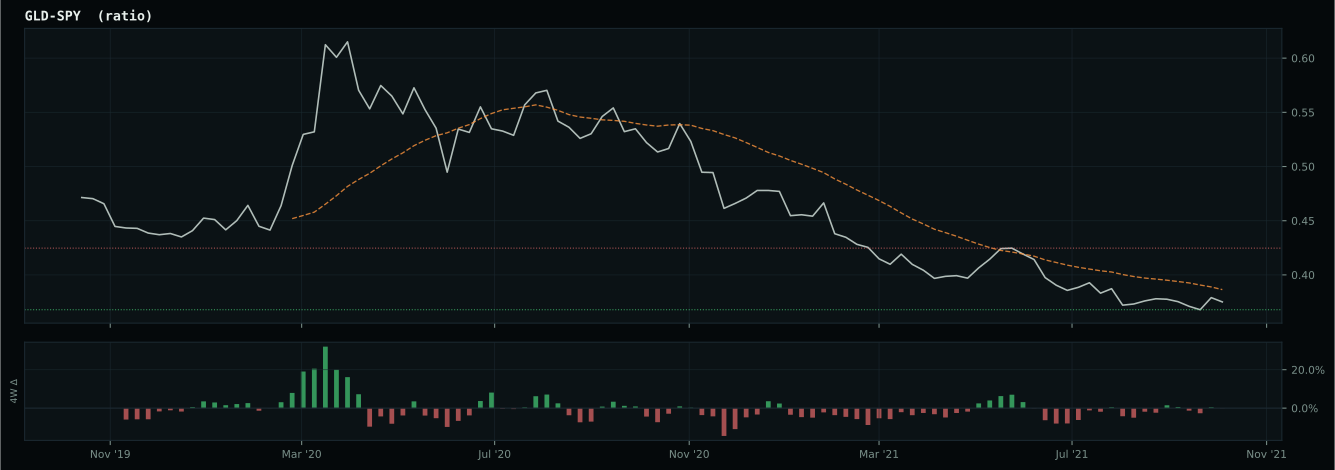
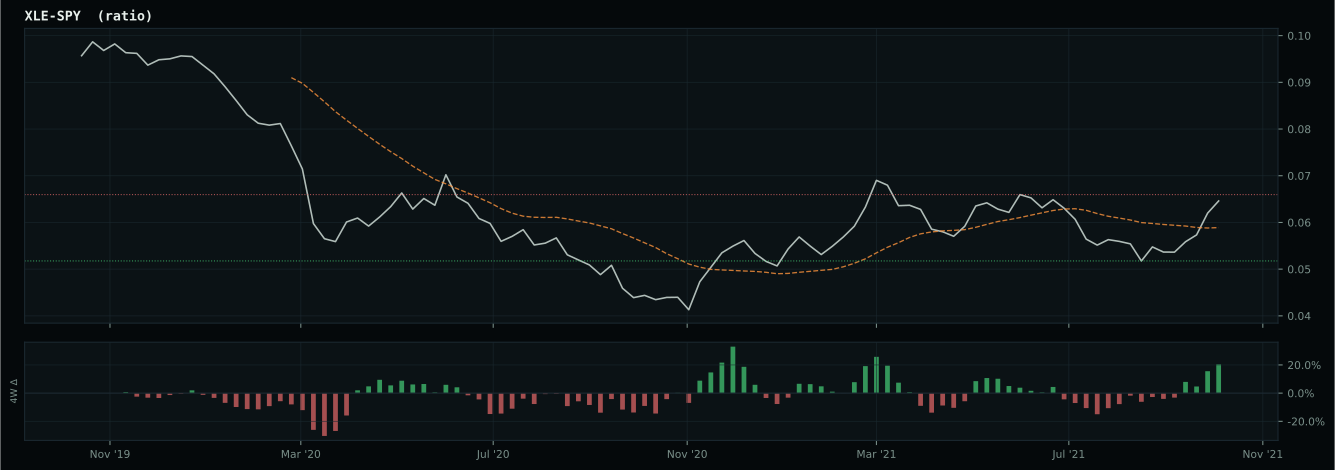
Macro Regime — Transition / Mixed
Macro Evidence Charts
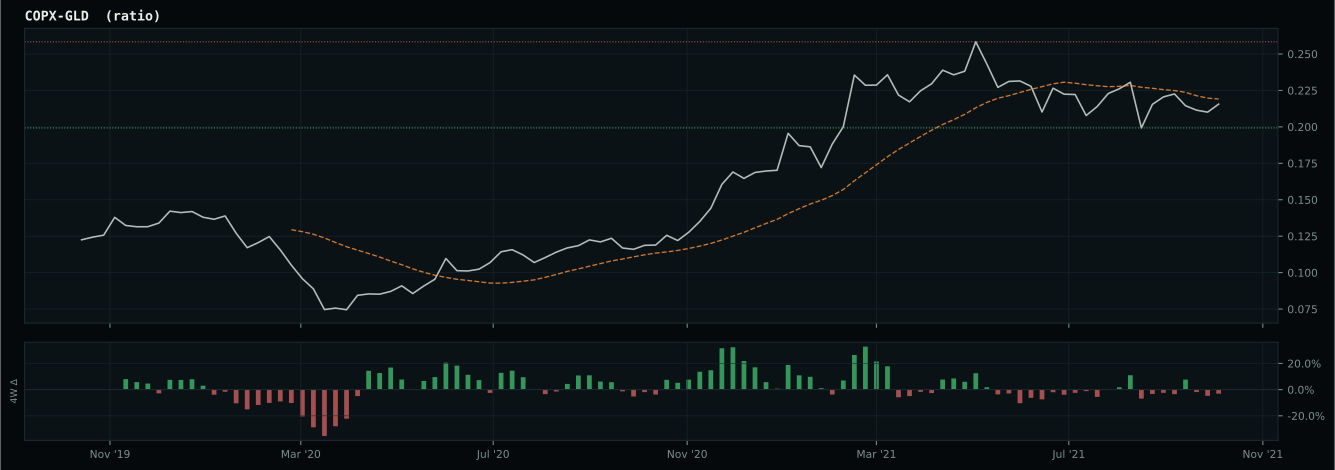
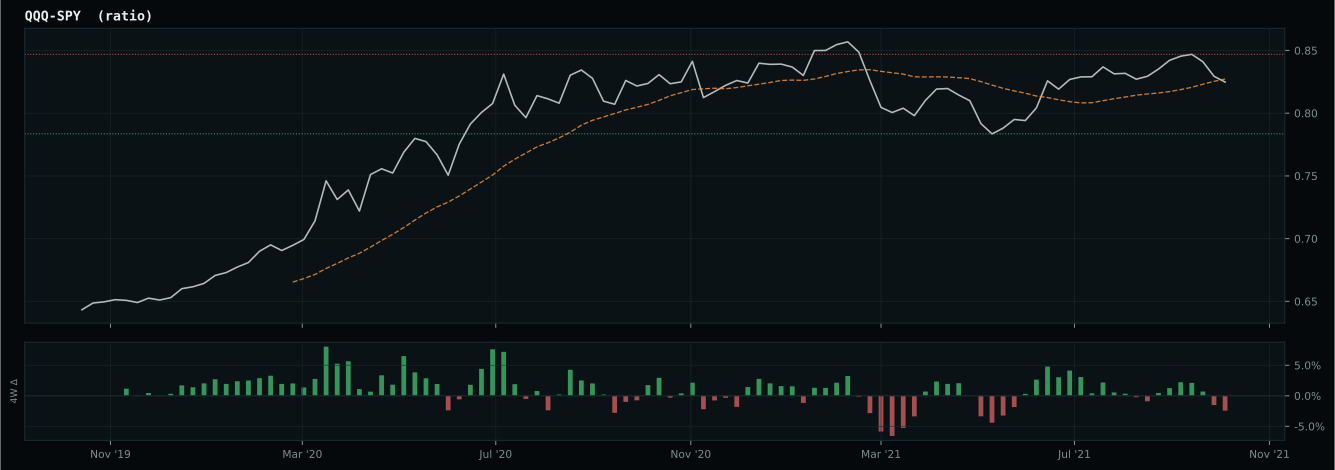
Market-implied signals behind the macro regime scores. Each ratio compares two assets; the direction and slope of the ratio is what the macro engine reads.
Crypto Regime — AltSeason
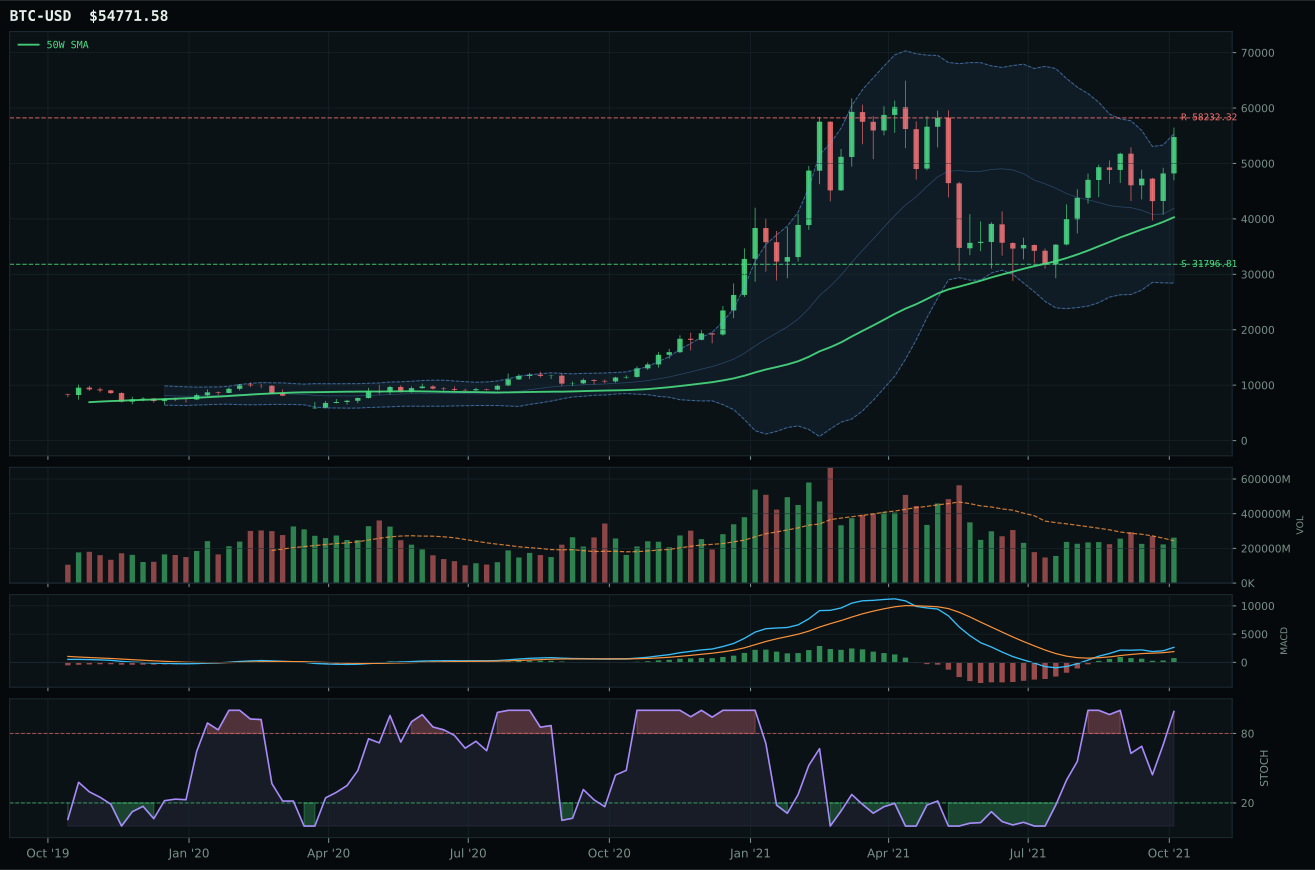
ValueBTC not armed: BTC has not made the first post-breakdown touch of the 200W buy zone after losing the 50W
TrendBTC confirmed: 2 consecutive closes above rising/flat 50W SMA
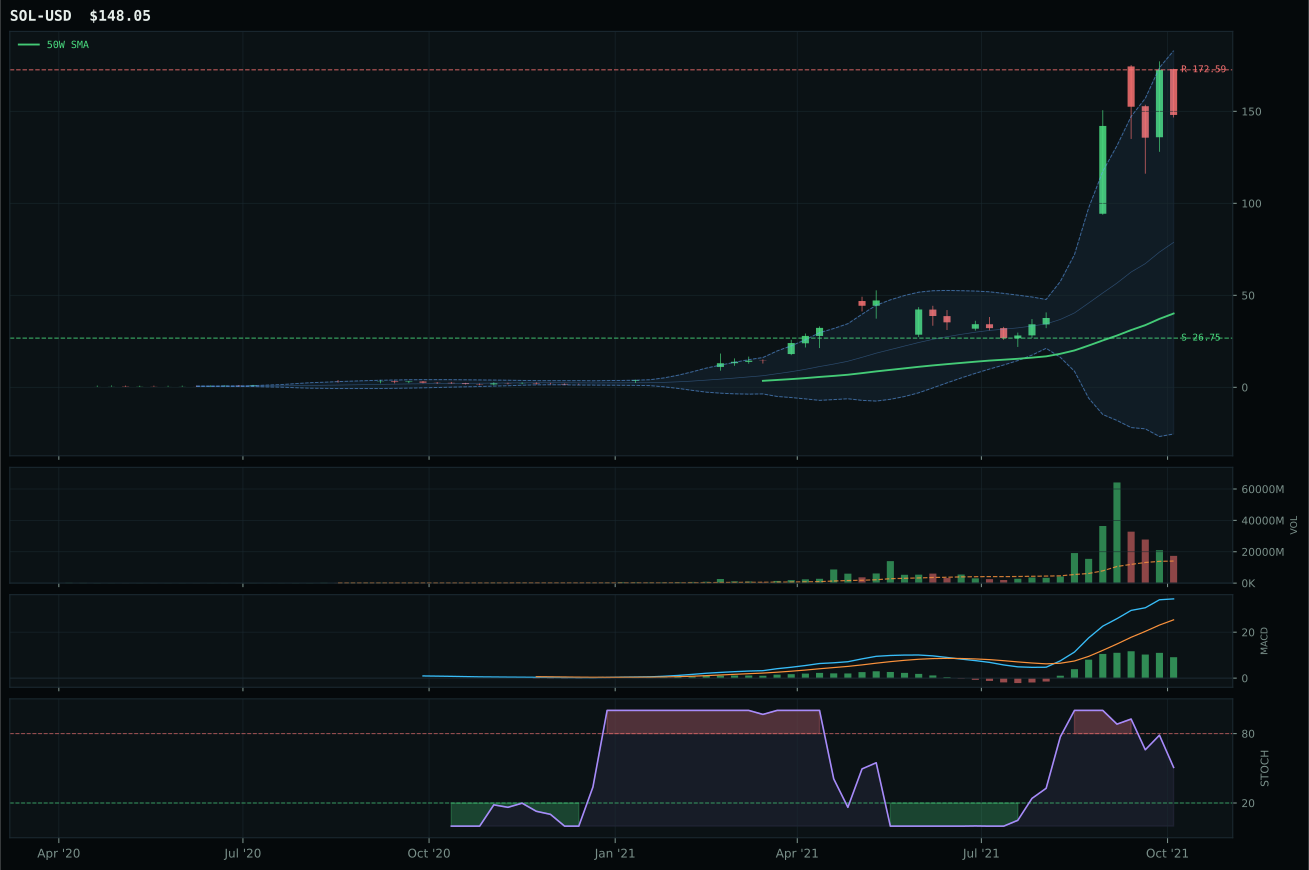
all available AltSeason conditions pass; missing optional confirmations skipped
Category Rankings
| Rank | Category | Winner | Score | Alloc | 4W Ret | Peers (4W) |
|---|---|---|---|---|---|---|
| 1 | Traditional Energy | FCG | 86.3 | 20% | +2.51% | XLE +2.3% · XOP +3.3% |
| 2 | Agriculture & Livestock | WEAT | 71.0 | 20% | +4.45% | MOO +4.0% · VEGI +4.2% |
| 3 | Utilities & Infrastructure | IGF | 50.1 | 10% | +3.81% | PAVE +11.8% · XLU +4.3% |
| 4 | Defense & Aerospace | ITA | 48.7 | 10% | +1.71% | XAR +2.8% · ROKT +3.6% |
| 5 | Nuclear Energy | URNM | 46.3 | 10% | +27.47% | URA +23.0% · NLR +5.1% |
| 6 | Technology | CIBR | 45.5 | 10% | +11.00% | XLK +10.8% · IGV +9.3% |
| 7 | Industrial Metals | COPX | 45.1 | 10% | +0.94% | REMX +15.6% · PICK -1.9% |
| 8 | Precious Metals | GDX | 39.4 | 10% | +7.75% | GLD +3.9% · SLV +7.5% |
| 9 | AI | SMH | 23.4 | 0% | +17.79% | BOTZ +11.9% · AIQ +7.7% |
| 10 | Emerging Markets | INDA | 15.2 | 0% | +2.83% | IEMG +0.5% · ILF -5.1% |
Traditional Energy — FCG
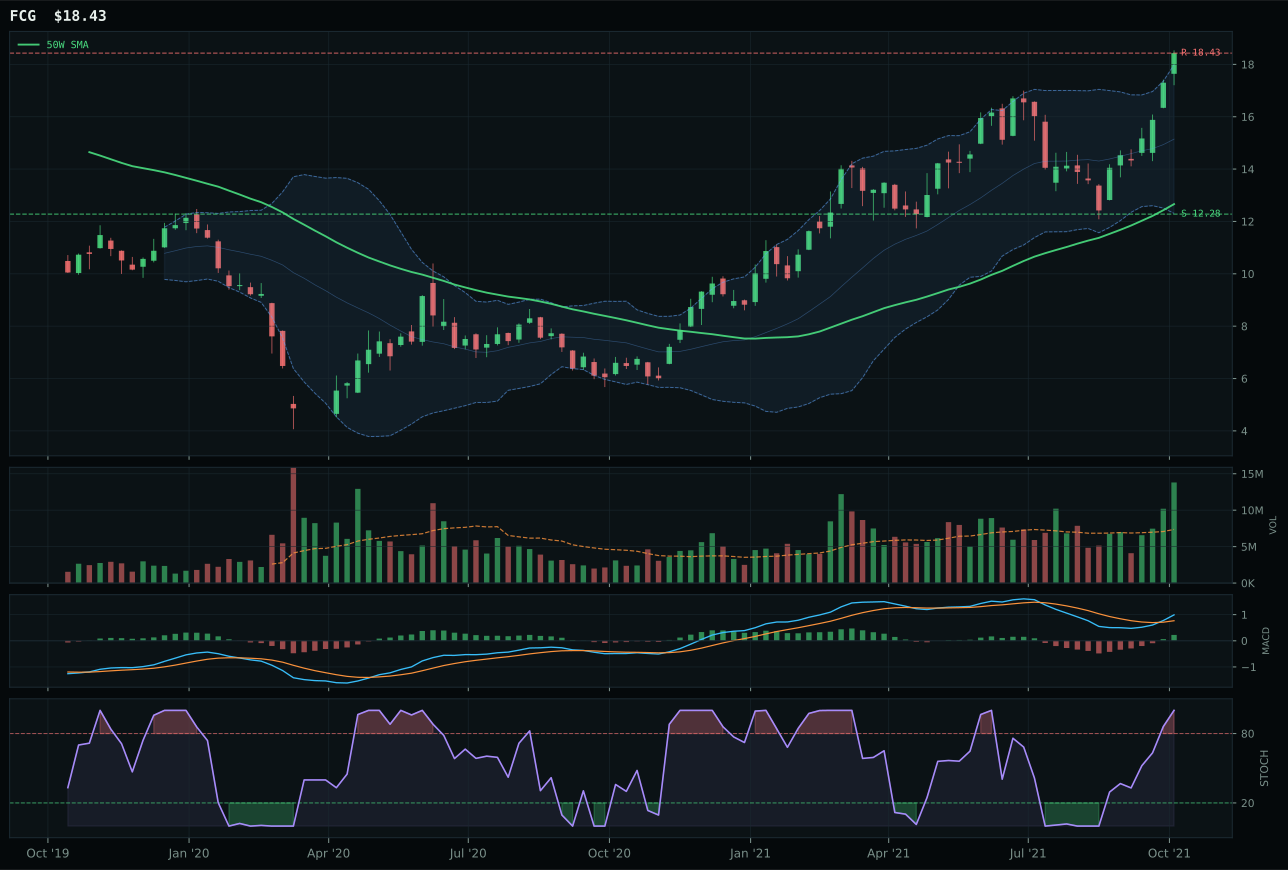
FCG has a vertical extension profile with 14.5% 13-week relative strength versus SPY.
A failed hold above support would weaken the setup.
Actionable but governed by invalidation levels.
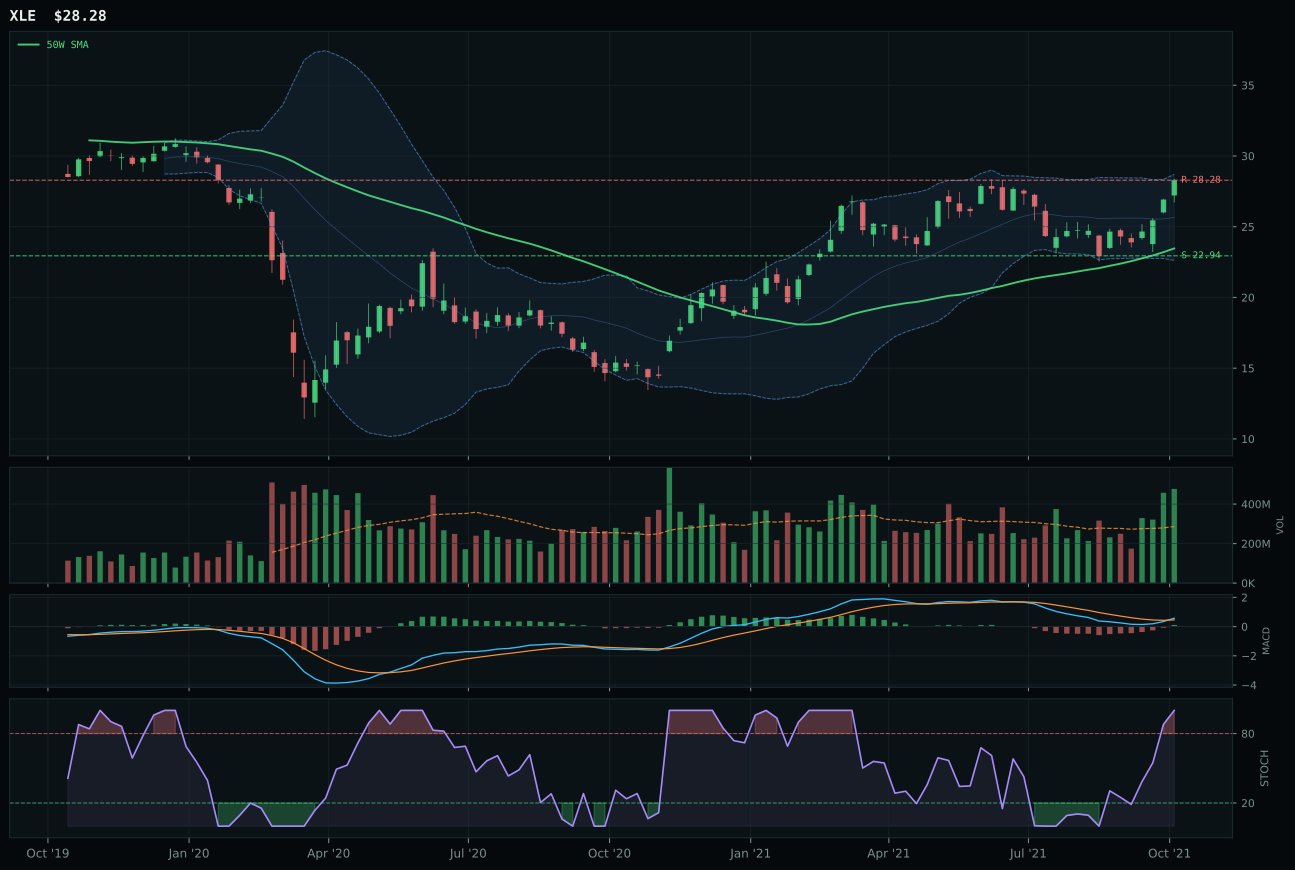
XLE has a vertical extension profile with 6.5% 13-week relative strength versus SPY.
A failed hold above support would weaken the setup.
Actionable but governed by invalidation levels.
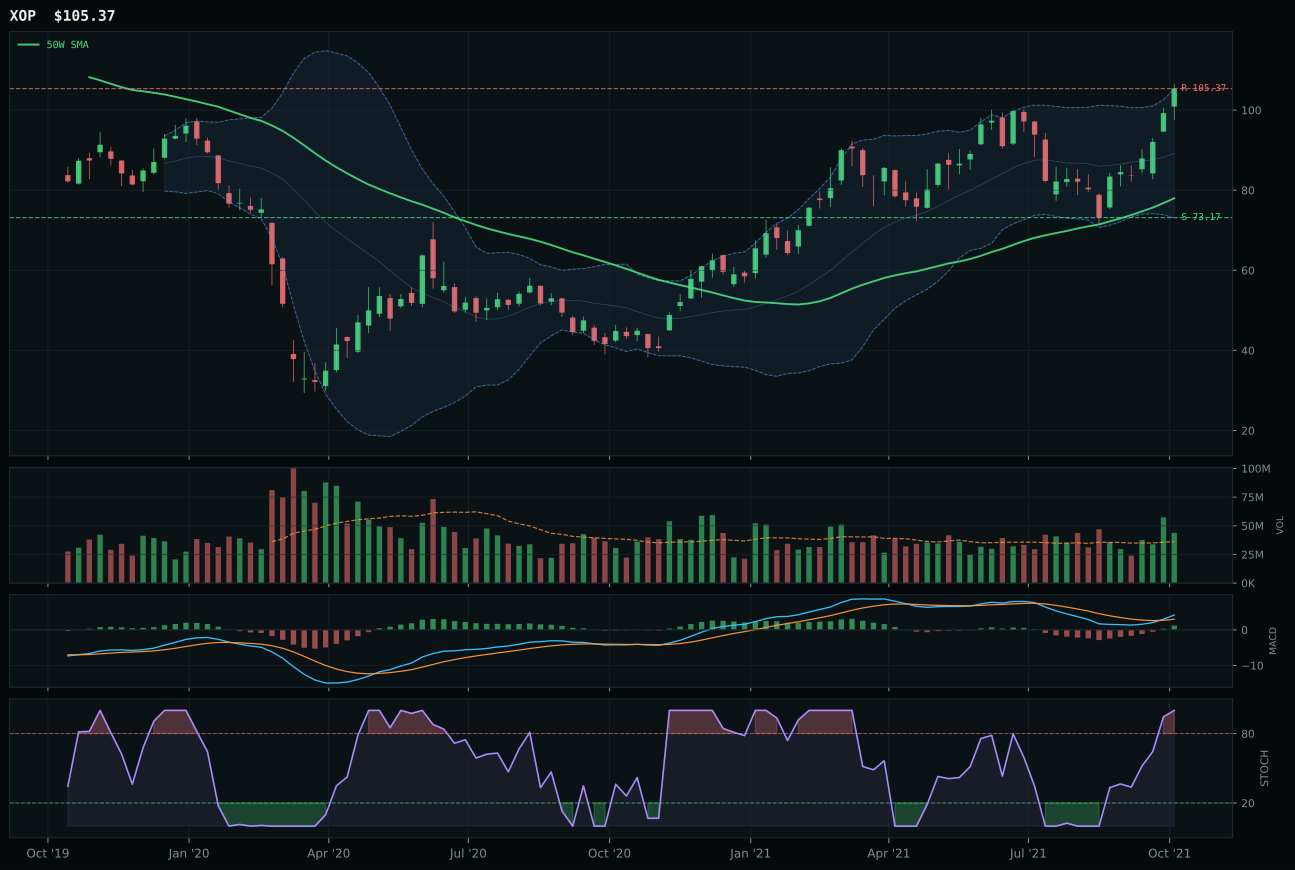
XOP has a vertical extension profile with 11.7% 13-week relative strength versus SPY.
A failed hold above support would weaken the setup.
Actionable but governed by invalidation levels.
FCG claimed the category with 14.5% relative strength versus SPY and 2.8% category-relative strength, with momentum confirmation at 100.0 driven by 28.6% 4W return and volume accumulation at 1.88x average—clear institutional conviction behind the move. XLE's relative weakness at 6.5% and -5.2% category-relative strength despite similar technical profiles (both vertical extension, both bullish improving MACD, both overbought stochastic) reveals that even in a synchronized energy rally, specialized natural gas plays are outpacing integrated majors. The 7.3-point gap between FCG and XLE is tight—both setups are extended and stretched—but FCG's superior relative strength and volume sponsorship confirm that natural gas scarcity (LNG exports, winter demand, geopolitical supply) is the stronger narrative than integrated energy cash flows. At 45.5% extended from the 50W, FCG is late to the party for new buyers, but that extension is precisely why it won: it means existing holders are profiting and reinvesting, not capitulating.
Traditional Energy ranks as a top-2 category at 10% allocation with a final score of 86.3, the second-highest in the portfolio behind only Crypto's overlay weighting. The category macro fit is 85.0, driven by energy scarcity at +16, inflation pressure at +10, supply shortage at +9, and real asset sponsorship at +7—a quartet of tailwinds that makes this the most macro-supported real asset theme. Technical evidence from FCG is 89.2, with trend at 100, momentum at 100, volume-price confirmation at 85.7, and persistence at 86.7; this is sustained institutional accumulation, not a technical bounce. The tension is timing: FCG is overbought stochastic and extended 45.5% from the 50W, meaning entry risk is high for new capital. Yet in an AltSeason crypto environment with 50% portfolio overlay, a 10% allocation to a macro-validated, momentum-confirmed real asset play is the portfolio's hedge against either crypto consolidation or continued inflation persistence. FCG's position is justified by the regime, not by technical perfection.
Agriculture & Livestock — WEAT
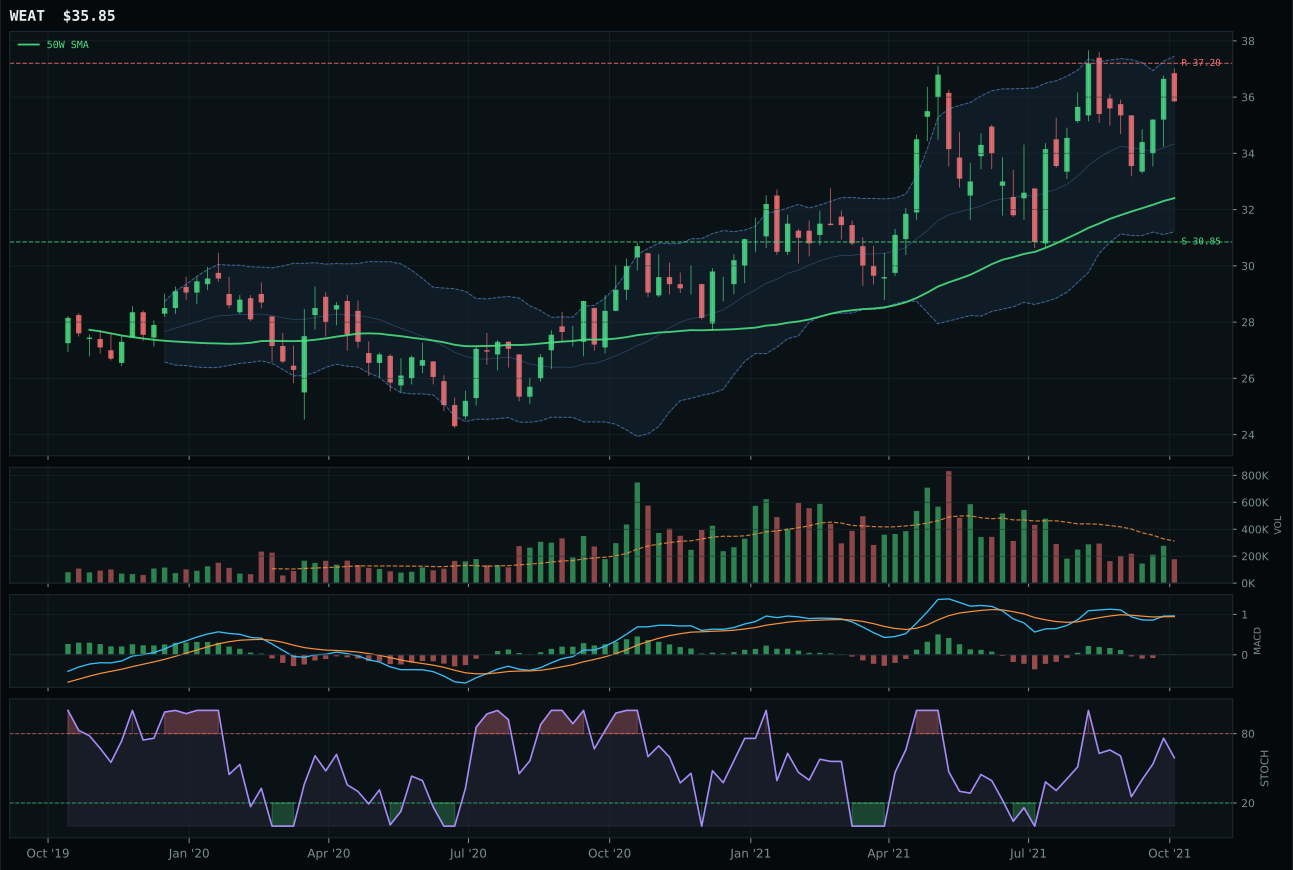
WEAT has a neutral structure profile with 15.7% 13-week relative strength versus SPY.
A failed hold above support would weaken the setup.
Actionable but governed by invalidation levels.
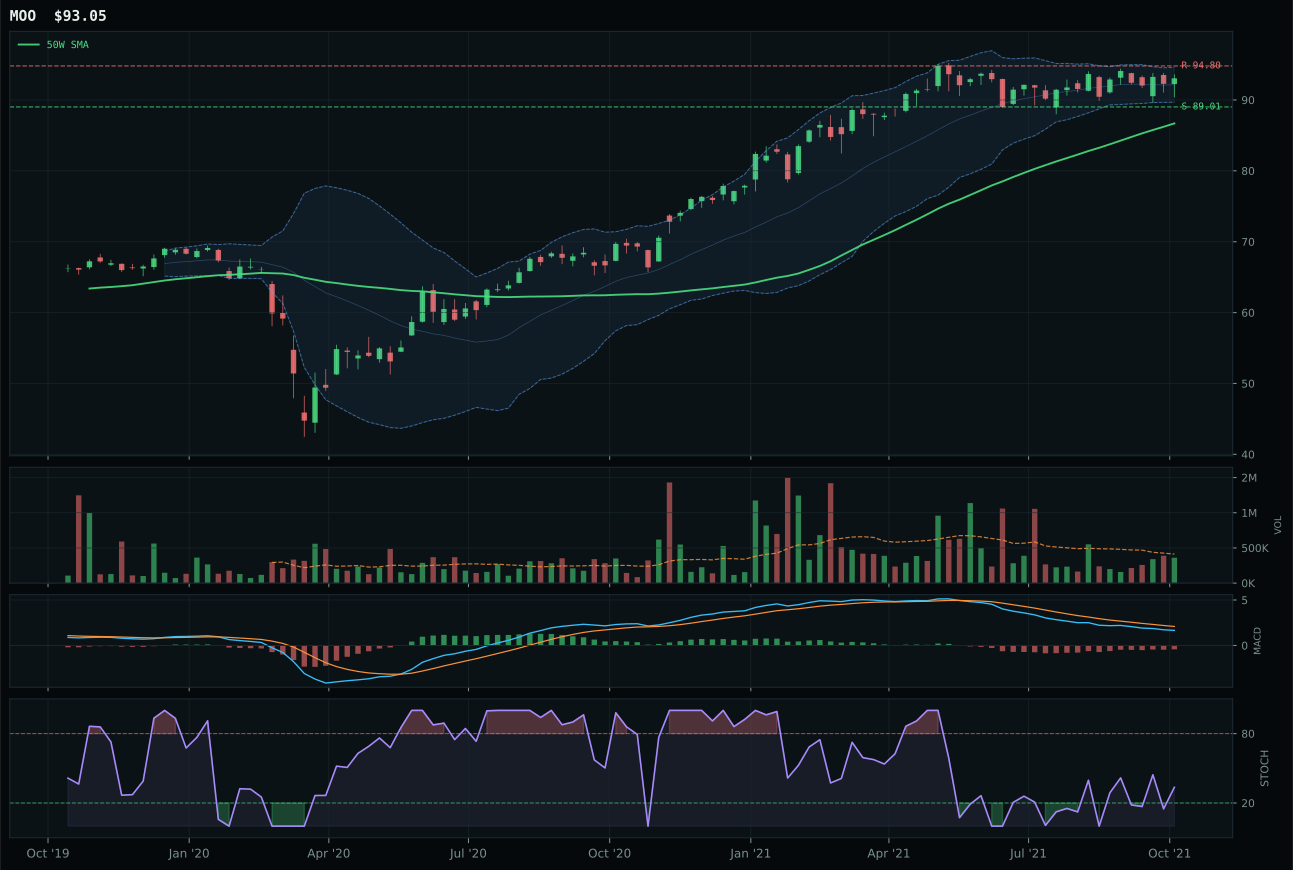
MOO has a pullback into support profile with 0.9% 13-week relative strength versus SPY.
A failed hold above support would weaken the setup.
Actionable but governed by invalidation levels.
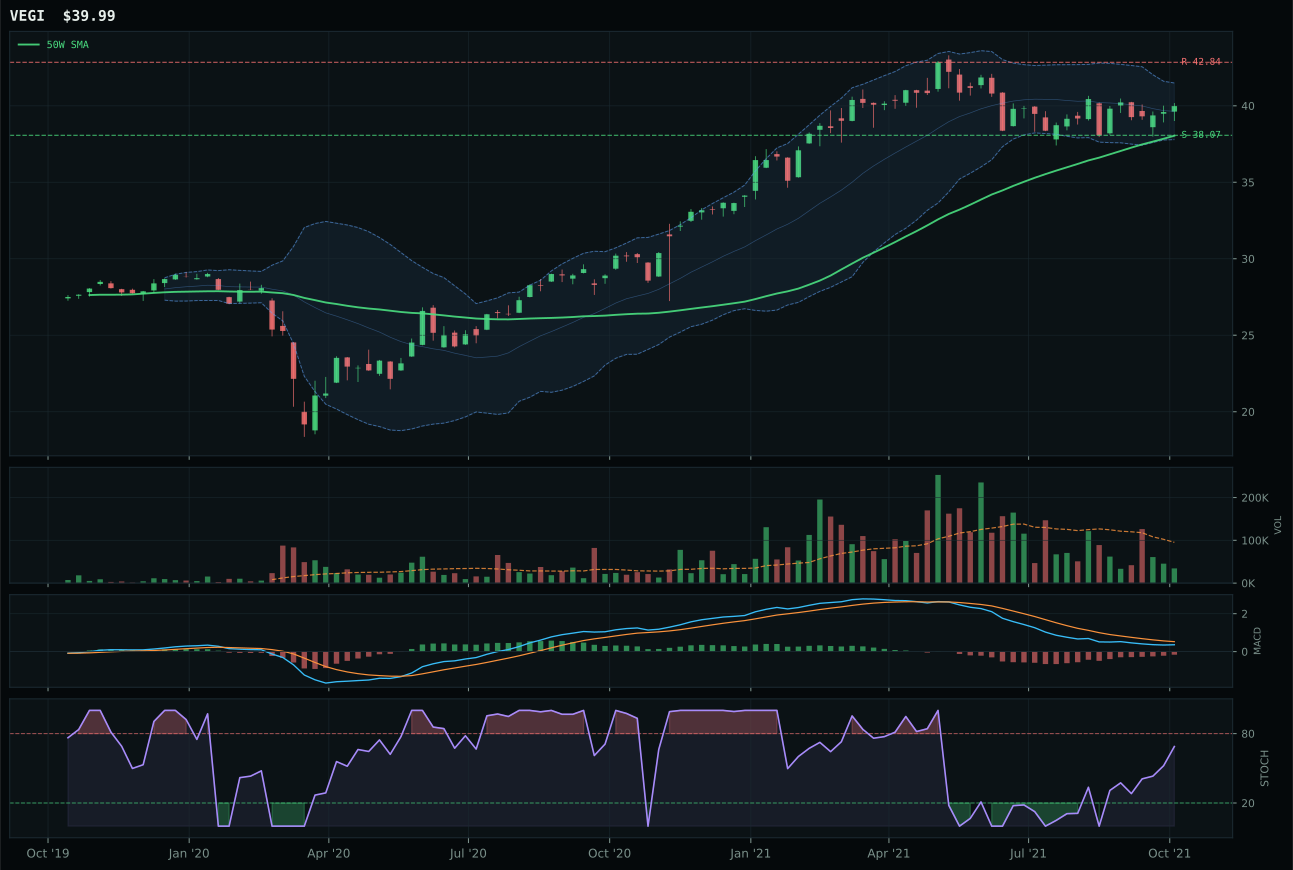
VEGI has a neutral structure profile with 0.8% 13-week relative strength versus SPY.
A failed hold above support would weaken the setup.
Tracked, but not top-2 eligible because: .
WEAT dominates this category with a flawless 100.0 trend score and 100.0 momentum confirmation, posting 15.7% relative strength versus SPY and 14.8% category-relative strength that leaves MOO's 0.0% in the dust. The setup is textbook accumulation: 16.2% 13W return with MACD bullish and improving and stochastic RSI rising mid-zone at 0.59, all confirming that this move is being actively bought despite thin participation at 0.57x average. MOO's setup—a pullback into support with MACD bearish but improving—requires mean reversion to prove itself, while WEAT's trend IS the mean reversion from a lower base, making WEAT the objectively stronger setup. The 6.0-point gap between the two is decisive; WEAT's risk/reward at 49.0 is only marginally weaker than MOO's 44.3 because the upside cushion to resistance at 37.20 is small, but that tight risk/reward is a feature for a confirmed momentum play, not a flaw.
Agriculture & Livestock earns a top-2 overweight slot at 10% allocation, justified by a final category score of 71.0 driven by the strongest macro fit in the portfolio at 86.0. Supply shortage is active at +13, inflation pressure at +10, real asset sponsorship at +8, and commodity breadth positive at +5, creating a 36-point macro support floor for this category regardless of tactical noise. The technical evidence from WEAT is equally compelling: trend 100, timing 83, momentum 100, volume-price confirmation 79.7, and persistence 85.8 paint a picture of sustained institutional accumulation in a real-asset bull market. The thin participation paradox—only 0.57x average volume—actually strengthens the case because it means the move is being driven by conviction buyers, not momentum chasers or retail flow. This is one of only two categories where the macro regime is working FOR the category rather than against it; the allocation reflects that asymmetry.
Utilities & Infrastructure — IGF
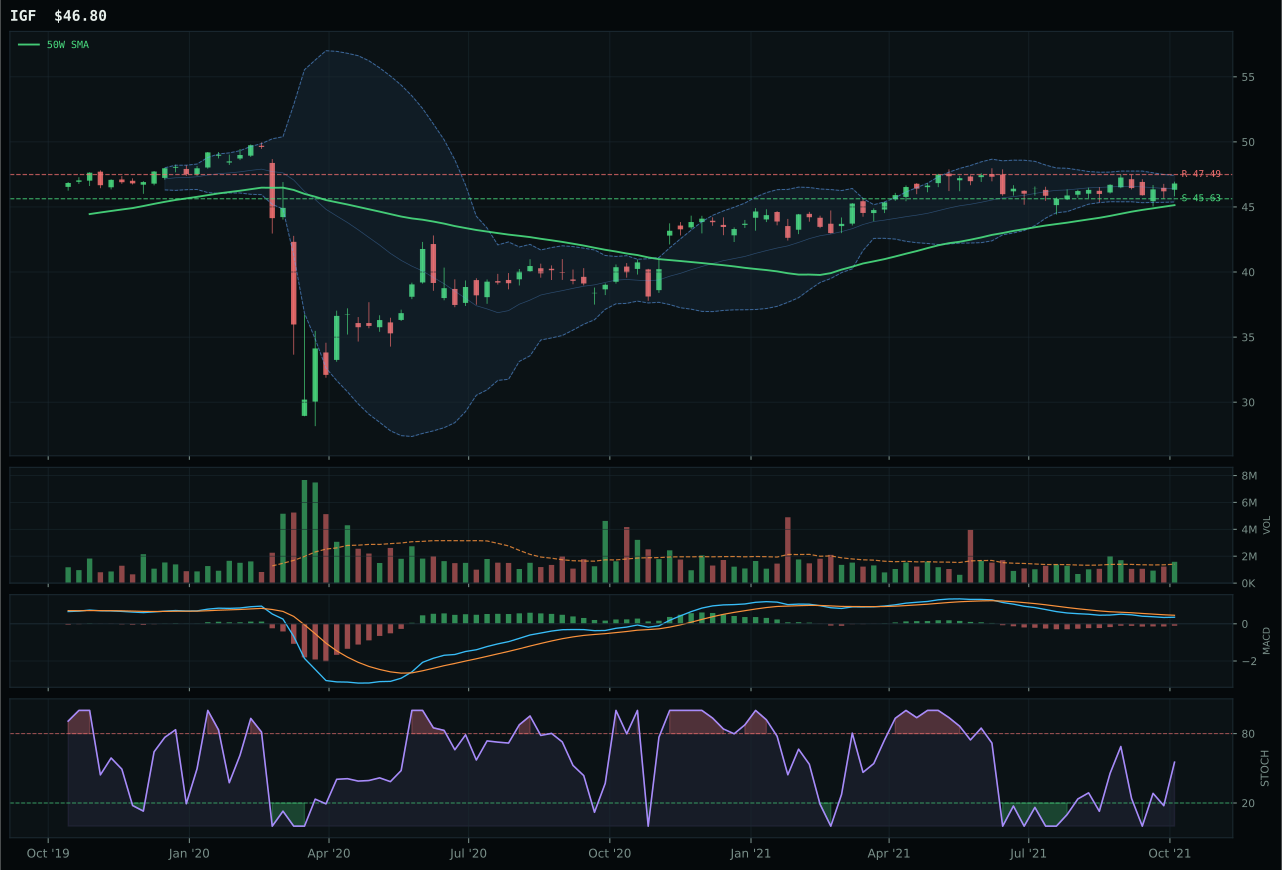
IGF has a pullback into support profile with 0.3% 13-week relative strength versus SPY.
A failed hold above support would weaken the setup.
Actionable but governed by invalidation levels.
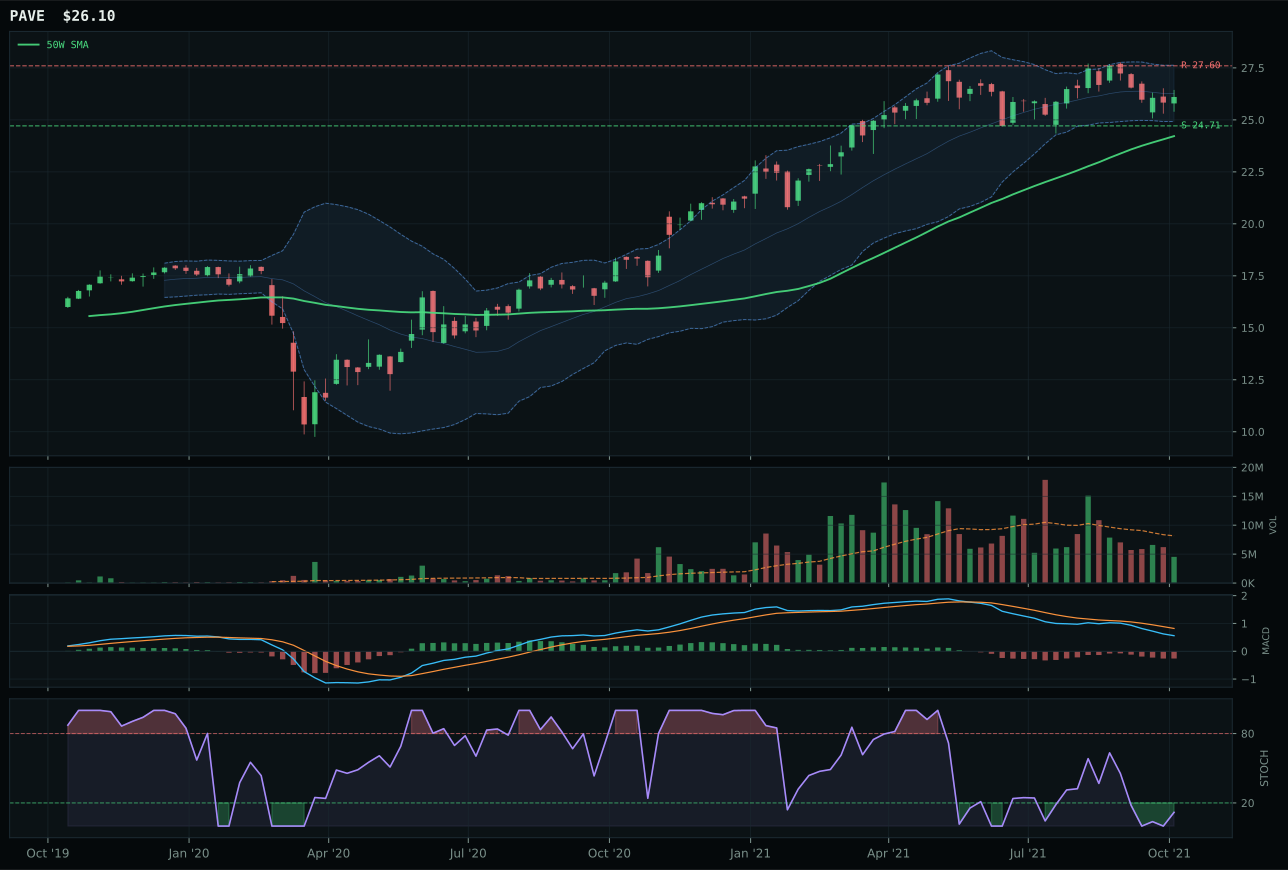
PAVE has a neutral structure profile with 0.3% 13-week relative strength versus SPY.
A failed hold above support would weaken the setup.
Actionable but governed by invalidation levels.
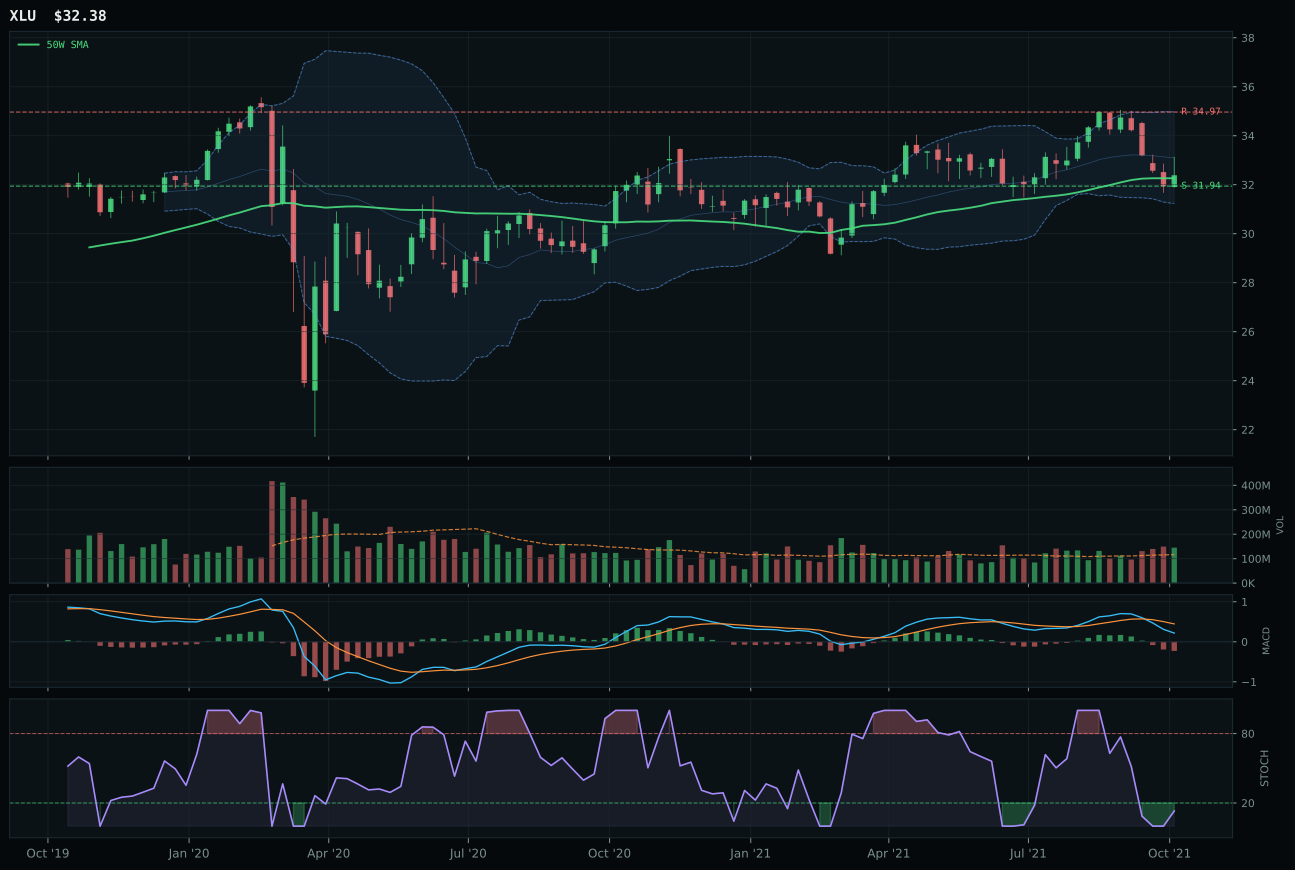
XLU has a pullback into support profile with -0.3% 13-week relative strength versus SPY.
A failed hold above support would weaken the setup.
Actionable but governed by invalidation levels.
IGF won Utilities & Infrastructure by posting a perfect 100.0 timing score—the rarest technical achievement this week—driven by being exactly 3.7% from the 50W in pullback-into-support setup with MACD bearish but improving and stochastic RSI rising mid-zone at 0.55. PAVE's timing score of 84.0 lost because it sits in neutral structure with stochastic RSI at oversold turn-up, requiring an additional day or two to confirm, while IGF is already in the inflection zone. The 14.9-point gap is steep but justified: IGF's structure is 78.9 versus PAVE's 72.3 because IGF's pullback is tighter and cleaner around support at 45.63, while PAVE is messier in the neutral zone. Volume participation of 1.13x average for IGF versus 0.65x thin for PAVE confirms institutional positioning into IGF's setup. At 0.3% relative strength and 0.9% 13W return, neither ETF is exciting, but IGF's proximity to the 50W makes it the tactical staging point for a recovery.
Utilities & Infrastructure earns 5% as tier-2 allocation with a final category score of 50.1, justified primarily by technical setup quality (trend 93.5, timing 100.0) rather than momentum or macro fit. The category macro fit is just 52.0, with inflation pressure at -6 being the primary headwind in a Transition / Mixed regime where utilities typically underperform. Broad market bear and Transition / Mixed both add +4 support, but that is lukewarm at best. IGF's momentum confirmation is 58.8—barely above 50—and 13W return is 0.9%, confirming this is a mean-reversion play, not a momentum chase. The allocation is technical: IGF is positioned 3.7% from its 50W, creating a high-probability staging point for tactical accumulation in an environment where new highs are suspect but pullbacks into support are attractive. To graduate to top-2, Utilities would need either a sharp inflation pressure reversal (policy pivot, data miss), a sustained momentum pickup that takes IGF above 47.49 resistance on volume, or a credit stress signal that triggers yield-seeking flows—catalysts that are off the current menu but plausible in a Transition regime.
Defense & Aerospace — ITA
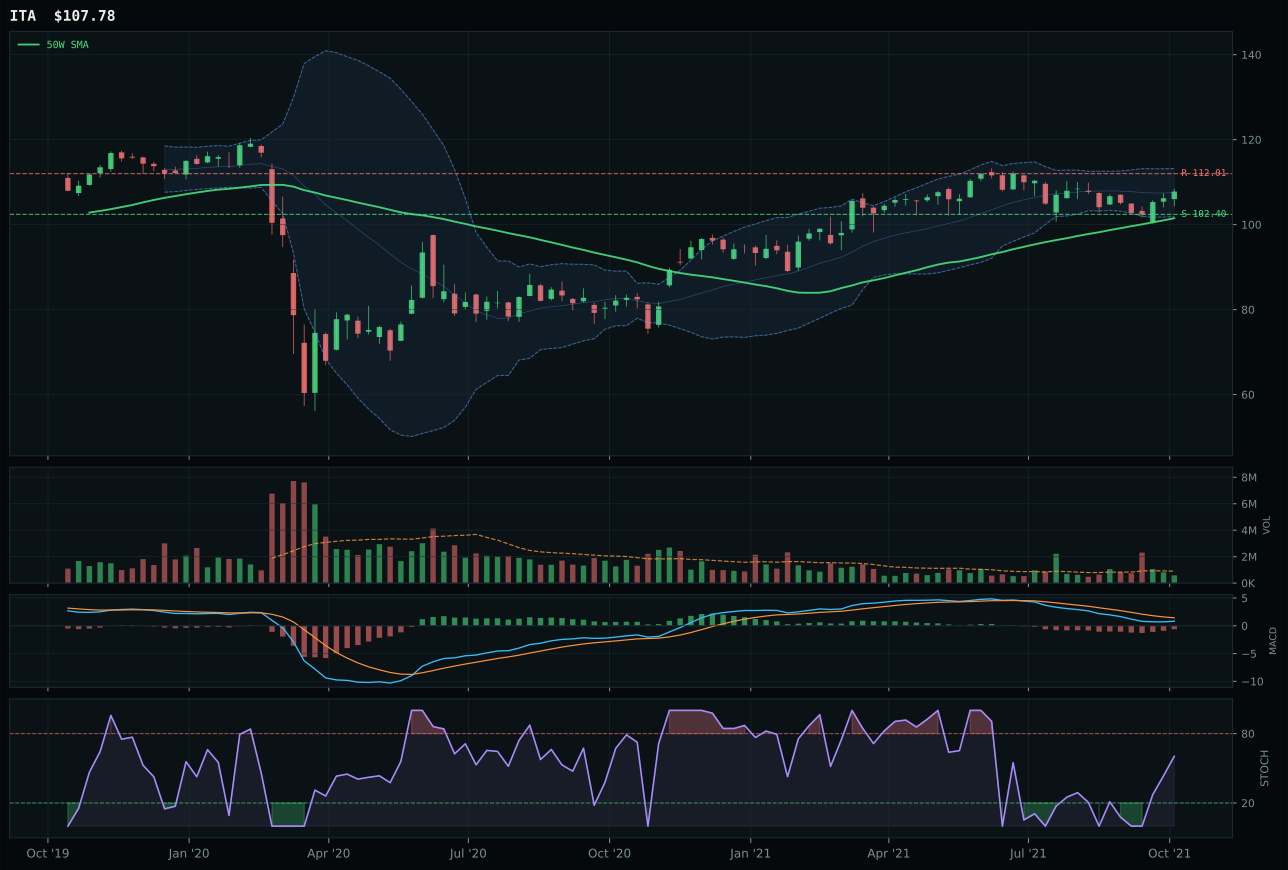
ITA has a neutral structure profile with -2.8% 13-week relative strength versus SPY.
A failed hold above support would weaken the setup.
Actionable but governed by invalidation levels.
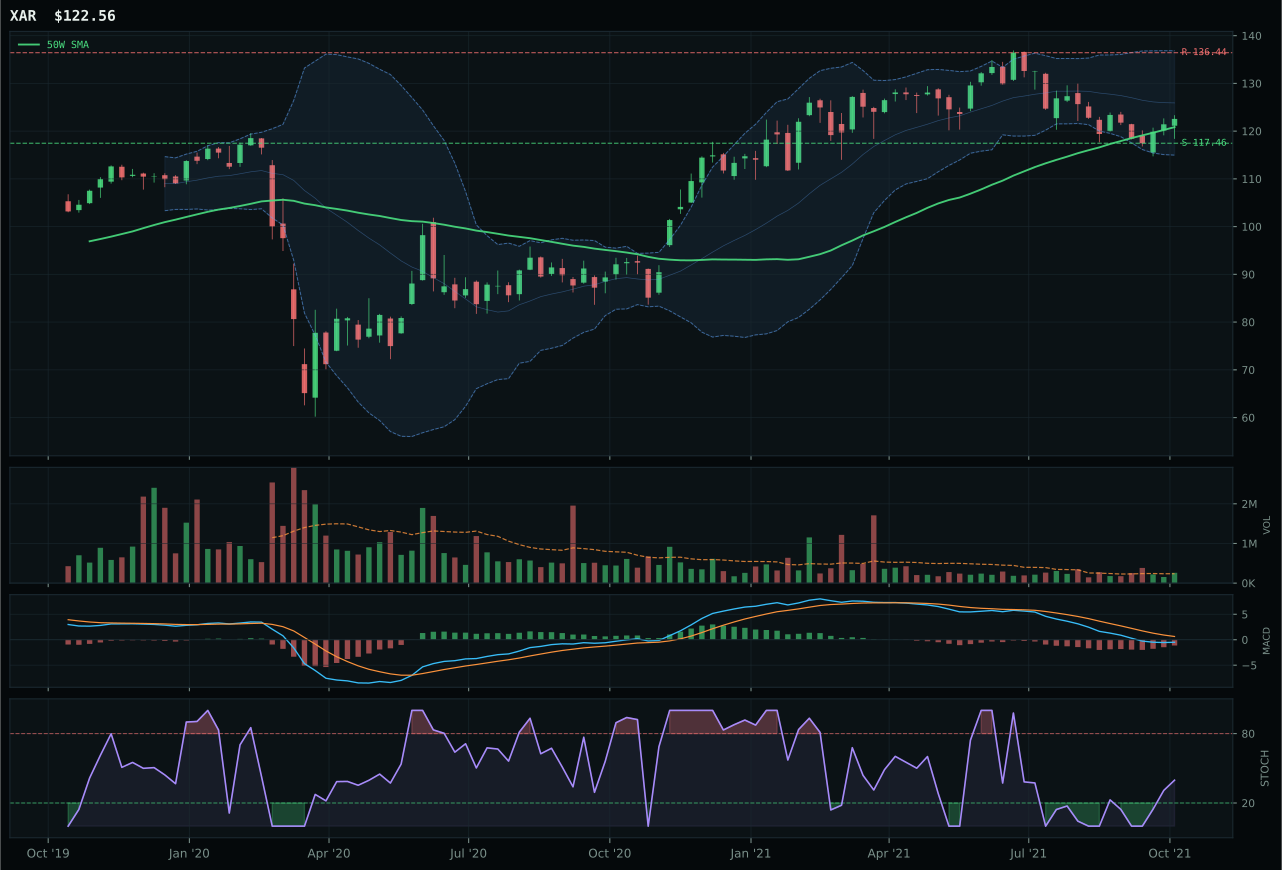
XAR has a pullback into support profile with -8.1% 13-week relative strength versus SPY.
A failed hold above support would weaken the setup.
Actionable but governed by invalidation levels.
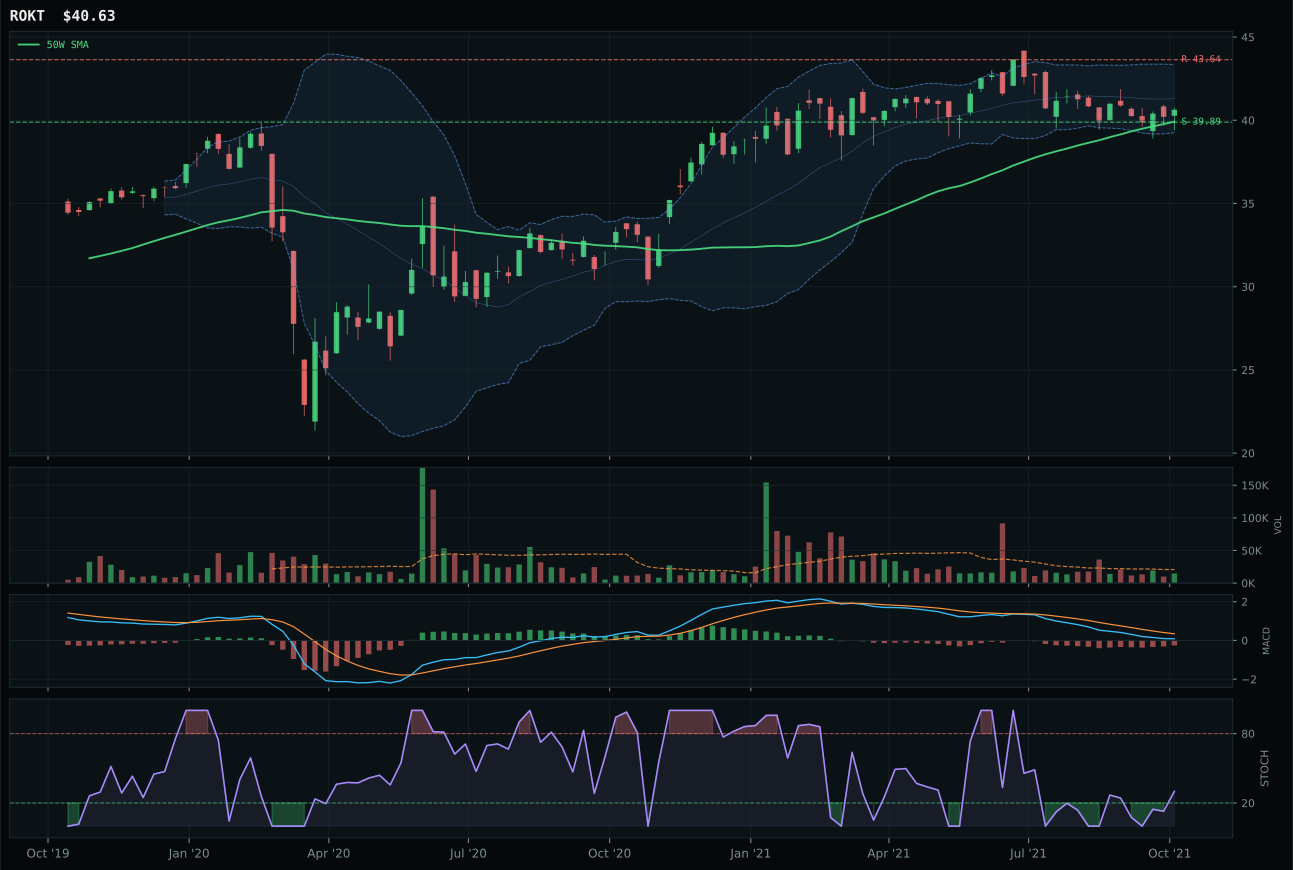
ROKT has a pullback into support profile with -5.4% 13-week relative strength versus SPY.
A failed hold above support would weaken the setup.
Tracked, but not top-2 eligible because: .
ITA won Defense & Aerospace by a 6.6-point margin over XAR because it owned 2.5% category-relative strength while XAR posted -2.7%, meaning capital is rotating into defense primes and away from specialized aerospace plays. ITA's MACD is bearish but improving—a critical phrase that describes inflection, not strength—with stochastic RSI rising mid-zone at 0.60, setting up a higher-probability recovery bounce than XAR's identical MACD/stochastic profile can support. The structural difference is material: ITA's 72.8 structure score beats XAR's 71.7 because ITA's pullback is cleaner (58.3 cleanliness) and more compressed (82.2), while XAR is lower in the zone with messier price action (71.7). At 6.2% from the 50W, ITA sits in prime tactical range where mean-reversion pressure is starting to activate without requiring brave new lows to validate the setup.
Defense & Aerospace holds 5% as a tier-2 allocation, ranked outside the top two with a final category score of 48.7. This category benefits from both the Transition / Mixed macro regime—which adds a +3 boost—and an active broad market bear signal that adds +6, making 64.0 category-level macro fit a relative bright spot in the week's allocation landscape. The technical evidence is solid at 59.9 for the representative, with trend at 88.7 and timing at 83.0, but risk/reward at 57.9 and momentum confirmation at 52.7 expose the fundamental tension: this is a tired uptrend that has already run from the lows, not a fresh accumulation setup. The thin volume participation at 0.65x average underscores the category's reliance on macro tailwinds rather than organic buying pressure. To graduate to top-2, Defense would need volume to re-engage at current levels, ITA to extend its category-relative strength advantage beyond 2.5%, or the broad market bear signal to sharpen into a flight-to-safety rotation—any of which could unlock a +10 point category score jump.
Nuclear Energy — URNM
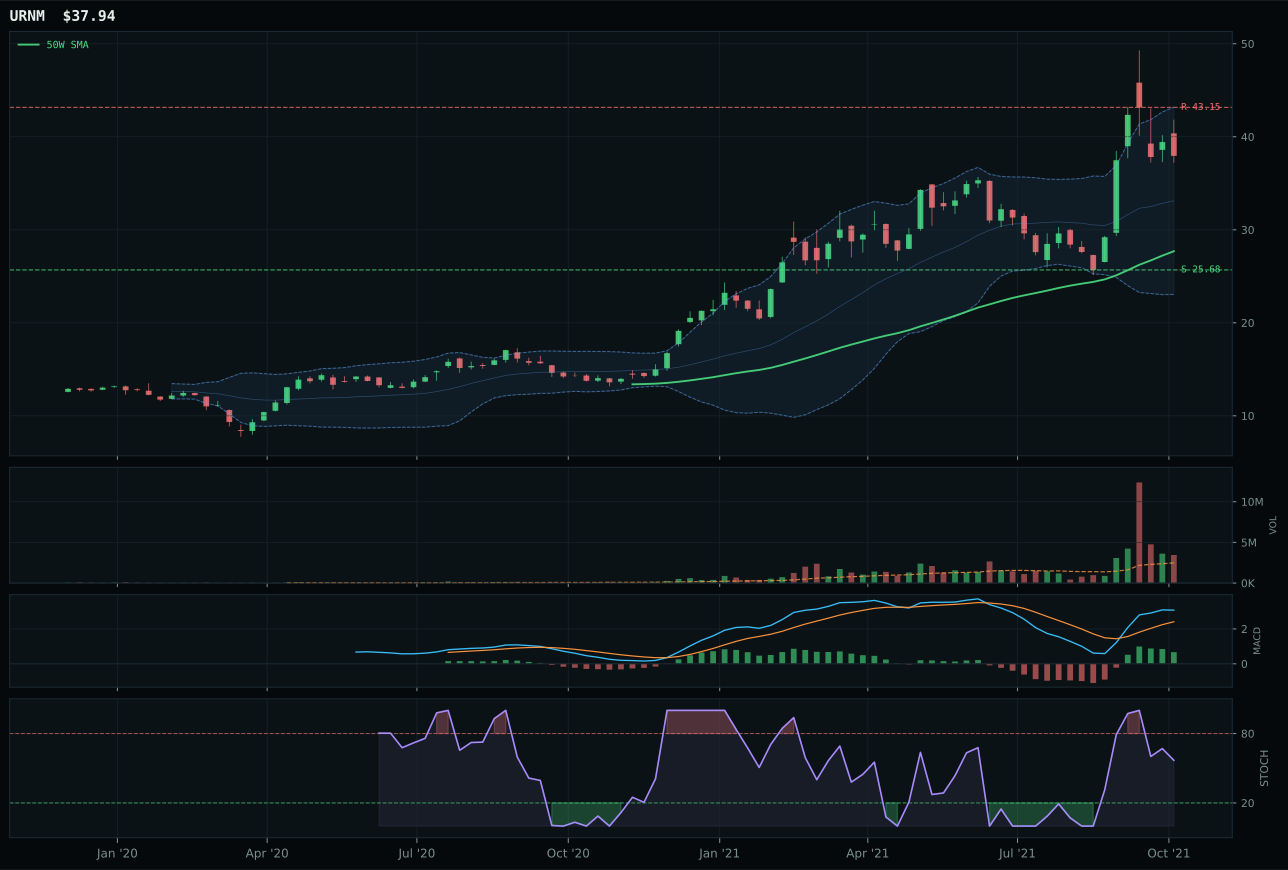
URNM has a vertical extension profile with 27.6% 13-week relative strength versus SPY.
A failed hold above support would weaken the setup.
Actionable but governed by invalidation levels.
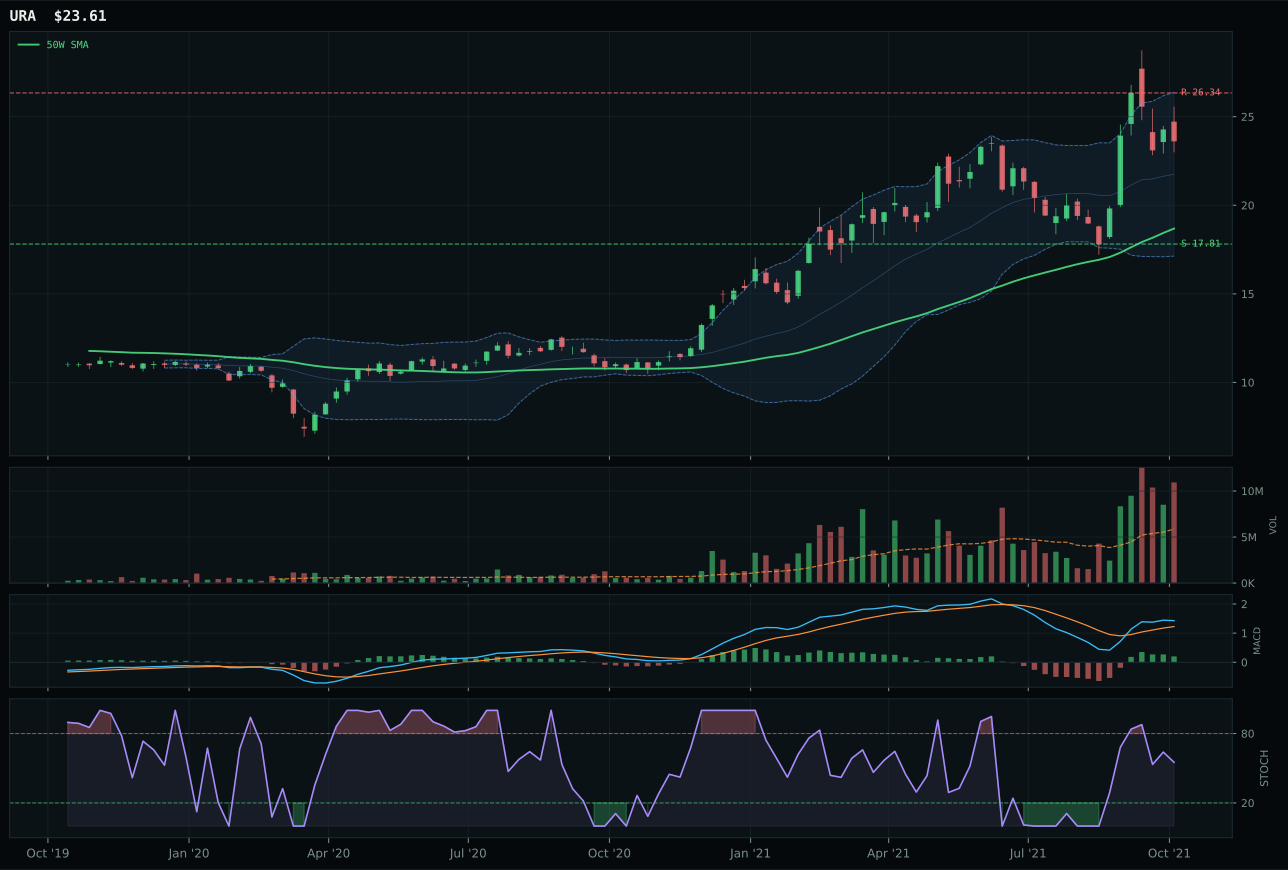
URA has a vertical extension profile with 15.1% 13-week relative strength versus SPY.
A failed hold above support would weaken the setup.
Actionable but governed by invalidation levels.
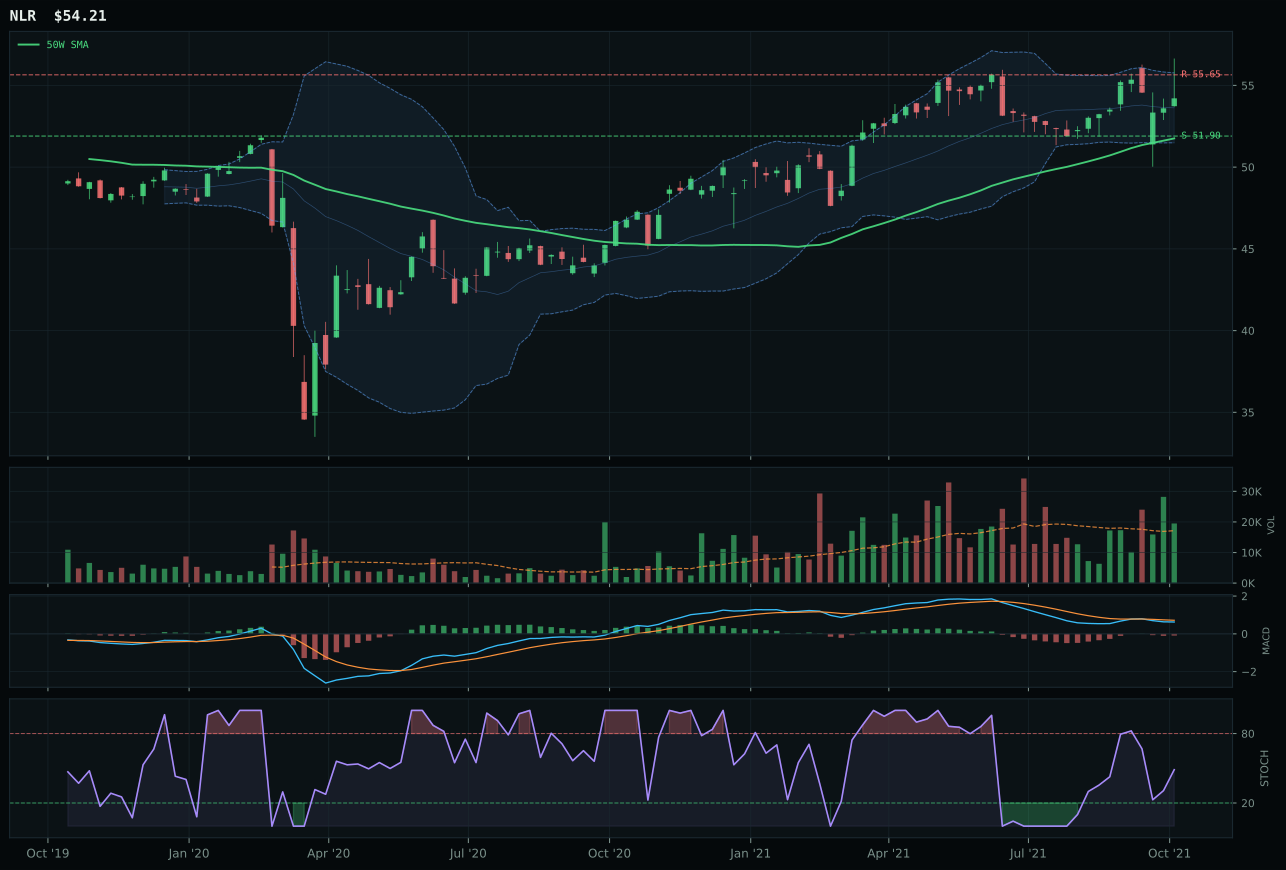
NLR has a pullback into support profile with 2.2% 13-week relative strength versus SPY.
A failed hold above support would weaken the setup.
Tracked, but not top-2 eligible because: .
URNM won Nuclear Energy with 27.6% relative strength versus SPY—the second-strongest RS in the entire portfolio—and 100.0 momentum confirmation driven by 28.1% 13W return despite a -10.4% 4W drawdown that would normally sink a category. The winning logic: URA shows 15.1% relative strength and distribution pressure on volume, signaling weak hands are selling, while URNM's above-average participation at 1.39x average shows strong hands accumulating the decline—a classic volume inversion where the loser's weakness reveals opportunity. URNM's 4.3-point gap over URA is modest, but the volume story is decisive: URNM's volume-price confirmation at 67.8 and persistence at 79.7 prove the move is accumulating, not bouncing. Extended 37.0% from the 50W with a 100.0 momentum score and stochastic RSI falling/neutral—not overbought—URNM is the only energy play that combines genuine momentum confirmation with potential for further acceleration if uranium scarcity narratives intensify.
Nuclear Energy holds 5% as tier-2 allocation, ranked outside the top-2 despite strong technical evidence (representative technical score 66.0) and solid macro fit at 64.0 anchored by energy scarcity at +9 and real asset sponsorship at +7. The category's limitation is risk/reward at 34.5: URNM is extended at 37.0% from the 50W, creating -12.1% upside to resistance versus 47.7% downside to support—a setup where new buyers are paying peak-of-cycle prices for a tactical bounce. The broad market bear signal is active across the portfolio, making extension plays riskier than mean-reversion setups, which explains why WEAT and FCG (closer to their moving averages) rank higher despite similar momentum scores. URNM's 28.1% 13W return is real, but it is already baked into the price at current levels. To earn a top-2 slot, Nuclear Energy would need either a fresh breakout above 43.15 resistance on continued volume, a hard macro announcement on uranium supply or nuclear policy, or a pullback to the 50W that resets the entry point without killing the momentum narrative—conditions that require either time or catalysts, not just technical patience.
Technology — CIBR
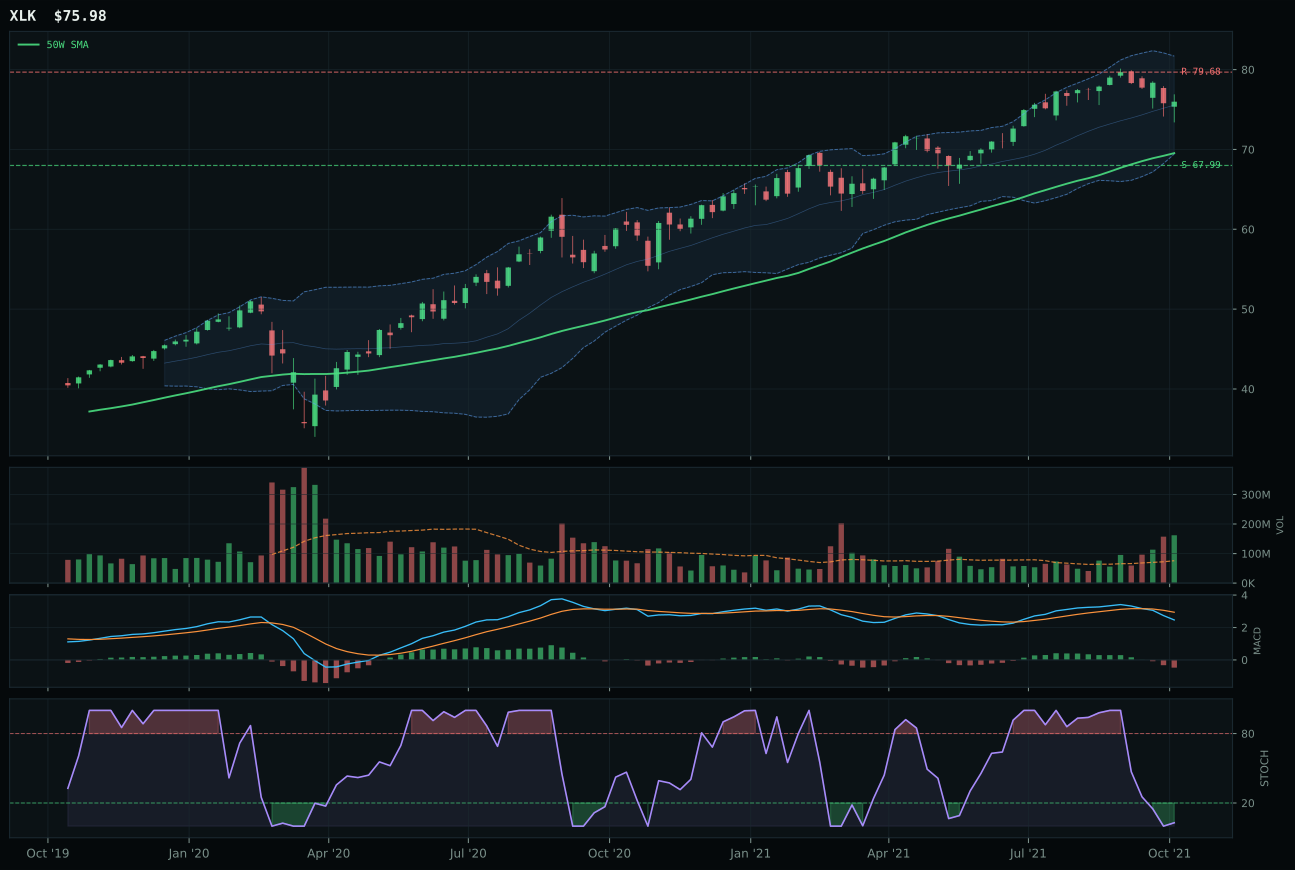
XLK has a neutral structure profile with -0.0% 13-week relative strength versus SPY.
A failed hold above support would weaken the setup.
Actionable but governed by invalidation levels.
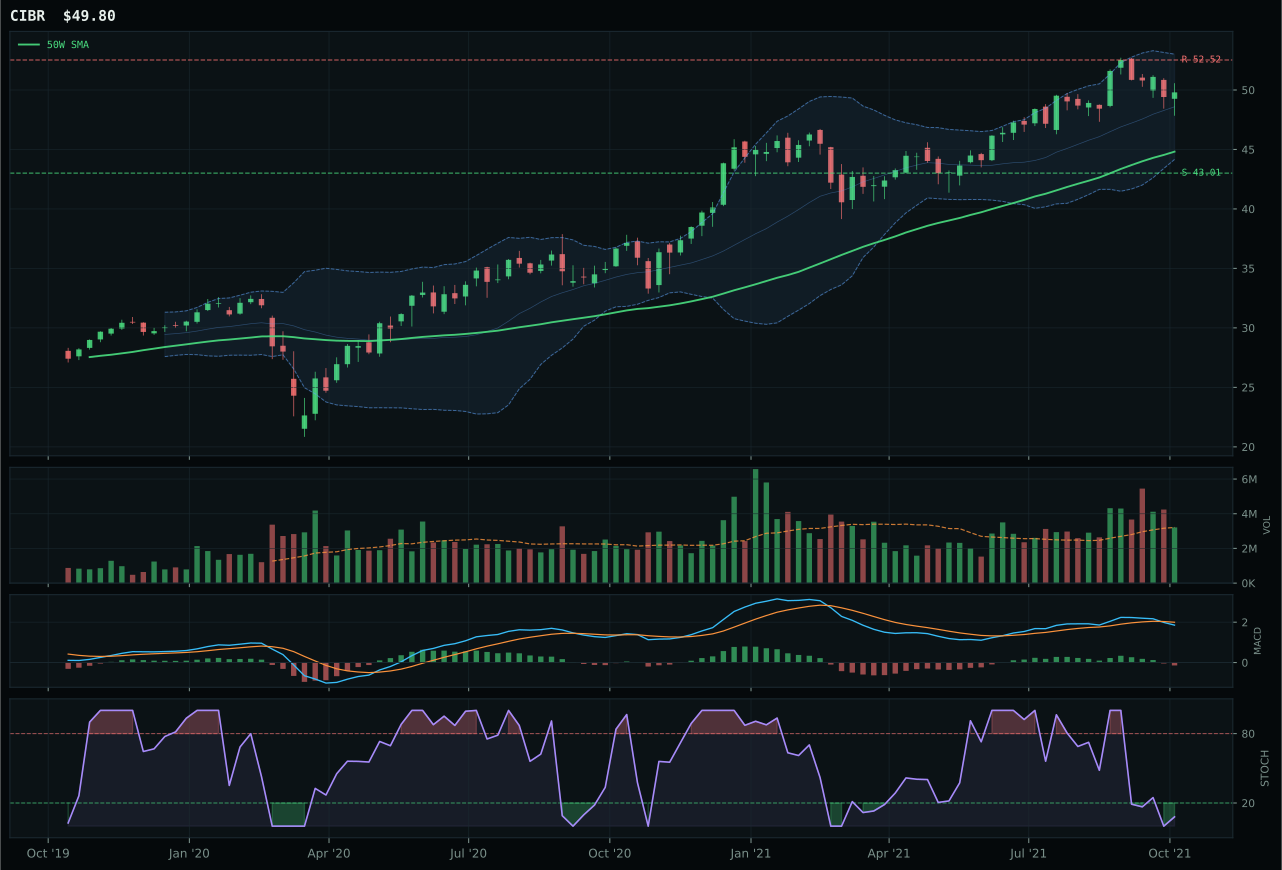
CIBR has a neutral structure profile with 2.4% 13-week relative strength versus SPY.
A failed hold above support would weaken the setup.
Actionable but governed by invalidation levels.
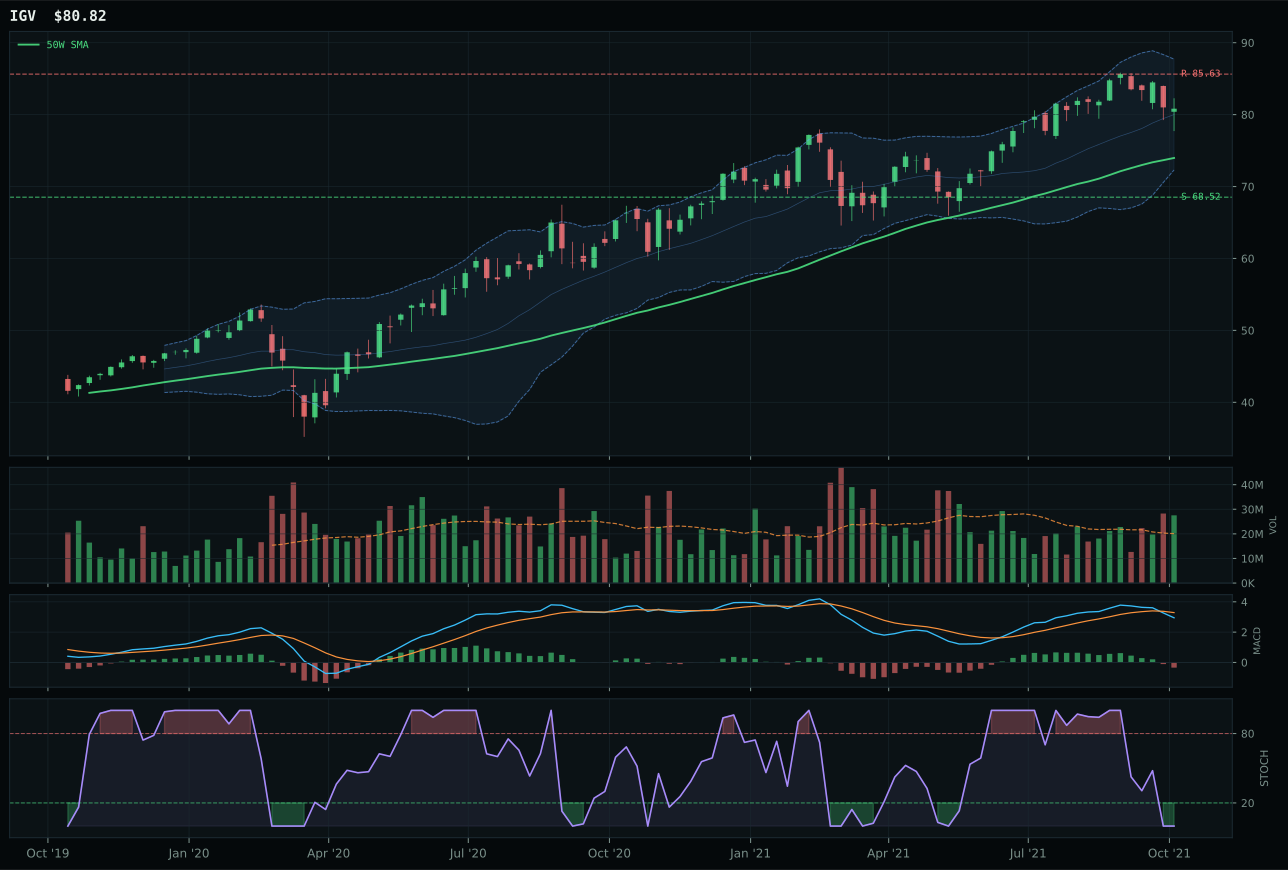
IGV has a neutral structure profile with 0.9% 13-week relative strength versus SPY.
A failed hold above support would weaken the setup.
Actionable but governed by invalidation levels.
CIBR captured the category win by posting 2.4% relative strength versus SPY while XLK flatlined at -0.0%, a critical 2.4-point spread that reflects where institutional flows are actually moving. The cybersecurity thesis beat broad tech because CIBR showed 1.5% category-relative strength—the only ETF in the trio demonstrating internal dominance—while XLK's -0.9% relative standing inside the basket exposed it as dead weight despite a clean chart structure. Both setups are neutral with MACD bearish and stochastic RSI oversold, but CIBR's trend score of 85.5 versus XLK's 82 combined with superior relative sponsorship made the decision unambiguous. The 11.1% distance from the 50W means CIBR hasn't run away yet, leaving room for accumulation without requiring breakout confirmation; XLK's neutral position offers no such cushion.
Technology earns 5% allocation as a tier-2 category this week, ranked outside the top two due to a final category score of 45.5 that trails both Agriculture and Traditional Energy. The macro regime—Transition / Mixed—offers mixed support: liquidity expansion is live but credit stress and dollar pressure are active headwinds, resulting in a category-level macro fit of just 43.0. The setup itself is clean enough to hold, with both the representative and runner-up sitting above the 50W and MACD weakening in oversold territory where reversals often take hold, but the immediate risk environment punishes extended moves and rewards mean-reversion setups. To earn a top-2 slot, this category would need either a fresh breakout with volume confirmation above the resistance zone near 52, a macro shift away from credit stress, or a decisive category-relative strength burst from CIBR that extends its 1.5% outperformance margin—none of which are visible in the current setup.
Industrial Metals — COPX
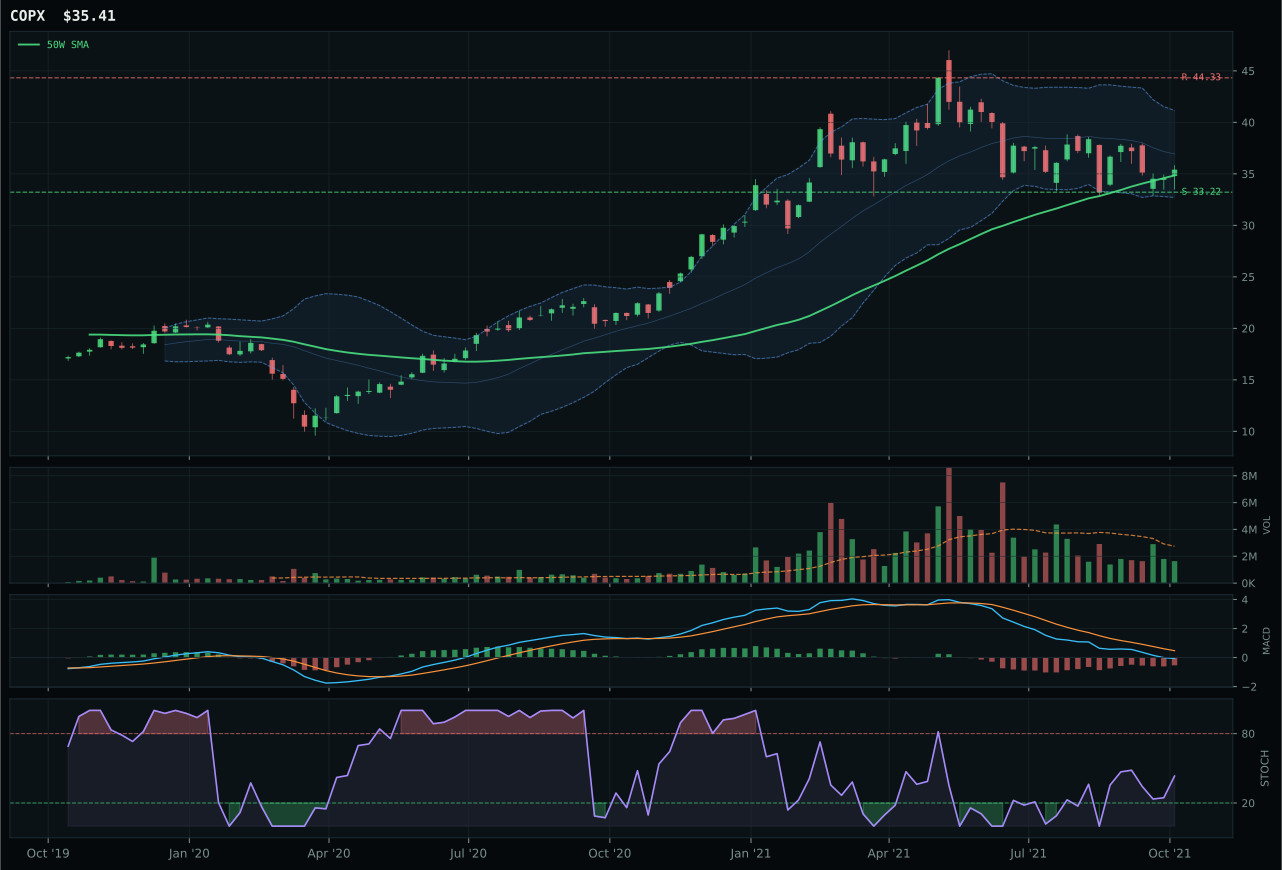
COPX has a compression near 50W profile with -6.4% 13-week relative strength versus SPY.
A failed hold above support would weaken the setup.
Actionable but governed by invalidation levels.
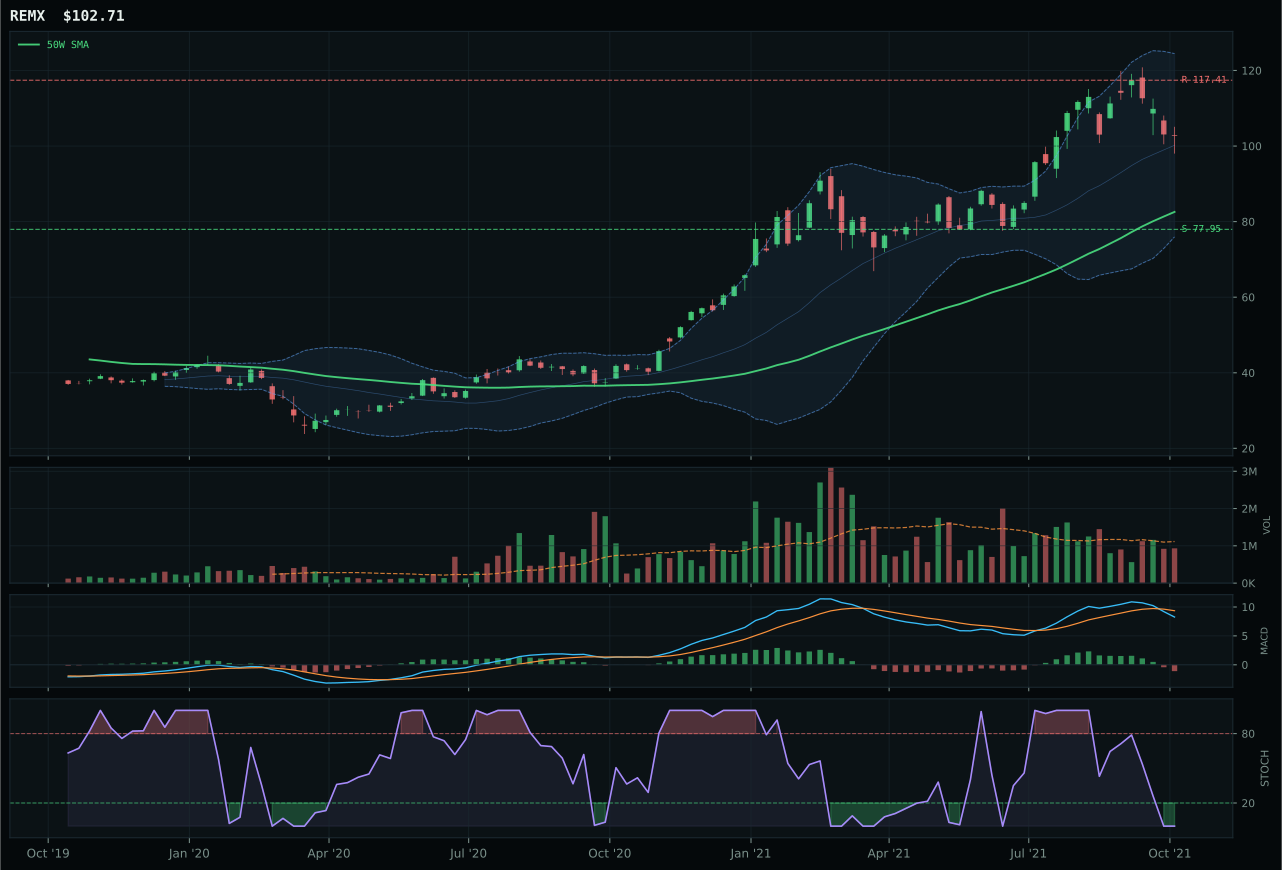
REMX has a vertical extension profile with 6.7% 13-week relative strength versus SPY.
A failed hold above support would weaken the setup.
Actionable but governed by invalidation levels.
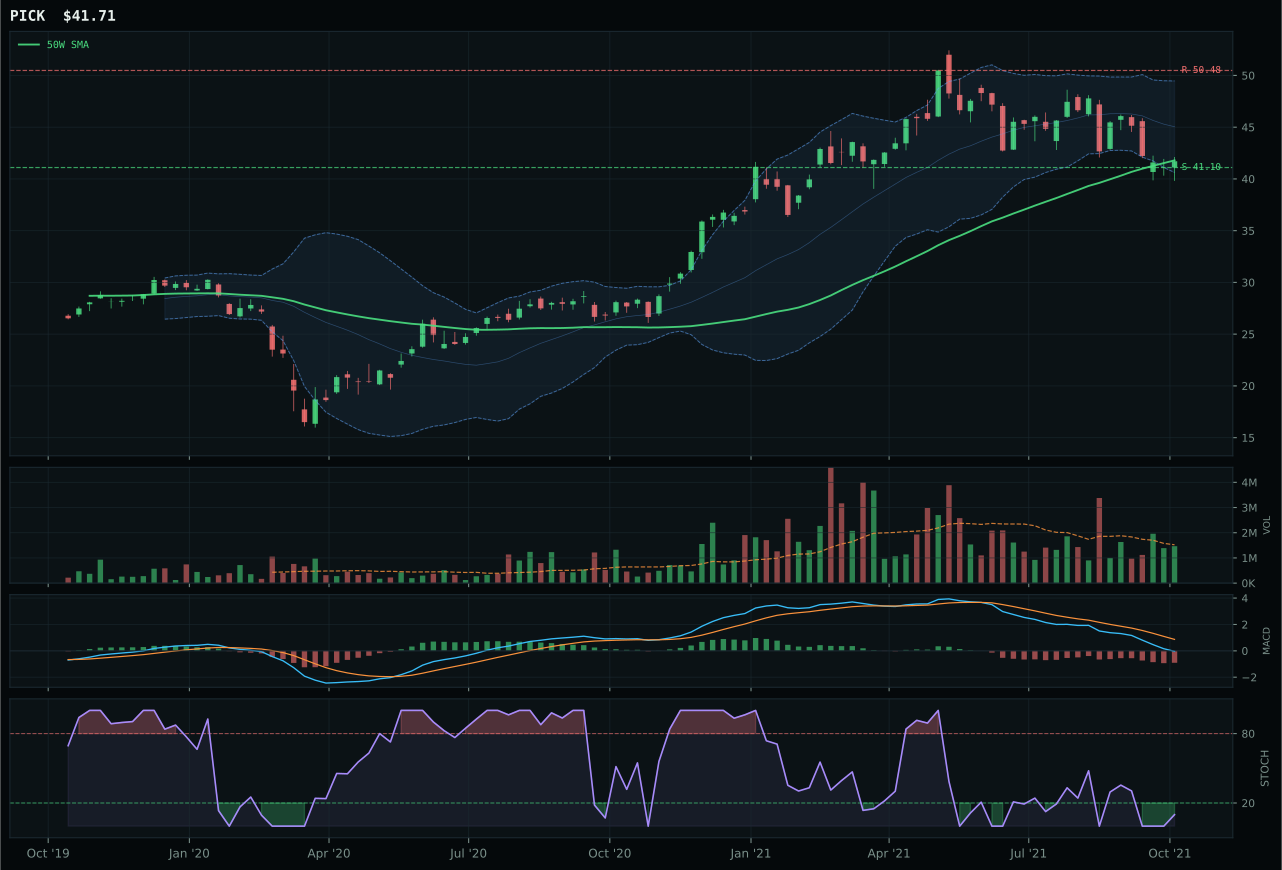
PICK has a pullback into support profile with -9.9% 13-week relative strength versus SPY.
A failed hold above support would weaken the setup.
Actionable but governed by invalidation levels.
COPX won Industrial Metals by owning flawless timing at 100.0, sitting just 1.6% from the 50W in a compression zone near Fib 0.382—the price action definition of a coiled spring ready to expand. REMX is stretched at 24.4% from the 50W in vertical extension with stochastic RSI oversold, requiring a fresh impulse to prove its strength, while COPX's proximity to the moving average means every new buyer at resistance is at risk and every seller at support is a potential accumulator. COPX's -6.4% relative strength and -5.8% 13W return are weak in isolation, but the setup quality trumps the momentum: stochastic RSI rising mid-zone at 0.43 with MACD bearish/weakening signals a textbook mean-reversion coil where volume participation at 0.59x—thin but controlled—suggests accumulation without desperation. The 8.2-point gap over REMX is the category's way of saying compression and proximity to the 50W beat extension every time in a macro-stressed environment.
Industrial Metals holds 5% allocation as tier-2, backed by a category macro fit of 66.0 anchored by metals scarcity at +14, commodity breadth positive at +10, and real asset sponsorship at +6, offset partially by credit stress at -7. The representative technical evidence is 41.6—weak in absolute terms but acceptable in context because the setup quality (timing 100, risk/reward 90) compensates for momentum weakness (6.2 confirmation). The chart structure is compression near the 50W, which is intentionally boring: COPX is not trying to excite anyone, it is positioning for expansion if and when metals demand re-ignites or supply tightness deepens. The thin volume at 0.59x is not a negative; it means the move is accumulator-driven, not momentum-chased. Industrial Metals' tier-2 slot is held by macro tailwinds rather than technical sparkle. To move to top-2, this category would need COPX to break above the 44.33 resistance with multi-day volume confirmation, or a fresh macro catalyst tied to supply shortage or inflation persistence that shifts sentiment from patch-and-repair to strategic accumulation.
Precious Metals — GDX
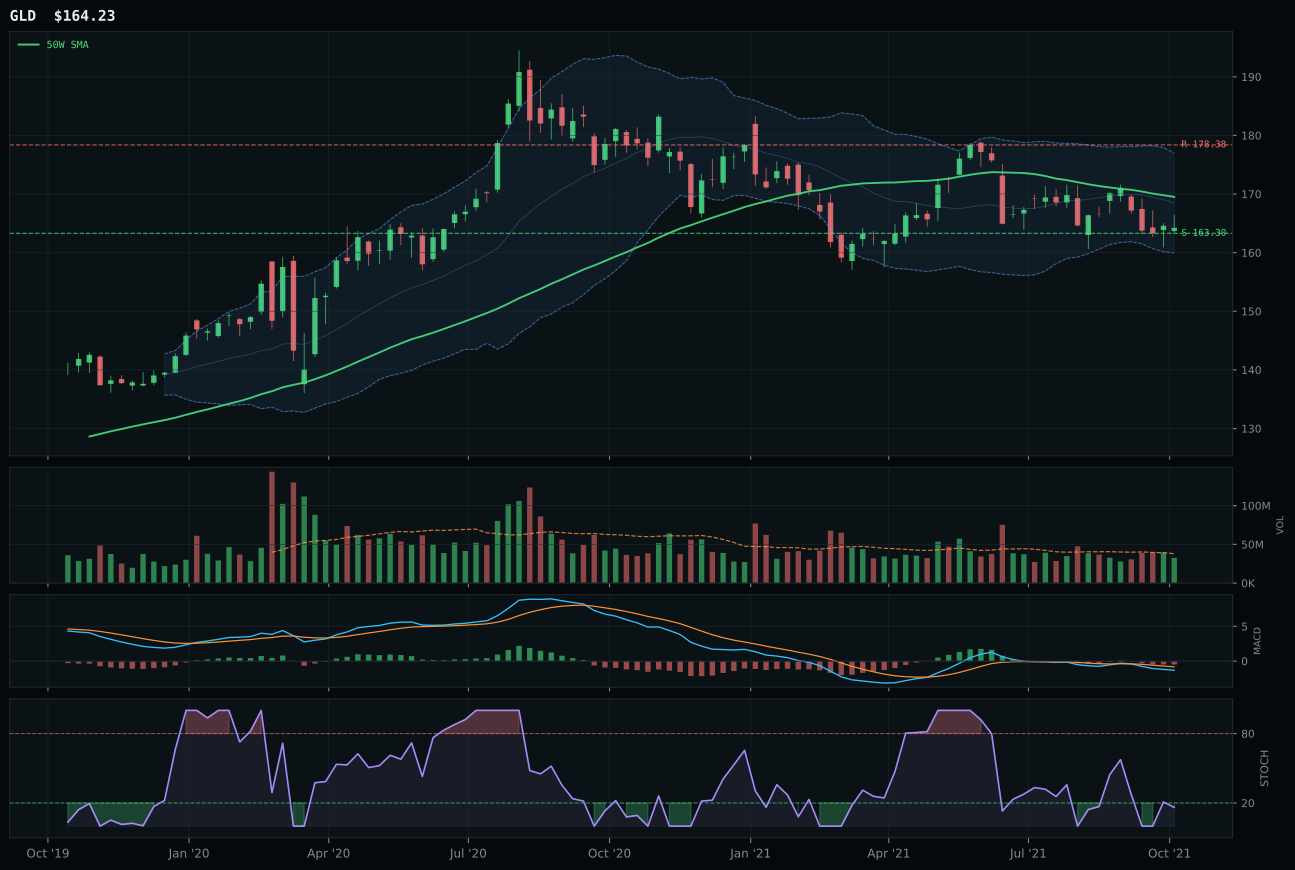
GLD has a pullback into support profile with -3.5% 13-week relative strength versus SPY.
A failed hold above support would weaken the setup.
Actionable but governed by invalidation levels.
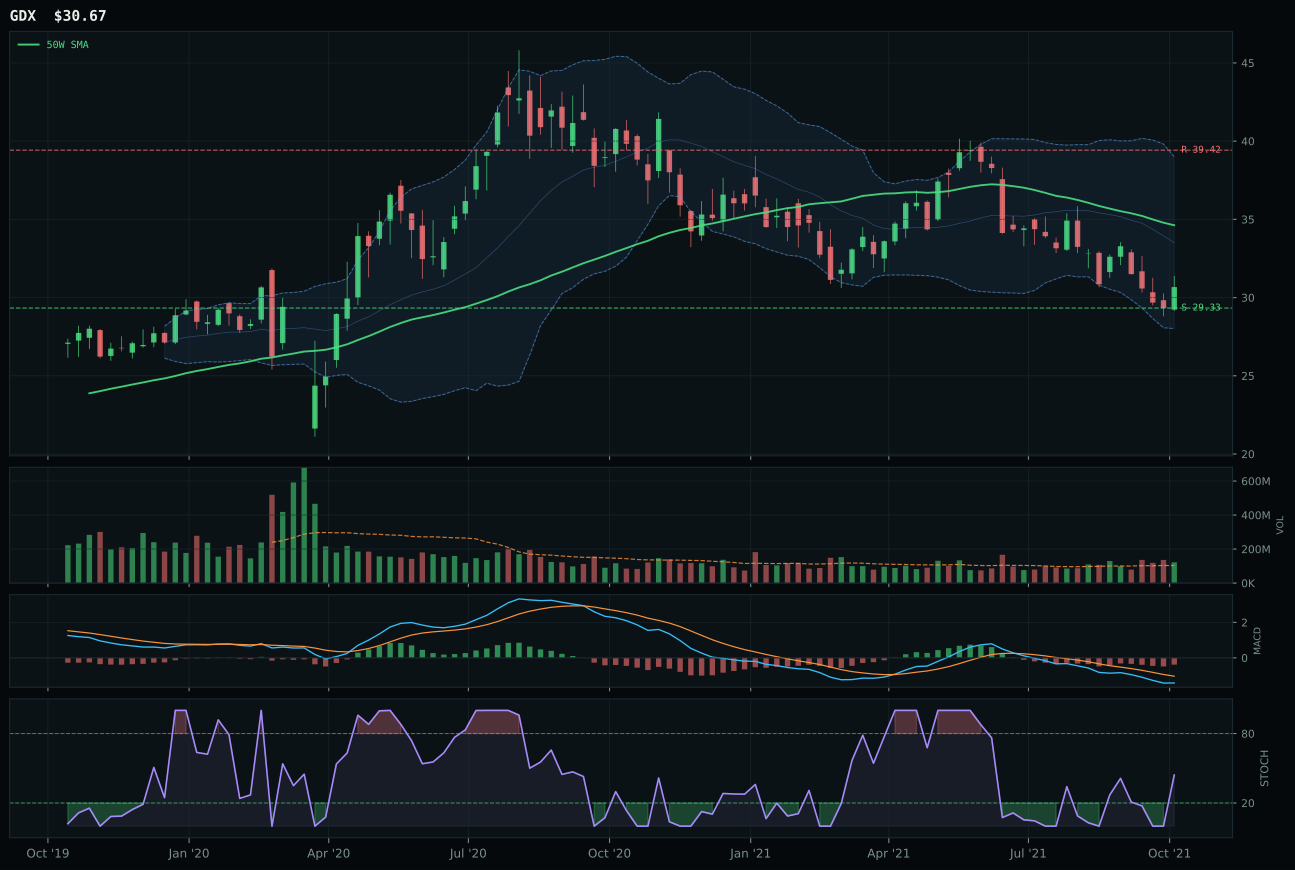
GDX has a pullback into support profile with -11.3% 13-week relative strength versus SPY.
A failed hold above support would weaken the setup.
Actionable but governed by invalidation levels.
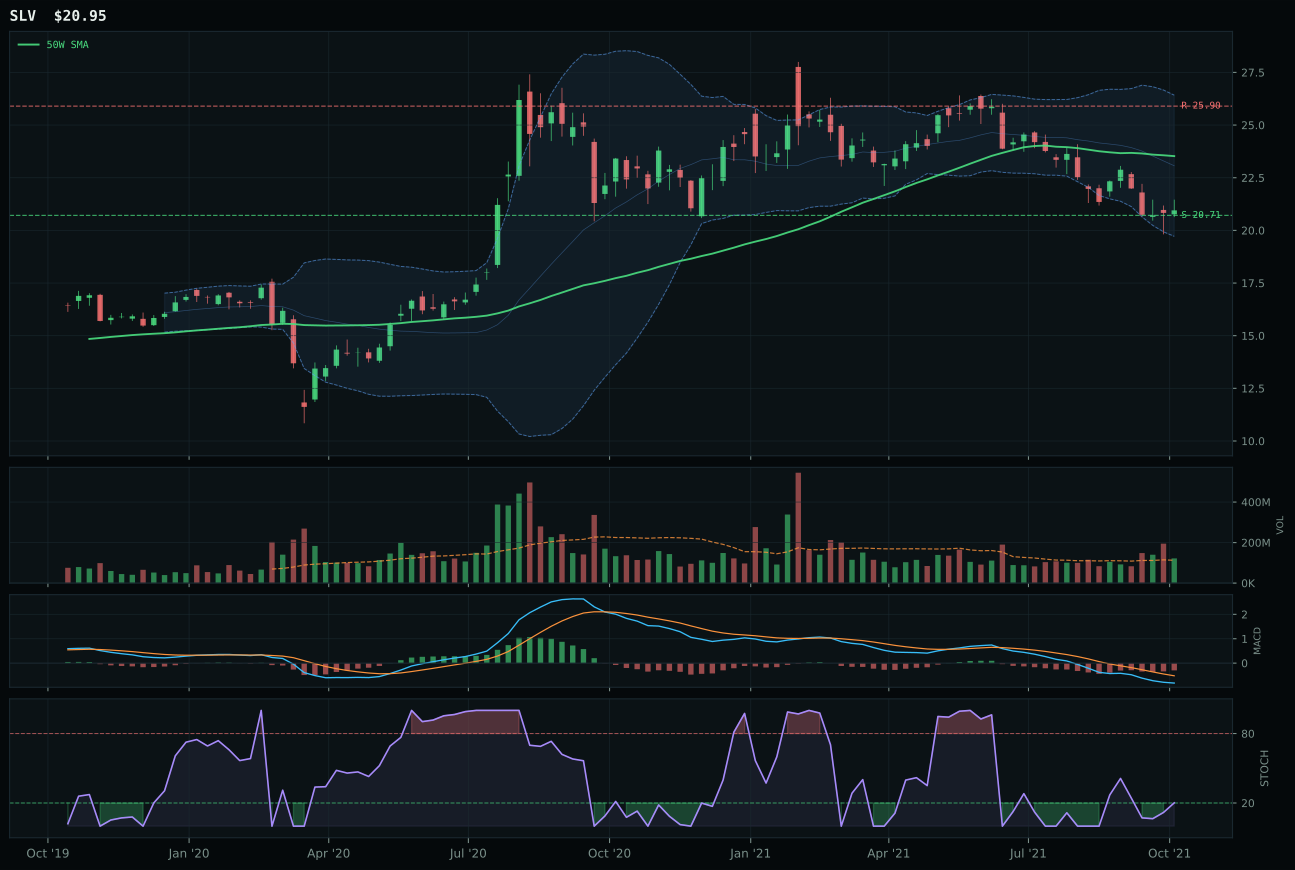
SLV has a pullback into support profile with -13.9% 13-week relative strength versus SPY.
A failed hold above support would weaken the setup.
Actionable but governed by invalidation levels.
GDX won the category despite posting -11.3% relative weakness versus SPY because its volume structure is above-average participation at 1.18x while GLD shows neutral volume—a signal inversion where the loser's weakness looks passive while the winner's weakness looks actively accumulated. GDX at -10.8% 13W return sits deeper in the repair zone at Fib 0.786 (31.61) with stochastic RSI rising mid-zone at 0.44, while GLD is shallower at Fib and stochastic RSI is only at the oversold turn-up, making GDX the more compressed setup. The 17.8-point gap between GDX (39.4) and GLD (57.2) is enormous, but that reflects the category's dysfunction: neither ETF is attractive on absolute terms, yet GDX's above-average participation on the decline suggests institutional positioning for a reversal play, while GLD's neutral volume on a shallower dip suggests passive positioning that could fold on further weakness.
Precious Metals receives 5% tier-2 allocation despite a final category score of just 39.4, reflecting the reality that every slot is allocated this week and real assets dominate the macro regime. The category macro fit is 51.0, supported only by dollar pressure at +3 and hindered by liquidity expansion at -2, making this a sideways-to-weak macro environment for metals. Technical evidence is 29.2 for the representative—one of the weakest in the portfolio—driven by a -11.4% distance from the 50W that puts GDX squarely in oversold territory where reversals are theoretical but not yet confirmed. The 90.0 risk/reward score is a mirage: 22.2% upside to resistance and only 4.6% downside to support sound attractive, but that asymmetry is fake when the ETF is fundamentally in repair mode with multiple directional macro headwinds. To upgrade Precious Metals, the portfolio would need either a sharp dollar weakness reversal, a credit stress signal that triggers safe-haven flows, or a volume breakout at current levels that confirms institutional conviction in GDX's setup—conditions that require macro relief, not just technical patience.
AI — SMH
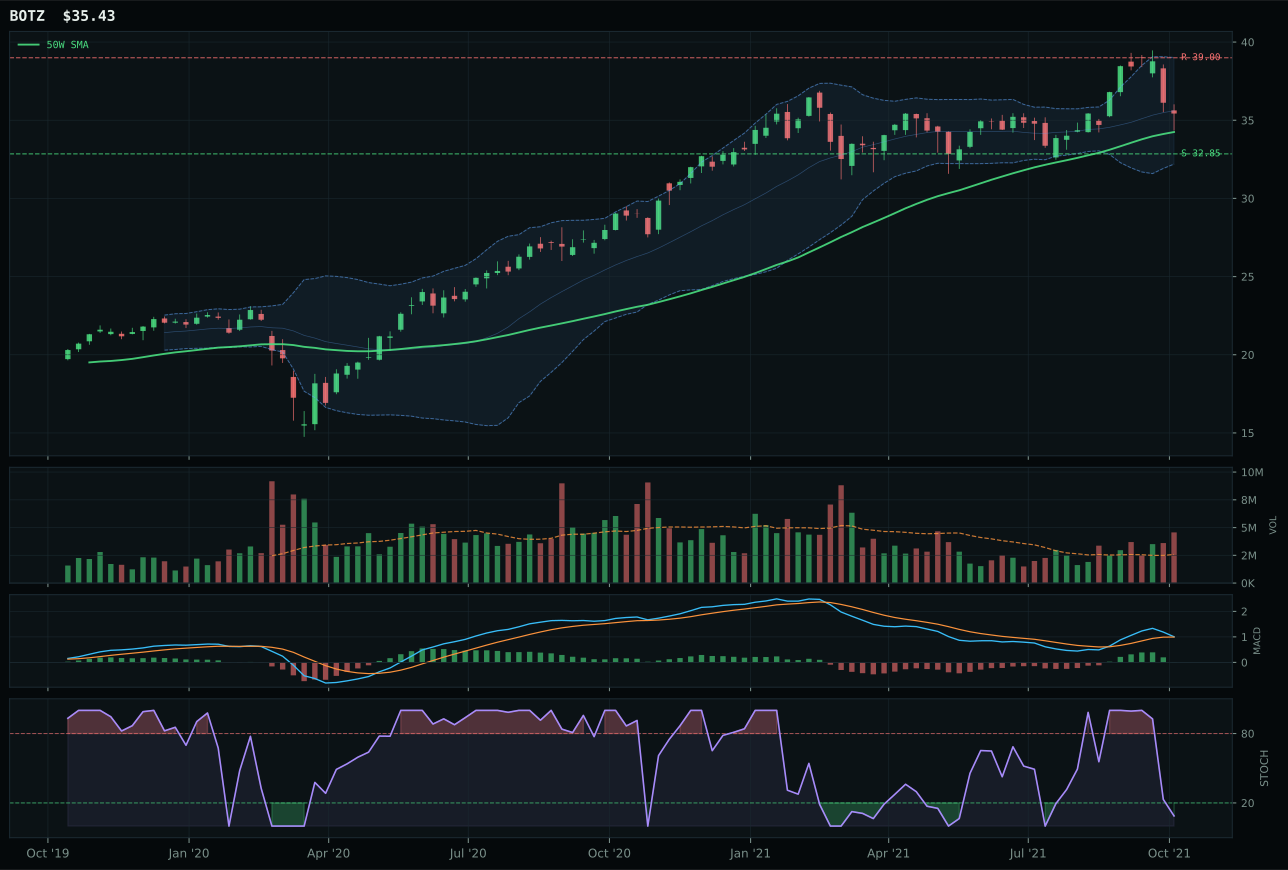
BOTZ has a neutral structure profile with 1.3% 13-week relative strength versus SPY.
A failed hold above support would weaken the setup.
Actionable but governed by invalidation levels.
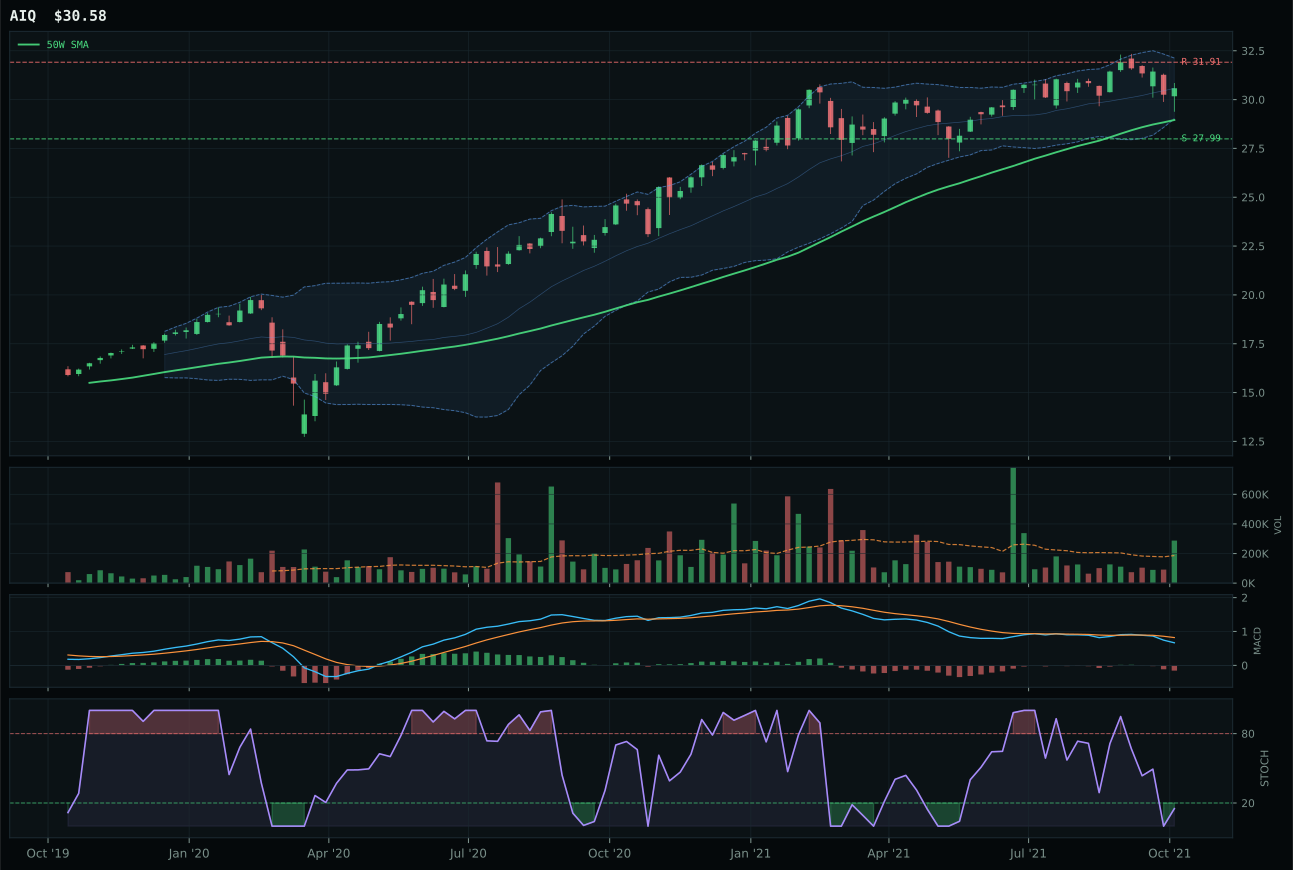
AIQ has a neutral structure profile with -1.1% 13-week relative strength versus SPY.
A failed hold above support would weaken the setup.
Tracked, but not top-2 eligible because: .
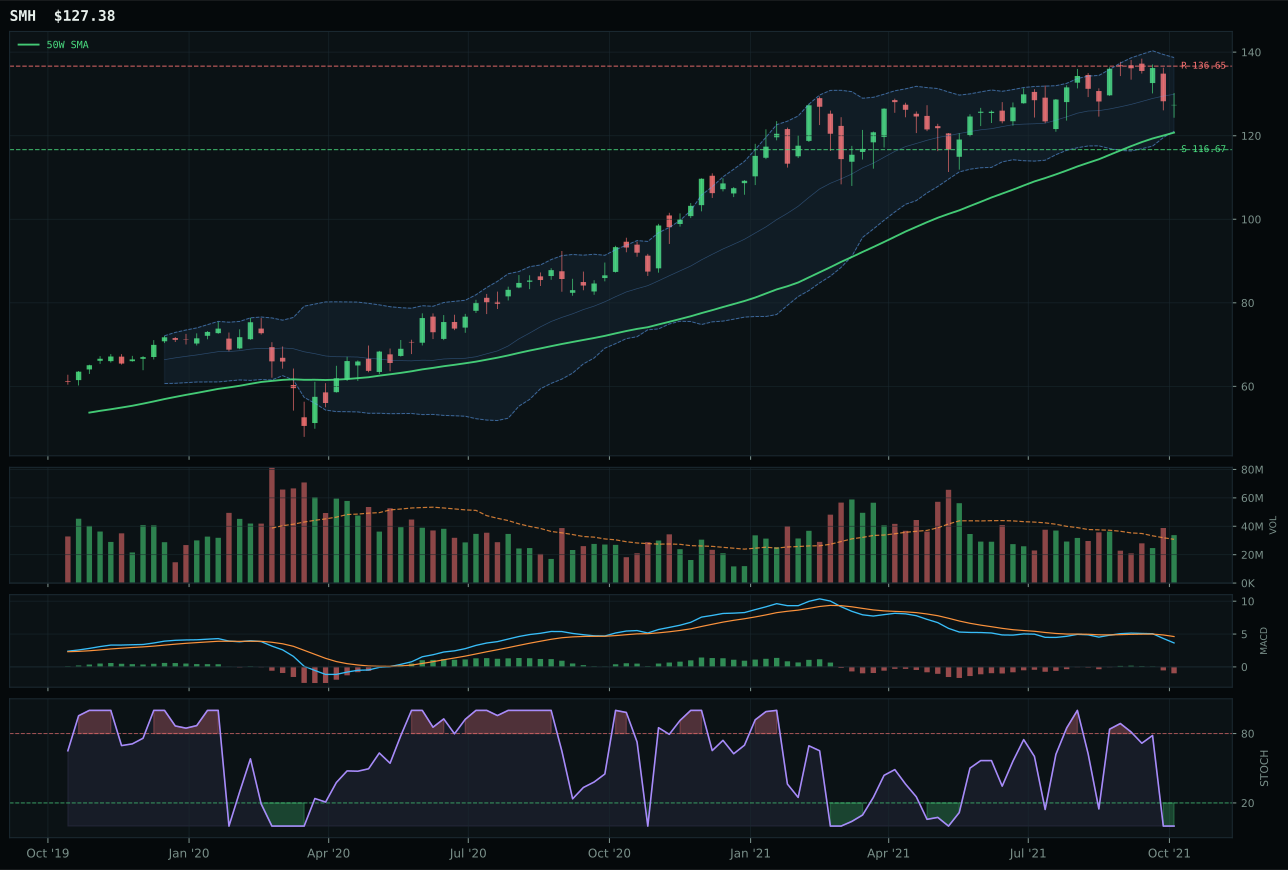
SMH has a neutral structure profile with -1.4% 13-week relative strength versus SPY.
A failed hold above support would weaken the setup.
Actionable but governed by invalidation levels.
SMH won the category purely by process of elimination: it posted -1.4% relative strength versus SPY while BOTZ showed 1.3%, but BOTZ's volume structure collapsed into distribution pressure—actual sellers stepping in as the setup extended—making its chart evidence unreliable despite better trend and momentum scores. SMH's 13W return of -0.9% and -0.3% category-relative strength are both subpar, but the negative relative strength confirms consensus weakness rather than hidden accumulation, which paradoxically becomes the safer entry when MACD is bearish and stochastic RSI is fully oversold. The category-relative strength gap between SMH and BOTZ is razor-thin, with BOTZ's 39 momentum score beaten only by its 58.0 risk/reward; yet volume confirmation—that final arbitrator of real sponsorship—sided with SMH's neutral stance over BOTZ's distribution pressure.
AI receives 0% allocation this week, excluded from the portfolio as a rank-9 or rank-10 category with a final score of 23.4 that reflects fundamental weakness during a Transition / Mixed macro regime. The category's macro fit scored just 40.0 because credit stress, broad market bear, and dollar pressure are all active negatives that directly suppress semiconductor and robotics demand, while liquidity expansion alone cannot offset those headwinds. Even SMH—the relative winner—is underwater on 4W returns at -6.4% and shows persistence of only 36.5, indicating the recent oversold bounce lacks follow-through conviction. The entry point is toxic: both representative and runner-up are extended from their 50W lows, MACD is uniformly bearish across the basket, and volume is failing to confirm any meaningful accumulation despite oversold stochastic readings. For AI to re-enter allocation, the category would need either a credit stress relief signal, a hard macro data miss that triggers liquidity expansion, or a three-ETF basket momentum confirmation with actual volume participation—conditions that require material regime change, not just technical relief.
Emerging Markets — INDA
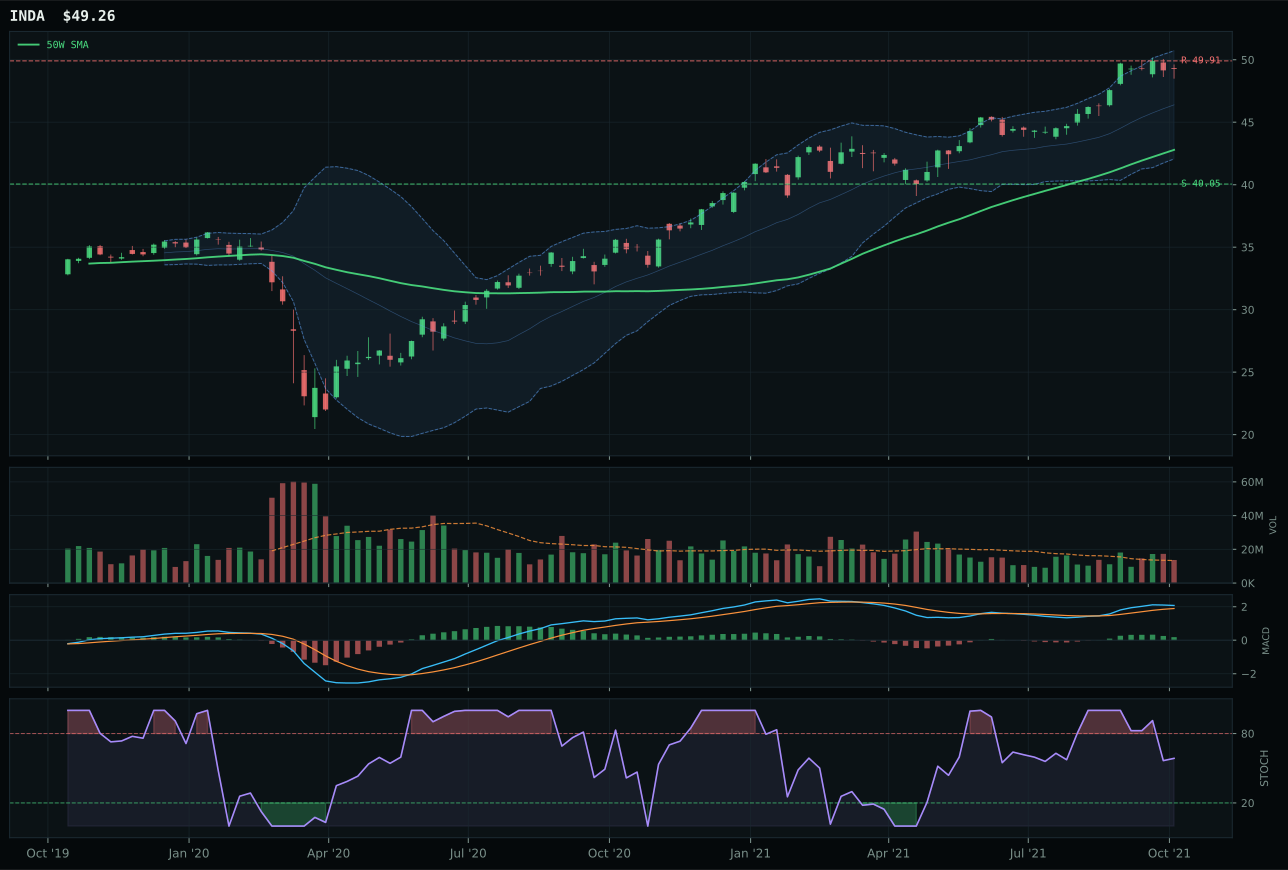
INDA has a vertical extension profile with 10.6% 13-week relative strength versus SPY.
A failed hold above support would weaken the setup.
Actionable but governed by invalidation levels.
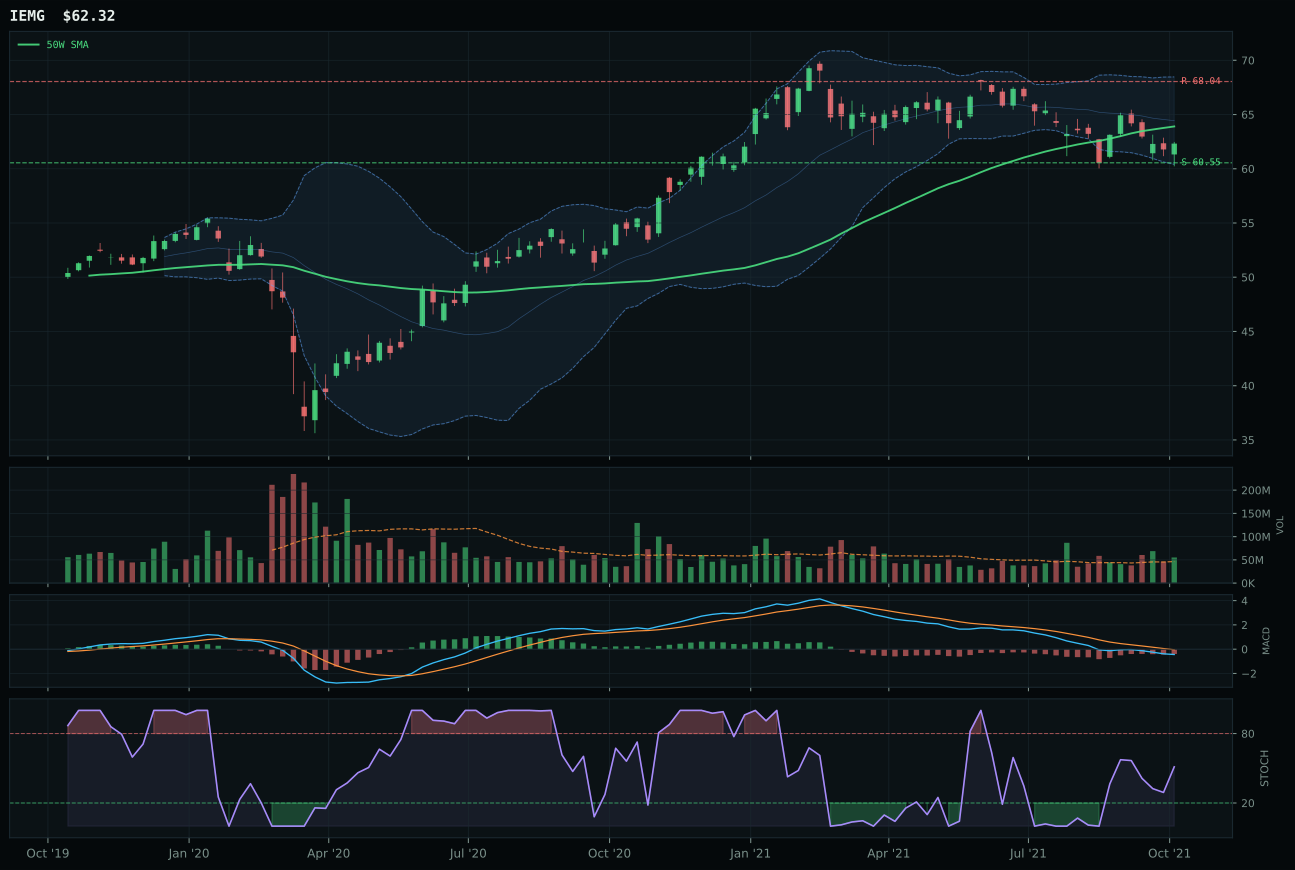
IEMG has a pullback into support profile with -5.1% 13-week relative strength versus SPY.
A failed hold above support would weaken the setup.
Actionable but governed by invalidation levels.
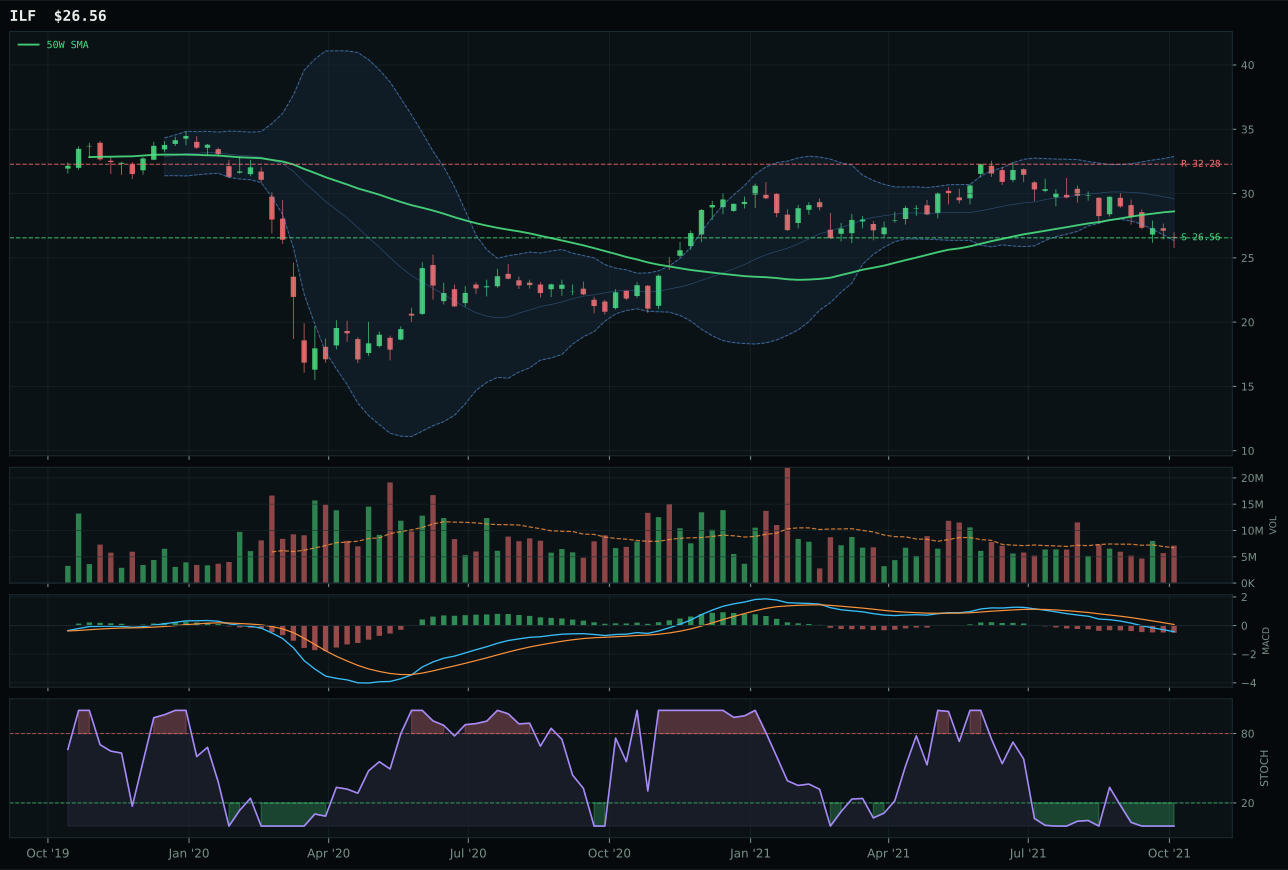
ILF has a pullback into support profile with -12.9% 13-week relative strength versus SPY.
Extension and support failure are the main tactical risks.
Tracked, but not top-2 eligible because: structurally broken.
INDA won Emerging Markets with 10.6% relative strength versus SPY and 15.7% category-relative strength—genuine outperformance—despite both representing late-stage momentum (11.1% 13W return, near 52W high). The win over IEMG is structural: INDA's 83.6 structure score beats IEMG's 70.1 because INDA's vertical extension is cleaner (83.3 cleanliness) and more compressed (89.0), while IEMG is in a messier pullback into support at 60.55. INDA's MACD is bullish but flattening—a sign of momentum peaking—while IEMG's is bearish but improving, yet the category-relative strength gap of 15.7% confirms INDA is the money flow winner. Volume is neutral for INDA (1.03x average) versus above-average for IEMG, suggesting INDA's move has structural conviction while IEMG's strength is forced and temporary.
Emerging Markets receives 0% allocation this week, excluded as a rank-9 or rank-10 category with a final score of just 15.2—the portfolio's third-weakest theme. The category macro fit is 25.0, devastated by dollar pressure at -14 and credit stress at -10, with broad market bear at -9 creating a triple negative that overwhelms any technical positives. INDA's 11.1% 13W return looks impressive until the macro context clarifies it: a strong dollar regime suppresses EM returns, credit stress tightens EM funding, and broad market bear behavior means carry trades are being unwound. The technical evidence is there (representative technical score 73.2), but it is noise against macro headwinds. Even INDA's 100.0 momentum score and 15.7% category-relative strength cannot overcome the fact that EM as a region is structurally disadvantaged when the dollar is rising and risk appetite is contracting. For Emerging Markets to return to allocation, the portfolio would need either a sharp dollar weakness signal, a credit stress relief flash (Fed pivot, spread compression), or a 20+ point swing in macro fit—conditions that require regime change, not just INDA hitting new highs.