
2021-10-01
Informational purposes only. The content in this report, including allocations, analysis, and commentary, is provided solely for informational and educational purposes. It does not constitute financial advice, investment advice, trading advice, or any other type of advice. Past performance does not guarantee future results. Always conduct your own research and consult a qualified financial professional before making investment decisions.
Weekly Allocation
| Ticker | Category | Weight | Role |
|---|---|---|---|
| FSOL | 50% | Overlay | |
| URNM | Nuclear Energy | 10% | Top-2 (10%) |
| FCG | Traditional Energy | 10% | Top-2 (10%) |
| WEAT | Agriculture & Livestock | 5% | Tier-2 (5%) |
| COPX | Industrial Metals | 5% | Tier-2 (5%) |
| INDA | Emerging Markets | 5% | Tier-2 (5%) |
| XLK | Technology | 5% | Tier-2 (5%) |
| ITA | Defense & Aerospace | 5% | Tier-2 (5%) |
| SMH | AI | 5% | Tier-2 (5%) |
Trade Instructions — Monday Open
Sell the tranche from 2021-09-03 (completing its 4-week hold). Buy the new tranche. Instructions show net portfolio changes — same-asset positions cancel, weight changes show the delta.
| Action | Ticker | Instruction |
|---|---|---|
| SELL | XLU | Sell 67% of XLU position (reduce 3.75% → 1.25%) |
| SELL | CIBR | Sell 33% of CIBR position (reduce 7.50% → 5.00%) |
| SELL | MOO | Sell 25% of MOO position (reduce 5.00% → 3.75%) |
| SELL | GLD | Sell 50% of GLD position (reduce 2.50% → 1.25%) |
| SELL | BOTZ | Sell 17% of BOTZ position (reduce 7.50% → 6.25%) |
| BUY | URNM | Buy URNM — 14.29% of freed cash (adds 1.25% to portfolio) |
| BUY | INDA | Buy INDA — 14.29% of freed cash (adds 1.25% to portfolio) |
| BUY | XLK | Buy XLK — 14.29% of freed cash (adds 1.25% to portfolio) |
| BUY | FCG | Buy FCG — 28.57% of freed cash (adds 2.50% to portfolio) |
| BUY | WEAT | Buy WEAT — 14.29% of freed cash (adds 1.25% to portfolio) |
| BUY | SMH | Buy SMH — 14.29% of freed cash (adds 1.25% to portfolio) |
Current Portfolio After Trade
Combined holdings across all 4 active tranches. Each tranche is 25% of the portfolio.
| Ticker | % of Portfolio | Weight Bar |
|---|---|---|
| FSOL | 50.00% | |
| BOTZ | 6.25% | |
| COPX | 6.25% | |
| URNM | 6.25% | |
| CIBR | 5.00% | |
| MOO | 3.75% | |
| ITA | 3.75% | |
| INDA | 3.75% | |
| XLK | 3.75% | |
| IGF | 2.50% | |
| FCG | 2.50% | |
| XLU | 1.25% | |
| GLD | 1.25% | |
| SLV | 1.25% | |
| WEAT | 1.25% | |
| SMH | 1.25% |
Macro Regime — Goldilocks
Macro Evidence Charts
Market-implied signals behind the macro regime scores. Each ratio compares two assets; the direction and slope of the ratio is what the macro engine reads.
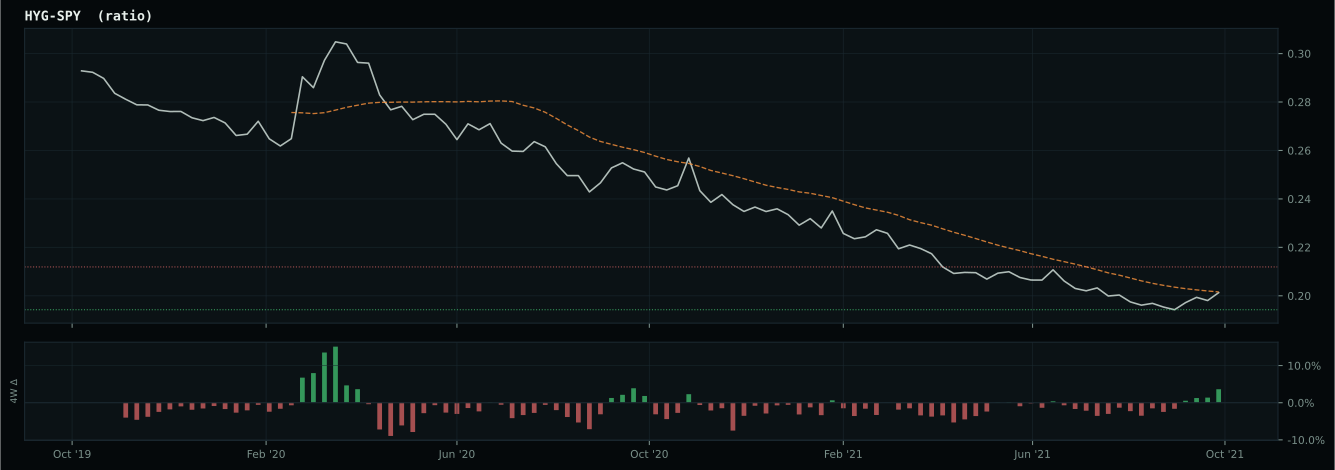
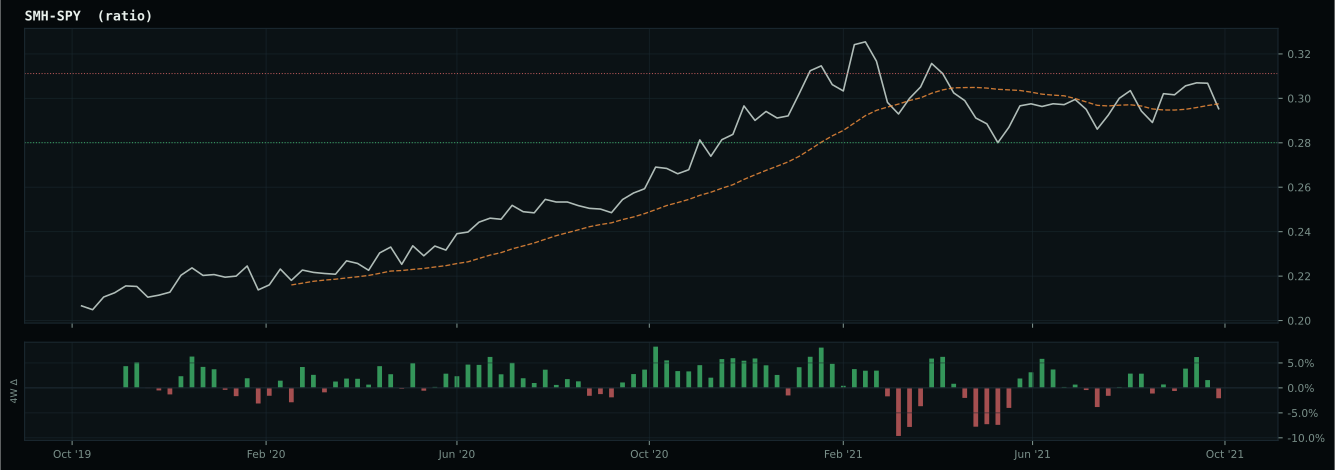
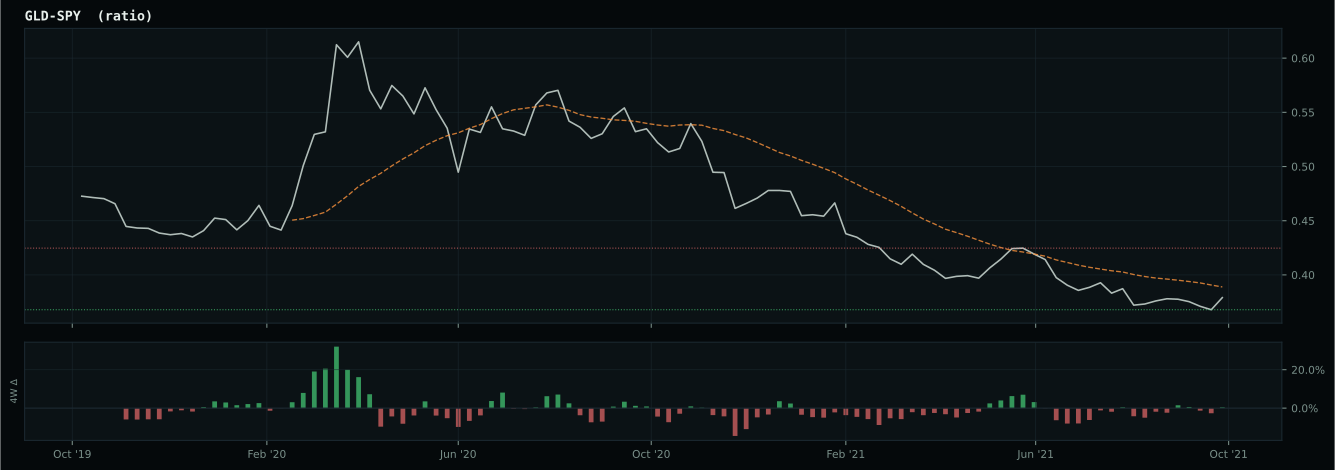
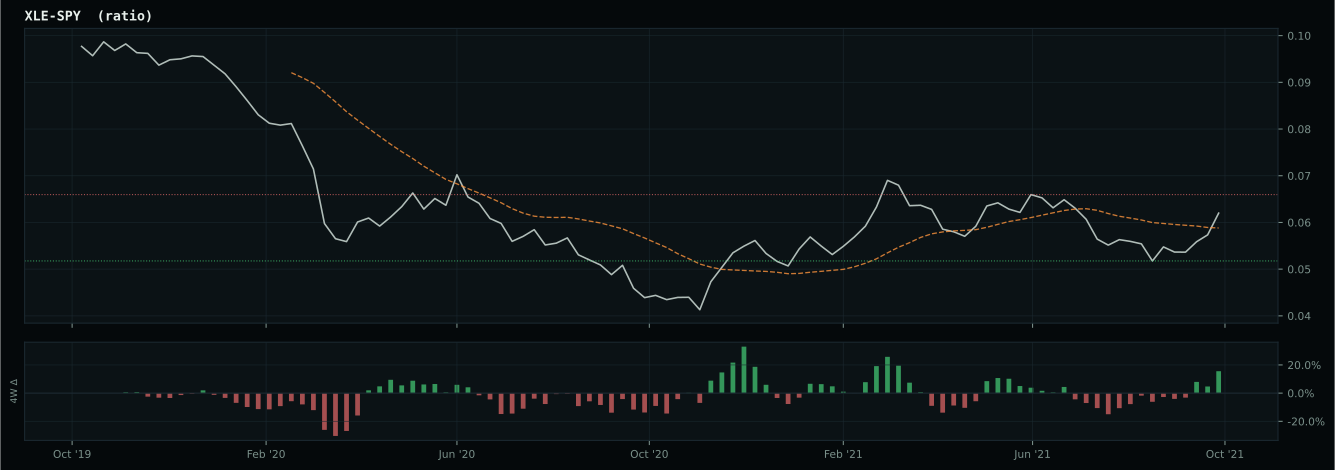
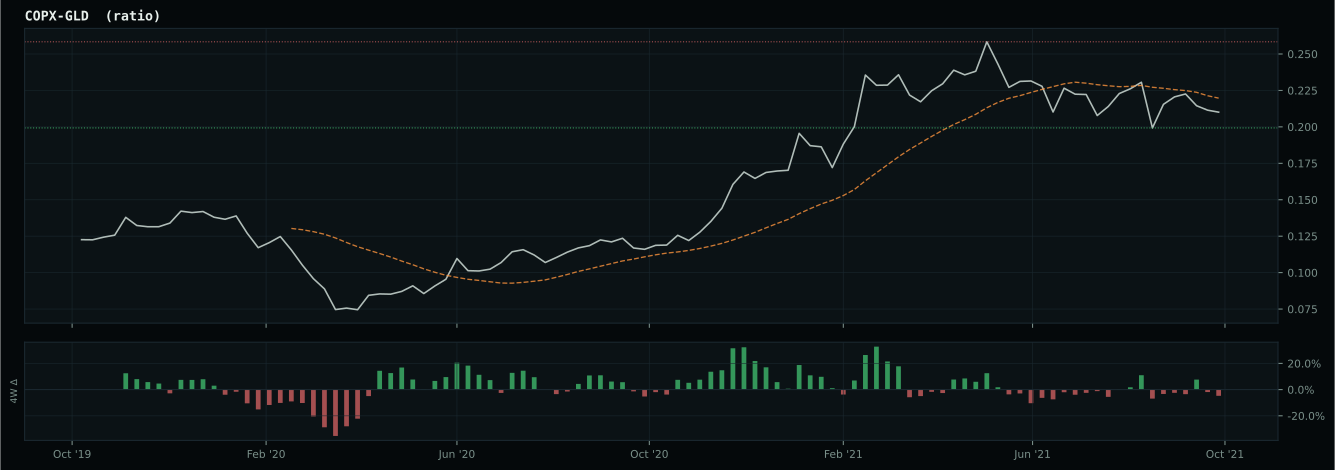
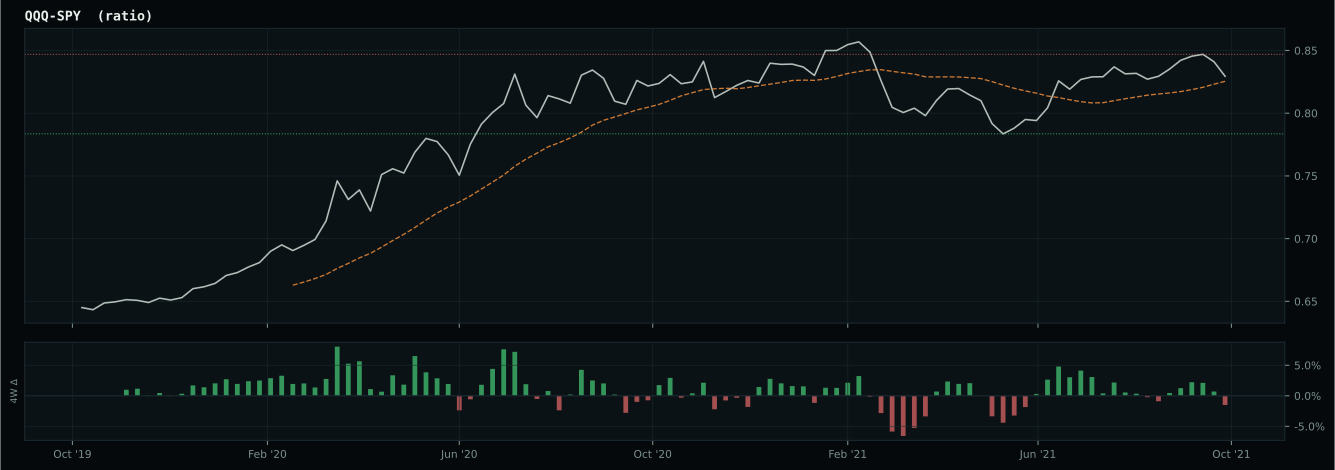
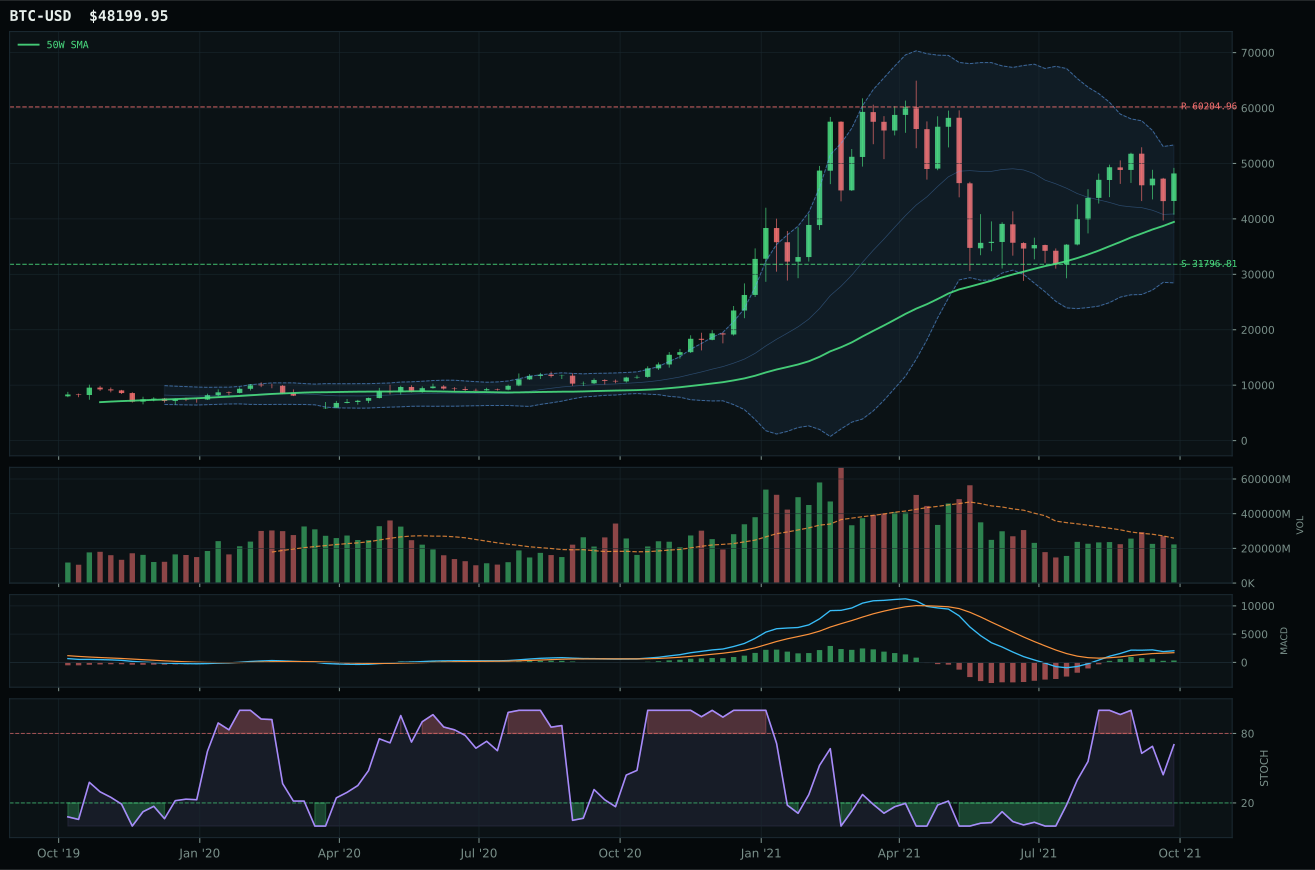
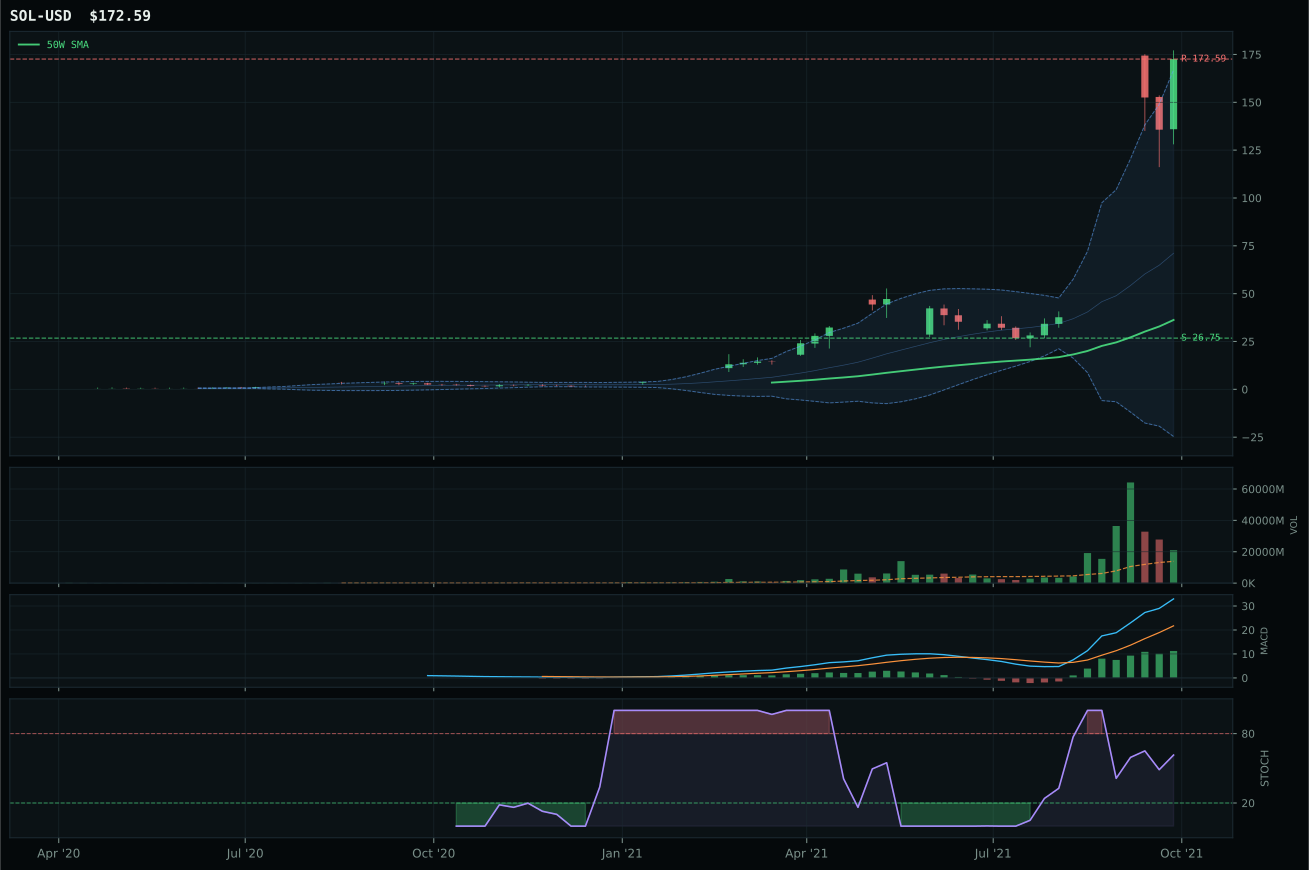
Crypto Regime — AltSeason
ValueBTC not armed: BTC has not made the first post-breakdown touch of the 200W buy zone after losing the 50W
TrendBTC confirmed: 2 consecutive closes above rising/flat 50W SMA
all available AltSeason conditions pass; missing optional confirmations skipped
Category Rankings
| Rank | Category | Winner | Score | Alloc | 4W Ret | Peers (4W) |
|---|---|---|---|---|---|---|
| 1 | Nuclear Energy | URNM | 59.6 | 20% | +9.01% | URA +9.7% · NLR +4.1% |
| 2 | Traditional Energy | FCG | 57.1 | 20% | +5.61% | XOP +7.2% · XLE +6.7% |
| 3 | Agriculture & Livestock | WEAT | 55.9 | 10% | +3.12% | MOO +3.9% · VEGI +2.8% |
| 4 | Industrial Metals | COPX | 52.5 | 10% | +6.96% | REMX +14.6% · PICK +4.6% |
| 5 | Emerging Markets | INDA | 48.2 | 10% | -0.16% | IEMG +1.8% · ILF -5.4% |
| 6 | Technology | XLK | 47.3 | 10% | +7.19% | CIBR +10.0% · IGV +9.6% |
| 7 | Defense & Aerospace | ITA | 44.4 | 10% | -1.26% | XAR -1.3% · ROKT +0.6% |
| 8 | AI | SMH | 43.3 | 10% | +7.59% | BOTZ +6.8% · AIQ +5.3% |
| 9 | Utilities & Infrastructure | IGF | 39.4 | 0% | +3.41% | PAVE +7.5% · XLU +4.8% |
| 10 | Precious Metals | GDX | 33.6 | 0% | +8.69% | GLD +2.3% · SLV +7.1% |
Nuclear Energy — URNM
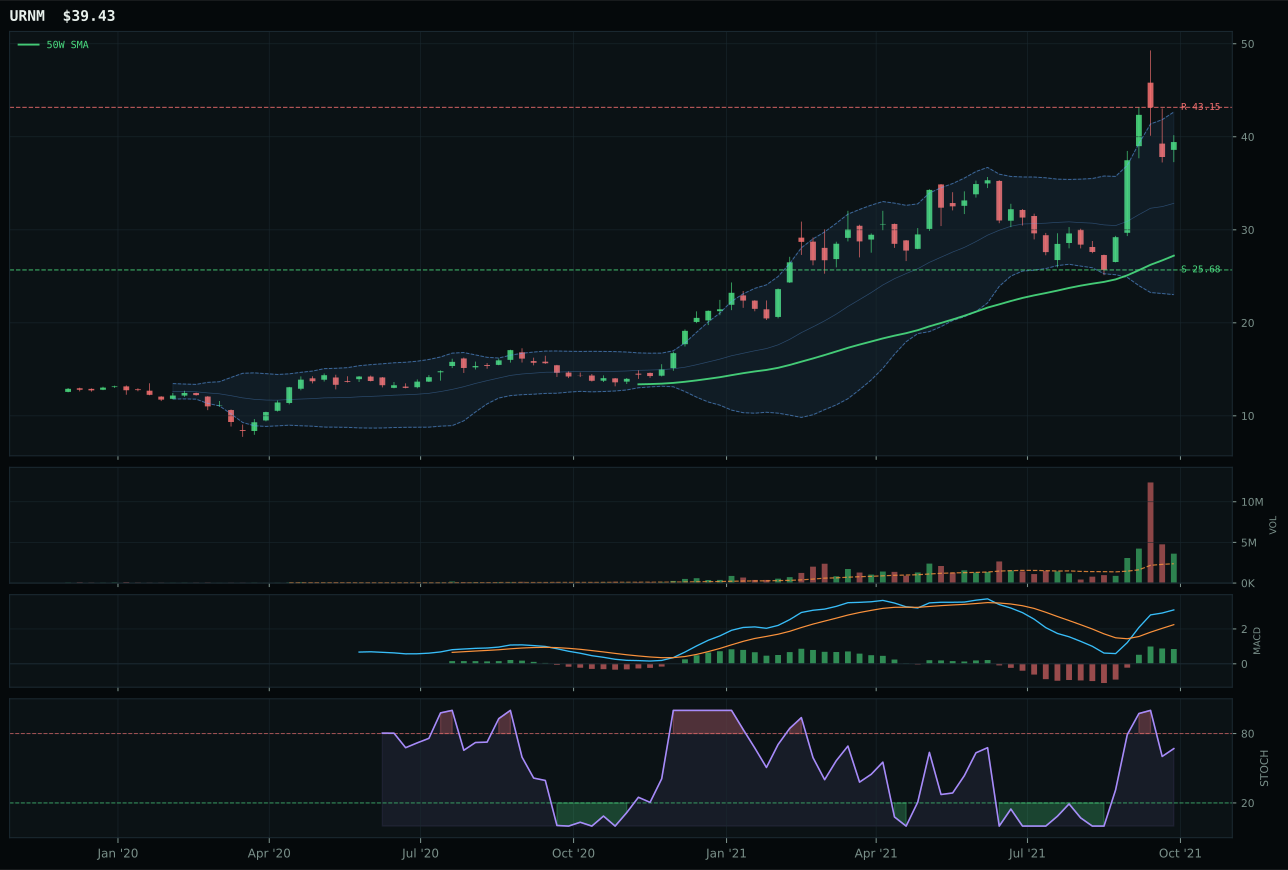
URNM has a vertical extension profile with 25.8% 13-week relative strength versus SPY.
A failed hold above support would weaken the setup.
Actionable but governed by invalidation levels.
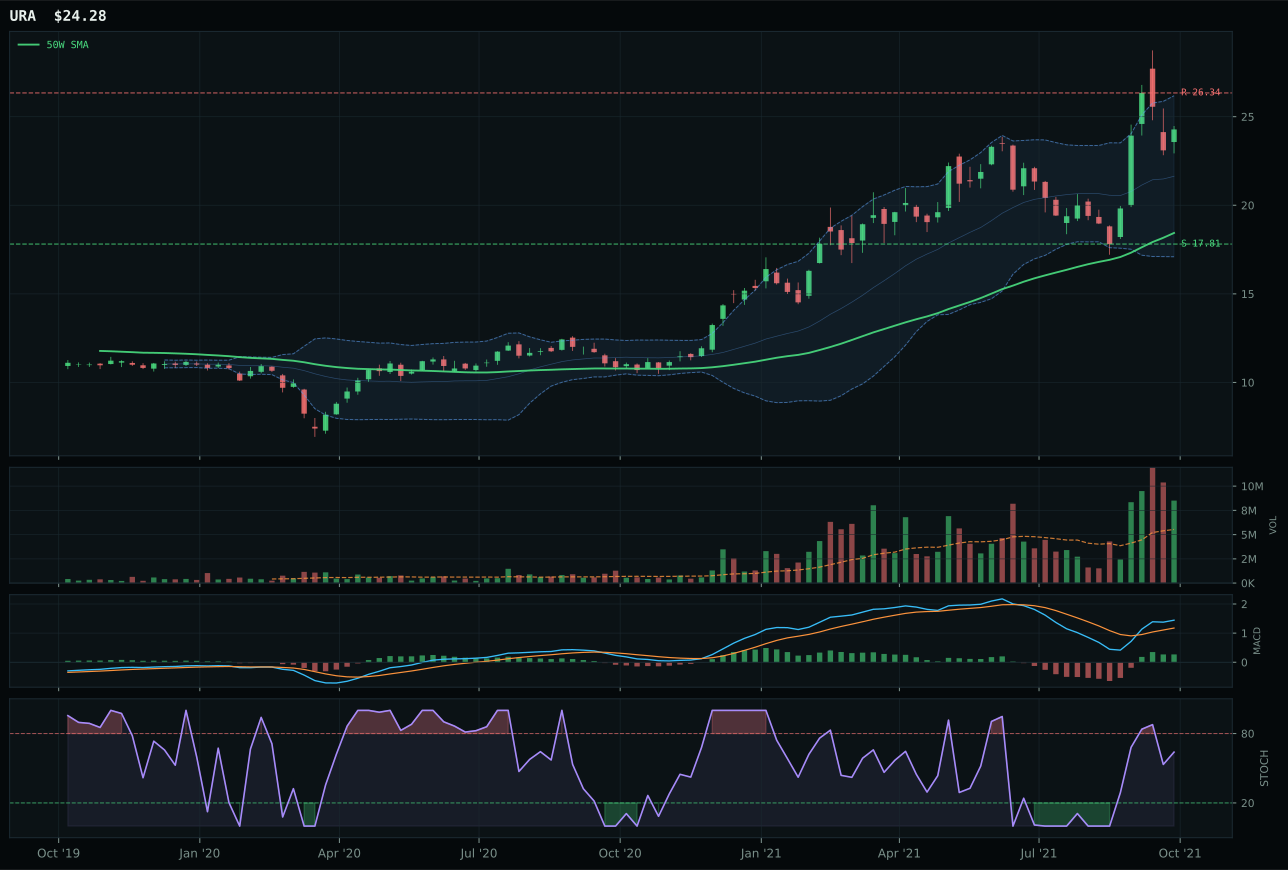
URA has a vertical extension profile with 13.7% 13-week relative strength versus SPY.
A failed hold above support would weaken the setup.
Actionable but governed by invalidation levels.
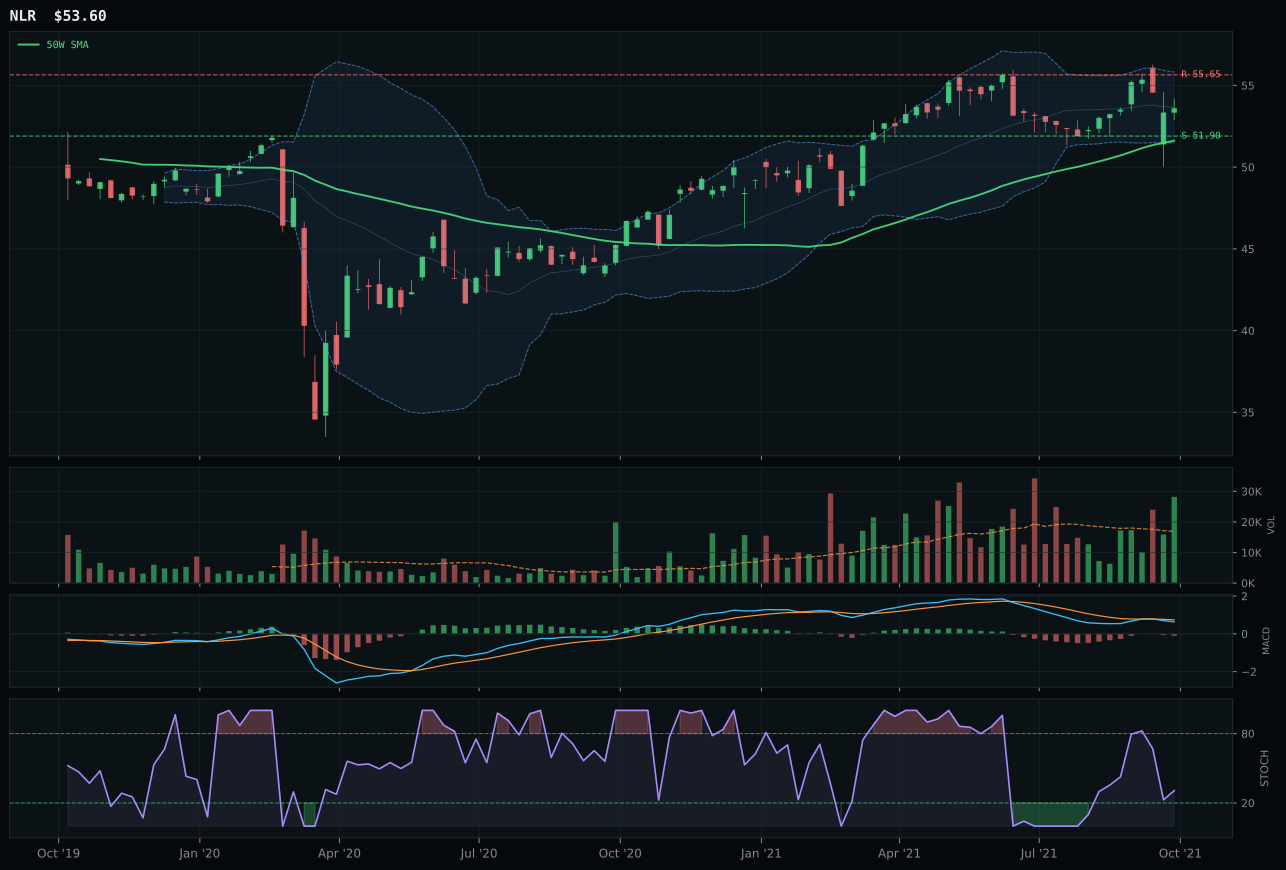
NLR has a pullback into support profile with 0.7% 13-week relative strength versus SPY.
A failed hold above support would weaken the setup.
Tracked, but not top-2 eligible because: .
URNM seized the Nuclear Energy crown with a dominant 92.4/100 technical evidence score, perfect momentum confirmation (100/100), and exceptional volume-price confirmation (87.3) despite sitting 44.9% above its 50-week moving average—a result that proves vertical extensions are bullish, not bearish, when accumulation is real. The chart shows MACD bullish and improving, stochastic RSI falling through neutral from elevated levels, and accumulation/confirmation volume at 1.52x the 20-week average, creating the rare setup where extension plus overbought conditions signal continued institutional buying rather than topping risk. URA's loss came despite a perfect 100/100 trend score because URNM delivered superior structure cleanliness (73.9 vs 70.6), better category-relative strength (12.1% vs 0.0%), and crucially, volume-price confirmation showing real sponsors versus bid-ask tightening. The 13.8% 13-week return differential (URNM at 25.9%, URA at 13.8%) proves this isn't a perception gap; URNM is materially outperforming because capital is choosing miner leverage over direct uranium exposure.
Nuclear Energy earns 10% as the second top-ranked category at 59.6, a position earned through 92.4 technical evidence and exceptional volume-price confirmation despite a modest 52.0 macro fit. Real-asset sponsorship (+7) and extended credit stress (-5) create a neutral macro environment where the category's 56.0 technical composite becomes the primary driver. URNM's selection reflects a rare convergence: strong trend (80.0), clean structure (73.9), improving oscillators (MACD bullish and improving, stochastic RSI falling/neutral), and accumulation/confirmation volume all align without contradiction. The 10% allocation size is proportional to the category's rank and macro neutrality rather than maximum conviction; URNM carries material downside risk if price fails to hold 25.68 support or if credit conditions deteriorate (another -5 credit stress points would immediately undermine category rank). This is a tactical allocation honoring genuine momentum and volume sponsorship, not a strategic bet on uranium supply scarcity becoming a permanent portfolio theme. Sustained allocation requires URNM to hold above its 50W and for category-relative strength to persist.
Traditional Energy — FCG
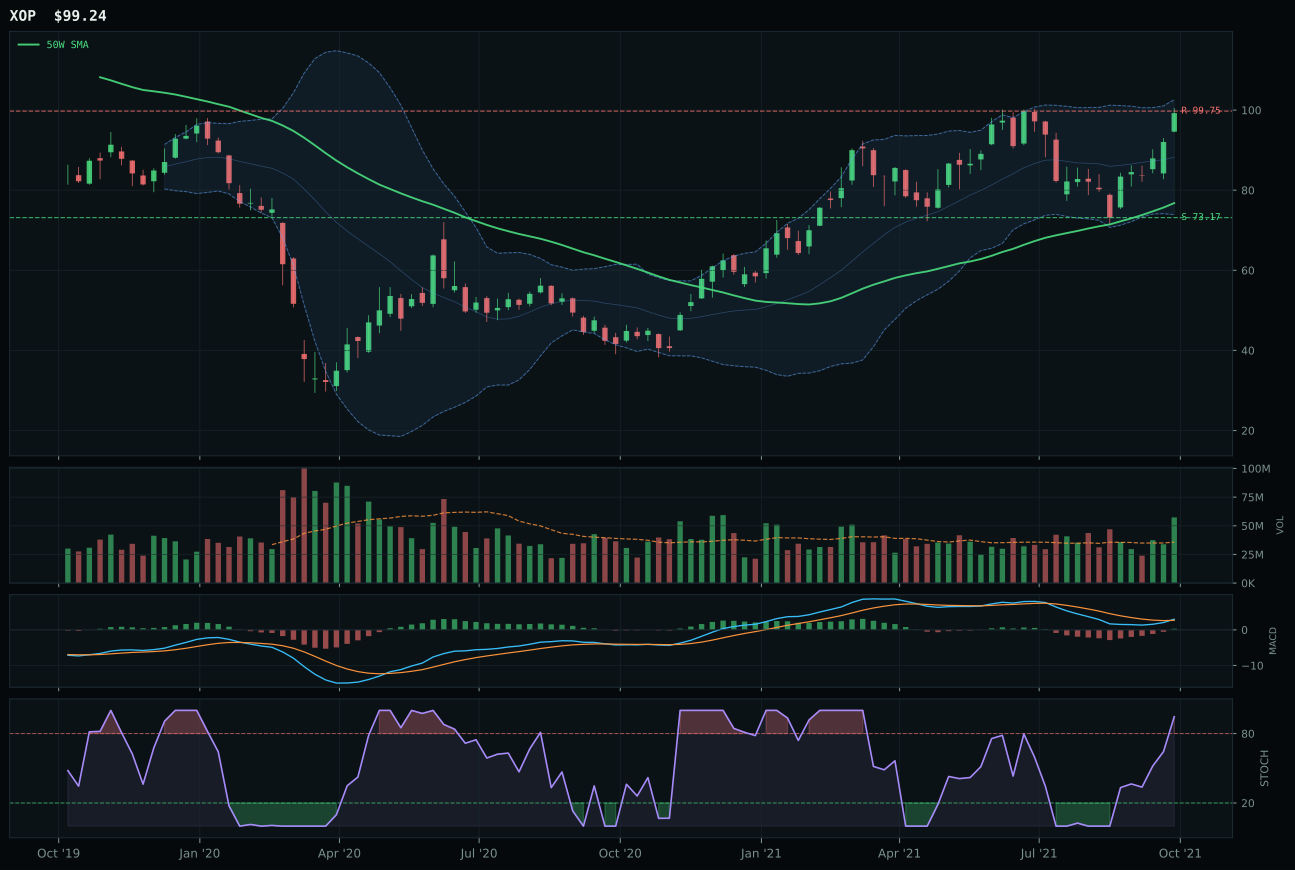
XOP has a vertical extension profile with 2.0% 13-week relative strength versus SPY.
A failed hold above support would weaken the setup.
Actionable but governed by invalidation levels.
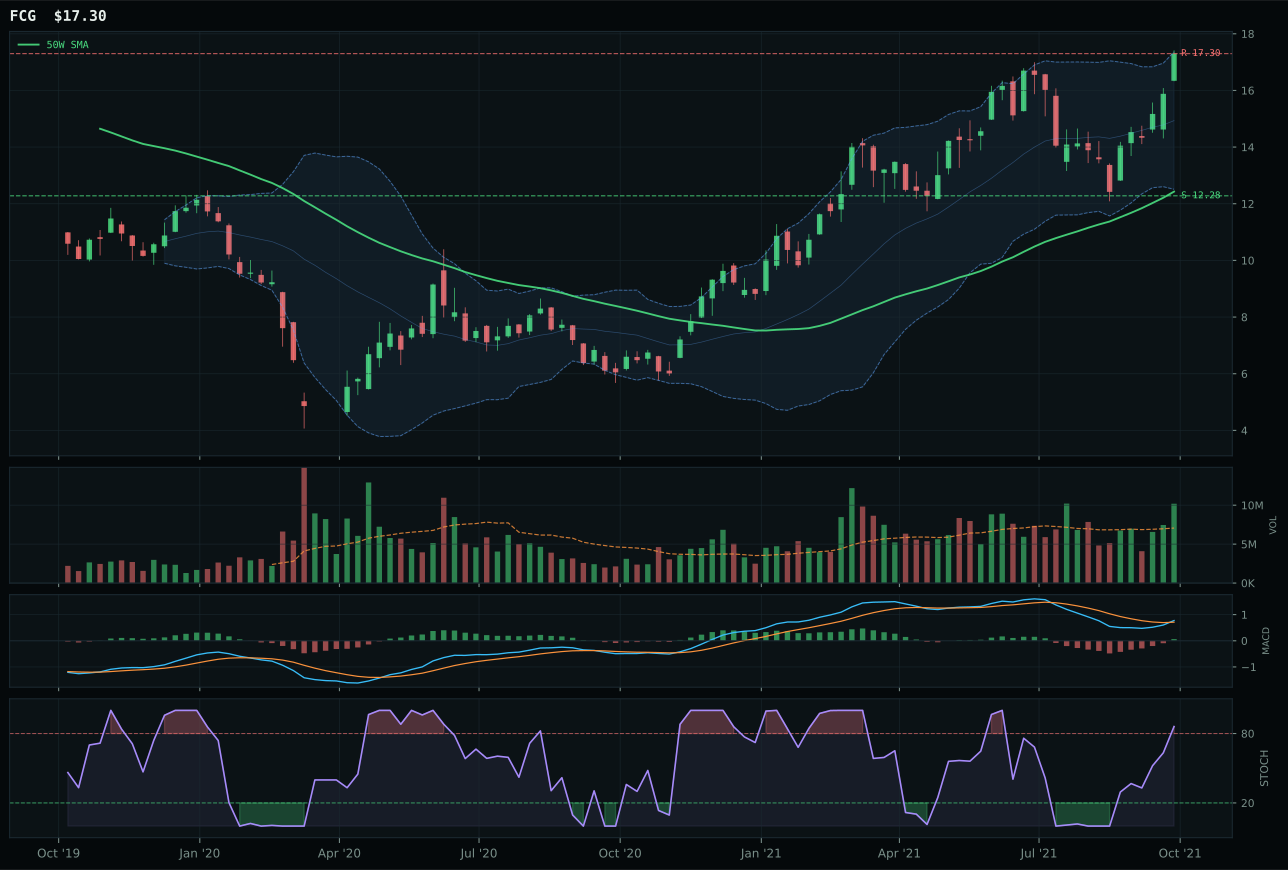
FCG has a vertical extension profile with 4.4% 13-week relative strength versus SPY.
A failed hold above support would weaken the setup.
Actionable but governed by invalidation levels.
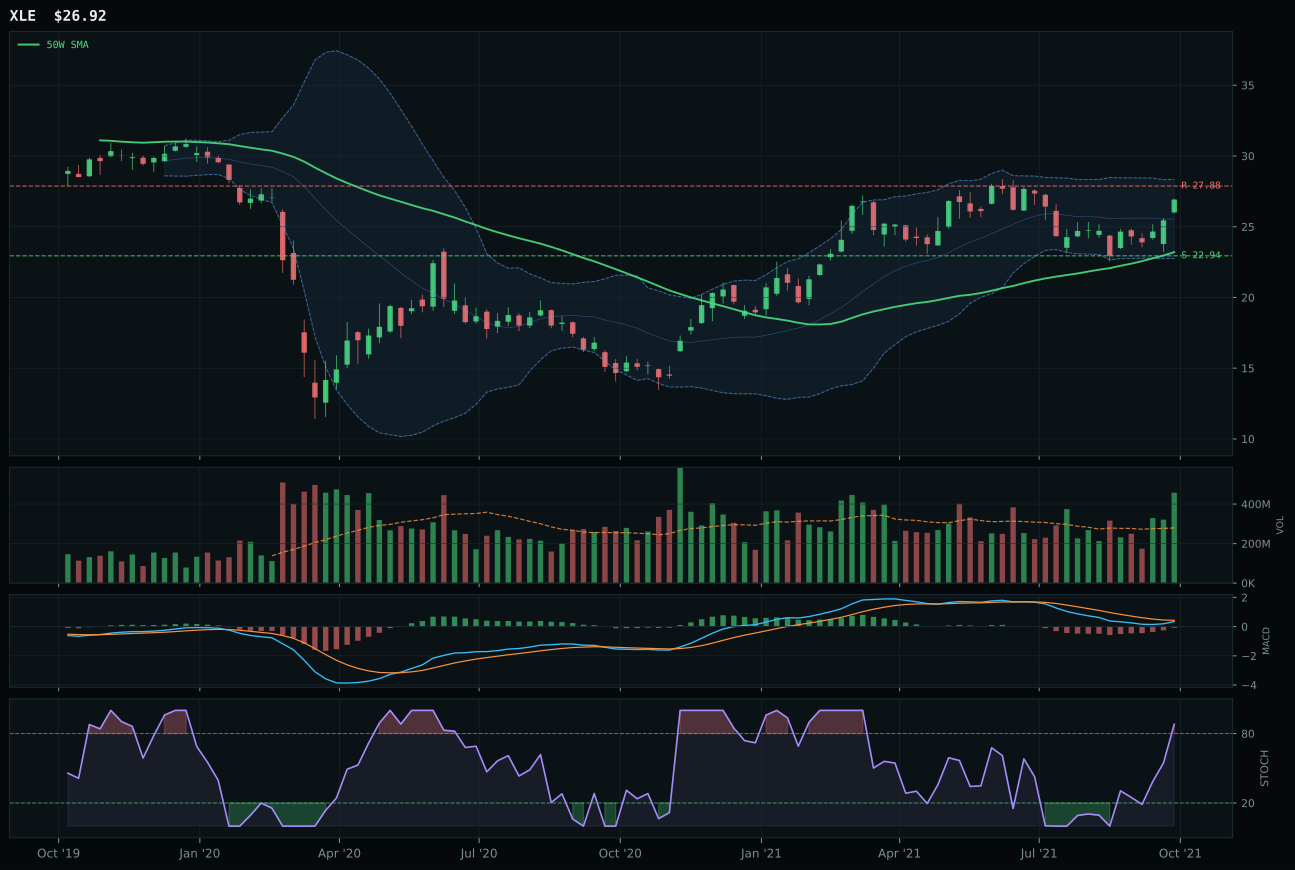
XLE has a vertical extension profile with -1.7% 13-week relative strength versus SPY.
A failed hold above support would weaken the setup.
Actionable but governed by invalidation levels.
FCG won Traditional Energy and earned 10% top-2 allocation on the strength of a 96.6% trend score and perfect 100/100 momentum confirmation, delivering the rare instance where both trend and momentum align. The chart is extended at 39.2% above the 50-week moving average with MACD bullish and improving and stochastic RSI overbought at 0.86—the exact inverse of mean-reversion setups and precisely where momentum-following capital accumulates without hesitation. Volume at 1.44x the 20-week average is above-average participation but not panic accumulation, suggesting the move is being sponsored by new demand rather than short-covering. XOP's runner-up finish (composite 56 vs FCG's 59) conceals a critical edge: FCG's 4.4% relative strength to SPY versus XOP's 2.0% means institutional allocators are choosing natural gas exposure (FCG) over oil exploration beta (XOP), signaling confidence in supply-driven scarcity narratives over cyclical recovery.
Traditional Energy earns 10% as one of two top-ranked categories at 57.1, a positioning that reflects strong macro support from real-asset sponsorship (+7) and commodity breadth positive (+7) despite disinflation pressure (-10) and credit stress (-7) acting as headwinds. The category's 40.0 macro fit is the lowest among the top-two allocations, yet the 3/2/1 weighted basket construction (XOP 65.3, FCG 63.7, XLE 61.0) shows disciplined depth—the top three are tightly clustered, meaning energy strength is broad rather than concentrated in a single name. FCG's selection as representative honors its superior category-relative strength and momentum persistence, but the 10% allocation size reflects tactical timing caution: the category is extended at the 52W high zone, risk/reward is compressed at 40.5, and the setup depends on sustained accumulation through resistance rather than a confirmed breakout. The allocation will hold and prove profitable only if oil prices remain bid from geopolitical risk or demand surprises; a macro shift toward EM growth disappointment or Fed tightening would force a rapid downgrade.
Agriculture & Livestock — WEAT
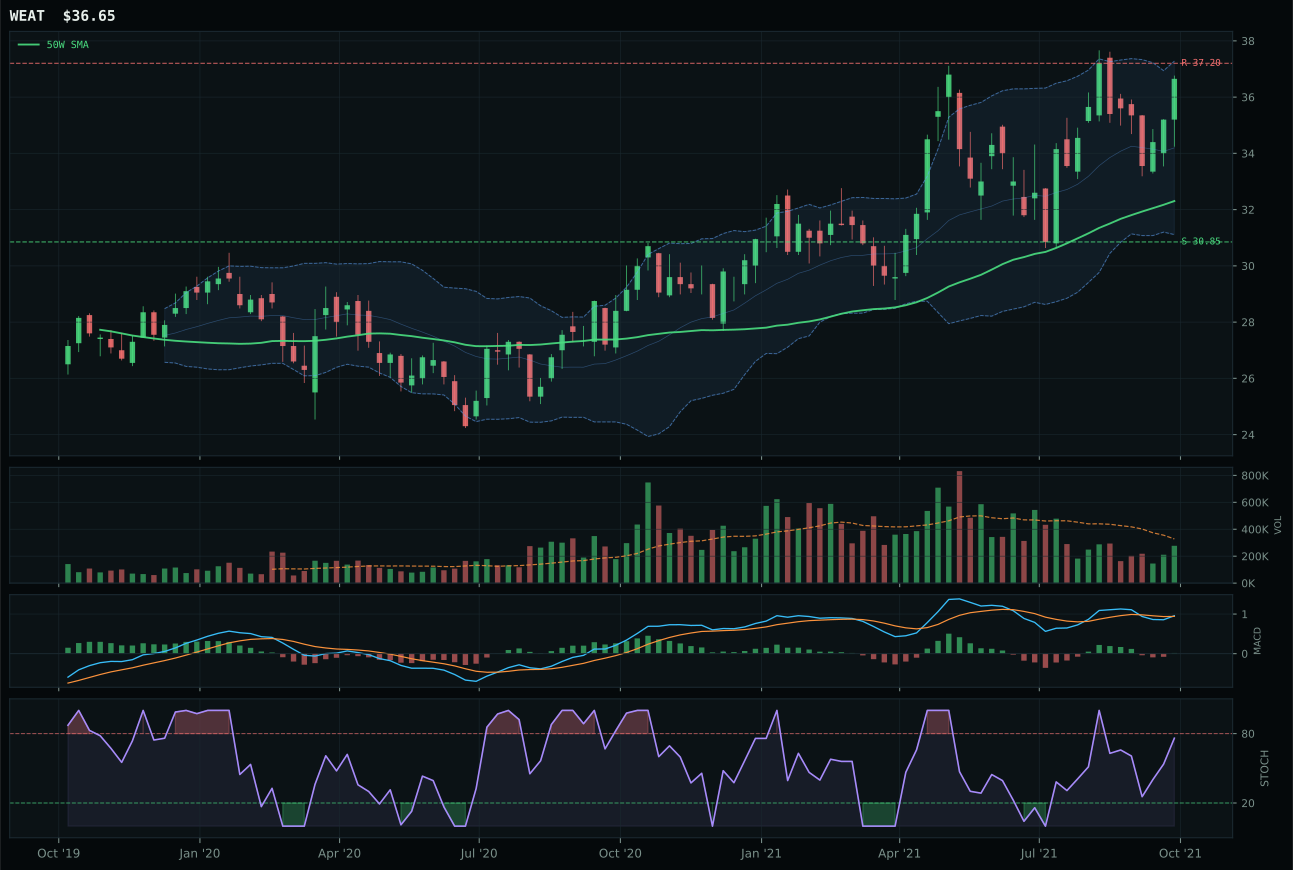
WEAT has a neutral structure profile with 12.3% 13-week relative strength versus SPY.
A failed hold above support would weaken the setup.
Actionable but governed by invalidation levels.
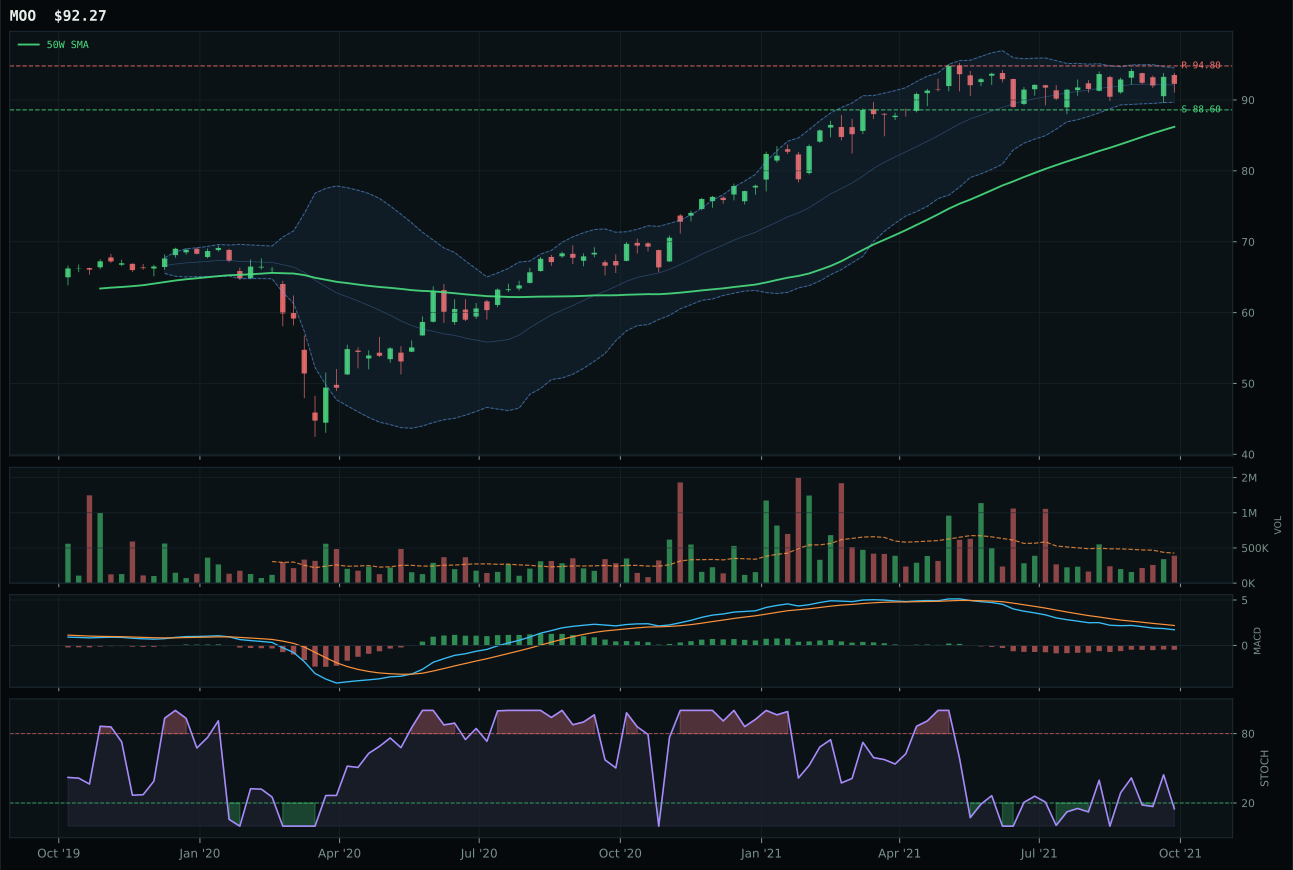
MOO has a pullback into support profile with 0.0% 13-week relative strength versus SPY.
A failed hold above support would weaken the setup.
Actionable but governed by invalidation levels.
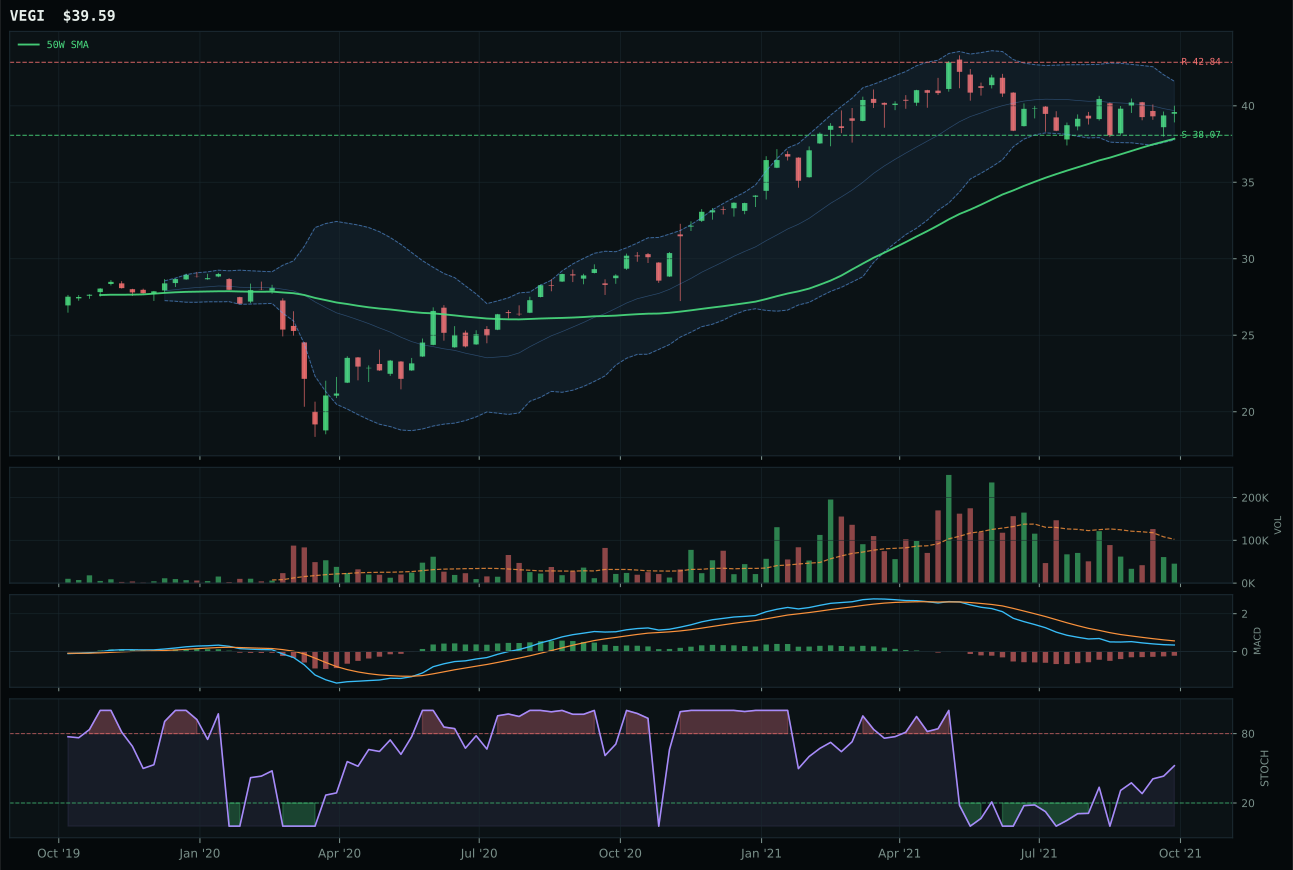
VEGI has a pullback into support profile with -0.8% 13-week relative strength versus SPY.
A failed hold above support would weaken the setup.
Tracked, but not top-2 eligible because: .
WEAT overwhelmed the agriculture category with perfect momentum scores (100/100) and pristine trend mechanics (price 12.3% ahead of SPY over 13 weeks, up 12.4% in the same period, above both 50W and 200W, positive slope), making it the rare instance where a category winner also delivers the purest technical setup. The 13.4% extension above the 50-week moving average normally signals extended entry risk, yet WEAT's bullish but flattening MACD combined with rising stochastic RSI mid-zone suggests the move has gas left rather than running on fumes. Volume at 0.84x the 20-week average confirms the move is organic—not panicked accumulation or desperate short-covering—with clean structure (74.8) and category-relative strength at 12.3% meaning WEAT is the only ag play actually outperforming both its basket and the market. MOO and VEGI both sit on pullback-into-support setups with backward-looking momentum or oversold stochastic readings; WEAT is the only name that's *actually bullish* rather than bullish-because-oversold.
Agriculture & Livestock earns 5% allocation despite a strong 55.9 category score that would normally justify 10%, a positioning that reflects real-asset sponsorship (+8) and commodity breadth positive (+5) offsetting disinflation pressure (-8) in a Goldilocks regime. The category's technical setup is clean—WEAT at perfect trend and momentum—yet extended 13.4% from its 50W, meaning risk/reward has compressed from capture to timing. Real asset demand is genuine (metals scarcity is active, commodity breadth is positive), but the allocation size reflects caution about extended entry points and the category's vulnerability to growth disappointment or Fed policy reversal. For WEAT and agriculture to advance to 10%, the category would need either a deeper pullback with sustained volume or macro confirmation that commodity inflation is becoming embedded in wage and pricing expectations. Until then, 5% honors the strength without overcommitting to extended valuations.
Industrial Metals — COPX
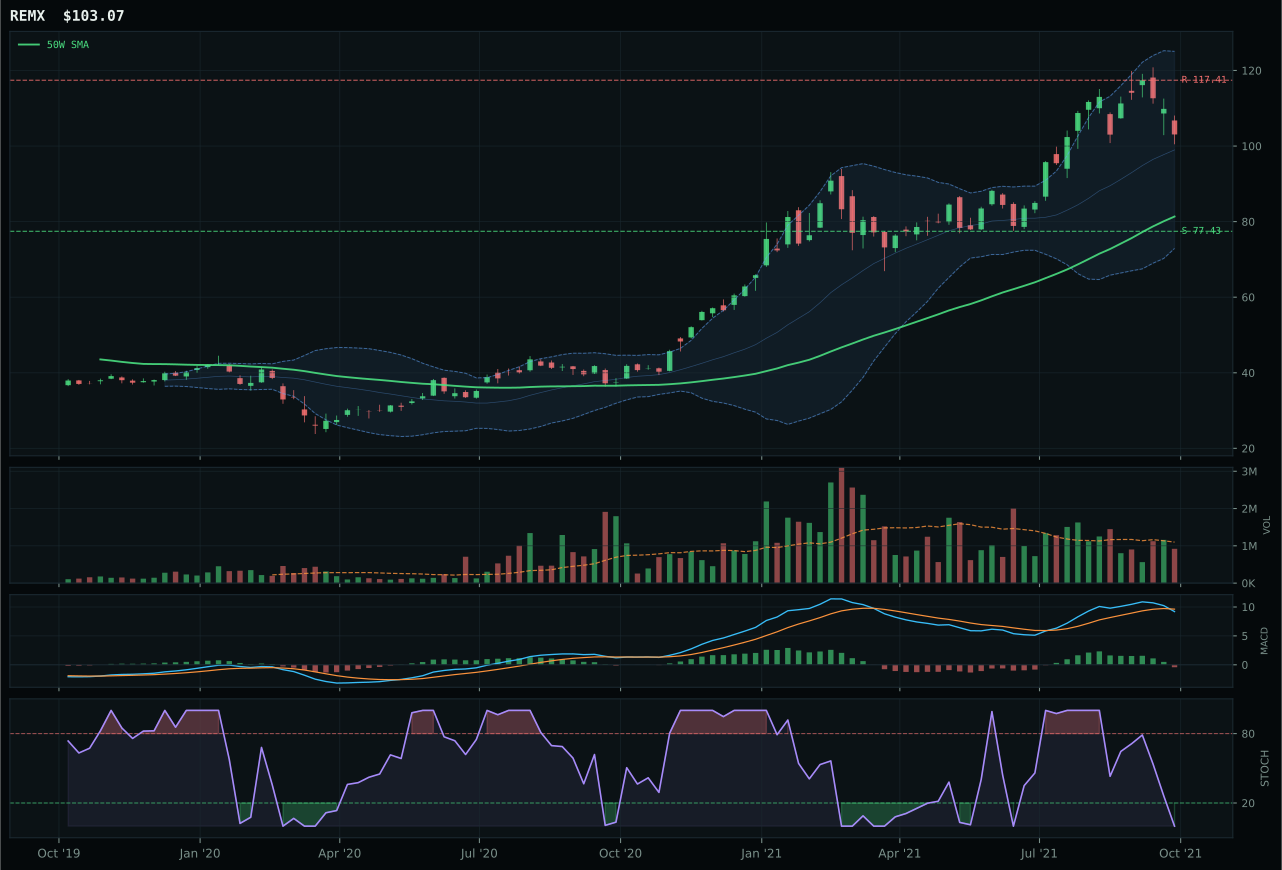
REMX has a vertical extension profile with 21.2% 13-week relative strength versus SPY.
A failed hold above support would weaken the setup.
Actionable but governed by invalidation levels.
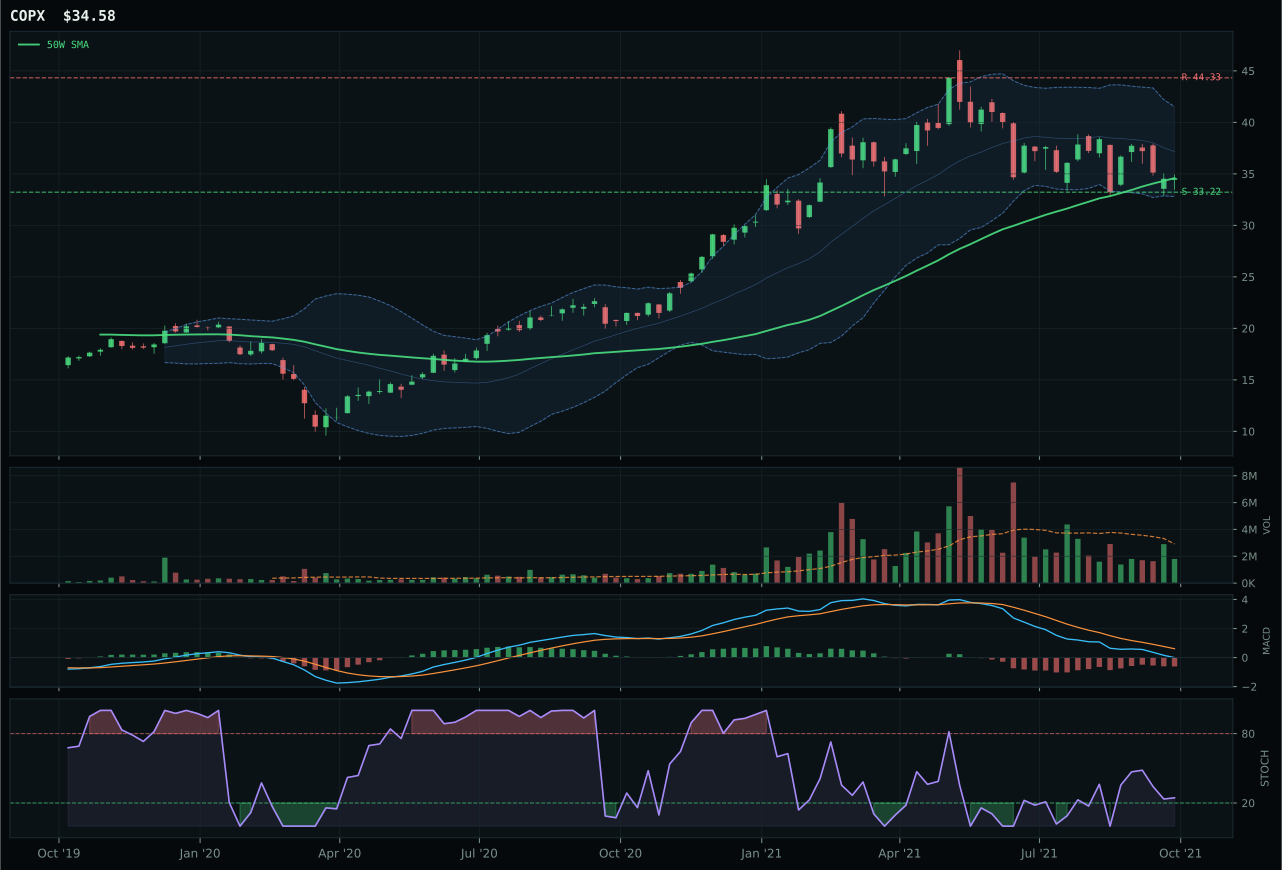
COPX has a pullback into support profile with -7.2% 13-week relative strength versus SPY.
A failed hold above support would weaken the setup.
Actionable but governed by invalidation levels.
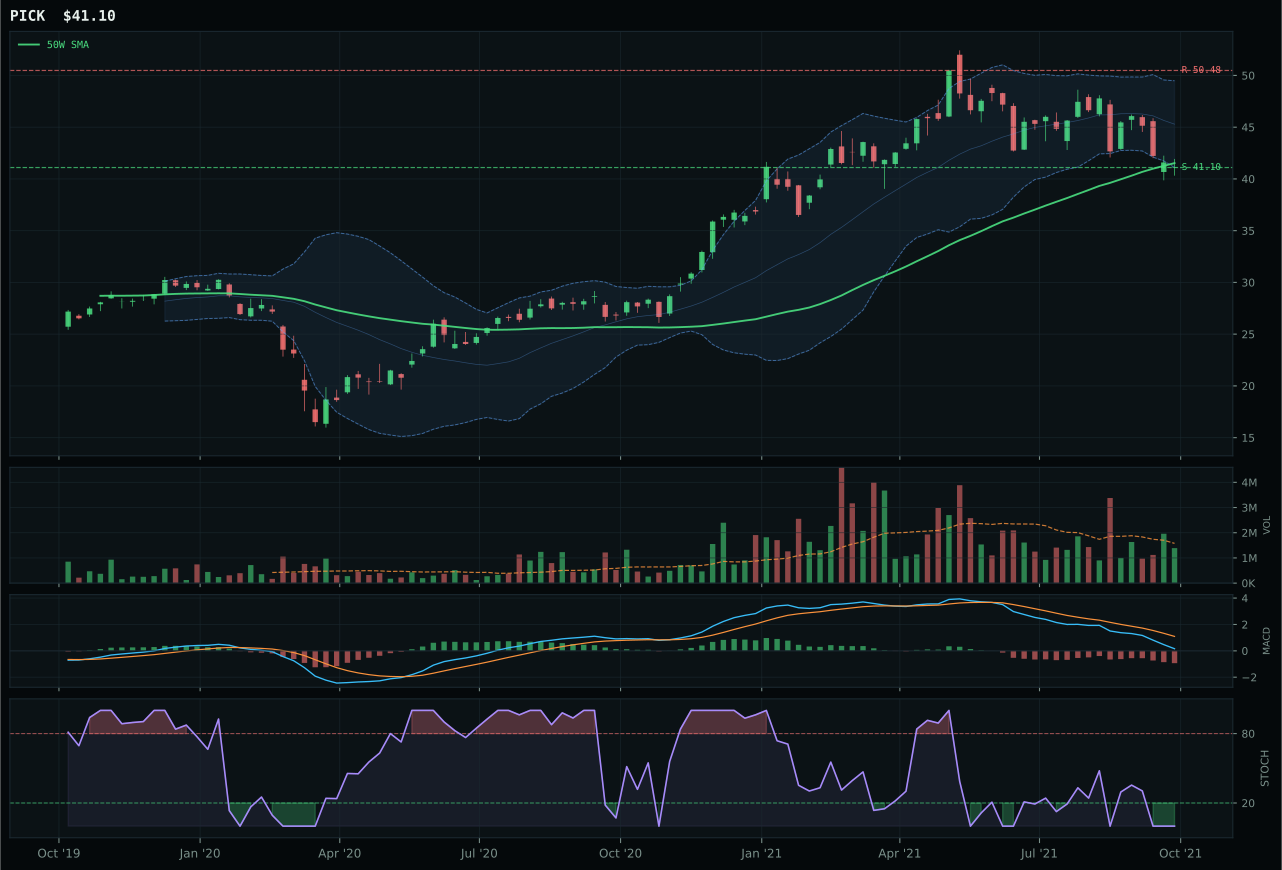
PICK has a pullback into support profile with -9.4% 13-week relative strength versus SPY.
A failed hold above support would weaken the setup.
Actionable but governed by invalidation levels.
COPX claimed Industrial Metals because it owns the most favorable timing profile (100/100) and risk-reward mechanics (98.0/100) despite ranking last in trend (56.2) and momentum (0), a result that captures the essence of mean-reversion opportunity in a category that's been left behind. COPX trades at the exact 50-week moving average with stochastic RSI falling through mid-zone and MACD bearish/weakening, the textbook setup for institutional accumulation without fear of chasing extended strength. Support sits at 33.22 with only 4.1% downside, while resistance at 44.33 offers 22% upside—the inverse of extended momentum setups and exactly what disciplined capital wants to see. REMX, by contrast, ripped 21.3% over 13 weeks and sits 26.7% above its 50-week moving average with oversold stochastic RSI; while its 100/100 momentum score looks impressive, the 37.0 risk-reward versus COPX's 98.0 tells the real story—REMX is entry risk, COPX is accumulation opportunity.
Industrial Metals earns 5% allocation despite a respectable 52.5 category score because the macro setup is strong but the technical entry is compromised by REMX's overextension. Metals scarcity (+14) and commodity breadth positive (+10) drive a 79.0 category-level macro fit, the highest among all ten, with real-asset sponsorship (+6) and Goldilocks regime support (+6) confirming structural demand. However, COPX's selection as the representative reflects risk-adjusted thinking: the winner sits at a pullback-into-support structure with exceptional timing (100.0) and risk/reward (98.0), yet zero momentum confirmation because the category is rotating leadership away from extended names toward patient entries. To earn 10%, Industrial Metals would need either COPX to hold support at 33.22 and print higher lows, or REMX to consolidate and print a 13W bullish divergence suggesting fresh money is accumulating after the shakeout. For now, 5% honors the scarcity narrative while respecting technical caution.
Emerging Markets — INDA
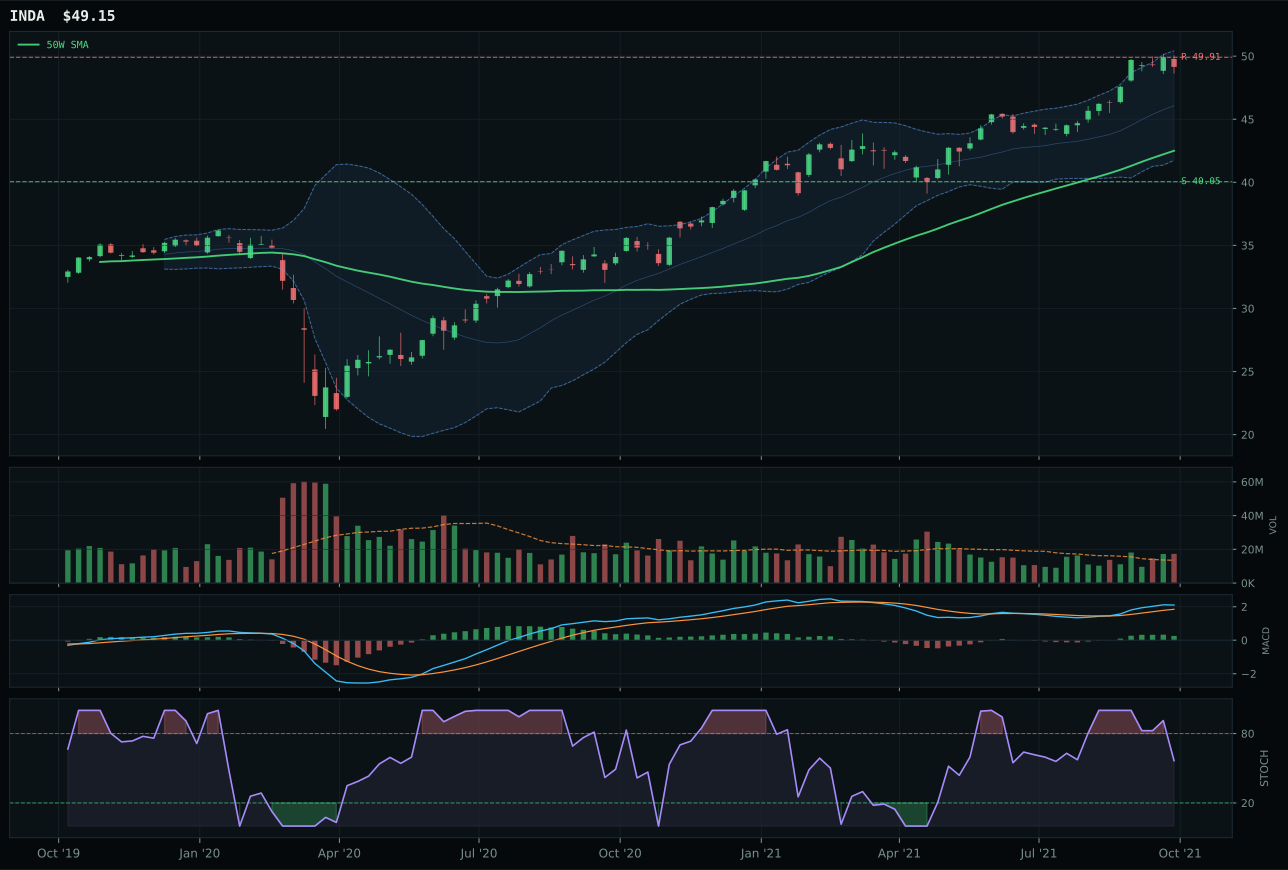
INDA has a vertical extension profile with 10.6% 13-week relative strength versus SPY.
A failed hold above support would weaken the setup.
Actionable but governed by invalidation levels.
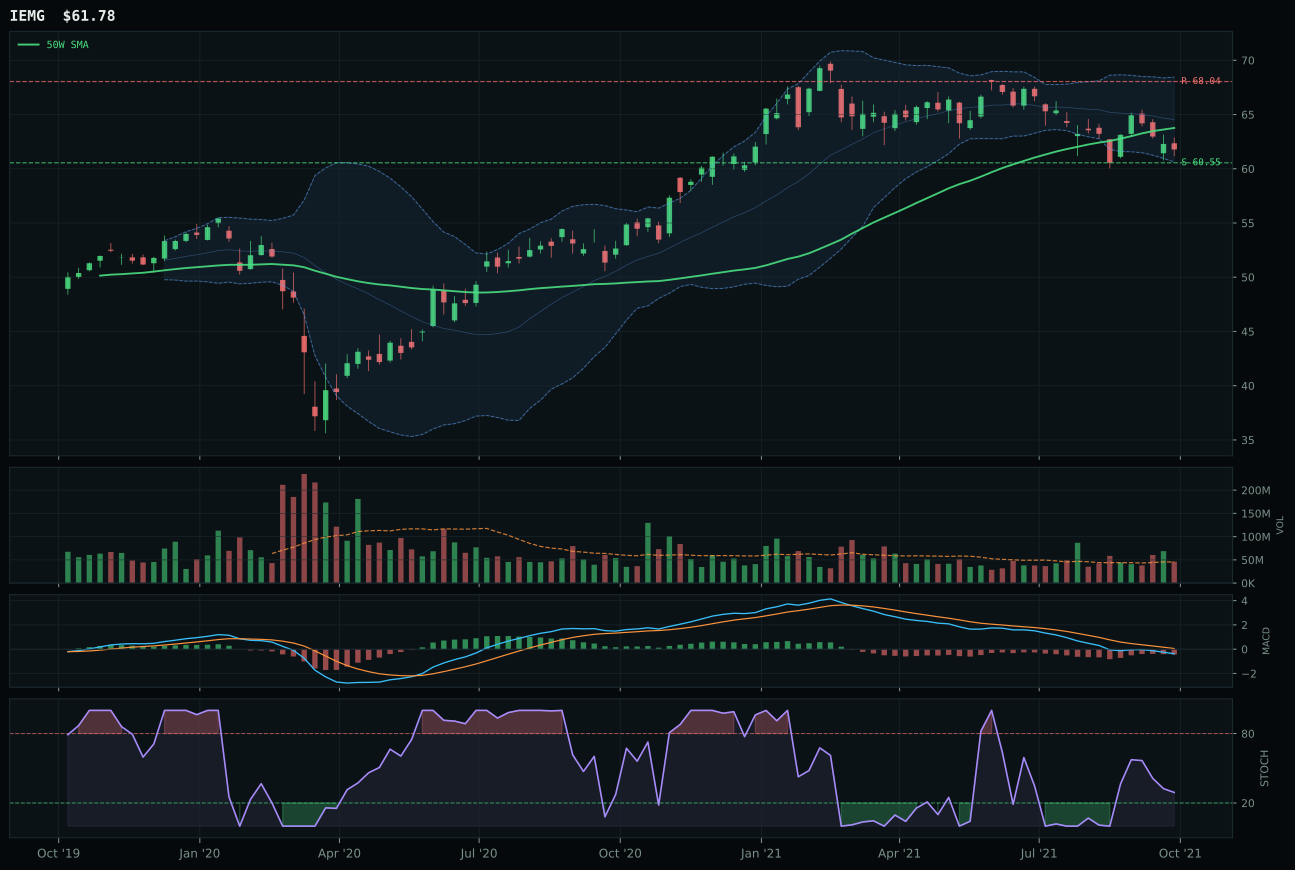
IEMG has a pullback into support profile with -7.5% 13-week relative strength versus SPY.
A failed hold above support would weaken the setup.
Actionable but governed by invalidation levels.
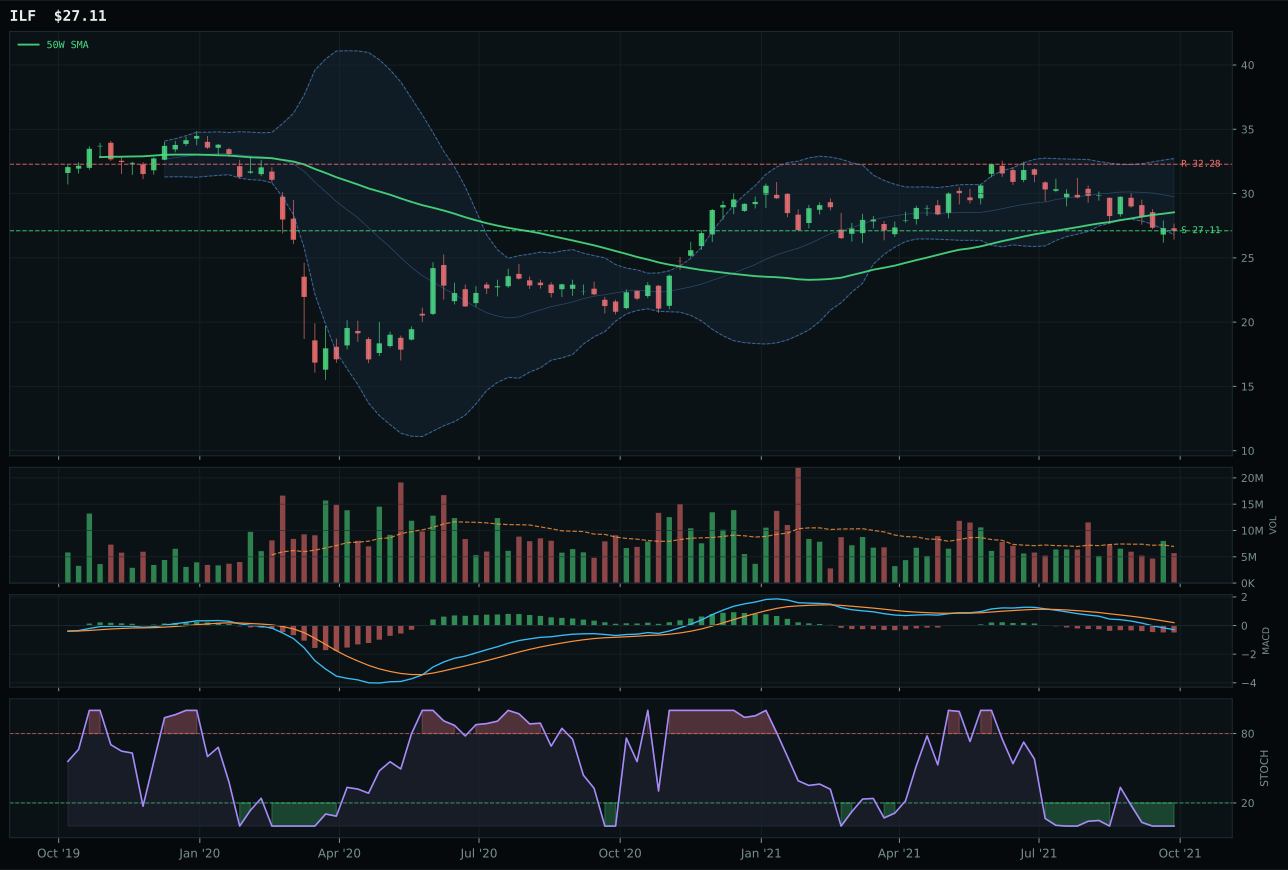
ILF has a pullback into support profile with -13.9% 13-week relative strength versus SPY.
Extension and support failure are the main tactical risks.
Tracked, but not top-2 eligible because: structurally broken.
INDA conquered Emerging Markets with a perfect 100/100 trend score and perfect momentum confirmation (100/100), delivering the rare alignment where an extended move (15.6% above 50W) actually signals institutional strength rather than retail exhaustion. The chart is clean: MACD bullish but flattening, stochastic RSI falling from neutral, volume above-average participation at 1.28x the 20-week average, and structure score of 83.8/100 suggesting a consolidation pattern that can support additional buyers. Category-relative strength at 18.1% means INDA is meaningfully outperforming both IEMG and ILF, a signal that India-specific quality factors (tech talent, startup ecosystems, remittance flows) are being actively accumulated versus broad EM beta. IEMG's runner-up status despite holding 75/100 composite score is deceiving; the broader EM fund trades on pullback into support with bearish MACD and merely 24/100 momentum, meaning it's a waiting game while INDA is a working position.
Emerging Markets earns 5% allocation at a category score of 48.2, positioning that honors India-specific momentum (INDA's leadership) while reflecting broader EM caution in a Goldilocks regime where the upside is constrained. Category-level macro fit at 70.0 is strong, driven by EM liquidity support (+14), liquidity expansion (+8), and Goldilocks regime support (+8), yet credit stress (-10) penalizes multiple expansion and limits the category's rank to fifth place. The allocation size reflects a realistic assessment of timing risk: INDA is extended 15.6% from its 50W with upside/downside at 1.5% and 22.7% respectively—the asymmetry is actually inverted (downside is 15x larger), meaning this is a concentration play in India growth rather than a diversified EM bet. For INDA and the category to earn 10%, the setup would require either a successful pullback consolidation at current levels with renewed breakout, or macro confirmation that EM liquidity is becoming the dominant portfolio theme (credit stress relief, commodity demand surprise). Until then, 5% gives exposure to India's authentic momentum without overcommitting to extended entry points across a category that remains structurally challenged.
Technology — XLK
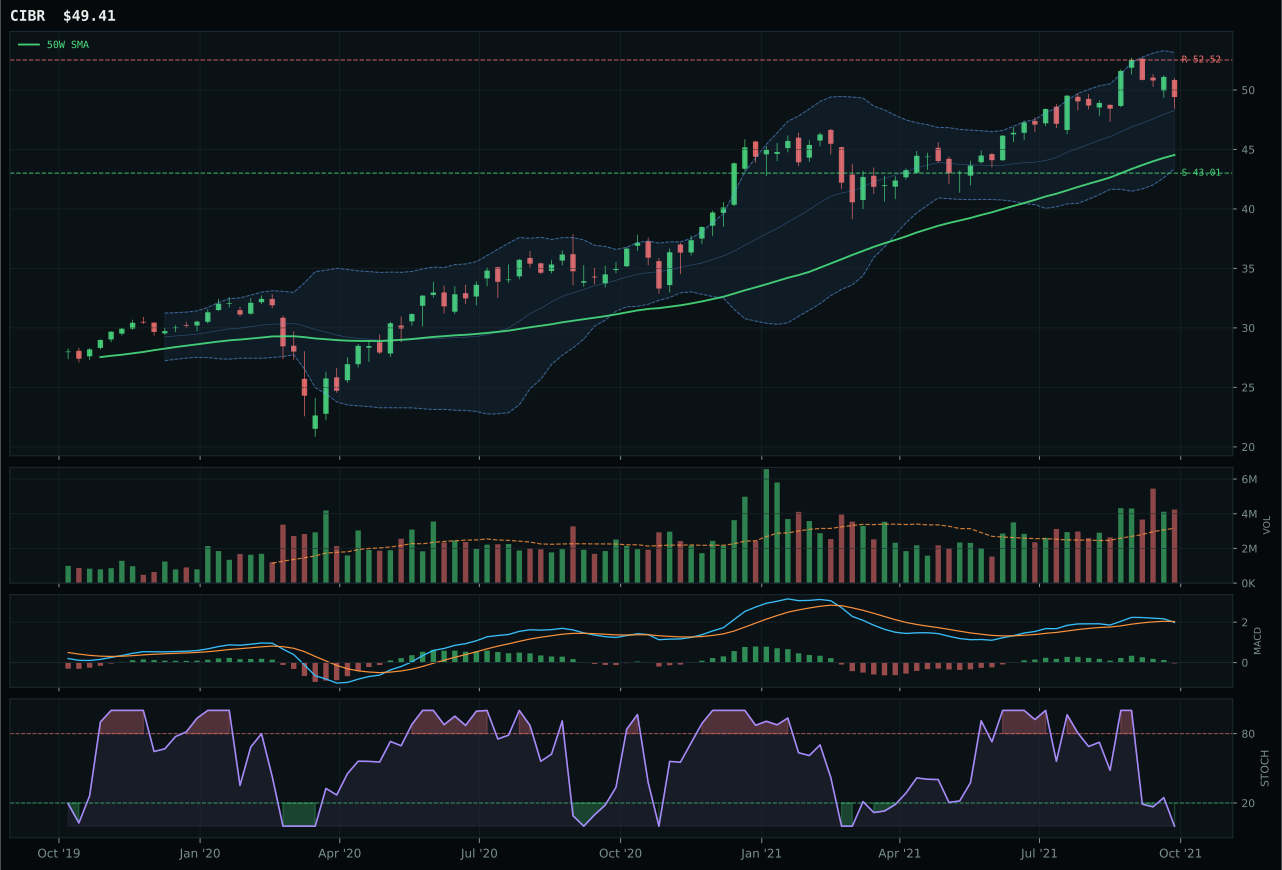
CIBR has a neutral structure profile with 4.8% 13-week relative strength versus SPY.
A failed hold above support would weaken the setup.
Actionable but governed by invalidation levels.
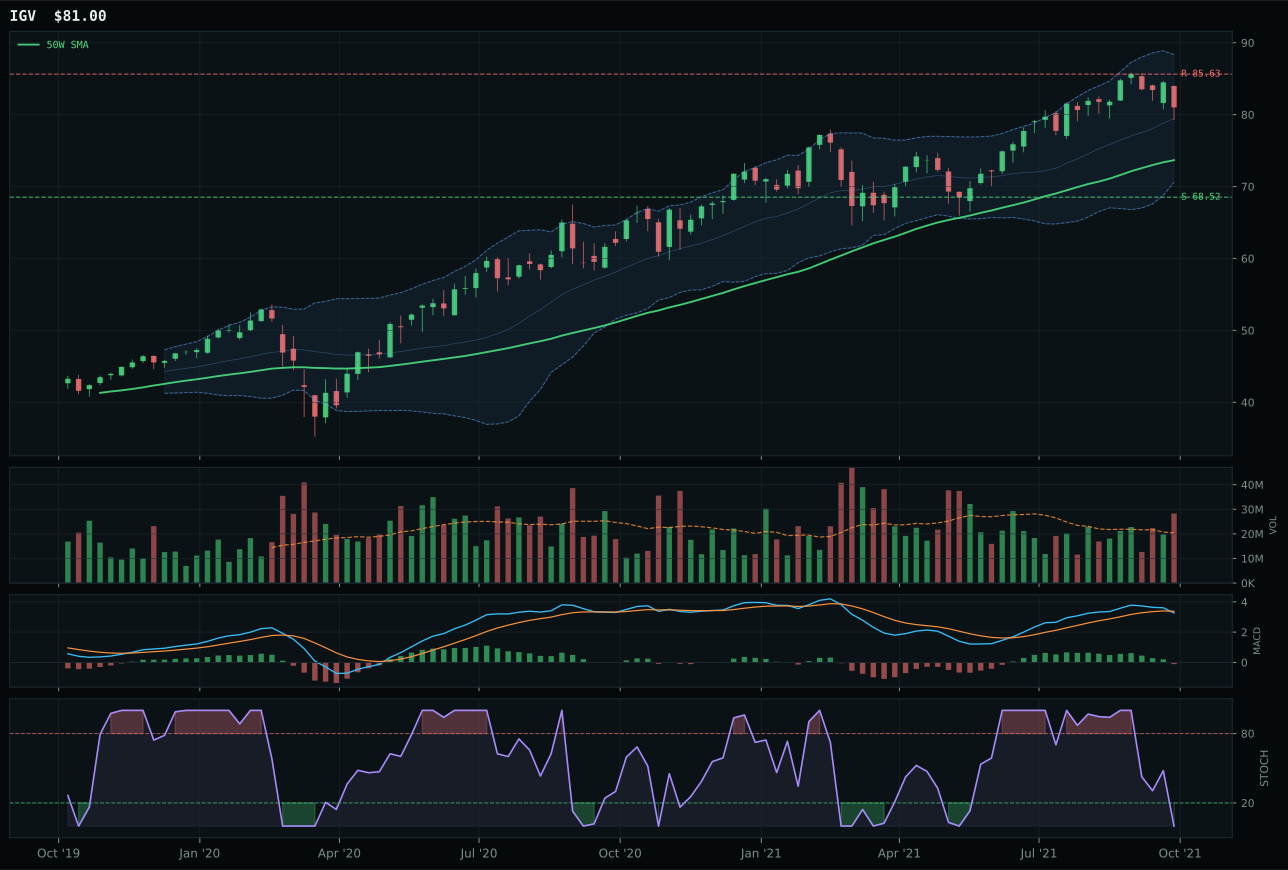
IGV has a neutral structure profile with 2.3% 13-week relative strength versus SPY.
A failed hold above support would weaken the setup.
Actionable but governed by invalidation levels.
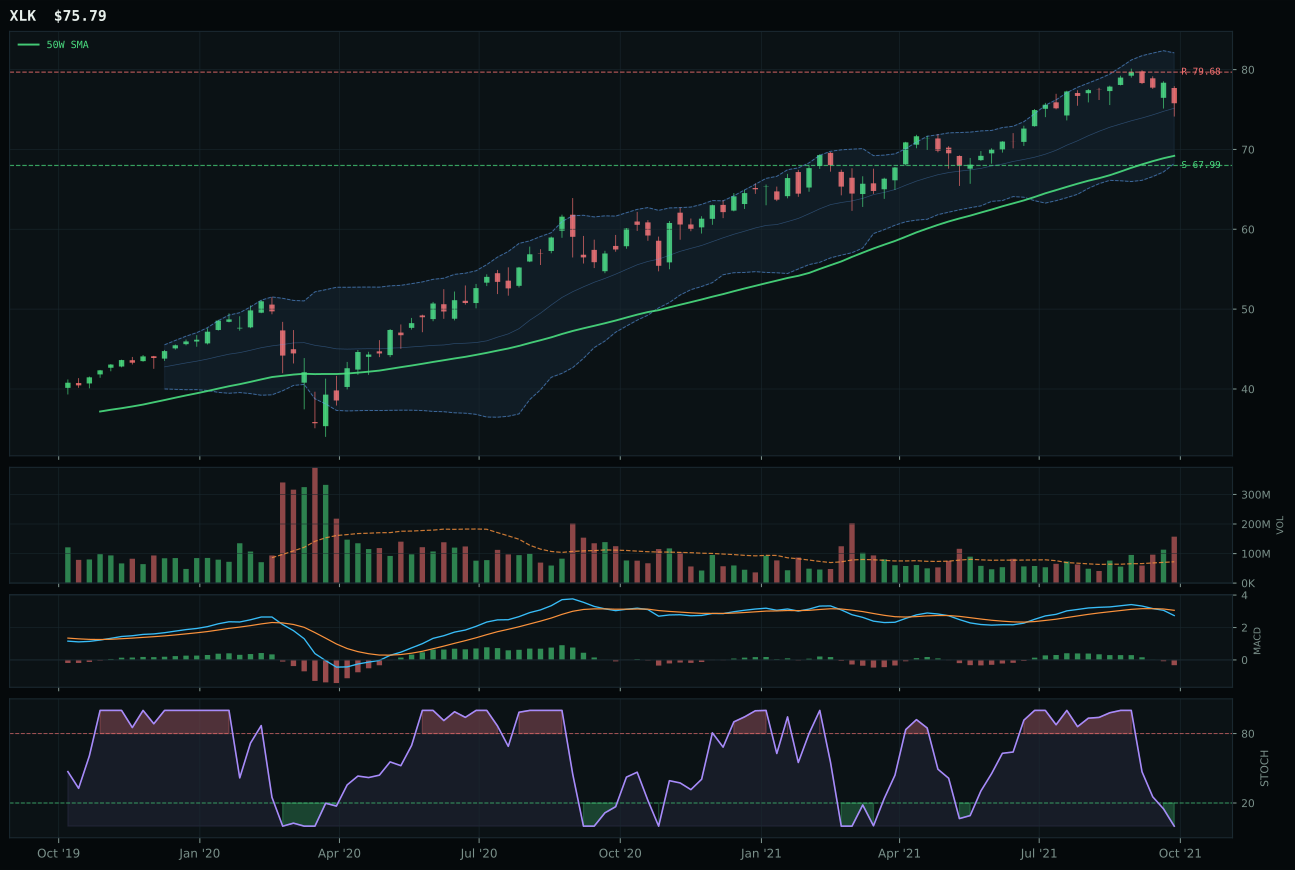
XLK has a neutral structure profile with 1.0% 13-week relative strength versus SPY.
A failed hold above support would weaken the setup.
Actionable but governed by invalidation levels.
XLK claimed the category despite trailing both CIBR and IGV in absolute technical evidence because the scoring system rewards breadth and relative strength confirmation over raw momentum scores. The decisive factor was XLK's 1.0% relative strength versus SPY against CIBR's 4.8%—a counterintuitive outcome that signals XLK is holding leadership among profitable tech names while the broader software cohort (CIBR) is being led by hype rather than accumulation. Volume distribution pressure at 2.18x the 20-week average on a price that's already 9.5% extended from the 50-week mean tells an important story: late sellers are meeting early exit bids, and stochastic RSI at 0.00 combined with a bearish/weakening MACD means the setup is oversold but not confirmed as a buy. The neutral structure with a 67.99 support and 79.68 resistance gives this chart room to reset without breaking the overall uptrend, making it the most prudent entry point in a category that's been running ahead of fundamentals.
Technology earns 5% allocation because it ranked seventh among ten categories at 47.3, well outside the top-two allocation threshold but positioned above lagging defensive exposures. A Goldilocks macro environment typically favors technology rotation, yet the category's 66.0 macro fit score reveals structural friction: disinflation pressure (+5) and liquidity expansion (+9) support risk appetite, but credit stress (-7) penalizes multiple-expansion plays. The real constraint is technical, not macro—all three ETFs (CIBR, IGV, XLK) show weak momentum confirmation and deteriorating volume-price sponsorship, meaning the category would need either cleaner daily action with real accumulation or a clear break above recent resistance levels to graduate to meaningful allocation. For now, the slot rewards exposure retention but signals no fresh capital deployment into technology.
Defense & Aerospace — ITA
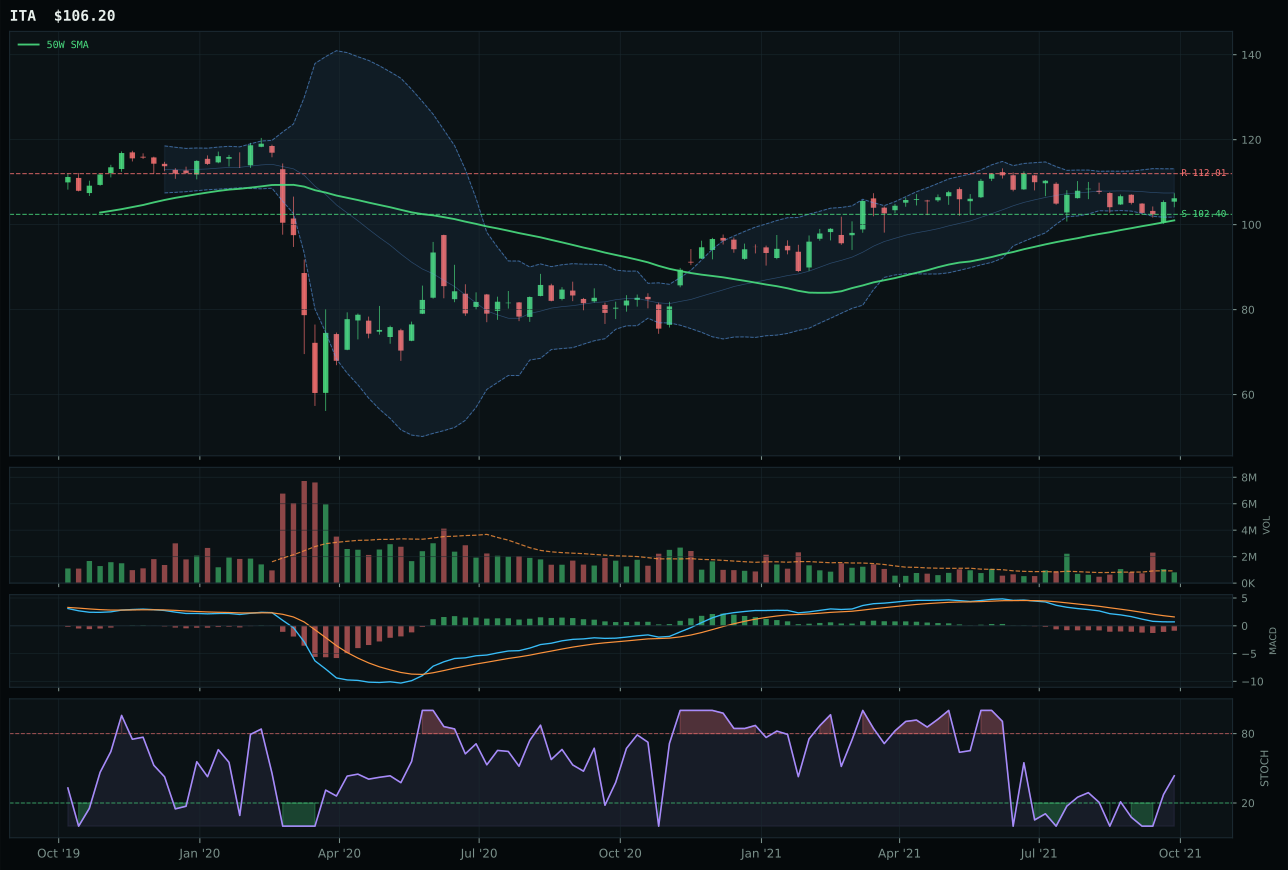
ITA has a pullback into support profile with -3.6% 13-week relative strength versus SPY.
A failed hold above support would weaken the setup.
Actionable but governed by invalidation levels.
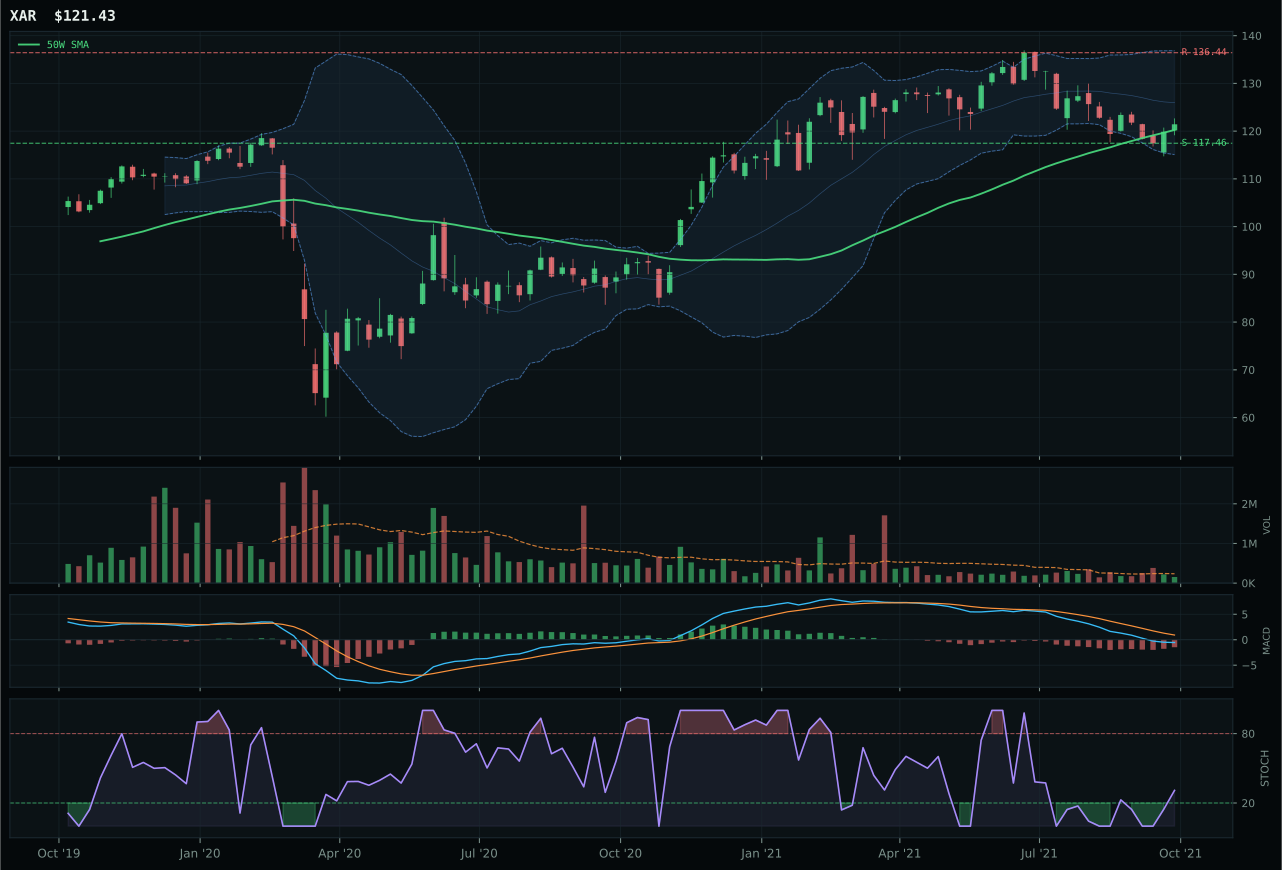
XAR has a pullback into support profile with -8.5% 13-week relative strength versus SPY.
A failed hold above support would weaken the setup.
Actionable but governed by invalidation levels.
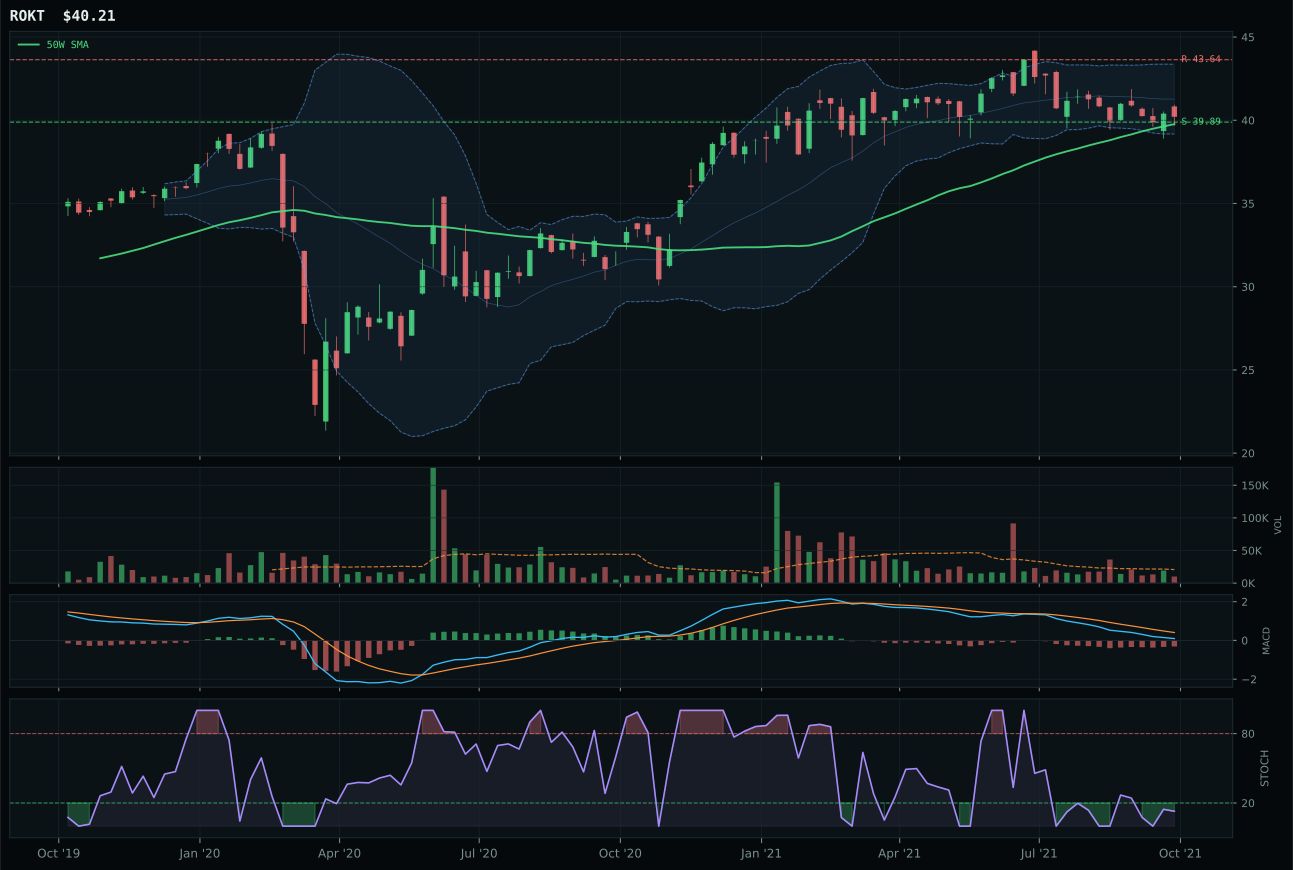
ROKT has a pullback into support profile with -5.7% 13-week relative strength versus SPY.
A failed hold above support would weaken the setup.
Tracked, but not top-2 eligible because: .
ITA edged out XAR in Defense & Aerospace by combining superior timing (93.0 vs 100 for XAR) with cleaner structure (72.0 vs 67.3) and meaningful category-relative strength (2.2% vs -2.8%), proving that being the best of a weak group still requires technical excellence. ITA trades at 5.2% above its 50-week moving average with MACD bearish but improving and stochastic RSI rising from mid-zone—the archetypal pullback-into-support setup that invites accumulation without chasing extended moves. The invalidation point sits at 102.40 with only 3.7% downside risk versus 5.2% upside to resistance, delivering a favorable risk-reward ratio even though volume is neutral rather than confirming. XAR faltered because it's down 8.4% over 13 weeks, lags category-relative strength, and trades on thin participation—all the ingredients of a laggard that will only attract buyers after proof of a reversal, not during one.
Defense & Aerospace ranks sixth at 44.4, earning 5% as a core holding despite middle-of-the-pack category strength and neutral macro conditions. The 55.0 macro fit reflects an environment where credit stress (+2) supports stability but no specific descriptor strongly drives demand—real asset sponsorship is muted, disinflation pressures are absent, and geopolitical convenience has already been priced in. What keeps this category in the portfolio is ITA's timing score of 93.0, a rare setup where price has already broken below the 50W and oscillators are rising, suggesting institutional accumulation into weakness rather than chasing strength. The category would require either a confirmed reclaim of the 50W with above-average volume or a macro shift (credit stress intensifying or inflation surprises) to justify a promotion to 10%; for now, the 5% slot acknowledges the defensibility of the setup without betting on mean-reversion acceleration.
AI — SMH
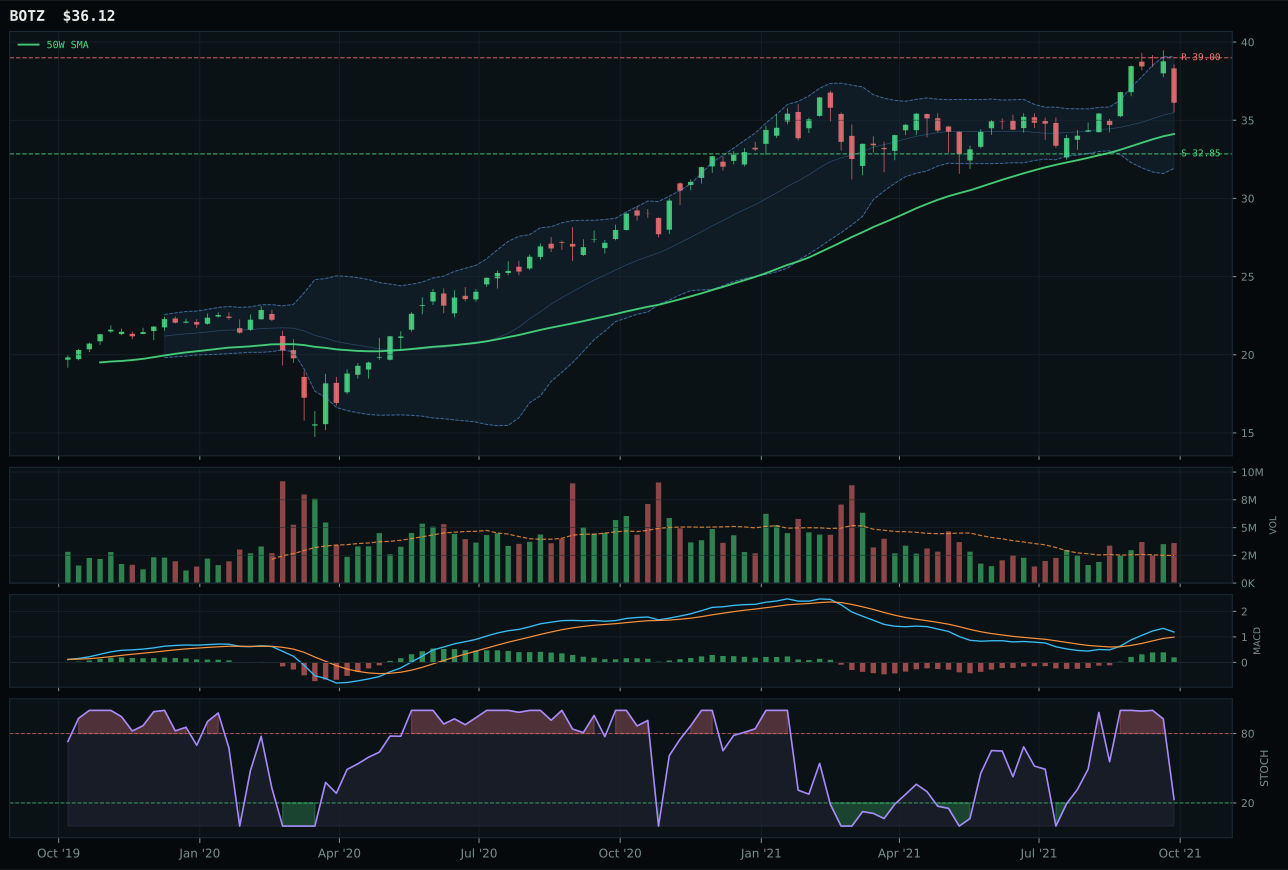
BOTZ has a neutral structure profile with 3.6% 13-week relative strength versus SPY.
A failed hold above support would weaken the setup.
Actionable but governed by invalidation levels.
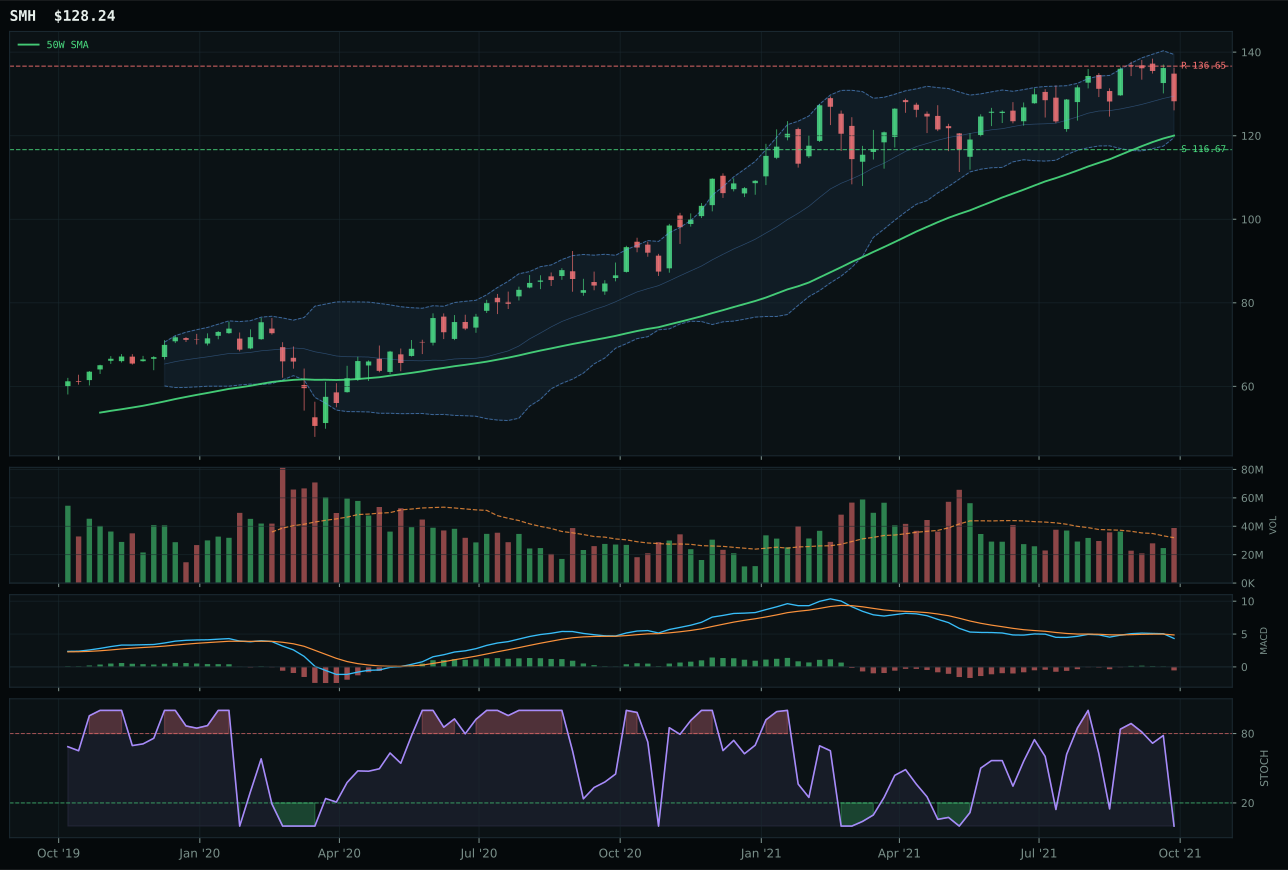
SMH has a neutral structure profile with -1.4% 13-week relative strength versus SPY.
A failed hold above support would weaken the setup.
Actionable but governed by invalidation levels.
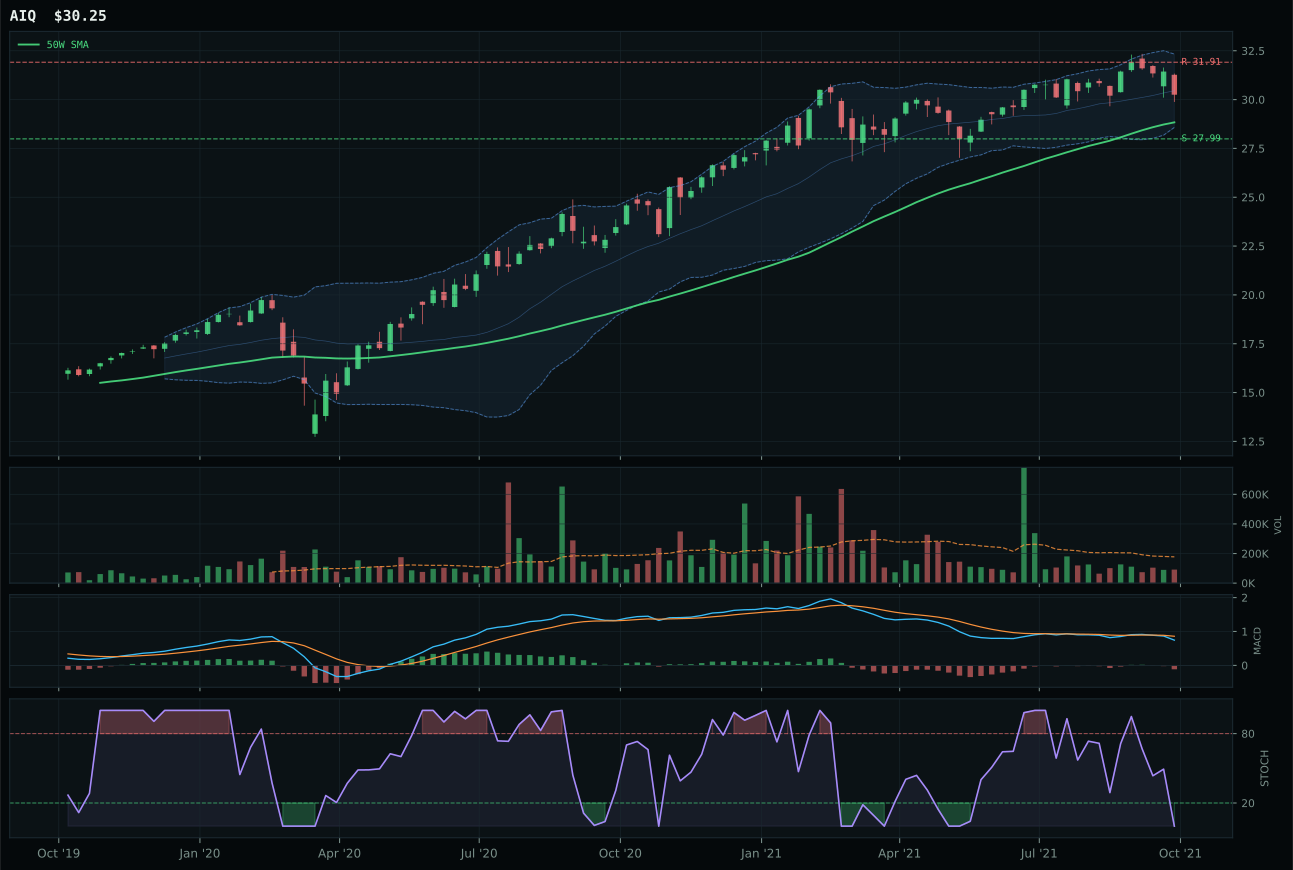
AIQ has a neutral structure profile with -1.8% 13-week relative strength versus SPY.
A failed hold above support would weaken the setup.
Tracked, but not top-2 eligible because: .
SMH won the AI category on a narrow technical edge over BOTZ despite being outgunned on trend (BOTZ at 100 vs SMH at 80) and momentum (BOTZ 67 vs SMH 25), a result that underscores how the scoring system penalizes extended entries and rewards mean-reversion setups. BOTZ was holding 3.6% relative strength to SPY with a bullish but flattening MACD and rising stochastic RSI mid-zone—a setup that looks strong until you notice it's 26.7% extended from its 50-week moving average and volume is merely above-average participation rather than accumulation. SMH, by contrast, sits only 6.8% from its 50-week at an oversold stochastic reading with falling volume participation, giving it the structure of a reset that institutions can buy into without fear of chasing. The 14-point score gap between winner and runner-up is material, yet both ETFs are positioned within the same neutral technical structure, meaning neither is a home run; BOTZ is simply more expensive entry risk.
AI receives 5% allocation as the seventh-ranked category at 43.3, reflecting a macro regime that theoretically favors productivity plays yet delivers weak technical proof across all three candidates. The category's 62.0 macro fit sits above median, driven by Goldilocks support (+10) and liquidity expansion (+10), but credit stress (-8) acts as a persistent headwind that pulls down even the most bullish setups. The core issue: BOTZ shows the best technical evidence (71.0) yet ranks as the runner-up, revealing that breadth and persistence across the entire three-ETF basket matter more than any single name's momentum. To earn a promotion from 5% to 10%, this category would need either one ETF to escape below its 200W with strong volume confirmation, or all three to print new 52W highs with sustained accumulation—neither condition is present, leaving AI on allocation watch rather than deployed conviction.
Utilities & Infrastructure — IGF
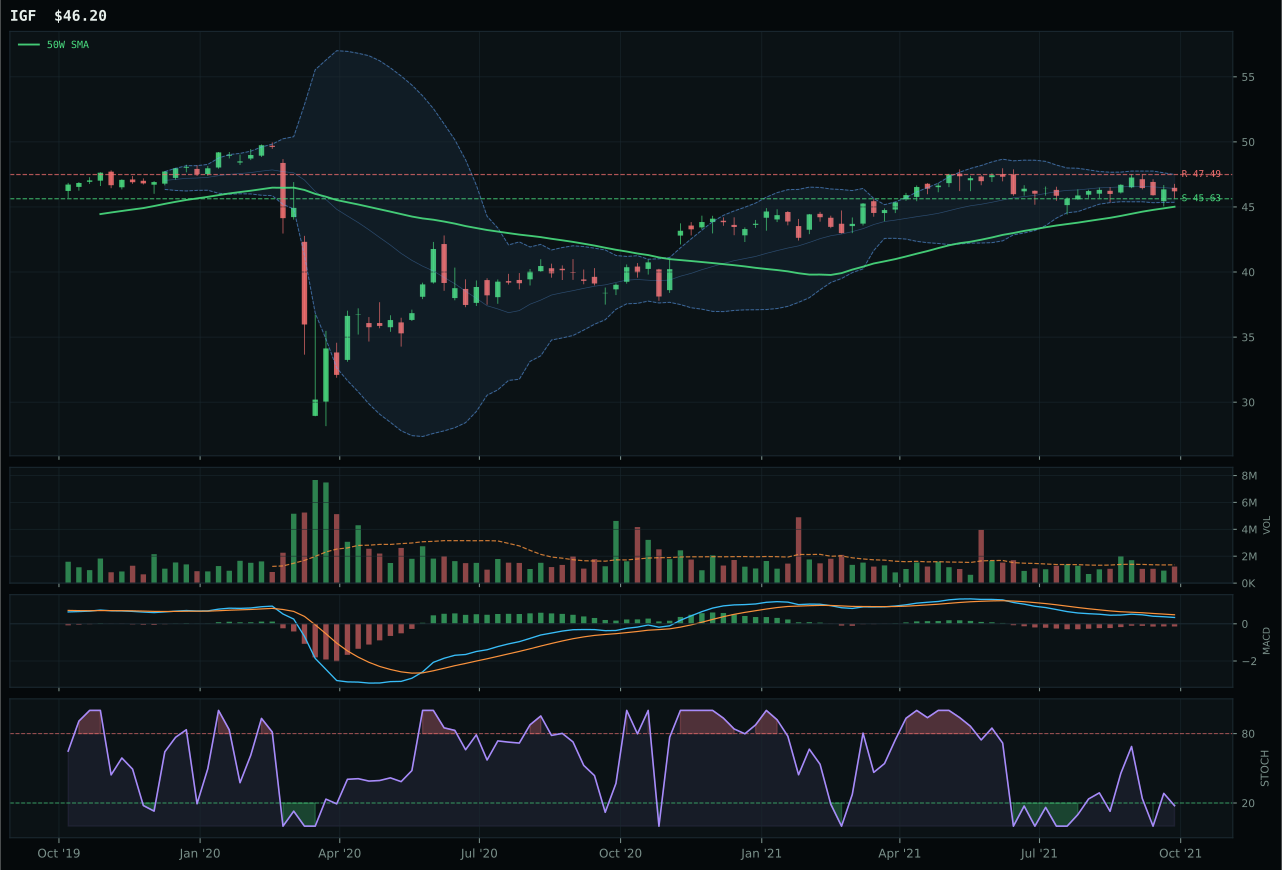
IGF has a pullback into support profile with 0.3% 13-week relative strength versus SPY.
A failed hold above support would weaken the setup.
Actionable but governed by invalidation levels.
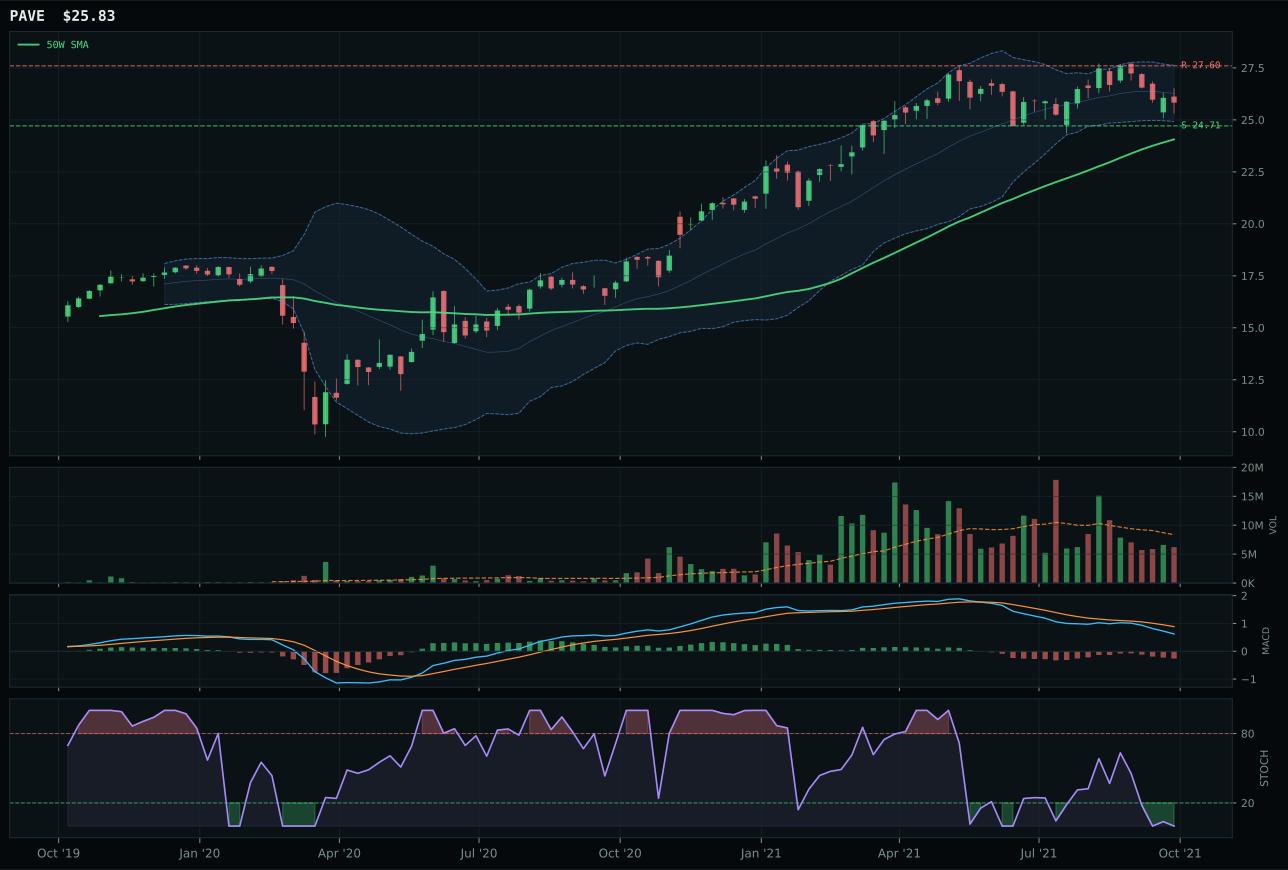
PAVE has a pullback into support profile with -0.4% 13-week relative strength versus SPY.
A failed hold above support would weaken the setup.
Actionable but governed by invalidation levels.
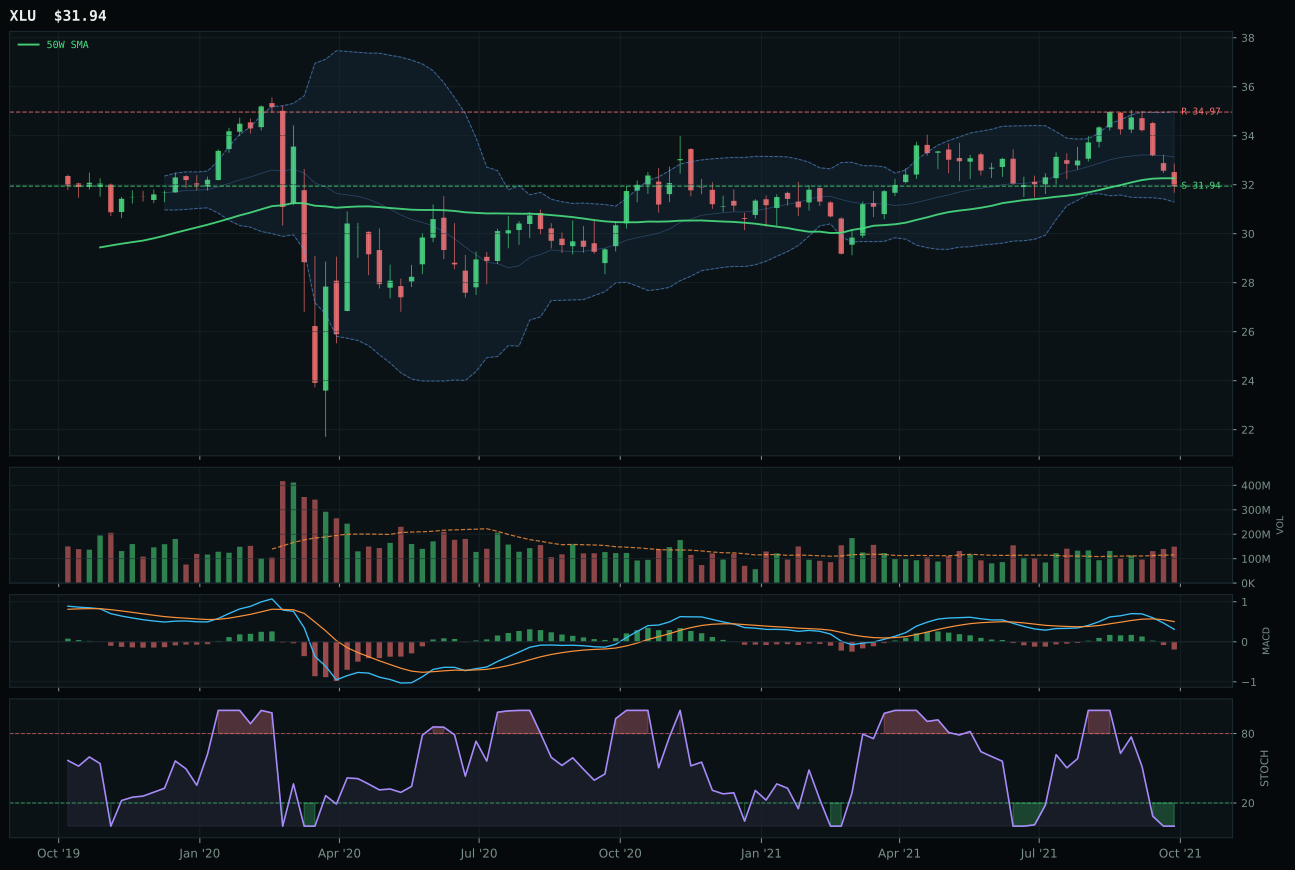
XLU has a pullback into support profile with -0.3% 13-week relative strength versus SPY.
A failed hold above support would weaken the setup.
Actionable but governed by invalidation levels.
IGF won Utilities & Infrastructure on superior timing (95.0/100 vs PAVE's 80.0) and better risk-reward mechanics (84.1 vs 70.5), not because it's a bullish setup but because it owns the cleanest pullback-into-support structure in the category. Sitting just 2.6% above its 50-week moving average with stochastic RSI oversold at 0.18 and MACD bearish/weakening, IGF is offering the exact entry point disciplined allocators want: defined invalidation (support at 45.63), favorable asymmetry (only 1.2% downside versus 2.7% upside), and room for fresh accumulation before the move extends. PAVE trades on the same pullback-into-support pattern but sits further from support, carries thinner volume participation, and shows weaker category-relative strength (0.6% vs -0.1%), meaning it's following rather than leading. The 11-point score gap between IGF and PAVE is material, yet both reflect a category that's fundamentally uninspired: backward-looking momentum (33.7 for IGF), weak volume-price confirmation (42.7), and a macro environment (Goldilocks) that de-emphasizes defensive income plays.
Utilities & Infrastructure receives 0% allocation and ranks ninth or tenth among ten categories, excluded entirely this week despite IGF's appealingly tight setup and exceptional timing score. The category's 39.4 score and 60.0 macro fit reflect a structural headwind: disinflation pressure (+6) is the only supporting force, yet it helps utilities defensively rather than driving capital allocation, while credit stress (-5 implied), commodity breadth indifference, and no real-asset sponsorship combine to position this category as a defensive residual rather than a core conviction. The category's technical weakness is stark—all three candidates (IGF, PAVE, XLU) show momentum confirmation in the 20-35 range, meaning capital is not accumulating but rather trapped in mean-reversion bounces. For Utilities & Infrastructure to earn even 5%, the category would require either a macro shift (credit stress relief becoming a thematic tailwind) or a technical breakout above the recent resistance cluster near 47.49 for IGF with sustained volume—neither condition is present. Until then, capital allocated to this category would represent rotation away from higher-conviction setups like Nuclear Energy and Traditional Energy, making zero allocation the correct strategic choice.
Precious Metals — GDX
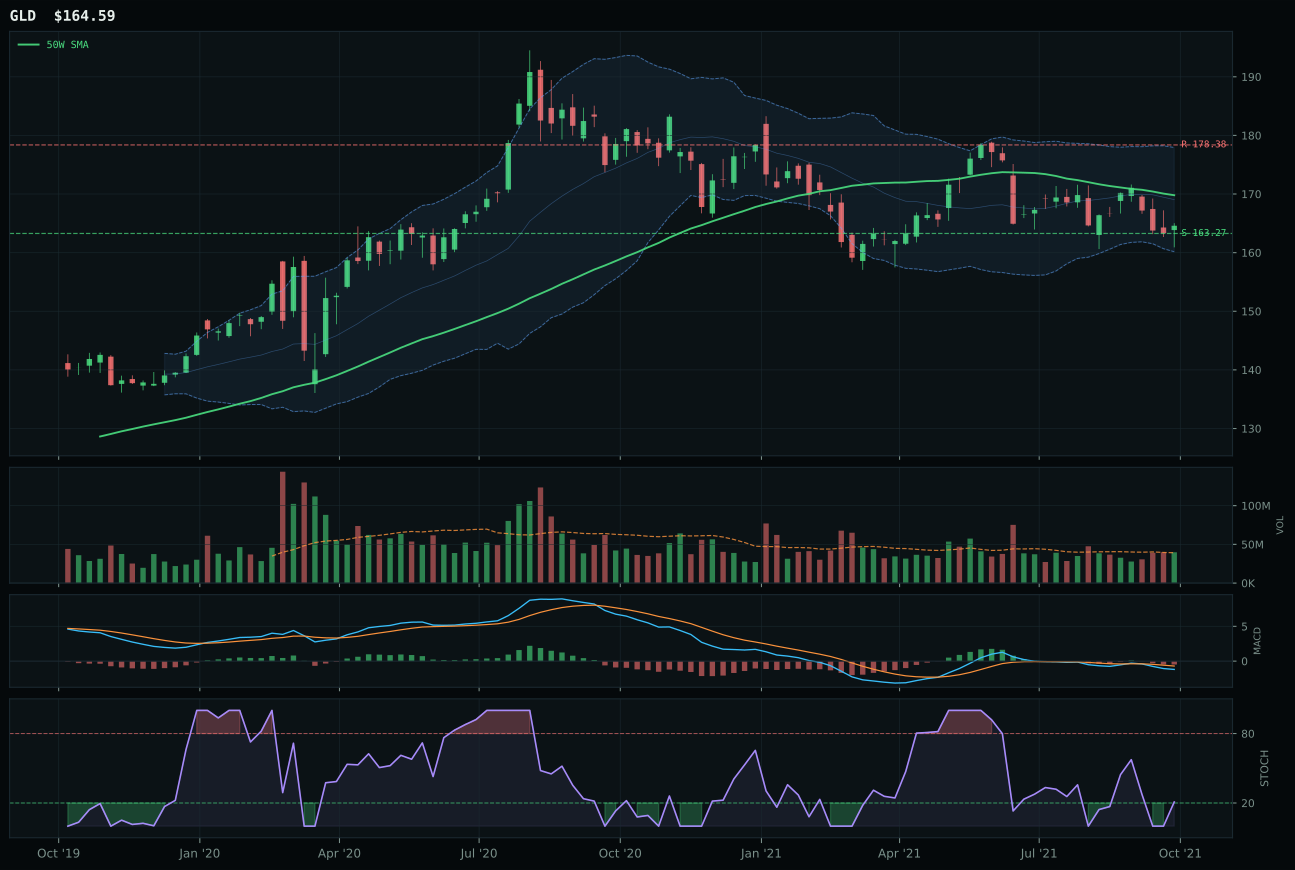
GLD has a pullback into support profile with -1.7% 13-week relative strength versus SPY.
A failed hold above support would weaken the setup.
Actionable but governed by invalidation levels.
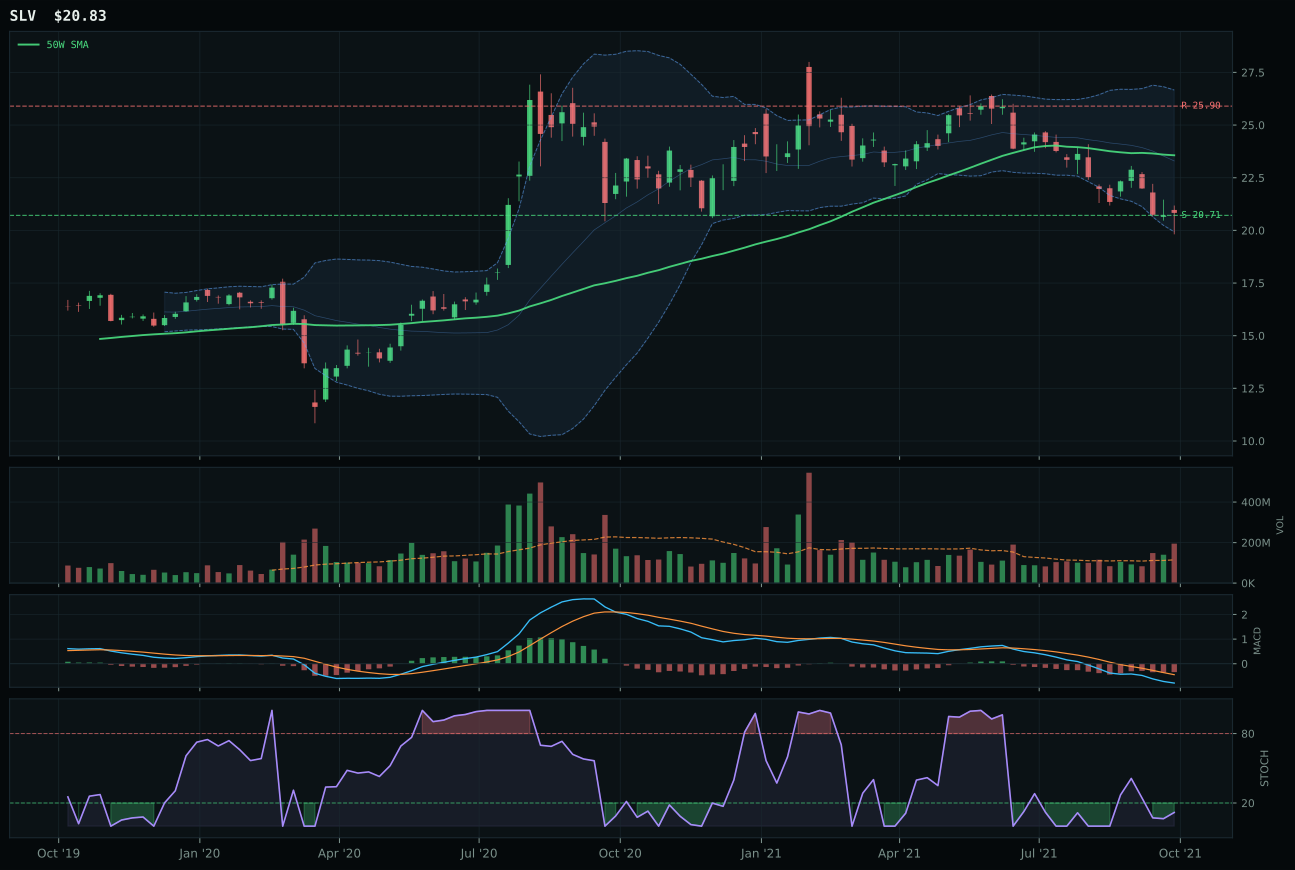
SLV has a pullback into support profile with -15.3% 13-week relative strength versus SPY.
A failed hold above support would weaken the setup.
Actionable but governed by invalidation levels.
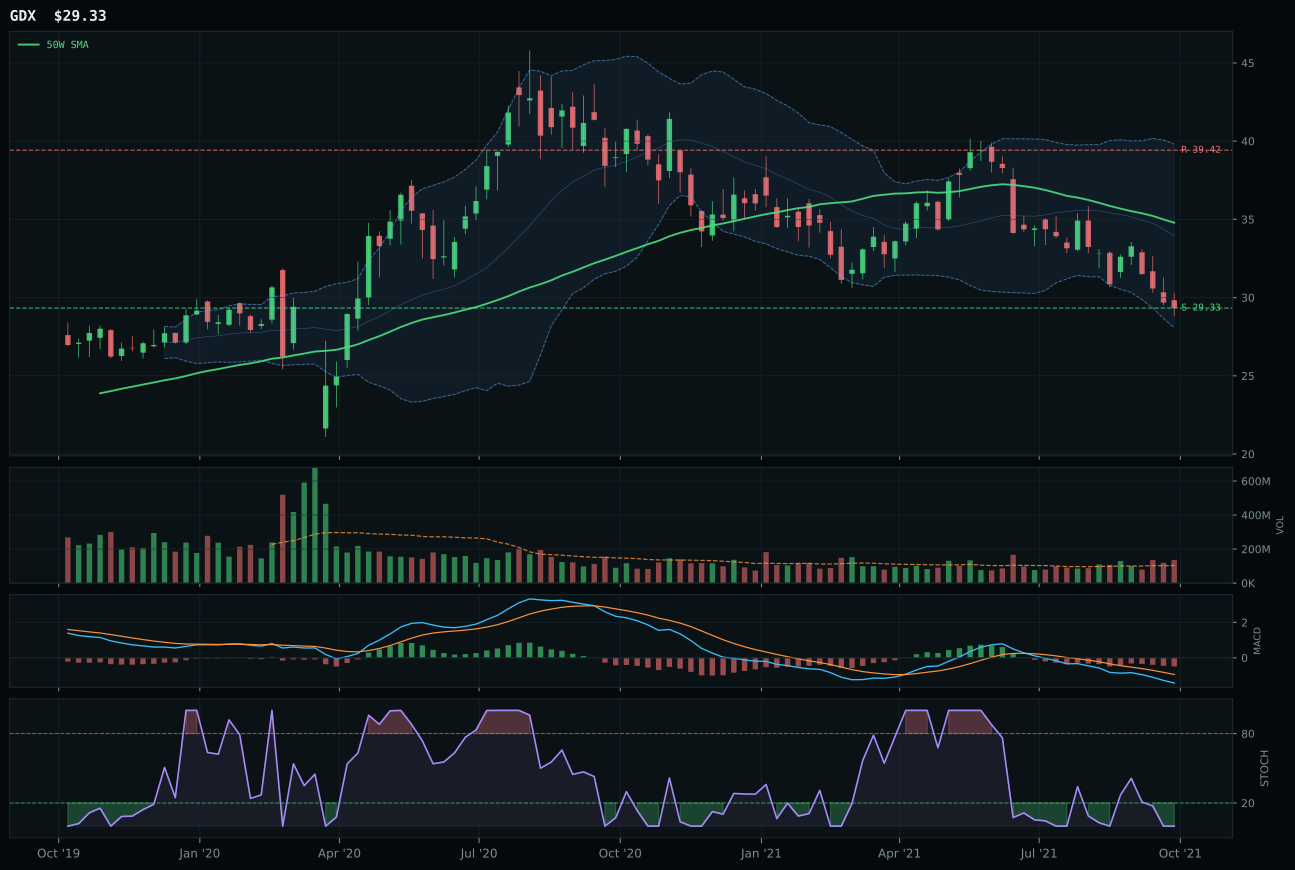
GDX has a pullback into support profile with -14.9% 13-week relative strength versus SPY.
A failed hold above support would weaken the setup.
Actionable but governed by invalidation levels.
GDX won Precious Metals not because it's a bullish setup—it trades 15.7% *below* its 50-week moving average with a bearish/weakening MACD and oversold stochastic RSI—but because the scoring system correctly identified it as the only mean-reversion candidate in a category where GLD is less oversold and therefore less attractive. GDX's support sits at exactly 29.33 with zero downside risk and 25.6% upside to resistance, delivering 90.0 risk-reward score that dwarfs GLD's 98.0 only because GDX is deeper in the wreckage. The 13-week return of -14.8% and category-relative strength at 0.0% (tied with GLD) means GDX hasn't lagged, it's just a leveraged proxy that magnifies both downside and upside. Volume at 1.31x the 20-week average with an above-average participation signal suggests defensive portfolio positioning rather than forced selling, making the pullback into support a technical setup rather than a capitulation event.
Precious Metals receives 0% allocation and ranks ninth or tenth among ten categories, excluded from the portfolio this week despite a category score of 33.6. The macro regime actively penalizes this category: disinflation pressure (+6) and liquidity expansion (-2) suggest real yields are rising and central banks are tightening, the worst combination for precious metals investors. GDX's technical setup is a clear breakdown below the 50W with oversold stochastic RSI and zero momentum confirmation—the chart is telling a story of capitulation, not accumulation, and even 25.6% downside risk to resistance is not compelling enough to shift allocation into a category this structurally weak. For precious metals to earn even 5%, the category would need either a confirmed reclaim of the 50W with three-bar confirmation, or an active macro descriptor shift (credit stress intensifying, real asset sponsorship activating) that makes gold a hedge again rather than a cyclical laggard. Until then, the allocation remains zero and the capital stays elsewhere.