
2021-09-24
Informational purposes only. The content in this report, including allocations, analysis, and commentary, is provided solely for informational and educational purposes. It does not constitute financial advice, investment advice, trading advice, or any other type of advice. Past performance does not guarantee future results. Always conduct your own research and consult a qualified financial professional before making investment decisions.
Weekly Allocation
| Ticker | Category | Weight | Role |
|---|---|---|---|
| FSOL | 50% | Overlay | |
| XLK | Technology | 10% | Top-2 (10%) |
| BOTZ | AI | 10% | Top-2 (10%) |
| COPX | Industrial Metals | 5% | Tier-2 (5%) |
| MOO | Agriculture & Livestock | 5% | Tier-2 (5%) |
| IGF | Utilities & Infrastructure | 5% | Tier-2 (5%) |
| URNM | Nuclear Energy | 5% | Tier-2 (5%) |
| ITA | Defense & Aerospace | 5% | Tier-2 (5%) |
| INDA | Emerging Markets | 5% | Tier-2 (5%) |
Trade Instructions — Monday Open
Sell the tranche from 2021-08-27 (completing its 4-week hold). Buy the new tranche. Instructions show net portfolio changes — same-asset positions cancel, weight changes show the delta.
| Action | Ticker | Instruction |
|---|---|---|
| SELL | XLU | Sell 40% of XLU position (reduce 6.25% → 3.75%) |
| SELL | CIBR | Sell 25% of CIBR position (reduce 10.00% → 7.50%) |
| SELL | GLD | Sell 33% of GLD position (reduce 3.75% → 2.50%) |
| BUY | BOTZ | Buy BOTZ — 20.00% of freed cash (adds 1.25% to portfolio) |
| BUY | IGF | Buy IGF — 20.00% of freed cash (adds 1.25% to portfolio) |
| BUY | INDA | Buy INDA — 20.00% of freed cash (adds 1.25% to portfolio) |
| BUY | XLK | Buy XLK — 40.00% of freed cash (adds 2.50% to portfolio) |
Current Portfolio After Trade
Combined holdings across all 4 active tranches. Each tranche is 25% of the portfolio.
| Ticker | % of Portfolio | Weight Bar |
|---|---|---|
| FSOL | 50.00% | |
| CIBR | 7.50% | |
| BOTZ | 7.50% | |
| COPX | 6.25% | |
| MOO | 5.00% | |
| URNM | 5.00% | |
| ITA | 3.75% | |
| XLU | 3.75% | |
| GLD | 2.50% | |
| IGF | 2.50% | |
| INDA | 2.50% | |
| XLK | 2.50% | |
| SLV | 1.25% |
Macro Regime — Goldilocks
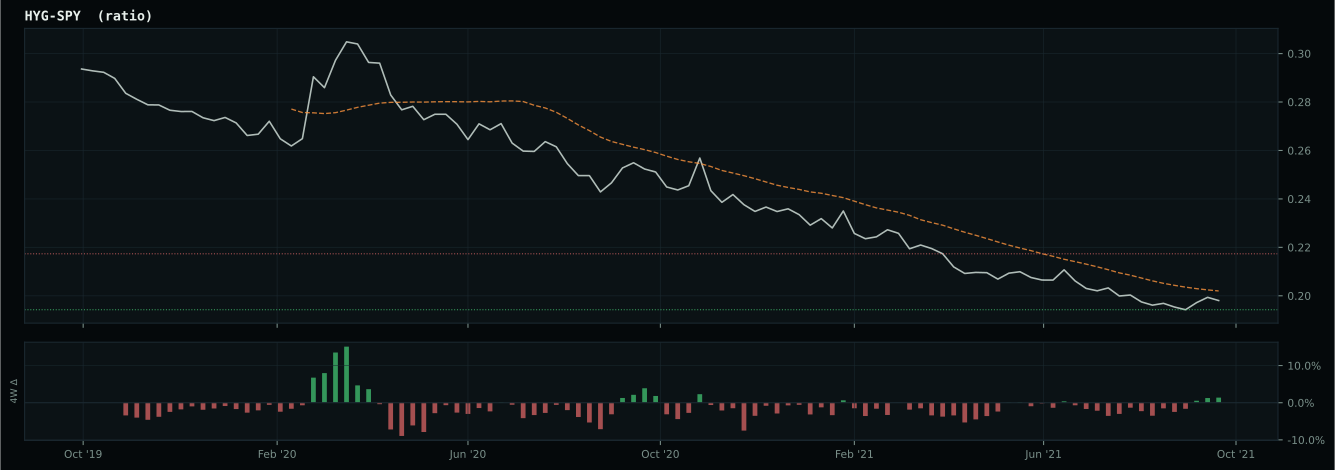
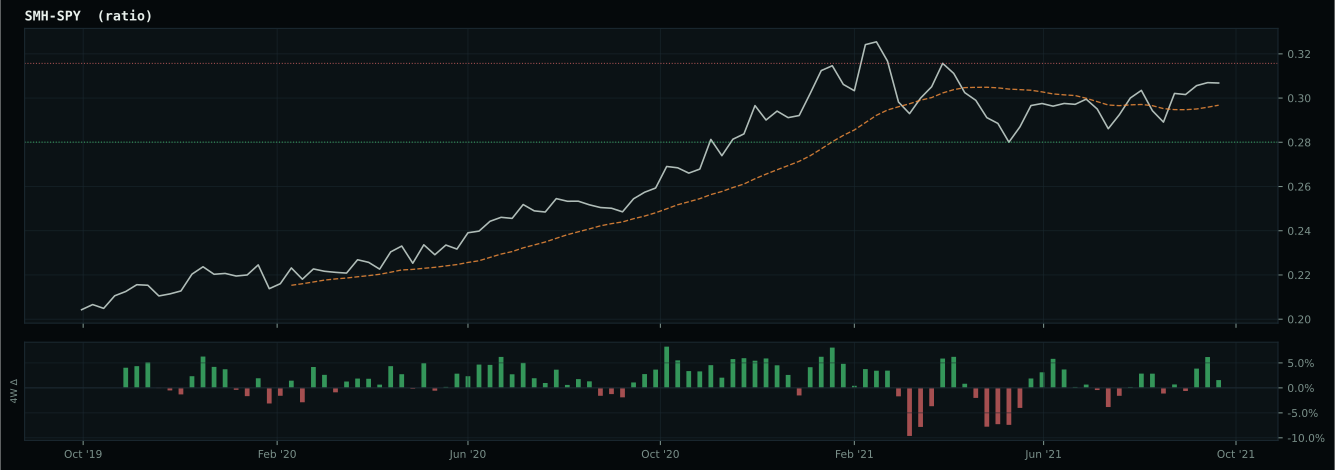
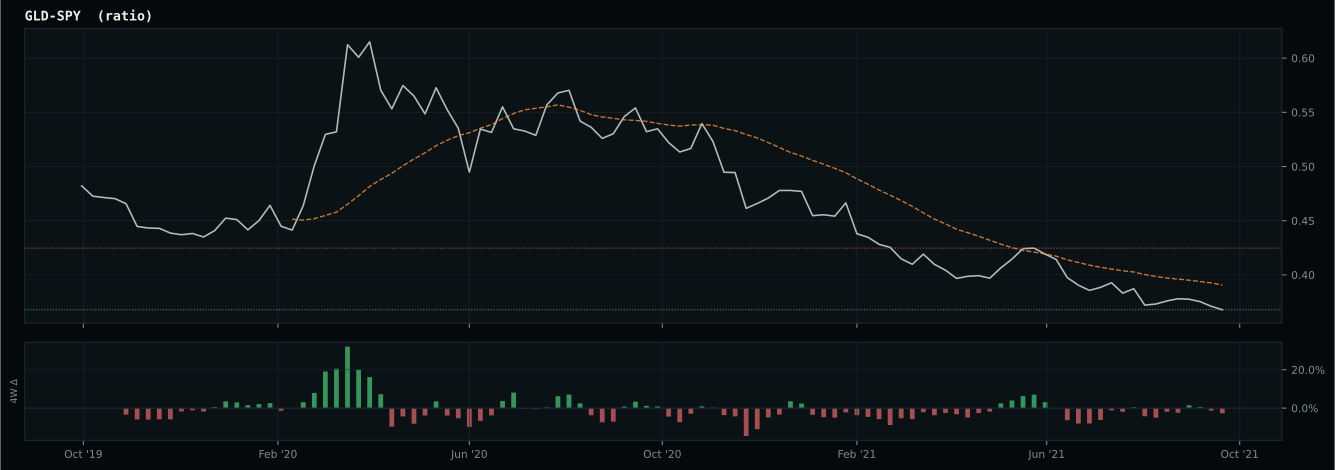
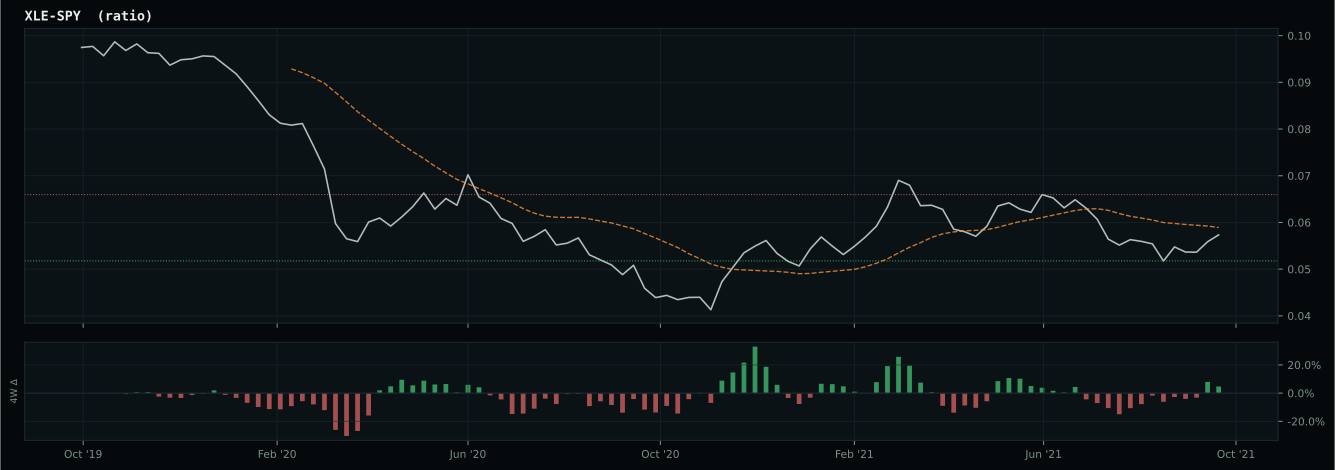
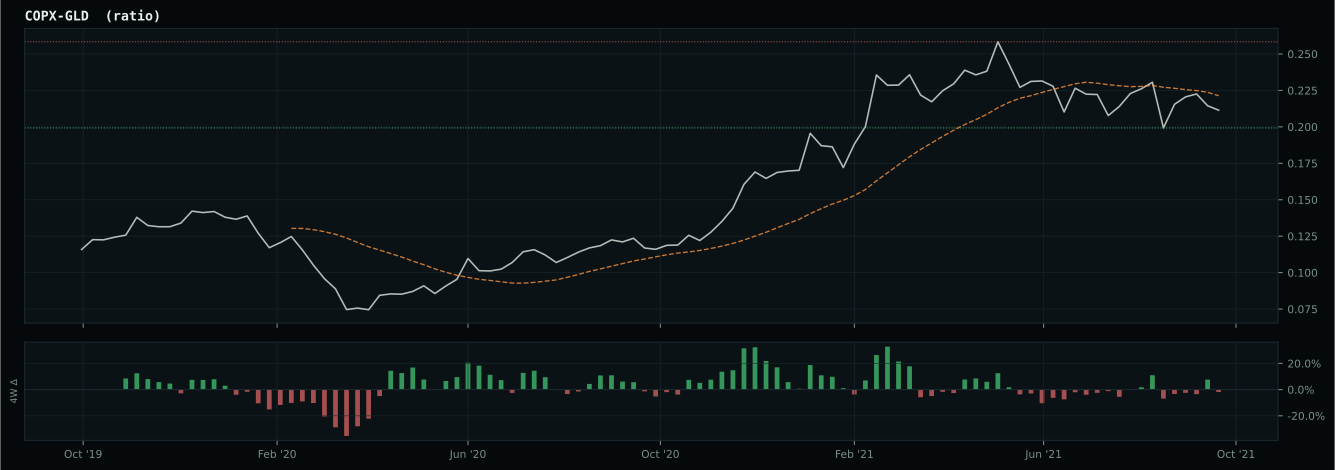
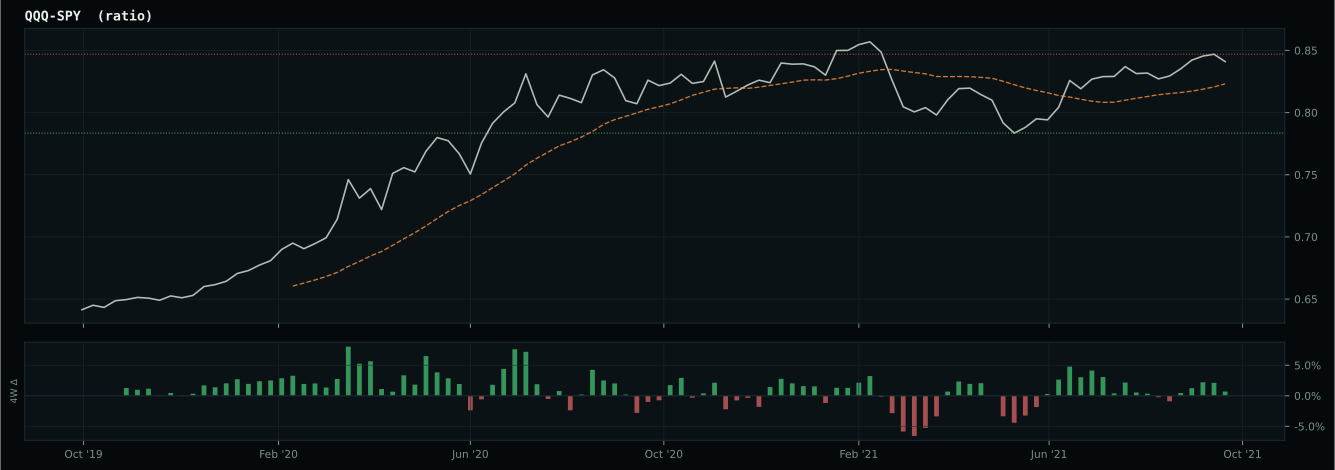
Macro Evidence Charts
Market-implied signals behind the macro regime scores. Each ratio compares two assets; the direction and slope of the ratio is what the macro engine reads.
Crypto Regime — AltSeason
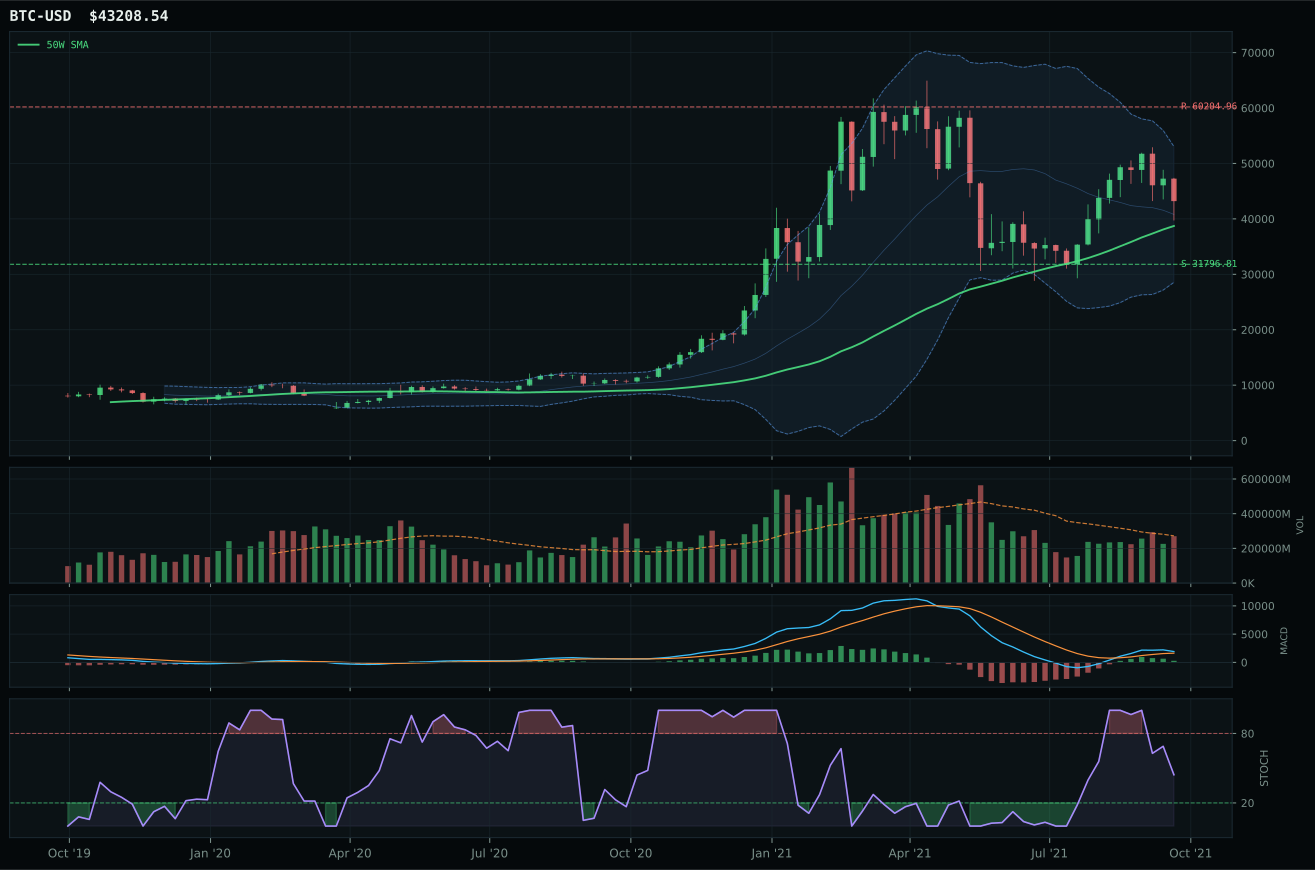
ValueBTC not armed: BTC has not made the first post-breakdown touch of the 200W buy zone after losing the 50W
TrendBTC confirmed: 2 consecutive closes above rising/flat 50W SMA
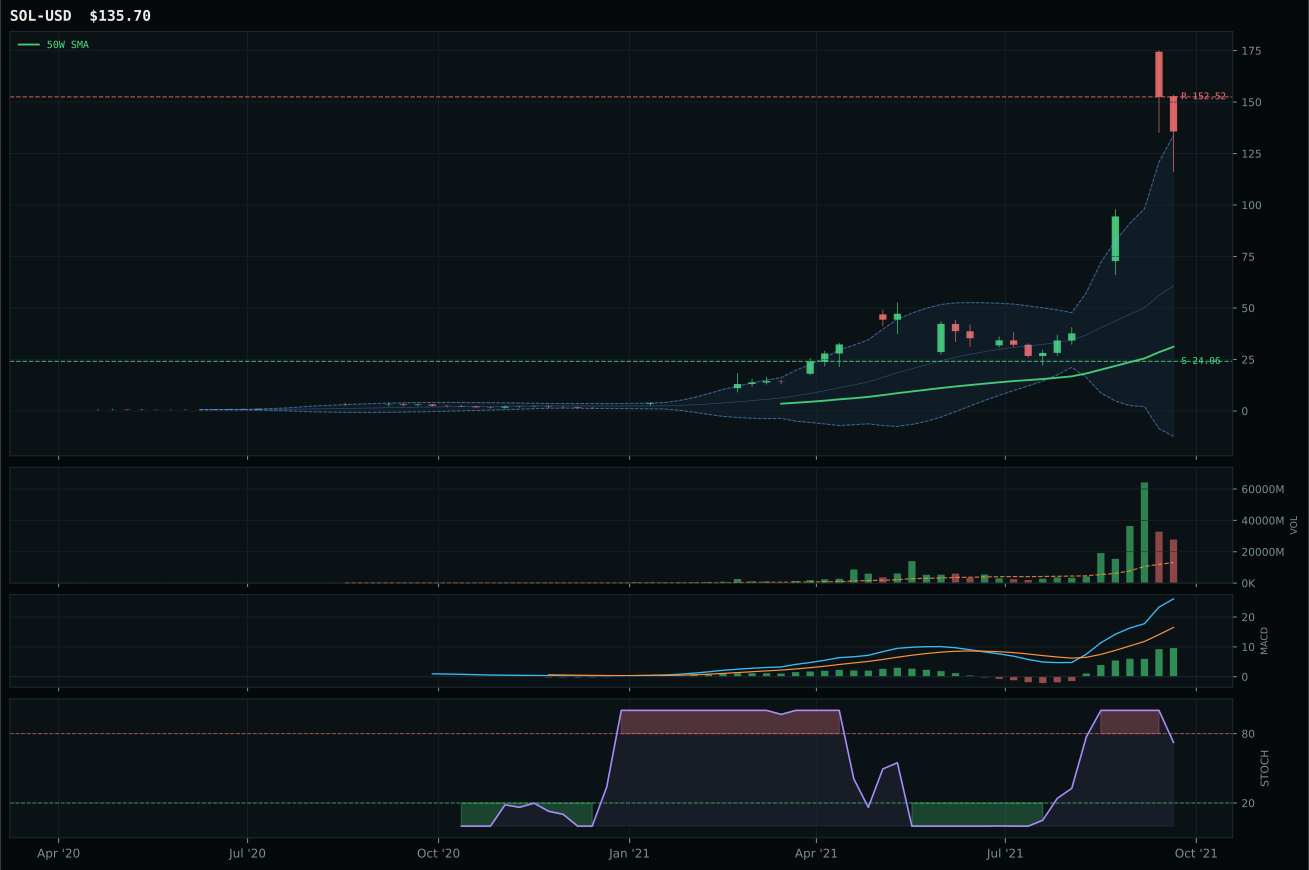
all available AltSeason conditions pass; missing optional confirmations skipped
Category Rankings
| Rank | Category | Winner | Score | Alloc | 4W Ret | Peers (4W) |
|---|---|---|---|---|---|---|
| 1 | Technology | XLK | 68.8 | 20% | +2.33% | IGV +3.5% · CIBR +5.4% |
| 2 | AI | BOTZ | 67.5 | 20% | -3.08% | SMH -0.5% · AIQ +1.4% |
| 3 | Industrial Metals | COPX | 60.9 | 10% | +11.94% | REMX +6.9% · PICK +5.3% |
| 4 | Agriculture & Livestock | MOO | 42.4 | 10% | +2.31% | WEAT +5.7% · VEGI +3.3% |
| 5 | Utilities & Infrastructure | IGF | 42.2 | 10% | +3.18% | XLU +3.3% · PAVE +4.9% |
| 6 | Nuclear Energy | URNM | 42.0 | 10% | +23.22% | URA +22.6% · NLR +7.2% |
| 7 | Defense & Aerospace | ITA | 37.5 | 10% | +2.89% | XAR +3.2% · ROKT +1.5% |
| 8 | Emerging Markets | INDA | 35.7 | 10% | -0.60% | ILF -4.5% · IEMG +2.6% |
| 9 | Precious Metals | SLV | 34.3 | 0% | +8.01% | GLD +2.9% · GDX +12.1% |
| 10 | Traditional Energy | FCG | 24.6 | 0% | +16.16% | XOP +15.7% · XLE +12.8% |
Technology — XLK
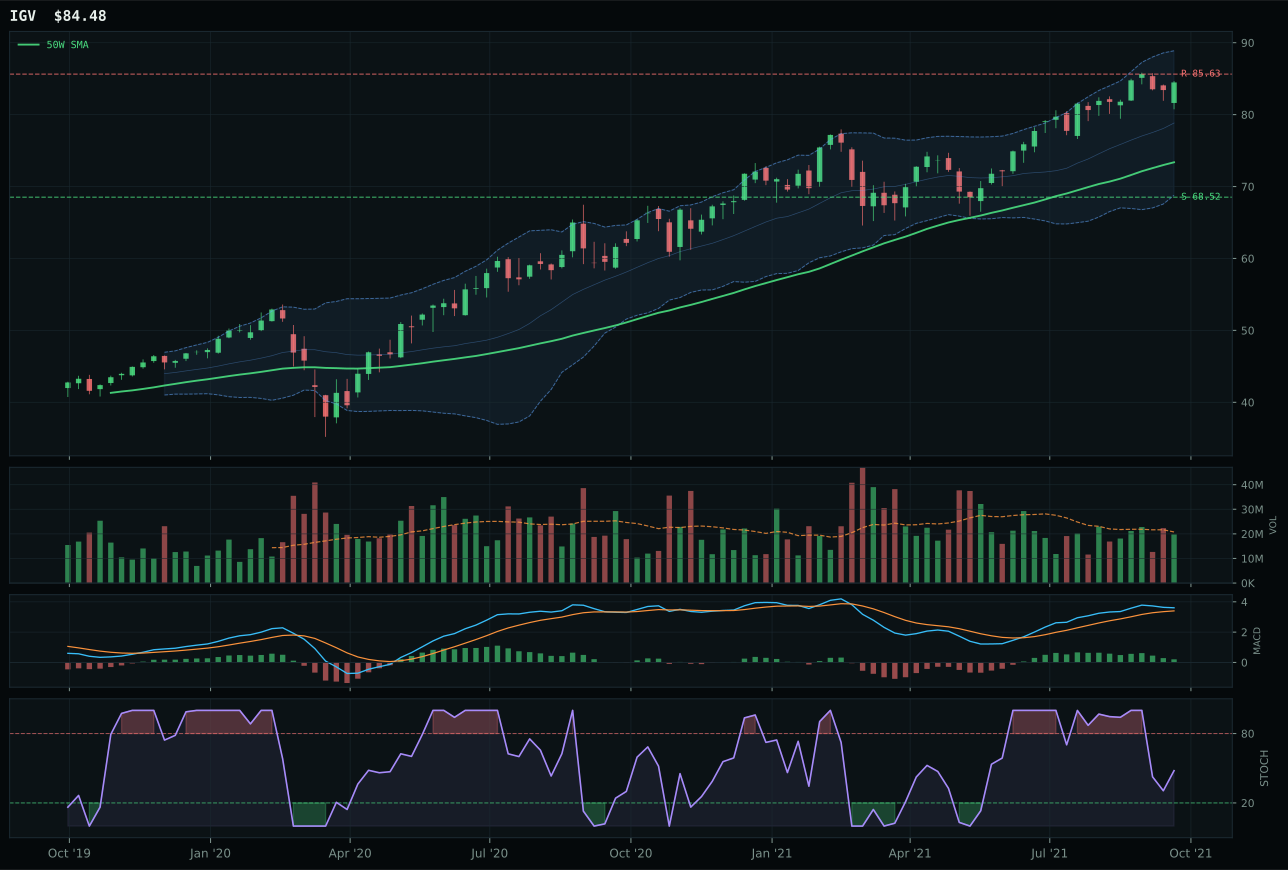
IGV has a vertical extension profile with 4.6% 13-week relative strength versus SPY.
A failed hold above support would weaken the setup.
Actionable but governed by invalidation levels.
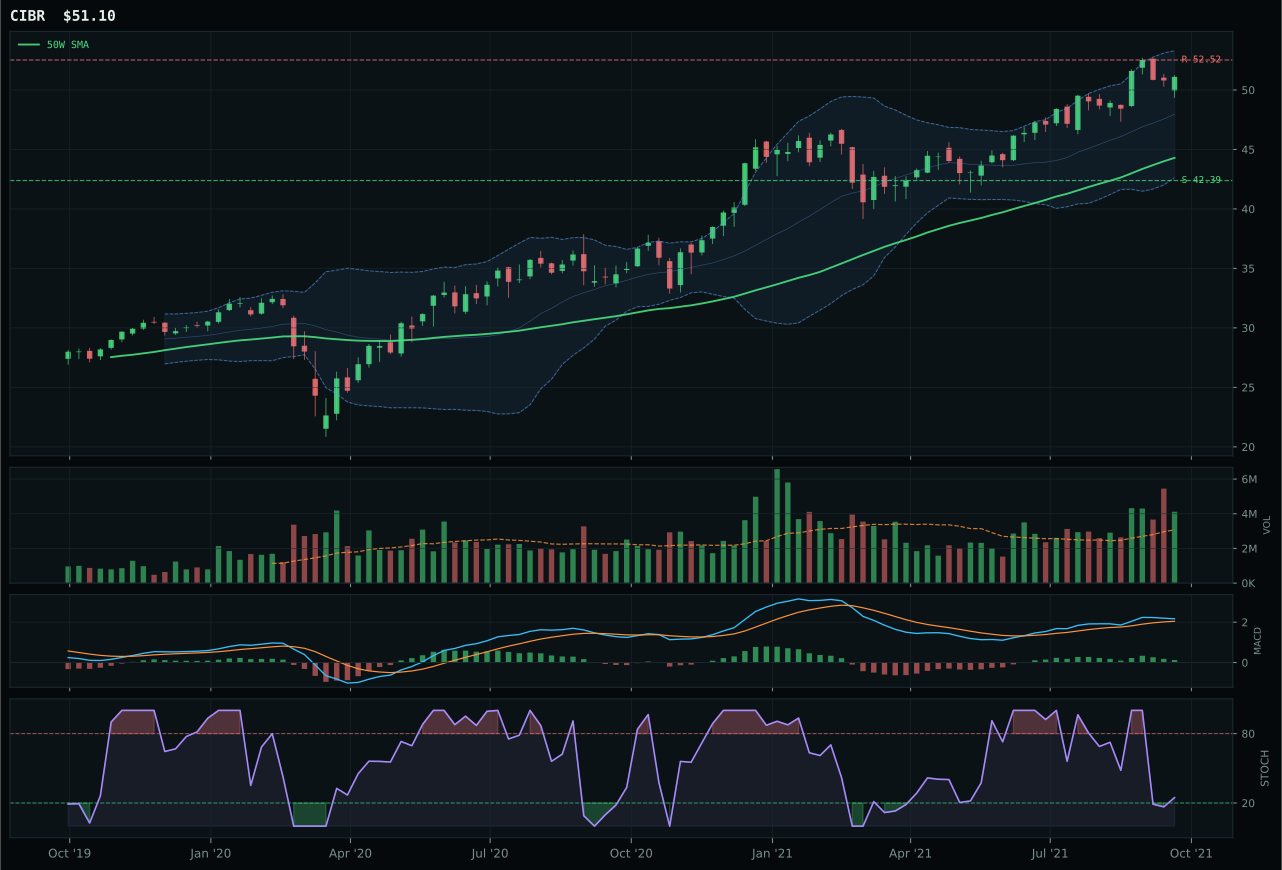
CIBR has a vertical extension profile with 4.0% 13-week relative strength versus SPY.
A failed hold above support would weaken the setup.
Actionable but governed by invalidation levels.
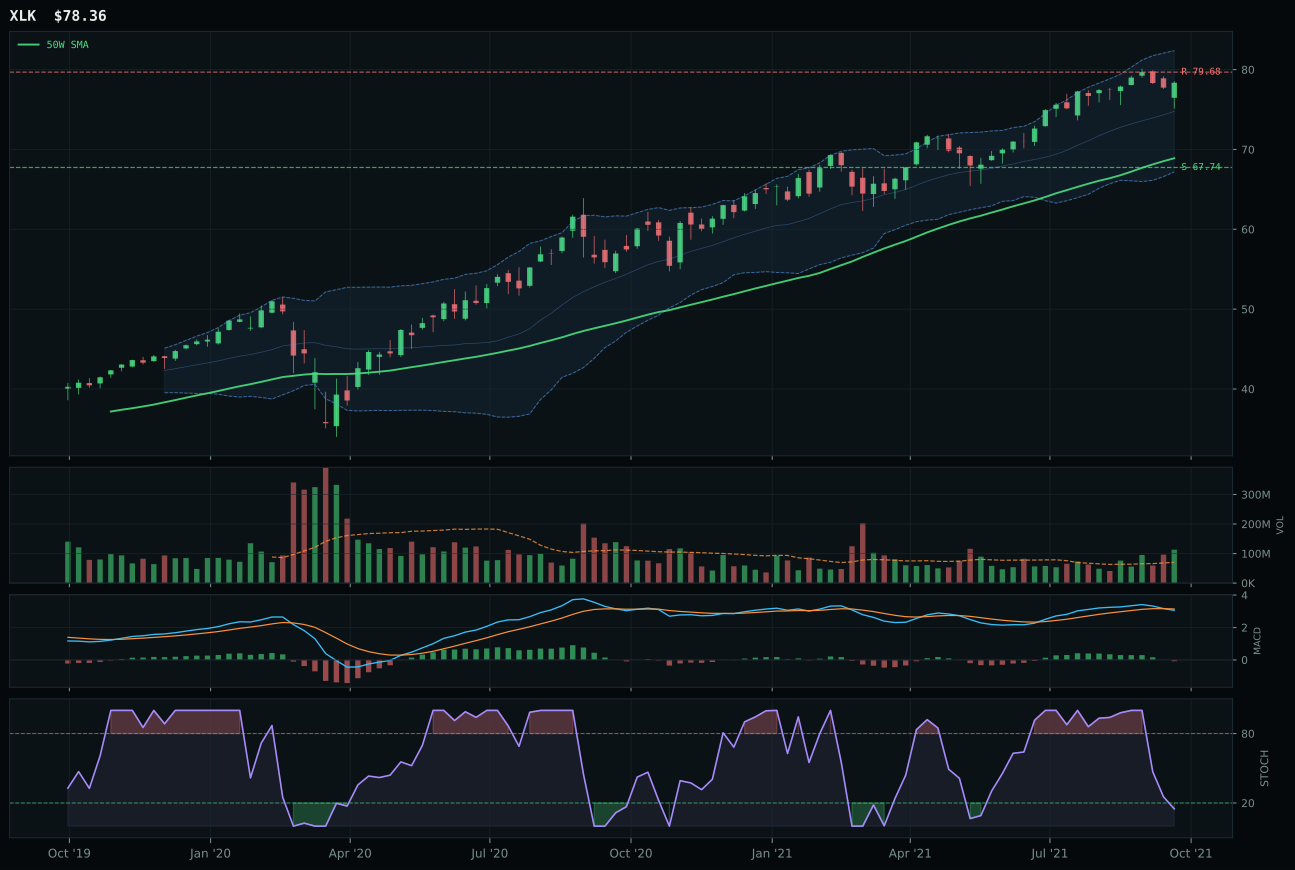
XLK has a neutral structure profile with 3.8% 13-week relative strength versus SPY.
A failed hold above support would weaken the setup.
Actionable but governed by invalidation levels.
XLK wins the category because it combines price strength above both the 50W and 200W with a measured 13.7% distance that avoids the vertical extension trap plaguing its peers. The 3.8% relative strength versus SPY sits in a sweet spot—enough to justify capital allocation without the momentum divergence showing in IGV, which trades at 4.6% RS but suffers a flattening MACD and deteriorating stochastic RSI. XLK's neutral structure with 87.3 compression score and accumulation-level volume at 1.62x the 20W average creates a clean entry setup; IGV's vertical extension and stochastic RSI fall tell you the move is already aging. The trend score of 87.8 reflects genuine breadth leadership rather than narrow, stretched momentum, and the timing score of 62.0 acknowledges the overbought stochastic while the bearish MACD flags risk—a nuanced read that IGV's 40.0 timing score simply misses by staying bullish into deteriorating confirmation.
Technology earns its 10% top-2 slot because the category scored 68.8, ranking among the two highest-scoring eligible categories this week. XLK's macro fit of 72.0 at the category level reflects active tailwinds: liquidity expansion and AI growth sponsorship both carry signal weight, while the Goldilocks regime provides a structural bid that offsets the modest credit stress headwind. The technical evidence of 62% weight drives the decision—price structure, volume sponsorship, and timing quality are observable facts this week, not stale narratives. However, recognize the tension: momentum is positive but MACD is weakening and stochastic RSI is oversold, meaning entry risk has risen since the initial leg up. This allocation works because the risk-adjusted opportunity favors the setup today; deterioration in breadth or volume confirmation would quickly disqualify the category for next week's rebalance.
AI — BOTZ
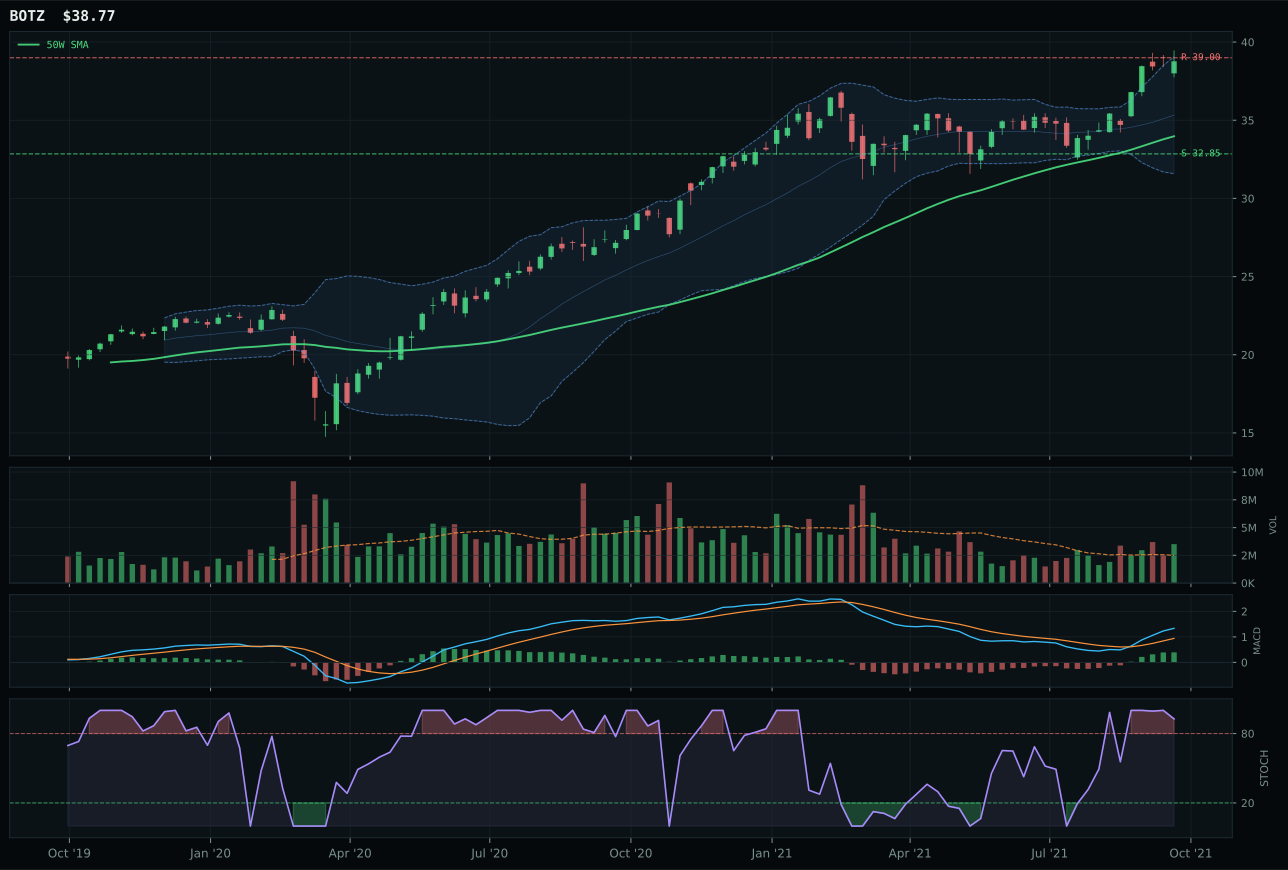
BOTZ has a neutral structure profile with 6.0% 13-week relative strength versus SPY.
A failed hold above support would weaken the setup.
Actionable but governed by invalidation levels.
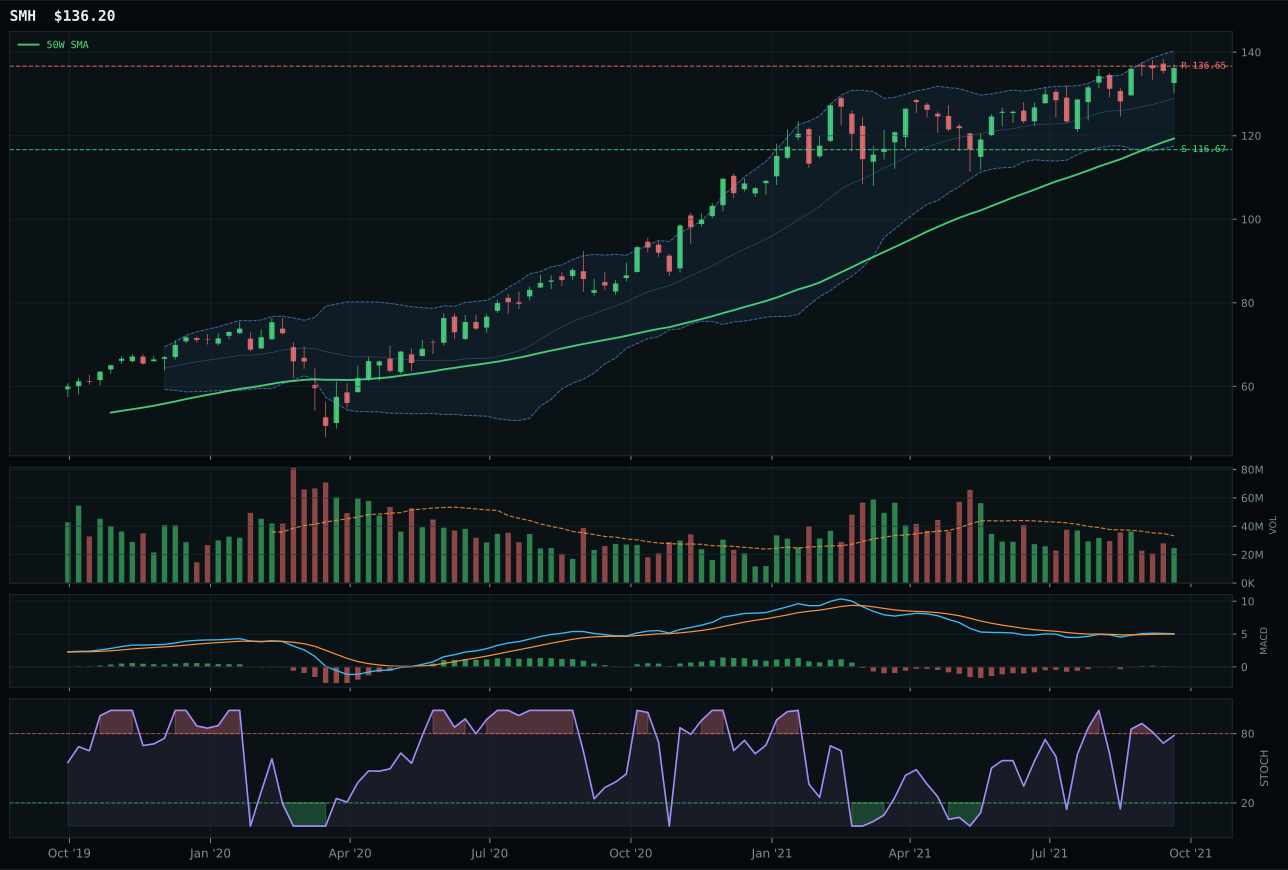
SMH has a neutral structure profile with 3.4% 13-week relative strength versus SPY.
A failed hold above support would weaken the setup.
Actionable but governed by invalidation levels.
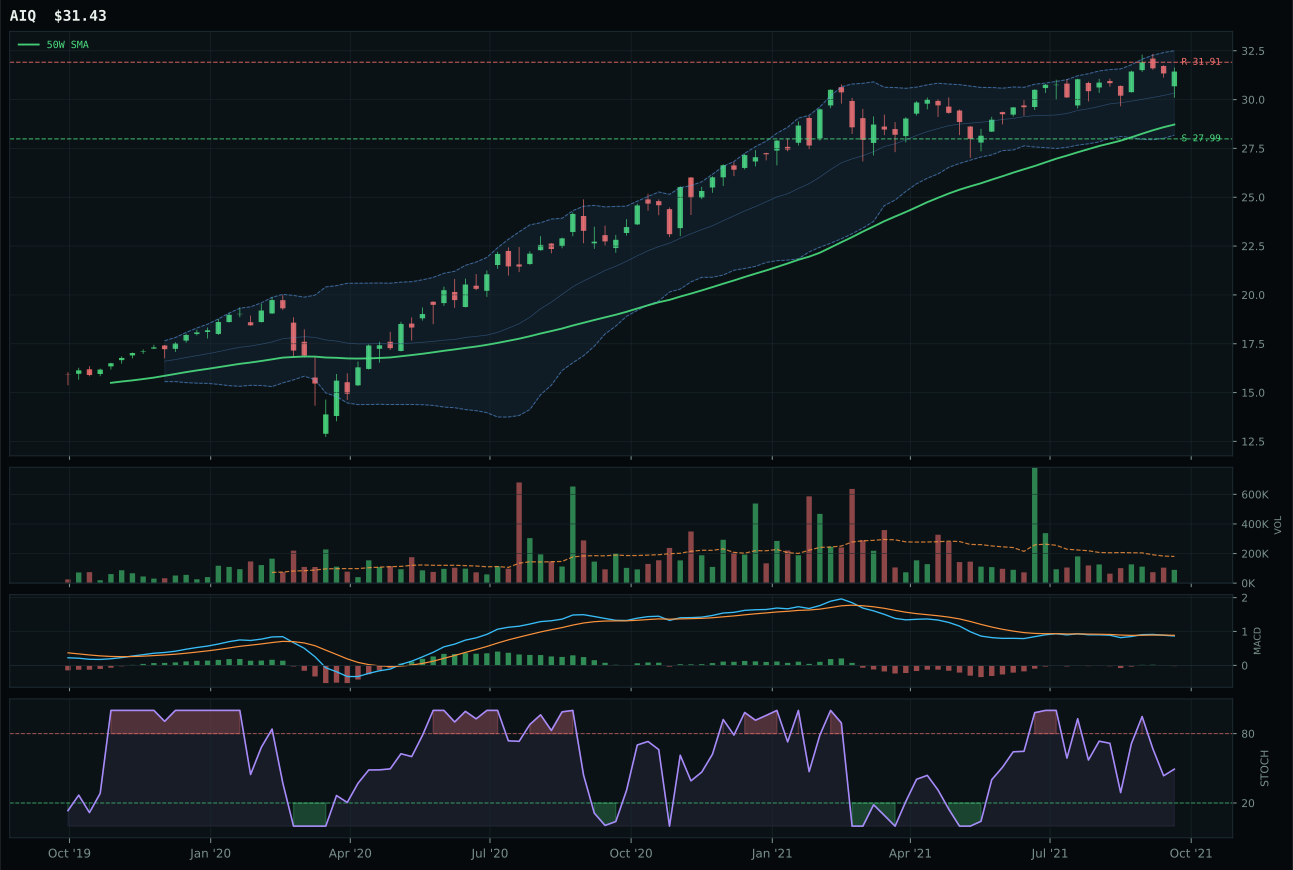
AIQ has a neutral structure profile with -1.0% 13-week relative strength versus SPY.
A failed hold above support would weaken the setup.
Tracked, but not top-2 eligible because: .
BOTZ dominates because it alone delivers a perfect 100.0 trend score—price above both the 50W and 200W with a 0.6% slope and 6.0% SPY-relative strength that shows genuine conviction in the move. The 13W momentum of 10.1% paired with 2.6% category-relative strength creates the rare setup where both absolute and relative trends confirm each other without MACD deterioration; SMH's bullish but flattening MACD and falling stochastic RSI signal momentum is aging despite higher 13W return, and its thin participation at category-low volume tells you accumulation is not sponsoring the move. BOTZ's above-average participation at 1.41x the 20W average marks institutional participation, not retail chase. The 90.9 momentum confirmation score reflects this clean confluence of price, volume, and trend mechanics; SMH's 70.0 reads more like a statistical hangover from prior strength rather than active buying pressure this week.
AI earns its 10% top-2 allocation because the category scored 67.5, securing the second-highest eligible final score. BOTZ's technical evidence of 74.7 and strong macro fit of 76.0 align in a Goldilocks regime where liquidity expansion and AI growth sponsorship create tailwinds; credit stress is active but subordinate at -8 versus +14 for AI growth. The risk is real—stochastic RSI is overbought rolling over and price sits just 0.6% from resistance—but the category's macro signal is strong enough to justify allocation despite the extended setup. The upside to resistance is negative on a price-only basis, making this an execution-dependent trade: volume confirmation must hold for the setup to work. This is a top-2 call on momentum and macro alignment, not on valuation or long-term fundamentals; expect rebalancing if volume thins or MACD rolls over decisively.
Industrial Metals — COPX
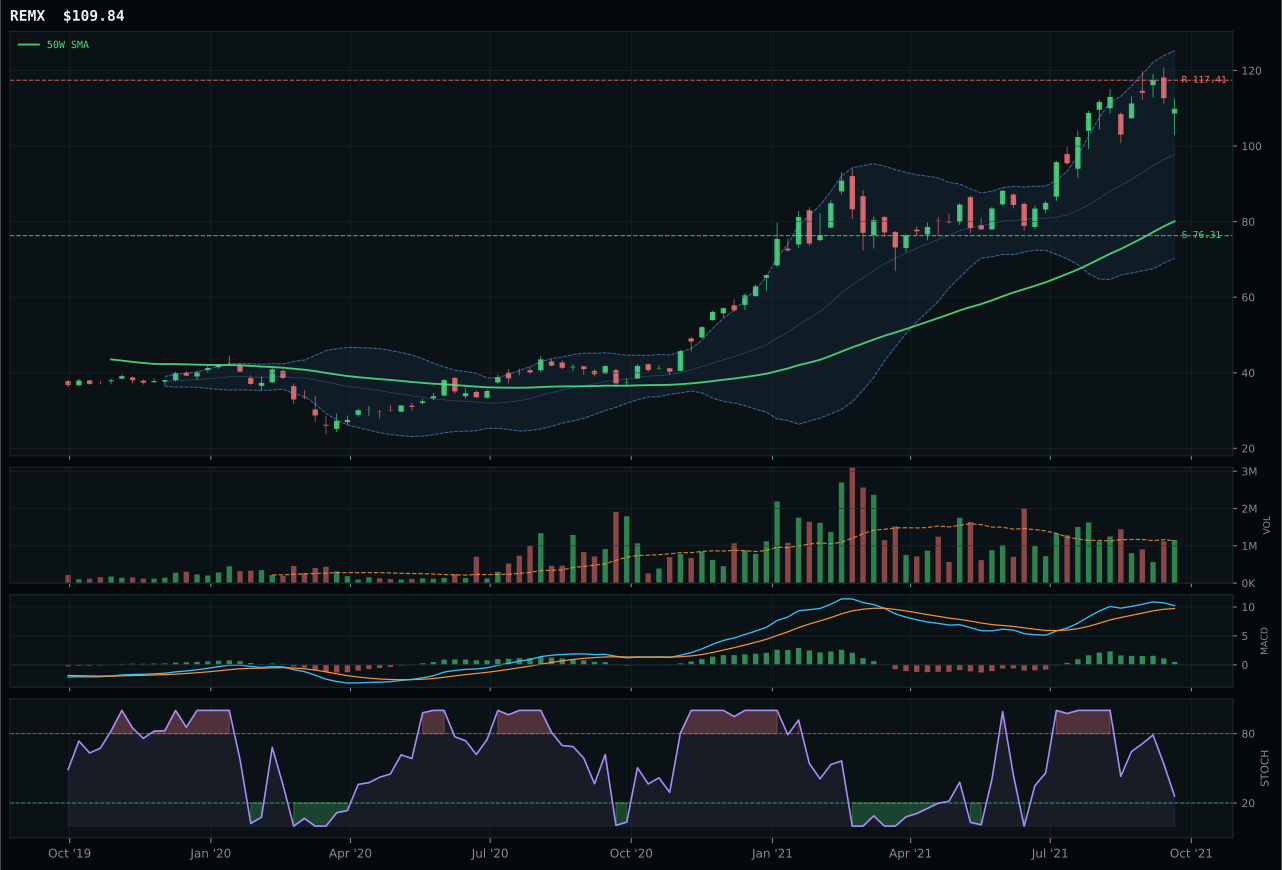
REMX has a vertical extension profile with 27.6% 13-week relative strength versus SPY.
A failed hold above support would weaken the setup.
Actionable but governed by invalidation levels.
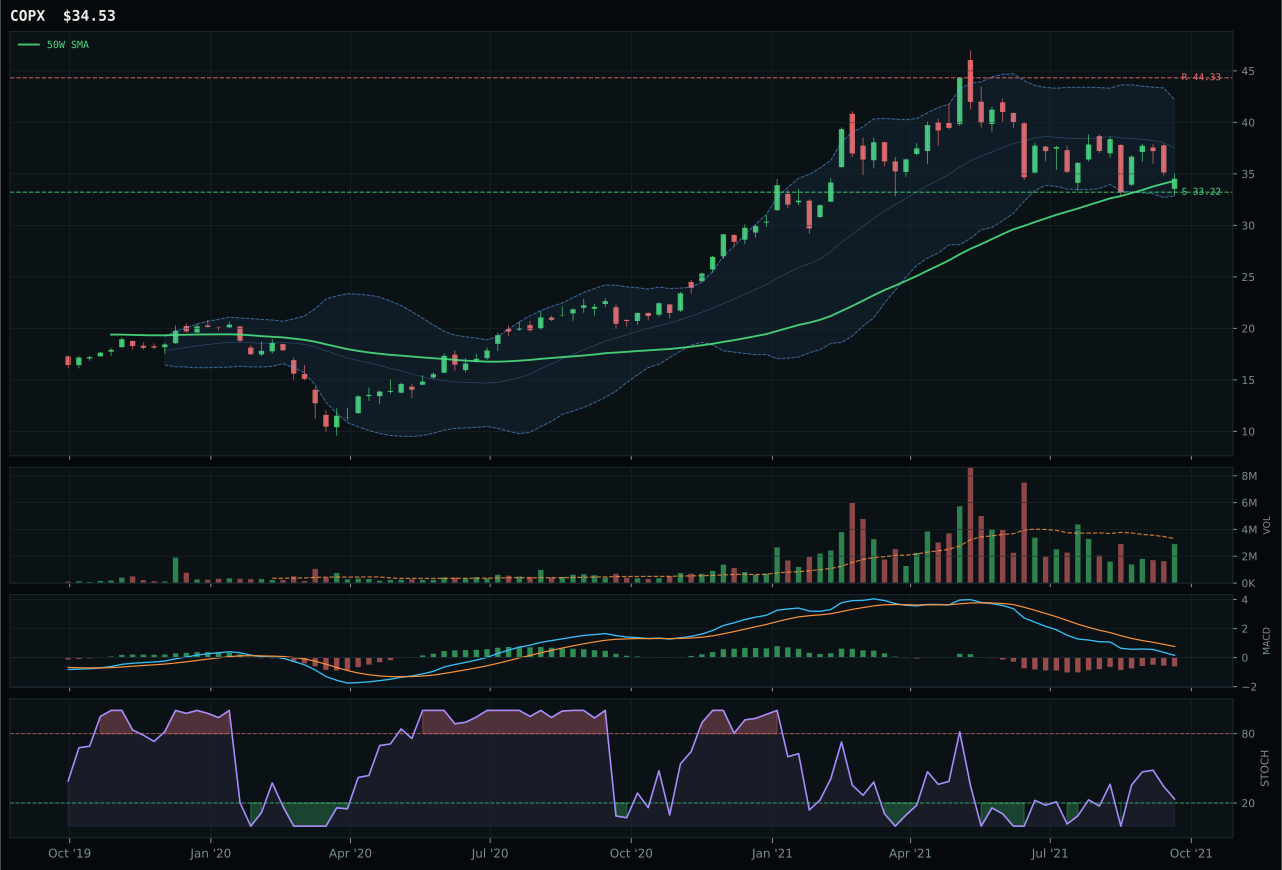
COPX has a pullback into support profile with -12.6% 13-week relative strength versus SPY.
A failed hold above support would weaken the setup.
Actionable but governed by invalidation levels.
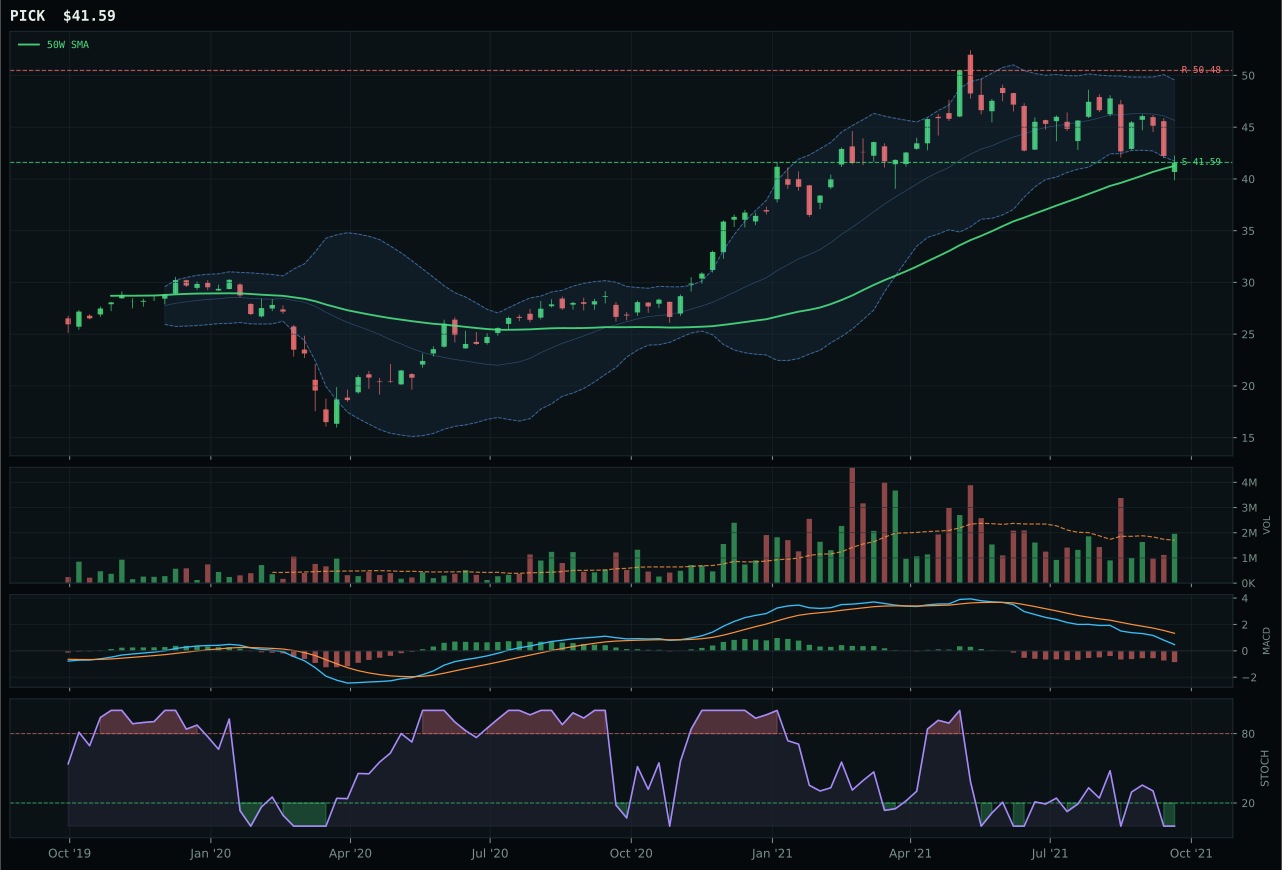
PICK has a pullback into support profile with -12.7% 13-week relative strength versus SPY.
A failed hold above support would weaken the setup.
Actionable but governed by invalidation levels.
COPX wins decisively against REMX by choosing pullback-into-support over vertical extension in a macro regime that rewards patience over momentum. COPX sits at just 0.6% from the 50W with perfect 100.0 timing, stochastic RSI falling at 0.23, and MACD bearish but improving—this is a textbook setup where every buyer at these prices paid full price, creating a defined invalidation at 33.22 support. REMX's 37.1% extension above the 50W and momentum confirmation of 100.0 feel aggressive, but the bullish-but-flattening MACD and falling stochastic RSI reveal the setup is maturing: the move has already attracted every buyer willing to chase, and late entries face 22.1% downside to support with minimal definition. COPX's 98.0 risk-reward versus REMX's 47.6 quantifies this difference in edge. The category's macro fit of 79.0 is strong enough to validate both, but COPX's risk-adjusted positioning wins the allocation decision within the category.
Industrial Metals earns 5% tier-2 allocation on a score of 60.9, benefiting from the strongest category-level macro fit at 79.0. Metals scarcity at +14 and commodity breadth positive at +10 provide genuine tailwinds, and Goldilocks regime supports real asset allocation; credit stress at -7 is the only headwind. COPX's technical evidence of 60.6 is solid but not exceptional, and the momentum confirmation of 12.5 shows weakness despite the strong trend; the move up in copper prices has stalled and the setup now depends on support holding. This allocation works because the macro case for industrial metals scarcity is the strongest after Technology and AI among all eligible categories, but understand that it's a macro play, not a technical momentum chase. If copper breaks support at 33.22, this category loses its case immediately—the macro story does not save a broken chart. Maintain this position as long as support holds; tighten your stop if volume participation drops below 1.0x the 20W average, signaling the accumulation story is stalling.
Agriculture & Livestock — MOO
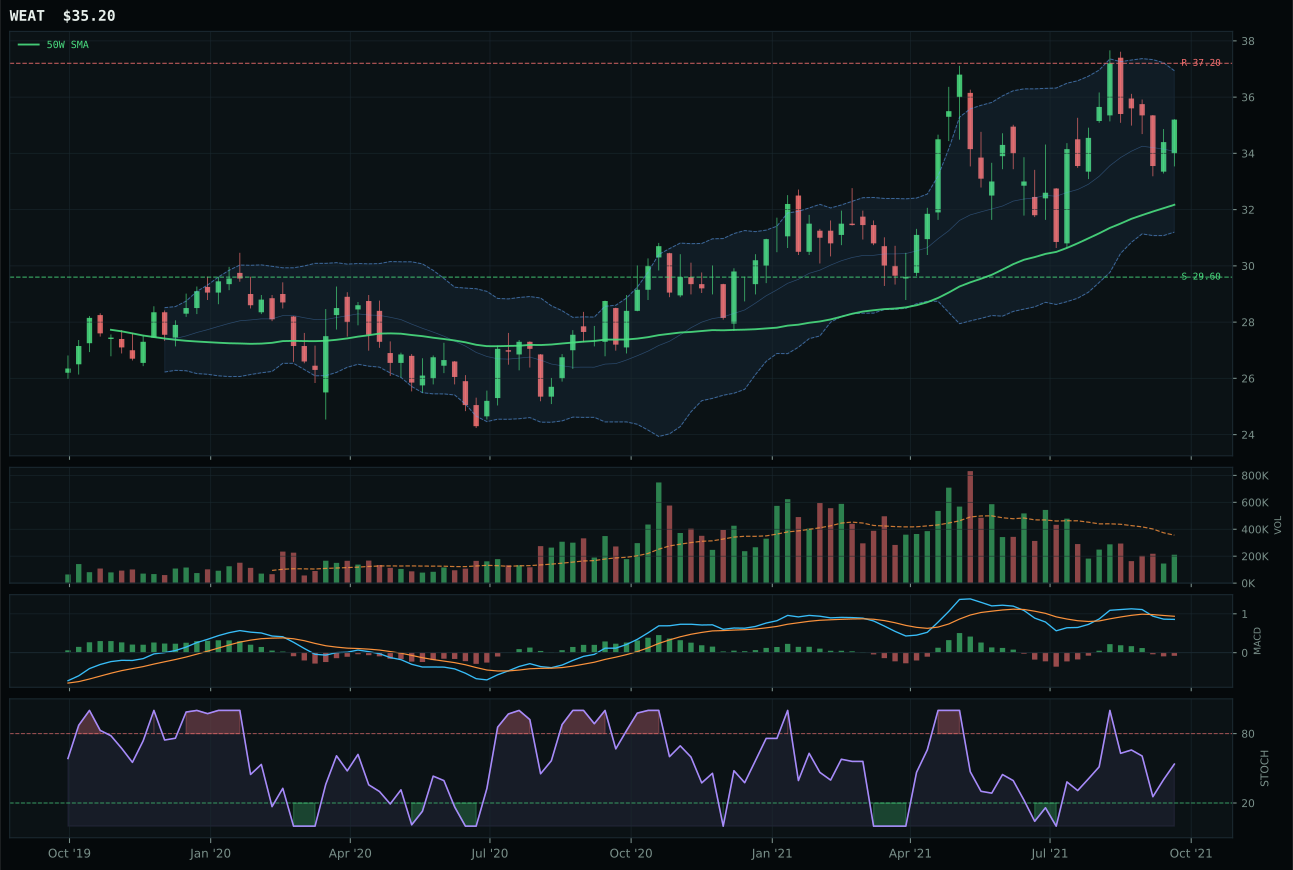
WEAT has a neutral structure profile with 6.6% 13-week relative strength versus SPY.
A failed hold above support would weaken the setup.
Actionable but governed by invalidation levels.
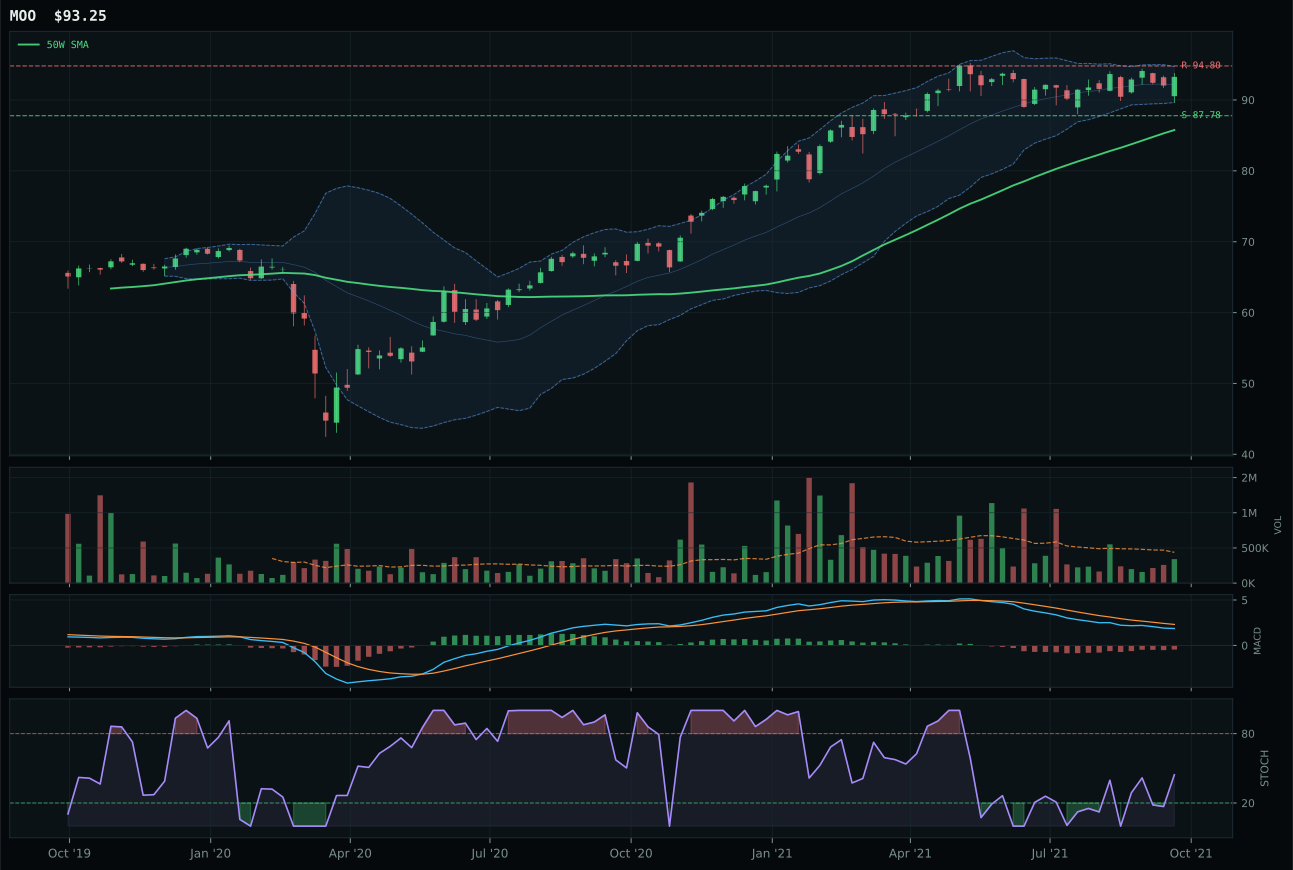
MOO has a neutral structure profile with -2.1% 13-week relative strength versus SPY.
A failed hold above support would weaken the setup.
Actionable but governed by invalidation levels.
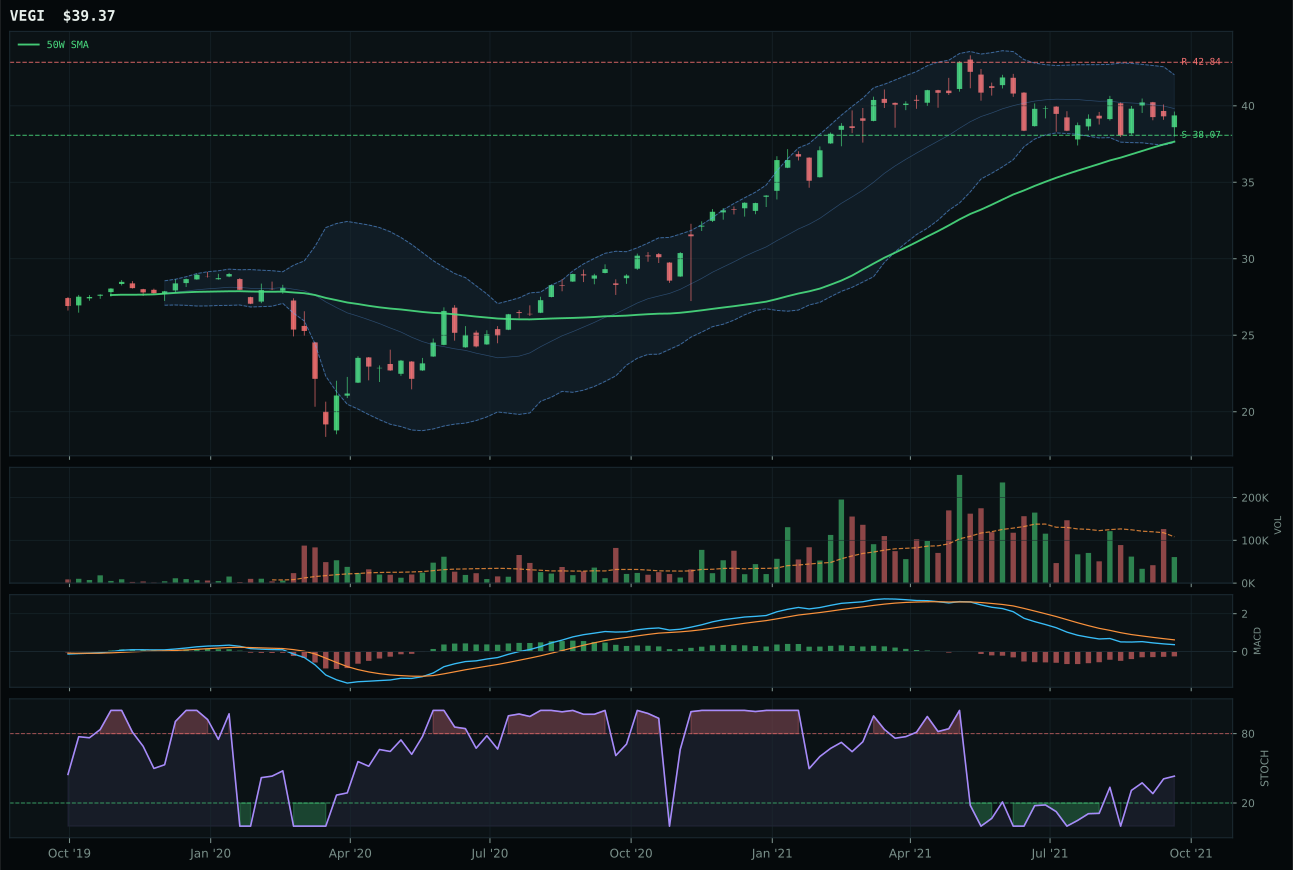
VEGI has a pullback into support profile with -5.1% 13-week relative strength versus SPY.
A failed hold above support would weaken the setup.
Tracked, but not top-2 eligible because: .
MOO edges WEAT in a margin-of-error competition because its timing score of 83.0 versus 70.0 reflects superior stochastic RSI action—rising mid-zone at 0.44 versus falling/neutral—and a bearish MACD that is improving rather than weakening. The 8.7% distance from the 50W sits in the productive range where strength is real but not stretched, and MOO's category-relative strength of 0.0% versus WEAT's 8.7% reveals the truth: WEAT's strong 13W return of 10.7% is primarily from grains, not from agribusiness breadth. MOO trades with neutral volume at 0.78x the 20W average, which is less aggressive than WEAT's thin participation but reflects the reality that this category lacks conviction. The score gap of only 1.3 points signals a weak category overall, and MOO wins because it avoids MACD deterioration while accepting similar lack of volume sponsorship.
Agriculture & Livestock receives 5% tier-2 allocation with a low category score of 42.4, placing it in the middle tier of eligible categories. The macro fit of 55.0 shows balanced opposing forces: real asset sponsorship and commodity breadth positive are offset by disinflation pressure at -8, reducing net macro tailwind. MOO's 66.7 technical evidence reflects decent trend setup but weak momentum confirmation and neutral volume, meaning this allocation is a residual holding rather than a conviction trade. The placement here depends on what else is available; if higher-conviction categories fill the top-2 and tier-2 allocations, agriculture survives as filler. However, recognize the conditional nature: breaching support at 87.78 would quickly invalidate the setup, and the lack of volume sponsorship means any move lower could accelerate without institutional participation to catch it. This is a hold-because-setup-is-defined trade, not a buy-because-macro-is-good trade.
Utilities & Infrastructure — IGF
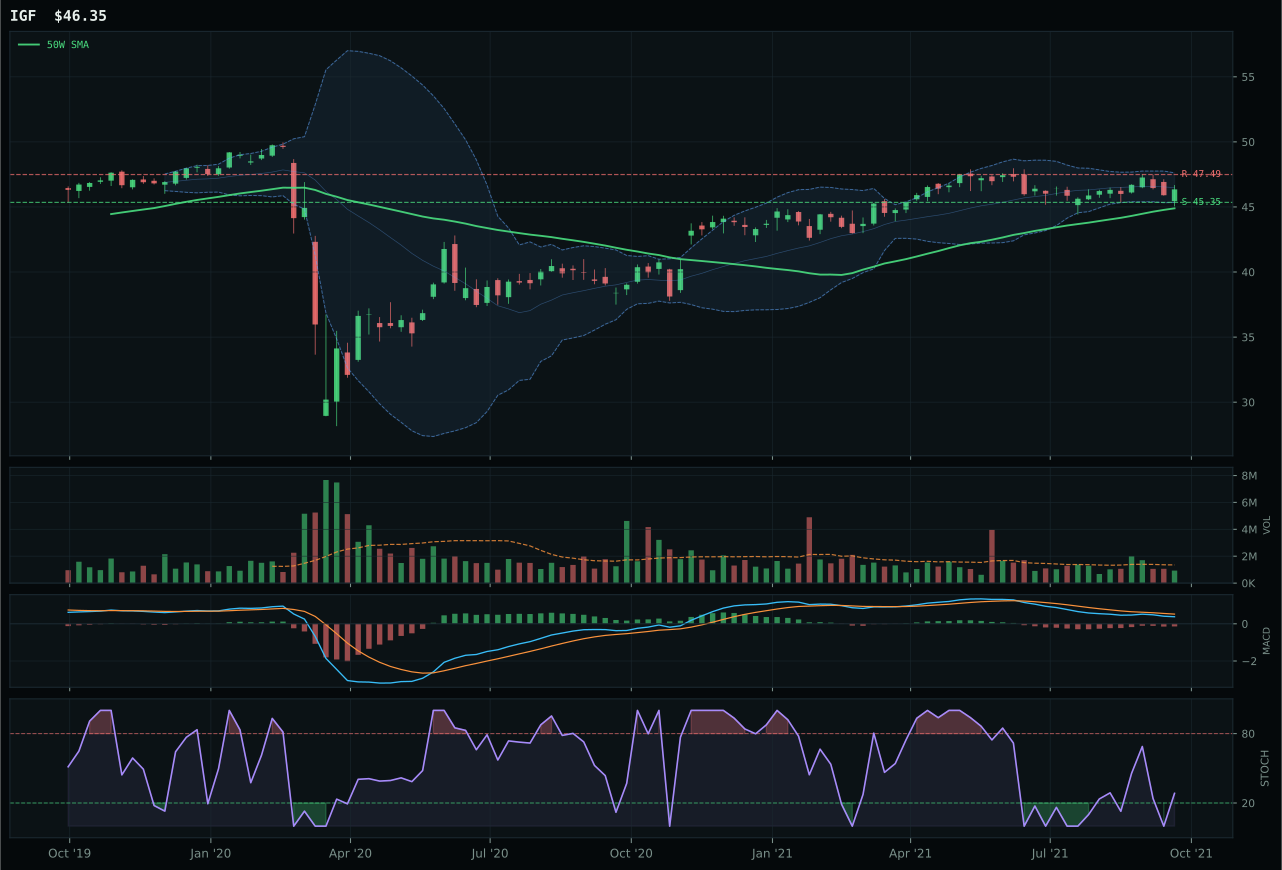
IGF has a pullback into support profile with -4.2% 13-week relative strength versus SPY.
A failed hold above support would weaken the setup.
Actionable but governed by invalidation levels.
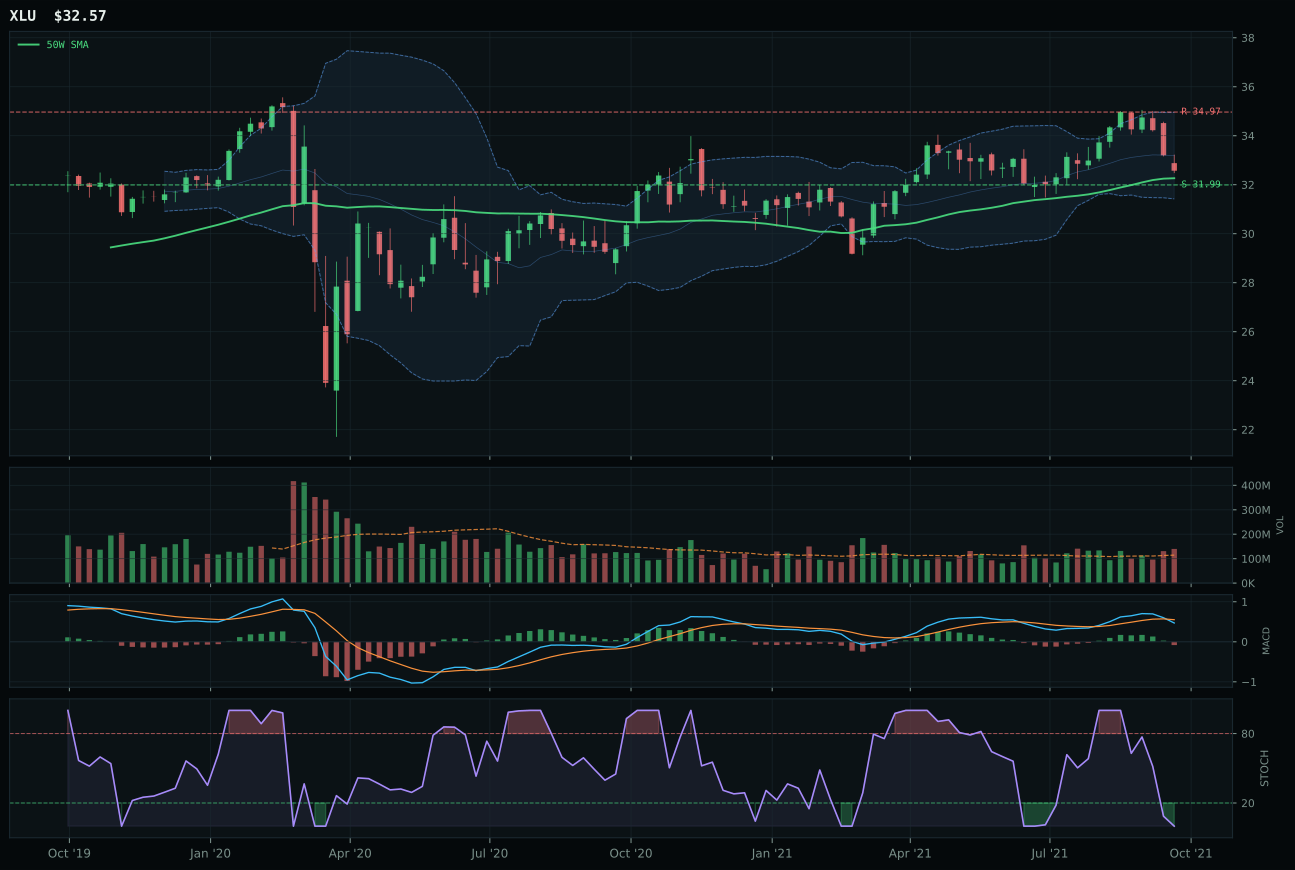
XLU has a pullback into support profile with -2.2% 13-week relative strength versus SPY.
A failed hold above support would weaken the setup.
Actionable but governed by invalidation levels.
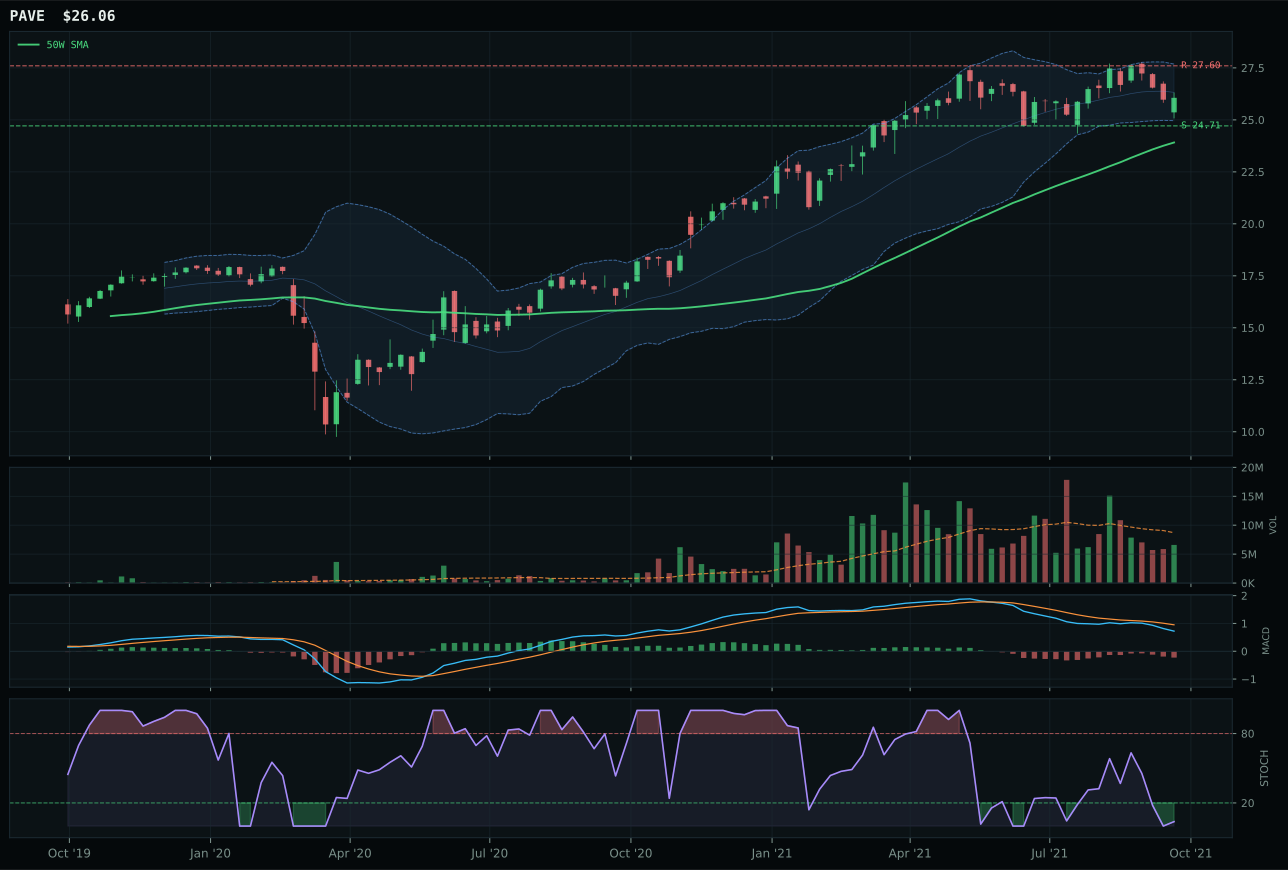
PAVE has a neutral structure profile with -3.3% 13-week relative strength versus SPY.
A failed hold above support would weaken the setup.
Actionable but governed by invalidation levels.
IGF wins against XLU in a category where both offer similar pullback-into-support structures but IGF's timing advantage drives the decision. IGF's 100.0 timing score and stochastic RSI at 0.28 (falling/neutral) with just 3.2% distance from the 50W creates a tighter entry than XLU's oversold stochastic RSI at the far lower level, which typically marks exhaustion rather than opportunity. IGF's bearish MACD is improving while XLU's is weakening, adding directional edge despite both sitting in supportable zones. XLU scores 81 composite versus IGF's 78, and its 98.0 risk-reward crushes IGF's 64.6, but in a category lacking volume sponsorship (IGF's thin participation at 0.69x, XLU's above-average), timing and MACD direction matter more than theoretical risk-reward. The -4.2% SPY-relative for IGF versus -2.2% for XLU is negligible, so the split decision rests on setup quality: IGF's rising timing setup edges XLU's falling timing setup.
Utilities & Infrastructure receives 5% tier-2 allocation on a score of 42.2, placing it in the middle tier of eligible categories. The macro fit of 60.0 reflects disinflation pressure at +6 and a Transition/Mixed regime contribution of +4, making utilities the defensive asset in the portfolio—not exciting, but functional. IGF's technical evidence of 67.3 is solid but not exceptional, and the momentum confirmation of 37.2 shows weakness; this is a low-volatility hold for portfolio ballast, not a conviction position. The thin participation at 0.69x the 20W average for IGF signals passive indexing rather than active accumulation, meaning the category lacks sponsorship. This allocation exists because defined-support setups in low-vol categories have value in a Goldilocks regime where they protect downside without requiring perfect timing. However, this is your last-to-exit category if risk increases; if credit stress becomes active or Goldilocks breaks, infrastructure holdings tie up capital that would be better deployed in growth categories. Monitor support at 45.35; if broken, this allocation loses its tactical justification and should be replaced with stronger opportunities.
Nuclear Energy — URNM
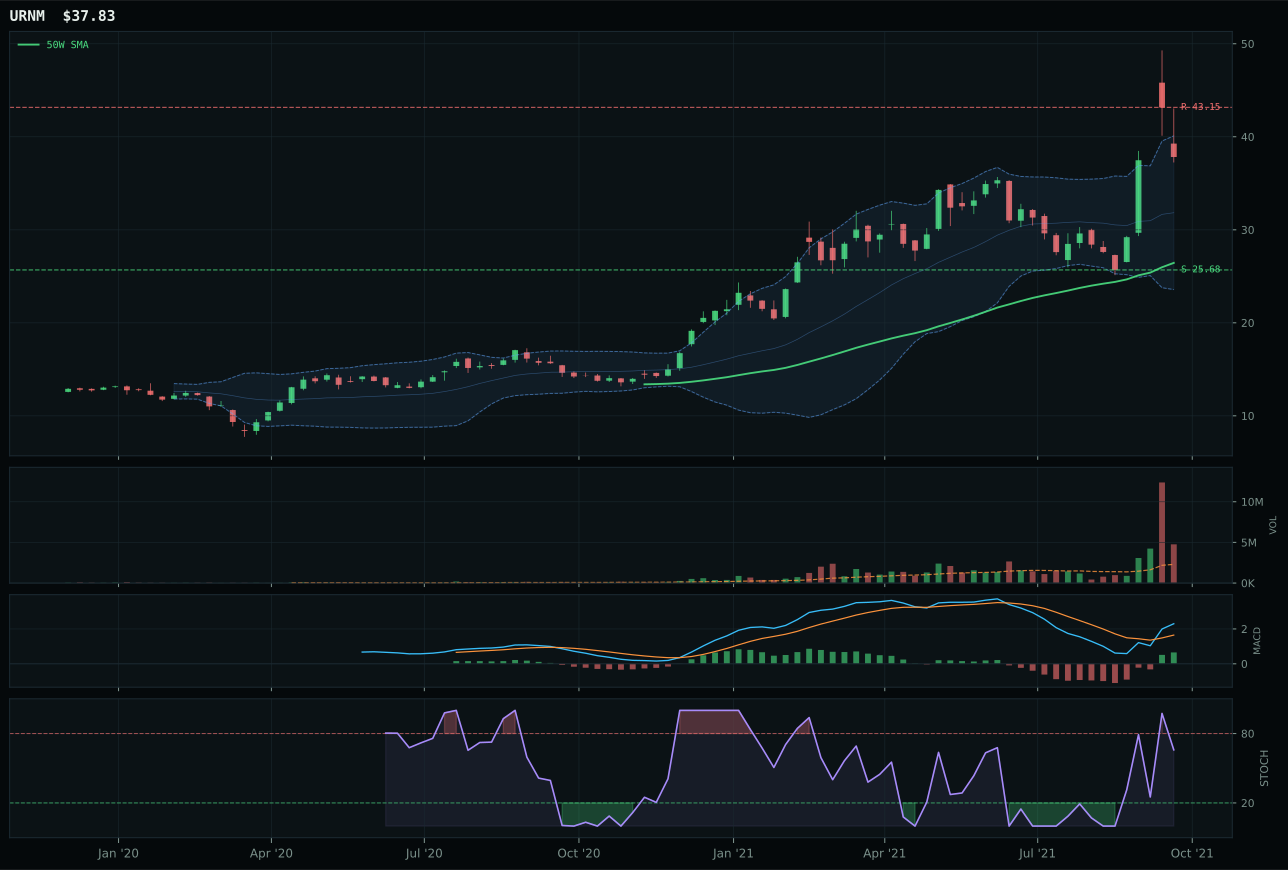
URNM has a vertical extension profile with 13.4% 13-week relative strength versus SPY.
A failed hold above support would weaken the setup.
Actionable but governed by invalidation levels.
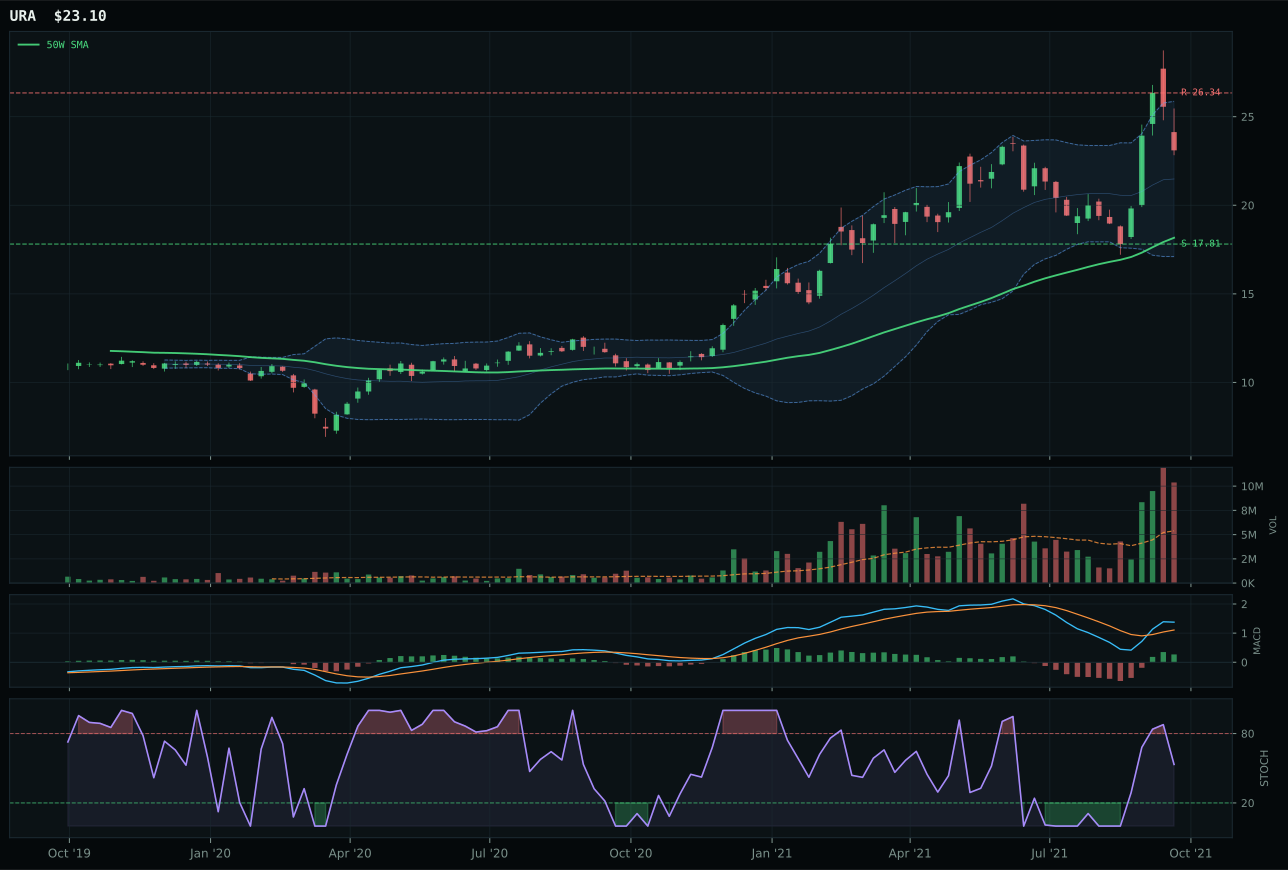
URA has a vertical extension profile with 0.5% 13-week relative strength versus SPY.
A failed hold above support would weaken the setup.
Actionable but governed by invalidation levels.
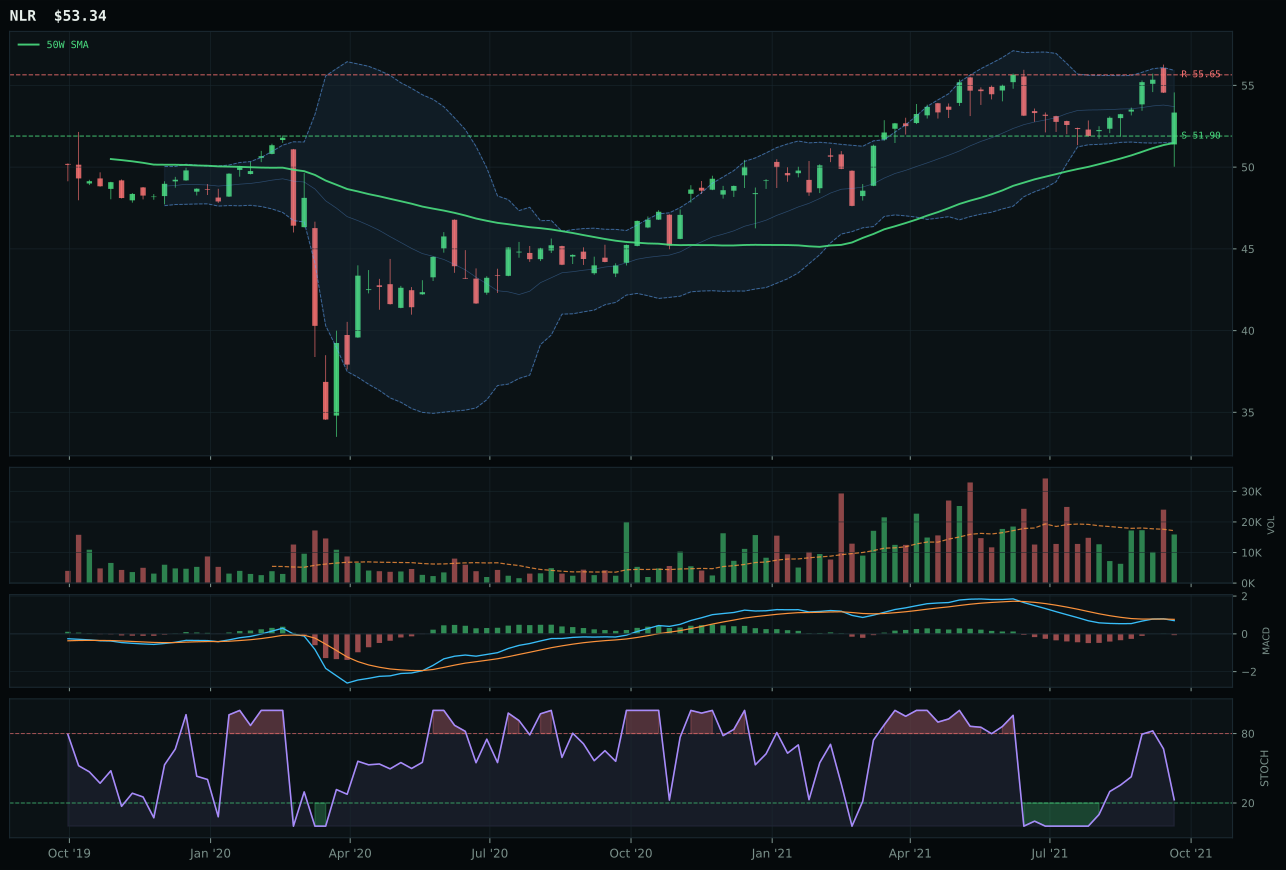
NLR has a pullback into support profile with -4.0% 13-week relative strength versus SPY.
A failed hold above support would weaken the setup.
Tracked, but not top-2 eligible because: .
URNM wins by trading strength against URA's weakness on relative basis, though this is a pyrrhic victory in a setup where both contenders are extended and distribution-pressure volume is flashing caution. URNM's 41.6% extension from the 50W is brutal for timing (53.0/100), but its 100.0 momentum confirmation and 13.4% SPY-relative strength show that if extension is occurring, it at least has conviction and category dominance: the 12.9% category-relative strength of +12.9 versus URA's 0.0% proves buyers are choosing URNM. URA's 100.0 trend score and thin -4.0% SPY-relative lag reflect technical purity without institutional sponsorship; at 0.5% category RS, URA is not winning the category competition. URNM's 2.07x volume distribution pressure is the warning signal—high volume on an extended move typically precedes pullback—but within a bad basket, URNM's momentum and relative strength edge justifies the selection over stalled URA.
Nuclear Energy receives 5% tier-2 allocation despite a weak 42.0 category score because it qualifies as eligible and fills the tier-2 slot. The macro fit of 57.0 reflects real asset sponsorship at +7 and AI growth sponsorship at +5, offsetting credit stress at -5; the case is real but modest compared to Industrial Metals' 79.0 or Technology's 72.0. URNM's technical evidence of 31.6 is alarming—this is a deeply extended setup with distribution-pressure volume and a 100.0 momentum confirmation that typically leads reversals. The timing of 53.0 and risk-reward of 26.7 tell the truth: 41.6% above the 50W with 47.3% downside to support means this setup has asymmetric risk to the downside. Allocate to this category only because the macro case for uranium scarcity has merit if energy demand accelerates, but understand that this is a momentum trade into extended setup, not a value or mean-reversion opportunity. Risk management is critical here; if volume participation drops below 1.5x the 20W average or stochastic RSI rolls over decisively, exit the position immediately rather than waiting for support to be tested.
Defense & Aerospace — ITA
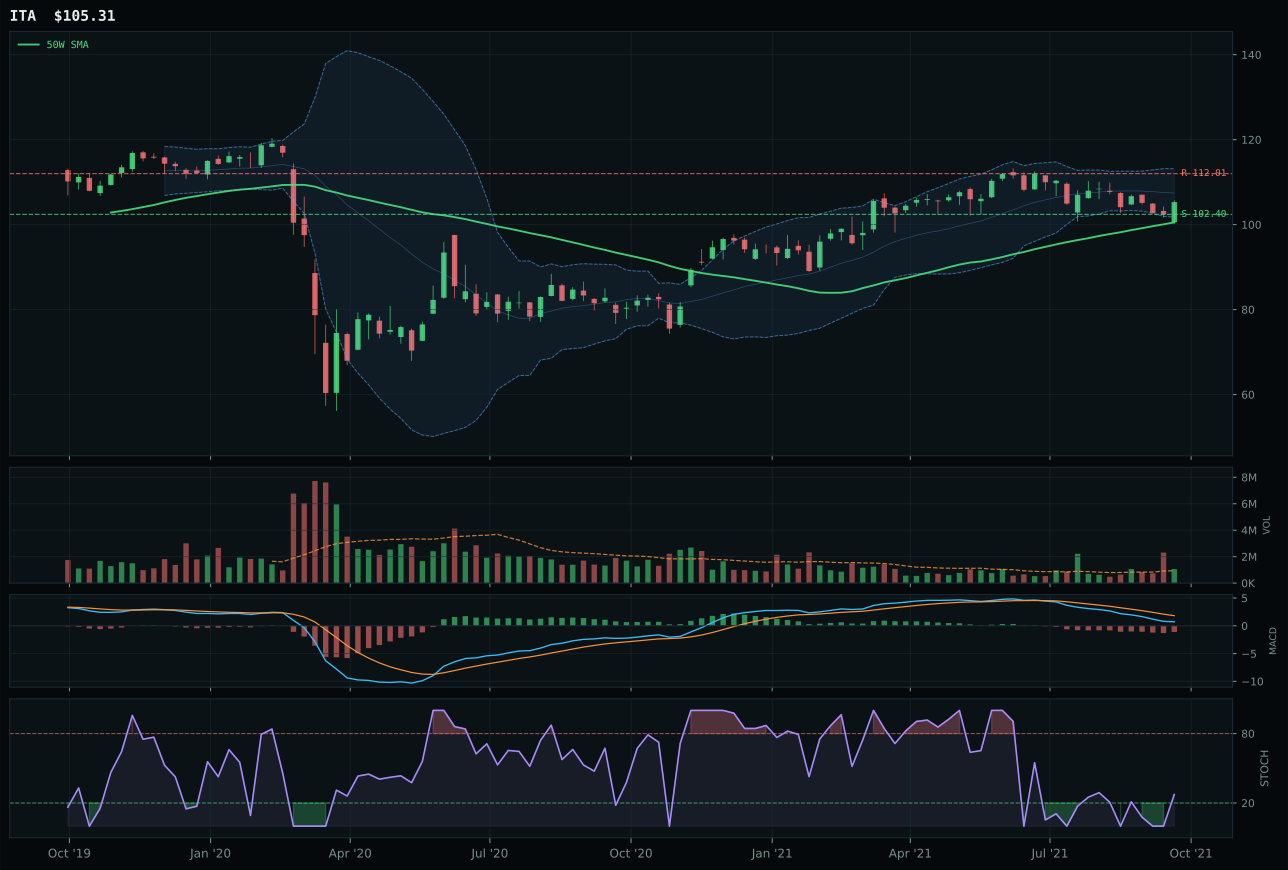
ITA has a pullback into support profile with -10.0% 13-week relative strength versus SPY.
A failed hold above support would weaken the setup.
Actionable but governed by invalidation levels.
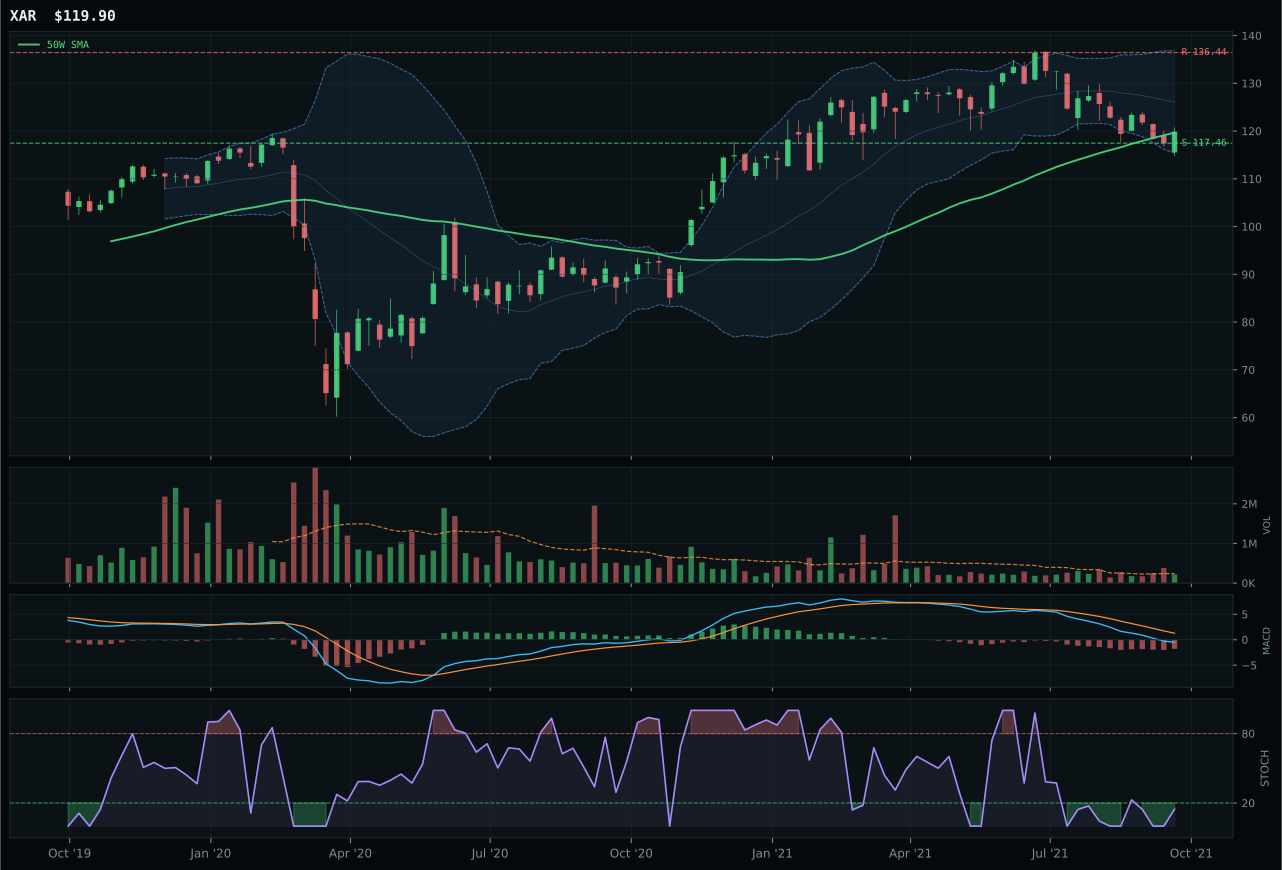
XAR has a pullback into support profile with -16.2% 13-week relative strength versus SPY.
A failed hold above support would weaken the setup.
Actionable but governed by invalidation levels.
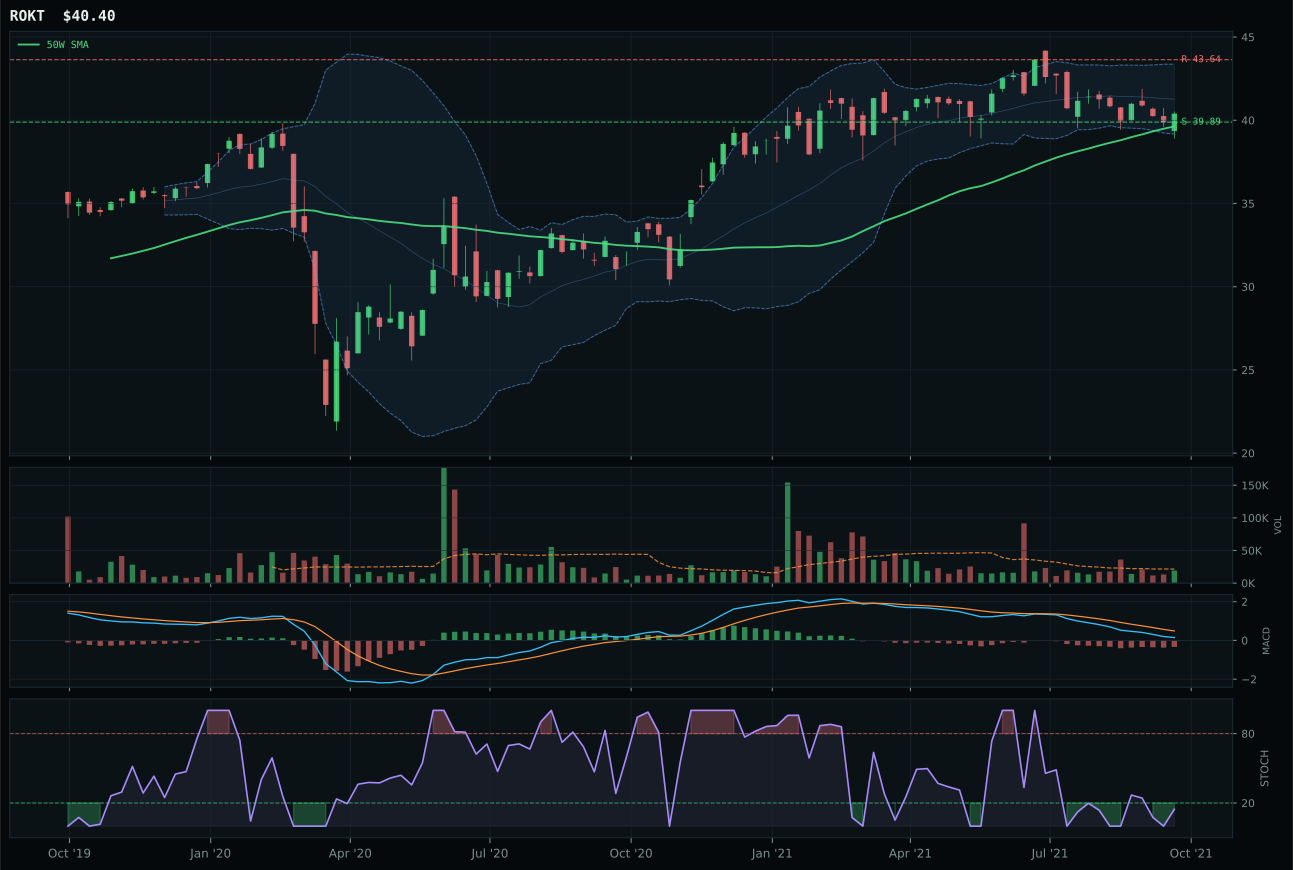
ROKT has a pullback into support profile with -11.5% 13-week relative strength versus SPY.
A failed hold above support would weaken the setup.
Tracked, but not top-2 eligible because: .
ITA wins a narrow race because its pullback into support setup offers superior risk management against two runners-up trading on hope rather than confirmation. The 100.0 timing score reflects the essential insight: price is just 4.8% from the 50W with MACD bearish but stochastic RSI rising mid-zone, creating a defined decision point at support 102.40 where invalidation is clean. ITA's 82.9 risk-reward score crushes XAR's 90.0 because ITA offers 2.8% downside to support versus a 6.0% upside cushion, while XAR dangles 90.0 risk-reward on a far more stretched -16.2% SPY-relative basis that lacks category conviction. The 1.4% category-relative strength advantage over XAR's -4.7% says buyers are choosing ITA, and above-average participation at 1.14x the 20W confirms sponsorship. Neither competitor has the volume profile or relative momentum to challenge this decision.
Defense & Aerospace receives 5% tier-2 allocation despite a weak 37.5 category score because it qualified as eligible and ranked above the zero-allocation threshold. The macro fit of 55.0 reflects a neutral stance—no descriptor profile strongly favors defense cyclicality in a Goldilocks regime where growth and technology are better sponsored. ITA's technical evidence of 43.2 is modest, but the 100.0 timing and 82.9 risk-reward create an asymmetric setup: the cost of being wrong is small relative to the potential bounce from support. This is a tactical hold that works only if support holds; breach 102.40 and the case evaporates immediately. Rank this category behind growth, AI, and high-conviction commodity scarcity plays, but the defined-risk entry justifies keeping capital at work rather than sitting in cash waiting for a better setup.
Emerging Markets — INDA
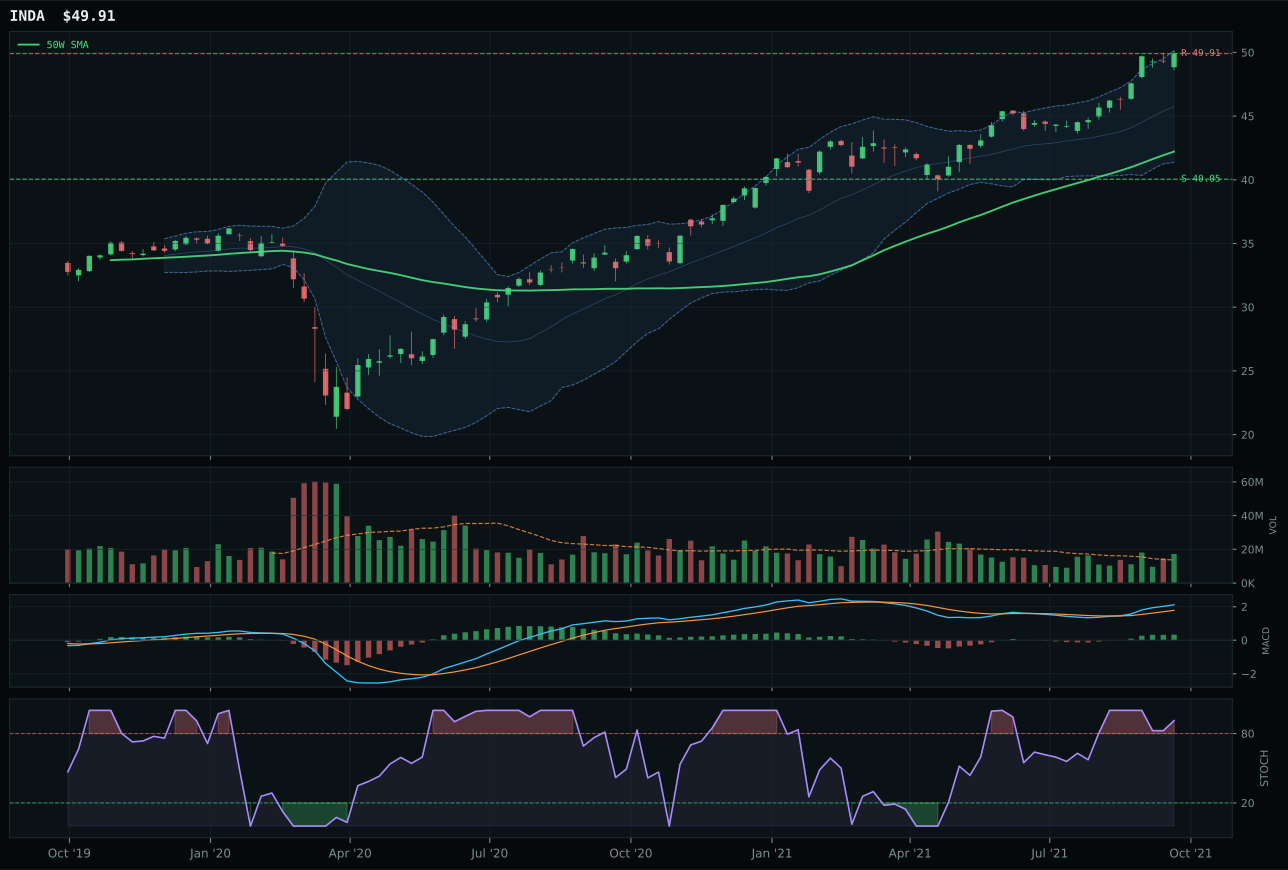
INDA has a vertical extension profile with 8.2% 13-week relative strength versus SPY.
A failed hold above support would weaken the setup.
Actionable but governed by invalidation levels.
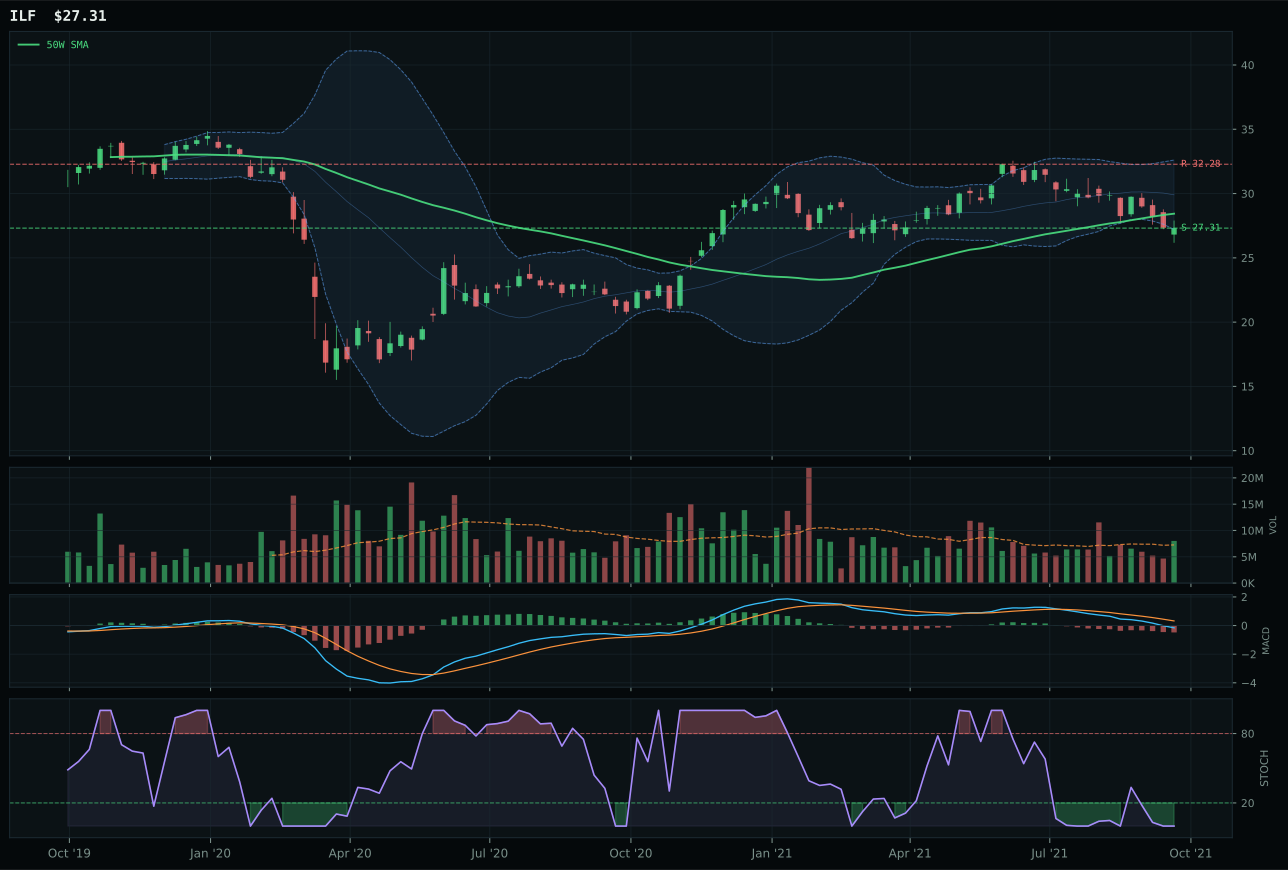
ILF has a pullback into support profile with -18.3% 13-week relative strength versus SPY.
Extension and support failure are the main tactical risks.
Tracked, but not top-2 eligible because: structurally broken.
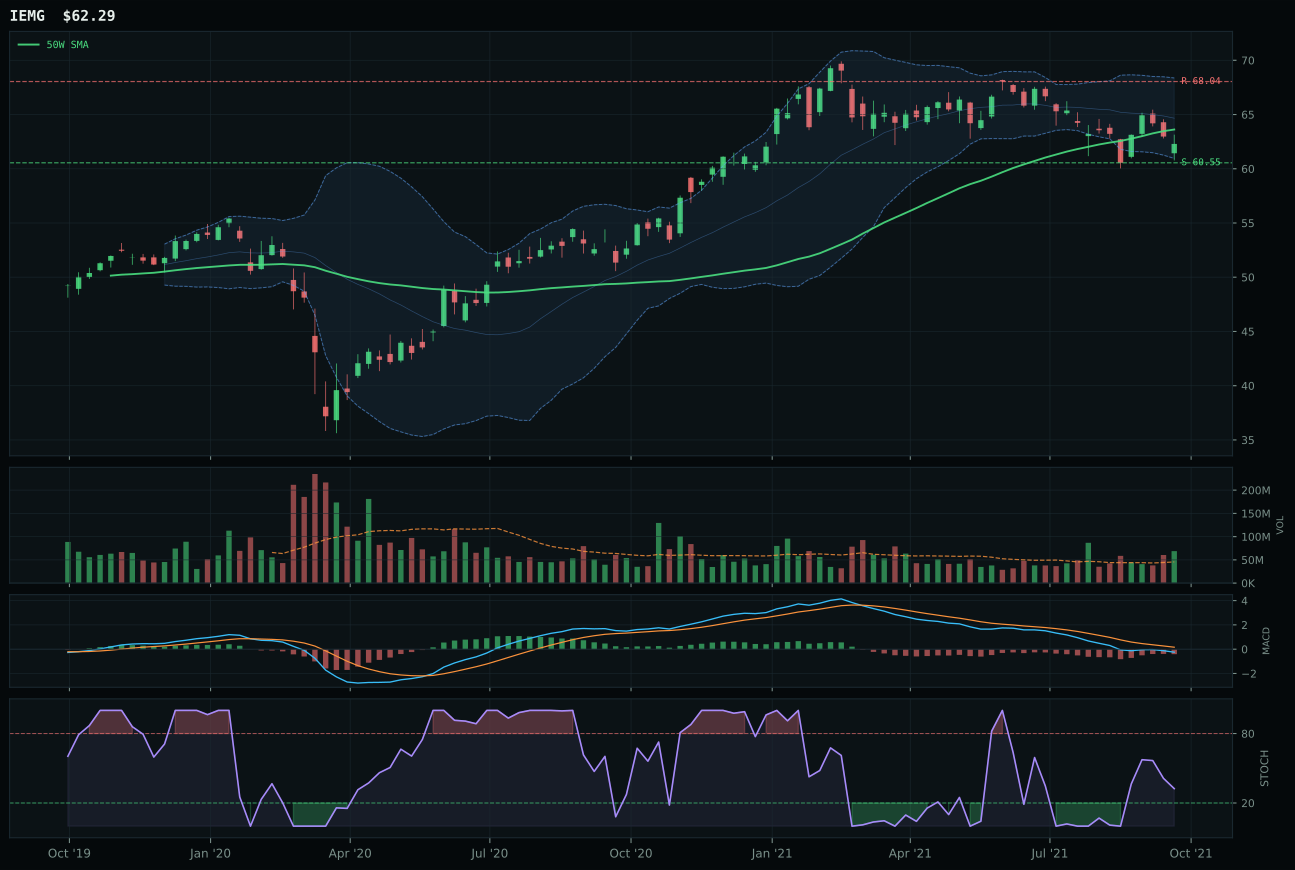
IEMG has a pullback into support profile with -11.6% 13-week relative strength versus SPY.
A failed hold above support would weaken the setup.
Actionable but governed by invalidation levels.
INDA crushes the competition with a perfect 100.0 trend score and clean 100.0 momentum confirmation, but this dominant technical performance is purchased at high entry risk. INDA's 18.2% extension from the 50W creates a setup where every buyer at these prices is late, and the 0.0% upside to resistance means no room for follow-through—the move is complete. ILF dropped hard: its 0.0 technical evidence reflects a structurally broken chart (bearish MACD, oversold stochastic, falling trend), and the -18.3% SPY-relative strength shows India outperformance came at the cost of broader EM weakness. INDA's 8.2% SPY-relative strength and 19.8% category-relative dominance quantify the leadership, but momentum confirmation of 100.0 with stochastic RSI overbought rolling over is a textbook top signal, not a bottom setup. The victory is real; the opportunity cost is extreme.
Emerging Markets receives 5% tier-2 allocation on a score of 35.7, which is weak but qualified as eligible. The category macro fit of 70.0 reflects em liquidity support at +14 and Goldilocks regime at +8, providing genuine tailwinds that offset credit stress at -10. INDA's technical evidence of 82.6 is strong—trend, structure, and volume all confirm—but the timing of 27.0 and risk-reward of 42.9 reveal the cost: entry at resistance with 24.6% downside risk and minimal upside cushion. This allocation works only if you believe EM liquidity support and India quality growth can drive prices higher despite technical extension. For this trade, monitor two critical levels: if stochastic RSI rolls below 0.70, the momentum setup is breaking; if INDA breaks below support at 40.05, the category loses its case and you exit immediately. This is a conviction position based on macro flow, not on technical purity; most of the allocation edge comes from the 70.0 category macro fit, not from INDA's extended setup. Respect the position risk.
Precious Metals — SLV
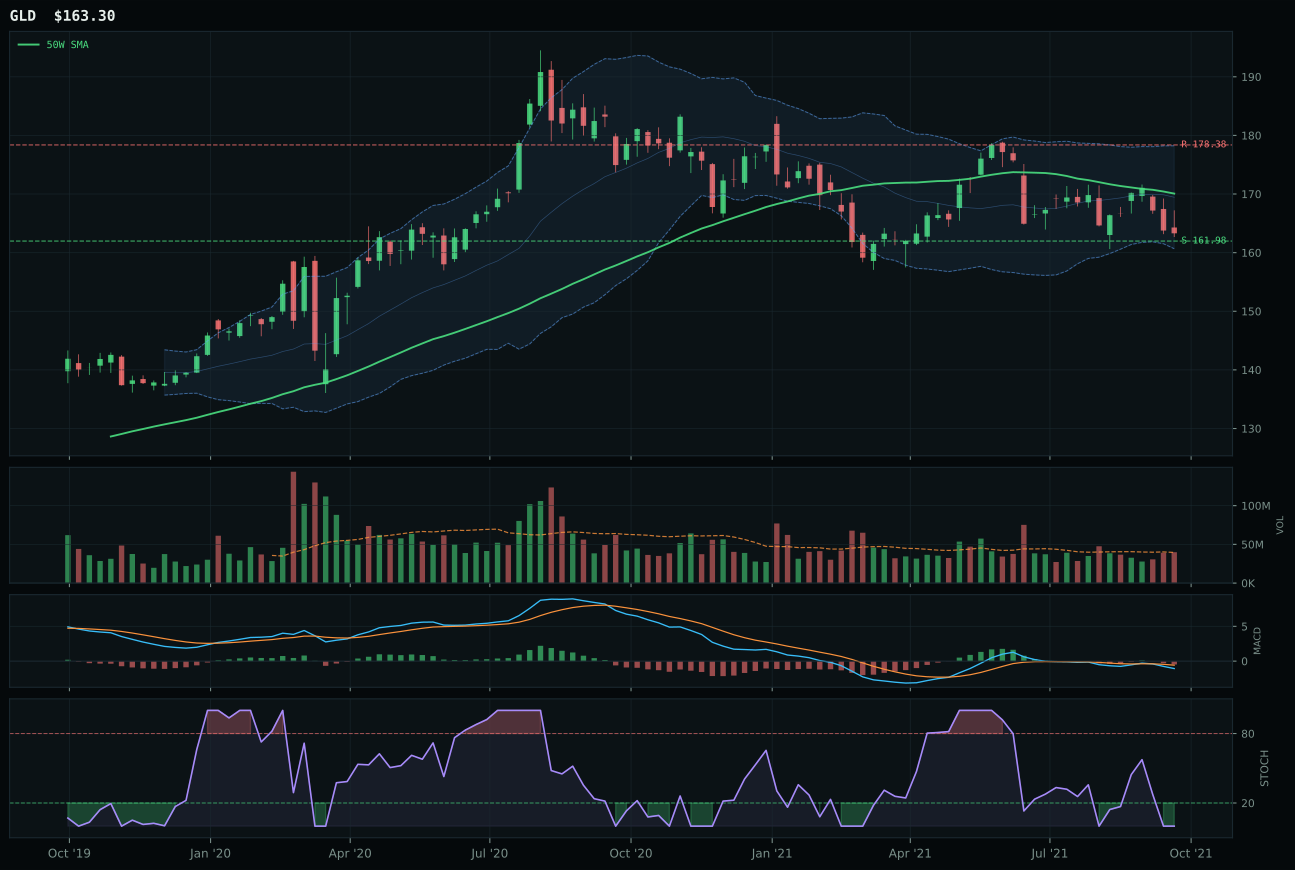
GLD has a pullback into support profile with -6.0% 13-week relative strength versus SPY.
A failed hold above support would weaken the setup.
Actionable but governed by invalidation levels.
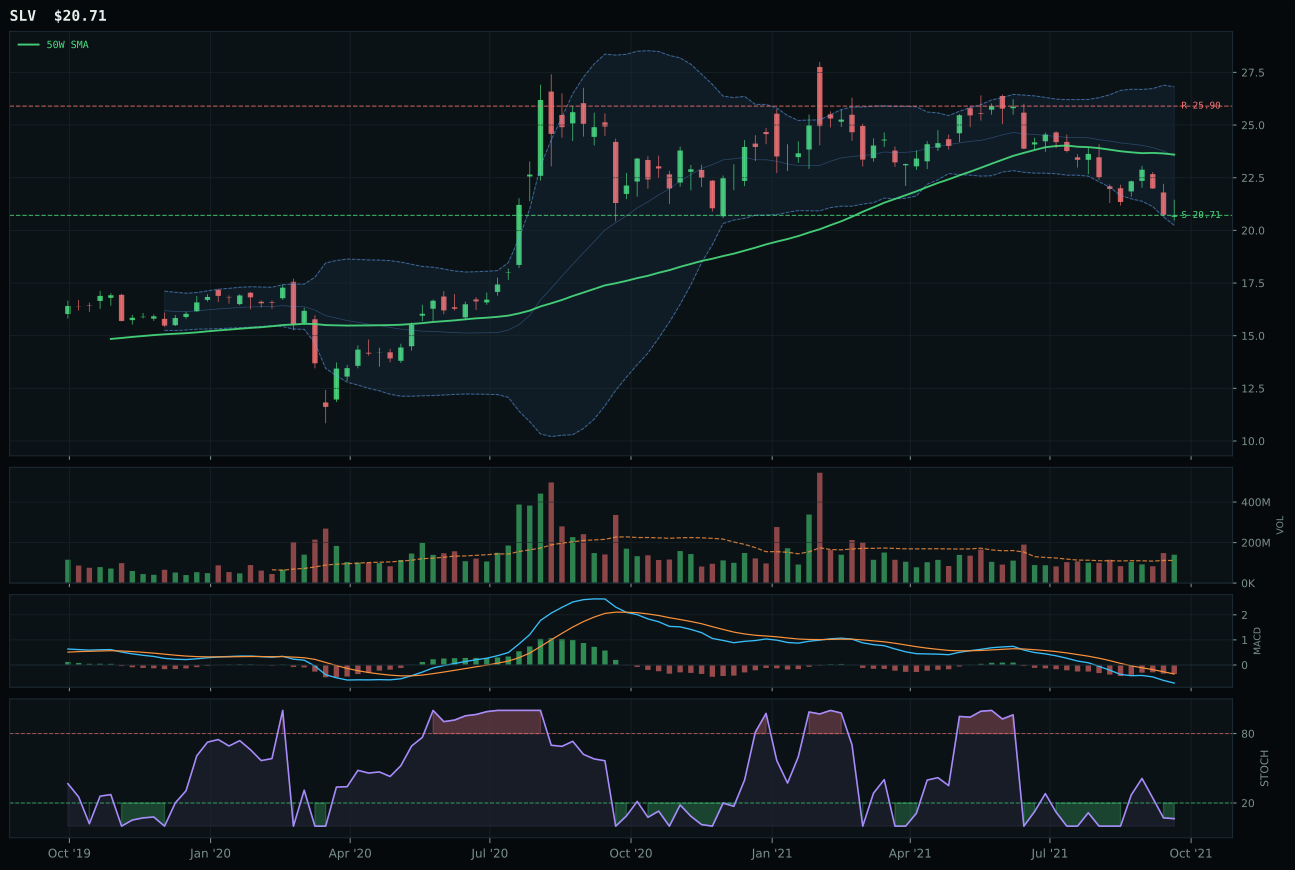
SLV has a pullback into support profile with -18.4% 13-week relative strength versus SPY.
A failed hold above support would weaken the setup.
Actionable but governed by invalidation levels.
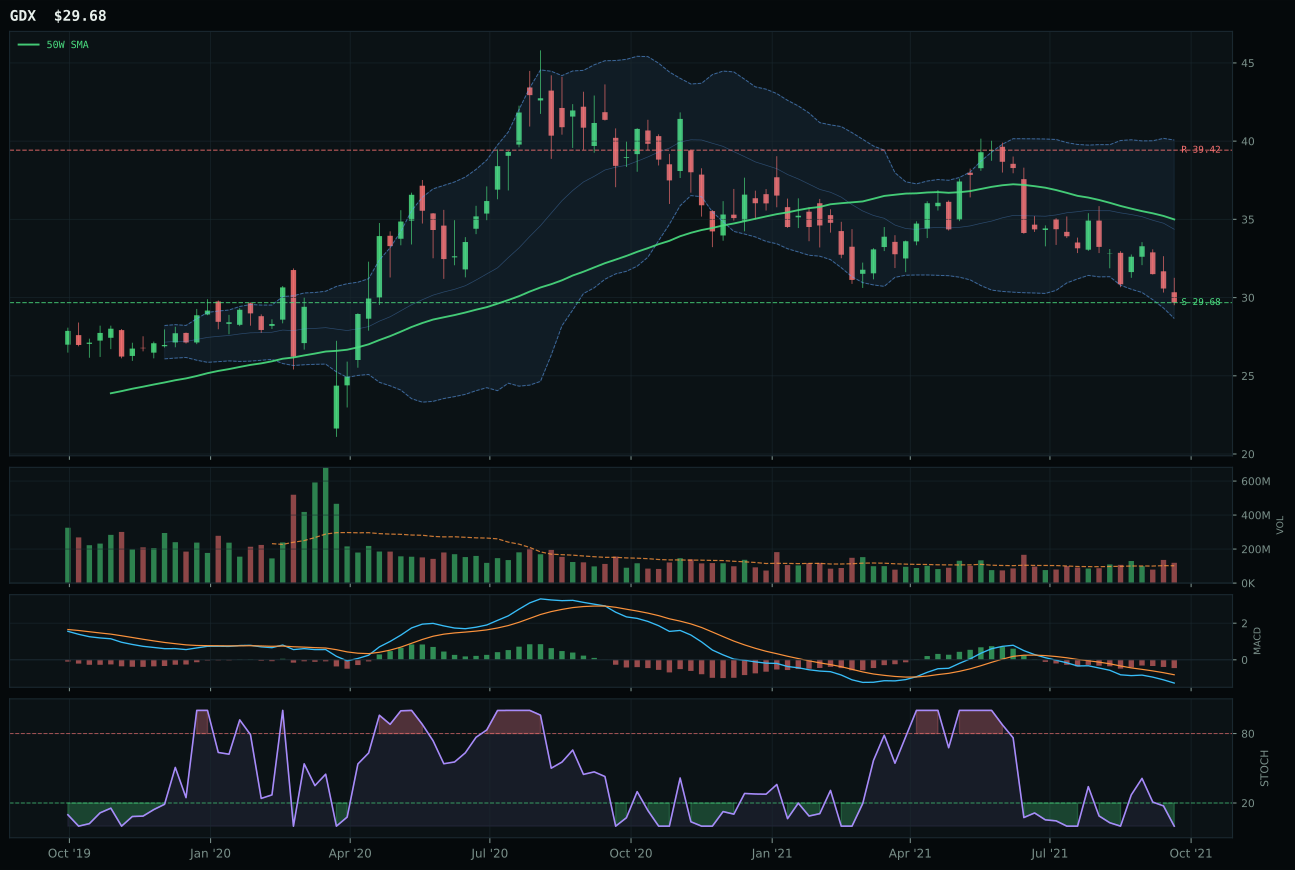
GDX has a pullback into support profile with -17.7% 13-week relative strength versus SPY.
A failed hold above support would weaken the setup.
Actionable but governed by invalidation levels.
SLV wins by default in a deeply impaired category, but the win itself is instructive: neither SLV nor GLD nor GDX possess the technical qualities that justify capital allocation at this moment. SLV edges GLD because its above-average participation at 1.25x the 20W average shows someone is buying the oversold dip, while GLD's neutral volume suggests passive index following rather than sponsorship. SLV's -18.4% SPY-relative strength is catastrophic, and the 13W return of -14.4% reflects a complete loss of trend momentum, but the stochastic RSI of 0.06 is deeply oversold and the 20.71 support is clean. The risk-reward of 90.0 and timing of 65.0 create an asymmetric setup on paper, but the momentum confirmation of 0.0 tells the real story: no one is buying, and the volume participation only reflects desperation, not conviction.
Precious Metals receives 0% allocation this week, excluded entirely from the portfolio. The category scored 34.3, ranking 9th or 10th, and the technical evidence of 20.5 for SLV—the best available option—is simply insufficient to justify holding capital in metals. Disinflation pressure is active at +6 and liquidity expansion is neutral to slightly negative, meaning the macro backdrop actively penalizes precious metals in a Goldilocks regime where real assets are needed for inflation hedge, not deflation protection. SLV's micro setup may have edge—oversold, support defined, volume rising—but the category macro is so weak that no micro setup can overcome it. For metals to re-enter the portfolio, at least two conditions must change: first, credit stress must shift from passive to active, signaling real financial fragility; second, the category must show volume participation above 1.5x average indicating institutional accumulation rather than retail panic buying. Until then, capital allocated to metals is capital not allocated to Technology, AI, or Industrial Metals scarcity plays with stronger macro sponsorship.
Traditional Energy — FCG
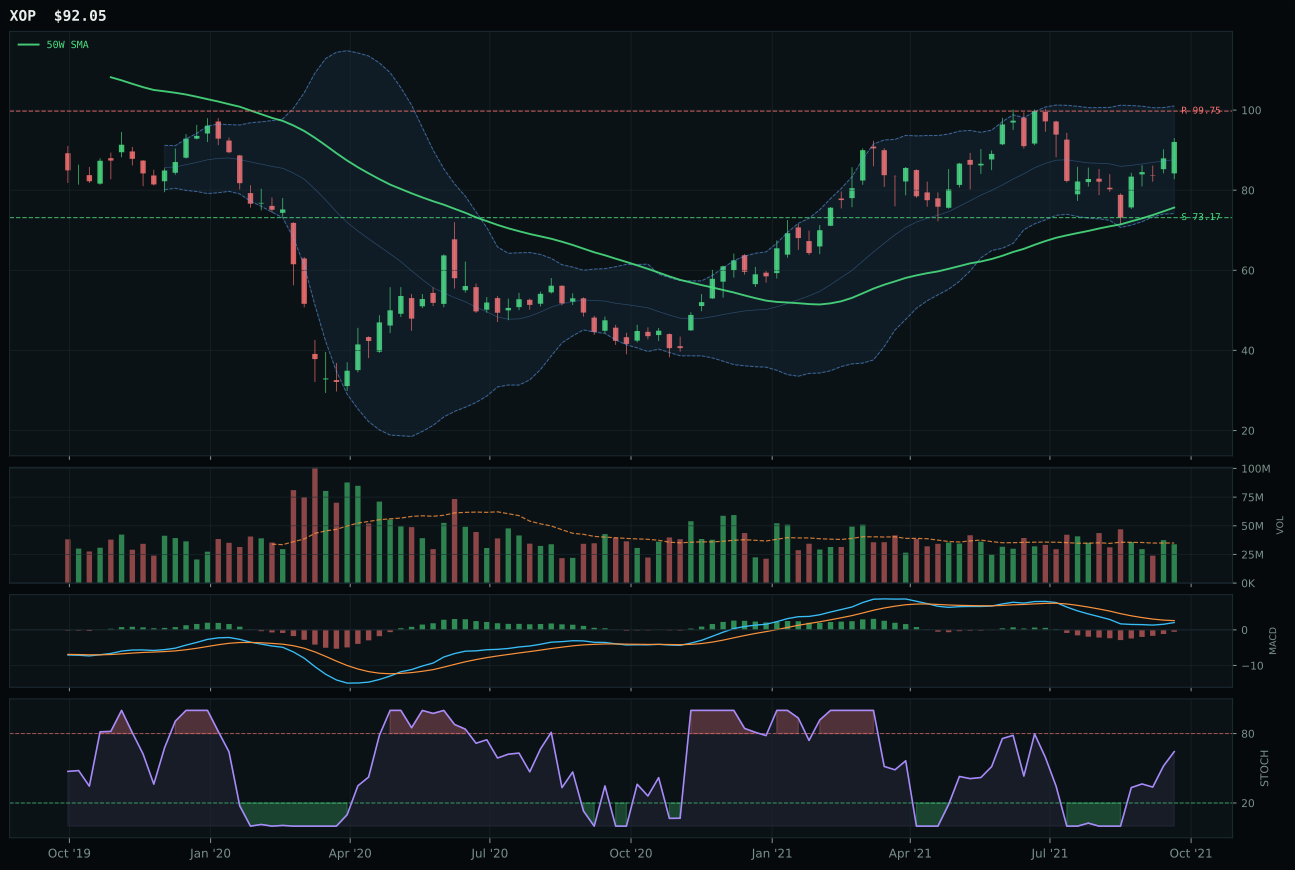
XOP has a vertical extension profile with -11.8% 13-week relative strength versus SPY.
A failed hold above support would weaken the setup.
Actionable but governed by invalidation levels.
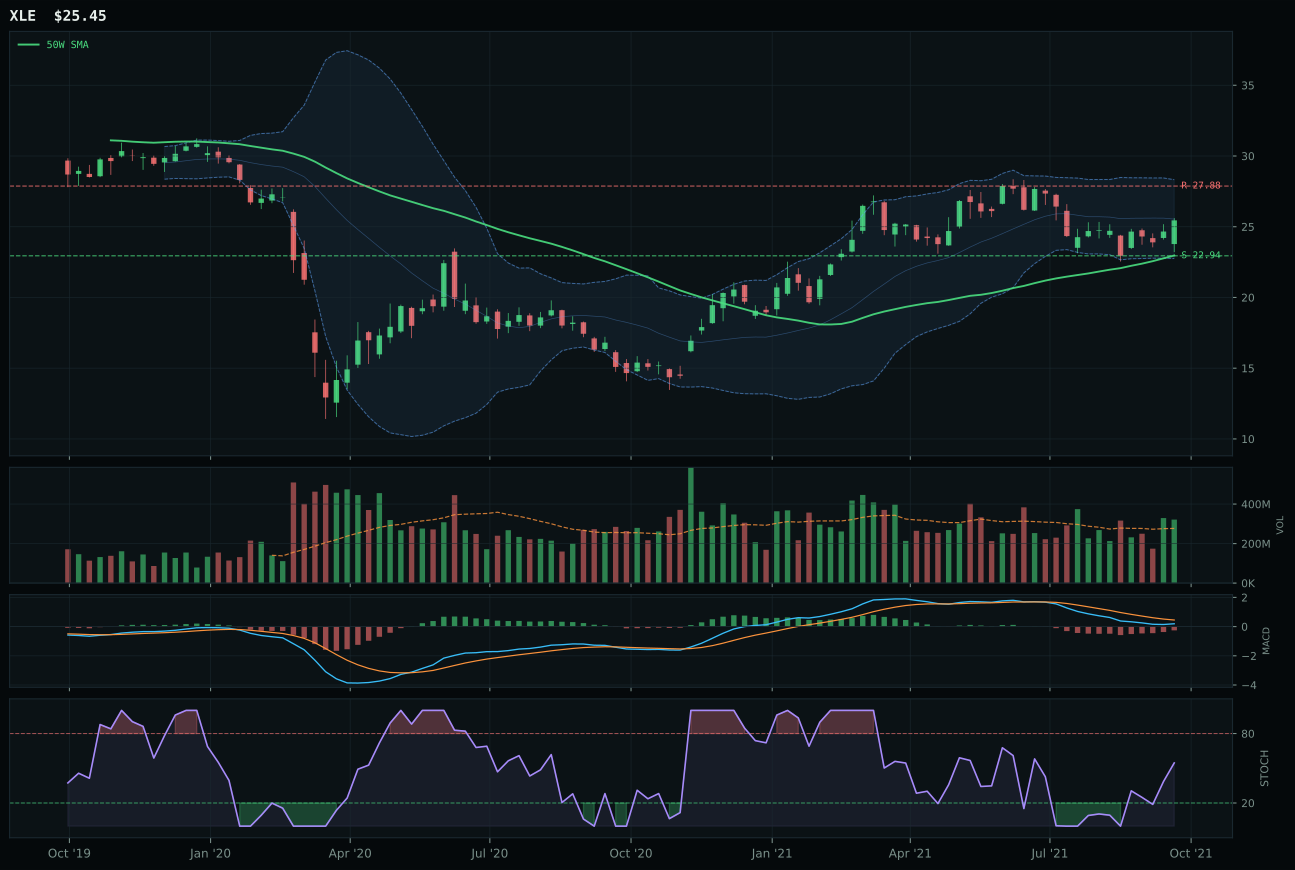
XLE has a neutral structure profile with -12.1% 13-week relative strength versus SPY.
A failed hold above support would weaken the setup.
Actionable but governed by invalidation levels.
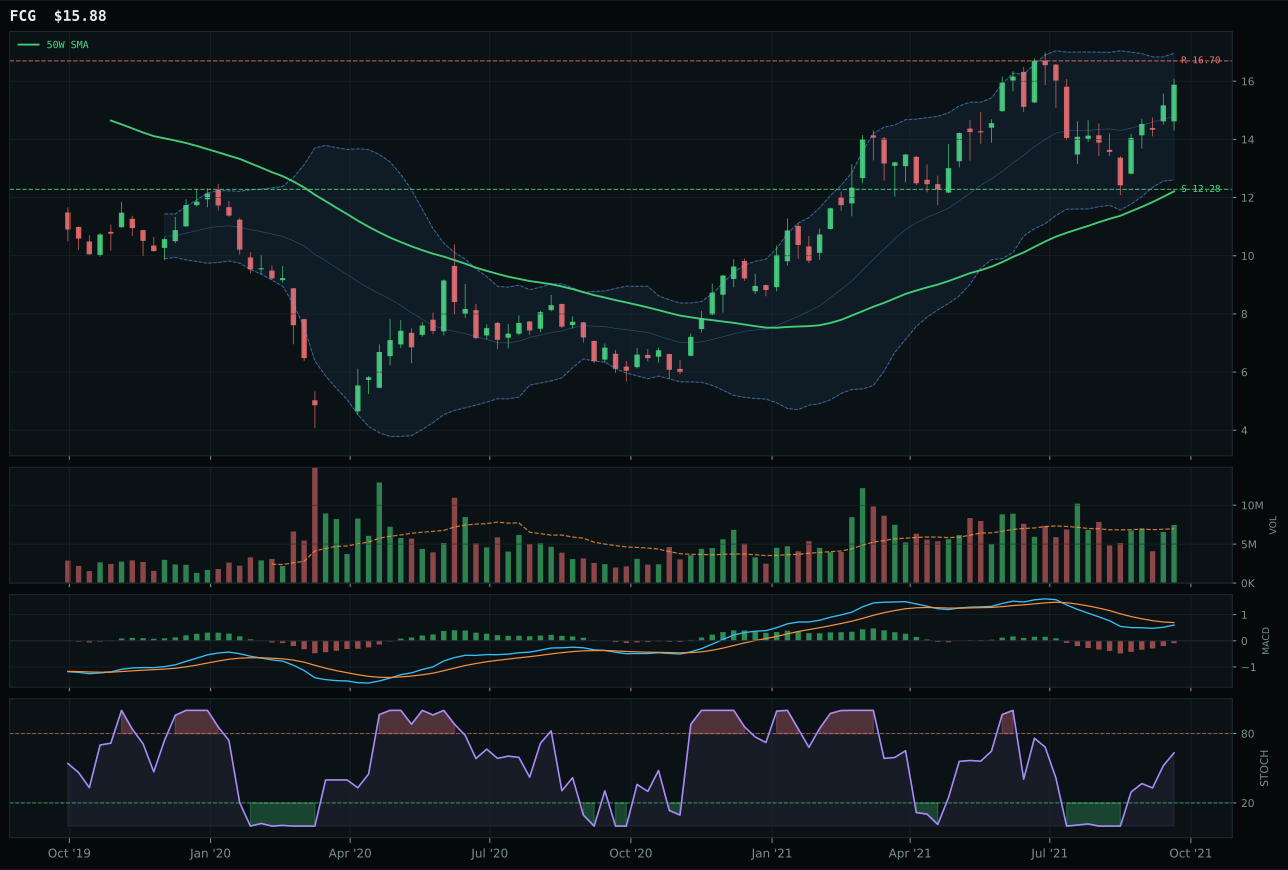
FCG has a vertical extension profile with -9.0% 13-week relative strength versus SPY.
A failed hold above support would weaken the setup.
Actionable but governed by invalidation levels.
FCG wins a category that should not exist in this portfolio, and its win reveals category rot: FCG trades at 30.0% extension above the 50W, making every current buyer late to the party and every support break a potential capitulation. Even within a weak basket, FCG's timing of 53.0 and risk-reward of 25.0 are objectively poor—upside to resistance is -4.9% with 29.3% downside to support, and volume is neutral at 1.07x the 20W average, showing no institutional sponsorship. XLE, the technical evidence leader at 54.5 reasoned rank, at least trades near the 50W with better MACD action, yet the category overall scores 24.6 because credit stress at -7 and disinflation pressure at -10 create headwinds that overwhelm any micro setup. The category-level macro fit of 40.0 is the real killer: liquidity expansion is not active for energy, and real asset sponsorship is weak relative to the disinflation headwind.
Traditional Energy receives 0% allocation this week, excluded from the portfolio entirely. The category scored 24.6, ranking 9th or 10th as one of the two worst-scoring categories, and there is no edge to harvest here. The technical setup is poor—FCG is extended, volume is weak, and MACD is mere hope-pattern—but the macro case is the primary disqualifier: disinflation pressure at -10 is the active headwind that matters most in 2021, and it directly penalizes traditional energy while supporting technology, AI, and deflation-hedge utilities. Credit stress is active at -7 but not yet severe enough to shift the energy narrative from demand-destruction to supply-crisis, meaning the macro regime remains hostile. For energy to re-enter the portfolio, inflation expectations must shift meaningfully—either through a Fed policy change or a geopolitical shock—and the disinflation descriptor must flip to inflation protection active. Until that regime change occurs, energy capital is better deployed elsewhere. The setup gap between COPX's 0.6% distance and FCG's 30.0% distance quantifies what you are giving up by standing in the wrong category.