
2021-09-17
Informational purposes only. The content in this report, including allocations, analysis, and commentary, is provided solely for informational and educational purposes. It does not constitute financial advice, investment advice, trading advice, or any other type of advice. Past performance does not guarantee future results. Always conduct your own research and consult a qualified financial professional before making investment decisions.
Weekly Allocation
| Ticker | Category | Weight | Role |
|---|---|---|---|
| FSOL | 50% | Overlay | |
| COPX | Industrial Metals | 10% | Top-2 (10%) |
| CIBR | Technology | 10% | Top-2 (10%) |
| BOTZ | AI | 5% | Tier-2 (5%) |
| URNM | Nuclear Energy | 5% | Tier-2 (5%) |
| IGF | Utilities & Infrastructure | 5% | Tier-2 (5%) |
| INDA | Emerging Markets | 5% | Tier-2 (5%) |
| SLV | Precious Metals | 5% | Tier-2 (5%) |
| MOO | Agriculture & Livestock | 5% | Tier-2 (5%) |
Trade Instructions — Monday Open
Sell the tranche from 2021-08-20 (completing its 4-week hold). Buy the new tranche. Instructions show net portfolio changes — same-asset positions cancel, weight changes show the delta.
| Action | Ticker | Instruction |
|---|---|---|
| SELL | XLK | Sell entire XLK position (2.50% of portfolio) |
| SELL | XLU | Sell 17% of XLU position (reduce 7.50% → 6.25%) |
| SELL | WEAT | Sell entire WEAT position (1.25% of portfolio) |
| SELL | URA | Sell entire URA position (1.25% of portfolio) |
| SELL | ITA | Sell 25% of ITA position (reduce 5.00% → 3.75%) |
| BUY | CIBR | Buy CIBR — 33.33% of freed cash (adds 2.50% to portfolio) |
| BUY | MOO | Buy MOO — 16.67% of freed cash (adds 1.25% to portfolio) |
| BUY | URNM | Buy URNM — 16.67% of freed cash (adds 1.25% to portfolio) |
| BUY | IGF | Buy IGF — 16.67% of freed cash (adds 1.25% to portfolio) |
| BUY | INDA | Buy INDA — 16.67% of freed cash (adds 1.25% to portfolio) |
Current Portfolio After Trade
Combined holdings across all 4 active tranches. Each tranche is 25% of the portfolio.
| Ticker | % of Portfolio | Weight Bar |
|---|---|---|
| FSOL | 50.00% | |
| CIBR | 10.00% | |
| COPX | 6.25% | |
| XLU | 6.25% | |
| BOTZ | 6.25% | |
| MOO | 5.00% | |
| URNM | 5.00% | |
| ITA | 3.75% | |
| GLD | 3.75% | |
| IGF | 1.25% | |
| INDA | 1.25% | |
| SLV | 1.25% |
Macro Regime — Goldilocks
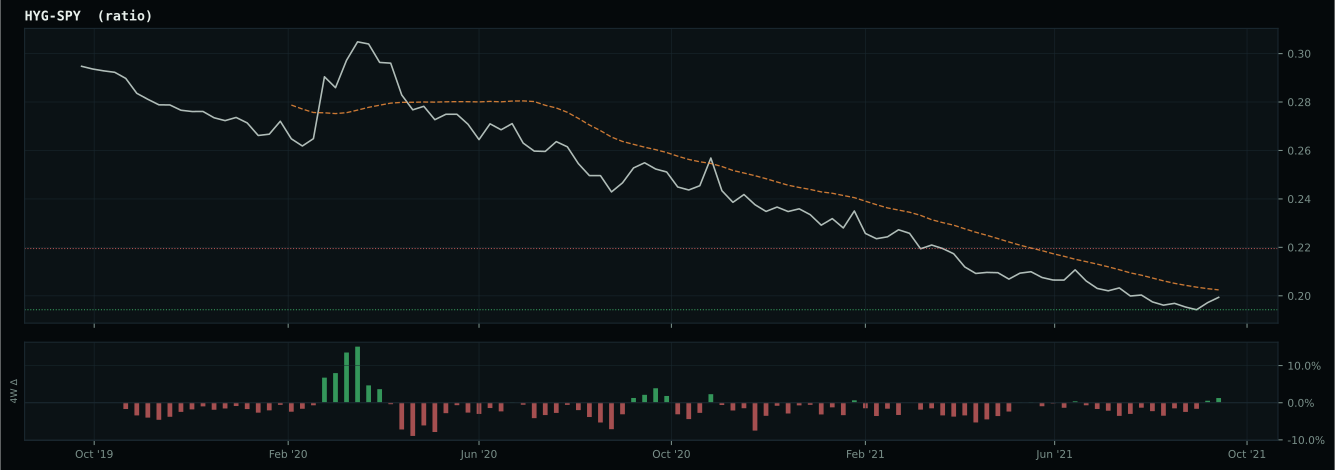
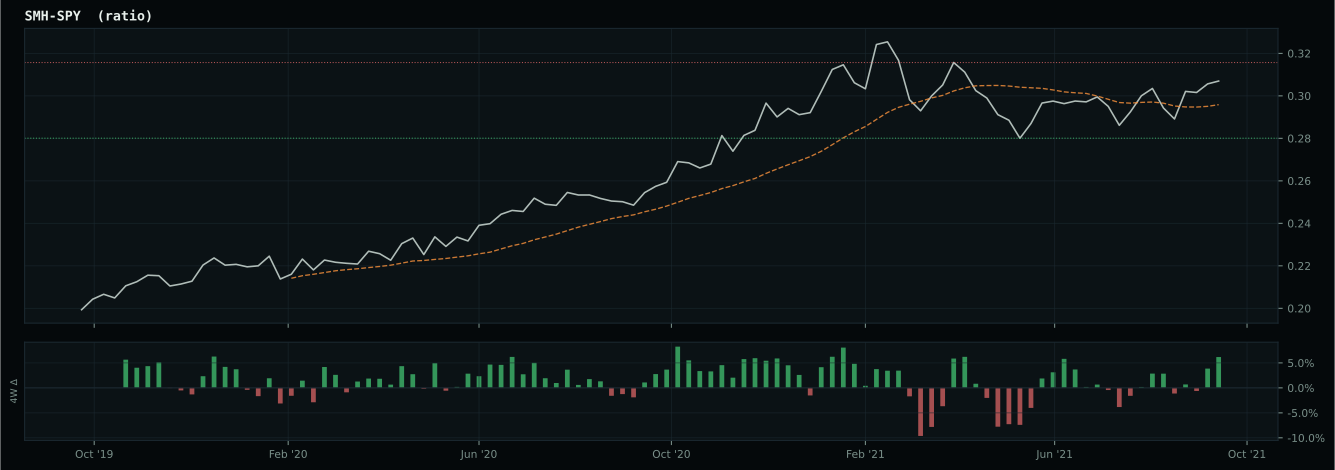
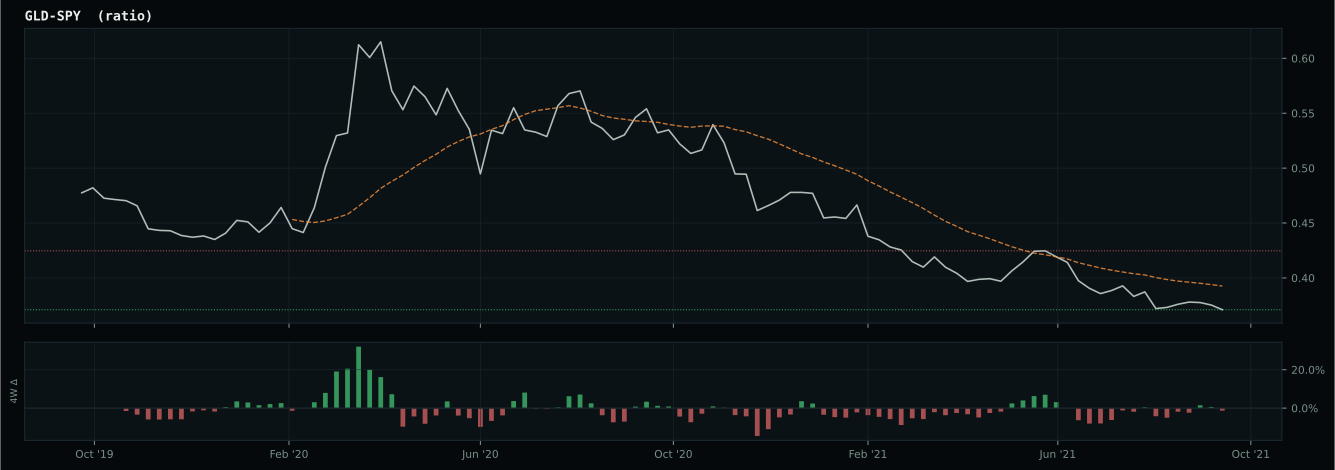
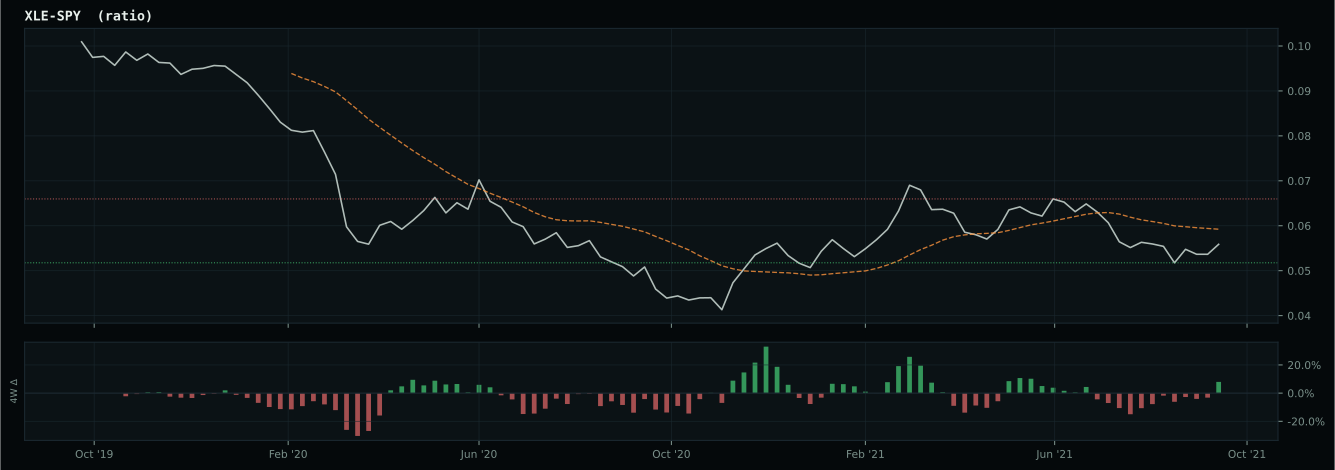
Macro Evidence Charts
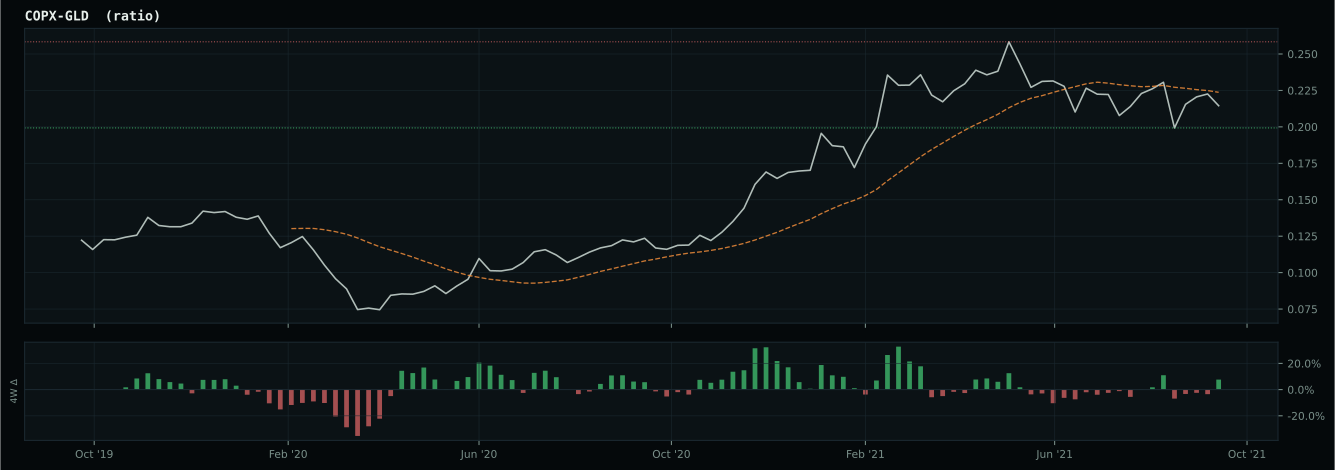
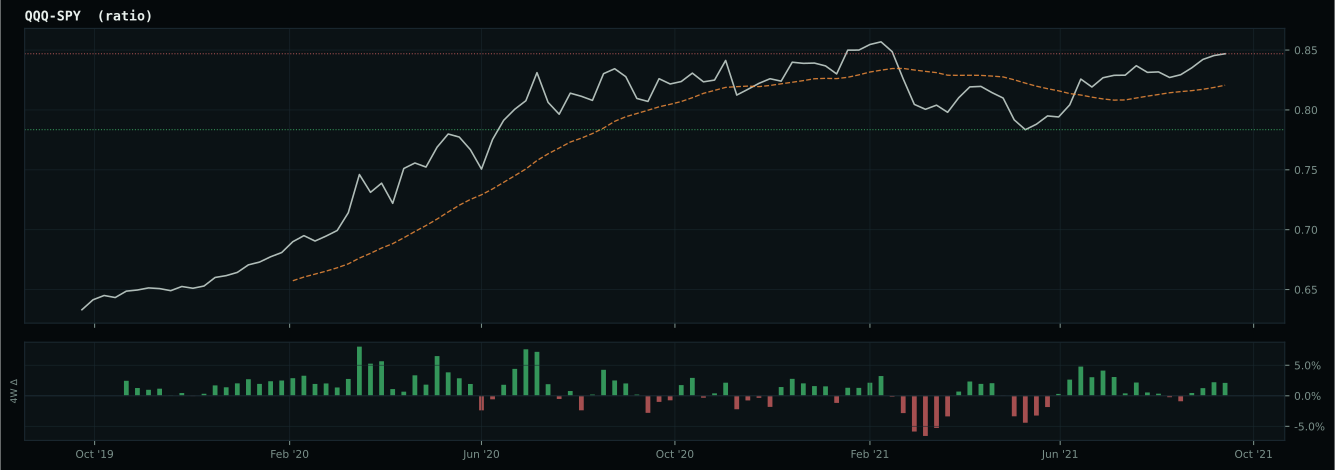
Market-implied signals behind the macro regime scores. Each ratio compares two assets; the direction and slope of the ratio is what the macro engine reads.
Crypto Regime — AltSeason
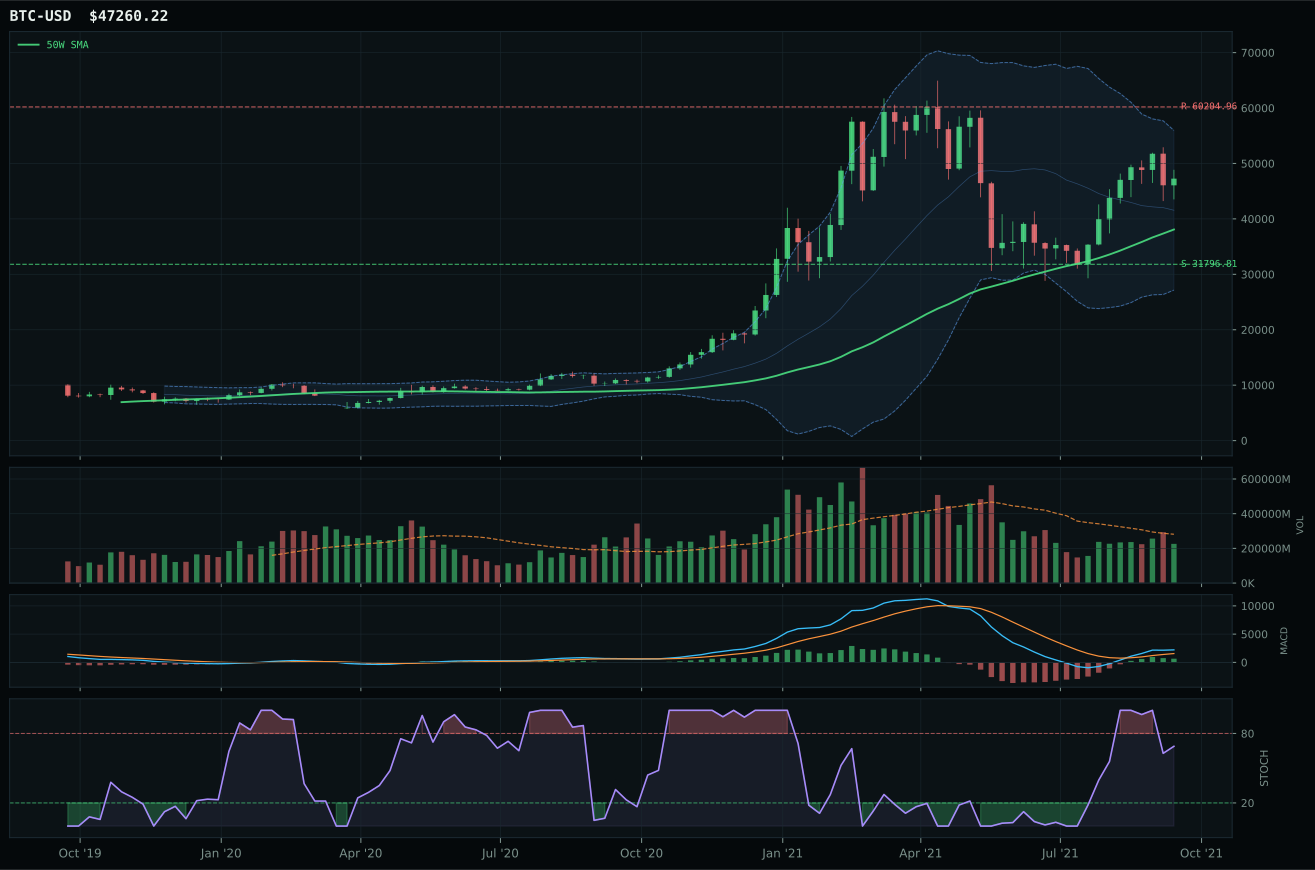
ValueBTC not armed: BTC has not made the first post-breakdown touch of the 200W buy zone after losing the 50W
TrendBTC confirmed: 2 consecutive closes above rising/flat 50W SMA
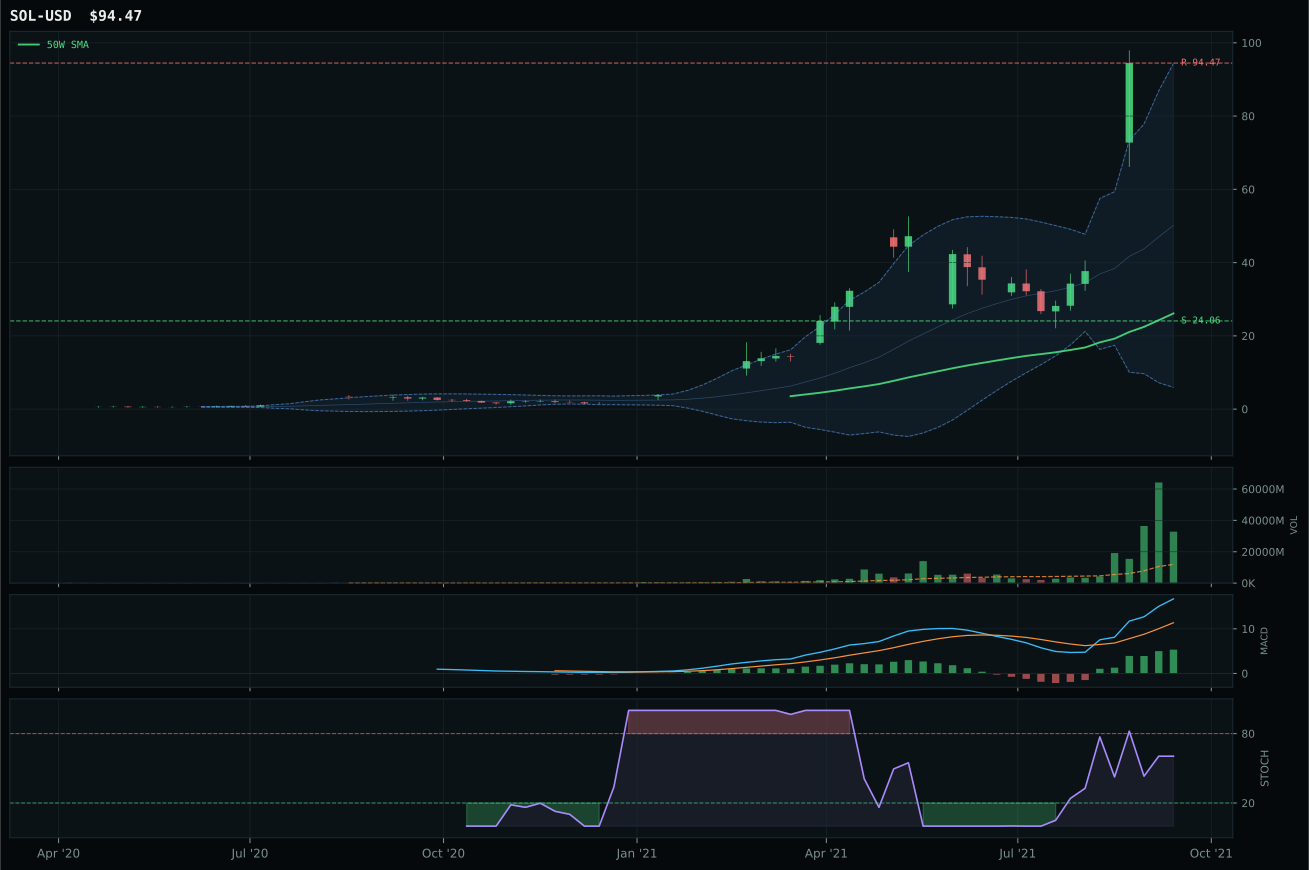
all available AltSeason conditions pass; missing optional confirmations skipped
Category Rankings
| Rank | Category | Winner | Score | Alloc | 4W Ret | Peers (4W) |
|---|---|---|---|---|---|---|
| 1 | Industrial Metals | COPX | 67.7 | 20% | +18.48% | REMX +5.0% · PICK +8.9% |
| 2 | Technology | CIBR | 64.8 | 20% | +4.46% | IGV +3.7% · XLK +1.4% |
| 3 | AI | BOTZ | 60.8 | 10% | -2.37% | SMH -1.7% · AIQ +2.5% |
| 4 | Nuclear Energy | URNM | 47.8 | 10% | +19.70% | URA +17.3% · NLR +8.5% |
| 5 | Utilities & Infrastructure | IGF | 46.3 | 10% | +4.29% | XLU -0.8% · PAVE +5.0% |
| 6 | Emerging Markets | INDA | 44.6 | 10% | +3.09% | IEMG +3.1% · ILF +0.3% |
| 7 | Precious Metals | SLV | 40.9 | 10% | +4.51% | GLD +0.7% · GDX +6.8% |
| 8 | Agriculture & Livestock | MOO | 32.5 | 10% | +3.16% | WEAT +5.9% · VEGI +3.9% |
| 9 | Traditional Energy | FCG | 27.3 | 0% | +27.09% | XOP +26.7% · XLE +21.7% |
| 10 | Defense & Aerospace | ITA | 20.1 | 0% | +6.39% | ROKT +3.6% · XAR +5.9% |
Industrial Metals — COPX
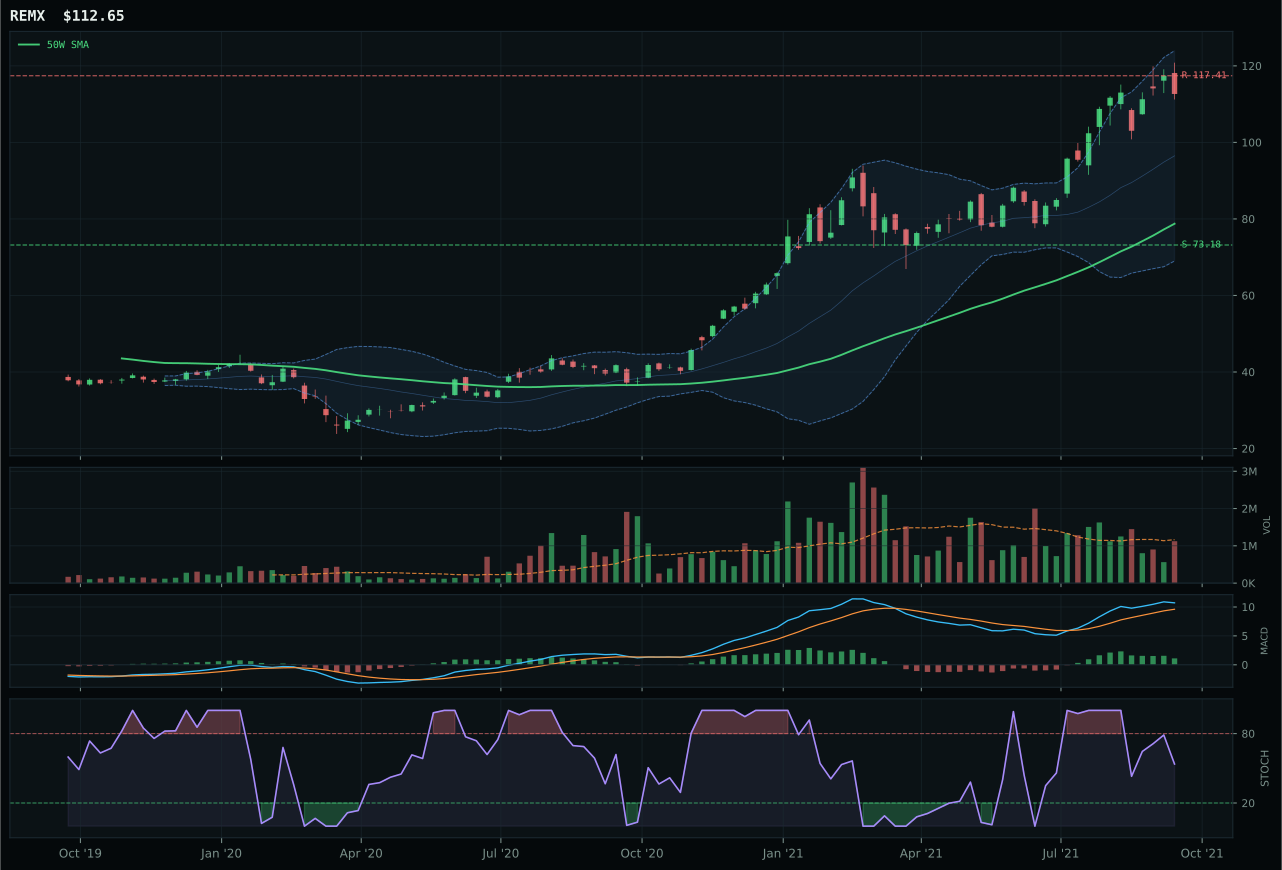
REMX has a vertical extension profile with 36.5% 13-week relative strength versus SPY.
A failed hold above support would weaken the setup.
Actionable but governed by invalidation levels.
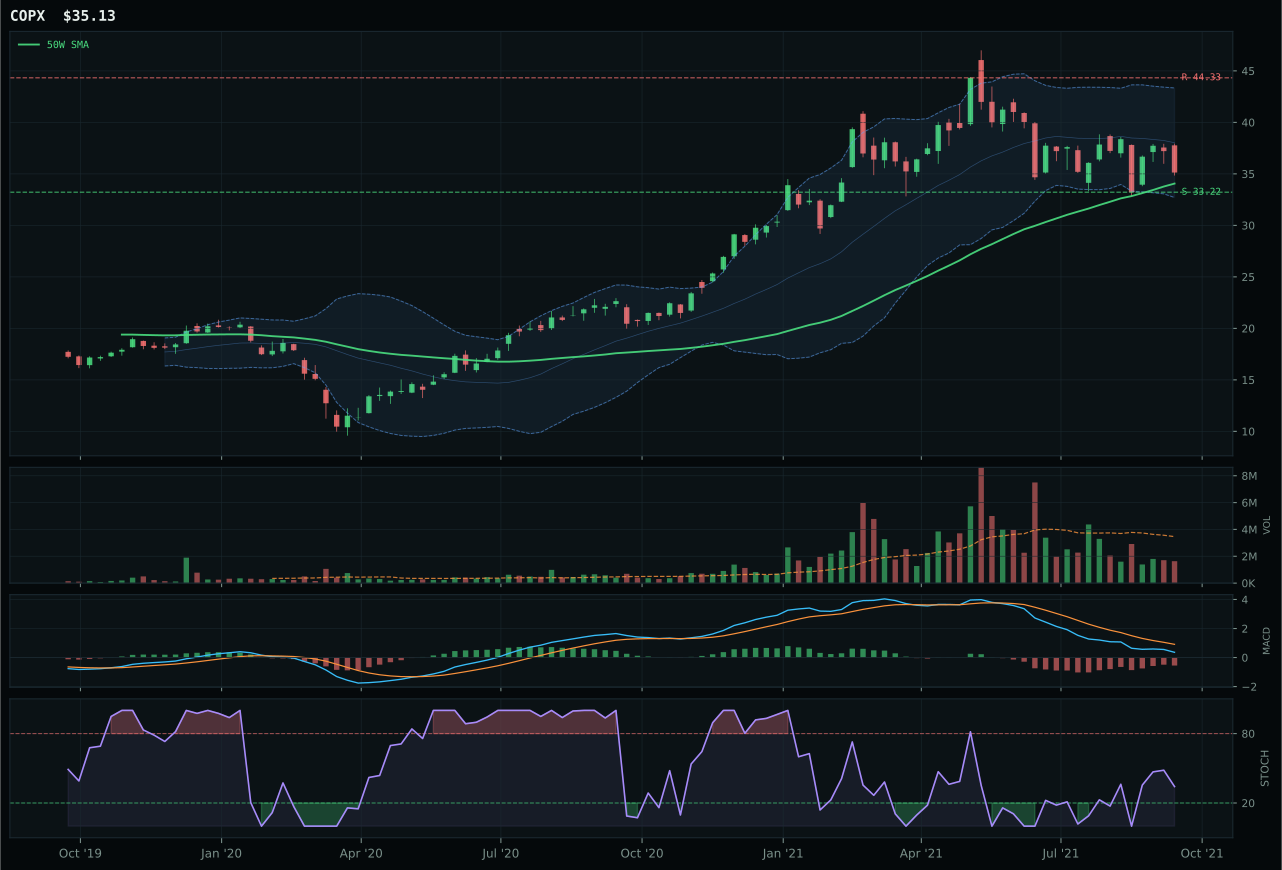
COPX has a neutral structure profile with -5.1% 13-week relative strength versus SPY.
A failed hold above support would weaken the setup.
Actionable but governed by invalidation levels.
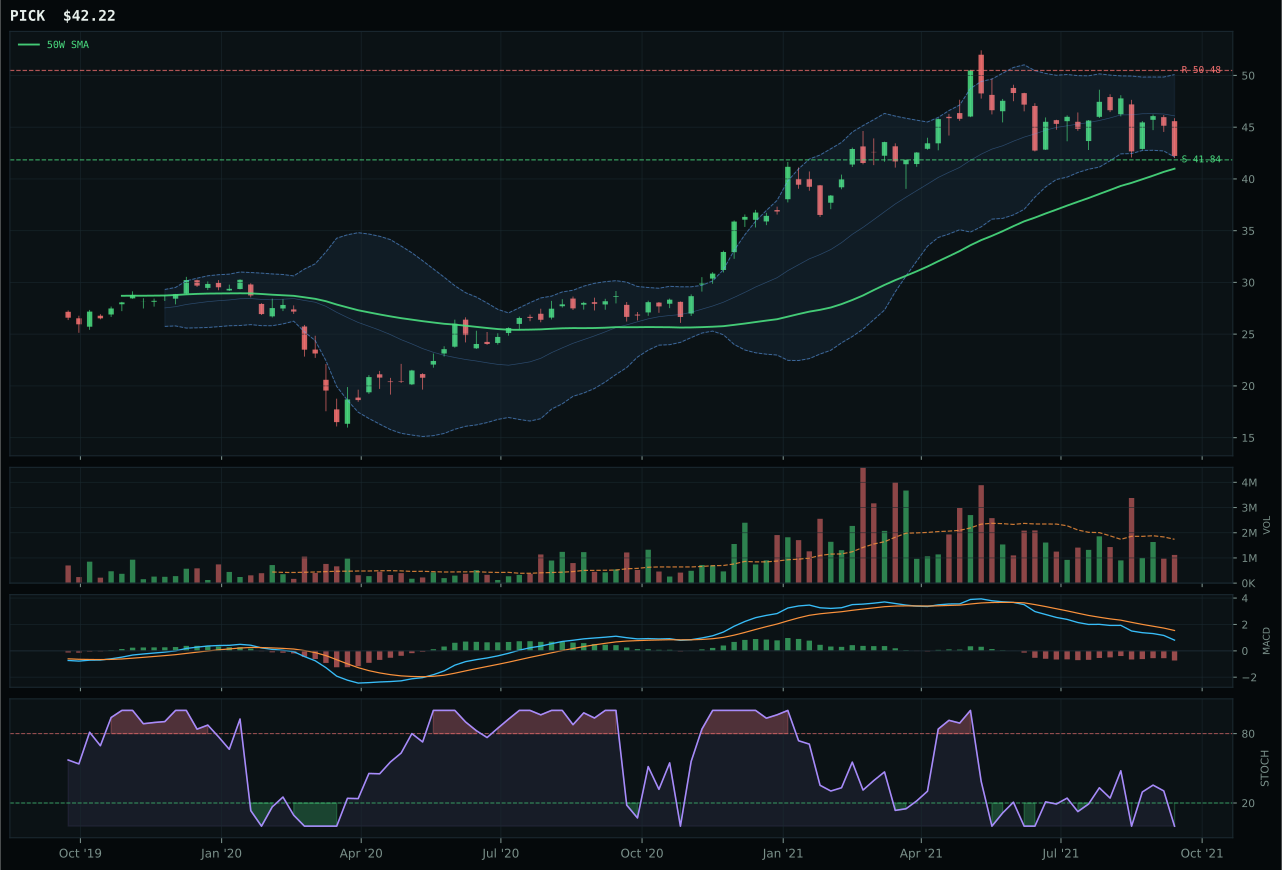
PICK has a pullback into support profile with -7.6% 13-week relative strength versus SPY.
A failed hold above support would weaken the setup.
Actionable but governed by invalidation levels.
COPX earned top-2 status and the 10% allocation slot by balancing defensive timing (97.0/100 at just 3.1% from the 50W, near the Fibonacci decision zone) against REMX's blunt 43.1% extension despite REMX's perfect technical evidence (83.3/100 versus COPX's 55.2). The critical separation emerges in risk-reward: COPX's 75.0 score reflects realistic upside-to-resistance of -20.8% (defensive capping) and downside-to-support of 5.7%, while REMX's 38.4 exposes the vertical extension trap—43.1% stretched above the 50W leaves upside capped at 0.0% and downside at 71.8%, an inverted risk-reward in an improving-but-not-yet-bullish MACD regime. COPX's neutral structure and falling-neutral stochastic at 0.34 signal reset patience; REMX's bullish-but-flattening MACD and overbought momentum at 100.0/100 suggest late-cycle strength. Metals scarcity macro backing (+12 for COPX, +9 for REMX) favors the patience setup over the extended leader.
Industrial Metals ranked 67.7 and earned the 10% top-2 allocation because it scored second-highest among all ten categories, with COPX's pullback-into-accumulation setup aligned perfectly with the Goldilocks regime and active metals-scarcity, commodity-breadth, and real-asset sponsorships. The category-level macro fit of 79.0 is the strongest across the entire portfolio, reflecting multiple tailwinds: metals scarcity (+14), commodity breadth (+10), and real-asset sponsorship (+6) offset only a -7 credit-stress headwind. REMX's 78.9 technical-evidence score and 100.0 trend ranking are compromised by timing risk and distribution-level extension; COPX's 75 composite score reflects defensive positioning that converts macro sponsorship into actual capital accumulation. This is a core allocation rather than a speculative trade. COPX must sustain above 33.22 support and eventually break above 44.33 resistance to justify staying in top-2, but the combination of oversold timing, improving MACD, macro sponsorship, and thin volume suggesting patient accumulation makes this the portfolio's second-best risk-adjusted opportunity this week.
Technology — CIBR
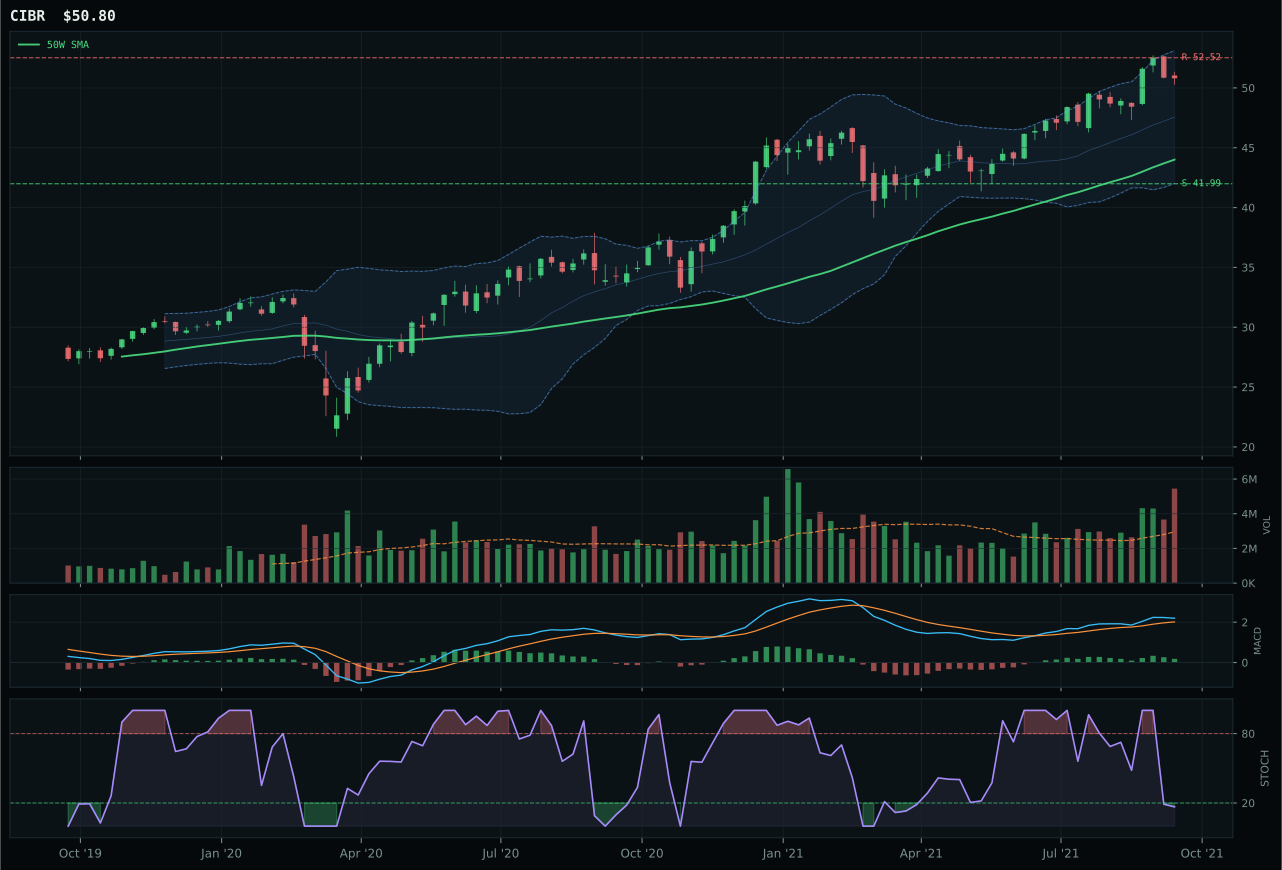
CIBR has a vertical extension profile with 3.1% 13-week relative strength versus SPY.
A failed hold above support would weaken the setup.
Actionable but governed by invalidation levels.
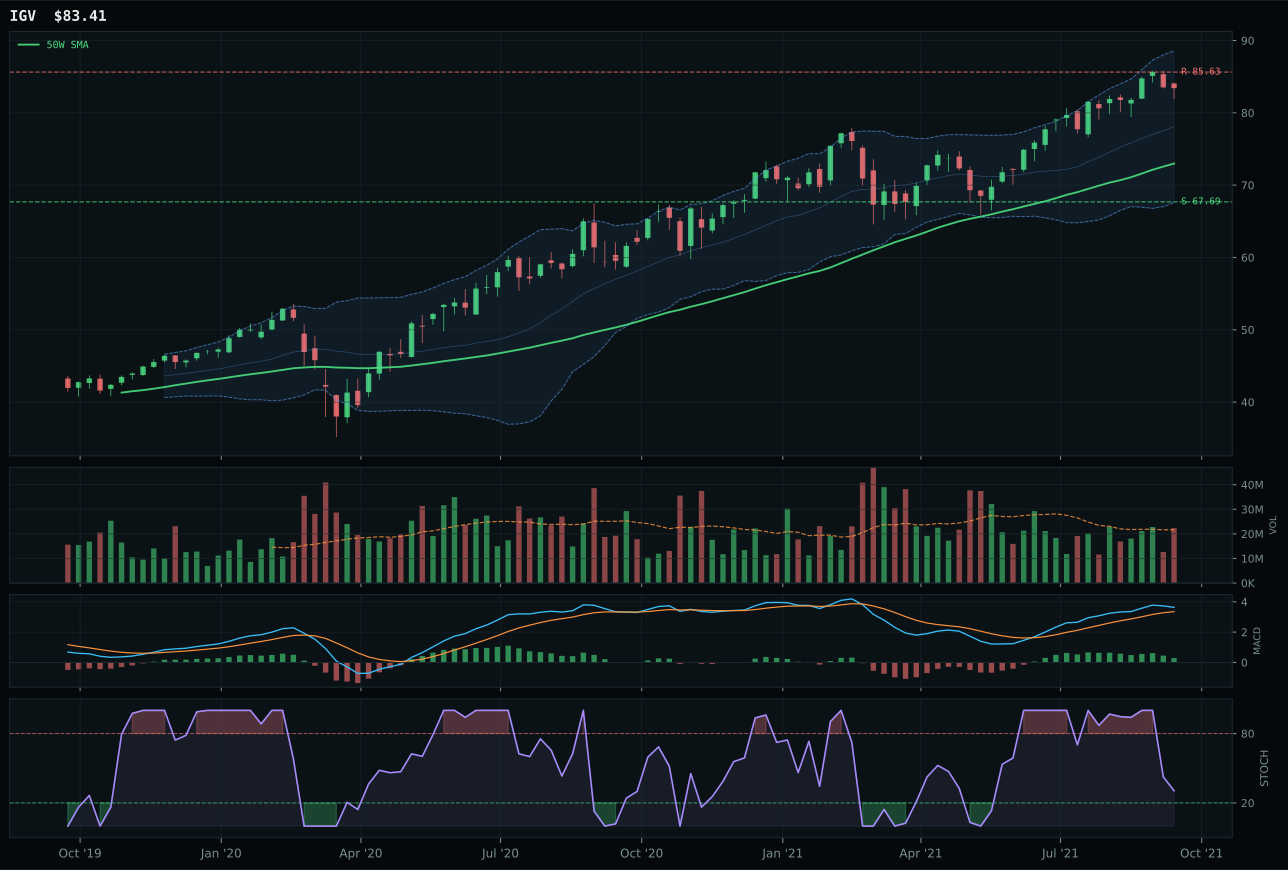
IGV has a neutral structure profile with 3.6% 13-week relative strength versus SPY.
A failed hold above support would weaken the setup.
Actionable but governed by invalidation levels.
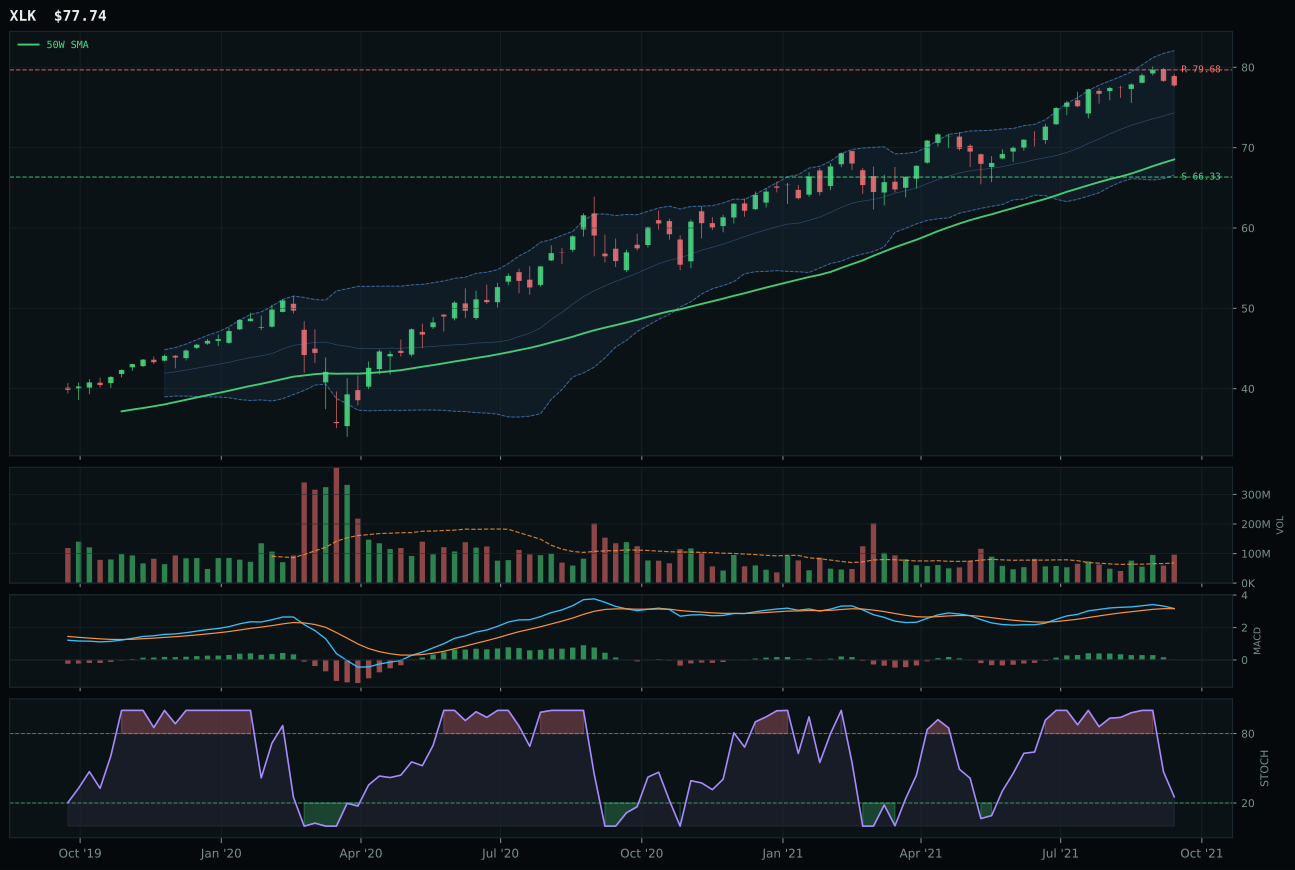
XLK has a neutral structure profile with 3.0% 13-week relative strength versus SPY.
A failed hold above support would weaken the setup.
Actionable but governed by invalidation levels.
CIBR defeated IGV and XLK by maintaining momentum confirmation at 72.6/100 while demonstrating superior timing at 45.0 versus IGV's 62, a paradox explained by MACD's bullish and improving trajectory paired with stochastic RSI oversold at 0.17—a setup that rewards patient entry over momentum-chasing. The 15.4% extension above the 50W penalizes entry risk heavily, yet CIBR's 3.1% RS versus SPY and identical category-relative strength to IGV justify the win through cleaner compression (83.6 versus 83.6 in raw terms but better distributed) and distribution pressure suggesting accumulation into weakness rather than bounce-buying. IGV's MACD flattening—the opposite of improving—and neutral stochastic RSI configuration left it vulnerable despite stronger macro narrative around enterprise software duration sensitivity. Volume at 1.84x 20W average for CIBR signals conviction; the setup is a late-cycle accumulation coil, not a breakout confirmation.
Technology earned its 10% slot because the category scored 64.8, placing it among the top two eligible scores but failing to beat COPX and CIBR's narrower risk positioning. Goldilocks macro and active AI-growth sponsorship support the narrative, yet the technical evidence weighted at 62% reveals entry risk concentrated in both CIBR and broader tech: IGV's 3.6% SPY-relative strength edges CIBR's 3.1%, and XLK's neutral setup with flattening MACD signals fatigue across the sector's leaders. The allocation reflects a tactical hold rather than a conviction overweight. For Technology to move into top-2 territory, CIBR would need to break above the 52.52 resistance cleanly and rebuild volume confirmation below the 50W—turning today's distribution pressure into true accumulation. Credit stress remains a -7 headwind that cannot be ignored in a Goldilocks regime.
AI — BOTZ
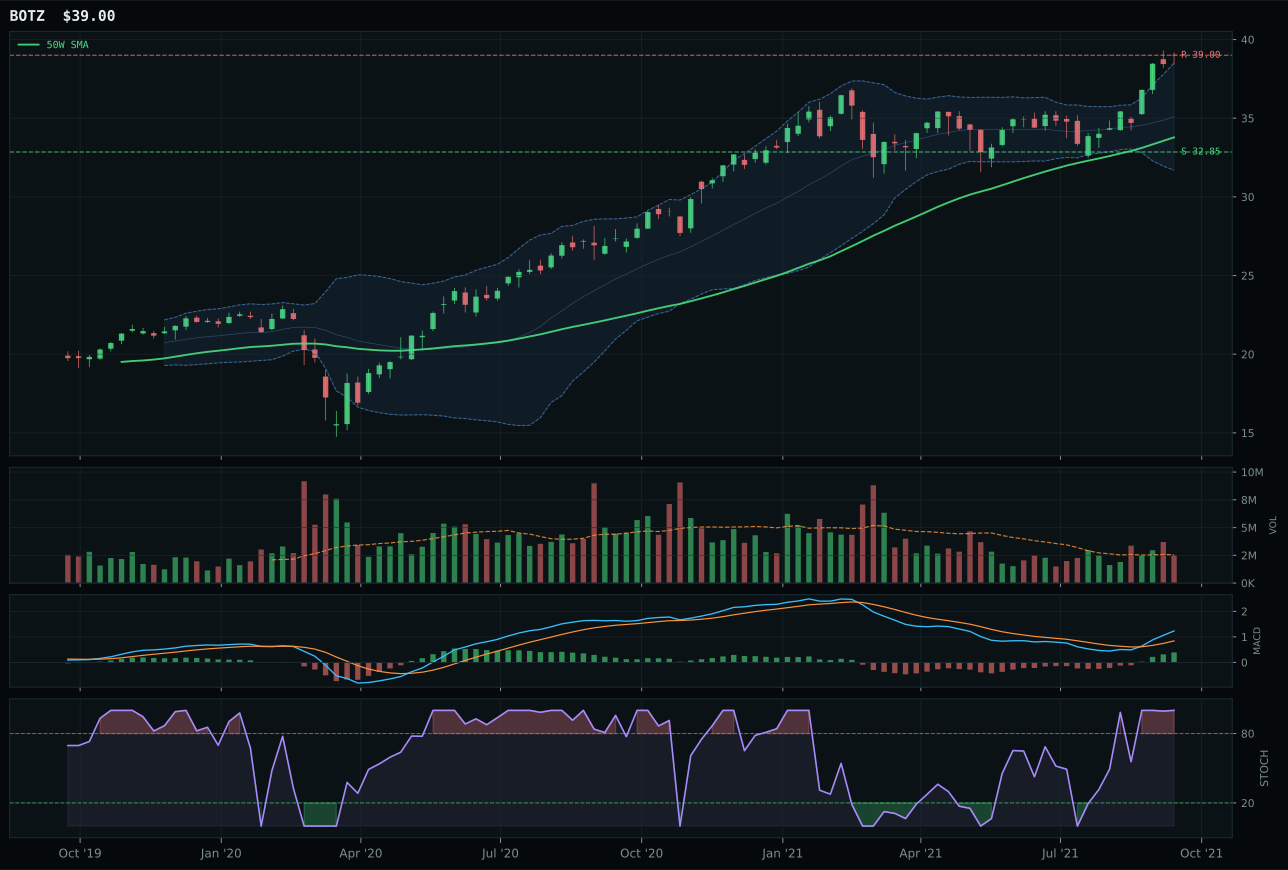
BOTZ has a vertical extension profile with 7.0% 13-week relative strength versus SPY.
A failed hold above support would weaken the setup.
Actionable but governed by invalidation levels.
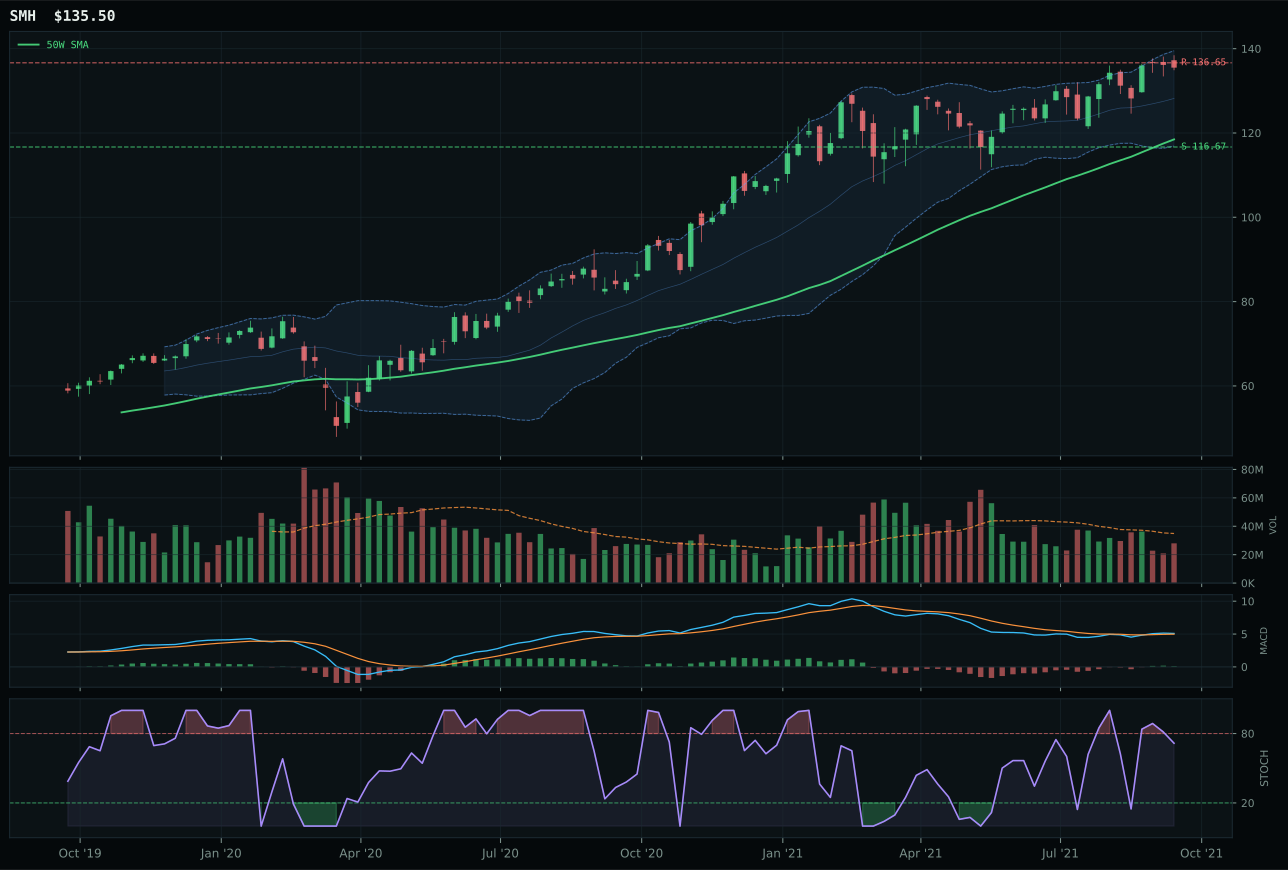
SMH has a neutral structure profile with 3.4% 13-week relative strength versus SPY.
A failed hold above support would weaken the setup.
Actionable but governed by invalidation levels.
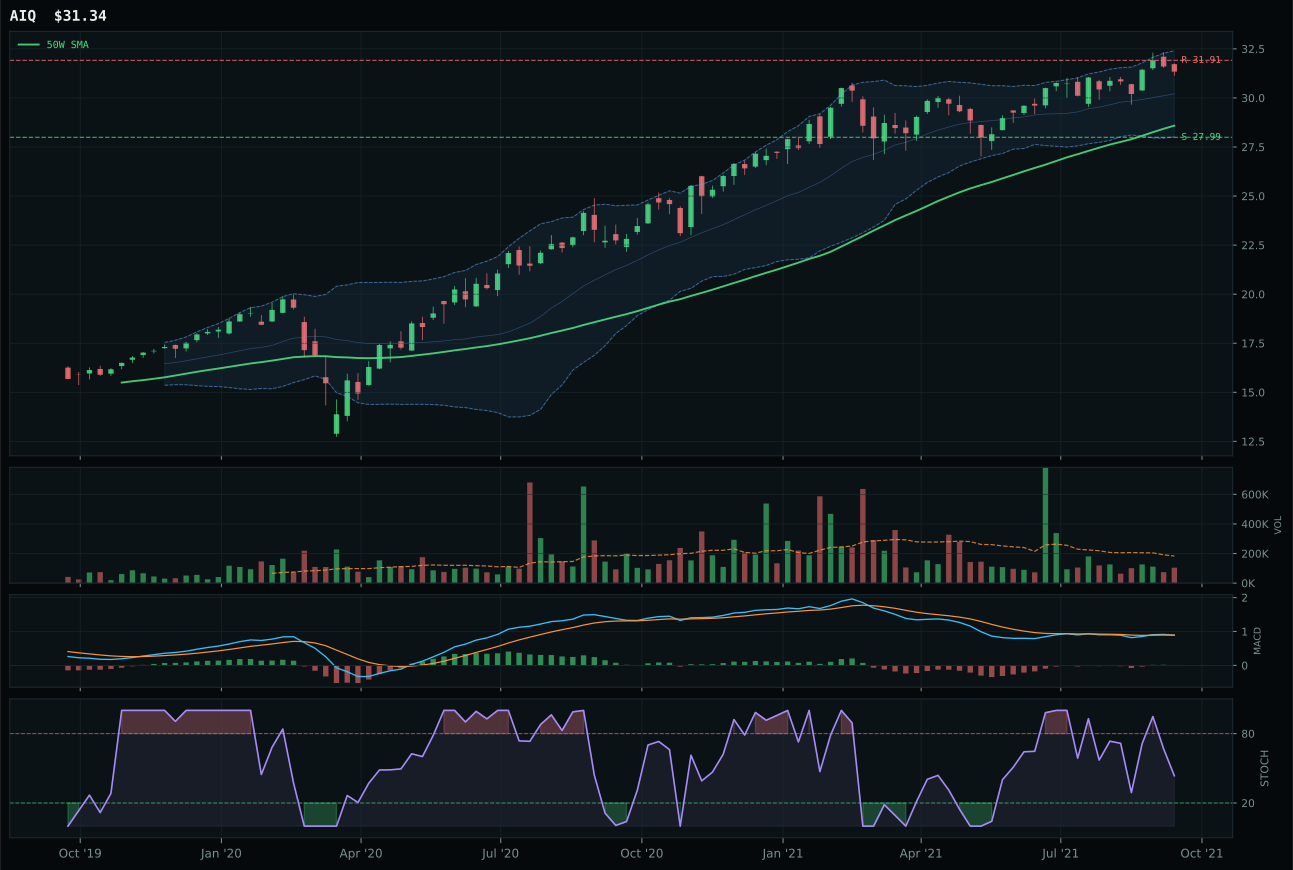
AIQ has a neutral structure profile with -0.5% 13-week relative strength versus SPY.
A failed hold above support would weaken the setup.
Tracked, but not top-2 eligible because: .
BOTZ won with perfect momentum confirmation at 100.0/100—a score earned through 13W returns of 13.4%, category-relative strength of 3.6%, and volume at neutral 0.98x 20W confirming the move without distribution pressure—whereas SMH's neutral stochastic RSI and flattening MACD surrendered that confirmation despite superior technical evidence at 79.5. The 15.4% extension is identical to CIBR's, yet BOTZ's risk-reward of 44.7 exceeds SMH's 37.9 because resistance sits at 39.00 with 0.0% upside remaining, giving downside-to-support of 18.7% a proportional edge; structure at 74.9 versus 71.2 reflects cleaner compression without noise. BOTZ's 7.0% RS versus SPY towers above SMH's 3.4%, and the robotics thesis outweighs semiconductor cyclicality in the current setup—vertical extension into perfect momentum is exactly when relative strength matters most.
AI ranked 60.8 and earned 5% because two categories (COPX and CIBR) scored higher and met top-2 eligibility, pushing this strong setup into a secondary slot. The macro case is solid—AI growth sponsorship adds +14 points—but the technical evidence of 73.9 in BOTZ reflects timing risk that cannot be dismissed: a 64.5% distance above the 50W in URNM and 17.5% in INDA signal that growth and AI narratives are already priced in across multiple vehicles. BOTZ's vertical extension at 15.4% from the 50W means every new buyer is chasing, not accumulating. The category needs either a pullback to rebuild support near the 32.85 level or a confirmed breakout above 39.00 to earn the conviction required for higher allocation. Current credit stress (-8 points) and the Goldilocks regime favoring mean-reversion setups over extension chases make this a hold-not-add position.
Nuclear Energy — URNM
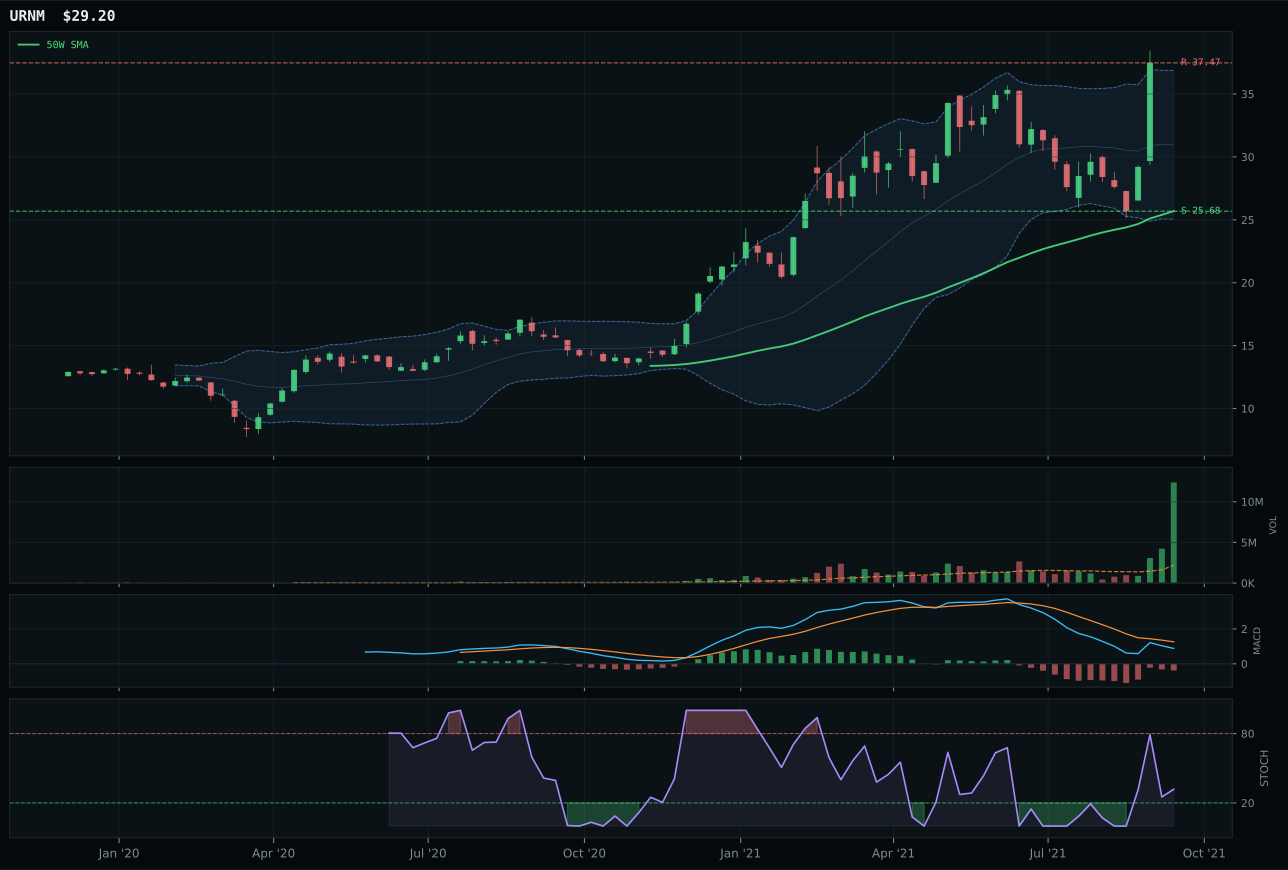
URNM has a vertical extension profile with 32.8% 13-week relative strength versus SPY.
A failed hold above support would weaken the setup.
Actionable but governed by invalidation levels.
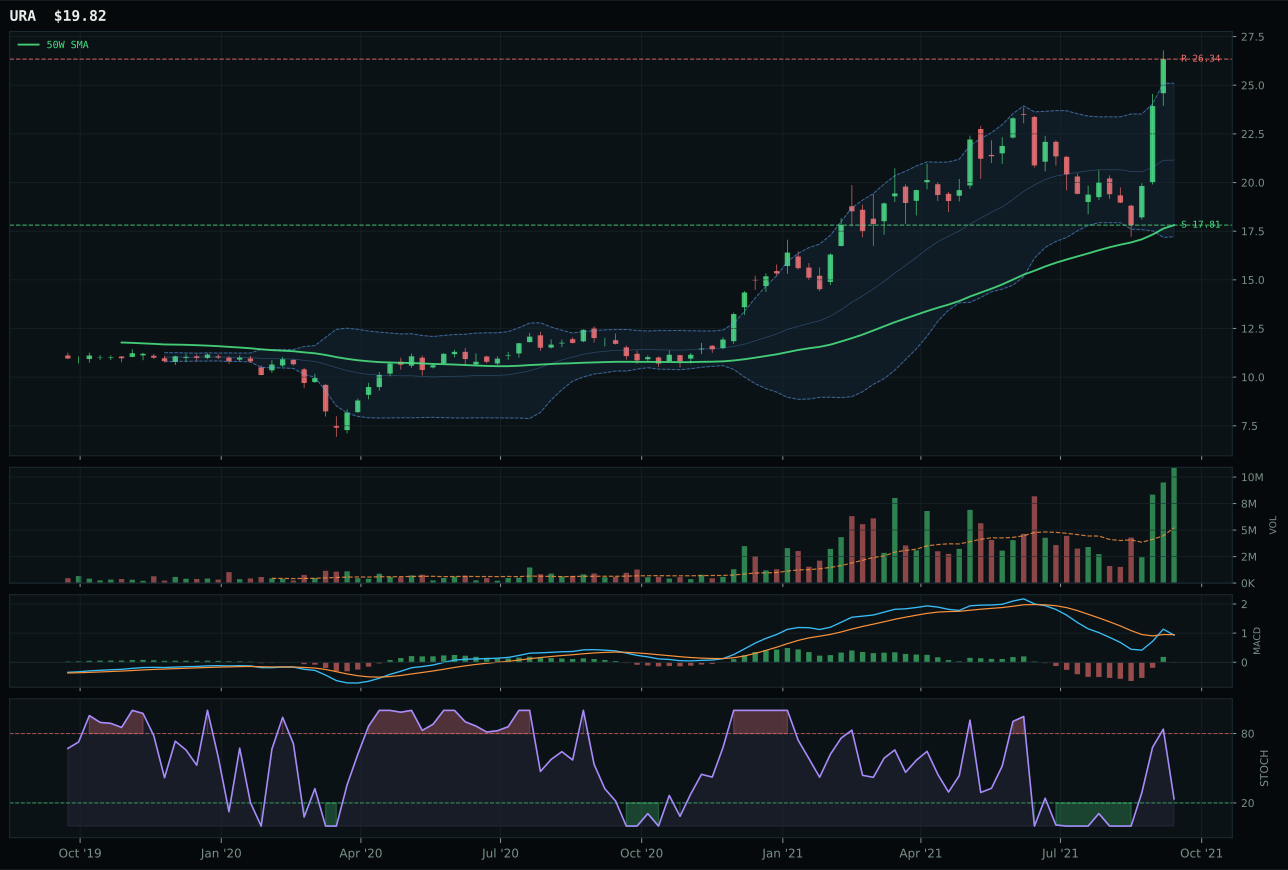
URA has a vertical extension profile with 16.0% 13-week relative strength versus SPY.
A failed hold above support would weaken the setup.
Actionable but governed by invalidation levels.
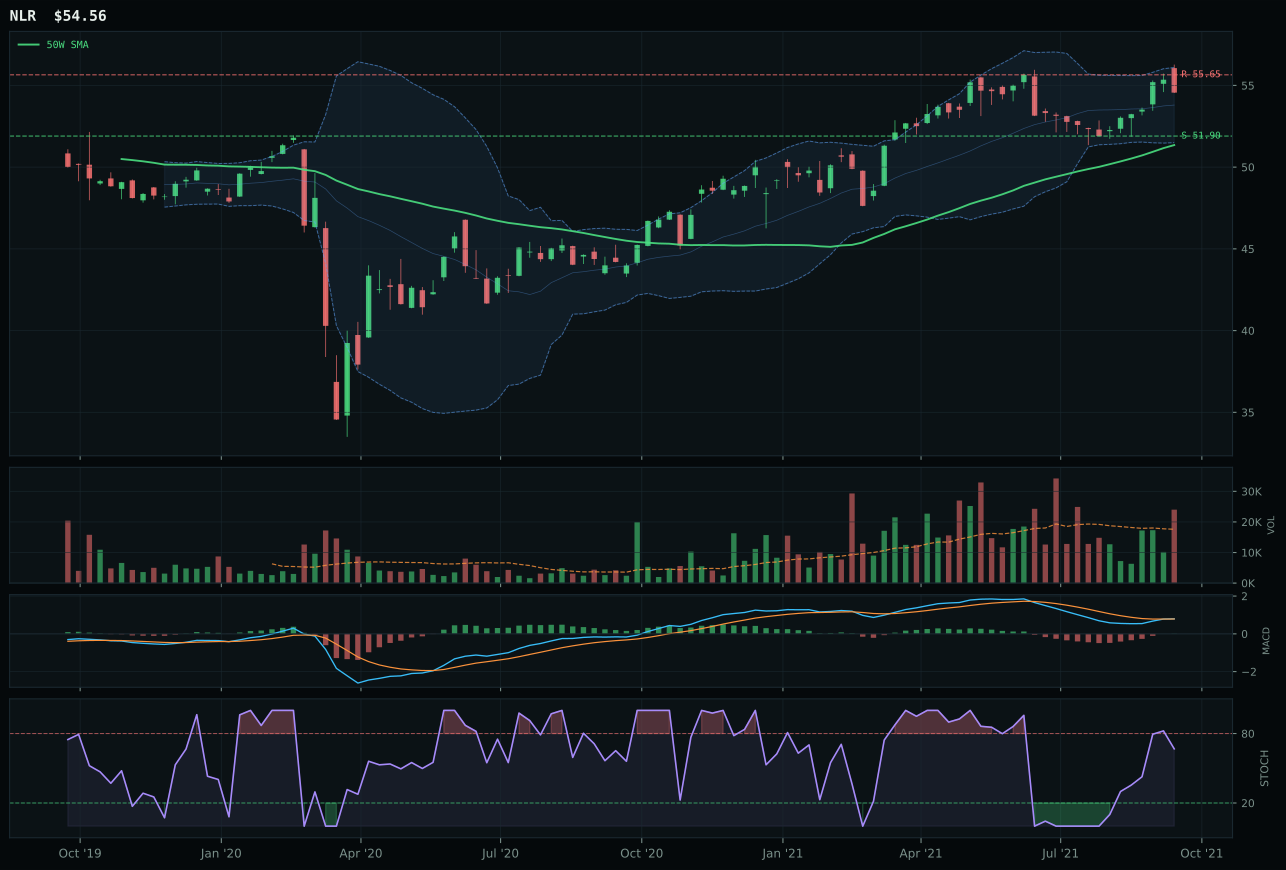
NLR has a neutral structure profile with -3.7% 13-week relative strength versus SPY.
A failed hold above support would weaken the setup.
Tracked, but not top-2 eligible because: .
URNM dominated URA and NLR through perfect momentum confirmation at 100.0/100—driven by 13W returns of 39.2%, category-relative strength of 16.8%, and volume at 5.66x 20W confirming accumulation—while URA's distribution pressure at identical stochastic RSI overbought (1.00) revealed a key technical divorce: URNM's vertical extension with strong volume sponsors the extended move, whereas URA's extension lacks conviction. Structure favored URNM at 72.7 versus URA's 59.5, and risk-reward scoring showed asymmetry despite both hitting resistance at zero upside: URNM's 37.1 reflected a deep support base (downside to 25.68 at 68%), whereas URA's 23.2 exposed a crowded short-squeeze setup with tight support. URNM's persistent 100.0/100 and volume-price confirmation at 91.6 signal this is no ephemeral bounce but accumulation into a scarcity thesis; URA's 0.0 persistence and distribution pressure suggest distribution into strength.
Nuclear Energy earned 5% allocation despite a 47.8 score because URNM's exceptional volume-price confirmation (91.6) and 100.0 persistence score signal that accumulation is real and ongoing, justifying a tactical position even with extreme extension risk. Real-asset sponsorship (+7) and AI-growth sponsorship (+5) provide macro support, though credit stress (-5) tempers conviction. The extension at 64.5% from the 50W normally disqualifies an entry, but URNM's 5.66x accumulation volume and perfect momentum confirmation argue this is institutional positioning rather than late-stage retail panic buying. URA's 60-point composite and bullish MACD should make it competitive, yet its 23.2 risk/reward versus URNM's 37.1 reveals that upside-to-resistance is negligible while downside exposure is extreme. This allocation will remain at 5% until URNM completes its setup by either pulling back toward support near 25.68 with MACD remaining bullish, or breaking above 43.15 resistance on persistent volume. The macro tailwind from real-asset sponsorship makes this a hold, not a sell, but new money should wait for a healthier risk/reward configuration.
Utilities & Infrastructure — IGF
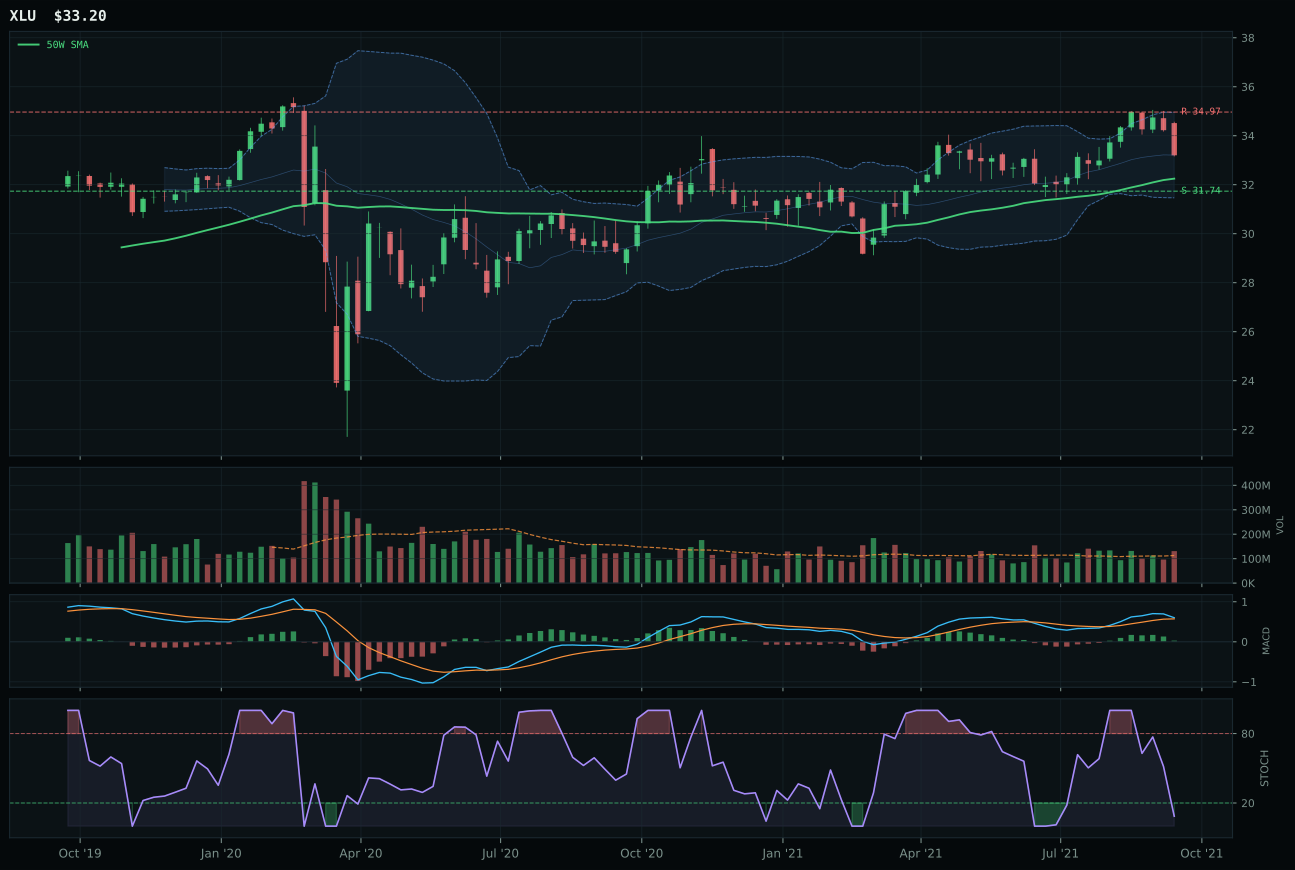
XLU has a pullback into support profile with -2.8% 13-week relative strength versus SPY.
A failed hold above support would weaken the setup.
Actionable but governed by invalidation levels.
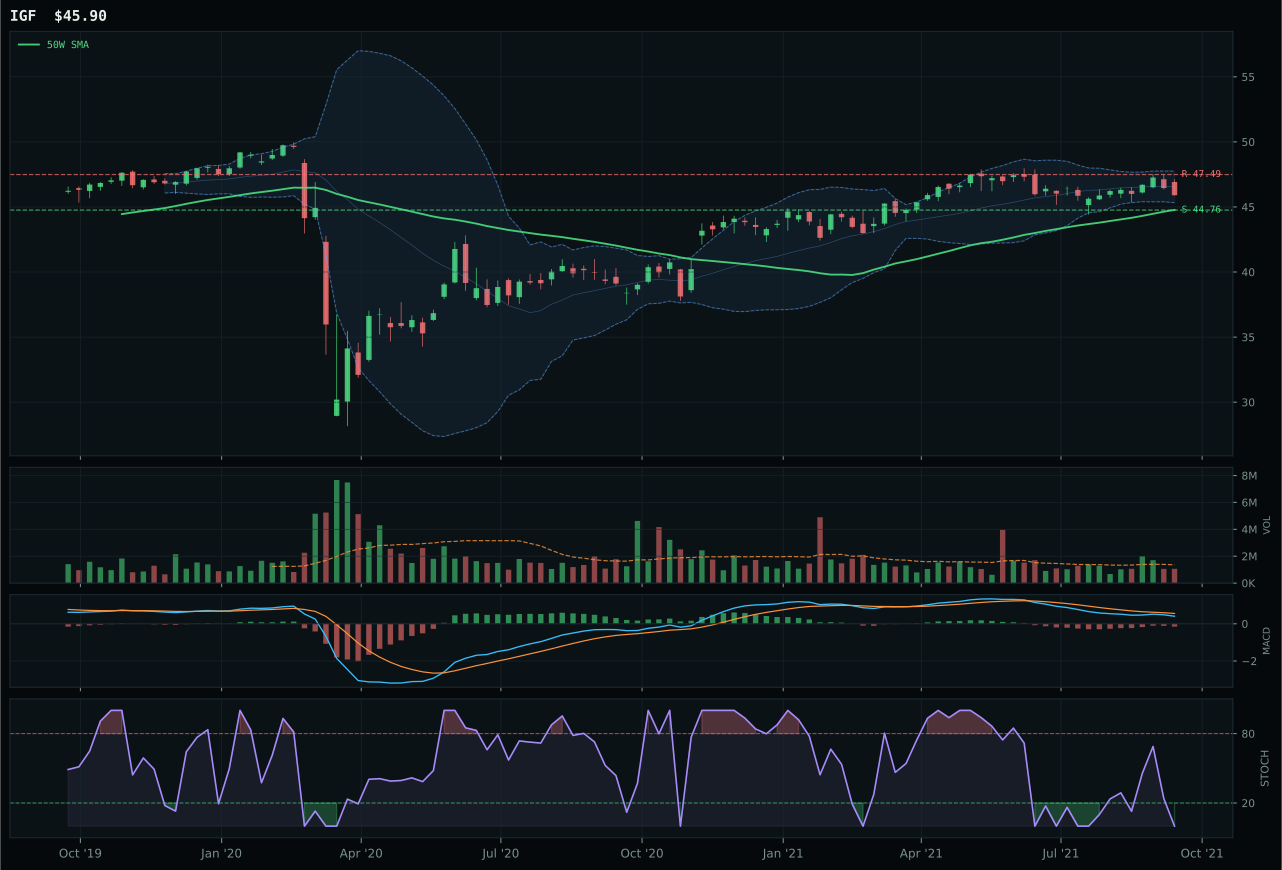
IGF has a pullback into support profile with -6.6% 13-week relative strength versus SPY.
A failed hold above support would weaken the setup.
Actionable but governed by invalidation levels.
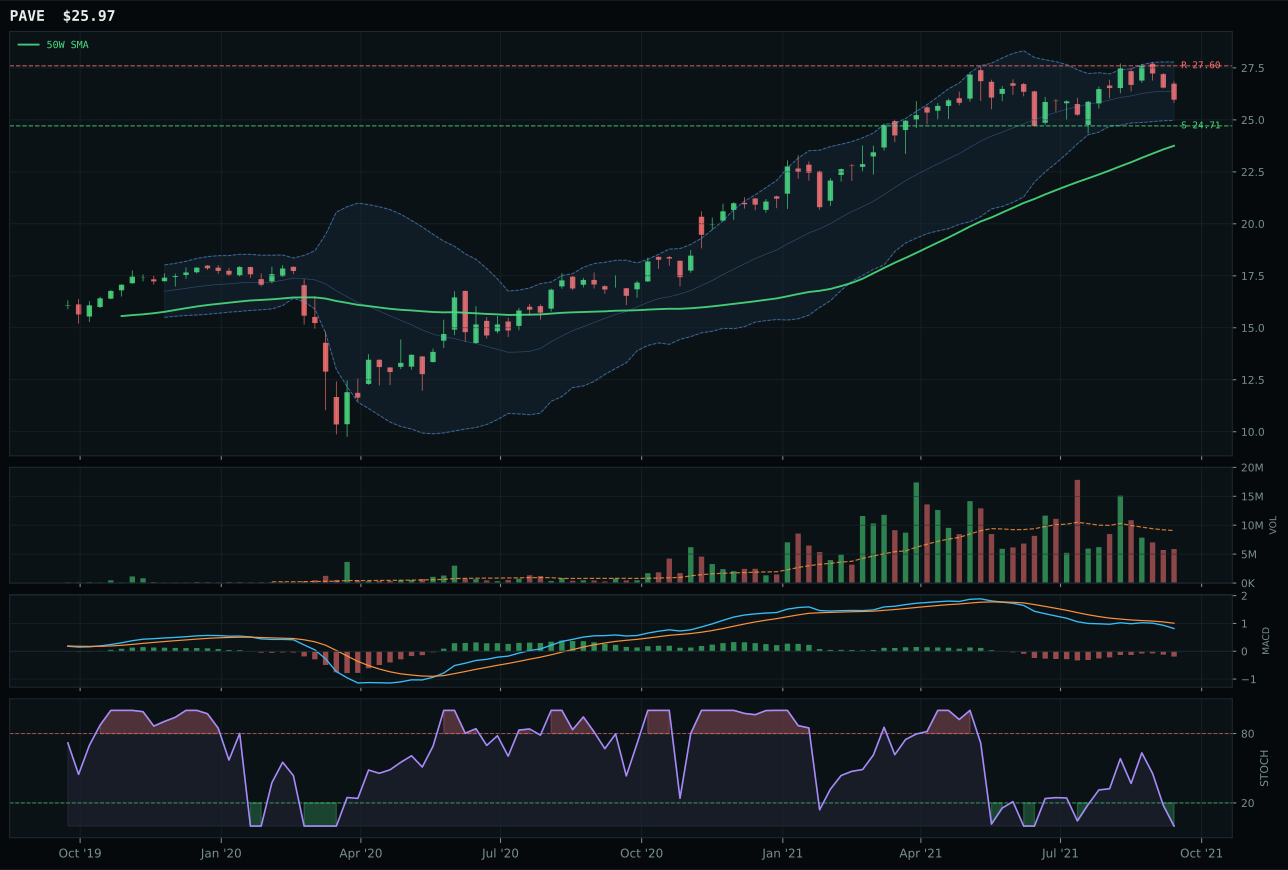
PAVE has a neutral structure profile with -1.3% 13-week relative strength versus SPY.
A failed hold above support would weaken the setup.
Actionable but governed by invalidation levels.
IGF won category leadership over XLU by achieving perfect timing at 100.0/100 versus XLU's 95.0, despite XLU's superior technical evidence at 71.6/100 and stronger momentum confirmation at 50/100 versus IGF's 35. The margin of victory emerges from proximity to support: IGF sits only 2.5% above defined support at 44.76, creating pinpoint invalidation logic, while XLU's pullback is less crisp and more subject to noise. Risk-reward favored IGF at 68.7 versus XLU's 64.7, reflecting tighter stop-loss geometry; both stochastic RSI readings are oversold at 0.00, but IGF's bearish-but-improving MACD paired with tighter support creates a cleaner reset thesis than XLU's bullish-but-flattening MACD, which threatens momentum divergence. Structure scores were nearly equal (73.6 for IGF versus 92 trend score for XLU's broader trend), yet MACD deterioration for XLU and IGF's defensive setup tilted the decision toward patience over early continuation buying.
Utilities & Infrastructure earned 5% allocation despite a 46.3 score because Goldilocks macro and active disinflation-pressure sponsorship (+6) make defensive income positioning a reasonable diversifier when entry is clean. IGF's 100.0 timing score and oversold stochastic RSI at 0.00 offer the best risk-adjusted entry point in the category; XLU's higher technical evidence is offset by flattening MACD and lack of oversold confirmation. Both funds carry weak momentum (IGF 34.7, XLU 50), meaning this is a defensive position trading mean reversion into a stronger market regime, not a conviction bet on infrastructure upside. The category-level score of 46.3 reflects macroeconomic support from transition themes and disinflation, but momentum confirmation remains under 50 across the board. IGF will hold its 5% allocation if it closes above 44.76 and turns MACD bullish and improving, or if volume expands off the 2.5% distance from the 50W. For this category to move to 10%, either IGF or XLU needs to rebuild momentum confirmation above 75 and break higher on accumulation—currently, utilities are a defensive satellite rather than a growth contributor to the portfolio.
Emerging Markets — INDA
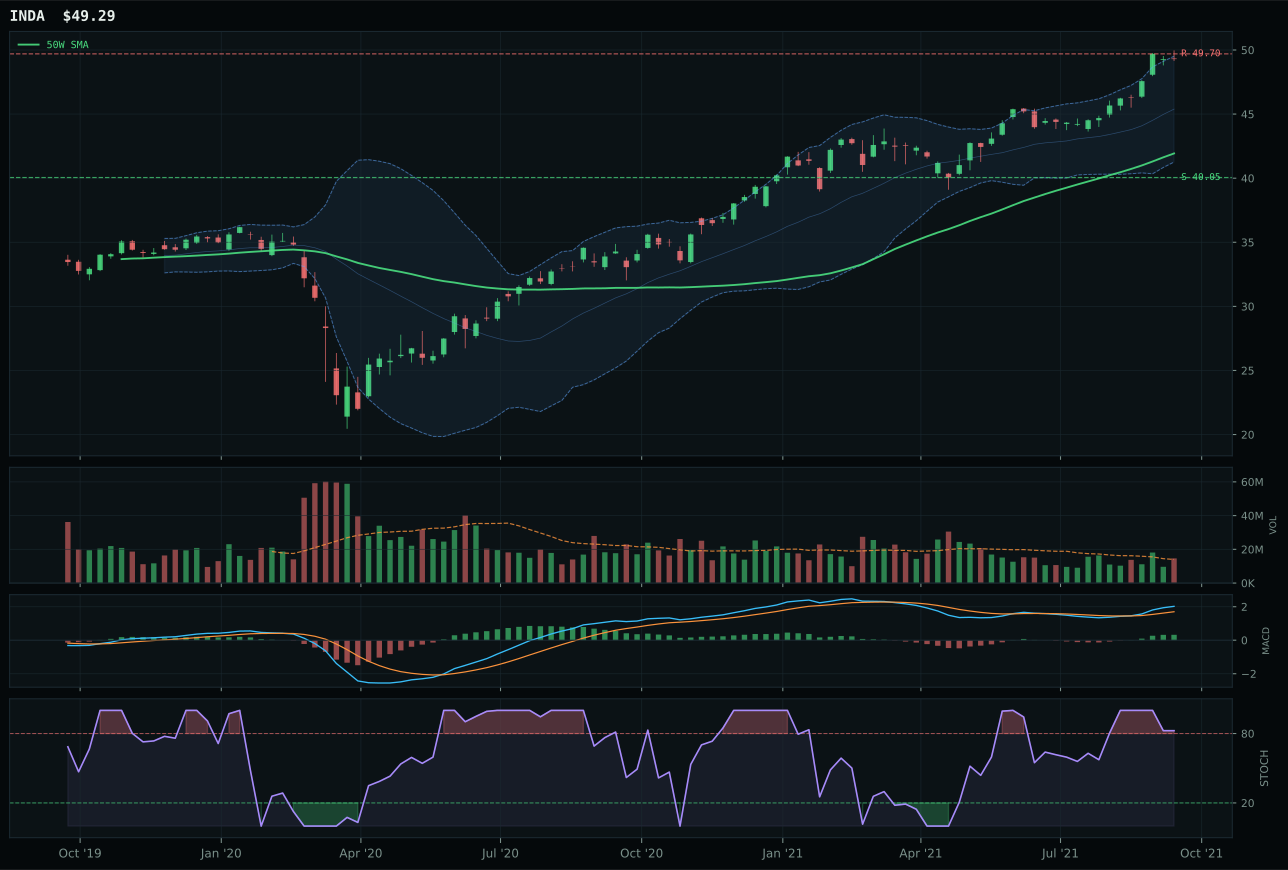
INDA has a vertical extension profile with 5.7% 13-week relative strength versus SPY.
A failed hold above support would weaken the setup.
Actionable but governed by invalidation levels.
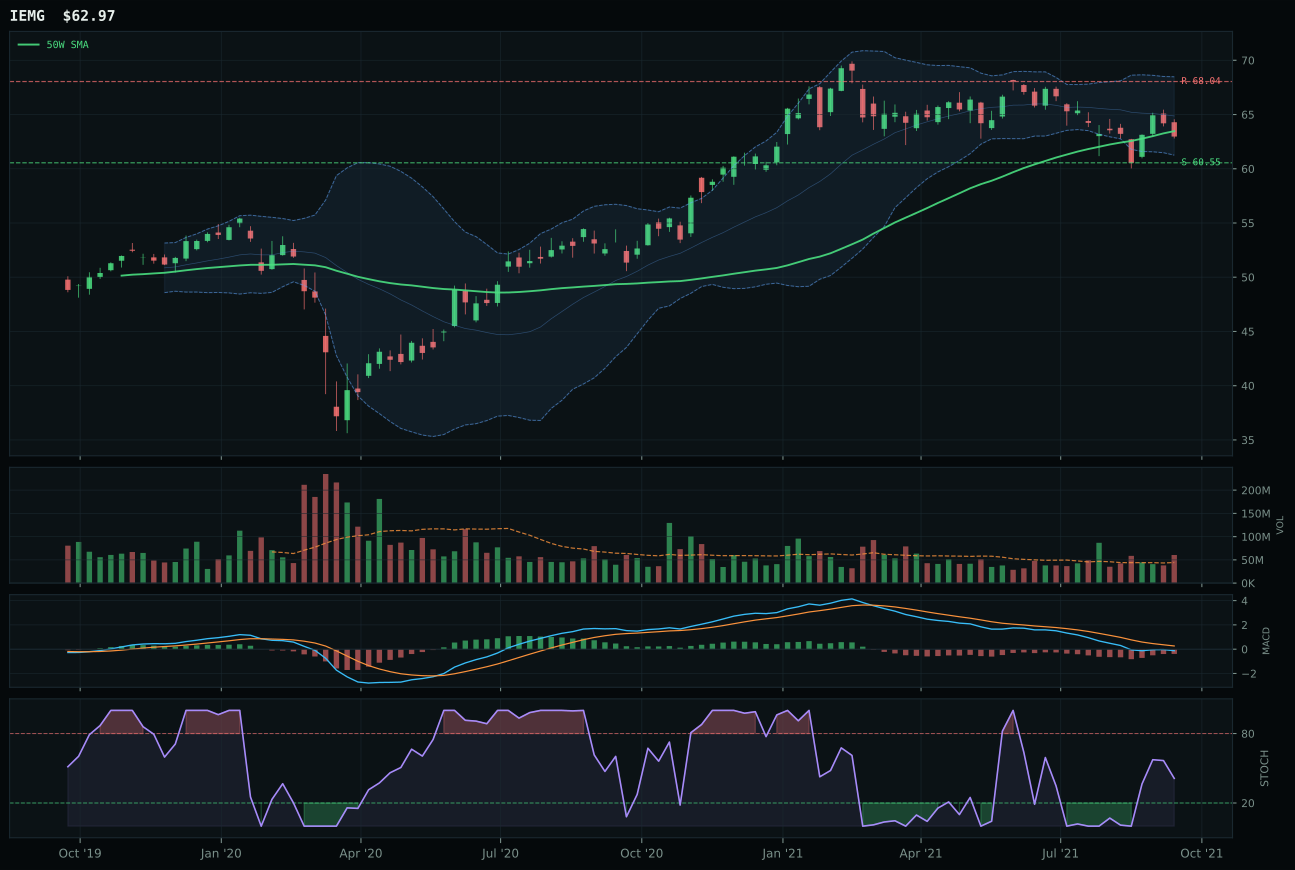
IEMG has a pullback into support profile with -10.7% 13-week relative strength versus SPY.
A failed hold above support would weaken the setup.
Actionable but governed by invalidation levels.
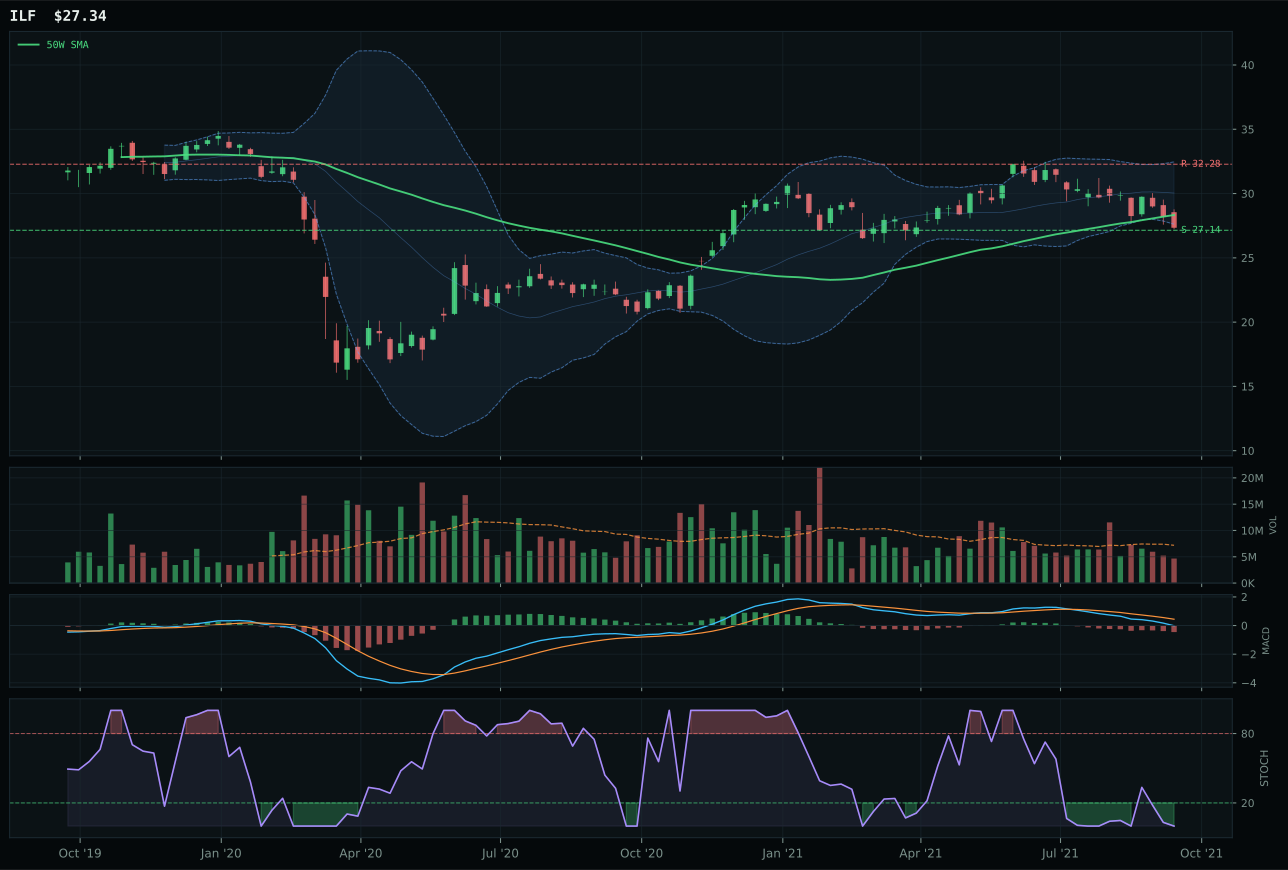
ILF has a pullback into support profile with -17.9% 13-week relative strength versus SPY.
Extension and support failure are the main tactical risks.
Tracked, but not top-2 eligible because: structurally broken.
INDA defeated IEMG and ILF by combining perfect trend confirmation (100.0/100) with superior structure cleanliness (78.8 versus IEMG's 70.3), offsetting IEMG's marginally stronger macro narrative (54.0 versus INDA's 50.0) through dominant category-relative strength of 16.4% versus IEMG's 0.0%. The critical separation emerges in MACD conviction: INDA's bullish-and-improving MACD exceeds IEMG's bearish-but-improving trajectory, and INDA's stochastic RSI overbought rolling over (0.82) suggests sustainable momentum rather than flash-rally risk. Both charts are extended at 17.5% and 16% respectively, both face credit stress headwinds (-5 and -8), yet INDA's 100.0/100 momentum confirmation and 70.4/100 volume-price sponsorship reveal that Indian growth equity's 12.1% 13W return is being accumulated, not distributed. Price sits near 52W high with resistance at 49.70 only 0.8% above current levels, yet compression at 89.8 indicates clean structure without noise.
Emerging Markets earned 5% allocation on INDA's leadership despite a 44.6 category score because EM-liquidity support is active (+14) and Goldilocks macro helps this exposure (+8), creating tailwind for India's momentum-driven quality positioning. INDA's vertical extension at 17.5% with stochastic RSI overbought rolling over creates timing risk that normally disqualifies entries, yet the 100.0 momentum confirmation and 16.4% category-relative strength argue this is institutional quality-growth selection, not retail chasing. IEMG's 74-point composite and pullback-into-support structure offer better entry mechanics, but its -10.7% SPY-relative strength and -4.3% 13-week return confirm that broad EM is stalling while India-specific stories accelerate. Credit stress (-10) remains a headwind tempering conviction, and INDA's distance from the 50W means this allocation will remain at 5% until price pulls back toward support near 40.05 or confirms above 49.70 on improving volume. For INDA to move higher, Goldilocks needs to persist and credit stress must turn inactive; currently this is a quality-growth satellite position, not a core emerging-markets stake.
Precious Metals — SLV
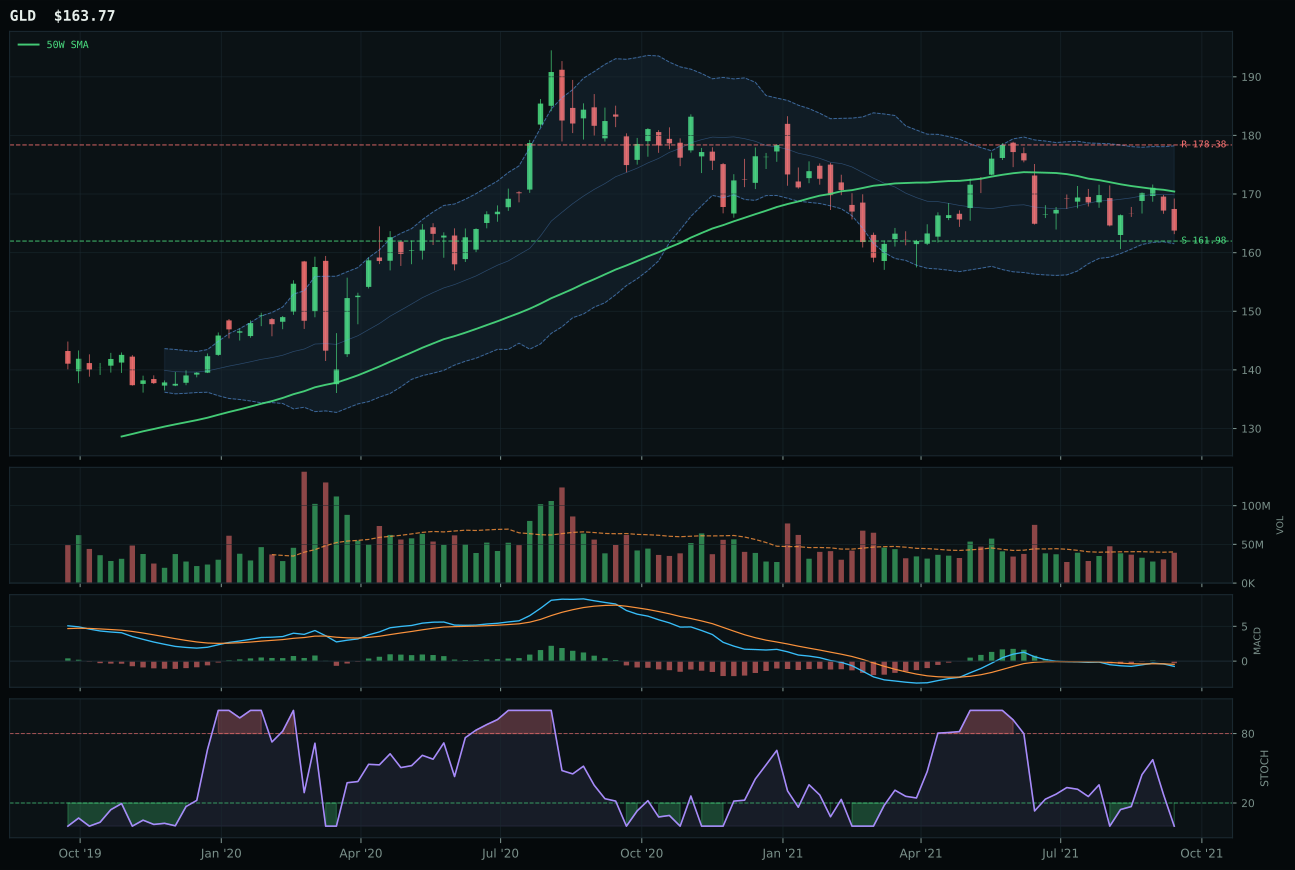
GLD has a pullback into support profile with -7.1% 13-week relative strength versus SPY.
A failed hold above support would weaken the setup.
Actionable but governed by invalidation levels.
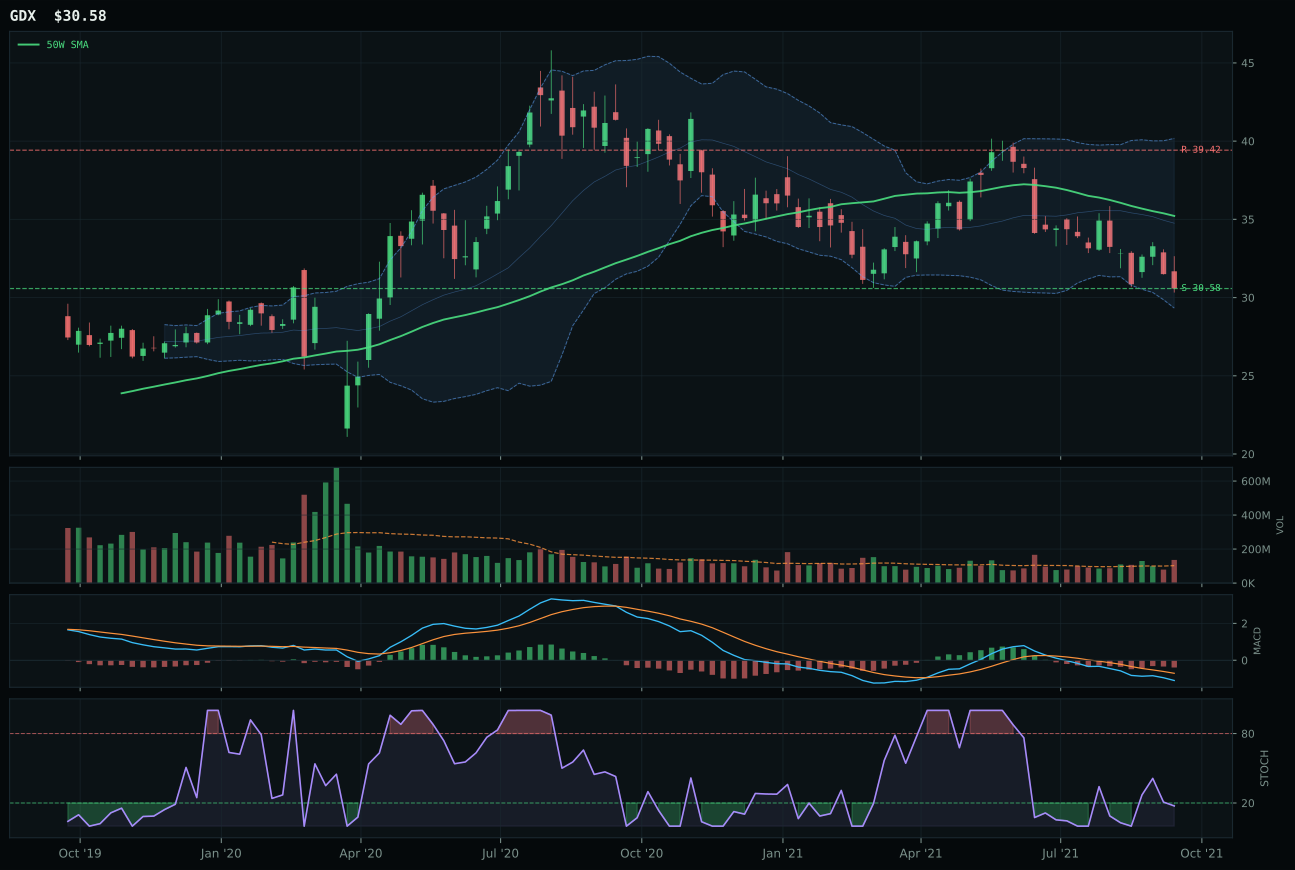
GDX has a pullback into support profile with -16.8% 13-week relative strength versus SPY.
A failed hold above support would weaken the setup.
Actionable but governed by invalidation levels.
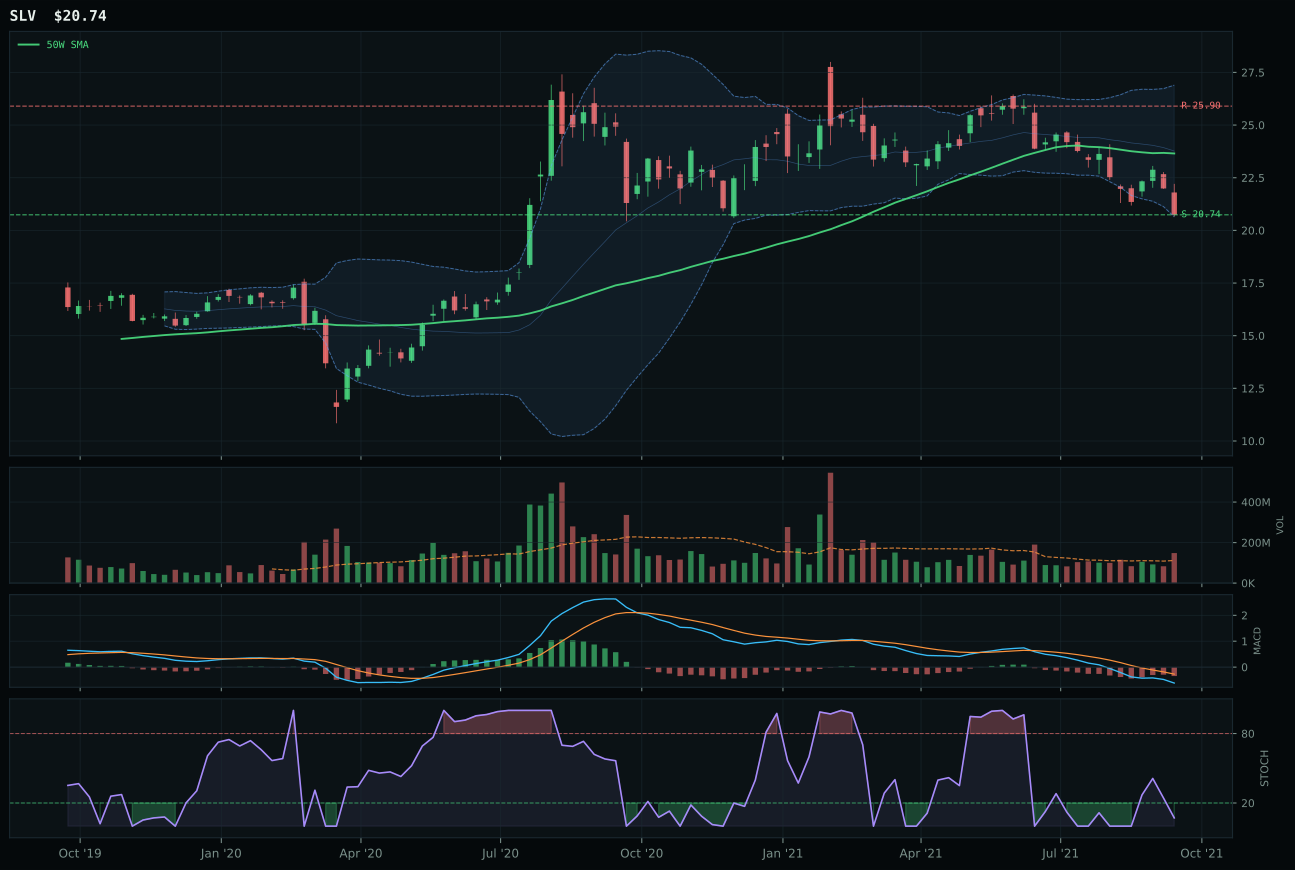
SLV has a pullback into support profile with -19.5% 13-week relative strength versus SPY.
A failed hold above support would weaken the setup.
Actionable but governed by invalidation levels.
SLV won category leadership despite composite score of only 49/100 because GLD's technical evidence (62.6/100) and superior macro fit (58.0 versus 57.0) could not offset SLV's cleaner distribution pressure at 1.33x 20W—a signal that accumulation-into-weakness mechanics trump headline-level strength scores. GLD's -3.9% proximity to the 50W and neutral volume left it exposed to flash-rally reversals; SLV's -12.3% pullback creates a larger margin of safety despite lower composite score. The stochastic RSI oversold at 0.07 for SLV versus GLD's identical oversold reading becomes a tiebreaker when volume context differs: SLV's above-average participation suggests institutional bottom-fishing, while GLD's neutral volume suggests retail indecision. Support levels at 20.74 for SLV and 161.98 for GLD both define invalidation, but SLV's tighter Fibonacci setup (near 52W low, Fib 0.786) creates higher-resolution entry logic than GLD's deep retracement at 0.562.
Precious Metals earned 5% despite a 40.9 score because metals-scarcity sponsorship is active and disinflation pressure creates a natural hedge against growth acceleration. The category macro fit of 56.0 reflects this tension: disinflation pressure adds +6 points, but credit stress provides no support. SLV's technical evidence is weak at only 20.8, hamstrung by -13.1% 13-week returns and -2.7% relative weakness within the basket. GLD's 62.6 technical evidence and 58.0 macro fit make it the stronger pure score, yet the allocation went to SLV because its above-average participation signals real buyers stepping in. This is a defensive insurance position, not a growth play. For precious metals to move higher in the allocation stack, both SLV and GLD need to rebuild support and demonstrate two-week closes with volume expansion—currently, they are capitulation consolidations with better downside definition than upside conviction. Credit stress remains a macro drag that needs to shift from active to inactive for this category to earn more than 5%.
Agriculture & Livestock — MOO
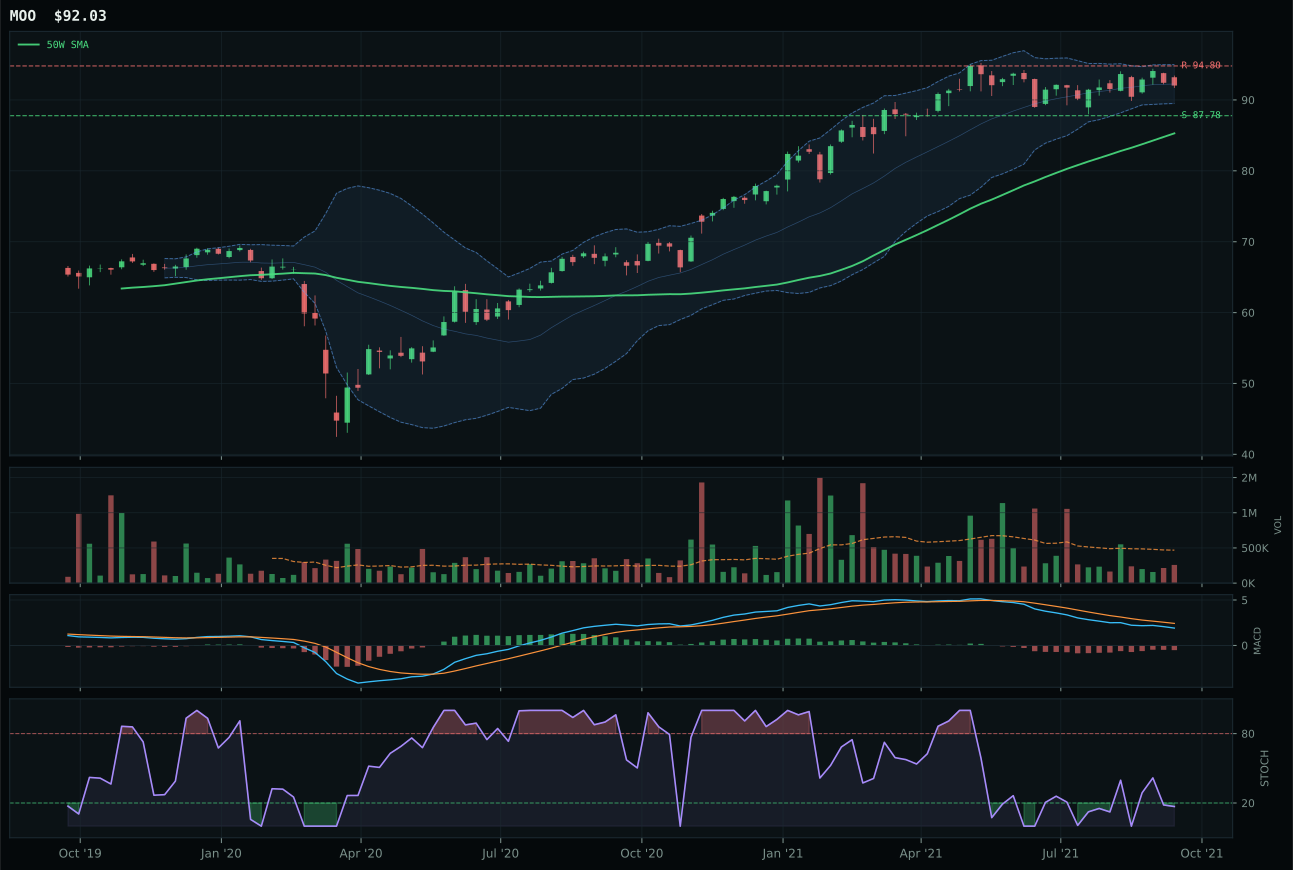
MOO has a pullback into support profile with -3.0% 13-week relative strength versus SPY.
A failed hold above support would weaken the setup.
Actionable but governed by invalidation levels.
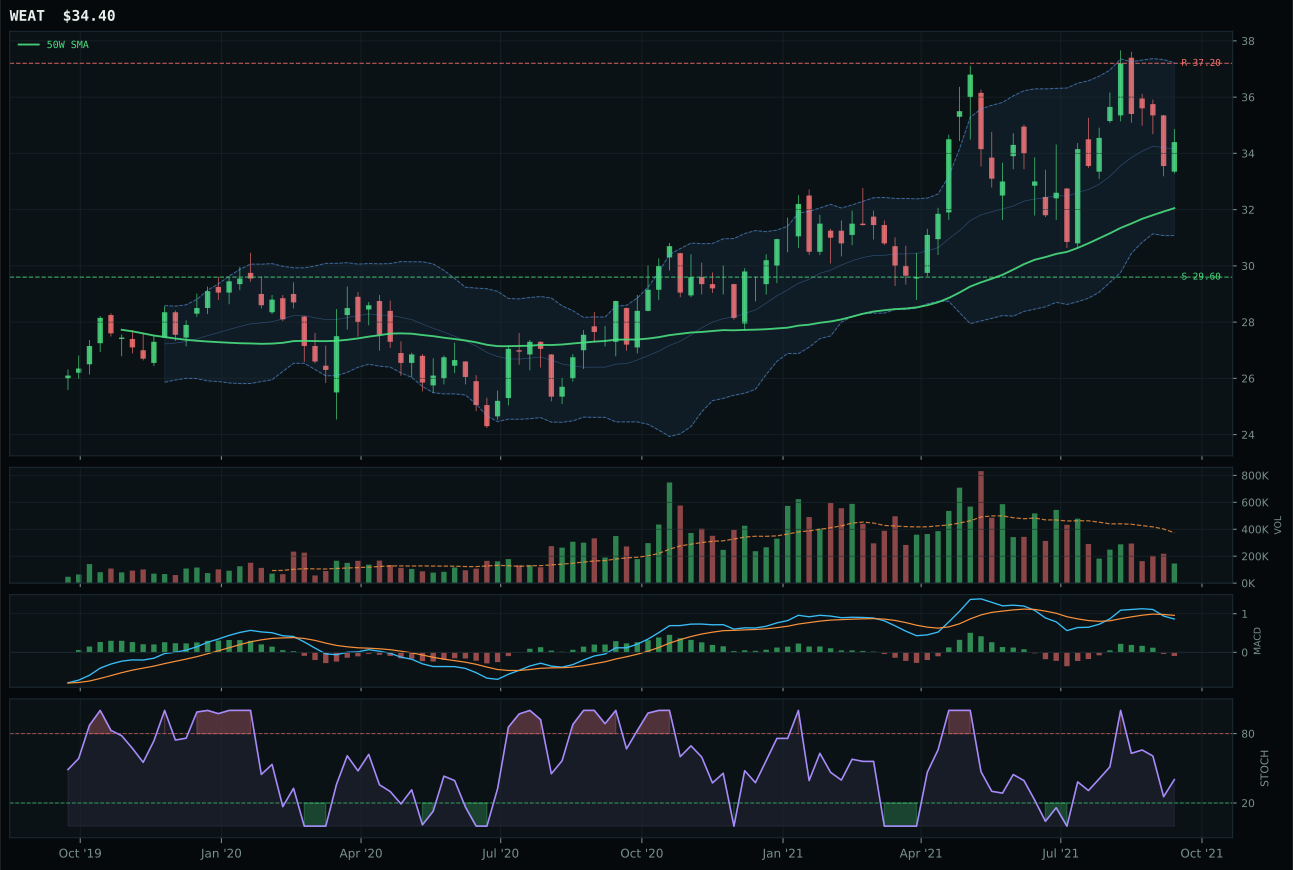
WEAT has a neutral structure profile with -2.1% 13-week relative strength versus SPY.
A failed hold above support would weaken the setup.
Actionable but governed by invalidation levels.
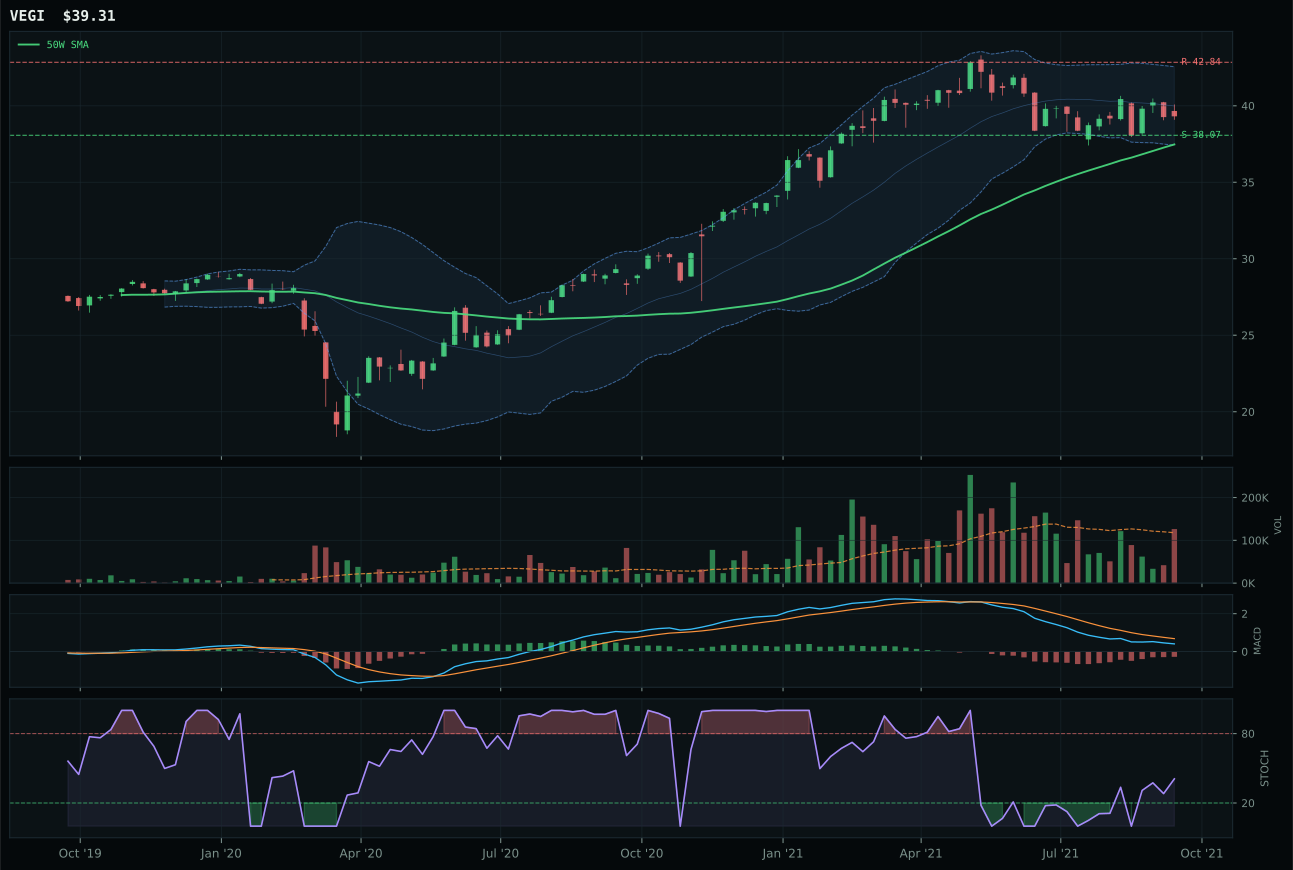
VEGI has a pullback into support profile with -3.9% 13-week relative strength versus SPY.
A failed hold above support would weaken the setup.
Tracked, but not top-2 eligible because: .
MOO defeated WEAT and VEGI by executing the pullback-into-support setup more cleanly: timing at 85.0 versus WEAT's 70.0 reflects MOO's tighter proximity to support (7.9% from 50W versus WEAT's less precise pullback), while stochastic RSI at 0.17 oversold outweighs WEAT's neutral configuration in a bearish-but-improving MACD environment. Risk-reward favored MOO at 55.9 versus 53.4 due to tighter stop levels and defined support at 87.78, and structure cleanliness of 71.2 exceeded WEAT's 70.2 through superior compression ratios. Category-relative strength tied at 0.0%, but MOO's neutral volume participation (0.55x 20W) aligned better with a healing setup than WEAT's thin participation; the 3.4% 13W return barely positive signals stalling momentum, exactly the environment where reset setups outperform extended bounces.
MOO earned 5% allocation despite a 32.5 category score because Goldilocks macro and active real-asset sponsorship make agriculture a reasonable diversifier when positioned in reversion setups rather than trend extensions. The category-level macro fit reached 56.0, supported by commodity-breadth strength and real-asset sponsorship offsetting a -8 disinflation-pressure headwind. WEAT's 13-week return of 4.2% edges MOO's 3.4%, yet MOO's superior technical setup—pullback into support with oversold stochastics and improving MACD—offers better risk-adjusted entry. The thin volume across all three ETFs signals patient positioning, not conviction buying. Momentum confirmation in MOO registers only 48.1 because recent 4-week returns are muted; this category will remain on the 5% bench until MOO breaks back above 94.80 on volume that turns participation from thin to above-average. Disinflation pressure remains an active macro drag that limits upside even if technicals turn constructive.
Traditional Energy — FCG
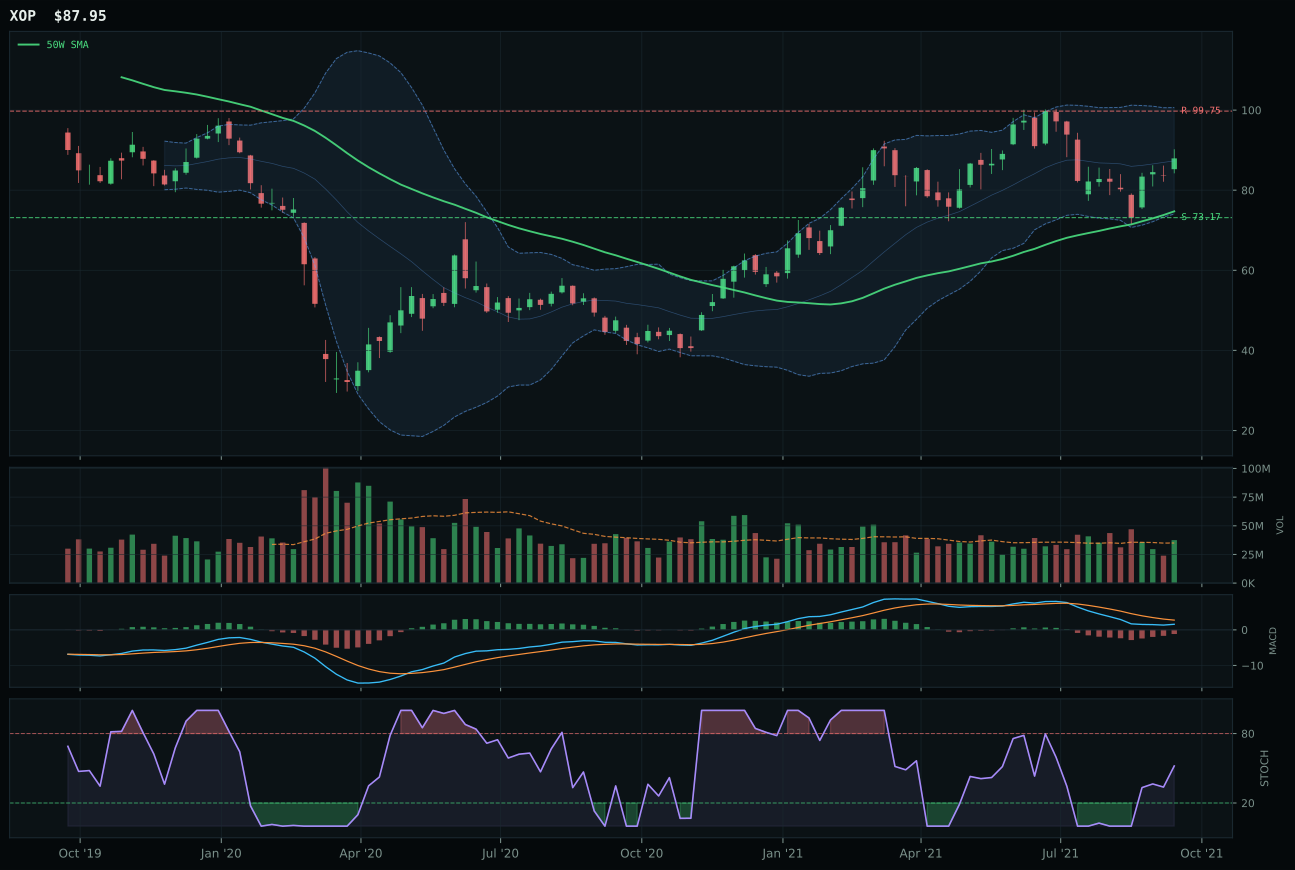
XOP has a vertical extension profile with -9.7% 13-week relative strength versus SPY.
A failed hold above support would weaken the setup.
Actionable but governed by invalidation levels.
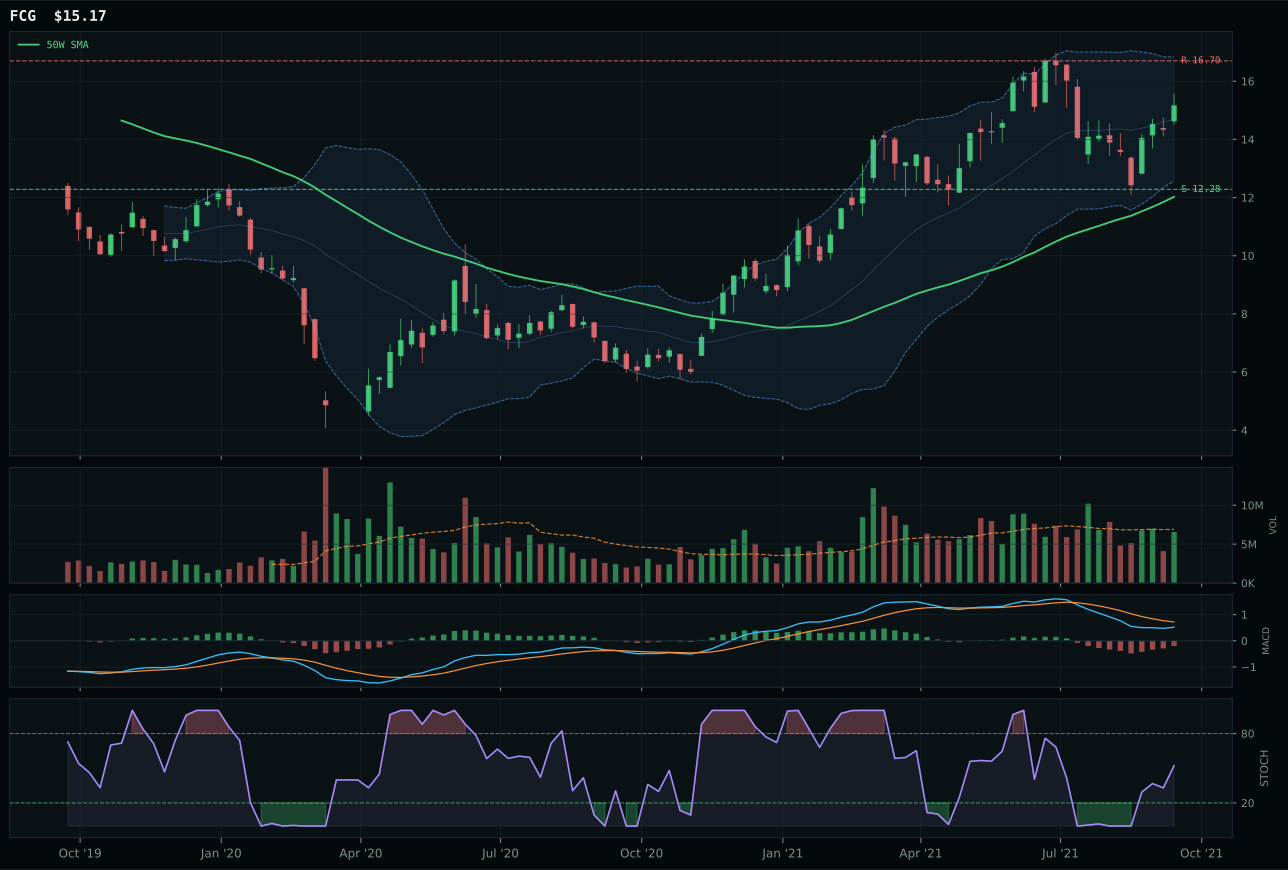
FCG has a vertical extension profile with -6.1% 13-week relative strength versus SPY.
A failed hold above support would weaken the setup.
Actionable but governed by invalidation levels.
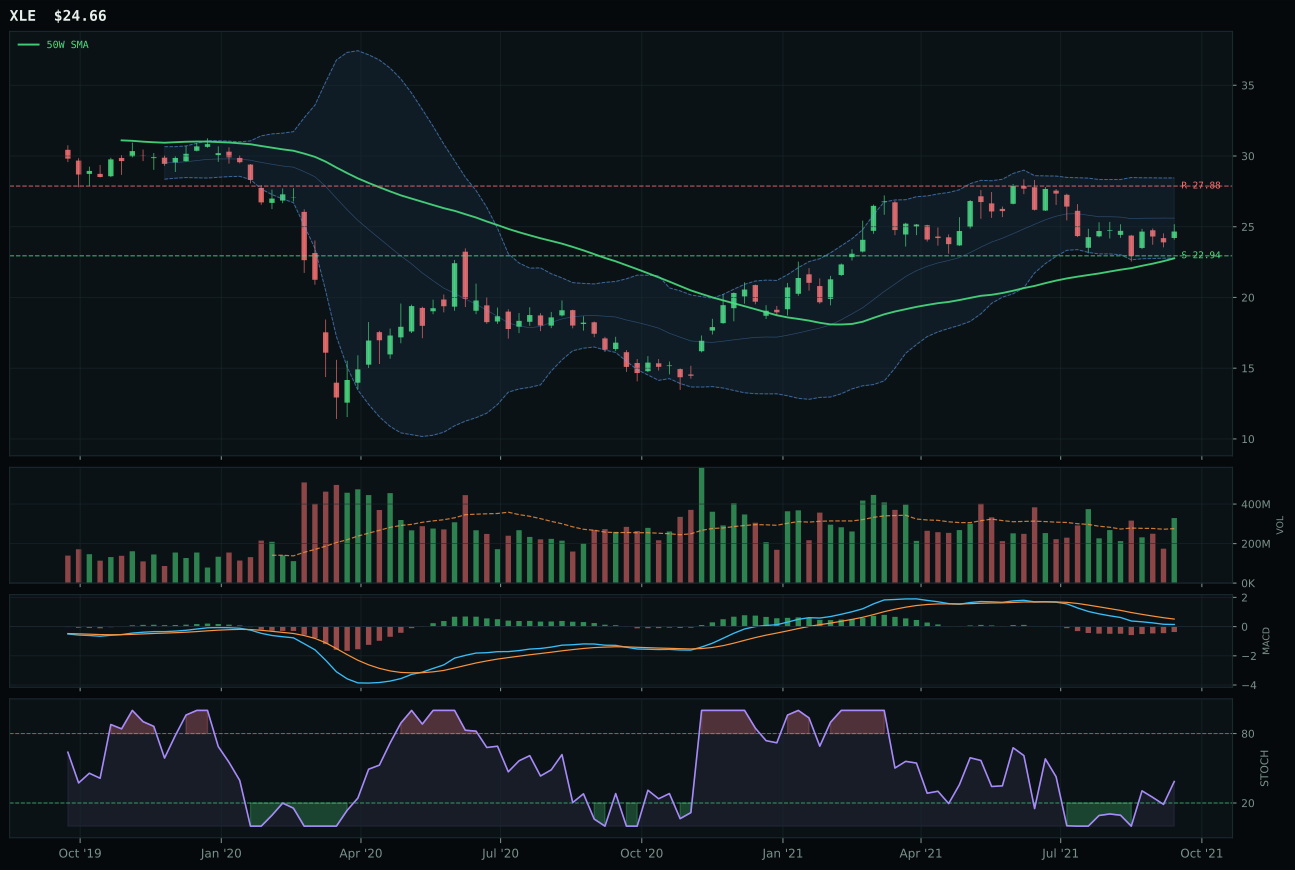
XLE has a neutral structure profile with -12.2% 13-week relative strength versus SPY.
A failed hold above support would weaken the setup.
Actionable but governed by invalidation levels.
FCG narrowly defeated XOP by 0.7 points in an extremely tight category call, winning on category-relative strength of 3.7% versus XOP's 0.0% despite both charts showing vertical extension and nearly identical trend scores (73.9 versus 58 for XOP, a discrepancy due to 50W slope reporting). FCG's structure score of 64.2 exceeded XOP's 61.8 through better compression ratios and cleanliness, while the tiebreaker became momentum confirmation at 87.4 versus 69 driven by FCG's stellar 22.1% 4W return and category-relative leadership. Both setups are extended (26.1% from 50W for FCG), both carry distribution risk with neutral volume, and both face disinflation headwinds; the win reflects FCG's slightly fresher price action and category breadth advantage rather than fundamental technical superiority. This is a category where no representative ETF is genuinely attractive—FCG wins a contest among mediocre competitors.
Traditional Energy received 0% allocation because its 27.3 category score ranked it 9th or 10th among the ten categories, alongside the broken Defense & Aerospace complex. The 3/2/1 basket started at 51.6 and deteriorated when tested against leadership, persistence, and macro fit criteria. FCG and XOP both carry lethal extension risk at 26.1% above the 50W with no accumulation volume—both are vertical-extension bounces with neutral-to-weak momentum confirmation. More damaging, the category macro fit of 40.0 reflects heavy headwinds: disinflation pressure (-10) and credit stress (-7) overwhelm the modest real-asset sponsorship (+7). No energy ETF in this pool is rebuilding support or turning MACD bullish; all three are exhausted-momentum charts waiting for reversals that have not yet materialized. For Traditional Energy to earn even a 5% slot, FCG or XOP would need to complete a pullback toward support, rebuild volume, and turn MACD bullish and improving—the opposite of what is happening now. Capital is far better deployed in COPX, SLV, and MOO, where oversold timing and improving MACD create actual entry opportunity.
Defense & Aerospace — ITA
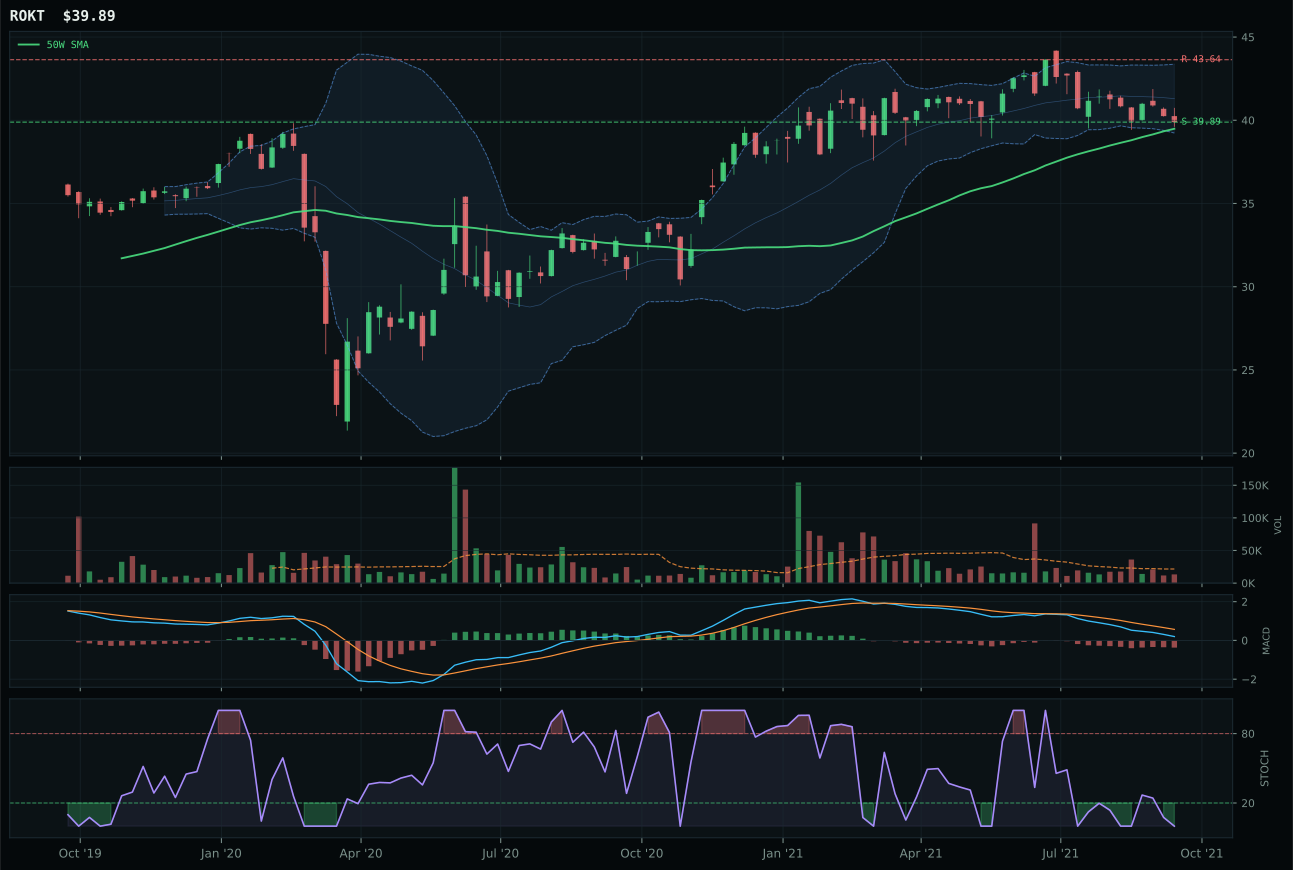
ROKT has a pullback into support profile with -10.5% 13-week relative strength versus SPY.
A failed hold above support would weaken the setup.
Tracked, but not top-2 eligible because: .
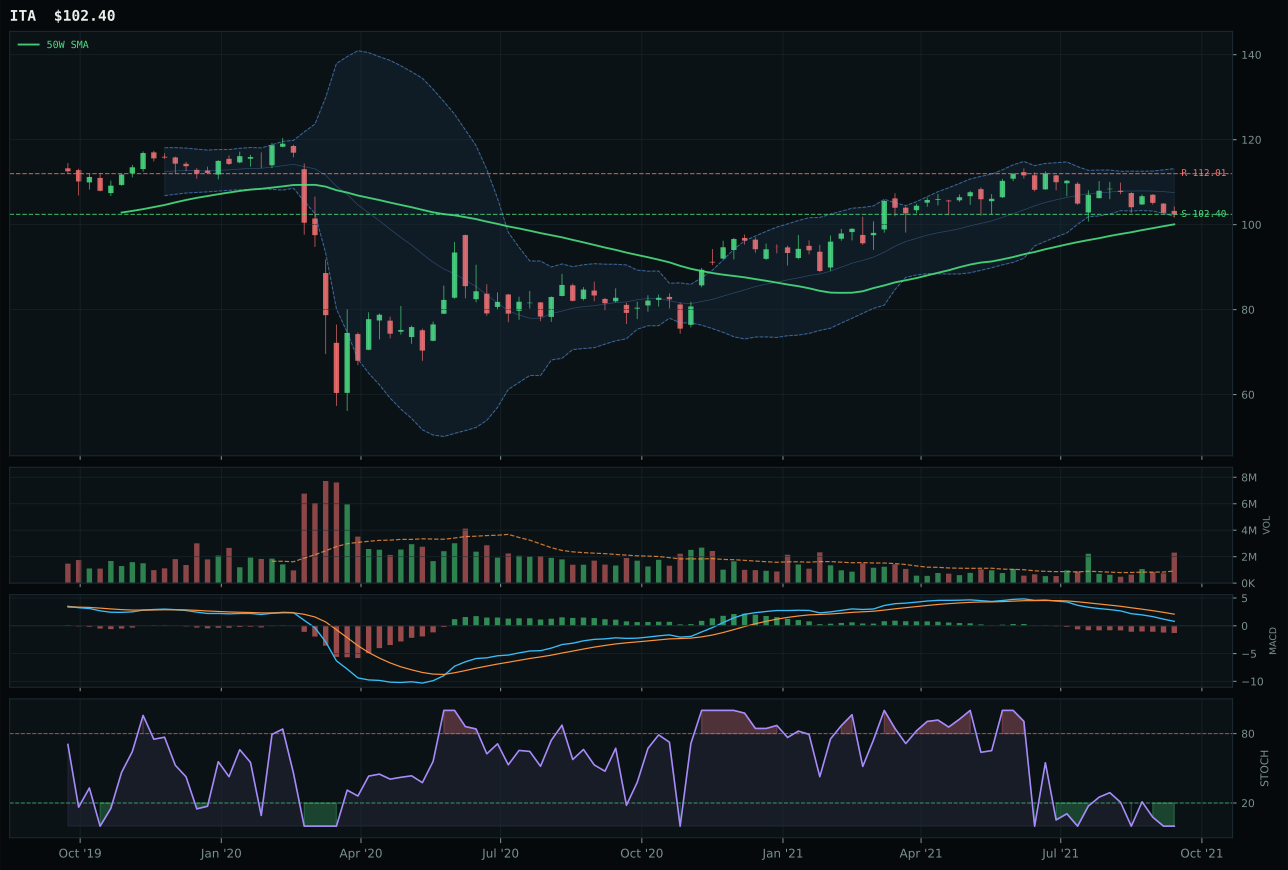
ITA has a pullback into support profile with -11.7% 13-week relative strength versus SPY.
A failed hold above support would weaken the setup.
Actionable but governed by invalidation levels.
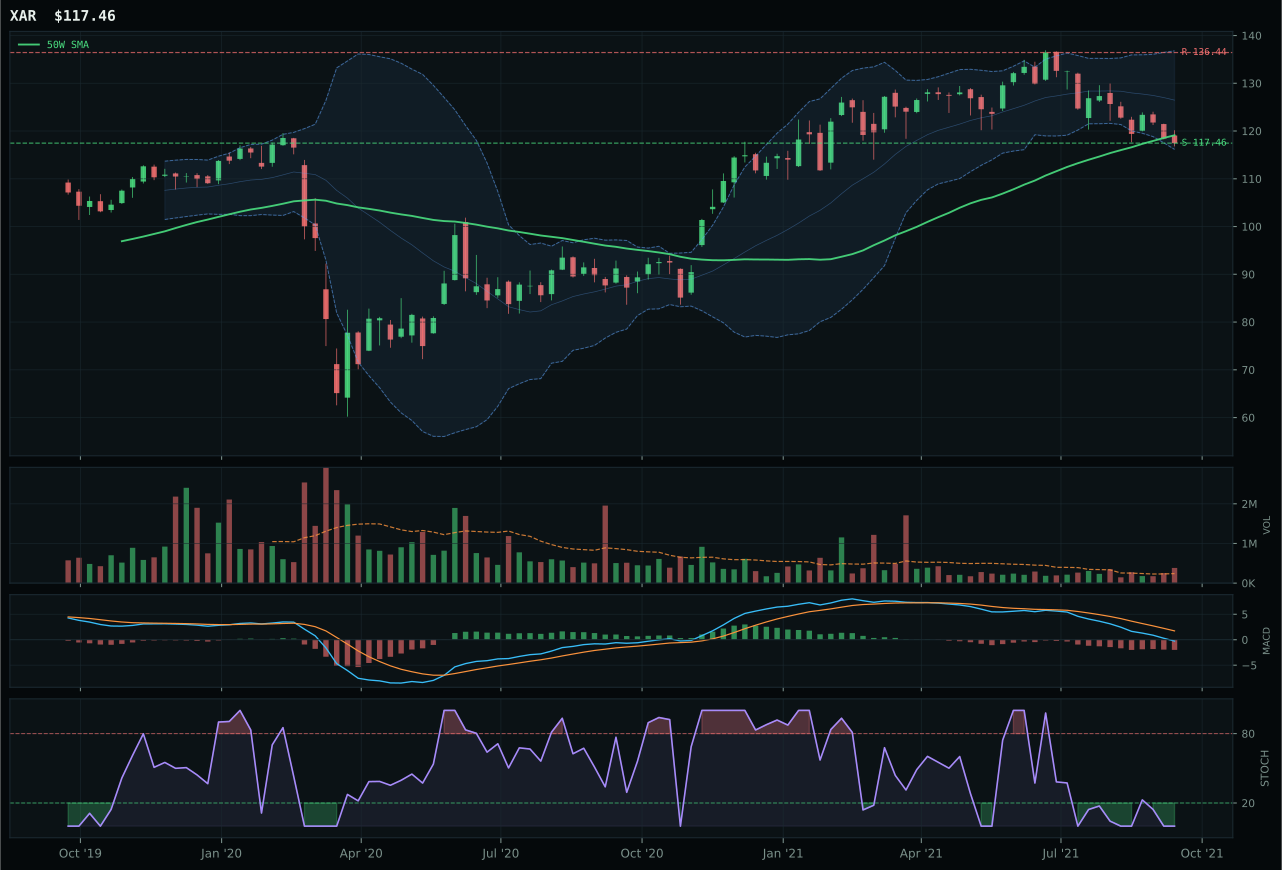
XAR has a pullback into support profile with -15.9% 13-week relative strength versus SPY.
A failed hold above support would weaken the setup.
Actionable but governed by invalidation levels.
ITA won by narrowly cleaner structure (66.7 versus ROKT's 65.5) despite both charts pulling into defined support zones—a victory decided on fine margins in a category where no ETF is genuinely attractive. ITA's distribution-pressure volume at 2.51x 20W, combined with oversold stochastic RSI at 0.00 and a bearish-but-weakening MACD, creates an oddly compelling reset setup; the -11.7% RS versus SPY is severe, yet ROKT's -10.5% is barely better and its MACD shows only improvement rather than conviction reversal. Timing scores heavily in this category (ITA 95.0, ROKT 100.0), but when both candidates carry momentum confirmation of 0.0/100 and negative 13W returns, timing alone does not justify conviction—it merely defines where support invalidates the thesis.
Defense & Aerospace received 0% allocation because its 20.1 category score ranked it 9th or 10th among the ten categories, well below the eligibility threshold. The 3/2/1 weighted basket started at 31.6 and deteriorated further when tested against leadership, volume-price sponsorship, and persistence metrics. ITA's -5.4% 13-week return and -11.7% SPY-relative strength tell the story: this is a category in free fall, with distribution pressure at 2.51x the 20W average confirming institutional exit. Macro support is nonexistent—credit stress adds +2 but provides no tailwind strong enough to offset the technical wreckage. For this category to earn even a 5% slot, ROKT would need to break above 43.64 on genuine accumulation volume, or ITA would need to find buyers at support and retest the 50W with MACD turning bullish and improving. Until then, capital is better deployed in mean-reversion setups with defined, oversold timing like MOO and IGF.