
2021-09-10
Informational purposes only. The content in this report, including allocations, analysis, and commentary, is provided solely for informational and educational purposes. It does not constitute financial advice, investment advice, trading advice, or any other type of advice. Past performance does not guarantee future results. Always conduct your own research and consult a qualified financial professional before making investment decisions.
Weekly Allocation
| Ticker | Category | Weight | Role |
|---|---|---|---|
| FSOL | 50% | Overlay | |
| CIBR | Technology | 10% | Top-2 (10%) |
| BOTZ | AI | 10% | Top-2 (10%) |
| URNM | Nuclear Energy | 5% | Tier-2 (5%) |
| COPX | Industrial Metals | 5% | Tier-2 (5%) |
| XLU | Utilities & Infrastructure | 5% | Tier-2 (5%) |
| GLD | Precious Metals | 5% | Tier-2 (5%) |
| ITA | Defense & Aerospace | 5% | Tier-2 (5%) |
| MOO | Agriculture & Livestock | 5% | Tier-2 (5%) |
Trade Instructions — Monday Open
Sell the tranche from 2021-08-13 (completing its 4-week hold). Buy the new tranche. Instructions show net portfolio changes — same-asset positions cancel, weight changes show the delta.
| Action | Ticker | Instruction |
|---|---|---|
| SELL | IGV | Sell entire IGV position (2.50% of portfolio) |
| SELL | PAVE | Sell entire PAVE position (2.50% of portfolio) |
| SELL | SMH | Sell entire SMH position (1.25% of portfolio) |
| SELL | WEAT | Sell 50% of WEAT position (reduce 2.50% → 1.25%) |
| SELL | GDX | Sell entire GDX position (1.25% of portfolio) |
| BUY | XLU | Buy XLU — 14.29% of freed cash (adds 1.25% to portfolio) |
| BUY | BOTZ | Buy BOTZ — 28.57% of freed cash (adds 2.50% to portfolio) |
| BUY | CIBR | Buy CIBR — 28.57% of freed cash (adds 2.50% to portfolio) |
| BUY | MOO | Buy MOO — 14.29% of freed cash (adds 1.25% to portfolio) |
| BUY | GLD | Buy GLD — 14.29% of freed cash (adds 1.25% to portfolio) |
Current Portfolio After Trade
Combined holdings across all 4 active tranches. Each tranche is 25% of the portfolio.
| Ticker | % of Portfolio | Weight Bar |
|---|---|---|
| FSOL | 50.00% | |
| CIBR | 7.50% | |
| XLU | 7.50% | |
| COPX | 6.25% | |
| BOTZ | 6.25% | |
| ITA | 5.00% | |
| URNM | 3.75% | |
| MOO | 3.75% | |
| GLD | 3.75% | |
| XLK | 2.50% | |
| WEAT | 1.25% | |
| URA | 1.25% | |
| SLV | 1.25% |
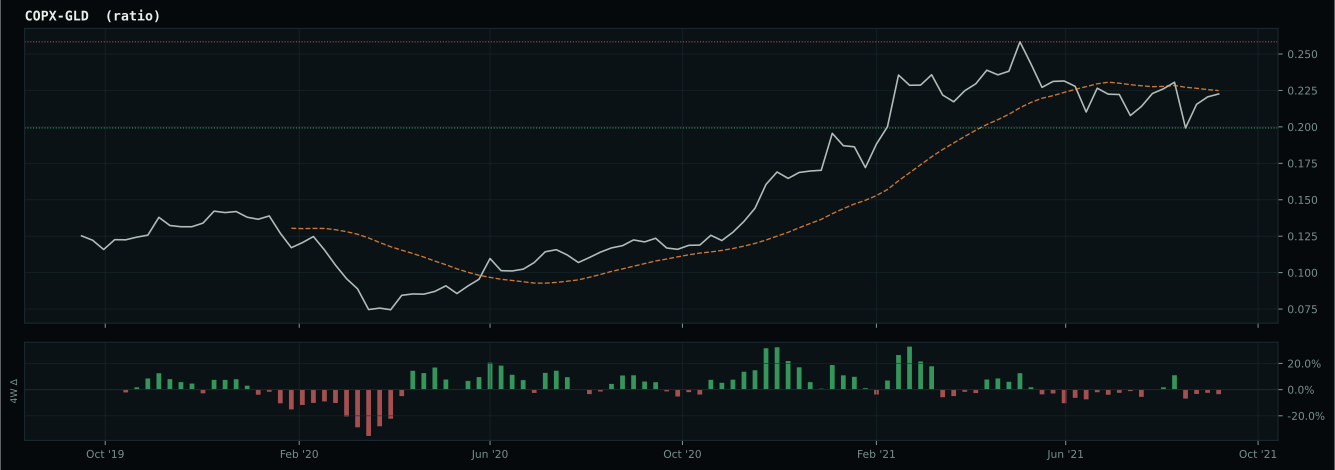
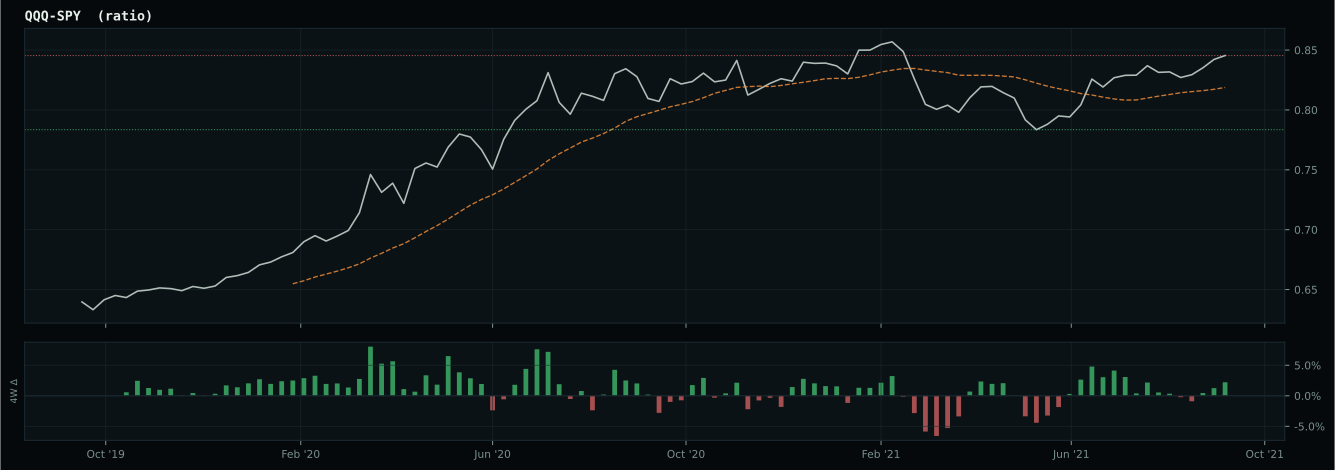
Macro Regime — Goldilocks
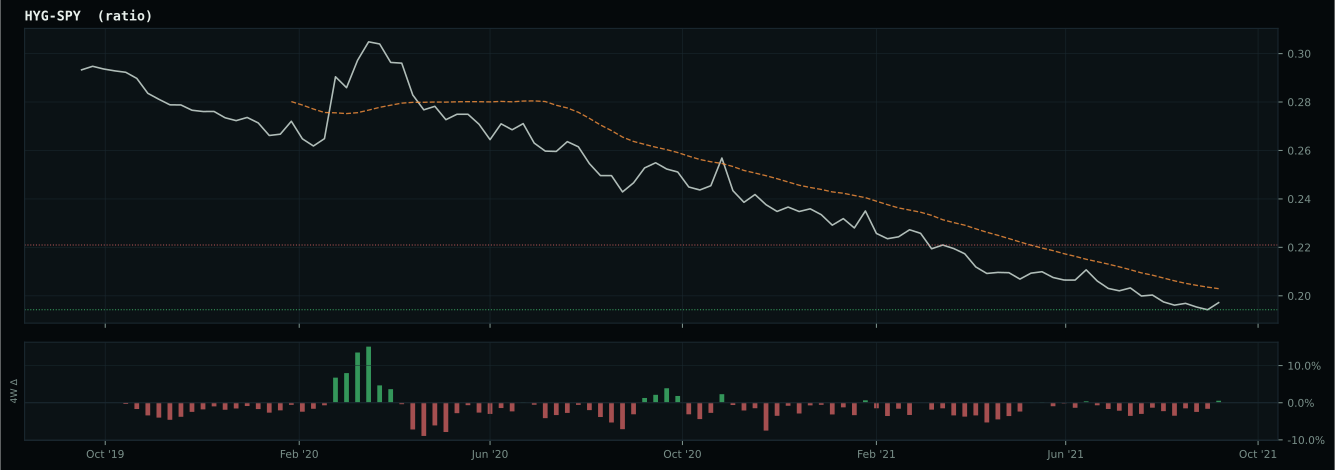
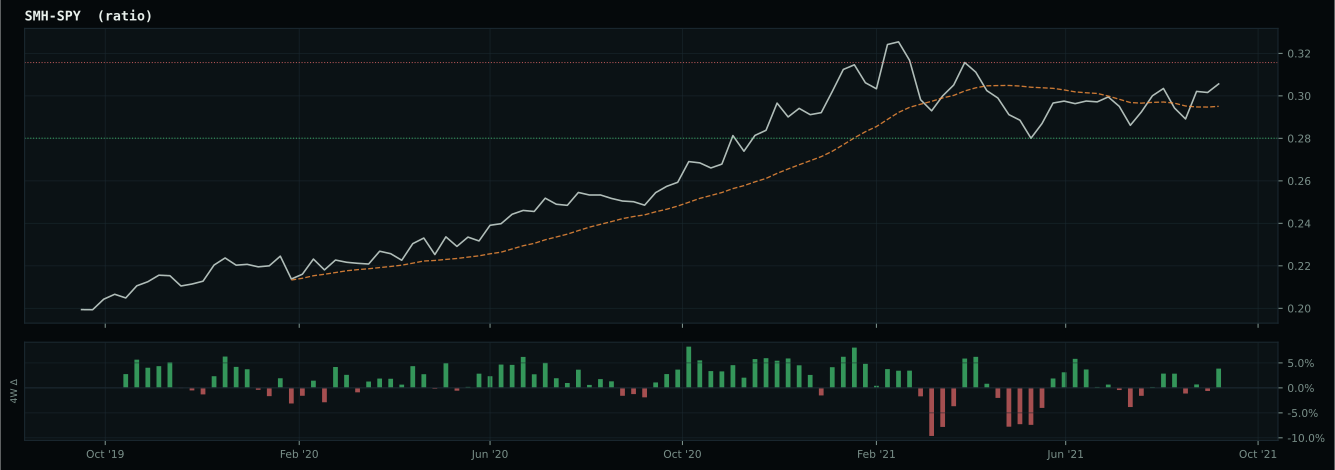
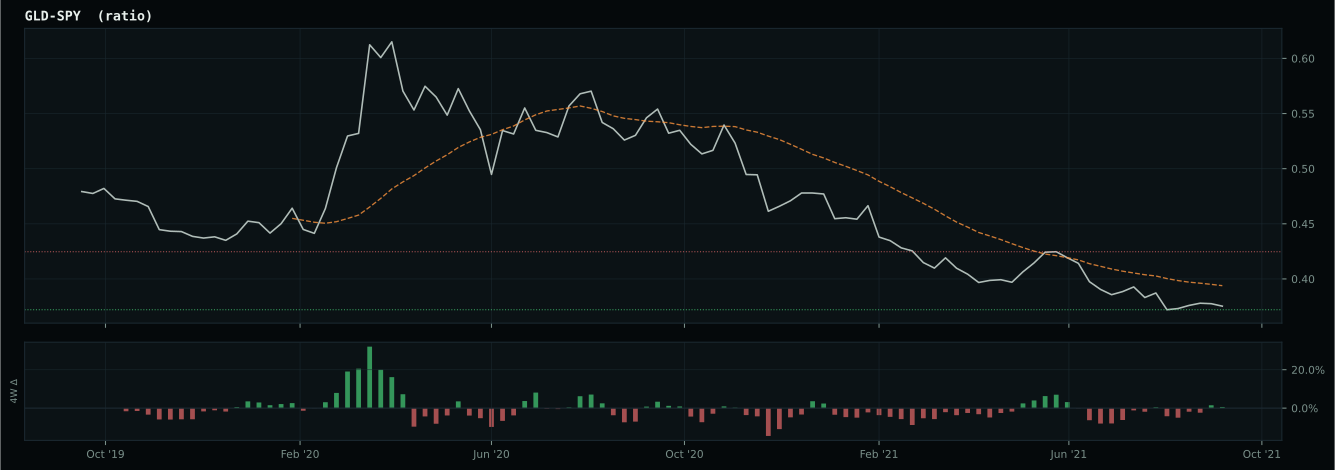
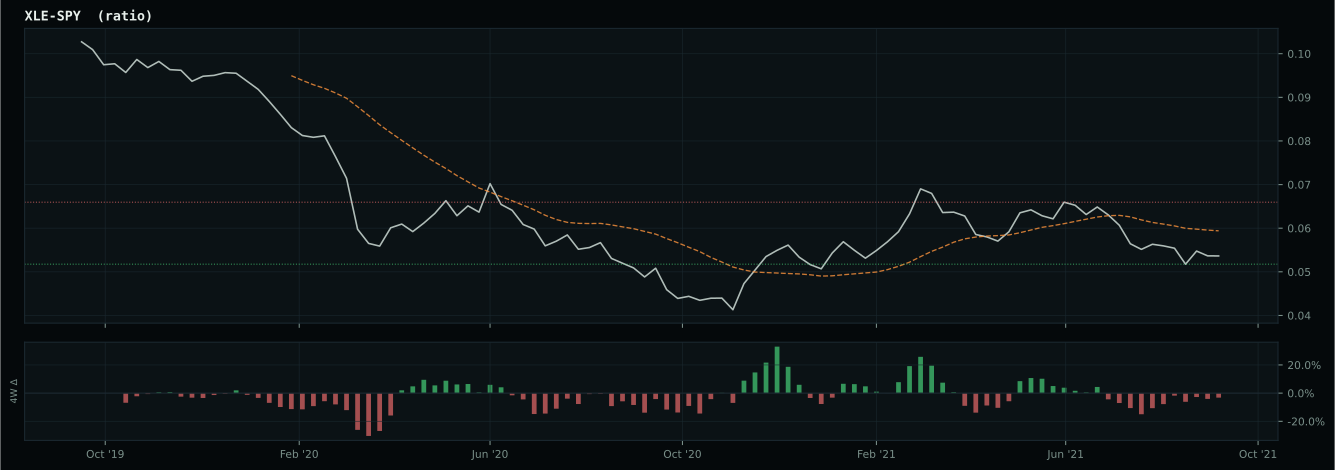
Macro Evidence Charts
Market-implied signals behind the macro regime scores. Each ratio compares two assets; the direction and slope of the ratio is what the macro engine reads.
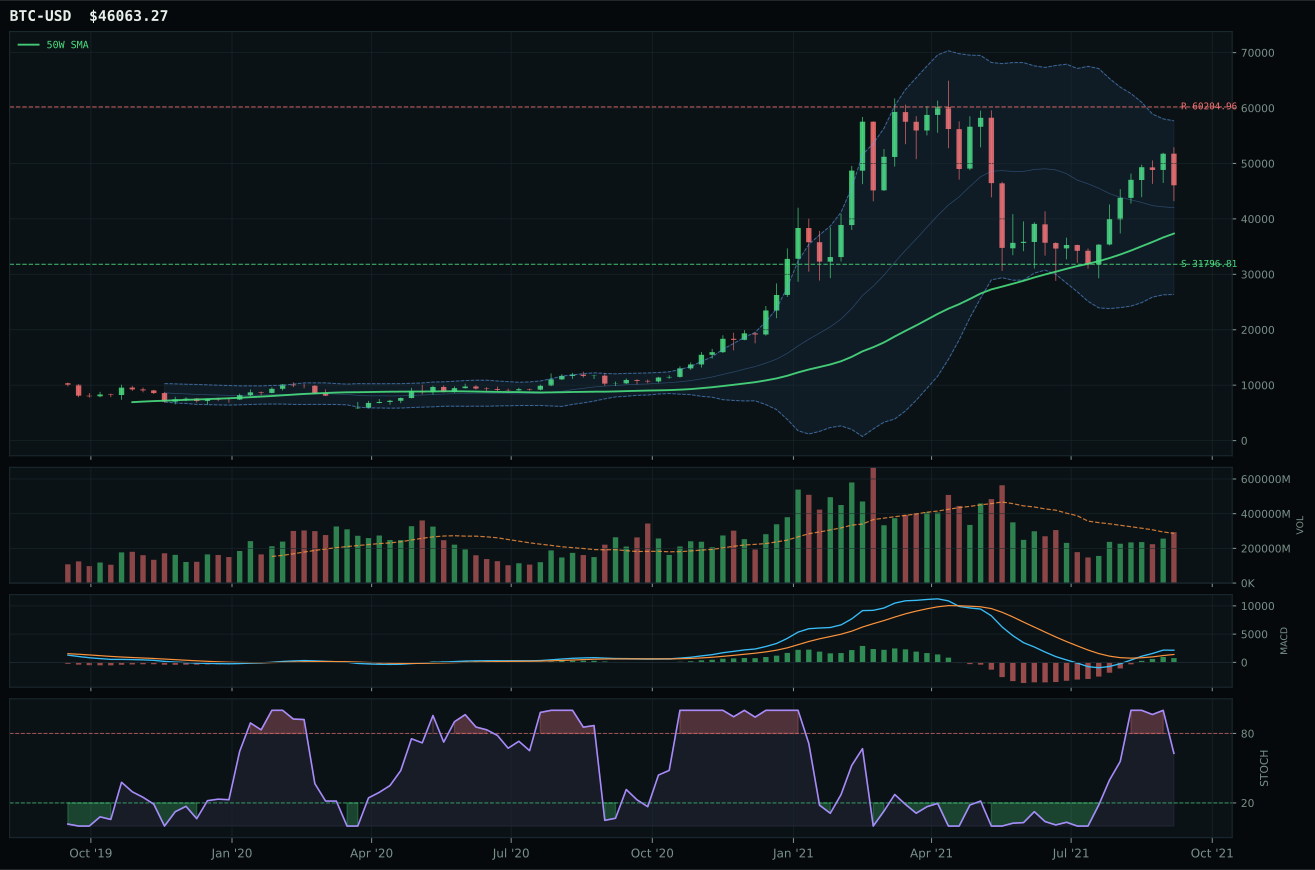
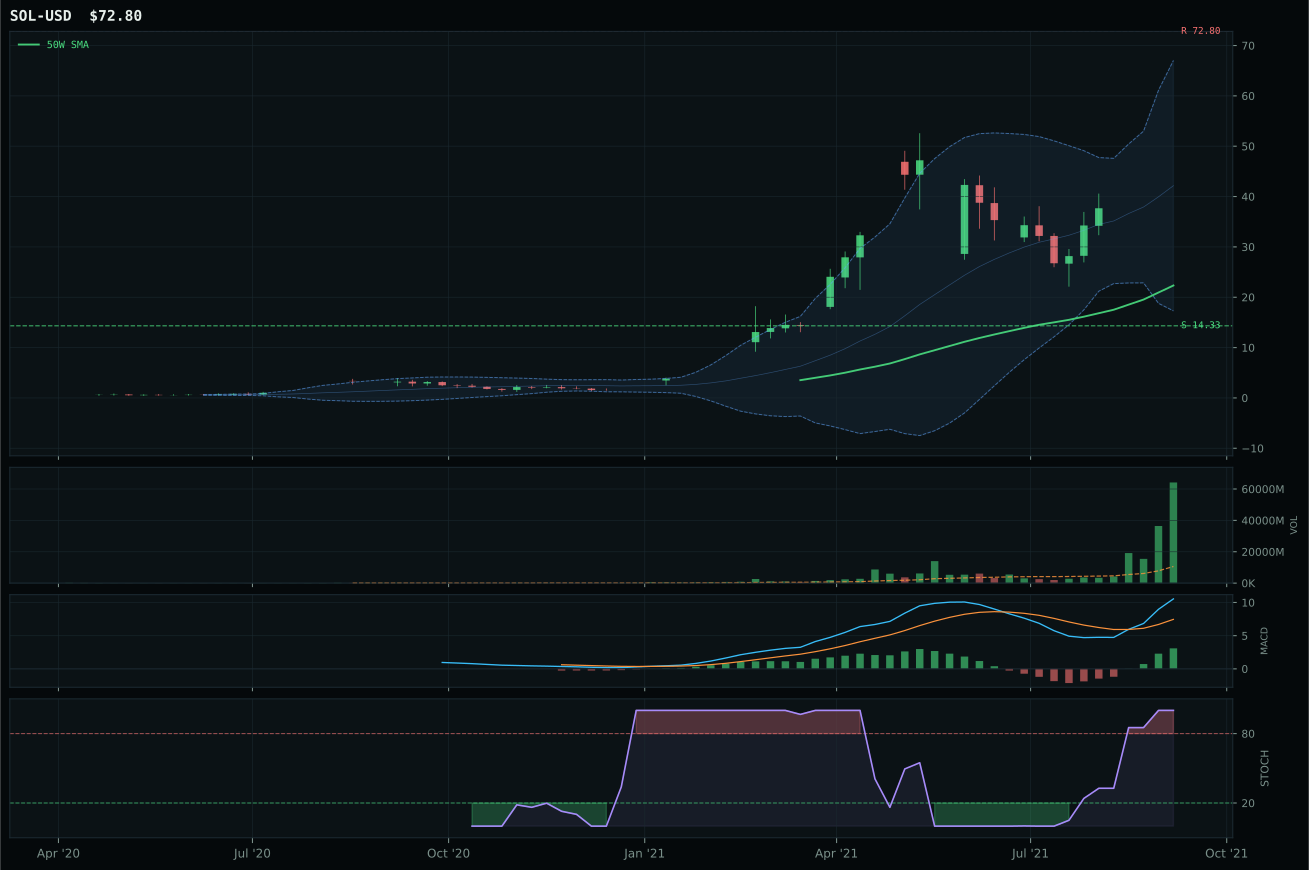
Crypto Regime — AltSeason
ValueBTC not armed: BTC has not made the first post-breakdown touch of the 200W buy zone after losing the 50W
TrendBTC confirmed: 2 consecutive closes above rising/flat 50W SMA
all available AltSeason conditions pass; missing optional confirmations skipped
Category Rankings
| Rank | Category | Winner | Score | Alloc | 4W Ret | Peers (4W) |
|---|---|---|---|---|---|---|
| 1 | Technology | CIBR | 71.4 | 20% | -2.76% | XLK -4.1% · IGV -4.1% |
| 2 | AI | BOTZ | 62.9 | 20% | -9.02% | SMH -7.7% · AIQ -3.6% |
| 3 | Nuclear Energy | URNM | 60.2 | 10% | -16.34% | URA -13.4% · NLR -3.0% |
| 4 | Industrial Metals | COPX | 55.9 | 10% | -4.42% | REMX -11.7% · PICK -6.1% |
| 5 | Utilities & Infrastructure | XLU | 50.5 | 10% | -6.56% | IGF -0.3% · PAVE -2.3% |
| 6 | Precious Metals | GLD | 42.4 | 10% | -2.04% | SLV -3.8% · GDX -3.1% |
| 7 | Defense & Aerospace | ITA | 29.3 | 10% | +4.12% | ROKT +0.9% · XAR +2.9% |
| 8 | Agriculture & Livestock | MOO | 29.3 | 10% | +0.05% | VEGI +0.9% · WEAT +7.8% |
| 9 | Emerging Markets | INDA | 15.3 | 0% | -0.32% | IEMG -2.6% · ILF -6.8% |
| 10 | Traditional Energy | FCG | 12.5 | 0% | +28.25% | XOP +26.0% · XLE +18.6% |
Technology — CIBR
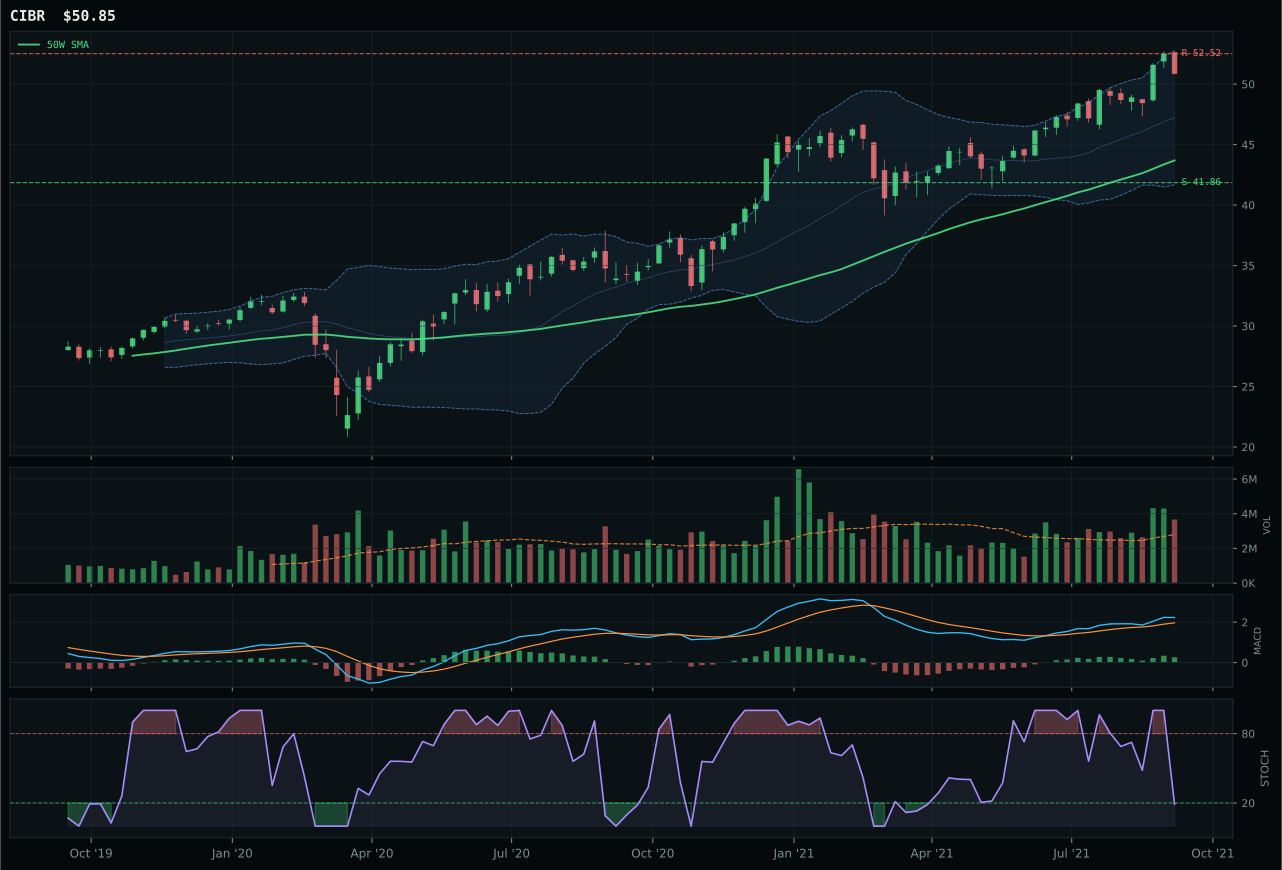
CIBR has a vertical extension profile with 5.2% 13-week relative strength versus SPY.
A failed hold above support would weaken the setup.
Actionable but governed by invalidation levels.
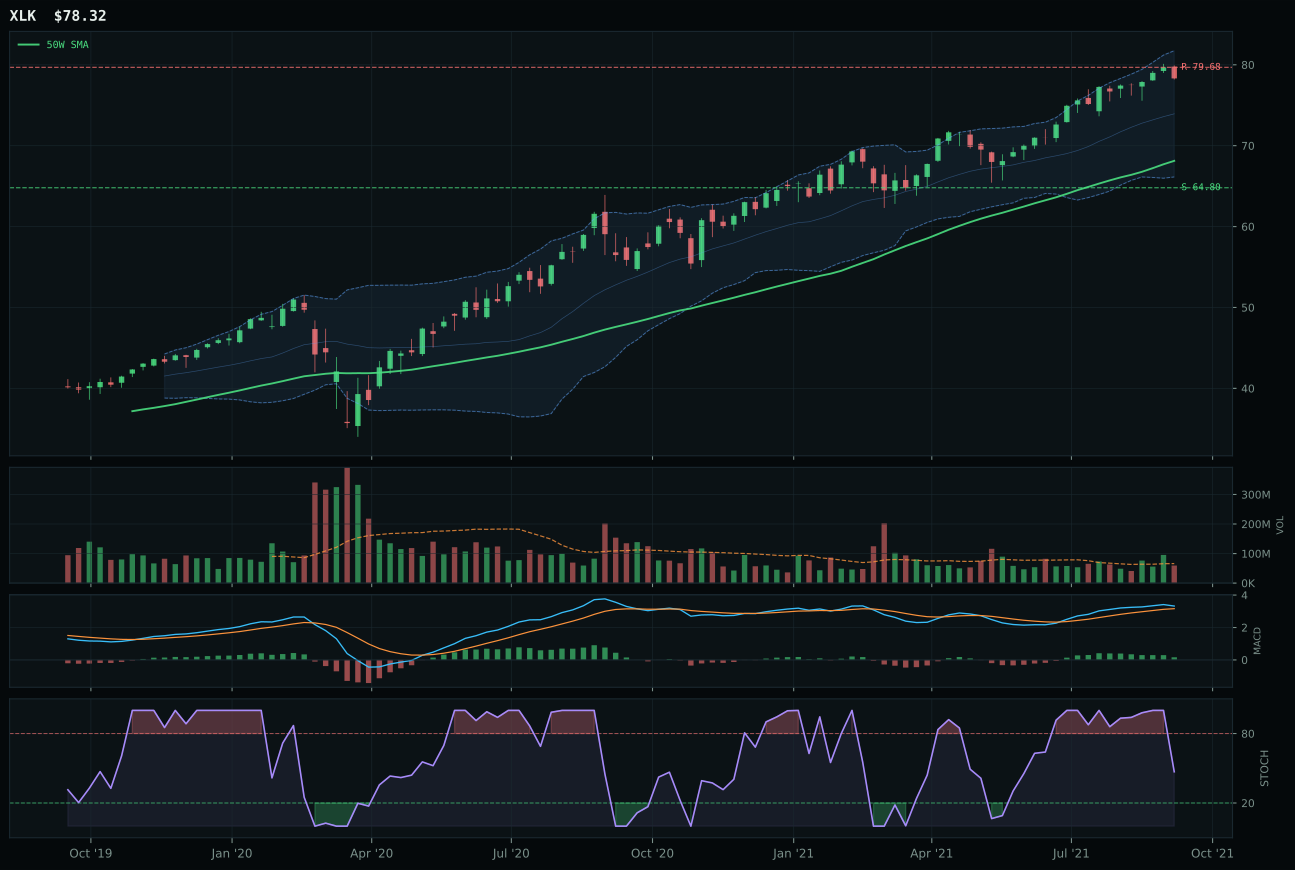
XLK has a neutral structure profile with 5.3% 13-week relative strength versus SPY.
A failed hold above support would weaken the setup.
Actionable but governed by invalidation levels.
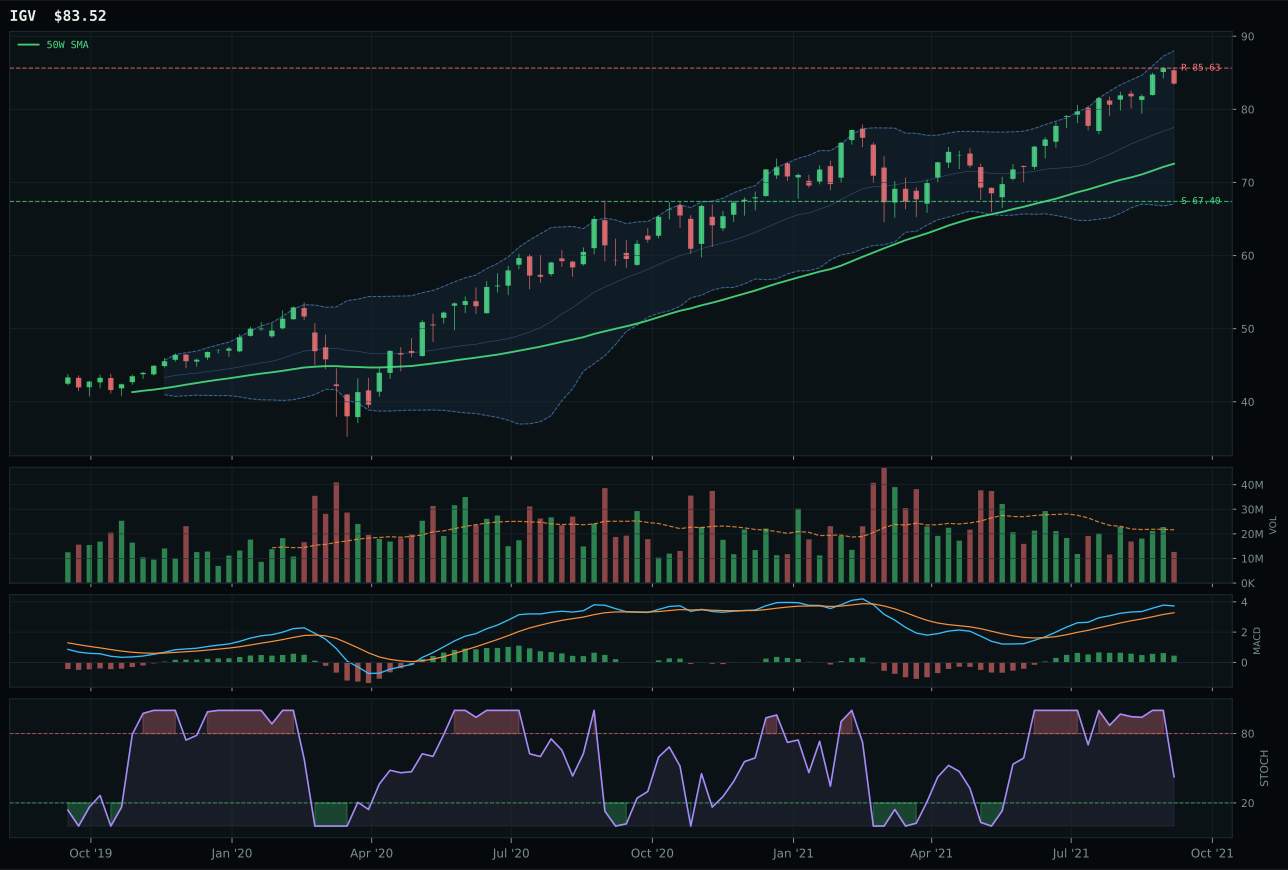
IGV has a vertical extension profile with 6.5% 13-week relative strength versus SPY.
A failed hold above support would weaken the setup.
Actionable but governed by invalidation levels.
CIBR wins the category with a 76.6 reasoned score against XLK's 69.2, driven by superior momentum confirmation (90.8 vs 77.0) and volume-price sponsorship (70.7 vs neutral). The cybersecurity ETF sits 16.4% above its 50W—extended, yes, but confirming real institutional accumulation at 1.31x average volume with MACD bullish and improving while stochastic RSI still sits oversold at 0.19. XLK failed on execution: its MACD is bullish but flattening, stochastic RSI is falling into neutral territory, and volume participation is neutral. Both trade above their 200W with identical 100.0 trend scores, but CIBR's relative strength versus SPY (5.2%) matches XLK's (5.3%) while CIBR's category relative strength sits at -0.2% versus XLK's 0.0%, making the decision turn on timing and confirmation quality. The 7.4-point gap between them reflects a clean technical win, not a close call.
Technology earned 10% allocation as a top-2 category, reflecting its rank among the two highest eligible final scores. Goldilocks and active liquidity expansion both support technology, and the category's 67.0 macro fit combines with strong 62% technical evidence weighting to justify conviction. The Goldilicks regime removes tail-risk hedging pressure, permitting growth exposure, while AI growth sponsorship adds a further +6 points to category reasoning. Credit stress is active and working against it (-7 points), but that tension is already priced into the technical scores and does not override the setup quality. This allocation tier reflects confidence in execution and setup cleanliness rather than macro tailwinds alone; with stronger breadth and volume confirmation than the 10% allocation slot normally requires, Technology keeps its seat as long as CIBR remains above 41.86 support and MACD holds bullish structure.
AI — BOTZ
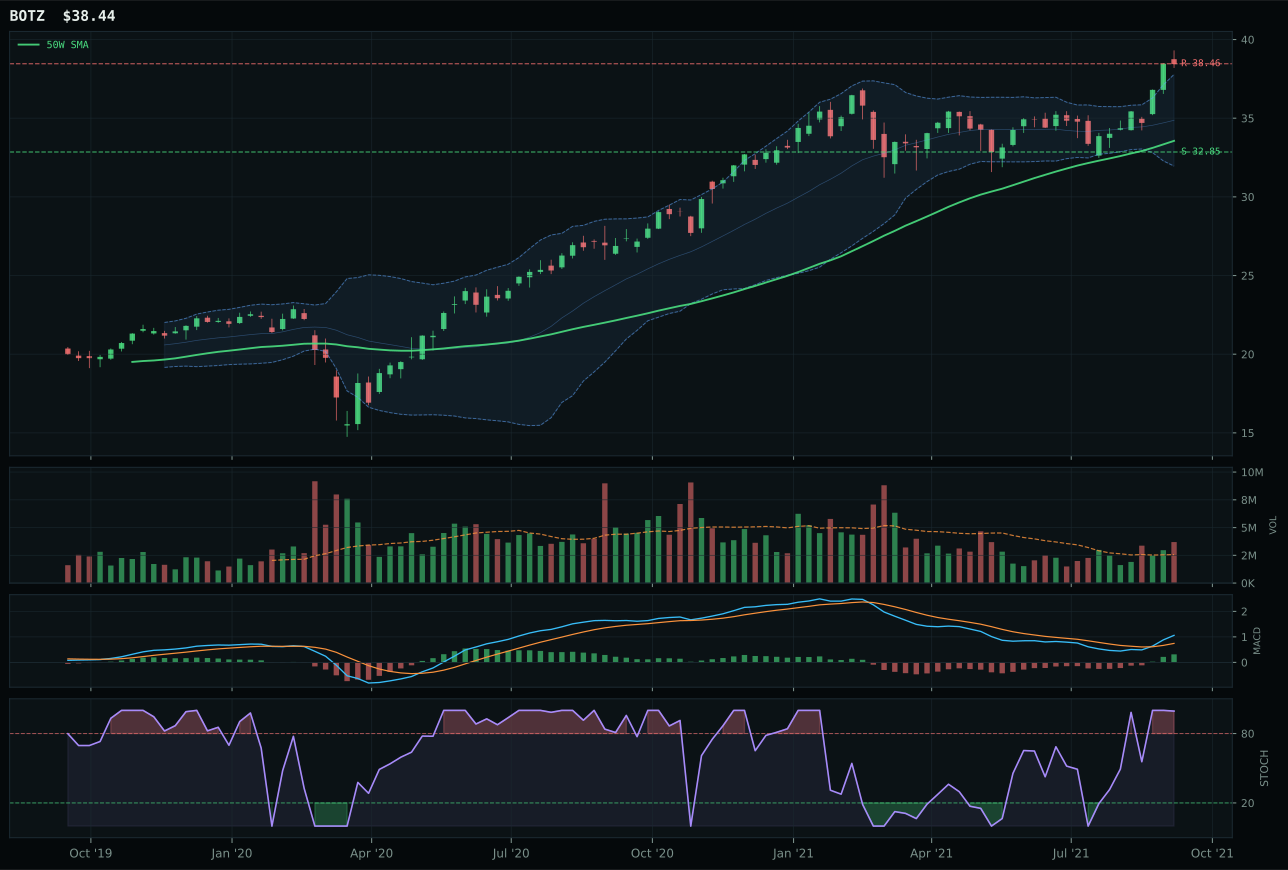
BOTZ has a neutral structure profile with 5.1% 13-week relative strength versus SPY.
A failed hold above support would weaken the setup.
Actionable but governed by invalidation levels.
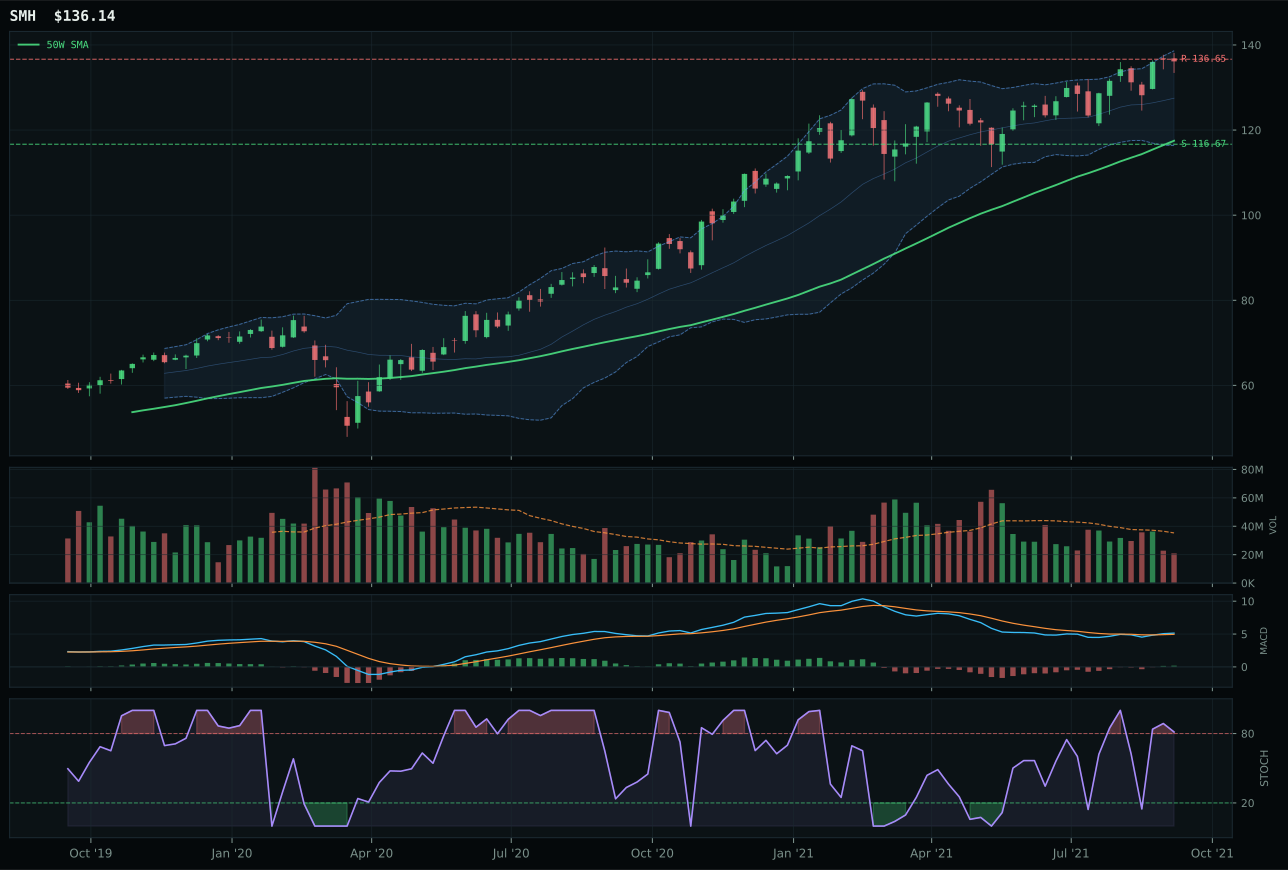
SMH has a vertical extension profile with 3.3% 13-week relative strength versus SPY.
A failed hold above support would weaken the setup.
Actionable but governed by invalidation levels.
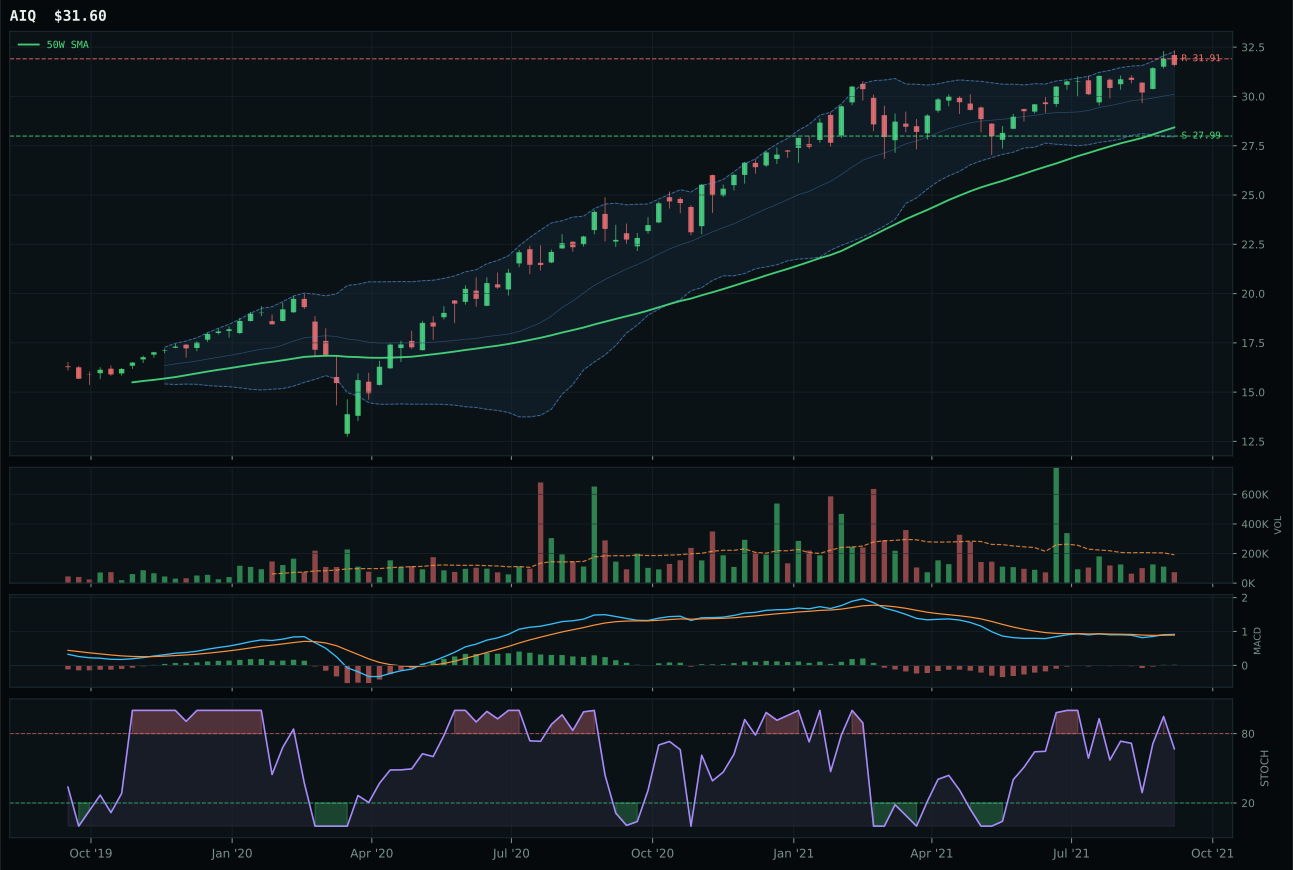
AIQ has a neutral structure profile with 1.8% 13-week relative strength versus SPY.
A failed hold above support would weaken the setup.
Tracked, but not top-2 eligible because: .
BOTZ prevails with a 78.6 reasoned score—15.6 points ahead of SMH—because it delivers momentum confirmation at 100.0 (perfect), structure cleanliness at 77.5 versus SMH's 72.0, and above-average volume participation (1.44x) versus SMH's thin participation. The robotics-focused ETF trades neutral structure but benefits from 1.8% category-relative strength while SMH sits at 0.0%, meaning BOTZ is the category's internal leader. Both sit near 52W highs and both have MACD bullish and improving; both are overbought on stochastic RSI momentum. The separation is in breadth: BOTZ's 4W return of 8.5% and 13W return of 10.1% trump SMH's 8.3% and reflect genuine follow-through, not a bounce. Timing is weaker at 59.0 for BOTZ than SMH's 37.0 technical score, but volume-price confirmation (82.1 vs 61) and persistence (73.5 vs momentum-driven readings) reveal which setup is accumulating rather than rejecting.
AI earned 10% allocation as the second top-2 category, joining Technology as the portfolio's paired near-term opportunity. The category score of 62.9 ranks below Technology's 71.4, yet both make the top-2 tier because macro regimes and category-level opportunity are separate from portfolio rank. AI benefits from active AI growth sponsorship (+14 points at the category level), offsetting credit stress (-8). Goldilocks environment adds +10, and liquidity expansion adds another +10, creating a 67.0 macro fit despite that broad-market-bear tailwind working against it (-8). The tension here is explicit: strong technical setup and momentum confirmation collide with the fact that every buyer at current prices is late to entry. Broad market bear being active is a warning flag, not a veto. BOTZ stays allocated because its volume-price confirmation and category-relative strength outweigh timing risk for now; if stochastic RSI rolls over cleanly or MACD flattens, the position becomes vulnerable to quick reassessment.
Nuclear Energy — URNM
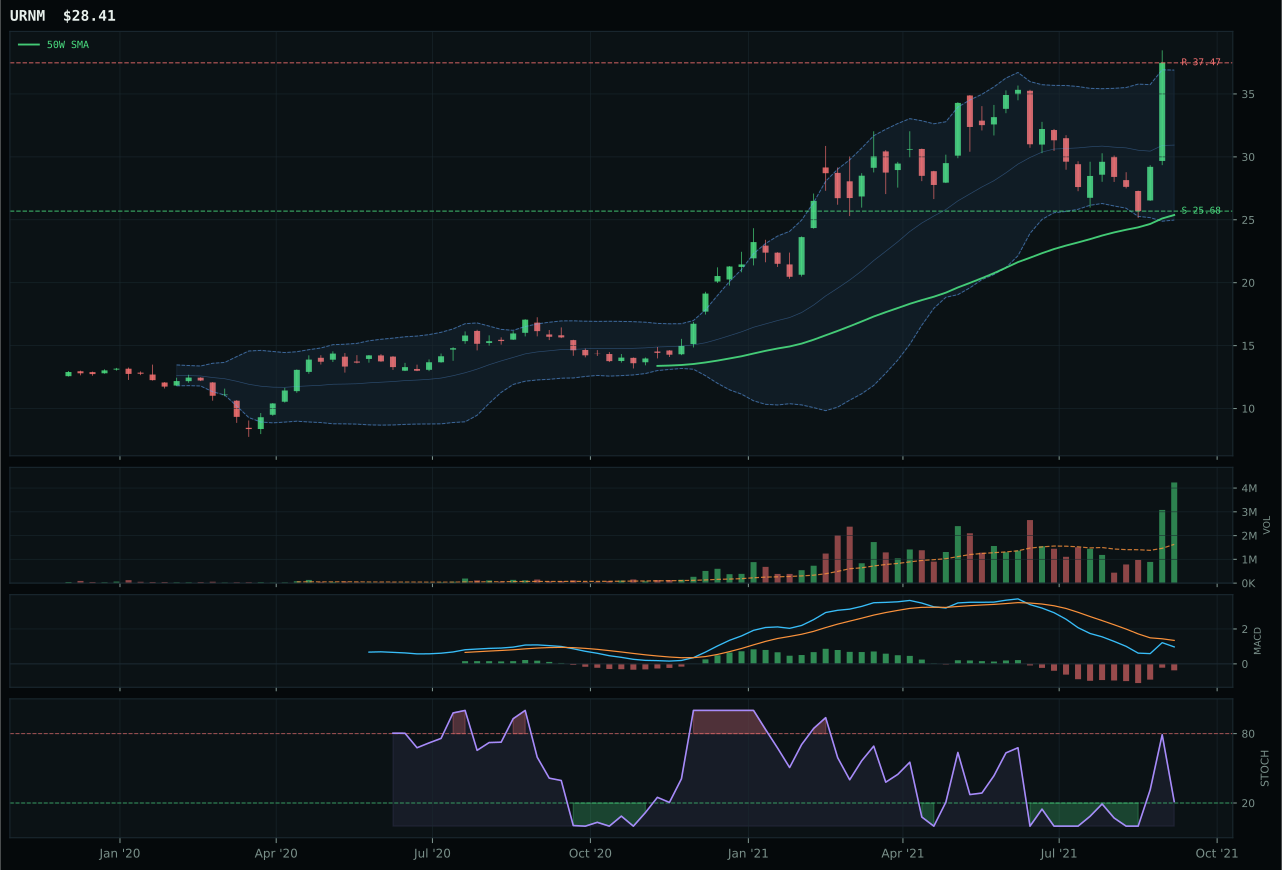
URNM has a vertical extension profile with 14.9% 13-week relative strength versus SPY.
A failed hold above support would weaken the setup.
Actionable but governed by invalidation levels.
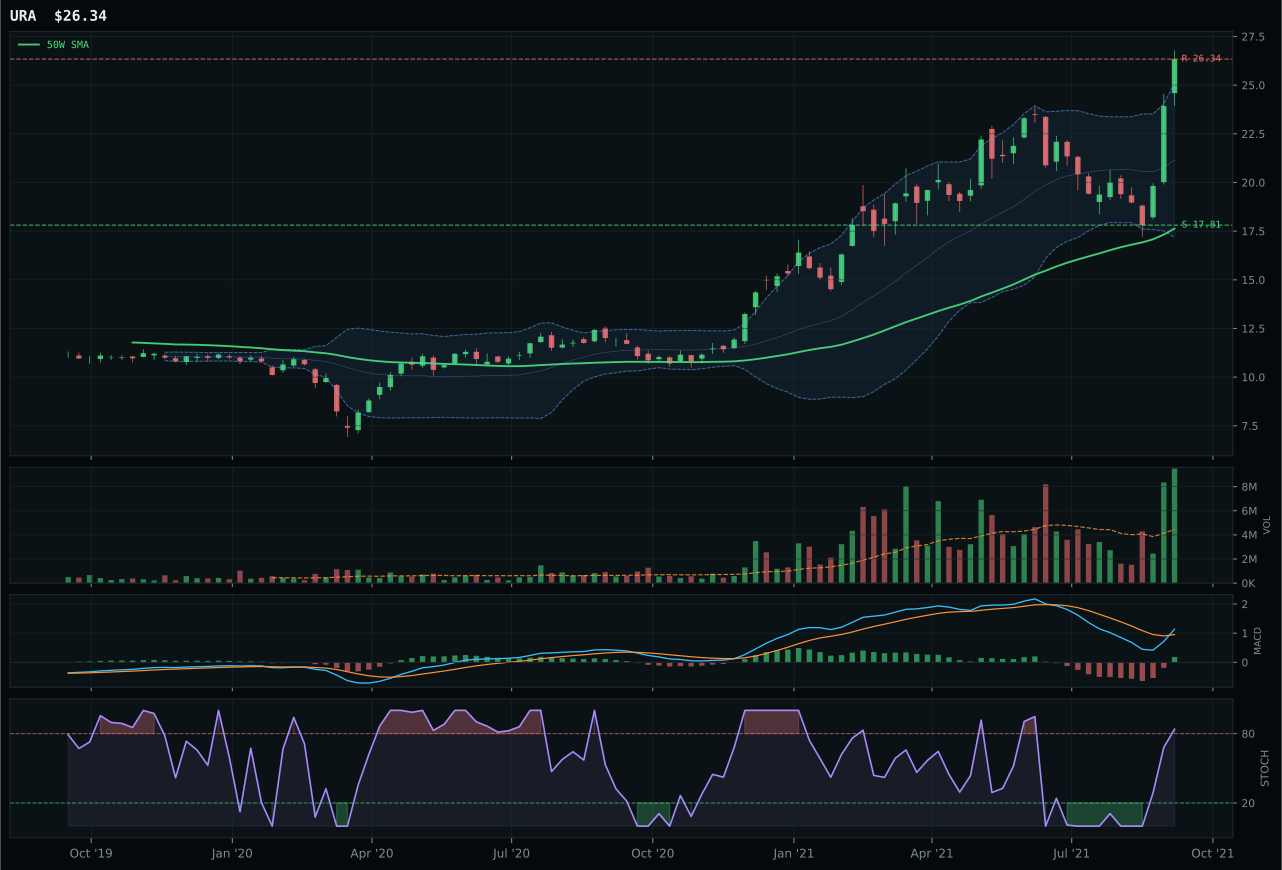
URA has a vertical extension profile with 7.2% 13-week relative strength versus SPY.
A failed hold above support would weaken the setup.
Actionable but governed by invalidation levels.
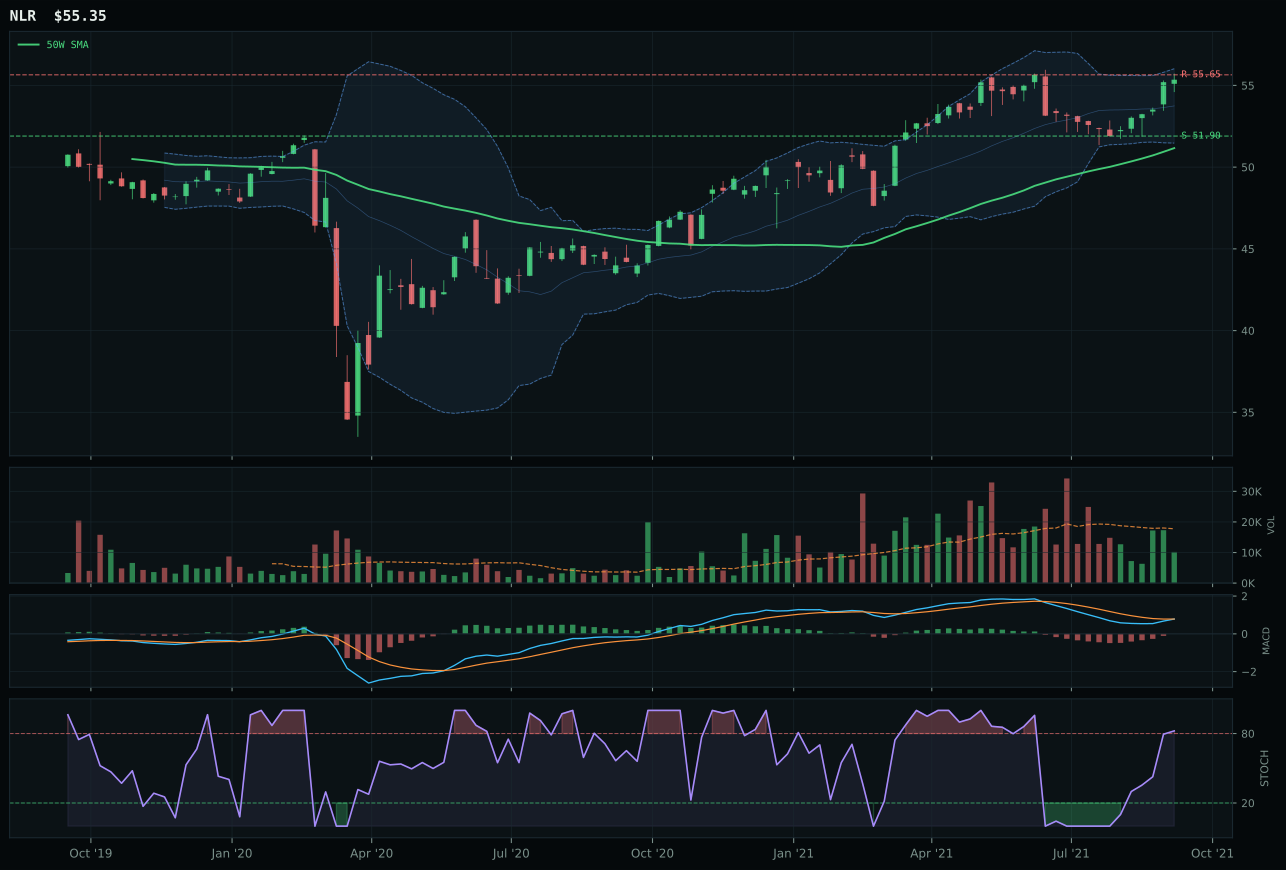
NLR has a neutral structure profile with -5.5% 13-week relative strength versus SPY.
A failed hold above support would weaken the setup.
Tracked, but not top-2 eligible because: .
URNM wins with a 77.5 reasoned score against URA's 74.2, claiming the category on structure cleanliness (74.0 vs 72.2) and category-relative strength (7.7% vs 0.0%), despite both showing identical 100.0 momentum confirmation scores. URNM sits 65.1% extended above its 50W—aggressively extended—but volume is confirming at 2.60x accumulation level, and both MACD is bullish and improving while stochastic RSI overbought momentum rolls with full conviction at 0.97. URA has identical MACD and stochastic character but at a lower price extension and with 0.0% category relative strength, meaning URA is a follower. The 13W return split (19.9% for URNM vs 12.2% for URA) and RS versus SPY (14.9% vs 7.2%) show URNM is the stronger performer. The gap of 3.3 points is modest, reflecting high-quality execution in both vehicles; URNM wins on breadth leadership and volume sponsorship despite both sitting overbought.
Nuclear Energy earned 5% allocation as a tier-2 category with a final score of 60.2, placing it seventh among ten categories and benefiting from real asset sponsorship (+7) and AI growth sponsorship (+5, reflecting nuclear's power-demand narrative). Credit stress is active (-5), a modest headwind. The category macro fit of 57.0 is respectable but not top-tier, reflecting that nuclear is a niche commodity exposure rather than a broad macro bet. URNM's technical evidence is 87.2, the second-highest in the entire portfolio, and its 100.0 momentum confirmation is perfect; timing is weaker at 37.0 because the extension is so severe. Yet volume-price confirmation at 84.3 and persistence at 90.0 reveal genuine institutional accumulation, not retail chasing. The allocation rationale is asymmetric upside from scarcity narrative plus perfect momentum confirmation, offset by entry risk from the 65.1% extension. To earn promotion to top-2, nuclear would need broader macro sponsorship signals or for URNM to consolidate and build a new base with continued accumulation. For now, the 5% slot captures the scarcity-and-energy-transition story without oversizing to a niche that could correct sharply if technicals deteriorate.
Industrial Metals — COPX
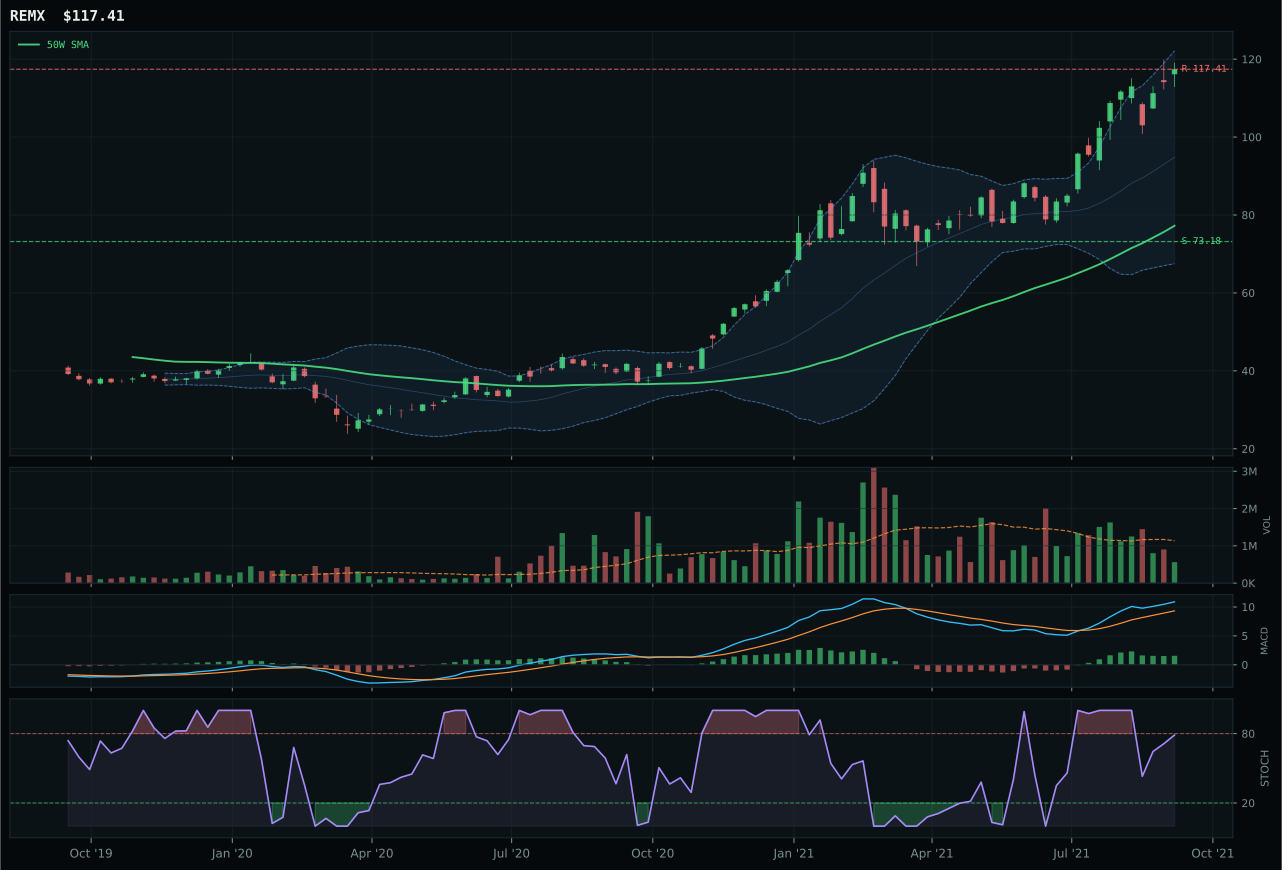
REMX has a vertical extension profile with 34.1% 13-week relative strength versus SPY.
A failed hold above support would weaken the setup.
Actionable but governed by invalidation levels.
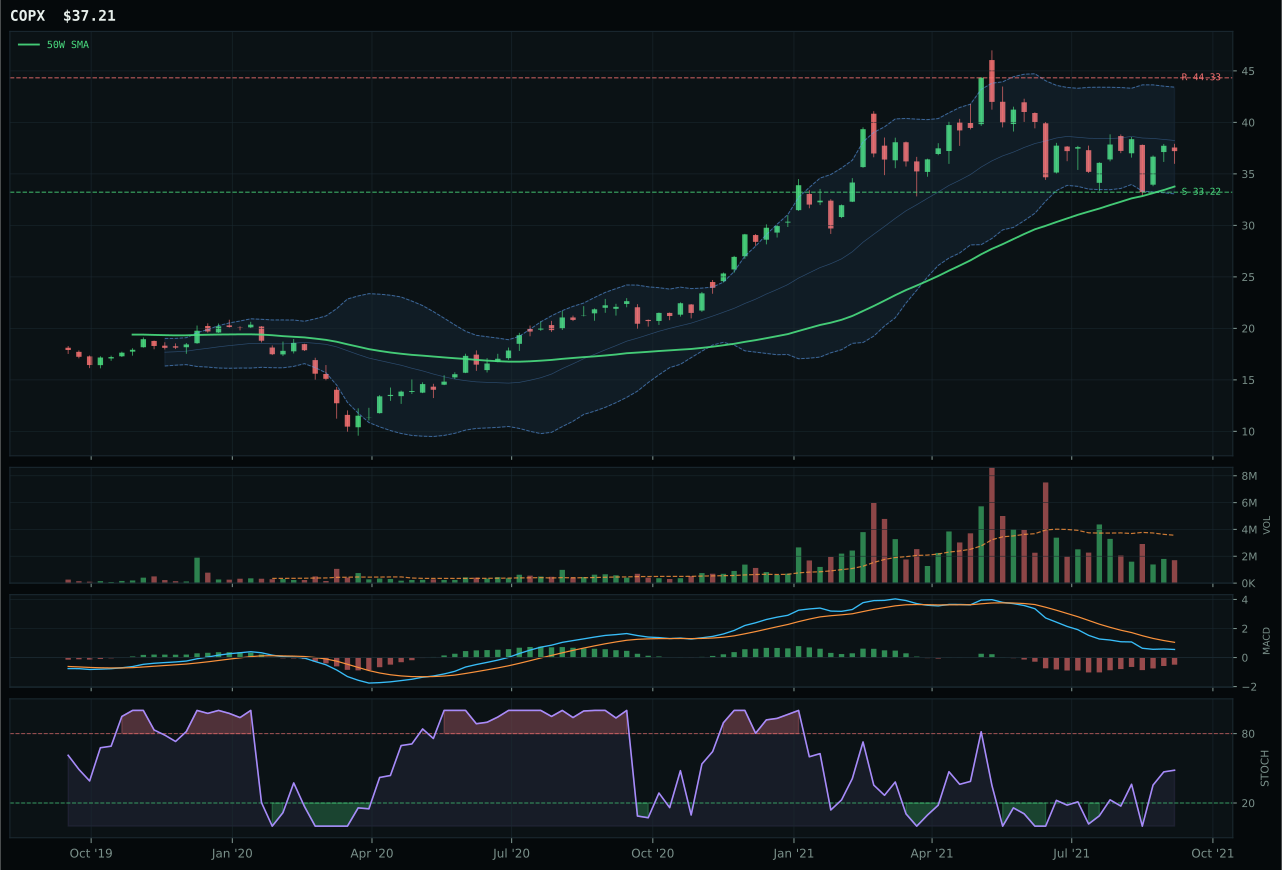
COPX has a neutral structure profile with -12.0% 13-week relative strength versus SPY.
A failed hold above support would weaken the setup.
Actionable but governed by invalidation levels.
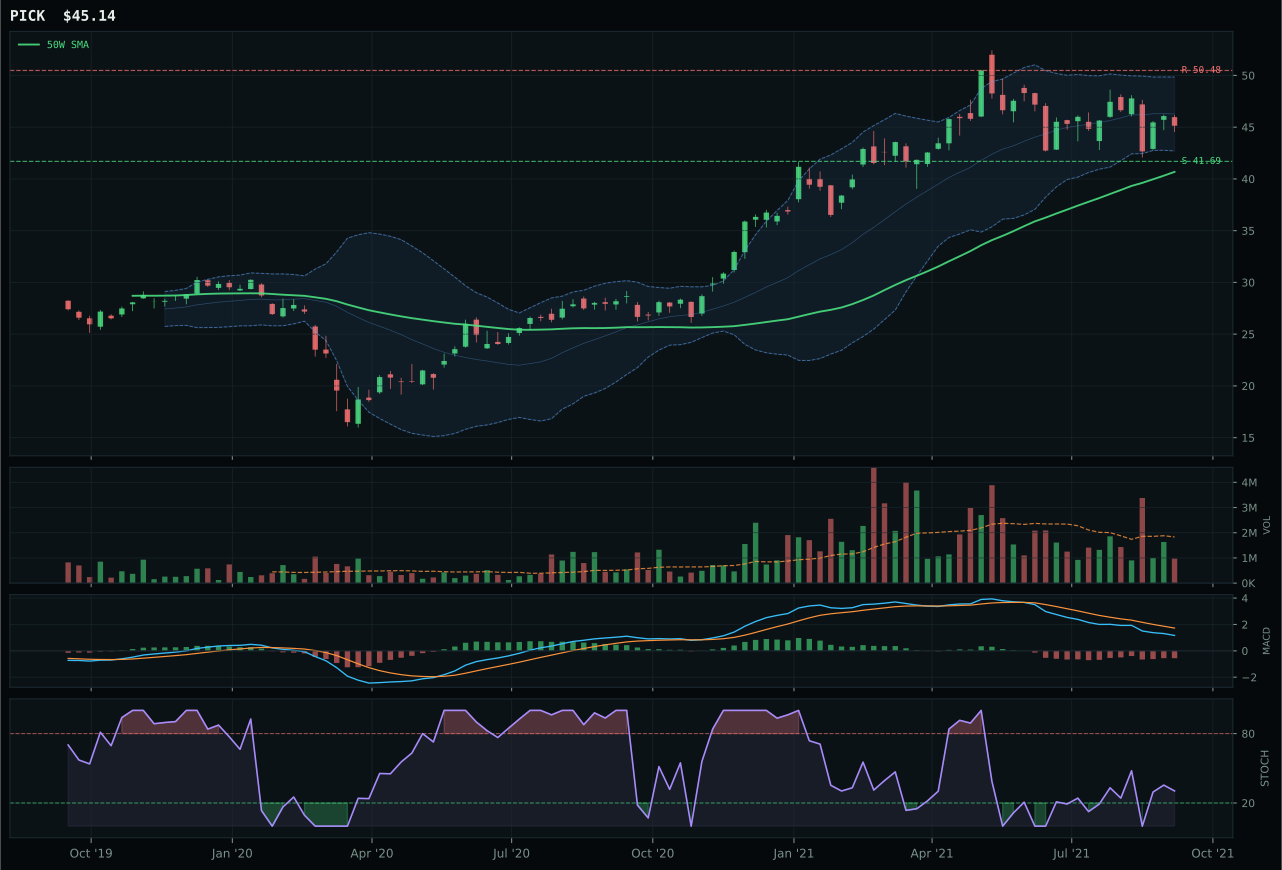
PICK has a neutral structure profile with -9.3% 13-week relative strength versus SPY.
A failed hold above support would weaken the setup.
Actionable but governed by invalidation levels.
COPX wins with a 57.5 reasoned score against REMX's 81.0, marking an unusual decision where the category representative lags the highest-ranked ETF by 23.5 points. REMX is extended 52% above its 50W with bullish-but-flattening MACD and overbought-momentum stochastic, while COPX sits only 10.2% from its 50W with MACD bearish but improving and stochastic RSI rising mid-zone from a lower level. REMX's 13W return is explosive at 39.1% versus COPX's -7.1%, and RS versus SPY is 34.1% versus -12.0%, revealing that rare earths momentum is live while copper demand is questioned. Yet REMX's timing score of 48.0 versus COPX's 83.0 captures the real-entry-risk problem: every REMX buyer is severely late, with upside to resistance showing -0.1% and downside risk at 17.0%. COPX offers 12.0% downside to support and -16.1% upside to resistance, creating a defined risk setup. The category reasoner chose timing geometry and mean-reversion opportunity over momentum continuation.
Industrial Metals earned 5% allocation as a tier-2 category with a final score of 55.9, benefiting from metals scarcity being active (+14 at category level) and commodity breadth positive (+10). Yet the category's macro fit of 72.0 is strong only relative to tier-2 peers; it still lags top-2 categories because credit stress is active (-7) and Goldilocks does not inherently sponsor commodity cyclicality. REMX's technical evidence is 88.0, the highest in the portfolio, yet it earned 0% of allocation because timing cost exceeded macro sponsorship value. COPX represents the category's actual bet: early-stage reversal into support on improving MACD with thin volume. This setup is less exciting than REMX's momentum, but it offers better entry risk geometry. The tension is explicit: rare earths scarcity is real, but REMX's 52% extension over the 50W eliminates asymmetric risk. COPX's -7.1% 13W return and -12.0% RS versus SPY reflect price action weakness, not fundamental deterioration, making reversal from the Fib 0.382 zone a reasonable allocation risk. Monitor MACD on REMX for momentum roll; if COPX's MACD clears through zero with volume confirmation, this category could earn promotion.
Utilities & Infrastructure — XLU
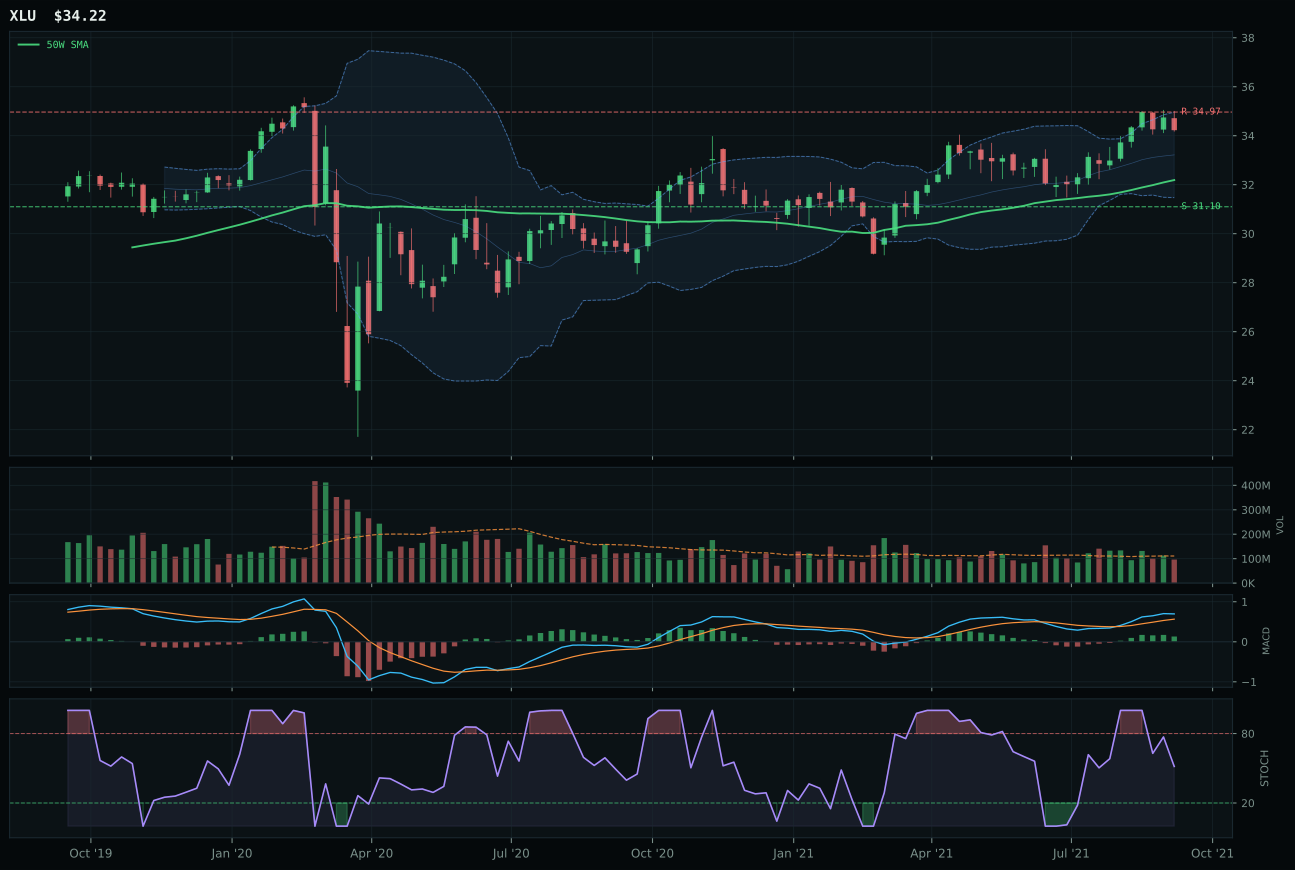
XLU has a neutral structure profile with -1.4% 13-week relative strength versus SPY.
A failed hold above support would weaken the setup.
Actionable but governed by invalidation levels.
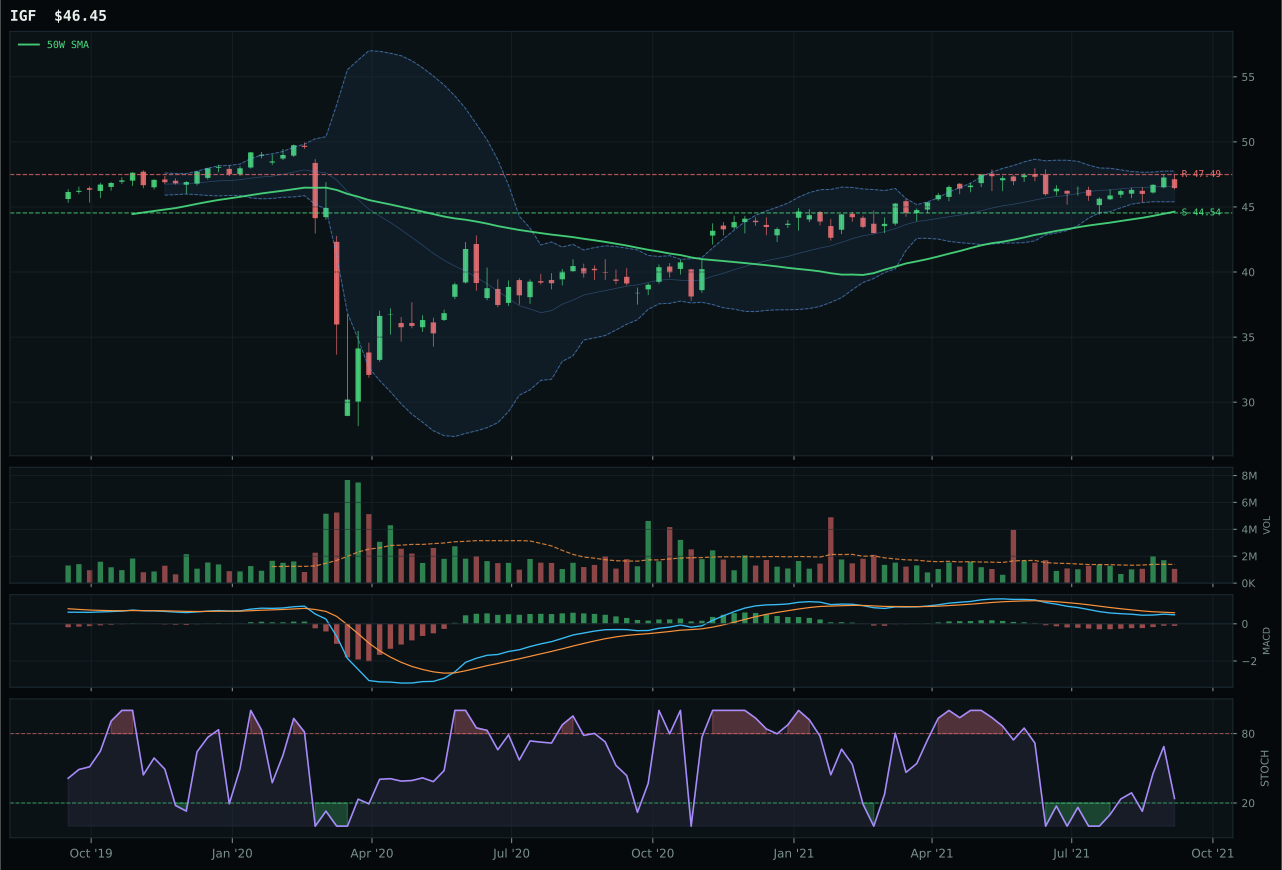
IGF has a pullback into support profile with -6.8% 13-week relative strength versus SPY.
A failed hold above support would weaken the setup.
Actionable but governed by invalidation levels.
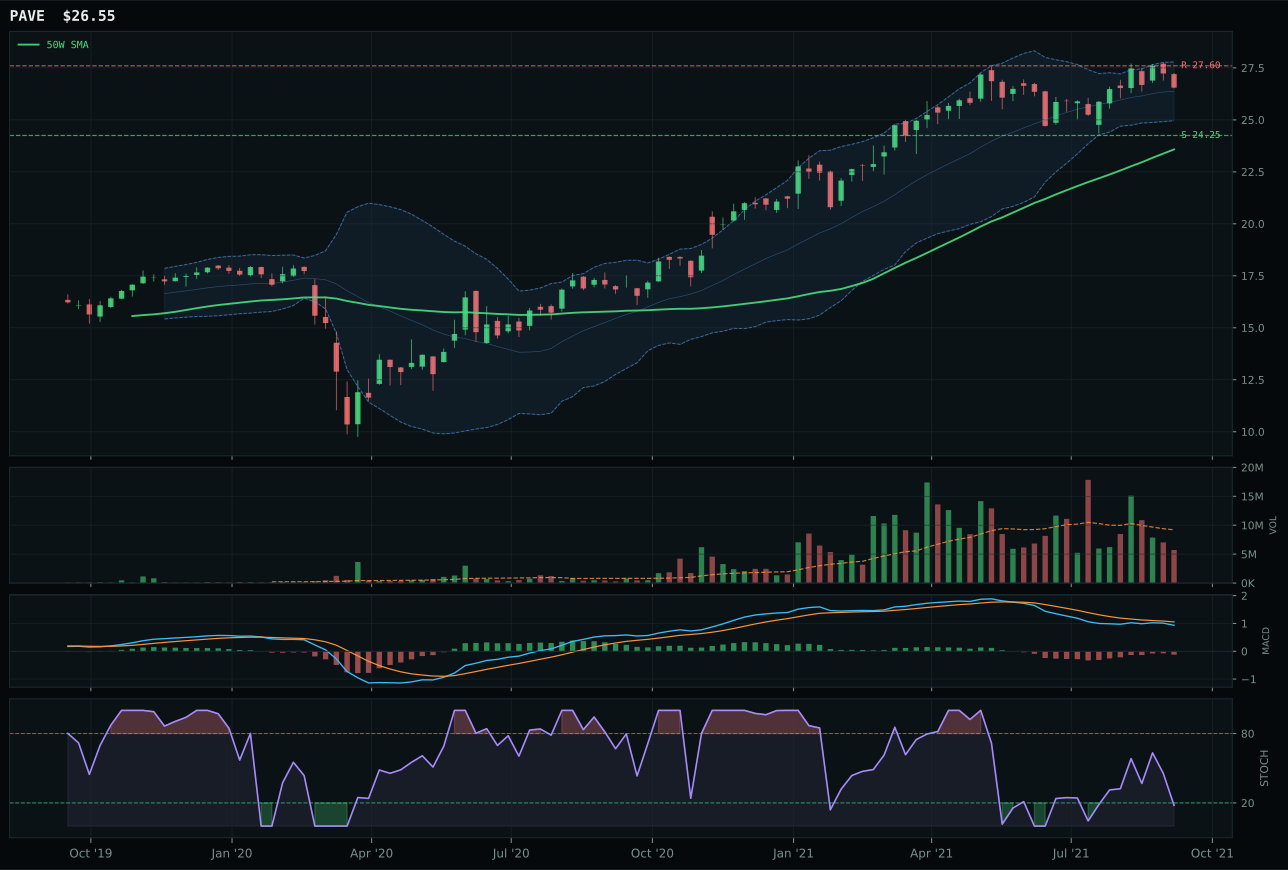
PAVE has a neutral structure profile with -4.2% 13-week relative strength versus SPY.
A failed hold above support would weaken the setup.
Actionable but governed by invalidation levels.
XLU wins with a 72.4 reasoned score against IGF's 65.2, claiming the category on superior trend (97.8 vs 83.0), timing (75.0 vs 100.0, which favors XLU's closer-to-50W entry), and category-relative strength (2.8% vs -2.6%). Both sit above their 50W with neutral structure and both have MACD bullish and improving. XLU sits 6.3% from the 50W in cleaner entry geometry, while IGF sits in a pullback-into-support setup that has not yet cleared the 50W. XLU's 13W return of 3.5% beats IGF's -1.8%, and its RS versus SPY of -1.4% is meaningfully better than IGF's -6.8%, revealing that regulated utility defense is holding up better than global infrastructure income in this regime. Volume is neutral for both (0.87x for XLU, neutral for IGF), but XLU's MACD is bullish and improving versus IGF's bearish but improving—a decisive momentum confirmation gap. The score separation of 7.2 points reflects a close decision with XLU's superior entry geometry and momentum character providing the edge.
Utilities & Infrastructure earned 5% allocation as a tier-2 category with a final score of 50.5, placing it sixth among ten allocated categories. Disinflation pressure is active (+6), supporting defensive yields, and broad market bear is active (+4), also favoring lower-beta names. The category macro fit of 64.0 is respectable, though it reflects defensive optionality rather than growth sponsorship. XLU's technical evidence is 76.8, the fourth-highest in the portfolio, driven by 97.8 trend, superior timing, and neutral structure offering entry geometry without excessive extension. The allocation captures portfolio duration and yield exposure in a Goldilocks regime where growth is not forced to rotate to pure defensives. However, the category ranks below top-2 and even below Industrial Metals, signaling that growth and real assets are preferred. XLU would earn promotion if Goldilocks regime broke or credit stress materialized sharply; until then, the 5% slot is a ballast holding that benefits from MACD remaining bullish and stochastic RSI staying above 0.20. If MACD flattens or rolls over, reduce position; this is timing-dependent allocation, not conviction structural holding.
Precious Metals — GLD
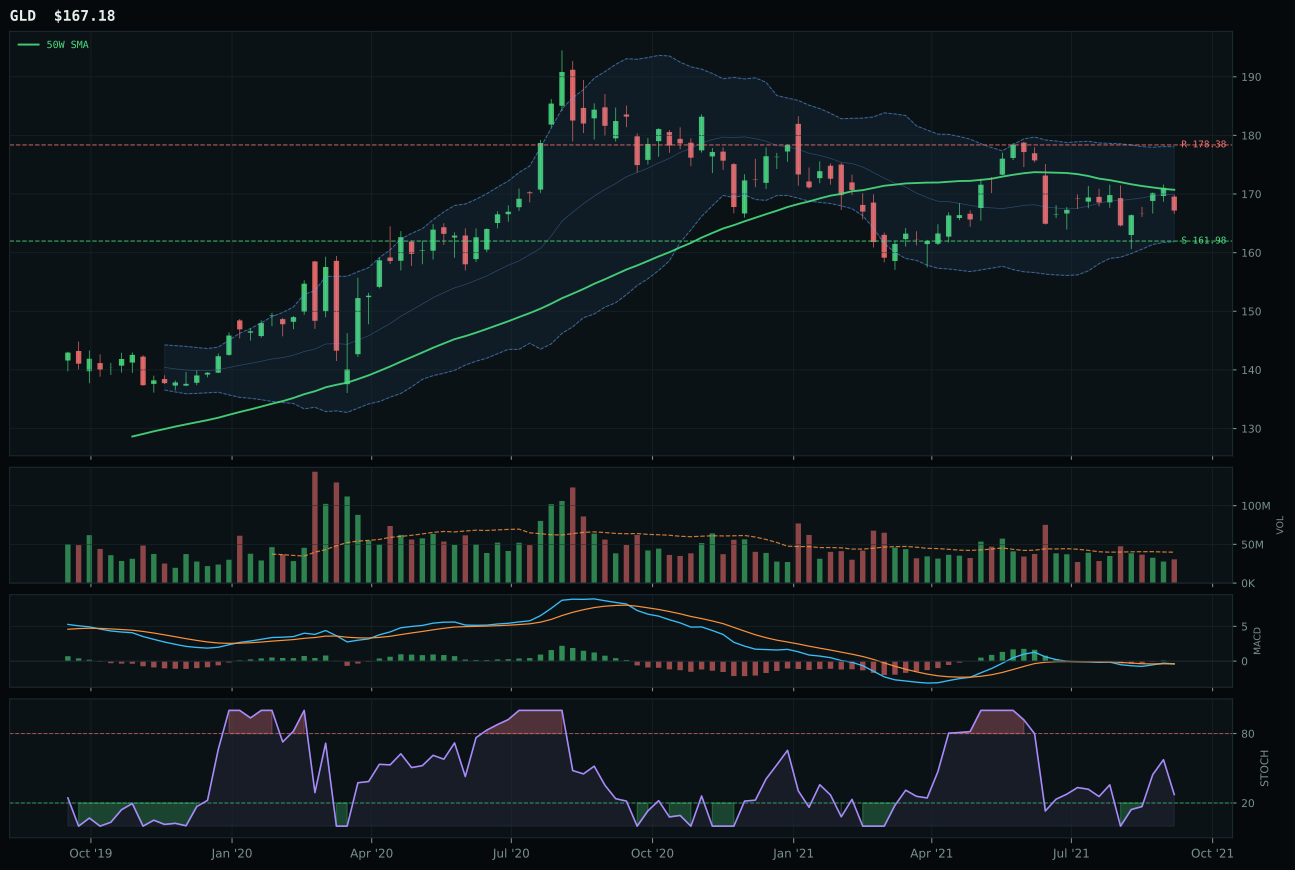
GLD has a pullback into support profile with -9.9% 13-week relative strength versus SPY.
A failed hold above support would weaken the setup.
Actionable but governed by invalidation levels.
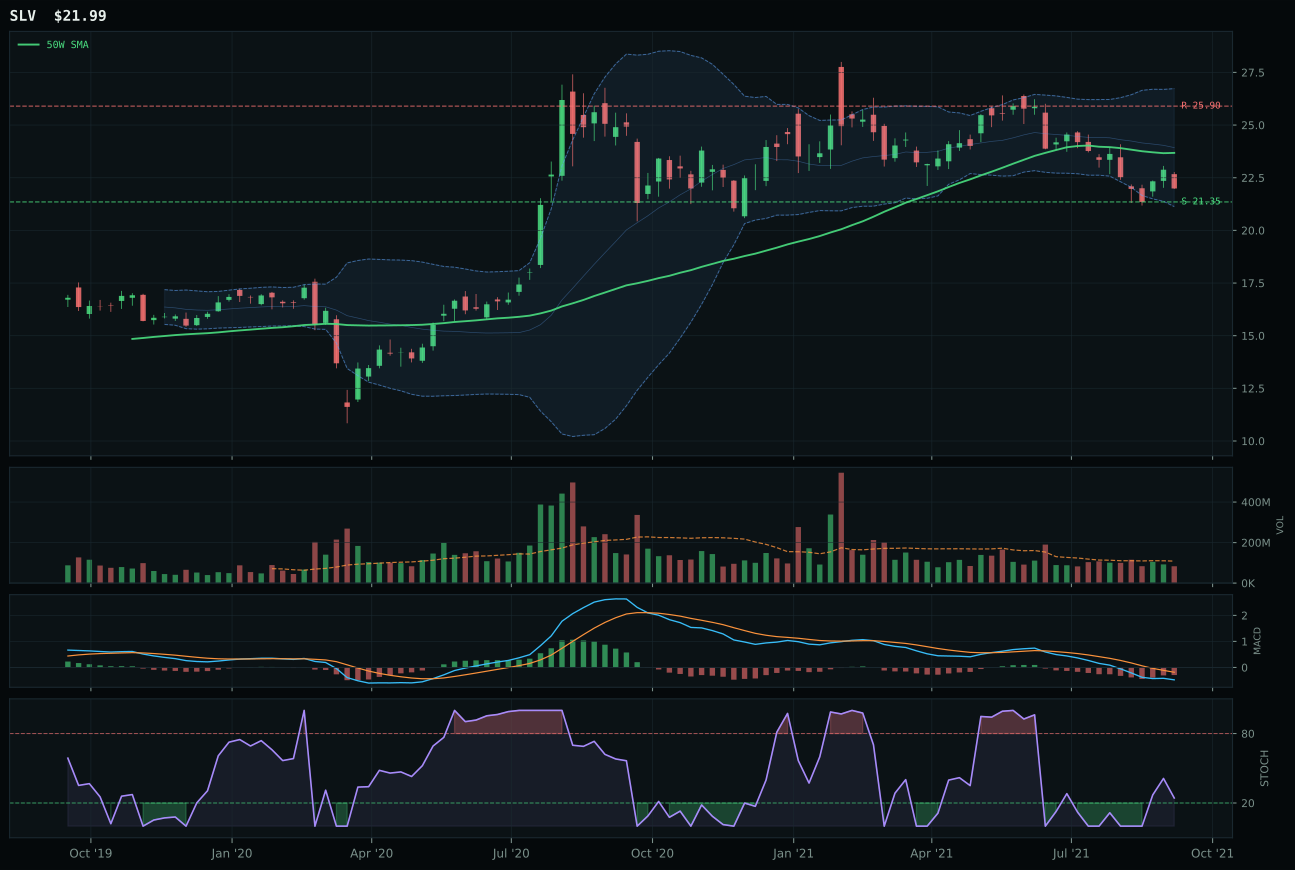
SLV has a pullback into support profile with -20.0% 13-week relative strength versus SPY.
A failed hold above support would weaken the setup.
Actionable but governed by invalidation levels.
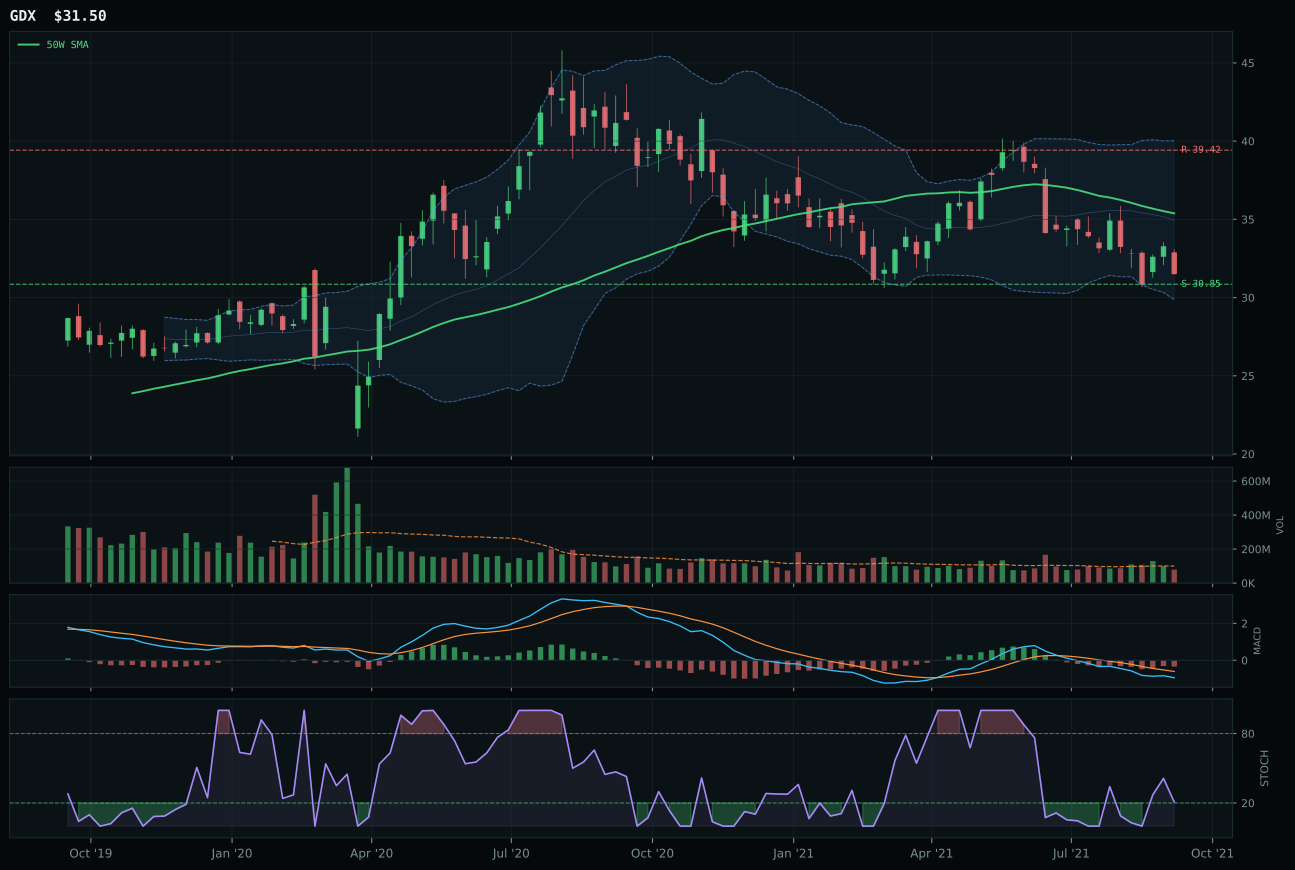
GDX has a pullback into support profile with -22.7% 13-week relative strength versus SPY.
A failed hold above support would weaken the setup.
Actionable but governed by invalidation levels.
GLD wins the metals category with a 63.7 reasoned score against SLV's 53.1—a 10.6-point victory driven by superior timing (100.0 vs 93.0), structure cleanliness (80.8 vs 68.3), and category-relative strength (10.1% vs 0.0%). Gold sits 2.1% below its 50W in a deep retracement/value zone near Fib 0.618, offering early-stage reversal geometry with MACD bearish but improving and stochastic RSI rising mid-zone. Silver's MACD is also improving, but its -20.0% 13W RS versus SPY reveals weakness relative to the broad market, while GLD's -9.9% is meaningfully stronger. Both offer strong risk/reward near 88-90, but timing score separation is decisive: GLD's 100.0 reflects price position at the Fib 0.618 retracement with optimal stochastic entry conditions, whereas SLV's 93.0 reflects its proximity to 52W lows rather than value-zone setups. Gold is the monetary hedge; silver is hybrid monetary/industrial, and industrial weakness is penalizing SLV's technical score.
Precious Metals earned 5% allocation as a tier-2 category with a 42.4 score, placing it middle-of-pack among the nine allocated categories. Disinflation pressure is active (+6), which supports metals as inflation-hedge optionality, and dollar pressure (+3) also helps. However, the category macro fit of 57.0 is weak relative to what top-2 categories enjoy, and liquidity expansion is actually working against metals (-2), suggesting the regime is risk-on rather than defensive. The technical evidence is 66.0 for GLD, above the category's 62% weighting threshold, meaning technicals are driving this allocation more than macro sponsorship. GLD's pullback-into-support geometry and 100.0 timing score make it a defensible entry point, but conviction is conditional: if stochastic RSI stops rising and MACD rolls over without clearing through zero, GLD loses its primary edge. The 5% slot is appropriate as an asymmetric hedge against disinflation persistence, not as a directional bet. Monitor dollar strength and real rates closely; if both inflect higher, metals lose both their macro tailwind and technical structure.
Defense & Aerospace — ITA
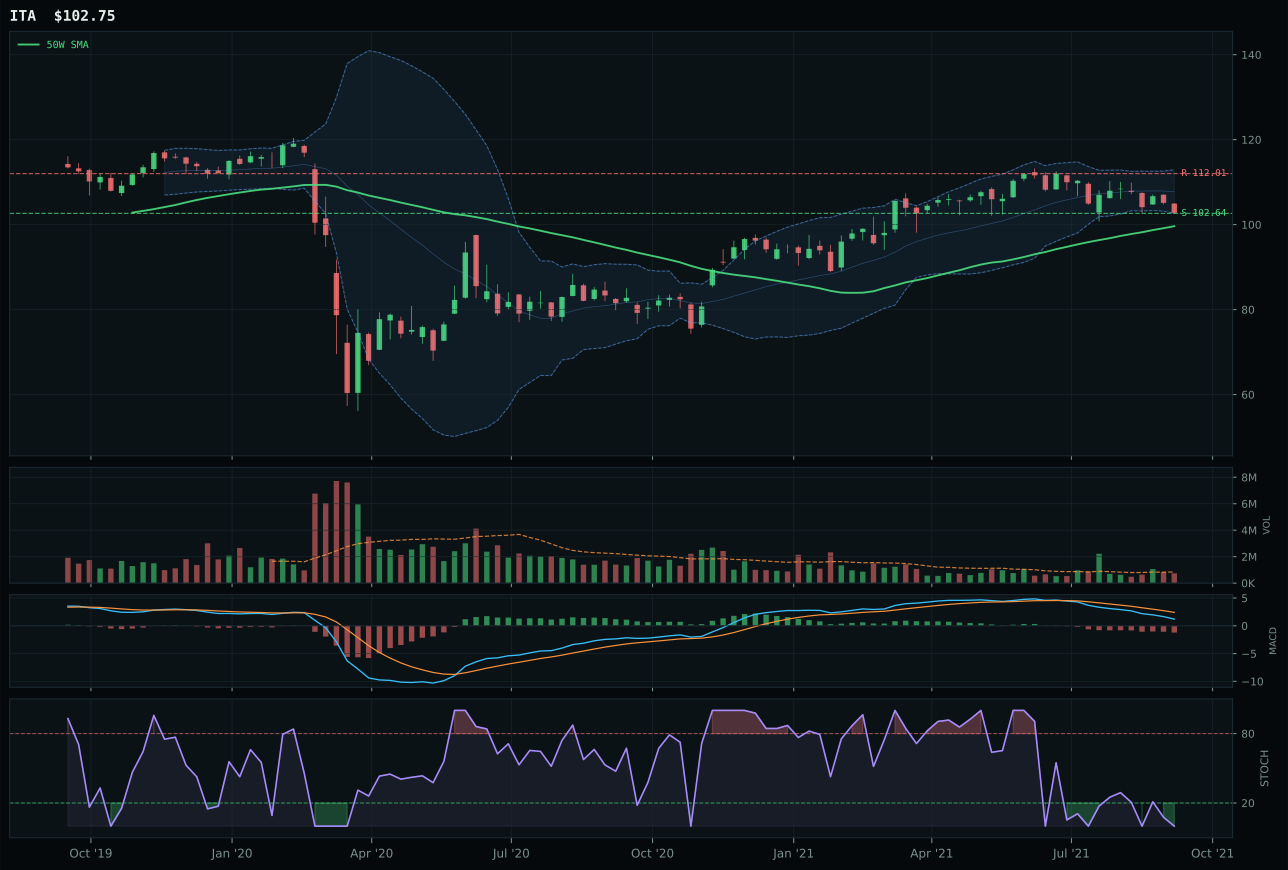
ITA has a pullback into support profile with -12.9% 13-week relative strength versus SPY.
A failed hold above support would weaken the setup.
Actionable but governed by invalidation levels.
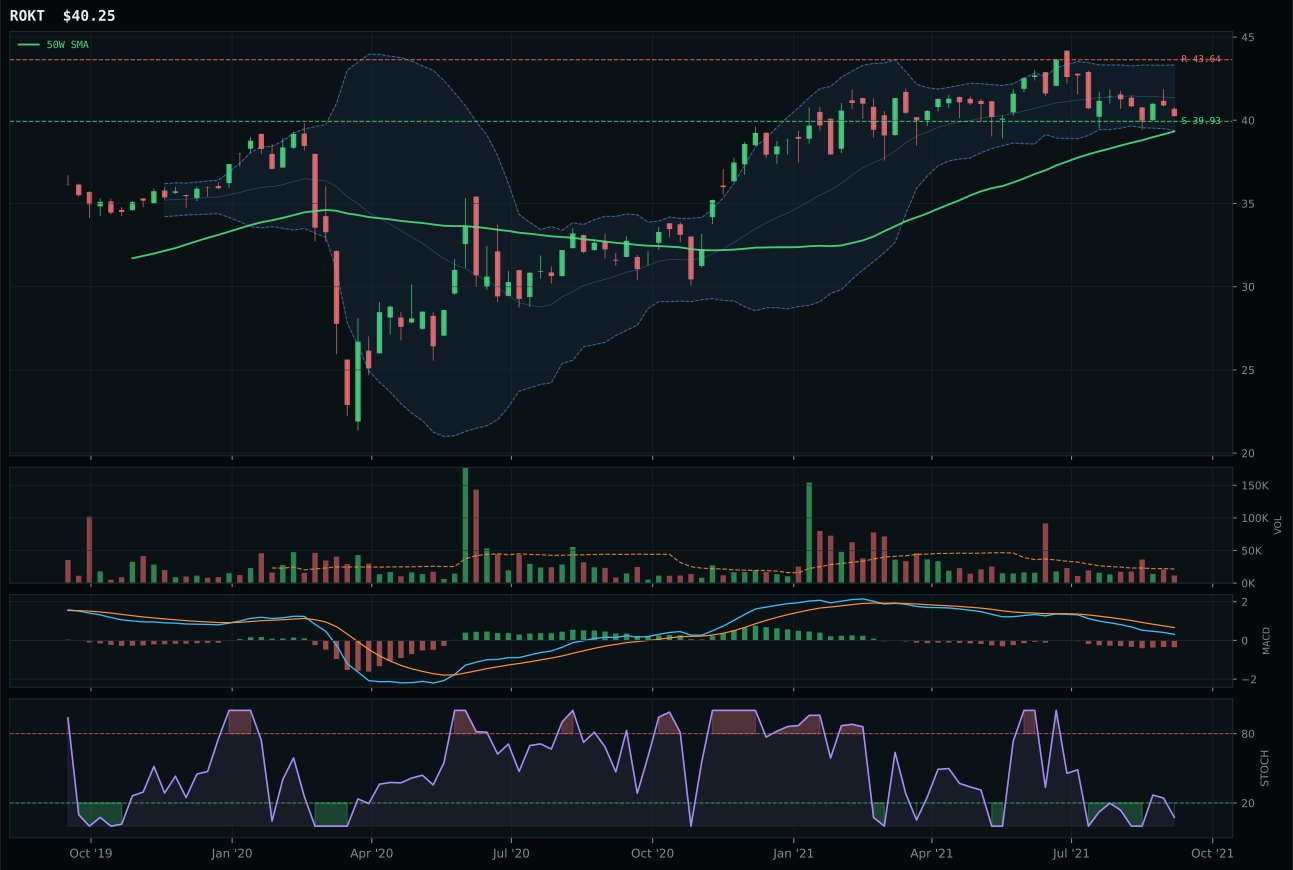
ROKT has a pullback into support profile with -10.7% 13-week relative strength versus SPY.
A failed hold above support would weaken the setup.
Tracked, but not top-2 eligible because: .
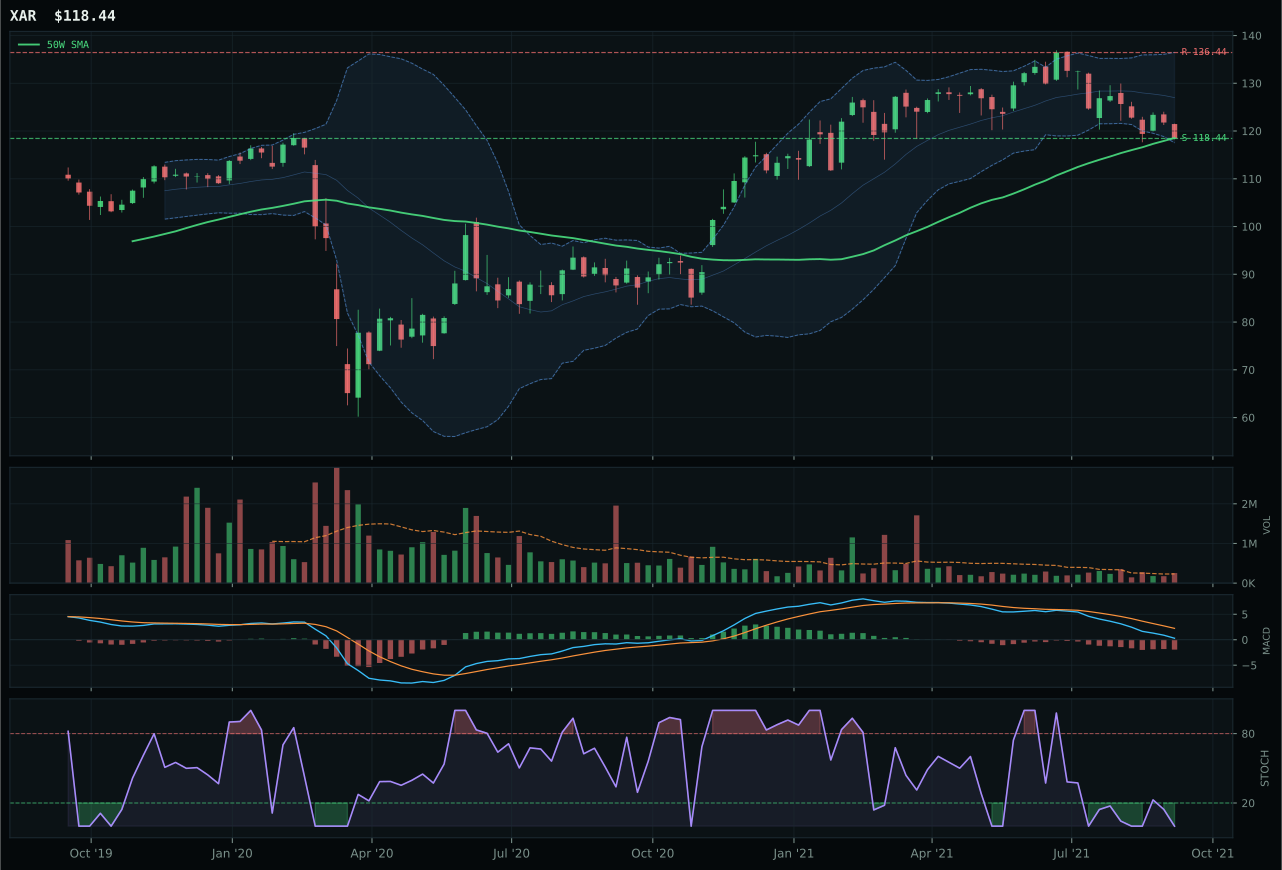
XAR has a pullback into support profile with -16.2% 13-week relative strength versus SPY.
A failed hold above support would weaken the setup.
Actionable but governed by invalidation levels.
ITA wins with a 42.5 reasoned score against ROKT's 41.2, but victory comes from a defensive setup, not aggressive strength: the ETF is 3.1% from its 50W with MACD bearish/weakening and stochastic RSI at oversold 0.00, creating textbook reversal geometry. Structure cleanliness at 71.9 beats ROKT's 68.1, and risk/reward is identical at 90.0—both offer 0.1% downside to support and similar distance to resistance. The critical edge is ITA's neutral volume (0.89x) versus ROKT's thin participation: when a chart is reversal-ready at support, neutral volume entering the zone signals patience, while thin participation suggests weak conviction. Momentum confirmation is flatlined at 0.0 for ITA (4W return -4.6%, 13W -7.9%, MACD deteriorating), meaning this is a mean-reversion setup, not a momentum play. The category itself is weak—29.3 final score—and ITA's win is a Pyrrhic victory among depressed peers.
Defense & Aerospace earned 5% allocation as a tier-2 category despite its weak 29.3 score, revealing how portfolio construction weights setup geometry against macro backdrop. The category's 59.0 macro fit exceeds Technical (67.0) because broad market bear is active (+6) and dollar pressure adds +3, both supporting defensive value. Yet the technical evidence across the basket is weak (34.2 for ITA), and credit stress is neutral (+2 here, but typically a headwind). The Goldilocks regime does not naturally sponsor defense; it sponsors growth. The 5% slot reflects ITA's clean pullback-into-support setup and risk/reward at 90.0 more than conviction in upside catalysts. To earn a top-2 promotion, this category would need either MACD to actually flip bullish with volume confirmation, or macro breadth signals to deteriorate further, turning defense from timing rotation into regime-change positioning. For now, it holds as a small hedge that costs little in opportunity if growth regimes persist.
Agriculture & Livestock — MOO
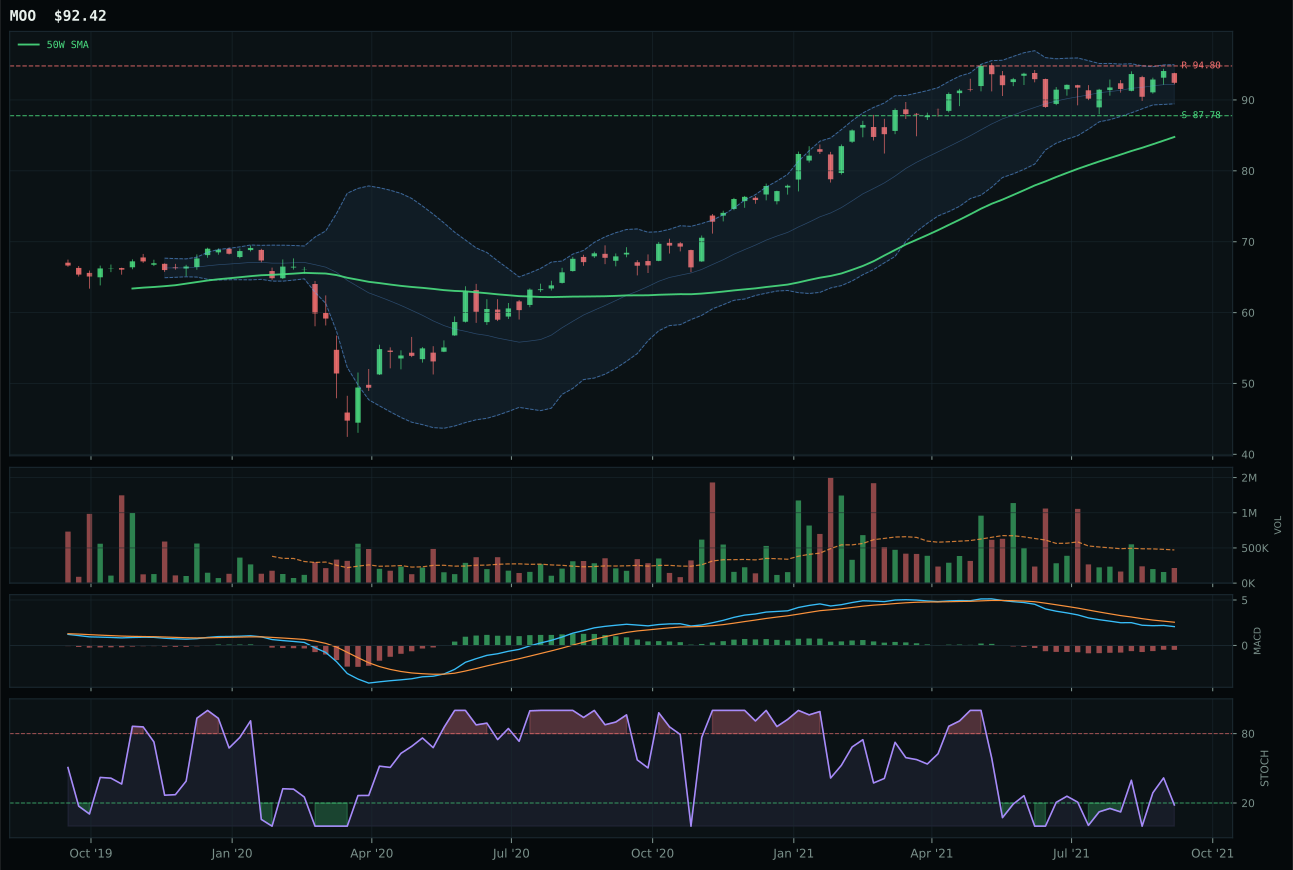
MOO has a neutral structure profile with -5.5% 13-week relative strength versus SPY.
A failed hold above support would weaken the setup.
Actionable but governed by invalidation levels.
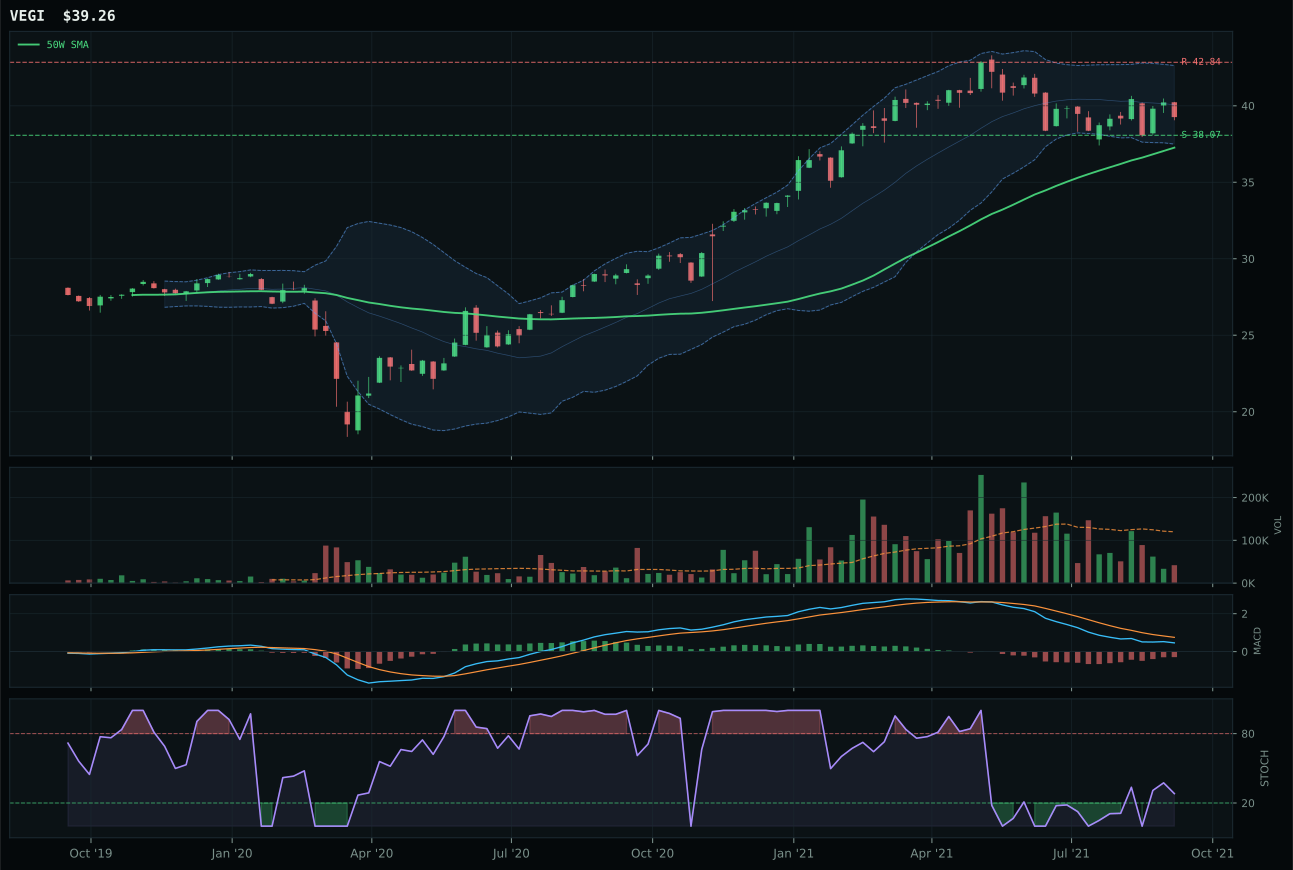
VEGI has a pullback into support profile with -8.8% 13-week relative strength versus SPY.
A failed hold above support would weaken the setup.
Tracked, but not top-2 eligible because: .
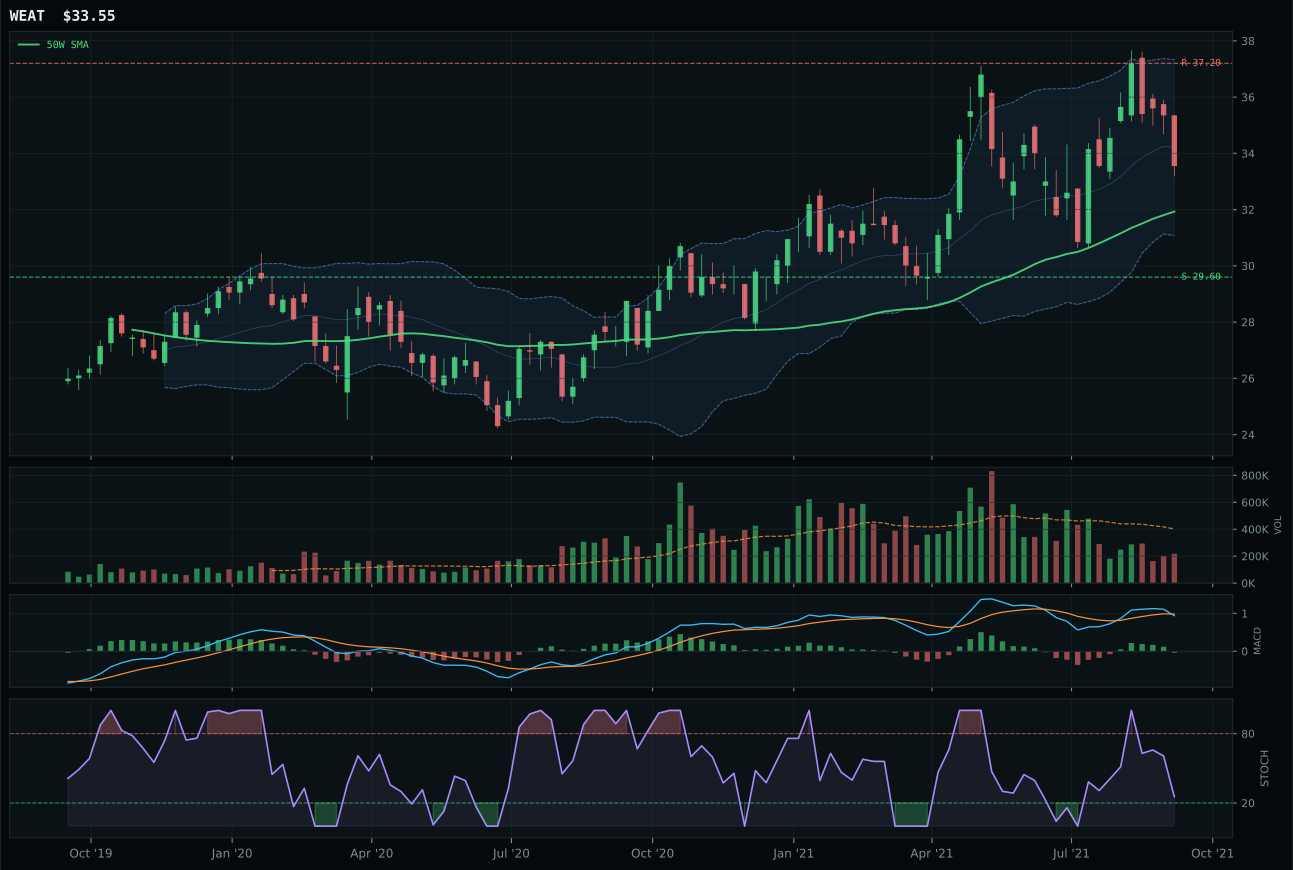
WEAT has a neutral structure profile with -6.3% 13-week relative strength versus SPY.
A failed hold above support would weaken the setup.
Actionable but governed by invalidation levels.
MOO wins against VEGI with a 57.5 reasoned score versus 45.0, powered by superior stochastic RSI timing (oversold turn up at 0.18 vs rising mid-zone) and category-relative strength (0.8% vs -2.5%). Both sit in neutral structure above the 200W; MOO is 9.0% from its 50W while VEGI sits in a pullback-into-support zone. MOO's MACD is bearish but improving—the same as VEGI—but MOO's stochastic RSI offers earlier-stage reversal signal, and its 13W return of -0.5% beats VEGI's -3.8%. Volume is thin for both (MOO at 0.46x, VEGI at thin participation), so this win reflects timing precision rather than institutional sponsorship. Risk/reward slightly favors VEGI at 90.0 versus MOO's 45.5, meaning VEGI has better downside protection; MOO compensates with better momentum setup geometry and category relative strength, making it the better entry point for a recovery trade.
Agriculture & Livestock earned 5% allocation as a tier-2 category with a final score of 29.3, matching Defense & Aerospace exactly and ranking low among the nine allocated slots. Real asset sponsorship is active (+8 at category level), and commodity breadth positive contributes +10, but disinflation pressure (-8) is a persistent headwind that explains why farming exposure does not rank higher. The Goldilocks macro regime does not force agricultural demand, and the weak technicals across MOO, VEGI, and WEAT suggest this category is reversal-watch rather than conviction long. MOO's oversold-turn-up setup is valid, but it arrives on thin volume and only -0.5% 13W return—more of a mean reversion bounce candidate than a thrust higher. The 5% slot is retained because commodity diversification and real asset exposure have macro optionality in late-cycle scenarios, and the risk/reward on pullbacks near support is asymmetric. If disinflation pressure reverses or commodity breadth weakens further, this slot could be reallocated to higher-conviction opportunities.
Emerging Markets — INDA
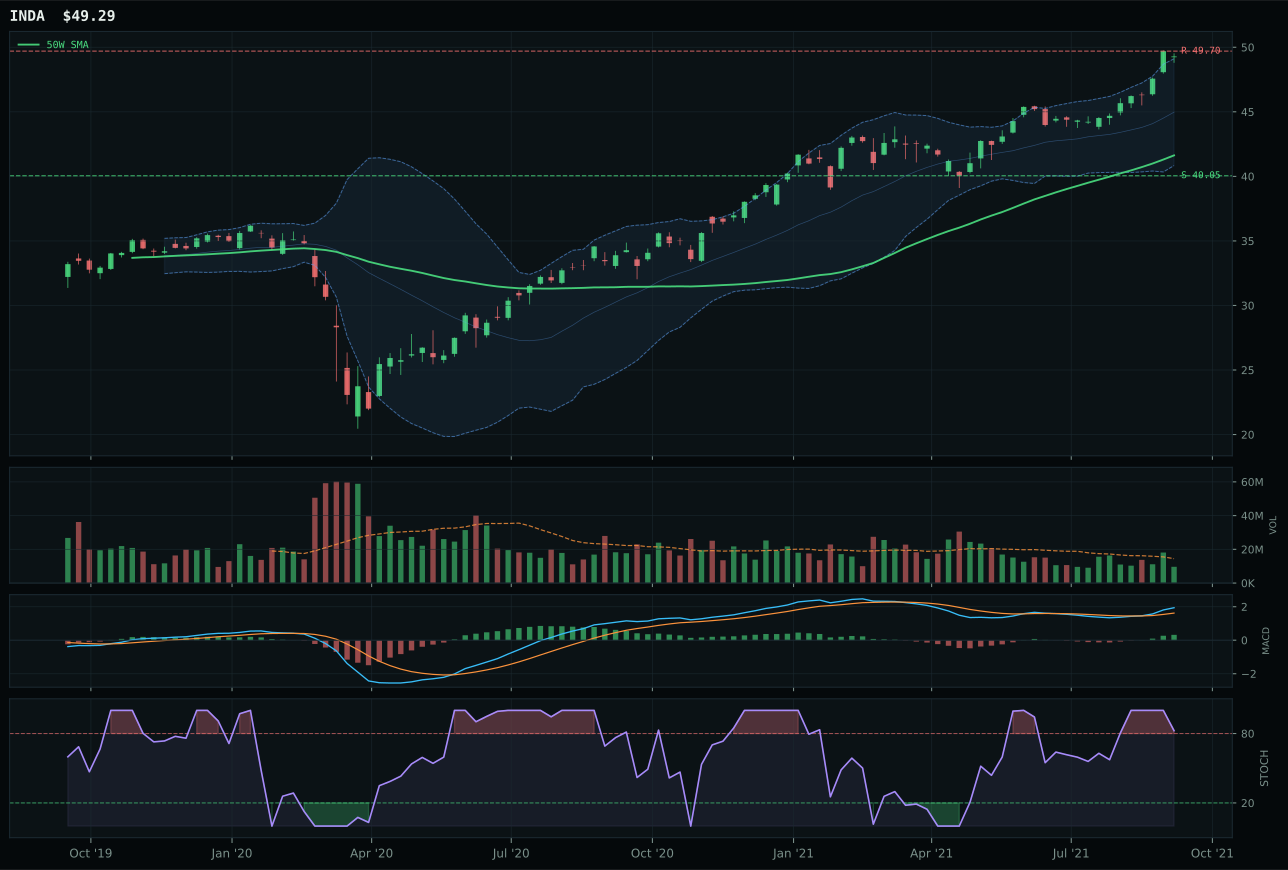
INDA has a vertical extension profile with 4.0% 13-week relative strength versus SPY.
A failed hold above support would weaken the setup.
Actionable but governed by invalidation levels.
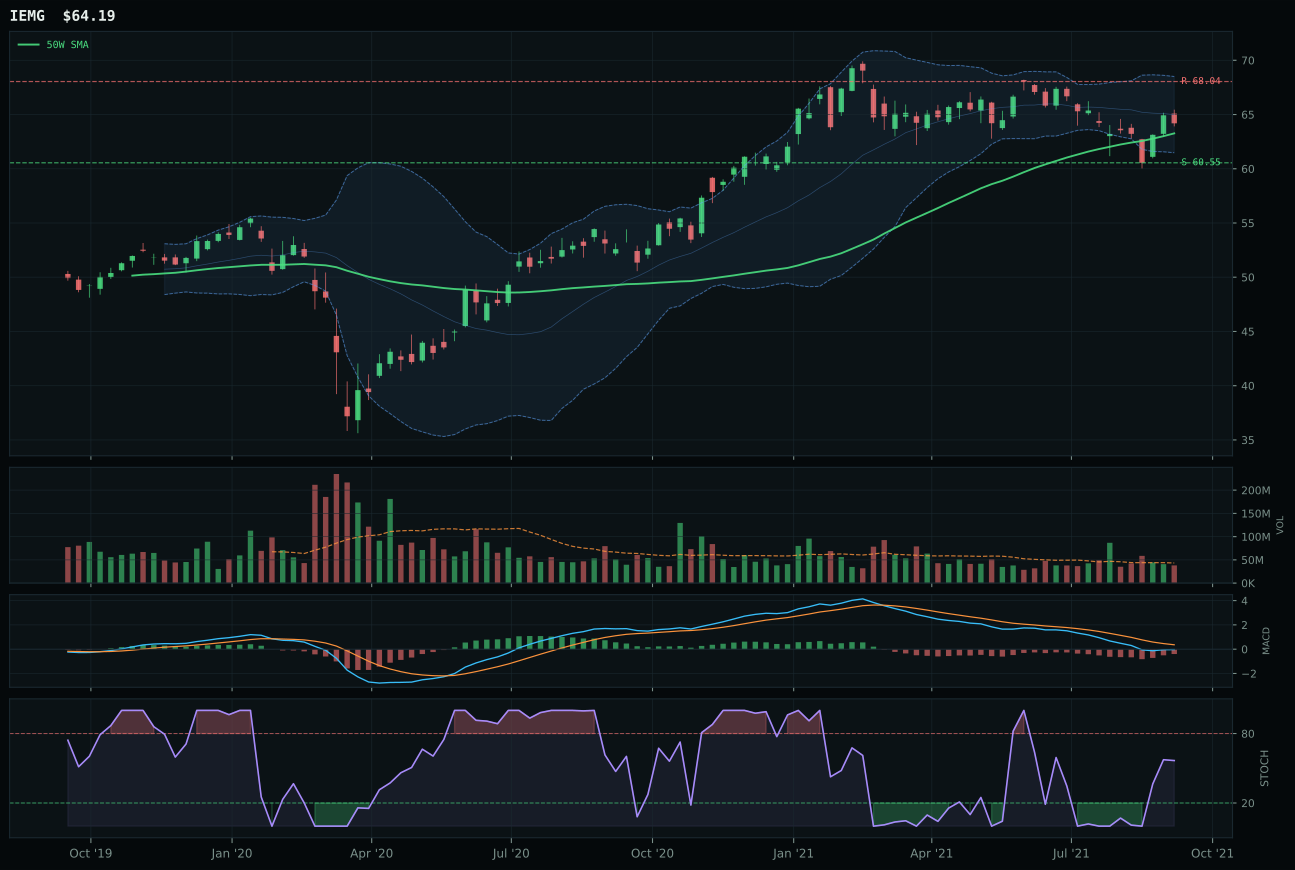
IEMG has a compression near 50W profile with -9.3% 13-week relative strength versus SPY.
A failed hold above support would weaken the setup.
Actionable but governed by invalidation levels.
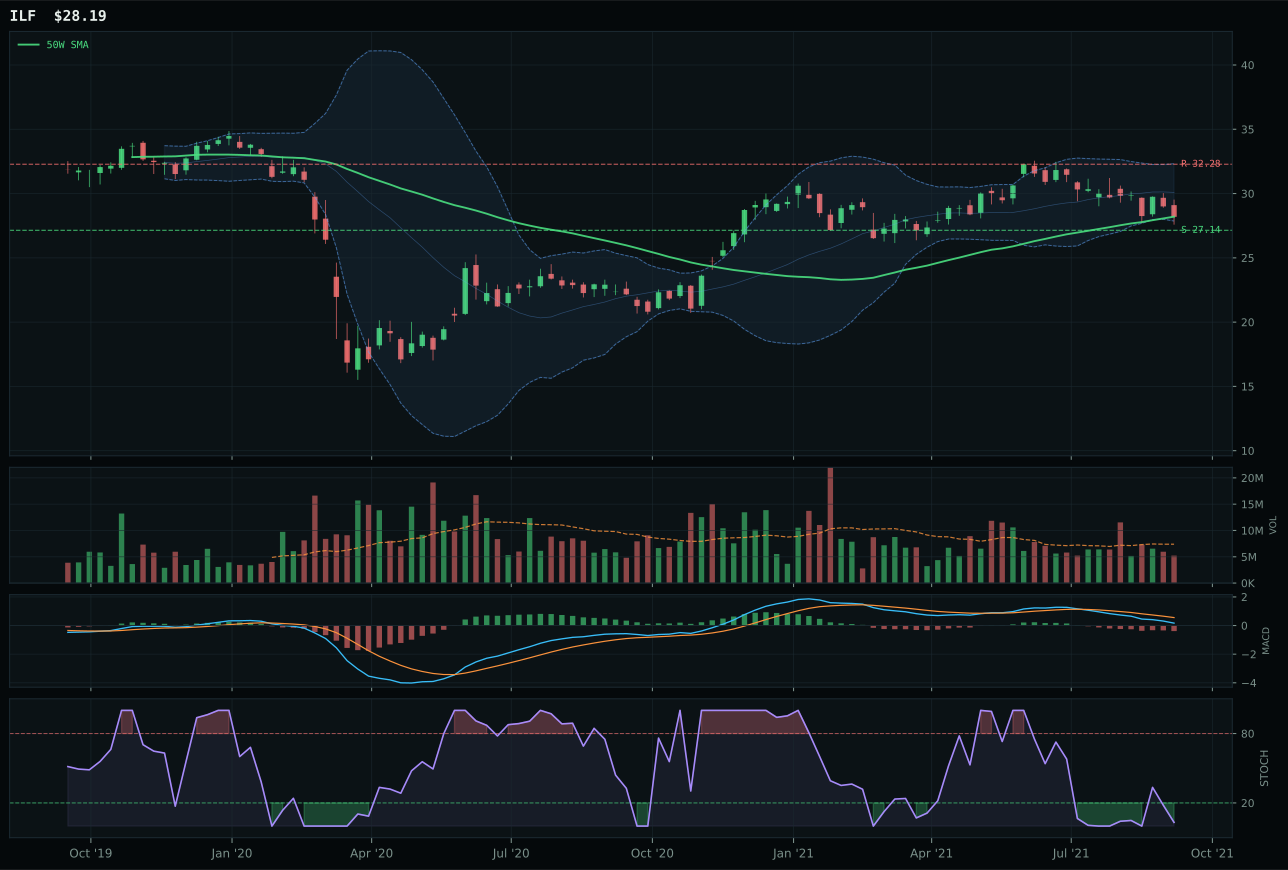
ILF has a pullback into support profile with -15.7% 13-week relative strength versus SPY.
Extension and support failure are the main tactical risks.
Tracked, but not top-2 eligible because: structurally broken.
INDA wins against IEMG with a 48.9 reasoned score versus 54.1—an unusual outcome where the representative ranks second. INDA possesses perfect 100.0 trend (price above 50W, above 200W, positive slope, 4.0% RS versus SPY) and dominant momentum confirmation at 96.0, but timing is penalized at only 27.0 because it sits 18.4% extended above the 50W near 52W highs. IEMG scores higher on technical evidence (62.0 vs 54.3) and timing (100.0 vs 27.0) because it sits in compression near the 50W—a cleaner setup for accumulation. Yet INDA's category-relative strength of 13.3% against IEMG's 0.0% signals that Indian growth is the category's internal leader. MACD is bullish and improving for INDA versus bearish but improving for IEMG, marking a critical confirmation edge. Both suffer from dollar pressure (-5 at their level) and credit stress (-5), but INDA's higher momentum and stronger relative strength carry the decision despite worse entry geometry.
Emerging Markets earned 0% allocation this week, placing the category outside the portfolio entirely despite INDA's clean momentum setup. The final category score of 15.3 ranks 9th or 10th, reflecting a devastating macro headwind: dollar pressure is active (-14 at category level), credit stress is active (-10), and broad market bear is active (-9). The category macro fit is only 33.0—the worst in the portfolio. Goldilocks (+8) and liquidity expansion (+8) are supposed to support emerging markets, but they are overwhelmed by currency, credit, and risk-sentiment tailwinds. INDA's bullish MACD and 9.0% 13W return are genuine technical strength, yet they cannot overcome a regime where dollar strength and risk-off mentality penalize EM exposure. The portfolio's allocation is to growth and real assets, not to currencies or EM beta. Emerging markets would need either dollar pressure to reverse as an active descriptor, broad market bear to turn off, or credit stress to ease materially. Until then, the 0% slot is appropriate. INDA could earn a tier-2 spot if it consolidates from its 18.4% extension and MACD holds bullish while dollar pressure eases; monitor for a reversal in DXY or credit spreads as the catalyst for EM re-entry.
Traditional Energy — FCG
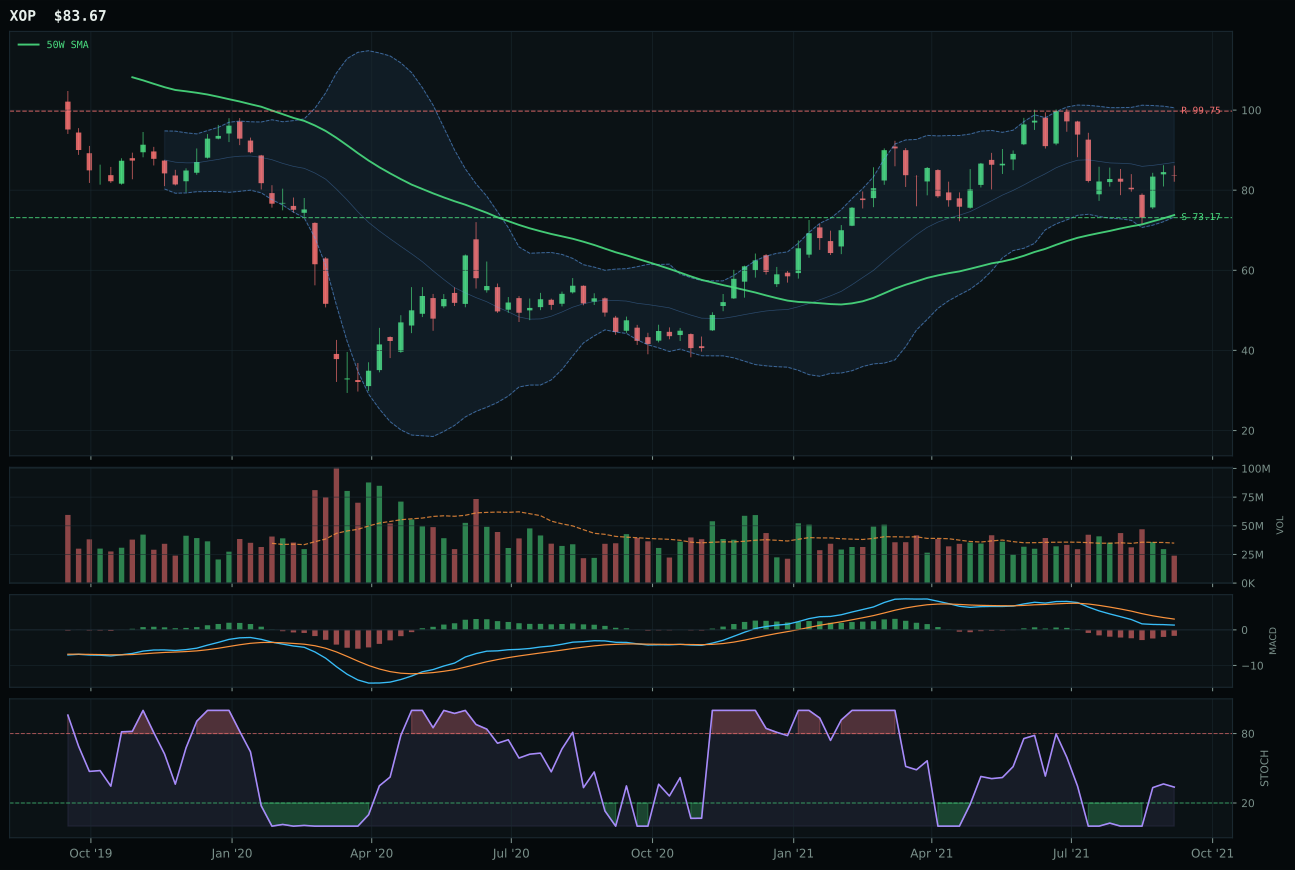
XOP has a neutral structure profile with -19.0% 13-week relative strength versus SPY.
A failed hold above support would weaken the setup.
Actionable but governed by invalidation levels.
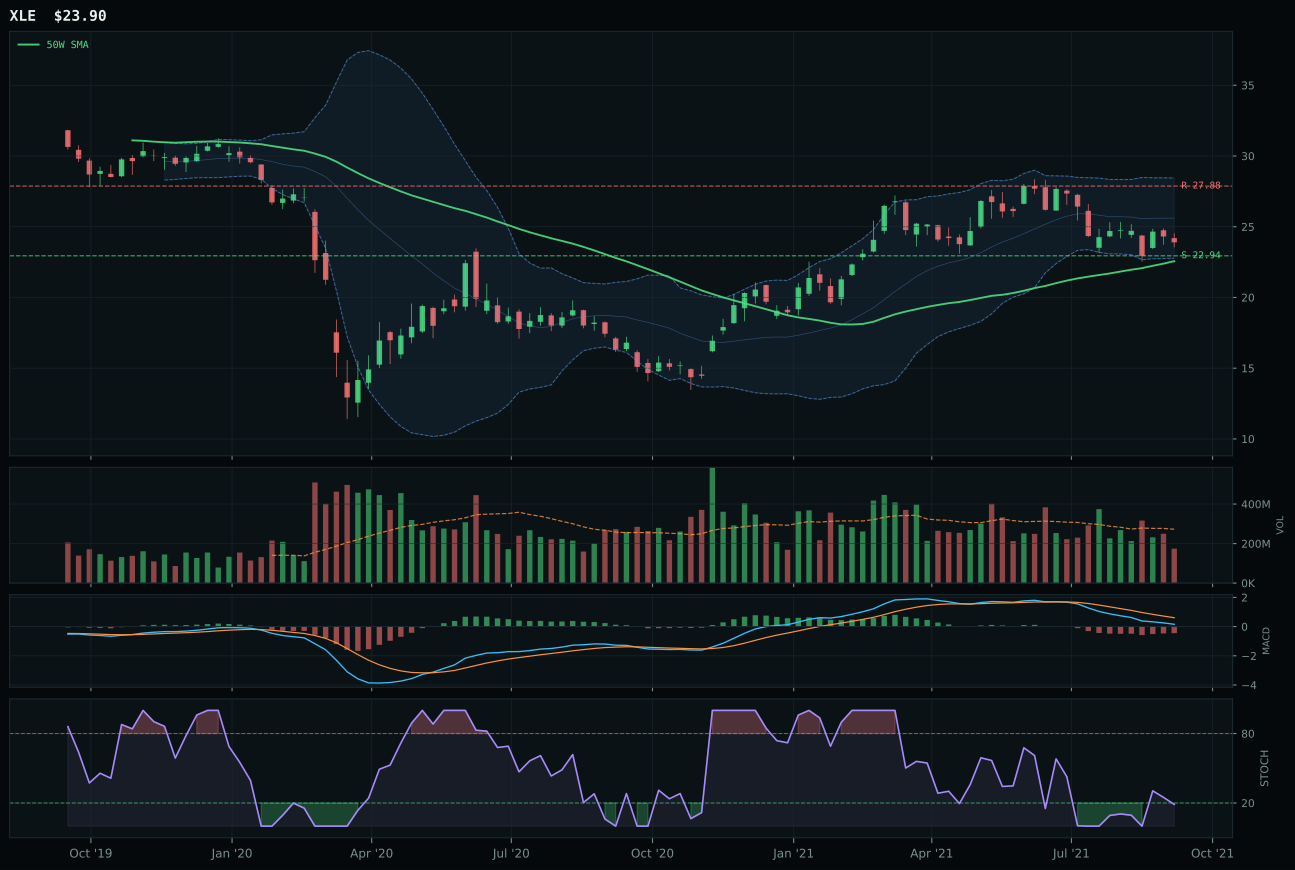
XLE has a pullback into support profile with -18.7% 13-week relative strength versus SPY.
A failed hold above support would weaken the setup.
Actionable but governed by invalidation levels.
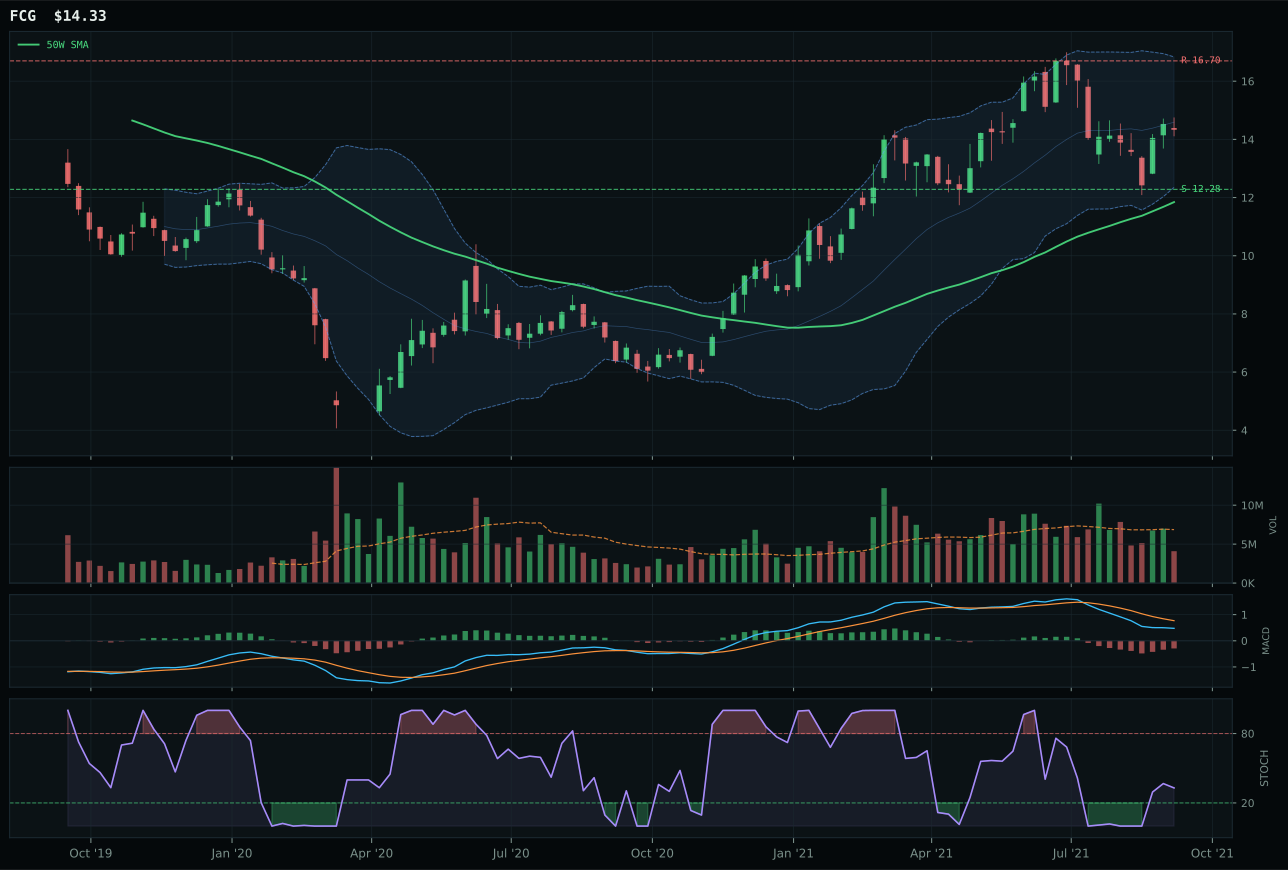
FCG has a vertical extension profile with -16.3% 13-week relative strength versus SPY.
A failed hold above support would weaken the setup.
Actionable but governed by invalidation levels.
FCG wins the category with a 34.4 reasoned score against XOP's 38.0—a reversal that makes this the portfolio's only 0% allocated winner, signaling deep category weakness. FCG is 21.0% extended above its 50W with bullish-but-improving MACD and rising-mid-zone stochastic, forming a vertical extension setup that penalizes entry risk even though technical evidence is 30.1. XOP scores 38.0 and is more cleanly structured at neutral with better timing (99.0 vs 61.0) and sits in the upper retracement zone, yet even XOP's 13W return of -14.1% and -19.0% RS versus SPY reveal a sector in genuine weakness. Volume is thin across both (0.60x for FCG, thin participation for XOP), and neither MACD nor momentum confirmation exceeds 23.7 points. The category's 12.5 final score places it dead last; FCG's win is technically marginal and allocation-irrelevant.
Traditional Energy earned 0% allocation this week, excluding the category entirely from the portfolio despite FCG's technical victory. The category ranks 9th or 10th with a final score of 12.5—the weakest in the portfolio—because macro headwinds are severe: disinflation pressure is active (-10), credit stress is active (-7), and real asset sponsorship (+7) cannot offset those two tailwinds. The category macro fit is only 40.0, far below the threshold needed for tier-2 consideration. Technicals are deteriorating: FCG shows -11.3% 13W return, -16.3% RS versus SPY, and momentum confirmation at only 22.7 out of 100. The underlying energy thesis is that dollar pressure (+3) and real asset sponsorship should have helped; instead, the broad market bear being active in the reasoning layer works against cyclicals hard. Energy would need either MACD to flip bullish across the basket (now all bearish but improving), volume to spike on accumulation (now thin), or disinflation pressure to reverse as an active descriptor. Currently, the sector is a laggard in a growth-sponsored regime. Revisit if XLE or XOP move decisively above their 50W with volume confirmation and MACD clears bullish—until then, energy allocation remains zero.