
2021-09-03
Informational purposes only. The content in this report, including allocations, analysis, and commentary, is provided solely for informational and educational purposes. It does not constitute financial advice, investment advice, trading advice, or any other type of advice. Past performance does not guarantee future results. Always conduct your own research and consult a qualified financial professional before making investment decisions.
Weekly Allocation
| Ticker | Category | Weight | Role |
|---|---|---|---|
| FSOL | 50% | Overlay | |
| XLU | Utilities & Infrastructure | 10% | Top-2 (10%) |
| CIBR | Technology | 10% | Top-2 (10%) |
| COPX | Industrial Metals | 5% | Tier-2 (5%) |
| URNM | Nuclear Energy | 5% | Tier-2 (5%) |
| MOO | Agriculture & Livestock | 5% | Tier-2 (5%) |
| GLD | Precious Metals | 5% | Tier-2 (5%) |
| BOTZ | AI | 5% | Tier-2 (5%) |
| ITA | Defense & Aerospace | 5% | Tier-2 (5%) |
Trade Instructions — Monday Open
Sell the tranche from 2021-08-06 (completing its 4-week hold). Buy the new tranche. Instructions show net portfolio changes — same-asset positions cancel, weight changes show the delta.
| Action | Ticker | Instruction |
|---|---|---|
| SELL | IGV | Sell 50% of IGV position (reduce 5.00% → 2.50%) |
| SELL | COPX | Sell 17% of COPX position (reduce 7.50% → 6.25%) |
| SELL | SMH | Sell 50% of SMH position (reduce 2.50% → 1.25%) |
| SELL | WEAT | Sell 33% of WEAT position (reduce 3.75% → 2.50%) |
| BUY | XLU | Buy XLU — 20.00% of freed cash (adds 1.25% to portfolio) |
| BUY | BOTZ | Buy BOTZ — 20.00% of freed cash (adds 1.25% to portfolio) |
| BUY | CIBR | Buy CIBR — 40.00% of freed cash (adds 2.50% to portfolio) |
| BUY | MOO | Buy MOO — 20.00% of freed cash (adds 1.25% to portfolio) |
Current Portfolio After Trade
Combined holdings across all 4 active tranches. Each tranche is 25% of the portfolio.
| Ticker | % of Portfolio | Weight Bar |
|---|---|---|
| FSOL | 50.00% | |
| COPX | 6.25% | |
| XLU | 6.25% | |
| ITA | 5.00% | |
| CIBR | 5.00% | |
| URNM | 3.75% | |
| BOTZ | 3.75% | |
| WEAT | 2.50% | |
| IGV | 2.50% | |
| GLD | 2.50% | |
| PAVE | 2.50% | |
| XLK | 2.50% | |
| MOO | 2.50% | |
| SMH | 1.25% | |
| GDX | 1.25% | |
| URA | 1.25% | |
| SLV | 1.25% |
Macro Regime — Goldilocks
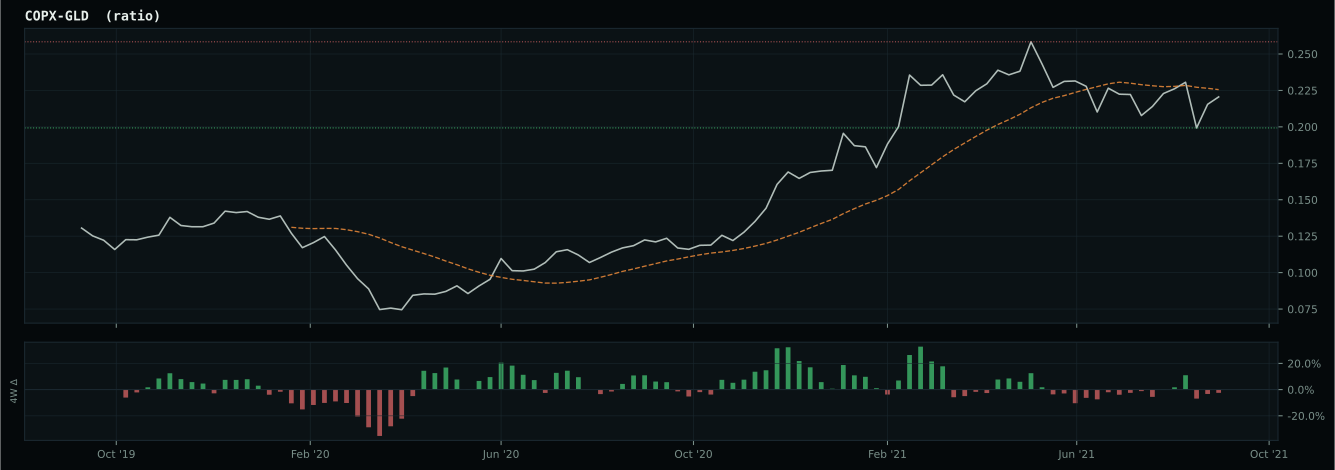
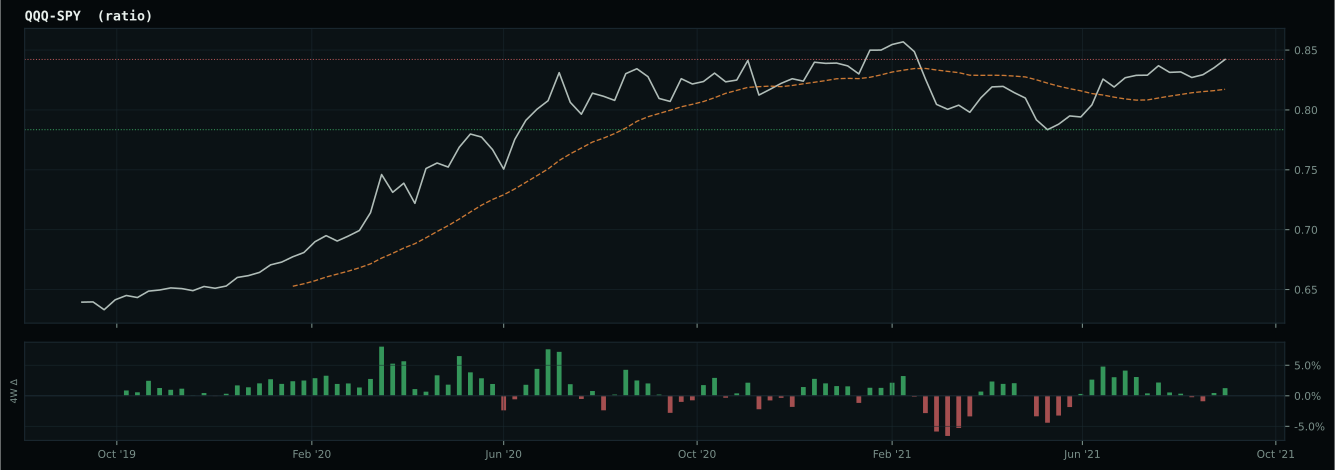
Macro Evidence Charts
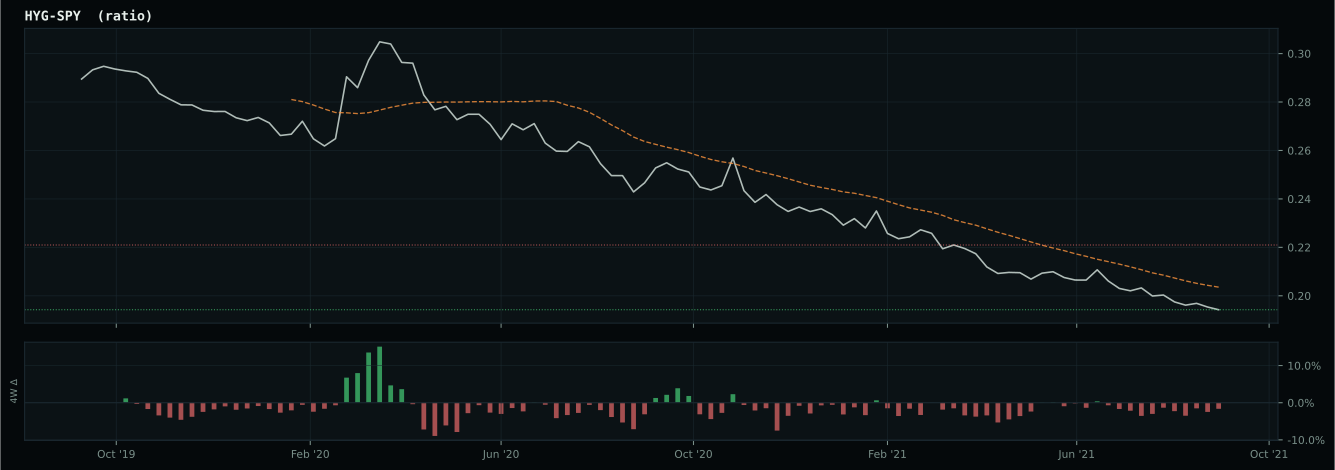
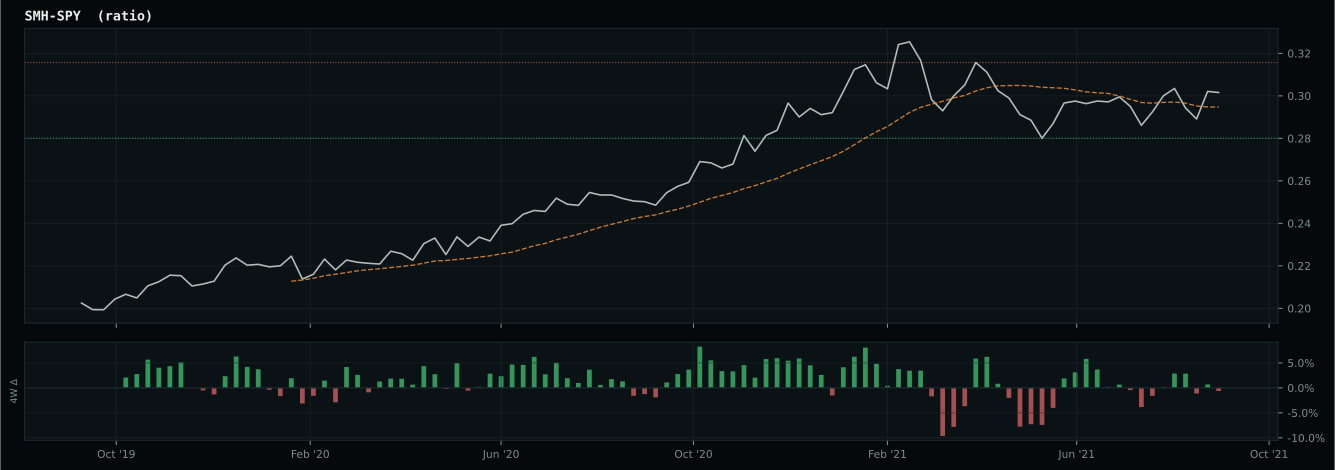
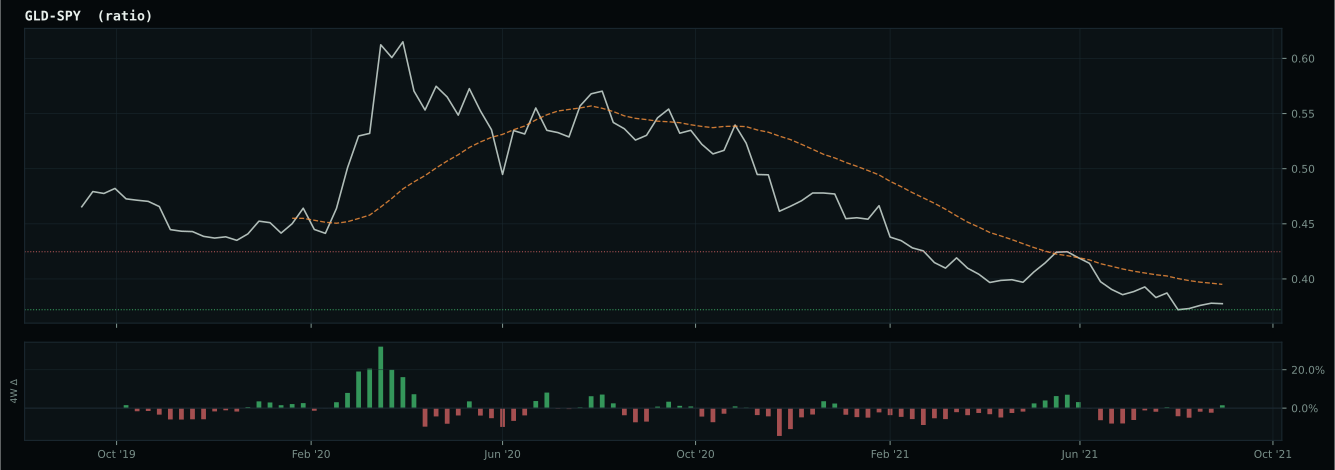
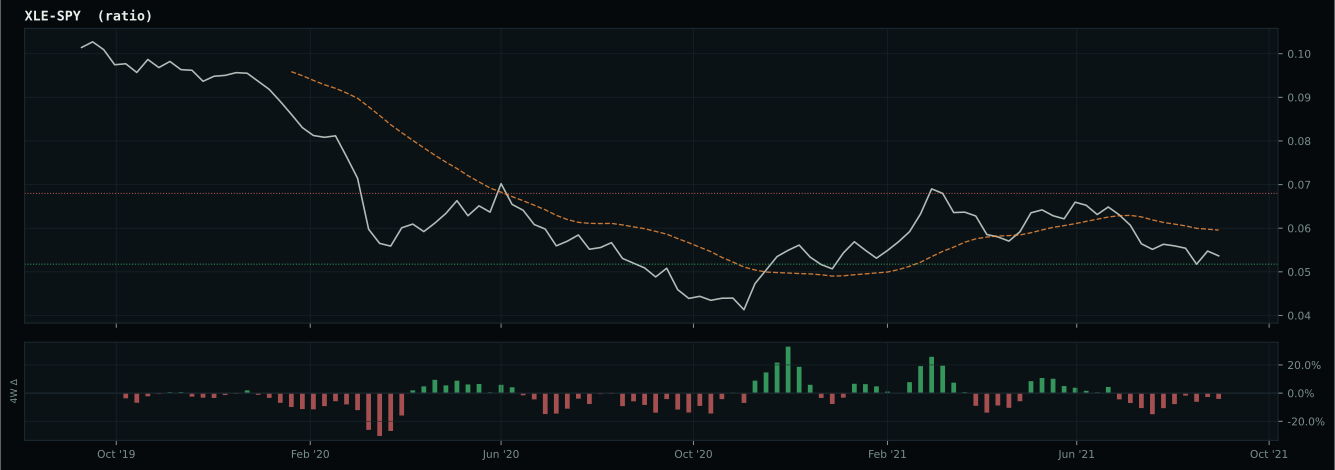
Market-implied signals behind the macro regime scores. Each ratio compares two assets; the direction and slope of the ratio is what the macro engine reads.
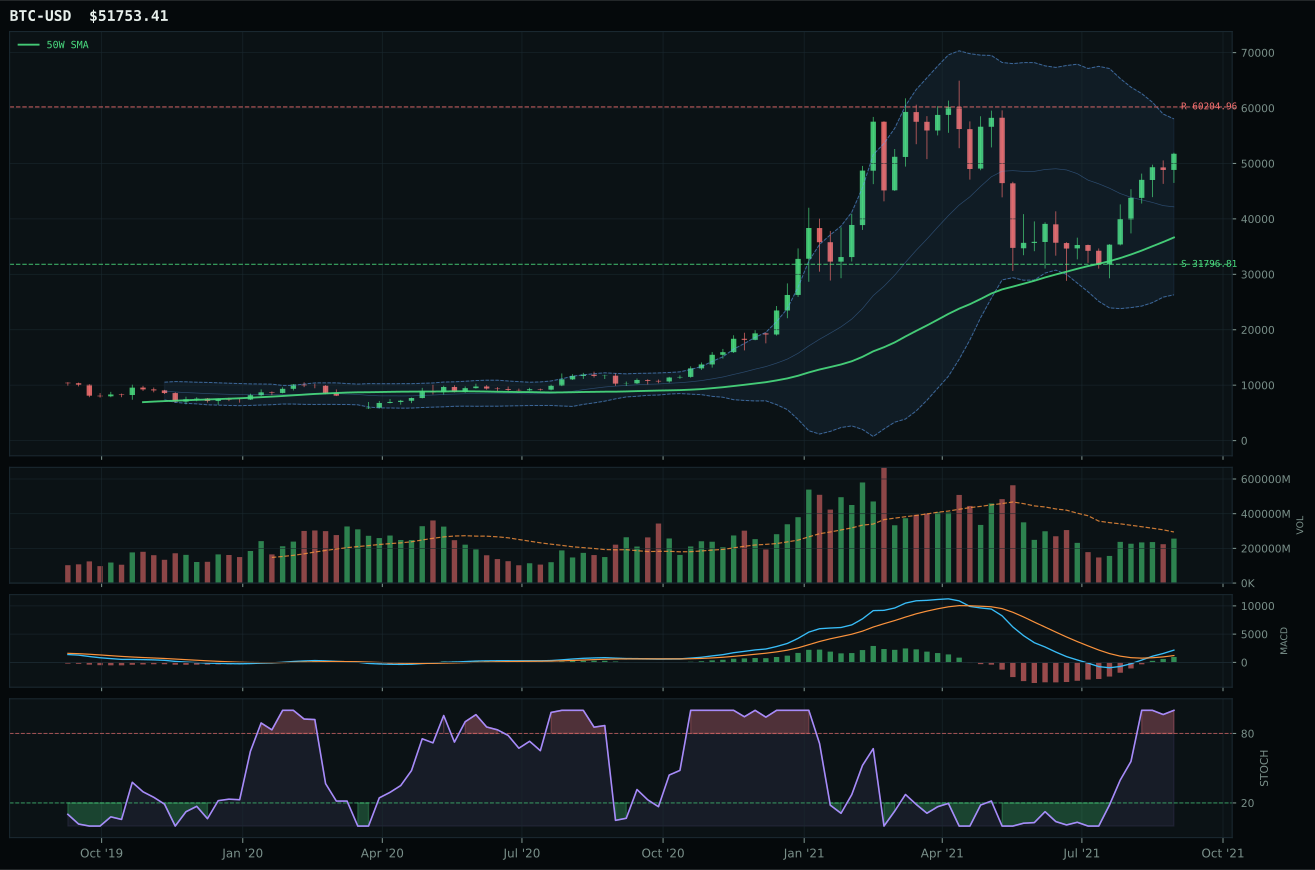
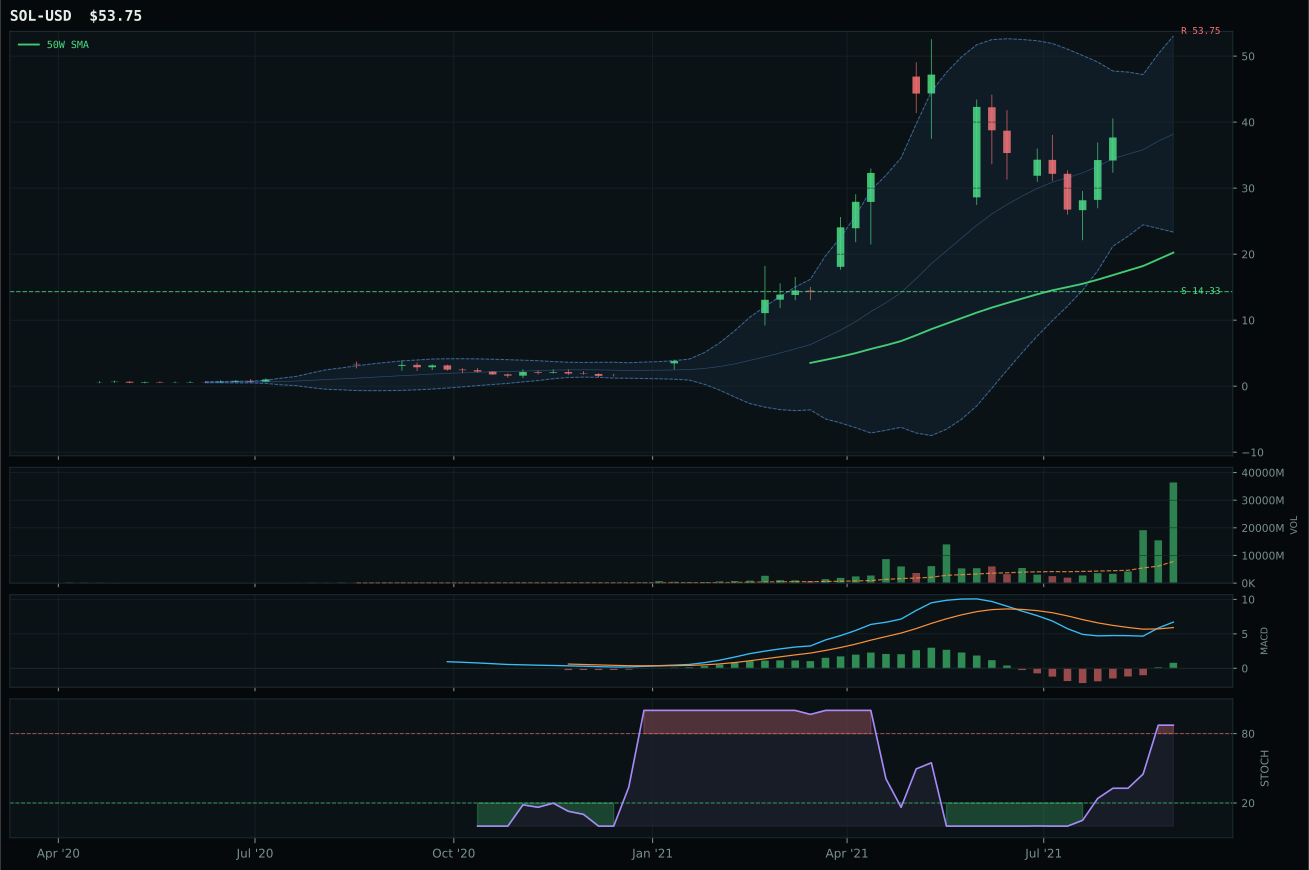
Crypto Regime — AltSeason
ValueBTC not armed: BTC has not made the first post-breakdown touch of the 200W buy zone after losing the 50W
TrendBTC confirmed: 2 consecutive closes above rising/flat 50W SMA
all available AltSeason conditions pass; missing optional confirmations skipped
Category Rankings
| Rank | Category | Winner | Score | Alloc | 4W Ret | Peers (4W) |
|---|---|---|---|---|---|---|
| 1 | Utilities & Infrastructure | XLU | 64.4 | 20% | -8.09% | IGF -1.7% · PAVE -5.2% |
| 2 | Technology | CIBR | 64.2 | 20% | -6.40% | IGV -5.8% · XLK -5.5% |
| 3 | Industrial Metals | COPX | 56.6 | 10% | -7.37% | REMX -11.4% · PICK -10.6% |
| 4 | Nuclear Energy | URNM | 54.0 | 10% | +3.53% | URA +0.5% · NLR -2.5% |
| 5 | Agriculture & Livestock | MOO | 41.9 | 10% | -1.64% | WEAT +4.2% · VEGI -1.5% |
| 6 | Precious Metals | GLD | 38.6 | 10% | -3.46% | SLV -8.4% · GDX -11.1% |
| 7 | AI | BOTZ | 37.8 | 10% | -8.05% | SMH -7.0% · AIQ -6.0% |
| 8 | Defense & Aerospace | ITA | 28.6 | 10% | +1.00% | XAR -0.3% · ROKT -1.0% |
| 9 | Emerging Markets | INDA | 20.2 | 0% | +0.20% | IEMG -5.8% · ILF -8.5% |
| 10 | Traditional Energy | FCG | 11.2 | 0% | +22.59% | XOP +20.4% · XLE +12.5% |
Utilities & Infrastructure — XLU
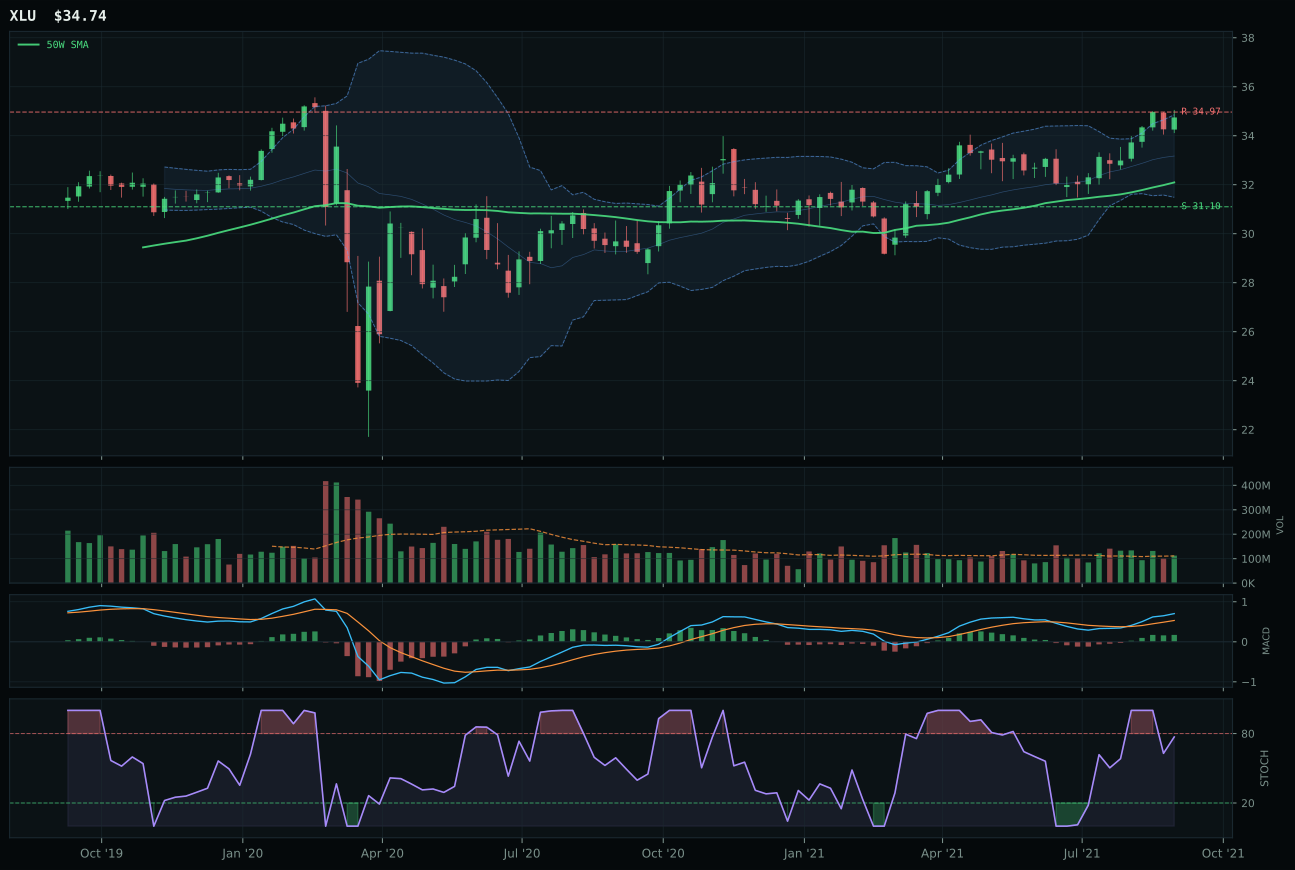
XLU has a neutral structure profile with -0.9% 13-week relative strength versus SPY.
A failed hold above support would weaken the setup.
Actionable but governed by invalidation levels.
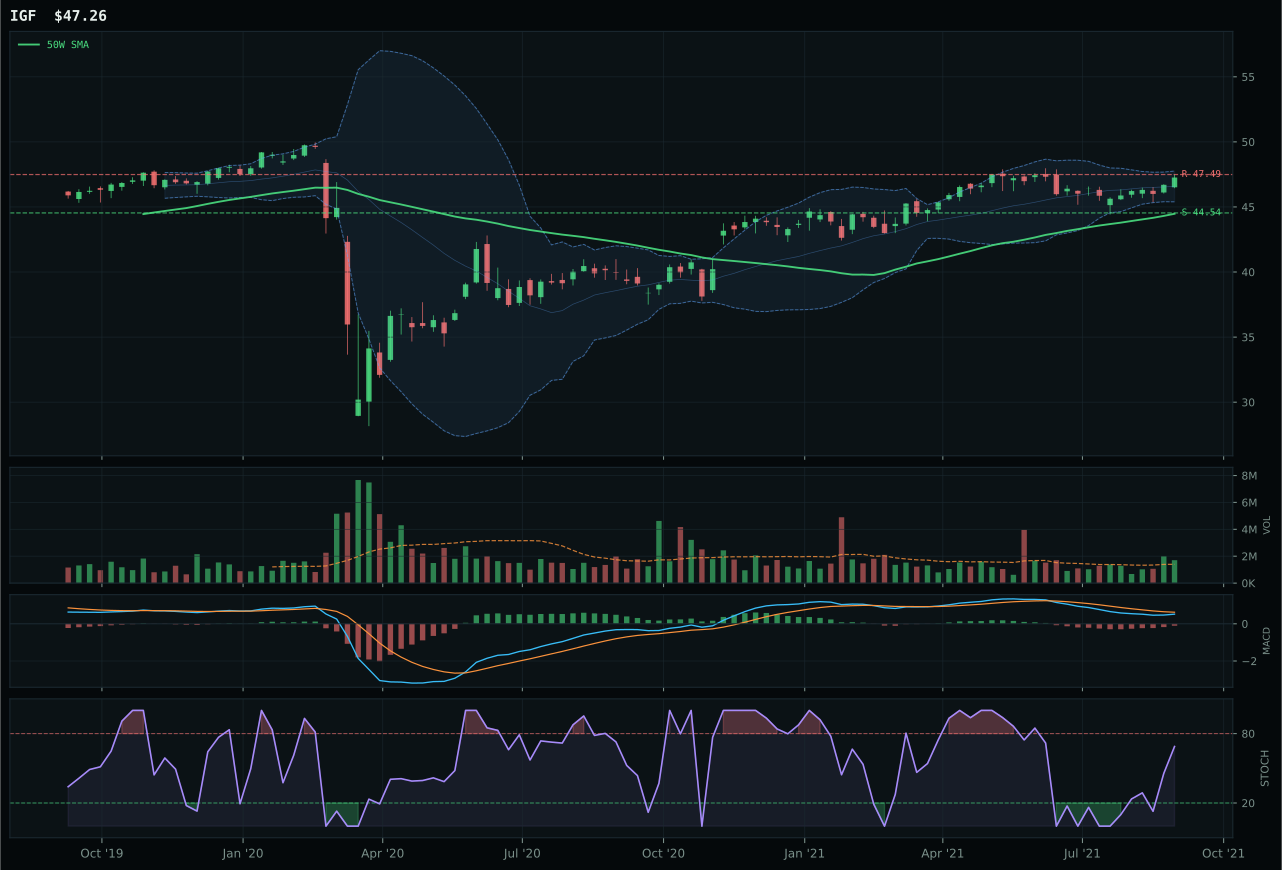
IGF has a neutral structure profile with -7.6% 13-week relative strength versus SPY.
A failed hold above support would weaken the setup.
Actionable but governed by invalidation levels.
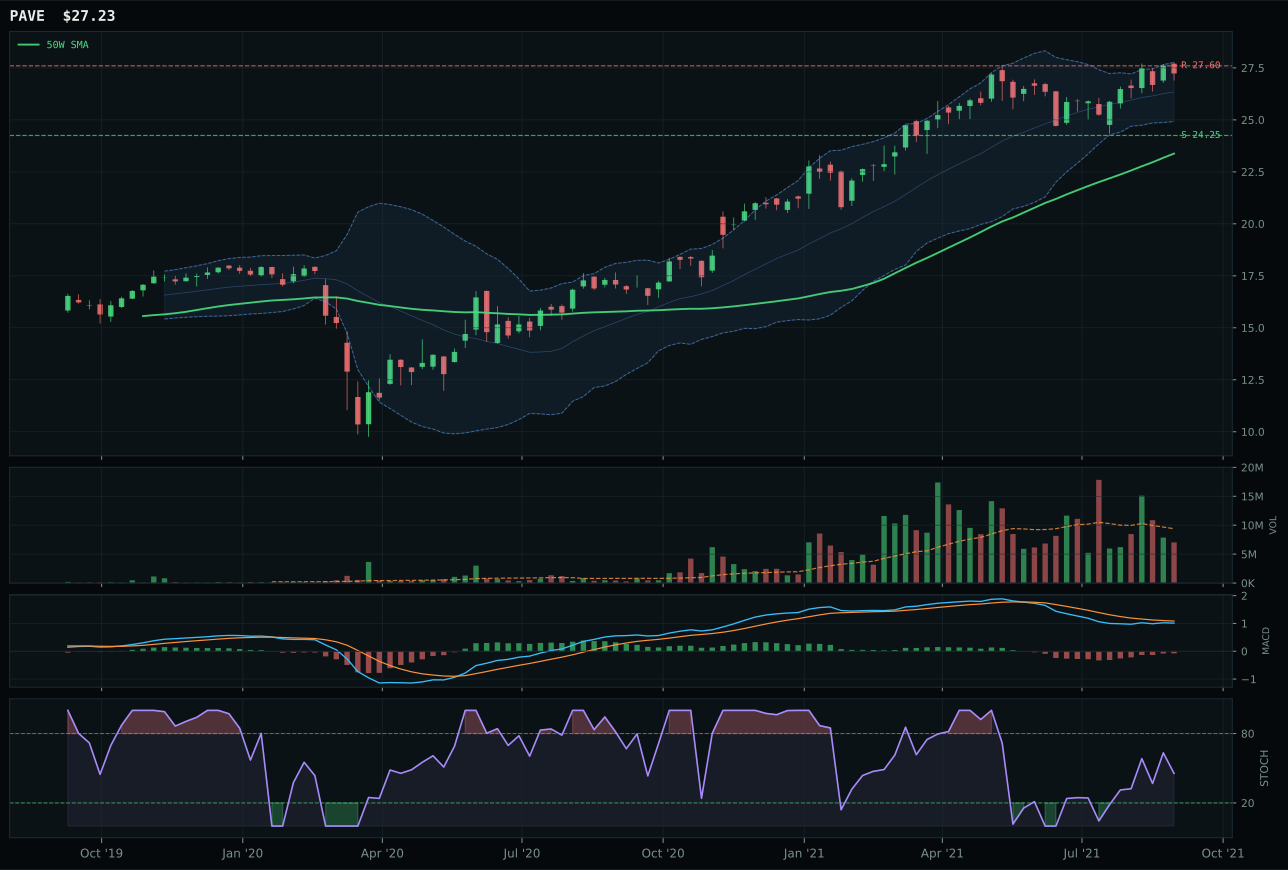
PAVE has a vertical extension profile with -5.0% 13-week relative strength versus SPY.
A failed hold above support would weaken the setup.
Actionable but governed by invalidation levels.
XLU secured the category and a top-2 ranking with a 9.2-point edge over IGF by combining the category's strongest trend score (98.6/100 from price solidly above both moving averages with a tight 0.3% 50-week slope) and momentum confirmation (77.6/100 from 3.0% four-week and 6.3% thirteen-week returns). XLU's MACD is bullish-and-improving while IGF's is bearish-but-improving, a critical divergence in a category built on defensive trend following rather than momentum acceleration. Category-relative strength of 4.1% for XLU versus IGF's -2.6% reflects active capital rotation into regulated utilities as a risk hedge. Both show neutral structure near the 50-week decision zone, but XLU's compression of 86.8 and tighter support-resistance bands (31.10 to 34.97) give it the cleaner technical geometry. Volume is neutral for both, confirming this is not accumulation-driven but rather a pure trend-following setup where price is the only conviction signal.
Utilities & Infrastructure earns 10% allocation as a top-2 category because the 64.4 score reflects near-perfect macro alignment with current regime conditions: disinflation pressure is active (+6), broad market bear is active (+4), and the category-level macro fit of 64.0/100 matches the technical evidence weight at 62%. This combination—technical purity plus macro tailwind—creates the portfolio's second-highest-conviction setup after the top 20% slot. XLU's trend confirmation of 98.6 is elite-tier, the kind of stability that allows portfolio managers to hold positions through volatility without constant rebalancing; the 6.3% 13-week return combined with near-zero -0.9% relative weakness versus SPY signals the trade is in a defensive consolidation rather than a chasing rally. Stochastic RSI at falling/neutral (0.77) means momentum has mild remaining, creating room for quiet accumulation as disinflation fears persist and rate-sensitive names find refuge in regulated yield. The 10% slot reflects conviction in utilities' structural role in a bear-market regime while acknowledging that risk-reward is compressed (38.0/100); this is a sleeping-pills holding, not a momentum rocket, suitable for core portfolio stability during macro uncertainty.
Technology — CIBR
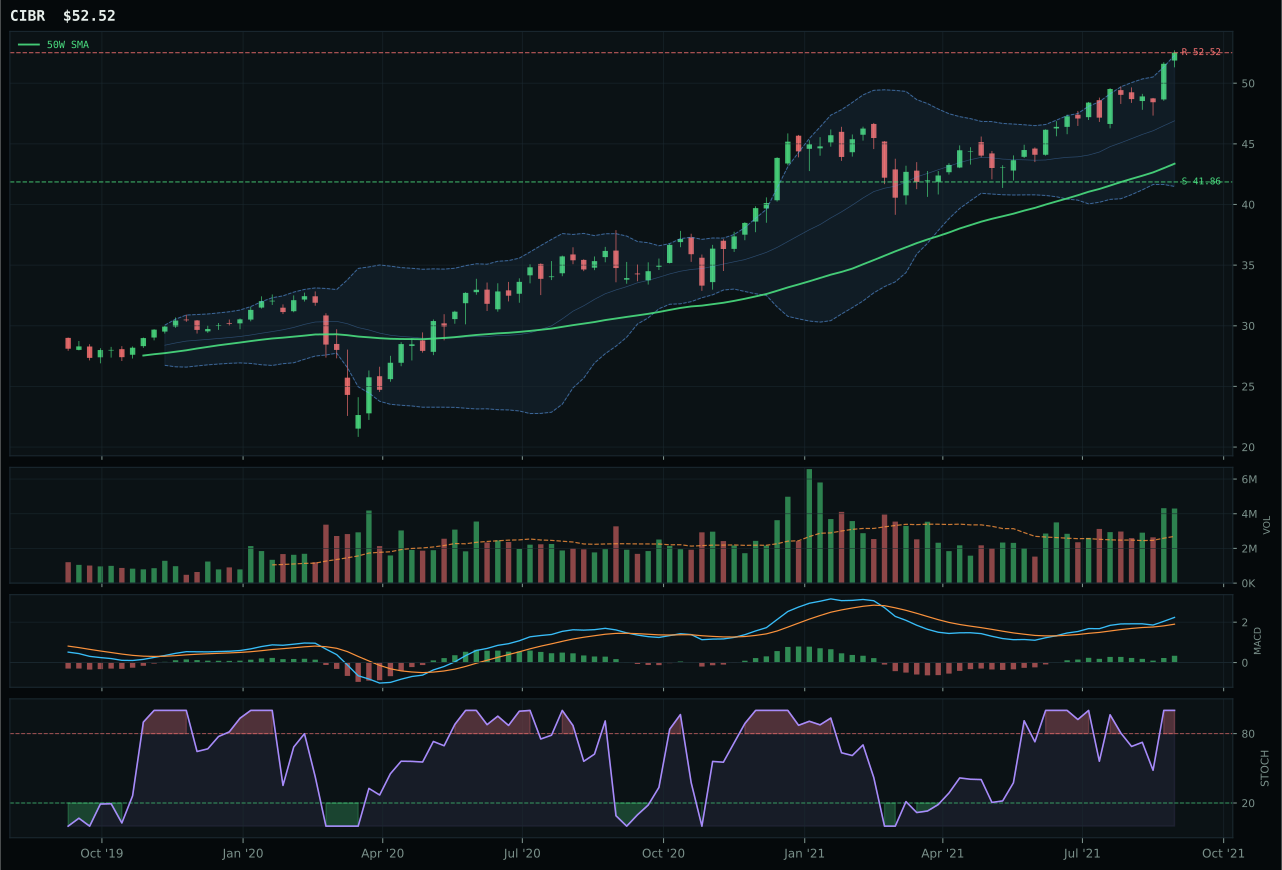
CIBR has a vertical extension profile with 11.9% 13-week relative strength versus SPY.
A failed hold above support would weaken the setup.
Actionable but governed by invalidation levels.
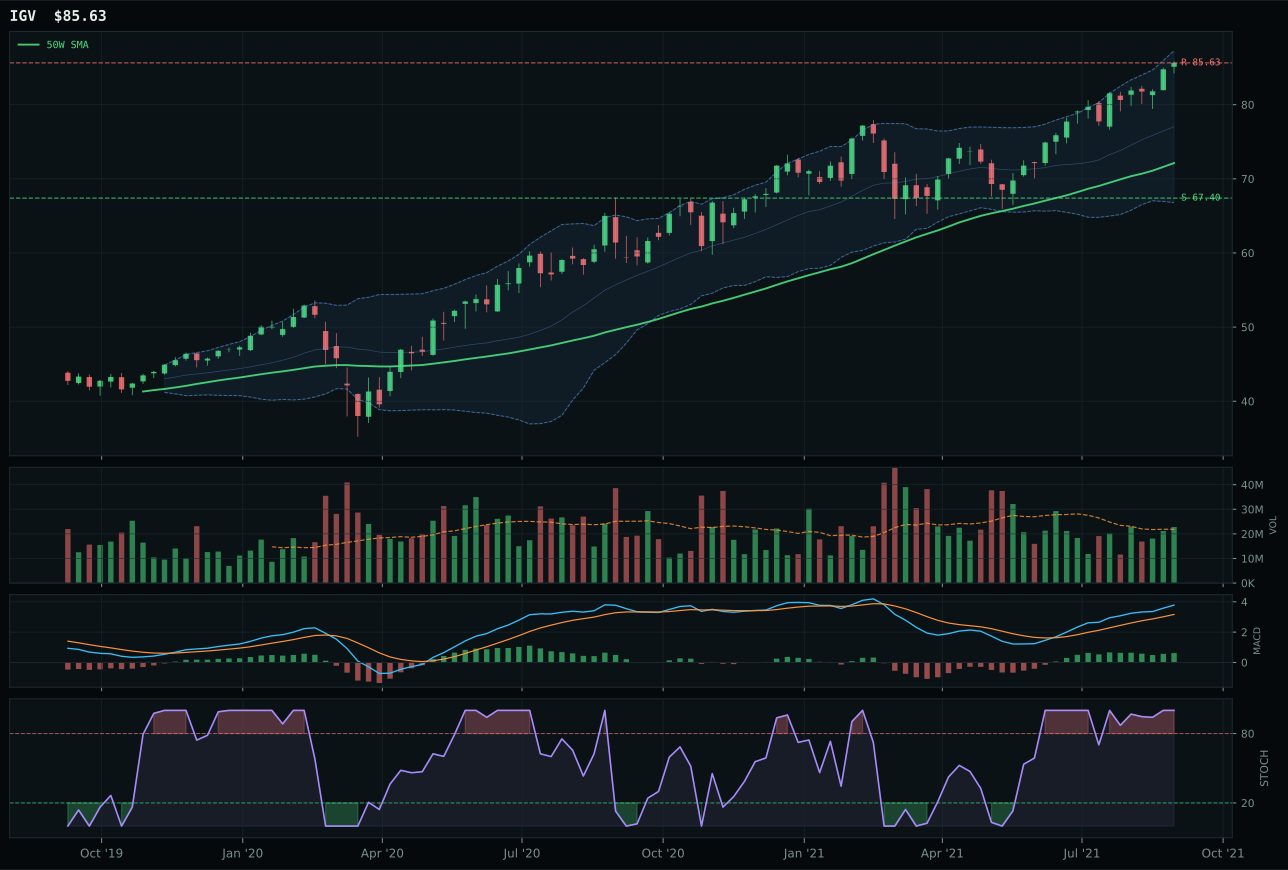
IGV has a vertical extension profile with 11.5% 13-week relative strength versus SPY.
A failed hold above support would weaken the setup.
Actionable but governed by invalidation levels.
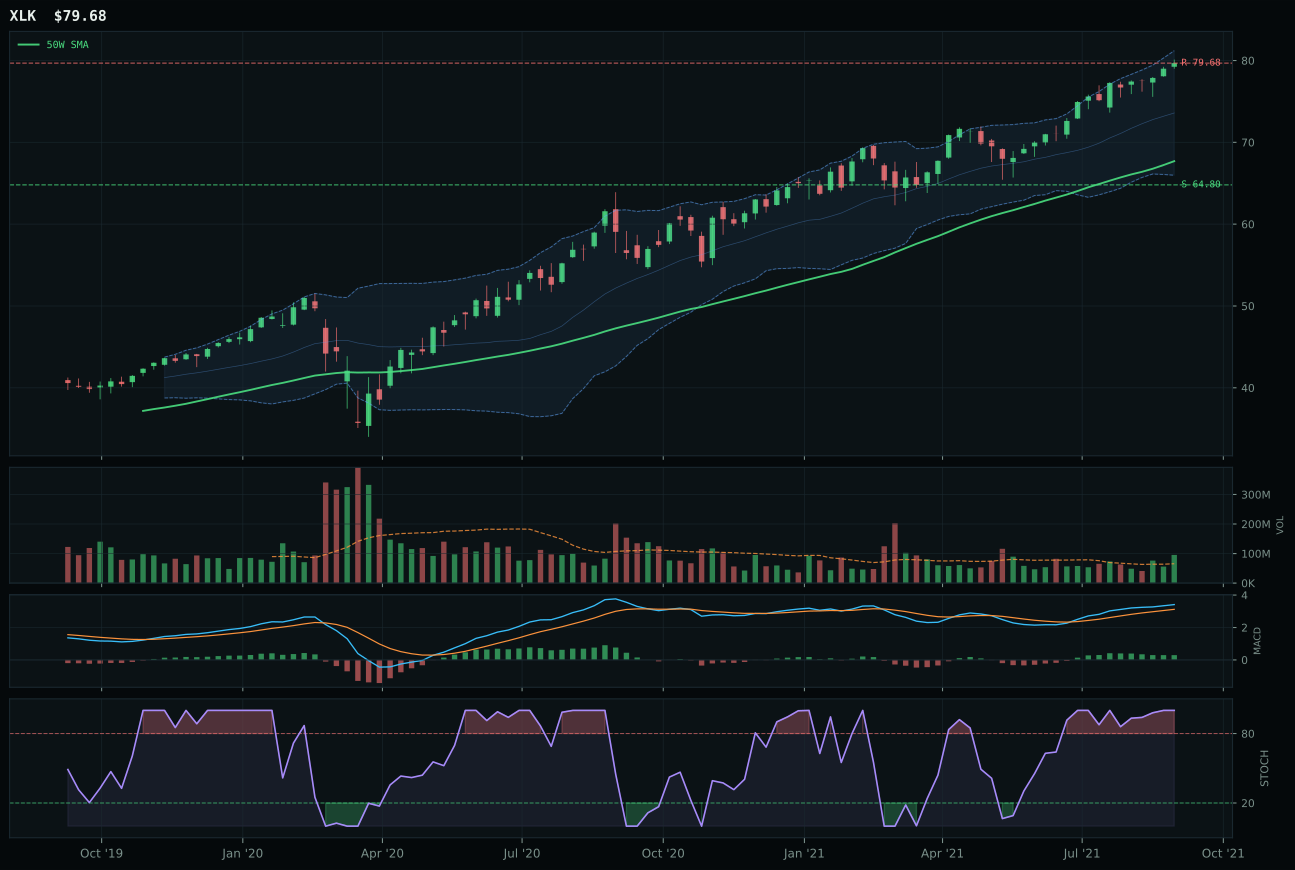
XLK has a vertical extension profile with 6.6% 13-week relative strength versus SPY.
A failed hold above support would weaken the setup.
Actionable but governed by invalidation levels.
CIBR secured the category by delivering the cleanest technical setup among three extended charts, with a 3.0-point margin over IGV. The cybersecurity ETF's MACD is bullish and improving—a critical edge over IGV's flattening momentum—while volume confirmation at 1.59x the 20-week average signals active accumulation rather than passive bounce. Relative strength of 11.9% versus SPY and 0.4% within its own basket demonstrates buyer conviction, though the 21.1% extension above the 50-week moving average means every fresh entry is paying a premium for the trend. Stochastic RSI sits at overbought territory, confirming strong short-term demand, yet the risk-reward calculation shows limited upside to resistance at 52.52 against 25.5% downside to support, a 1:10 asymmetry that penalizes aggressive accumulation.
Technology earns 10% allocation despite its 64.2 category score ranking it outside the top two because the risk-reward asymmetry has already compressed to near-zero upside to resistance. A 21.1% extension above the 50-week mean leaves buyers no margin for error, and the setup's cleanliness score of 58.3 reflects a noisy advance where follow-through volume would be needed to sustain positions. Broad market bear and credit stress conditions active in the macro regime add gravitational drag that macro fit scoring captures at 52.0 points. The 10% slot preserves exposure to cybersecurity's structural tailwinds without overcommitting capital to a trade where the risk-reward profile has deteriorated from compelling to merely respectable; only a pullback toward the 50-week support at 41.86 would justify elevation to top-2 status.
Industrial Metals — COPX
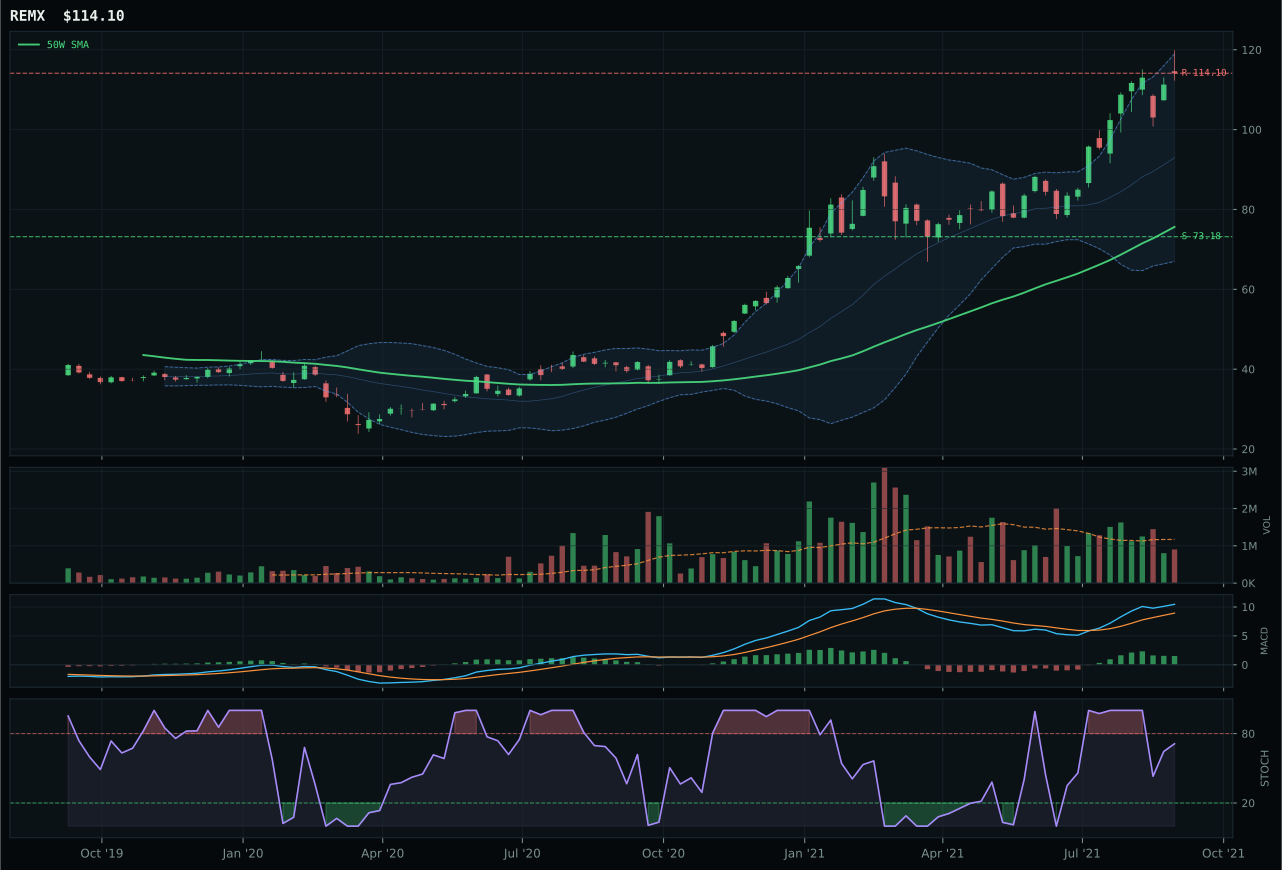
REMX has a vertical extension profile with 22.2% 13-week relative strength versus SPY.
A failed hold above support would weaken the setup.
Actionable but governed by invalidation levels.
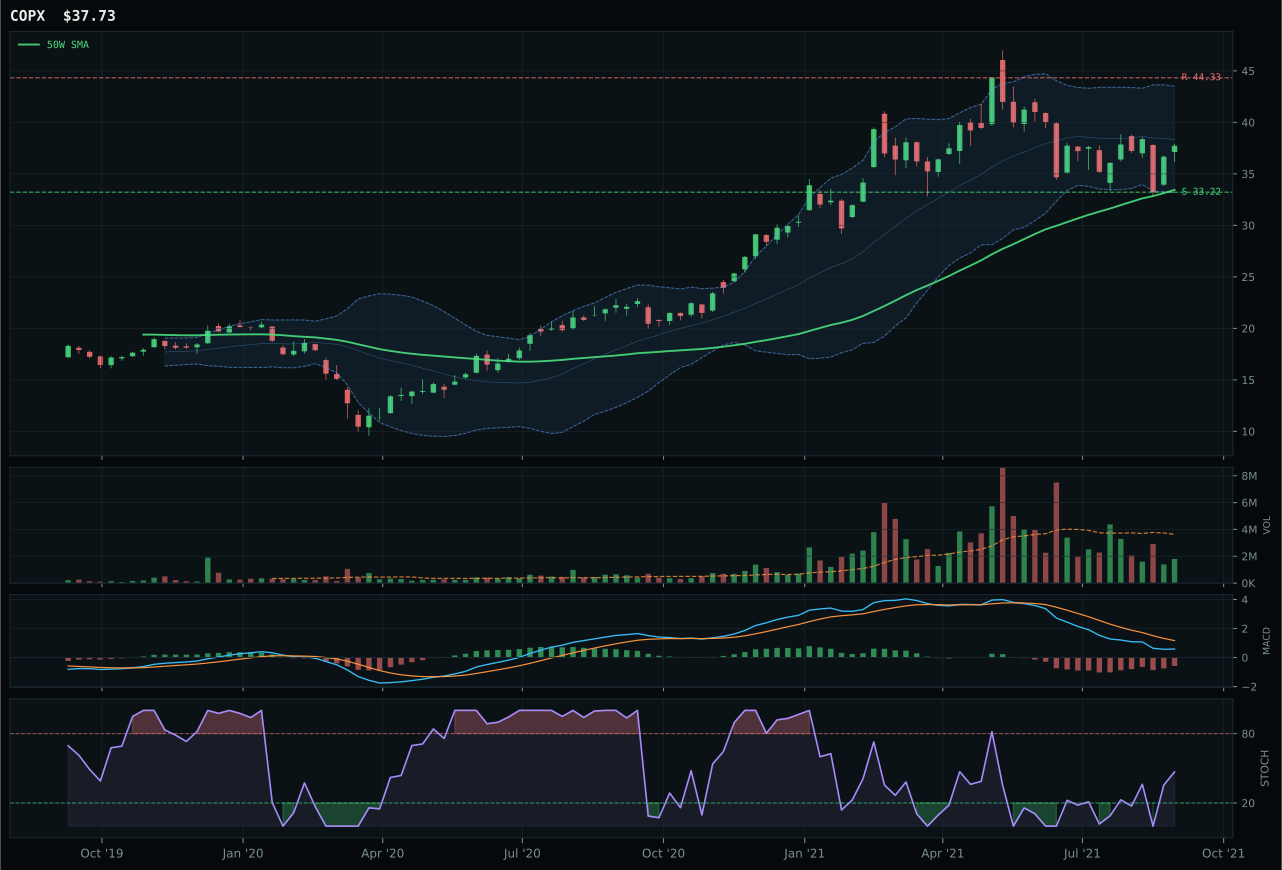
COPX has a neutral structure profile with -15.2% 13-week relative strength versus SPY.
A failed hold above support would weaken the setup.
Actionable but governed by invalidation levels.
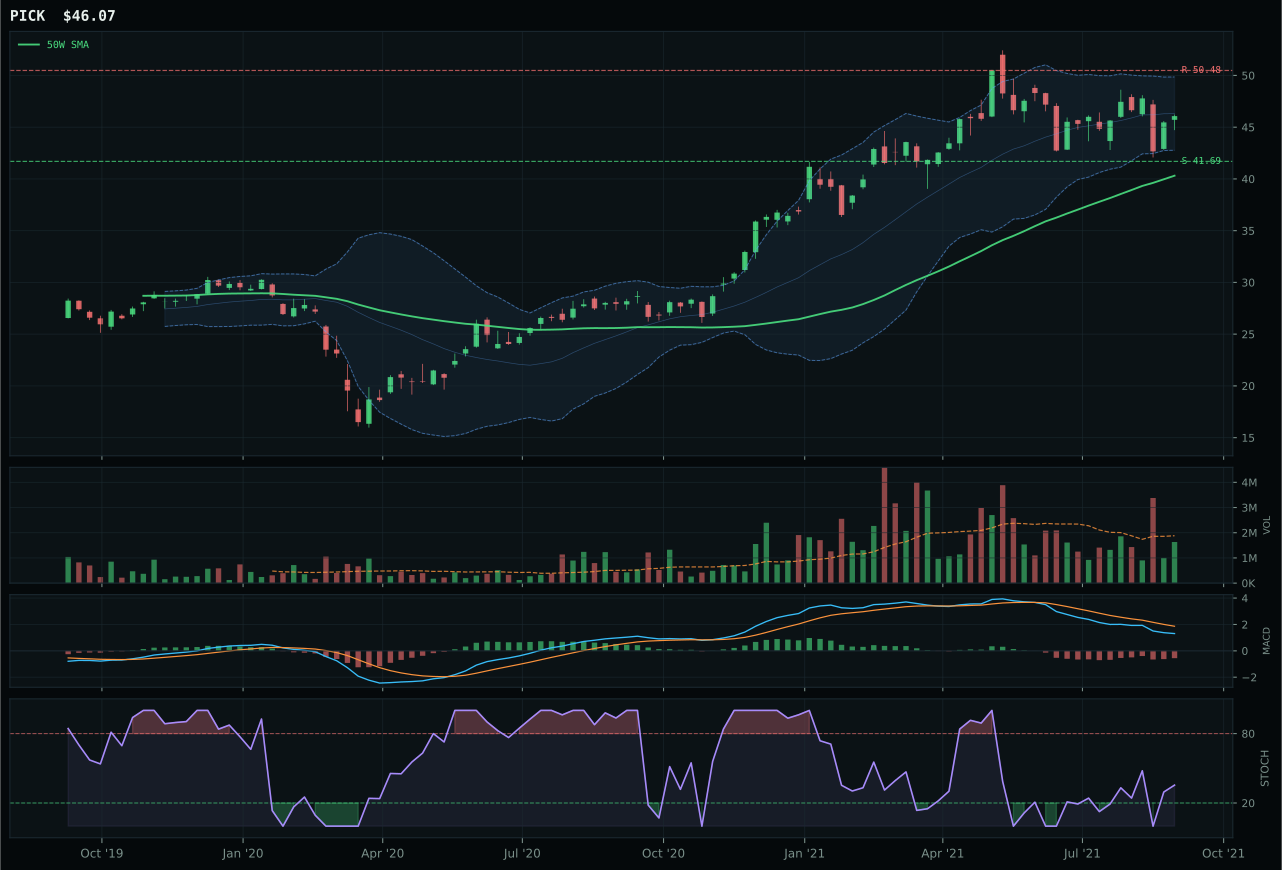
PICK has a neutral structure profile with -11.8% 13-week relative strength versus SPY.
A failed hold above support would weaken the setup.
Actionable but governed by invalidation levels.
COPX barely edged REMX (0.6-point gap) in a close decision where macro fit and timing divergence overcame REMX's superior trend credentials. REMX delivered perfect trend (100.0/100) with 22.2% SPY relative strength and a 29.4% thirteen-week return, but it is already 50.9% extended above the 50-week, making the entry mathematically late—timing scored only 40.0/100 versus COPX's 83.0. COPX shows bearish-but-improving MACD at 12.8% extension with rising-mid-zone stochastic (47), the exact opposite risk profile: no momentum yet, but setup is coiling into decision. REMX's stochastic is falling/neutral, suggesting momentum is rolling over, and its risk-reward degraded to 39.6/100 as upside to resistance sits at -14.9%. Category-relative strength favors REMX (+34.1%), but that strength is extended and at risk of reversal, while COPX's negative relative strength (-3.4%) leaves room for catch-up if sector breadth improves.
Industrial metals earns 5% allocation because the 56.6 category score benefits from robust macro support (metals scarcity +14, commodity breadth positive +10, Goldilocks +6) that partially masks deteriorating technical conditions. Copper's -8.0% 13-week return and -15.2% relative strength versus SPY confirm the cyclical exposure has lagged badly despite category-level macro fit of 72.0 out of 100, the highest among all allocation-tier categories. Volume confirmation of 40.5/100 and momentum confirmation of 11.3/100 reveal this is a macro-driven thesis rather than a technically-confirmed trend; real asset sponsorship and metals scarcity must remain active for positioning to work. Risk-reward at 64.7/100 with 13.6% downside to support and -14.9% upside to resistance creates a defensive payoff suitable for hedging rather than outright leverage. The 5% slot captures the inflation-hedge and supply-constraint narrative while acknowledging that technical sponsorship remains fragile; only accumulation volume breaking above resistance at 44.33 would justify doubling down on the trade.
Nuclear Energy — URNM
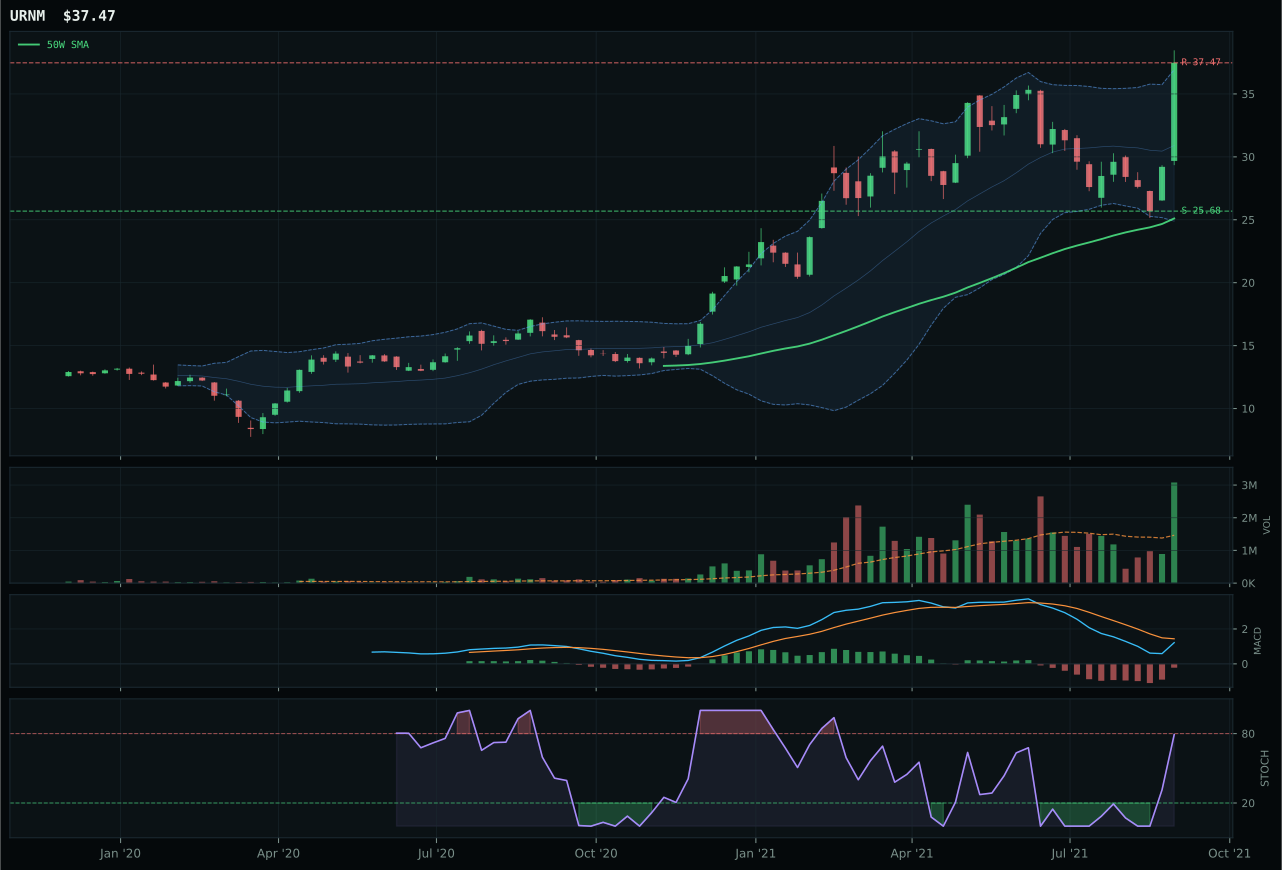
URNM has a vertical extension profile with 0.1% 13-week relative strength versus SPY.
A failed hold above support would weaken the setup.
Actionable but governed by invalidation levels.
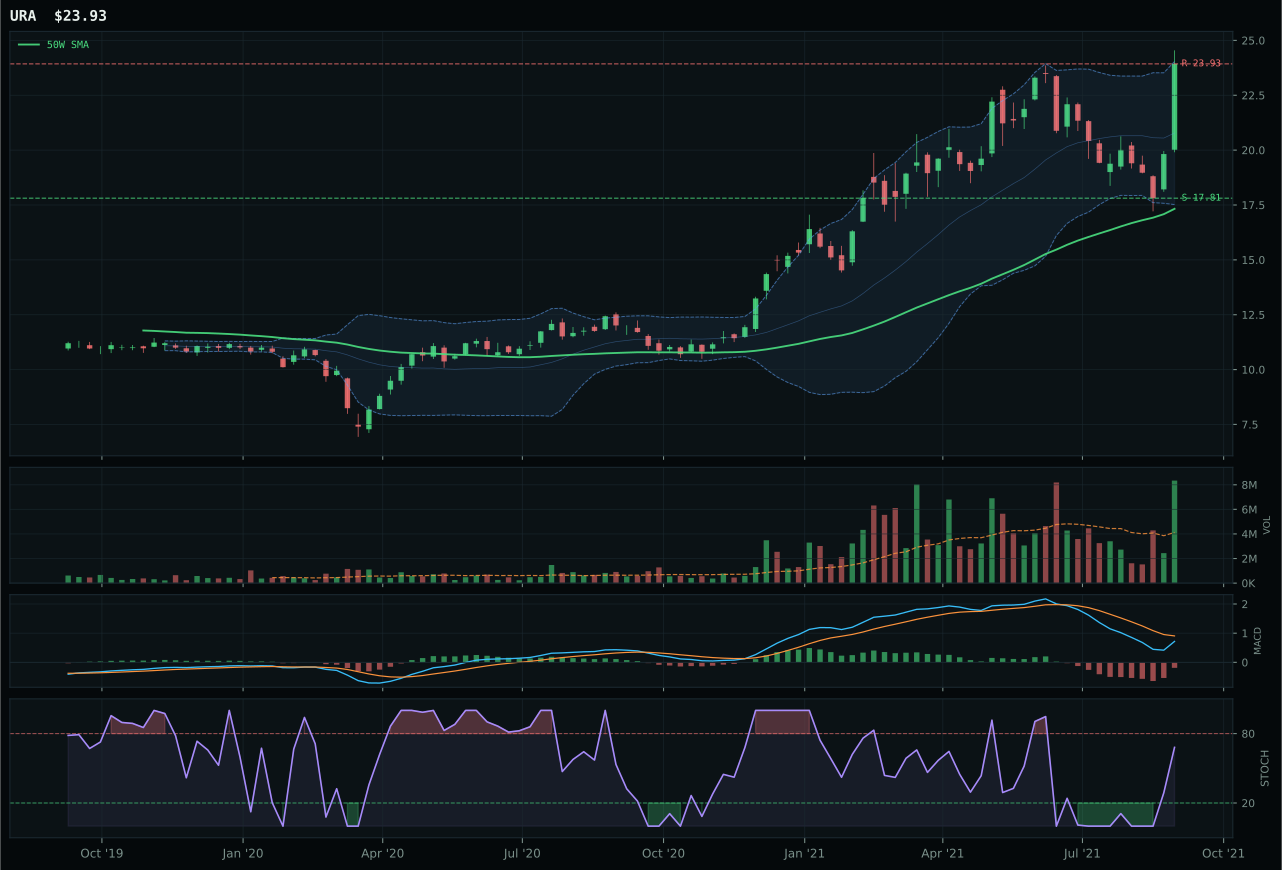
URA has a vertical extension profile with -4.5% 13-week relative strength versus SPY.
A failed hold above support would weaken the setup.
Actionable but governed by invalidation levels.
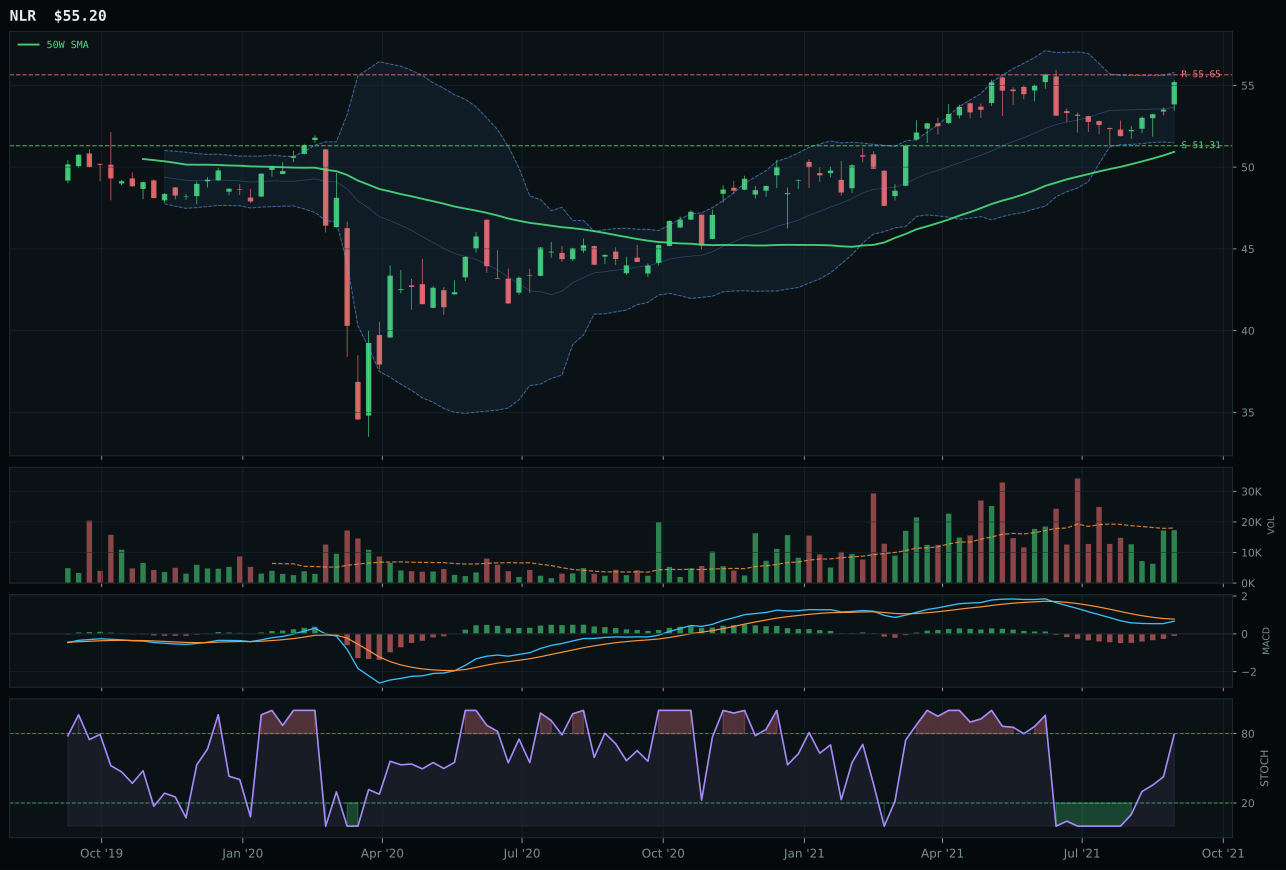
NLR has a neutral structure profile with -6.8% 13-week relative strength versus SPY.
A failed hold above support would weaken the setup.
Tracked, but not top-2 eligible because: .
URNM won the category despite URA's superior trend score (63.2 versus URA's 86.0-reading price positioning) because URNM's momentum confirmation reached 100.0/100—driven by a 31.9% four-week return, 7.3% thirteen-week return, and volume confirmation at 2.10x the 20-week average. URA showed identical MACD (bearish-but-improving) and stochastic (rising mid-zone), but its thirteen-week return of only 2.7% and neutral volume confirmed that URA is accepting the setup without aggressive accumulation. Category-relative strength of 4.6% for URNM versus 0.0% for URA proved decisive; uranium miners are choosing URNM's higher beta for the sector recovery. Both charts are 49% extended, a late-stage entry point, but URNM's vertical-extension setup with active volume participation signals final-phase accumulation by large institutions betting on nuclear supply-chain scarcity. Price sits near the 52-week high at 37.47 resistance with only 0.0% upside but 45.9% downside to support—risk asymmetry is sharply negative, yet momentum is still accelerating.
Nuclear energy earns 5% allocation despite the 54.0 score sitting comfortably outside top-two range because uranium scarcity and real asset sponsorship (+7 combined macro boost) create structural conviction that technical extension cannot entirely dismiss. The 31.9% four-week return and 7.3% 13-week gain confirm URNM has run hard, yet momentum confirmation of 100.0/100 validates that the acceleration is recent and potentially still in early innings of a new up-cycle. Risk-reward of 45.1/100 is compressed with minimal upside to 37.47 resistance but 45.9% downside to 25.68 support—an inverted profile that normally disqualifies, yet the support level sits above the 200-week moving average, creating a backstop if macro conditions hold. Volume at 2.10x the 20-week average is institutional-grade, the highest in the weekly portfolio, signaling that real-money capital believes in scarcity thesis. The 5% slot preserves exposure to energy-transition and nuclear-supply themes while acknowledging that entry risk is genuine; only a pullback toward the 50-week average at 24.90 would present a cleaner entry point.
Agriculture & Livestock — MOO
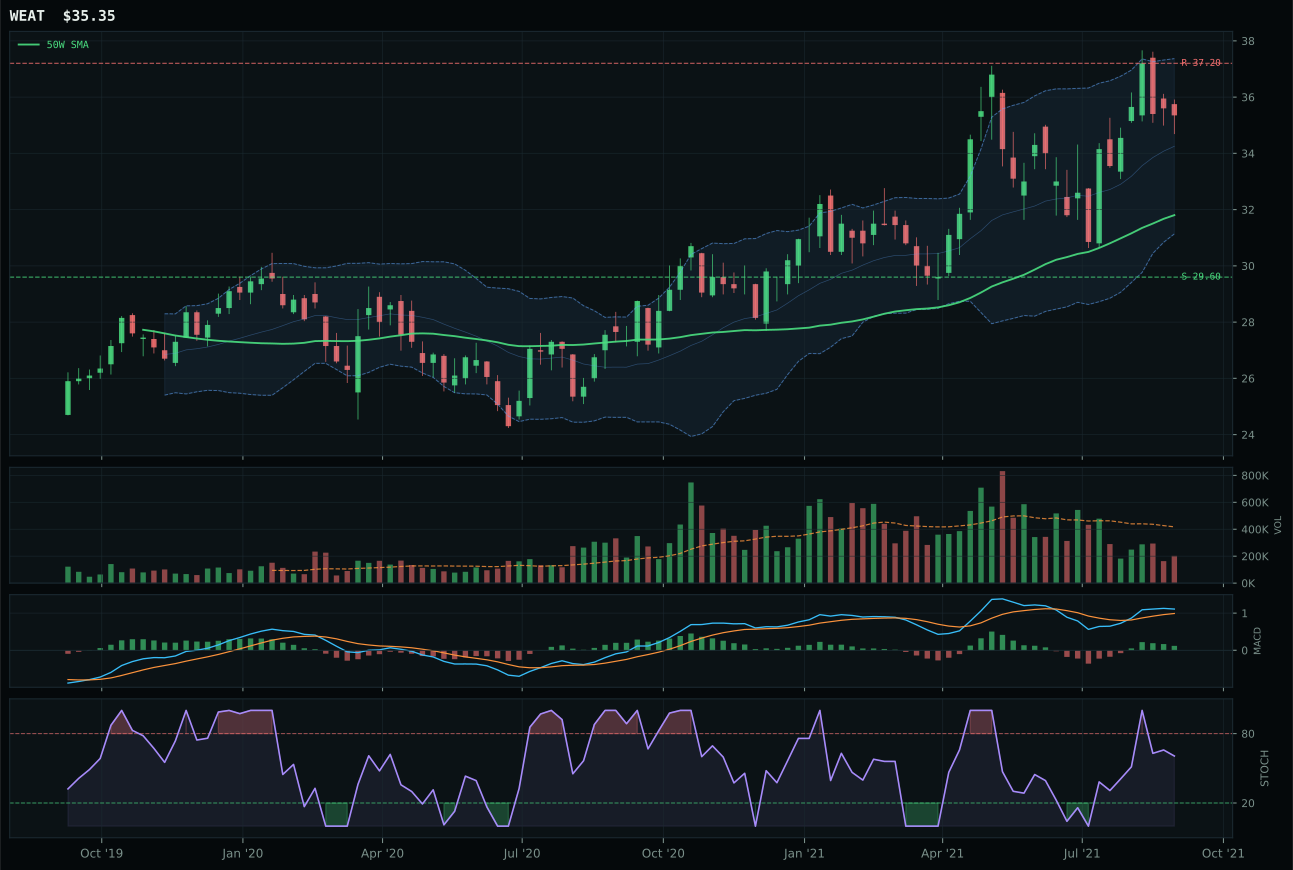
WEAT has a neutral structure profile with -4.2% 13-week relative strength versus SPY.
A failed hold above support would weaken the setup.
Actionable but governed by invalidation levels.
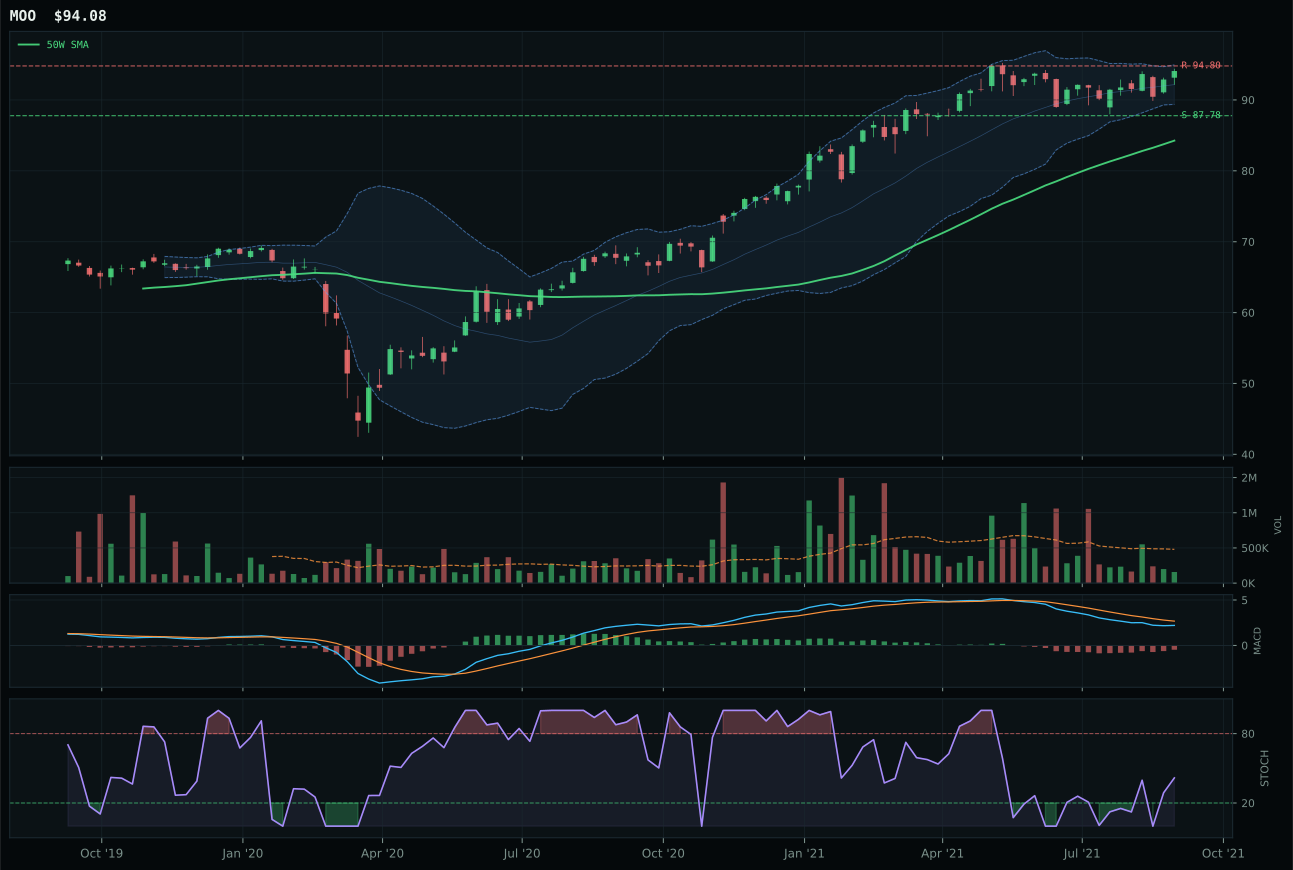
MOO has a neutral structure profile with -6.8% 13-week relative strength versus SPY.
A failed hold above support would weaken the setup.
Actionable but governed by invalidation levels.
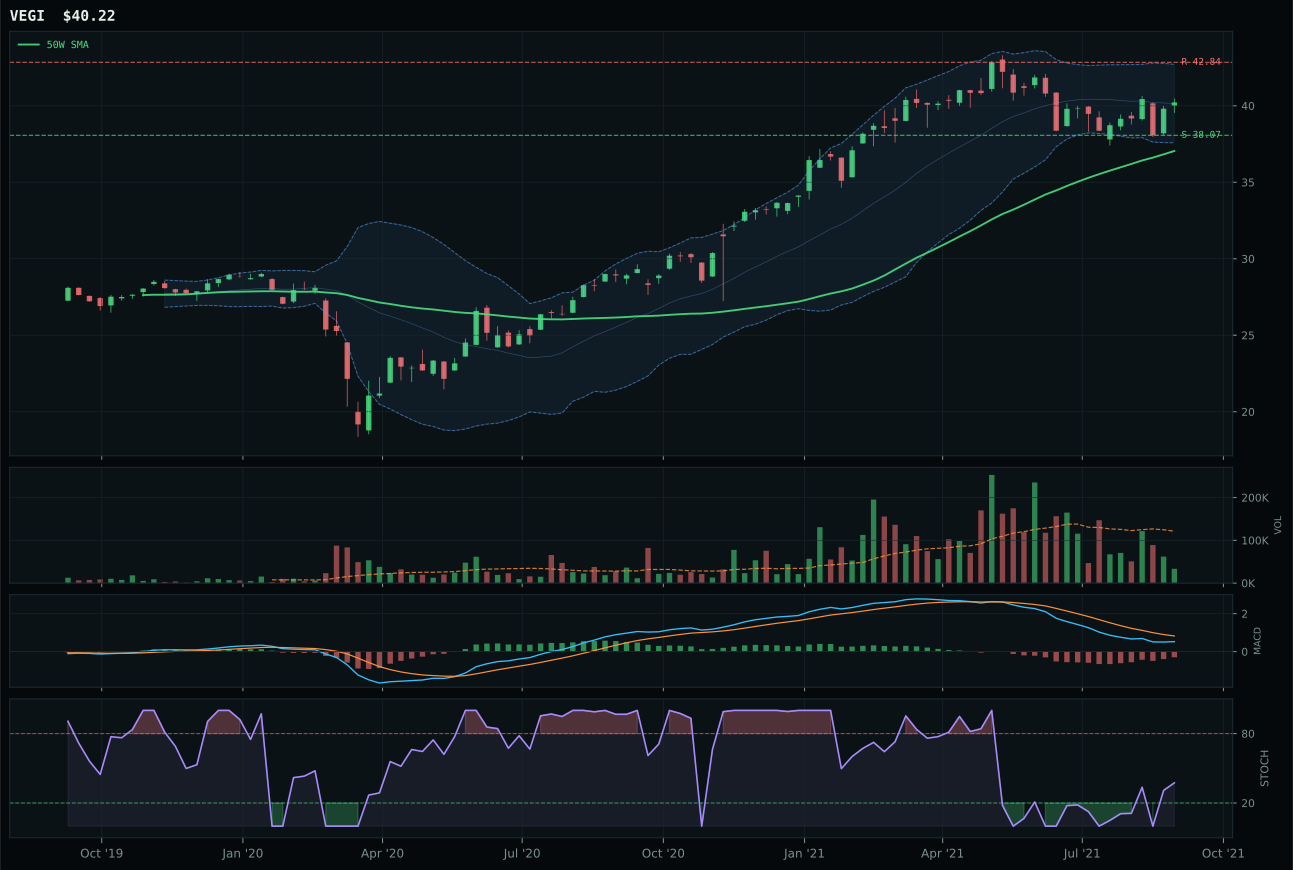
VEGI has a neutral structure profile with -11.1% 13-week relative strength versus SPY.
A failed hold above support would weaken the setup.
Tracked, but not top-2 eligible because: .
MOO edged out WEAT by 6.2 points despite inferior technical evidence (61.1 versus WEAT's 72.2), the win coming from MOO's superior stochastic RSI timing of rising mid-zone at 0.42 versus WEAT's falling/neutral setup. Both show neutral structure and thin volume participation (0.33x for MOO, thin for WEAT), and both face the same macro tension: real asset sponsorship adds 5 points but disinflation pressure subtracts 5, leaving them macro-neutral. MOO's thirteen-week return of 0.4% versus WEAT's 3.1% shows WEAT has momentum superiority, but the category-relative strength tie at zero margin and identical neutral structure means the momentum difference carries less weight than the stochastic RSI directional bias. The compression score favors MOO at 86.8 versus WEAT's compressed reading, suggesting potential for expansion if buyers defend the current level near 50-week moving average.
Agriculture earns 5% allocation because the 41.9 category score, while respectable, lacks the momentum and macro sponsorship evident in top-tier categories. Real asset sponsorship is active (+8) and commodity breadth is positive (+5), yet disinflation pressure counteracts those signals at -8, yielding a category-level macro fit of 55.0 that trails top-2 categories materially. Risk-reward collapses to 38.9/100, with nearly flat upside to 94.80 resistance (-0.8%) and only 7.2% downside to support; the setup offers defined risk but minimal reward. Volume-price confirmation of 52.7/100 reflects thin participation across the theme, and the 0.4% 13-week return confirms agribusiness has not participated in the rally. The 5% slot preserves real-asset diversification and captures any upside if commodity momentum accelerates, but without stronger volume accumulation or a break higher on conviction, this remains a residual position rather than a compelling alpha generator.
Precious Metals — GLD
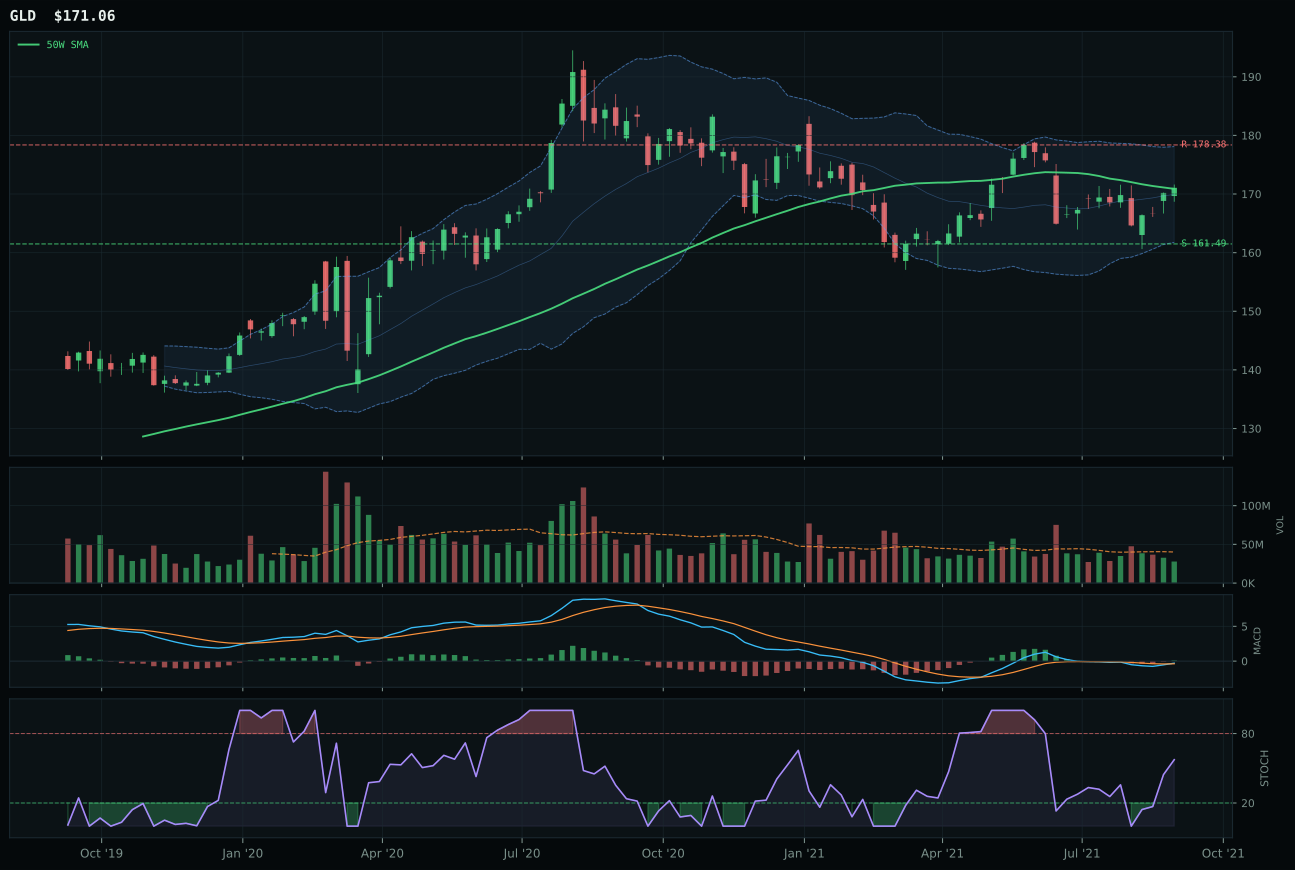
GLD has a compression near 50W profile with -10.7% 13-week relative strength versus SPY.
A failed hold above support would weaken the setup.
Actionable but governed by invalidation levels.
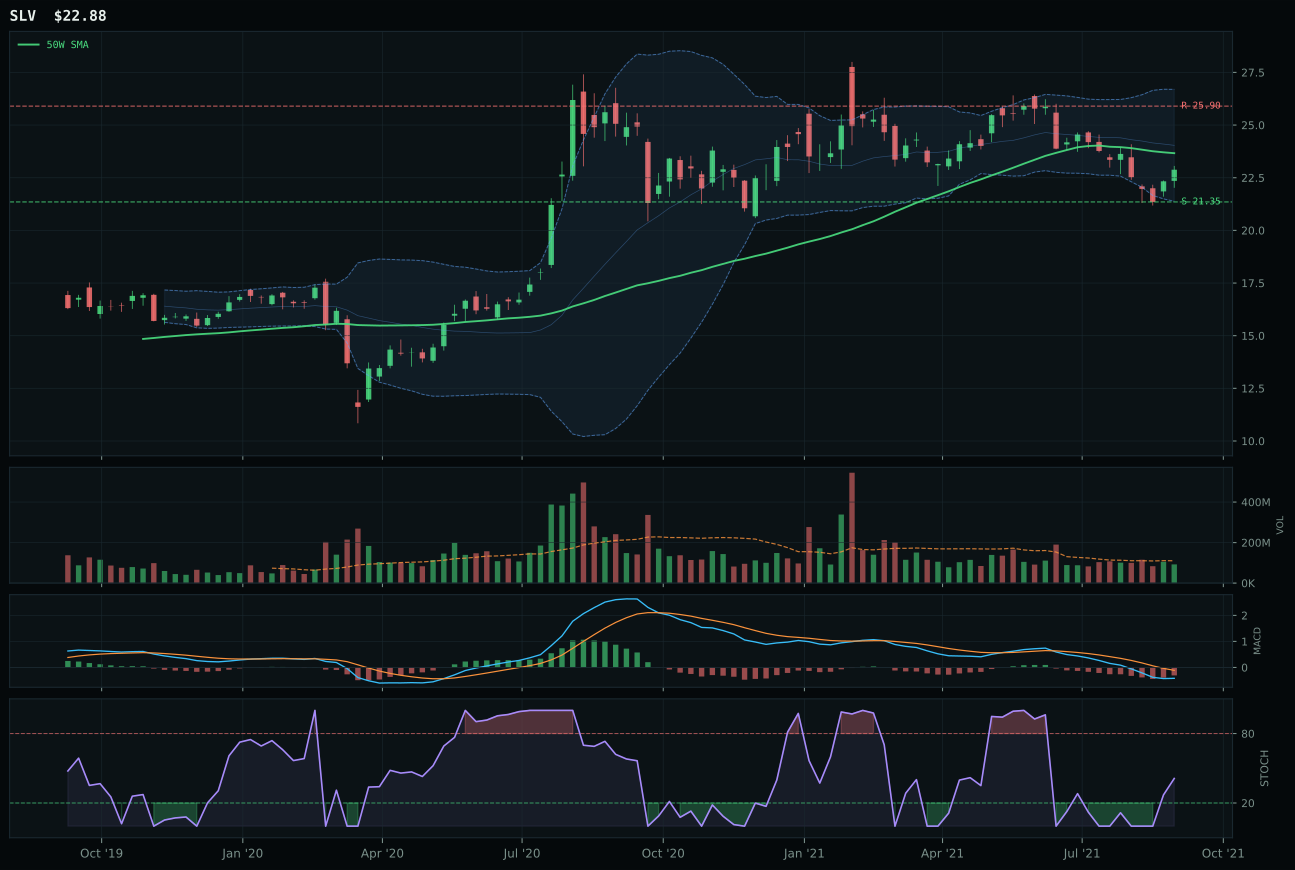
SLV has a neutral structure profile with -18.5% 13-week relative strength versus SPY.
A failed hold above support would weaken the setup.
Actionable but governed by invalidation levels.
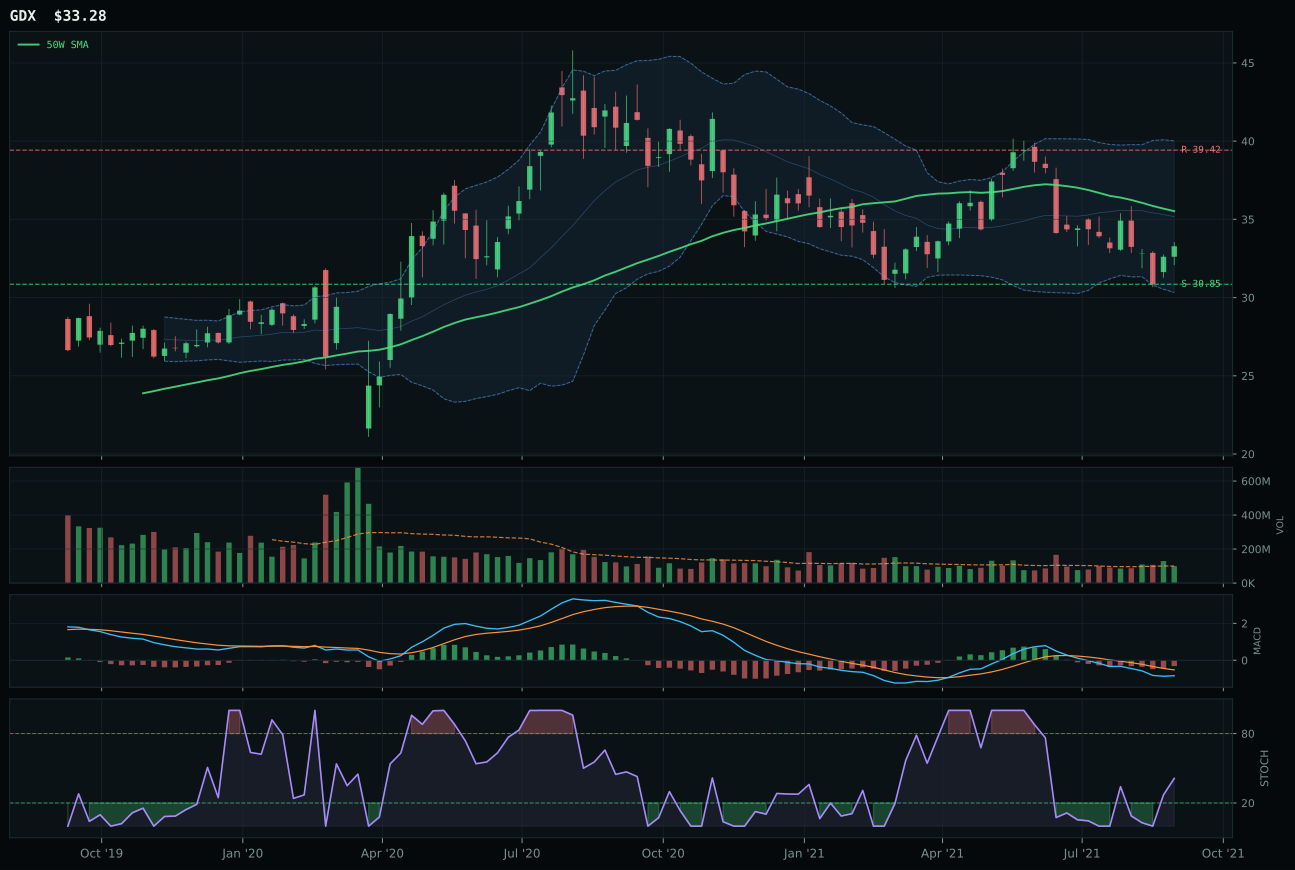
GDX has a neutral structure profile with -21.2% 13-week relative strength versus SPY.
A failed hold above support would weaken the setup.
Actionable but governed by invalidation levels.
GLD won the category with an 18.1-point advantage over SLV because it offered clean timing (100.0/100, price at the 50-week moving average decision point) while SLV sits far below its averages in a deep retracement. GLD's MACD is bullish and improving versus SLV's bearish-but-improving profile, and the category-relative strength of 7.8% for GLD versus 0.0% for SLV signals gold is attracting selective capital while silver languishes. Structure compression of 88.0 near the 50-week gives GLD expansion potential if buyers defend the level; SLV's 68.4 structure score reflects less clean setup geometry. Both show negative SPY relative strength (-10.7% and -18.5%, respectively), confirming that precious metals are defensive plays in this regime. GLD's risk-reward of 65.5/100 offers balanced asymmetry with 5.9% downside to support and -4.1% upside to resistance, a 1:1.5 ratio suitable for a retracement bounce candidate rather than a continuation trade.
Precious metals earns 5% allocation despite GLD's category victory because the 38.6 score places it well outside top-two range, reflecting mixed macro support and deteriorating absolute returns. Gold's -3.4% 13-week performance and -10.7% relative strength versus SPY confirm the metal has underperformed despite its -0.1% 50-week slope being nearly flat and supportive; this disconnect signals the trade is technically ripe but narratively struggling. Dollar pressure is active (+2) and disinflation pressure is active (+8), which does support monetary hedge demand, yet credit stress remains absent from the tailwinds. The 65.5 risk-reward score is respectable but not exceptional, with -4.1% upside to resistance and 5.9% downside to support—a payoff structure that justifies position-holding over position-building. At 5%, this allocation locks in downside definition via compression-near-50W support while preserving exposure to any pivot in broader macro conditions; elevation would require either a fresh low on accumulation volume or explicit credit stress conditions activating.
AI — BOTZ
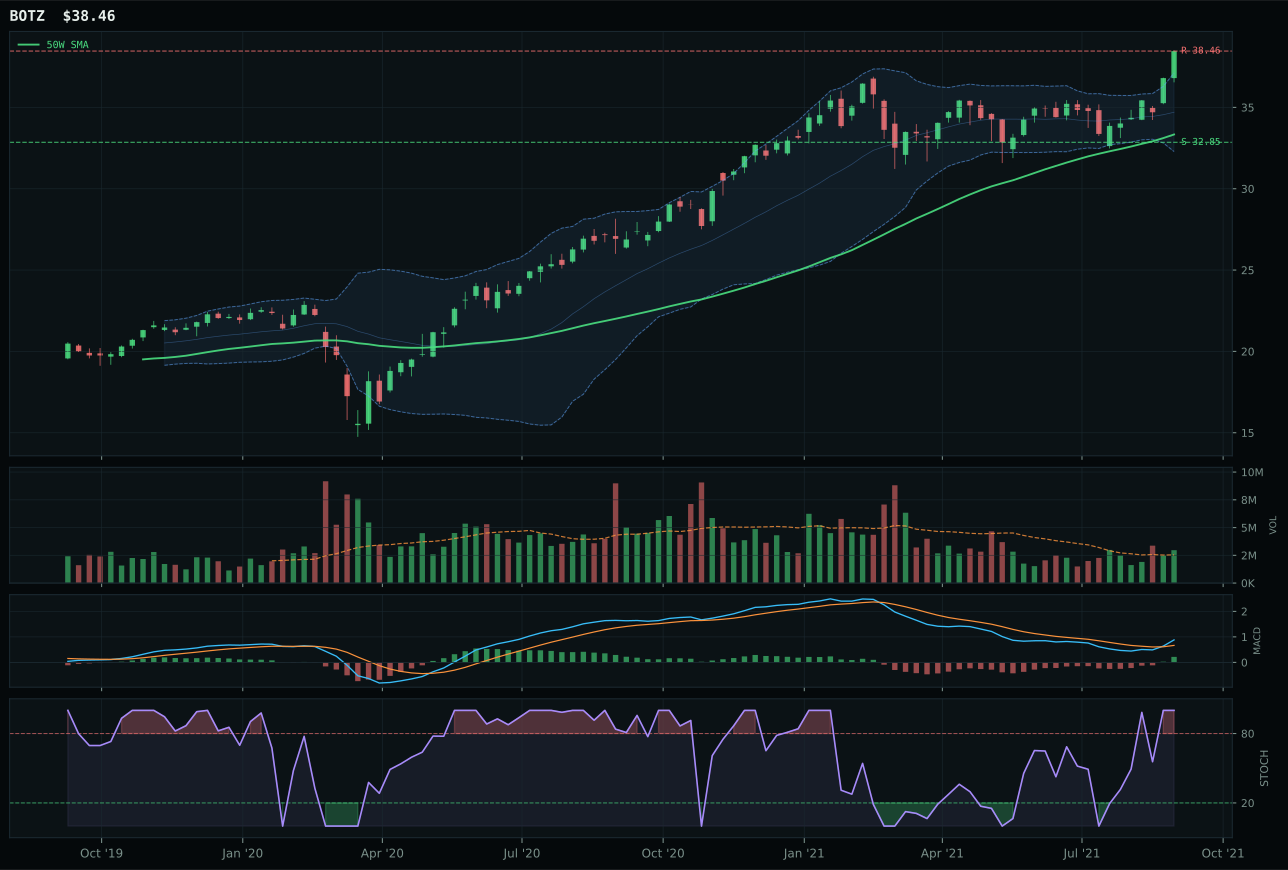
BOTZ has a vertical extension profile with 2.9% 13-week relative strength versus SPY.
A failed hold above support would weaken the setup.
Actionable but governed by invalidation levels.
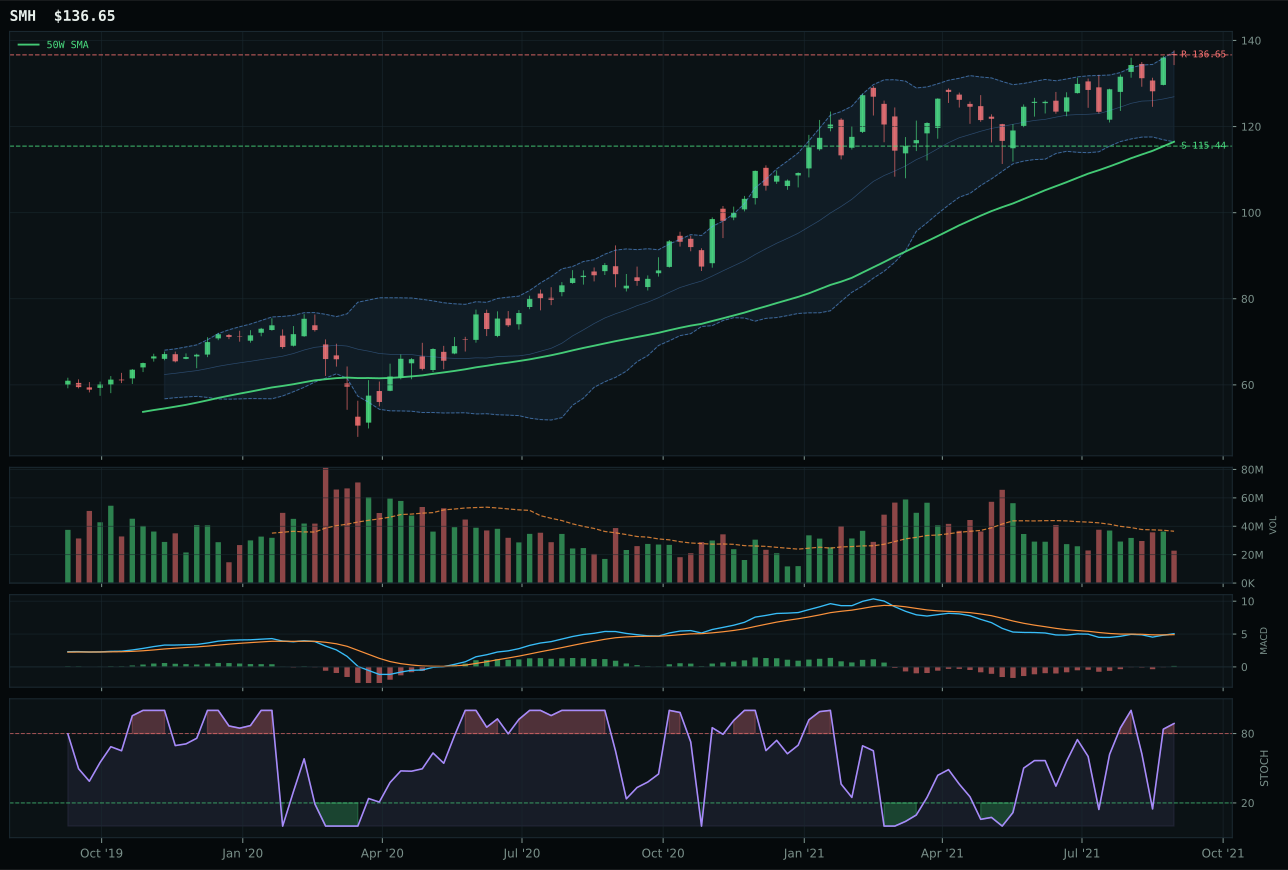
SMH has a vertical extension profile with 1.5% 13-week relative strength versus SPY.
A failed hold above support would weaken the setup.
Actionable but governed by invalidation levels.
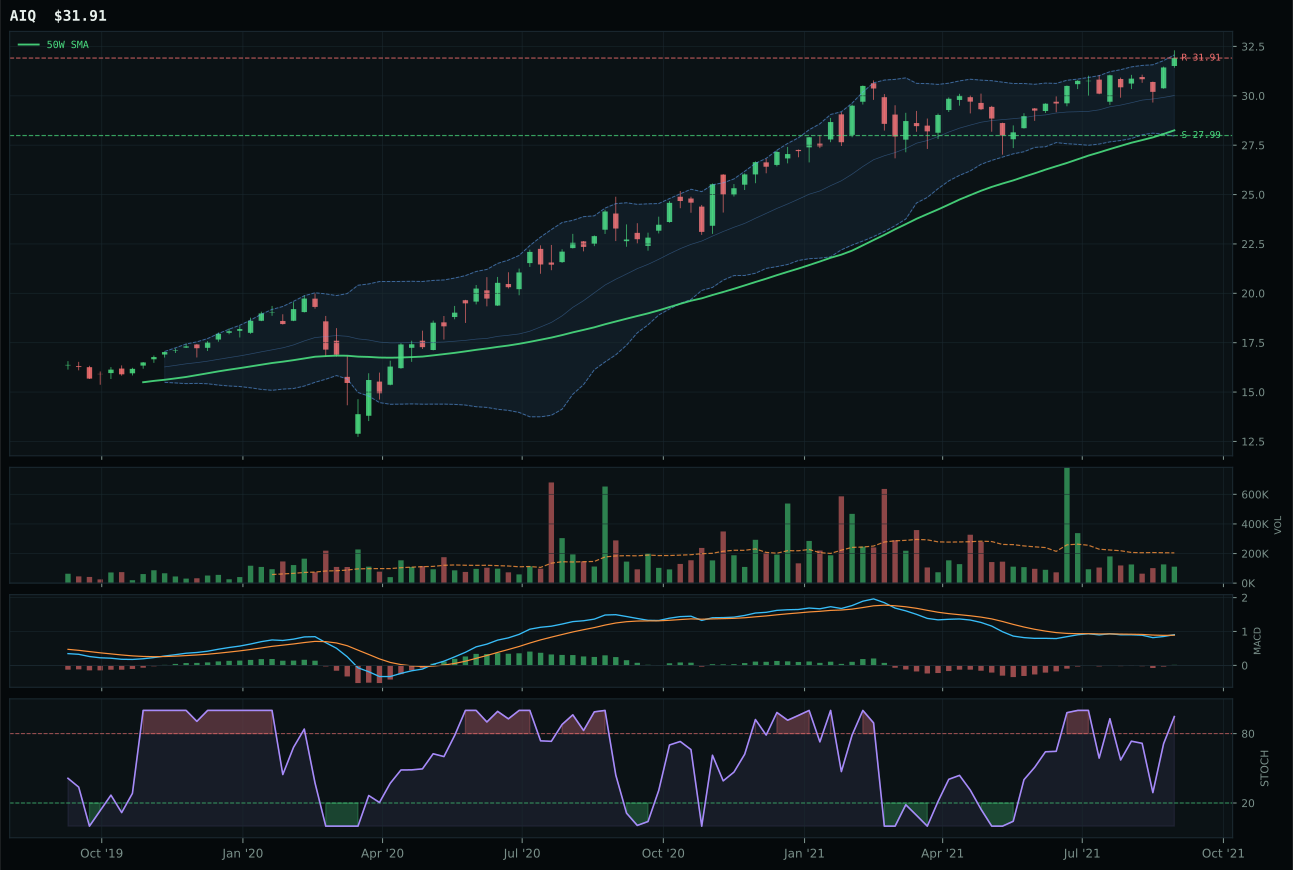
AIQ has a neutral structure profile with 1.9% 13-week relative strength versus SPY.
A failed hold above support would weaken the setup.
Tracked, but not top-2 eligible because: .
BOTZ beat SMH by a 6.3-point spread despite both charts showing vertical extension and overbought readings, but the robotics ETF's volume confirmation at 1.17x the 20-week average versus SMH's thin participation proved decisive. BOTZ's category-relative strength of 1.0% versus SMH's -0.4% reflects tighter peer leadership, and the 77.6 structure score edges SMH's 72.0 on cleanliness and compression balance. Both face identical macro headwinds (credit stress active at -6 points) and both are 15-17% extended from the 50-week, placing them in late-stage momentum territory where risk-reward is compressed to 45.4/100. The 10.1% thirteen-week return underperforms the broader technology basket, and the 2.9% SPY relative strength suggests AI is not pulling hard enough to justify aggressive overweight positioning.
AI ranks 5% allocation despite BOTZ's clean win because the 37.8 category score sits materially below the top-two threshold, dragged down by credit stress and broad market bear conditions weighing -8 points each against the category-level macro fit of 40.0. The setup's timing score of 37.0 penalizes the extended price structure aggressively; every new buyer at 15.4% above the 50-week is purchasing into diminishing opportunity set. Volume-price confirmation registers 73.0/100 rather than the accumulation-grade scores seen in top-2 categories, signaling participation that is above-average but not institutional-strength. The 5% position maintains exposure to robotics and AI compute themes while acknowledging that risk-reward has shifted unfavorably; elevation to 10% would require either a pullback to cleaner entry levels or macro conditions that swing credit stress and broad-market bearishness in the opposite direction.
Defense & Aerospace — ITA
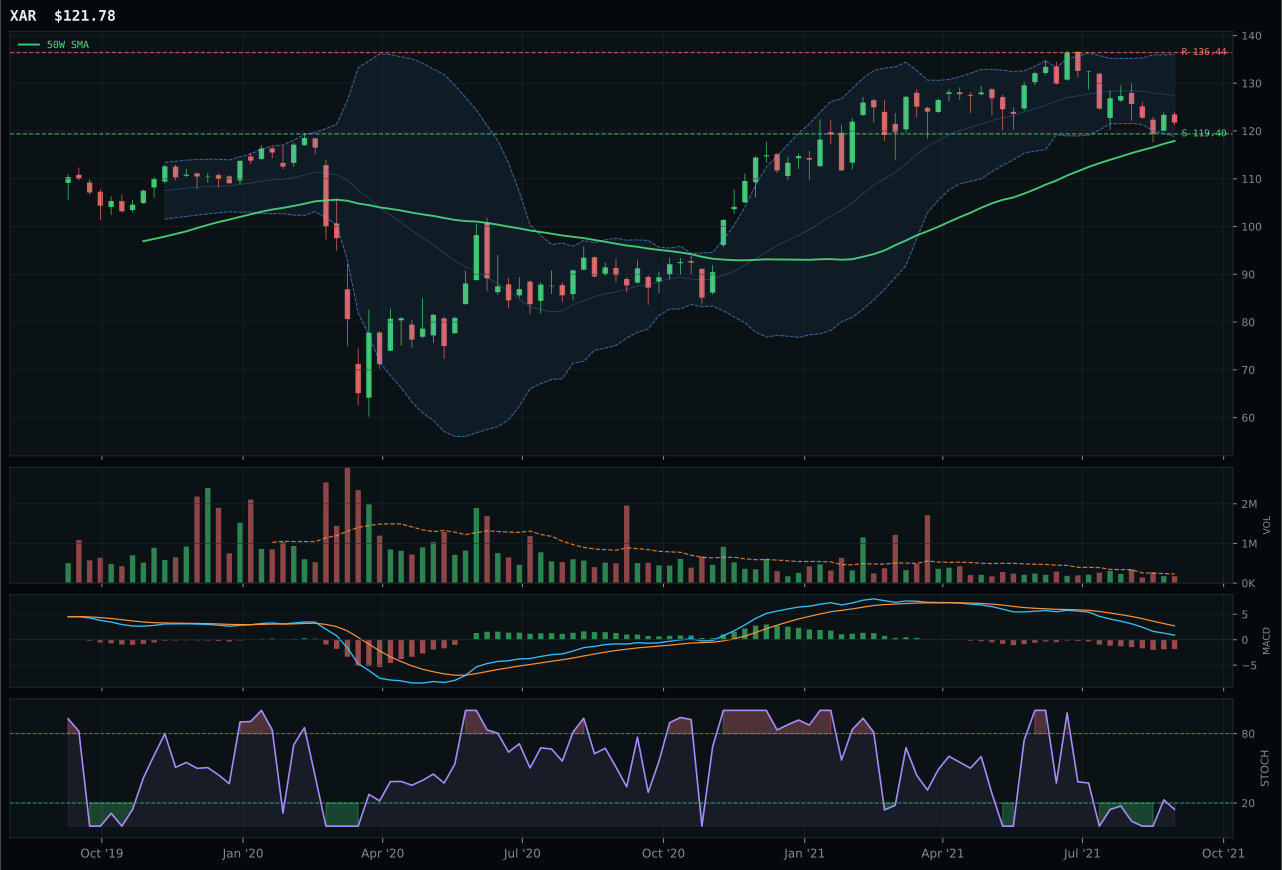
XAR has a pullback into support profile with -15.0% 13-week relative strength versus SPY.
A failed hold above support would weaken the setup.
Actionable but governed by invalidation levels.
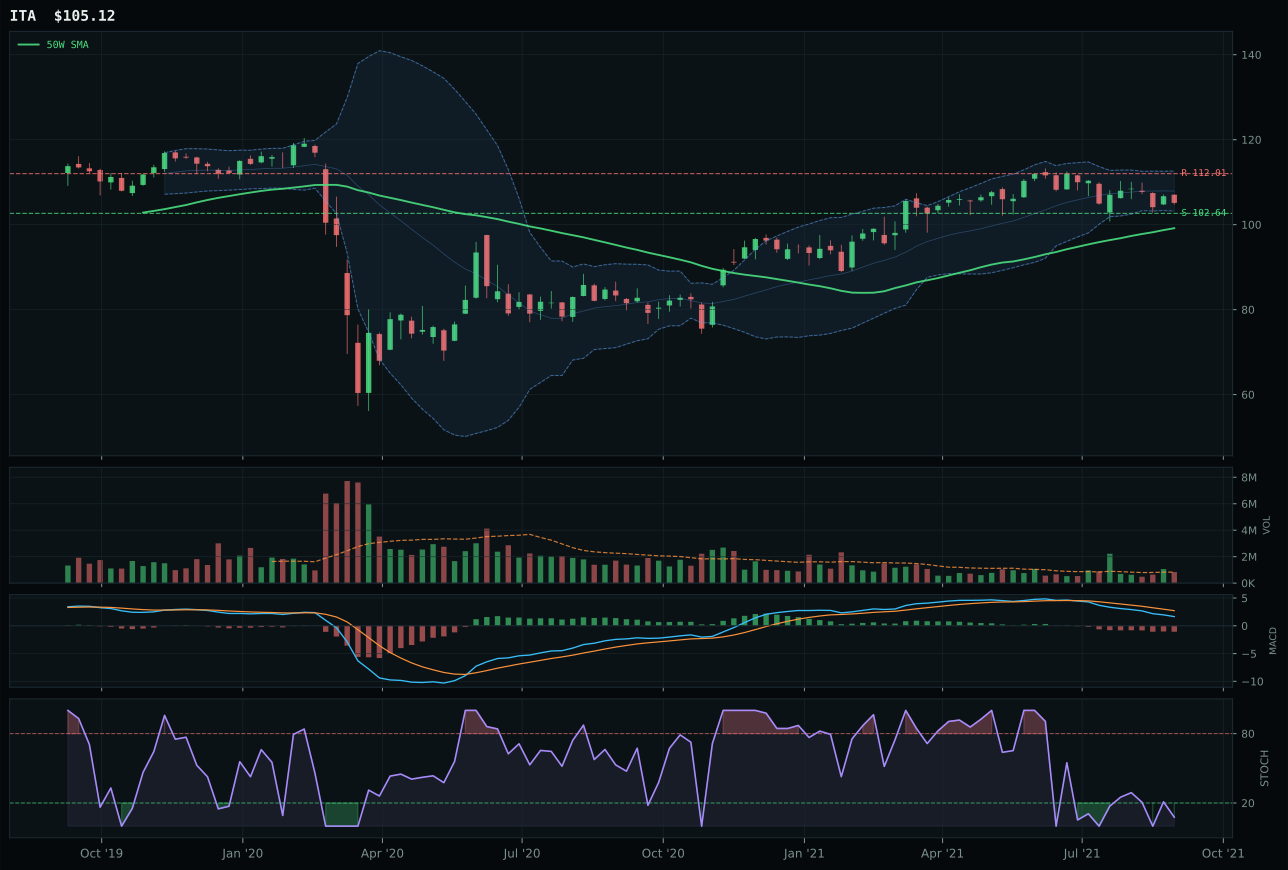
ITA has a pullback into support profile with -13.3% 13-week relative strength versus SPY.
A failed hold above support would weaken the setup.
Actionable but governed by invalidation levels.
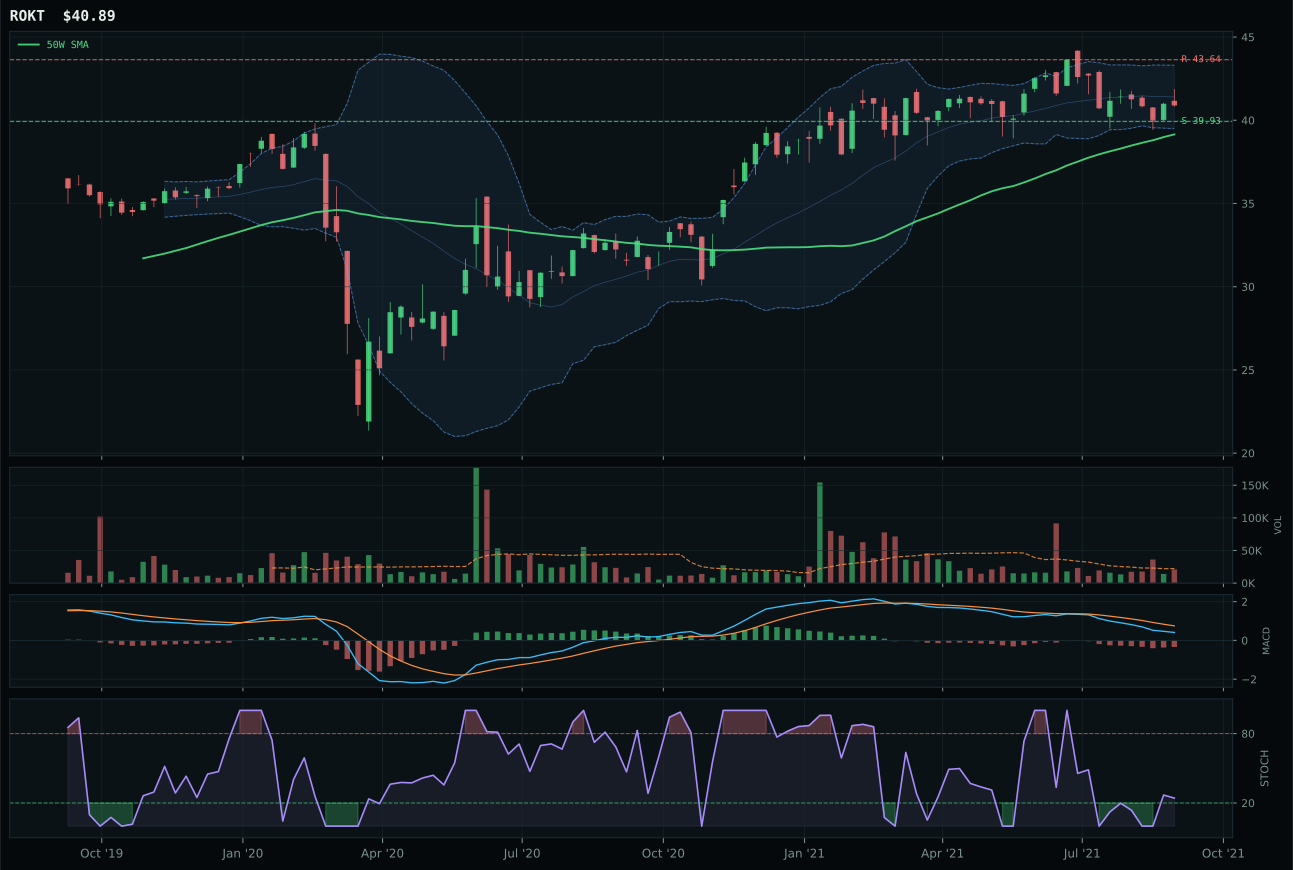
ROKT has a pullback into support profile with -11.1% 13-week relative strength versus SPY.
A failed hold above support would weaken the setup.
Tracked, but not top-2 eligible because: .
ITA won the category by the narrowest margin—a negative 3-point gap versus XAR—because both are pullback-into-support structures with identical terrible momentum (-6.1% thirteen-week return) but ITA showed marginally superior structure (72.0 versus XAR's 66.6) and neutral-versus-negative category relative strength (0.0% versus -1.8%). This is selection by elimination: neither candidate exhibits sponsorship. ITA's risk-reward score of 90.0/100 reflects the tight stop near 102.64 support with only 2.4% downside, making it a defined-risk mean-reversion candidate if oversold momentum reverses. MACD is bearish and weakening while stochastic RSI sits deeply oversold at 0.08, painting a picture of capitulation rather than accumulation. The trend component of 67.0 reveals price is still above both major averages, but -13.3% relative strength versus SPY tells you money is actively exiting this group.
Defense & Aerospace earns only 5% allocation despite occupying the top spot because its 28.6 category score reflects systemic weakness in both technical and macro conditions. The -6.1% 13-week return and -13.3% relative strength versus SPY indicate the theme is lagging badly in this market regime; even though broad market bear is active (+6) and dollar strength is positive (+3) for defense, the macro fit only reaches 59.0 out of 100, insufficient to carry a weak technical setup. Momentum confirmation of 2.5/100 and volume-price persistence of 30.8/100 underscore that this is a mean-reversion bet on oversold conditions, not a trend-following trade. The 5% slot is justified only by the defined support and risk-reward mathematics; without a fresh macro catalyst favoring defense spending or a break above 112.01 resistance on accumulation volume, this category lacks the sponsorship and timing precision required for higher allocation.
Emerging Markets — INDA
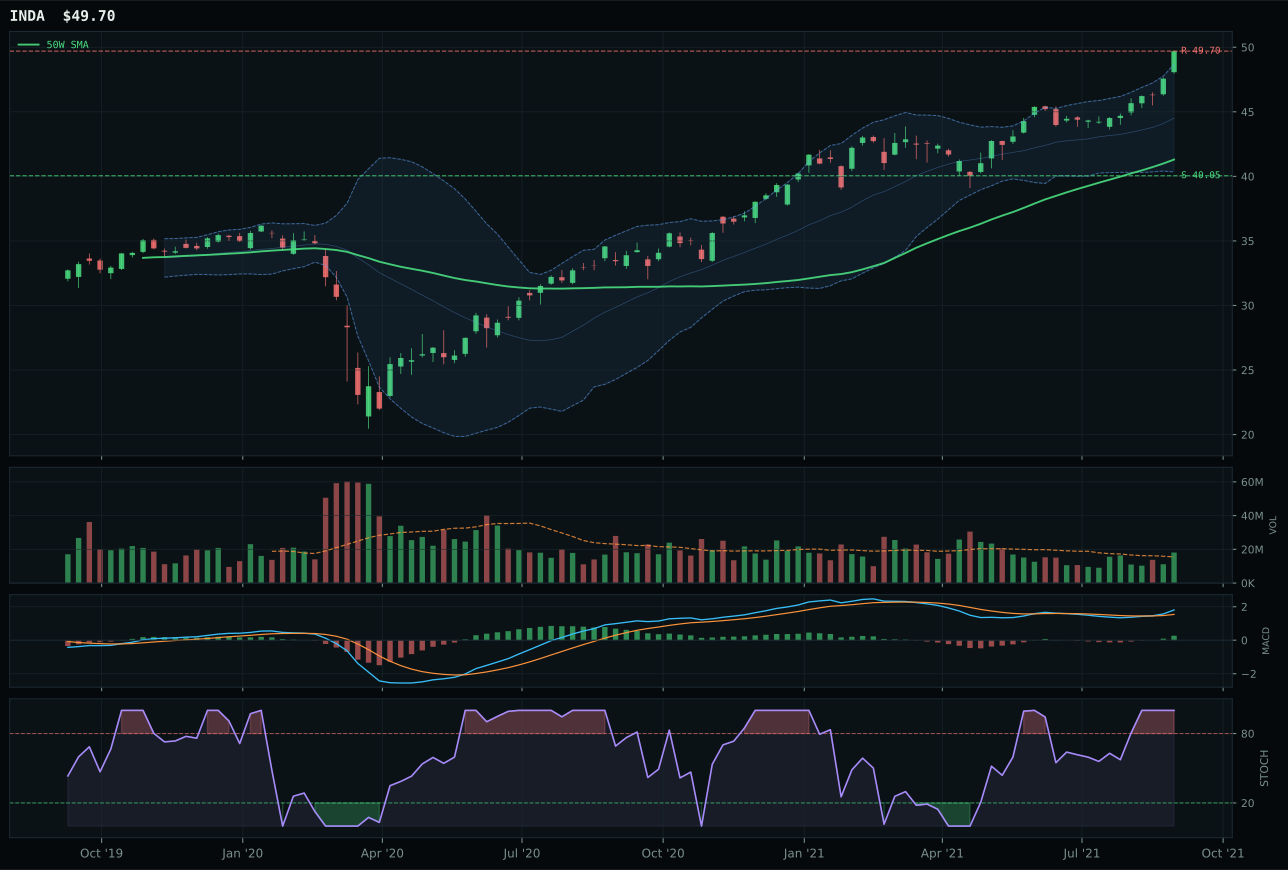
INDA has a vertical extension profile with 2.3% 13-week relative strength versus SPY.
A failed hold above support would weaken the setup.
Actionable but governed by invalidation levels.
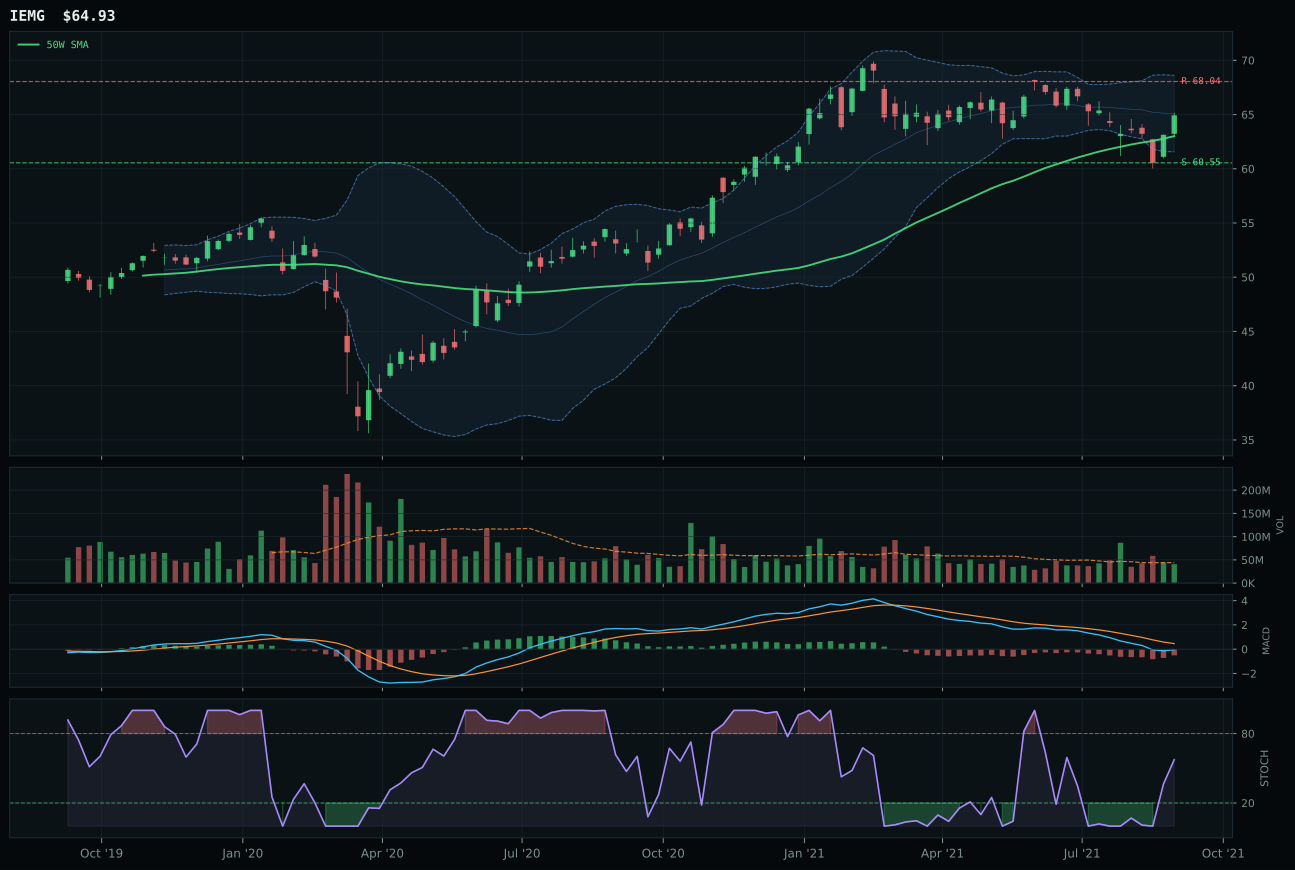
IEMG has a neutral structure profile with -11.8% 13-week relative strength versus SPY.
A failed hold above support would weaken the setup.
Actionable but governed by invalidation levels.
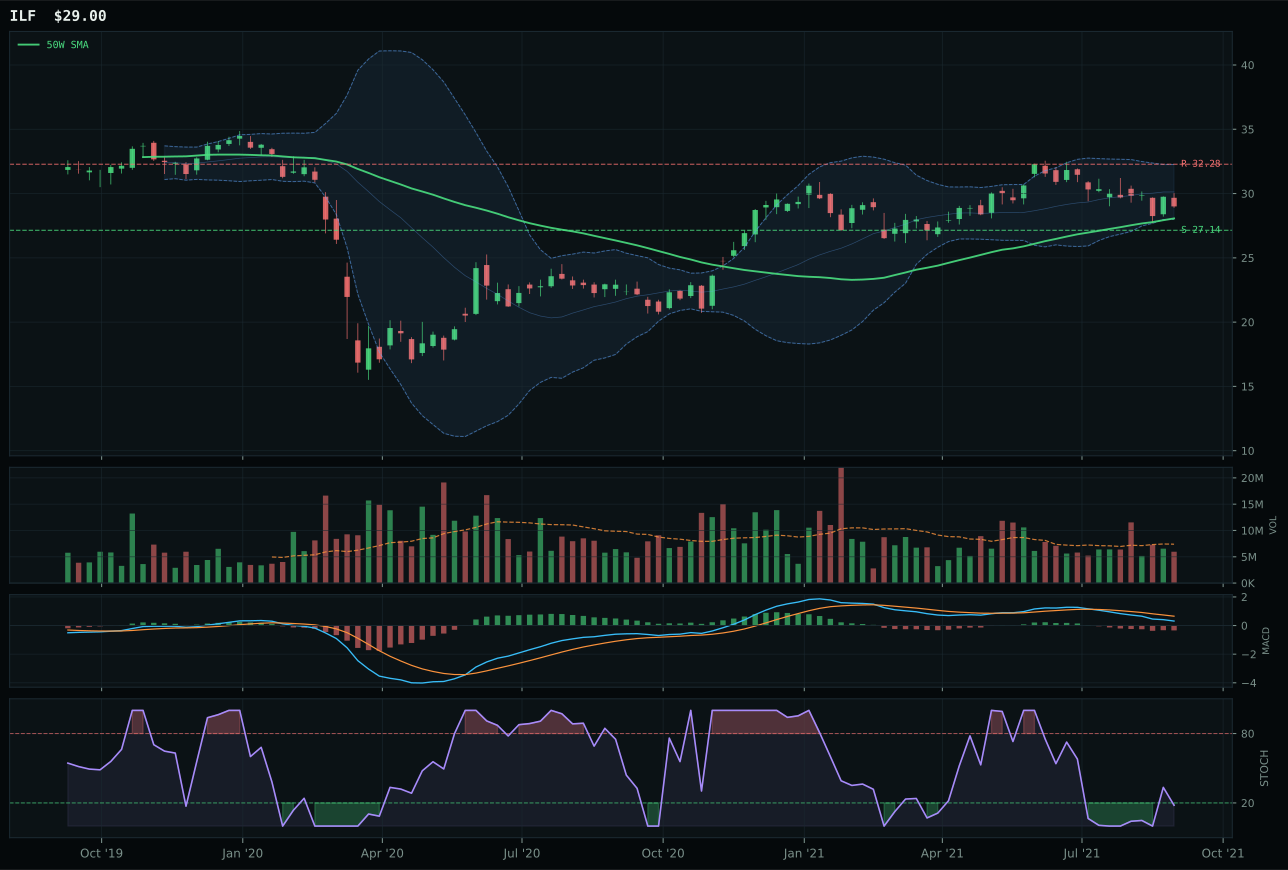
ILF has a neutral structure profile with -17.4% 13-week relative strength versus SPY.
A failed hold above support would weaken the setup.
Actionable but governed by invalidation levels.
INDA won by 2.2 points over IEMG despite broader emerging-market weakness, securing the category win through superior trend (100.0/100, both price above 50W and 200W with positive slope), momentum confirmation (100.0/100 from 8.8% four-week and 9.5% thirteen-week returns), and category-relative strength of 14.1% versus IEMG's 0.0%. INDA's volume participation of 1.17x the 20-week average versus IEMG's neutral reading confirms India-focused growth is attracting accumulation even as broad emerging-market sentiment deteriorates. IEMG's MACD is bearish-but-improving while INDA's is bullish-and-improving—a critical momentum divergence that signals India is decoupling upward from broader emerging-market malaise. Structure cleanliness favors INDA at 81.5 versus IEMG's 70.3; both sit in vertical-extension setups 20-21% above the 50-week, but INDA's better internal sponsorship justifies the extended entry.
Emerging markets receives 0% allocation because the 20.2 category score ranks among the lowest tier, crushed by dollar pressure active at -14 points and credit stress at -10 points, macro headwinds that directly penalize emerging-market currency and sovereign credit. INDA's technical 88.9 cannot overcome category-level macro fit of only 40.0 when dollar strength is actively hostile to EM returns; the 37.0 timing score for INDA itself reflects 20.3% extension that punishes entry into a trade facing macro headwinds. The category's own -25 net macro score (Goldilocks +8 offset by -14 dollar, -10 credit, -9 broad market bear) confirms this is a regime-hostile theme regardless of India's relative outperformance. Institutional positioning would be to avoid EM entirely until either dollar pressure reverses or credit stress conditions materially improve; INDA's momentum may persist briefly, but it is fighting structural policy headwinds that 0% allocation respects. Entry signals would require either dollar pressure deactivating from the macro descriptor set or a -20% retracement in INDA price that forces institutional reevaluation of entry risk.
Traditional Energy — FCG
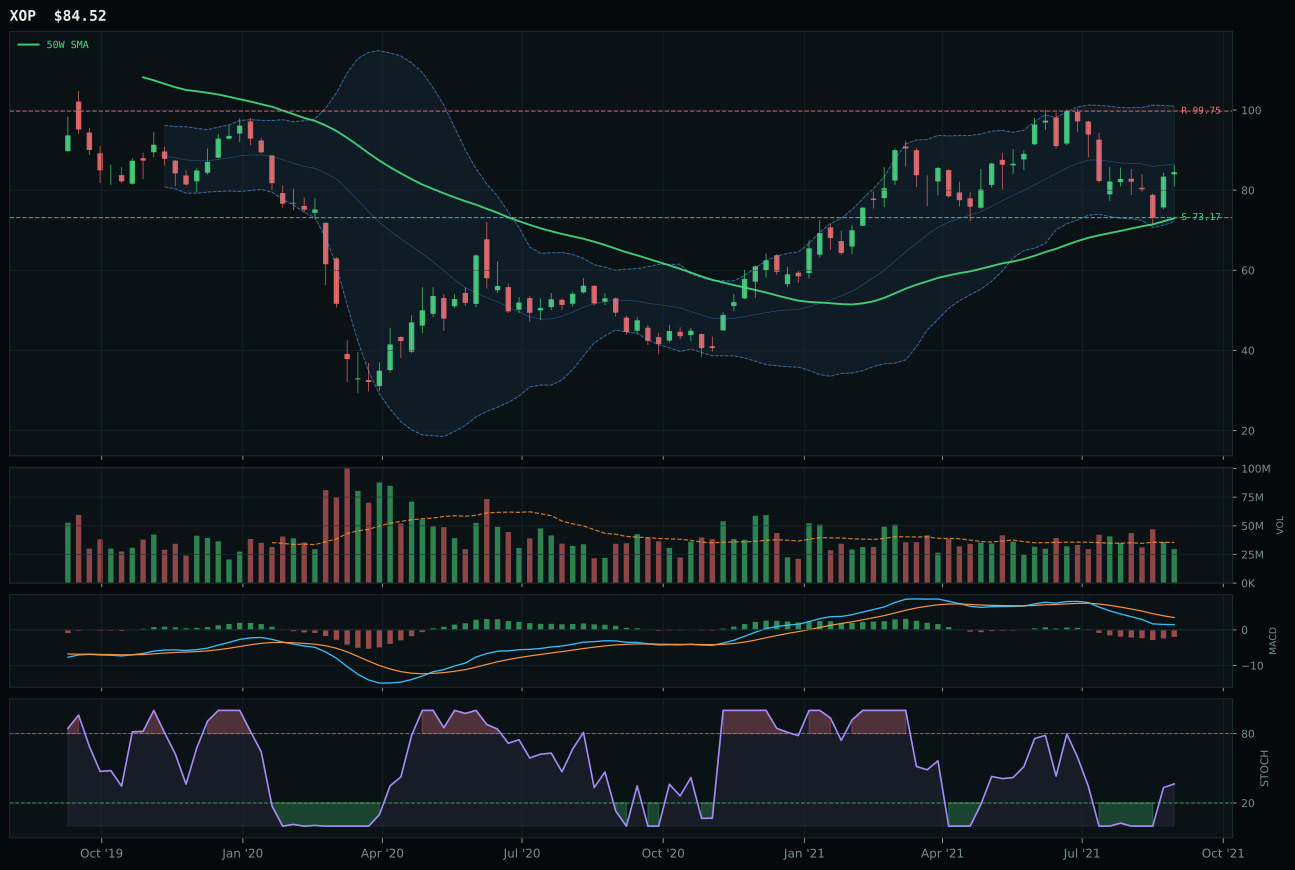
XOP has a vertical extension profile with -19.6% 13-week relative strength versus SPY.
A failed hold above support would weaken the setup.
Actionable but governed by invalidation levels.
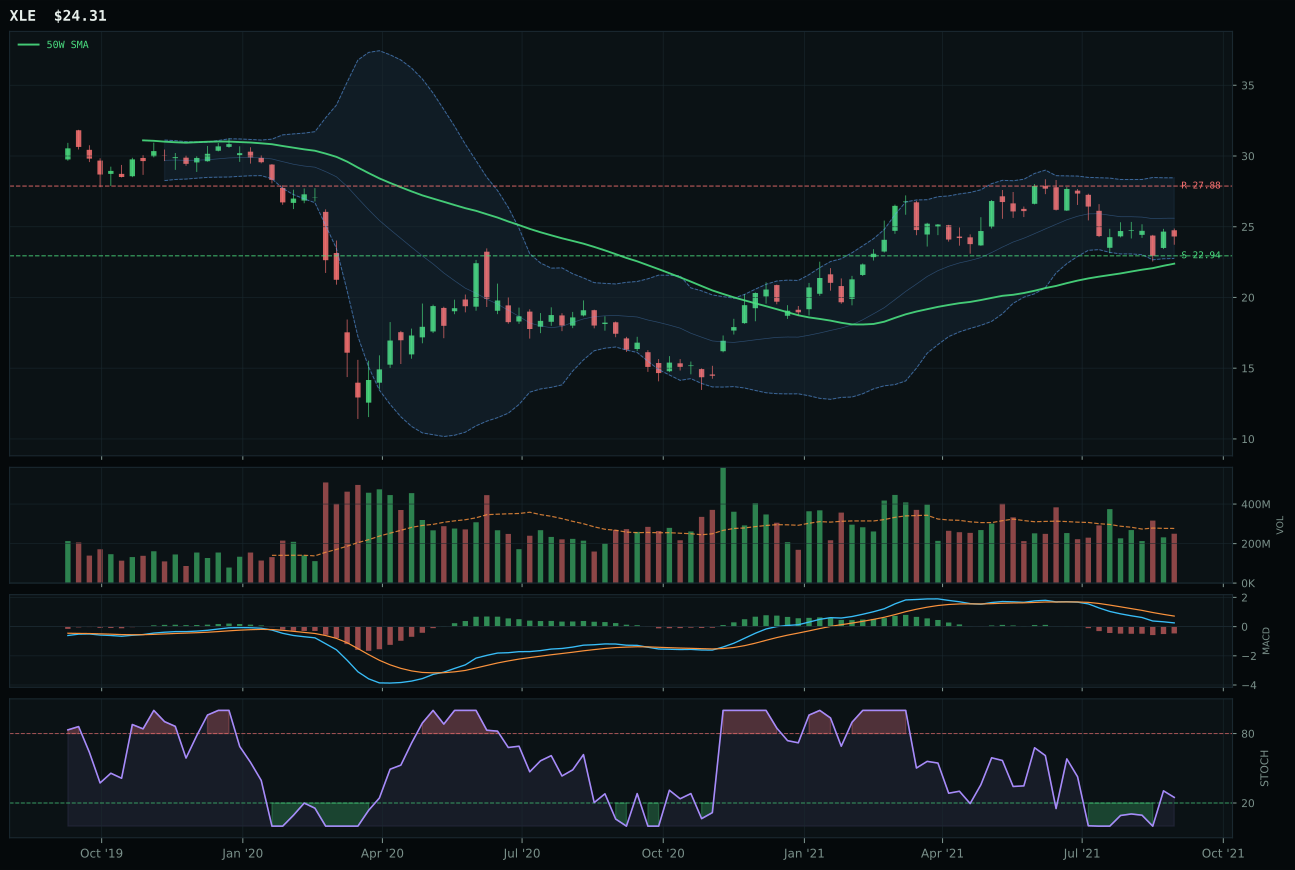
XLE has a neutral structure profile with -20.0% 13-week relative strength versus SPY.
A failed hold above support would weaken the setup.
Actionable but governed by invalidation levels.
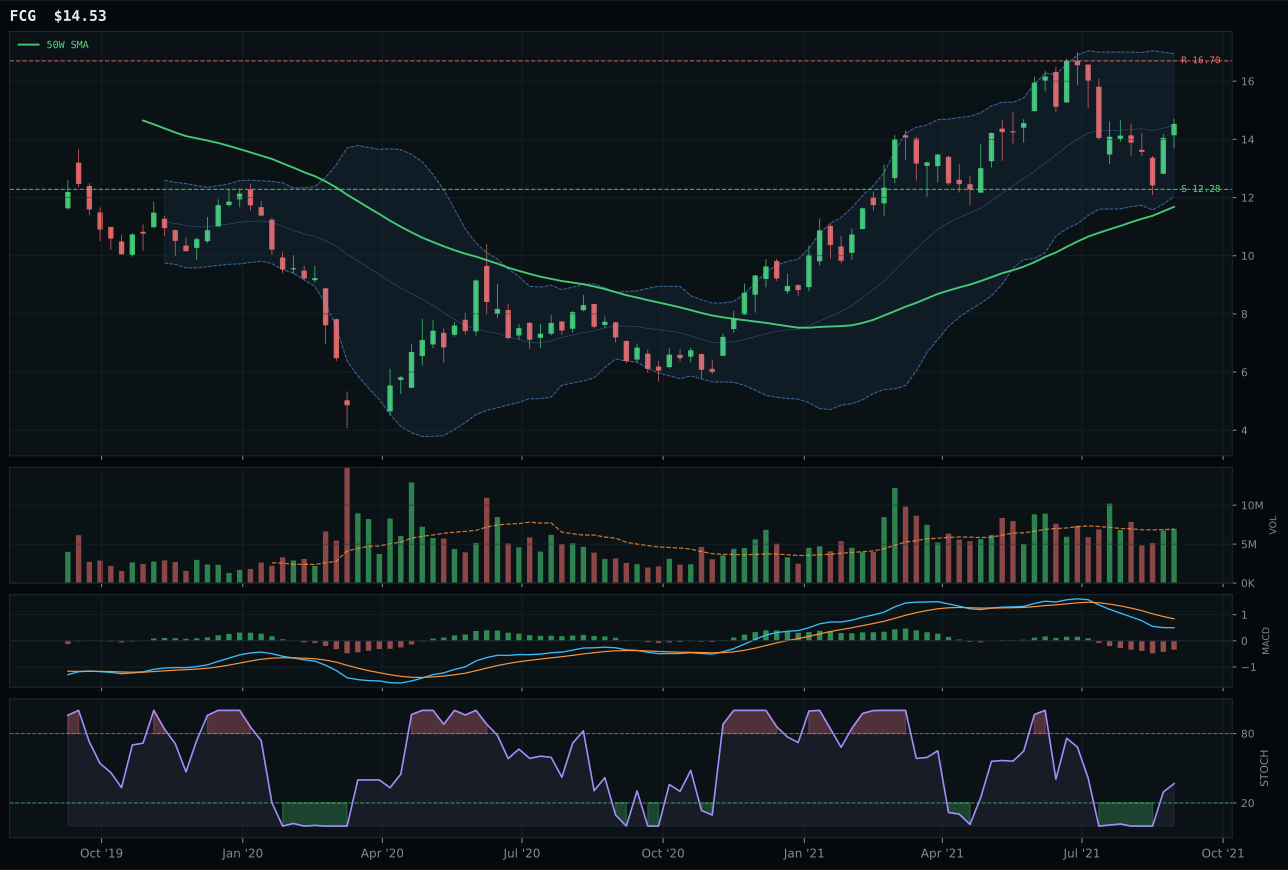
FCG has a vertical extension profile with -16.1% 13-week relative strength versus SPY.
A failed hold above support would weaken the setup.
Actionable but governed by invalidation levels.
FCG won by the narrowest margin (-1.2 points versus XOP) in the weakest category overall, selected because it showed marginally superior structure (63.6 versus XOP's 61.1) and category-relative strength of 3.4% versus XOP's 0.0%, though both exhibit terrible technical setup. FCG is 24.4% extended above the 50-week with MACD bearish and weakening—a deteriorating momentum picture—while stochastic RSI is only rising mid-zone at 0.37, confirming early reversal potential rather than strong rebound. Thirteen-week return of -8.9% and thin volume participation at 1.01x the 20-week average reveal that this category is a true laggard with no accumulation sponsorship. Neither FCG nor XOP nor XLE has positive momentum; all three sit in upper retracement zones waiting for mean reversion, not trending higher. The 0.4 basis point category-relative strength edge is meaningless; this is selection among three losers based on least-ugly structure.
Traditional energy receives 0% allocation because the 11.2 category score ranks dead last among all ten categories, disqualifying it entirely from the weekly portfolio regardless of individual ETF merits. Technical evidence averages only 22.2 across the category, a floor-level score driven by -12.8% to -20.0% relative underperformance versus SPY across all three names and broad market bear momentum that is actively hostile to energy cyclicals. Macro fit of 50.0/100 attempts rescue via real asset sponsorship (+7) but falls short against disinflation pressure (-10) and credit stress (-7), leaving the category with negative net macro tailwinds. Volume-price confirmation of 25.7/100 and persistence of 27.0/100 confirm that the energy trade is neither being accumulated nor confirmed; instead it sits in rejection pattern typical of lagging sectors awaiting catalysts. Zero allocation is the only honest position; energy would require a 180-degree swing in macro conditions—inflation breaking through disinflation pressure, credit stress reversing—to earn even 5% allocation, a pivot that current positioning provides zero evidence of supporting.