
2021-08-27
Informational purposes only. The content in this report, including allocations, analysis, and commentary, is provided solely for informational and educational purposes. It does not constitute financial advice, investment advice, trading advice, or any other type of advice. Past performance does not guarantee future results. Always conduct your own research and consult a qualified financial professional before making investment decisions.
Weekly Allocation
| Ticker | Category | Weight | Role |
|---|---|---|---|
| FSOL | 50% | Overlay | |
| XLU | Utilities & Infrastructure | 10% | Top-2 (10%) |
| CIBR | Technology | 10% | Top-2 (10%) |
| COPX | Industrial Metals | 5% | Tier-2 (5%) |
| MOO | Agriculture & Livestock | 5% | Tier-2 (5%) |
| URNM | Nuclear Energy | 5% | Tier-2 (5%) |
| GLD | Precious Metals | 5% | Tier-2 (5%) |
| BOTZ | AI | 5% | Tier-2 (5%) |
| ITA | Defense & Aerospace | 5% | Tier-2 (5%) |
Trade Instructions — Monday Open
Sell the tranche from 2021-07-30 (completing its 4-week hold). Buy the new tranche. Instructions show net portfolio changes — same-asset positions cancel, weight changes show the delta.
| Action | Ticker | Instruction |
|---|---|---|
| SELL | REMX | Sell entire REMX position (2.50% of portfolio) |
| SELL | SMH | Sell 33% of SMH position (reduce 3.75% → 2.50%) |
| SELL | ILF | Sell entire ILF position (1.25% of portfolio) |
| BUY | XLU | Buy XLU — 25.00% of freed cash (adds 1.25% to portfolio) |
| BUY | COPX | Buy COPX — 25.00% of freed cash (adds 1.25% to portfolio) |
| BUY | BOTZ | Buy BOTZ — 25.00% of freed cash (adds 1.25% to portfolio) |
| BUY | MOO | Buy MOO — 25.00% of freed cash (adds 1.25% to portfolio) |
Current Portfolio After Trade
Combined holdings across all 4 active tranches. Each tranche is 25% of the portfolio.
| Ticker | % of Portfolio | Weight Bar |
|---|---|---|
| FSOL | 50.00% | |
| COPX | 7.50% | |
| XLU | 5.00% | |
| ITA | 5.00% | |
| IGV | 5.00% | |
| URNM | 3.75% | |
| WEAT | 3.75% | |
| SMH | 2.50% | |
| GLD | 2.50% | |
| PAVE | 2.50% | |
| XLK | 2.50% | |
| BOTZ | 2.50% | |
| CIBR | 2.50% | |
| GDX | 1.25% | |
| URA | 1.25% | |
| SLV | 1.25% | |
| MOO | 1.25% |
Macro Regime — Goldilocks
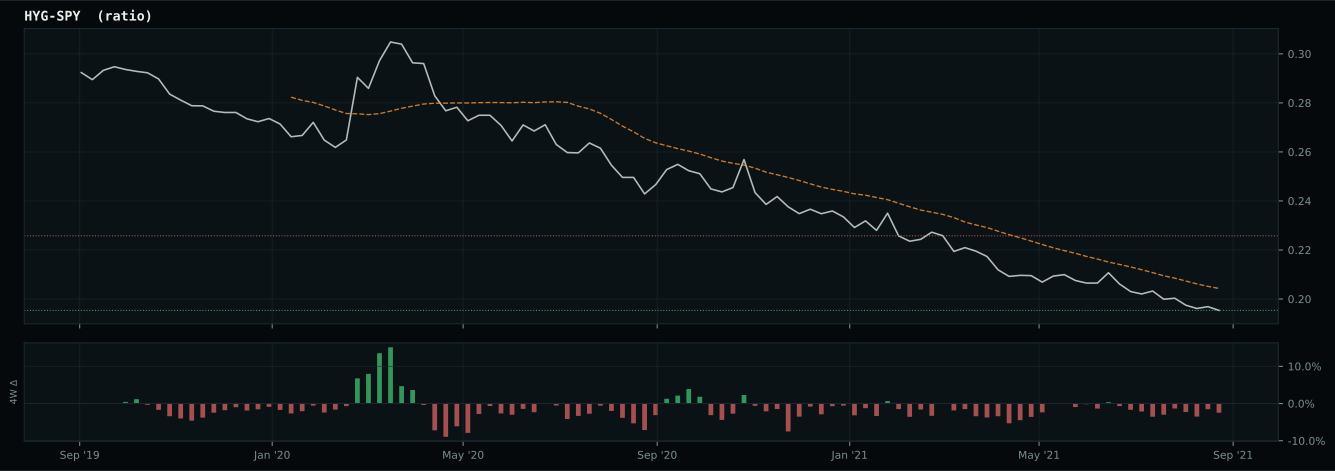
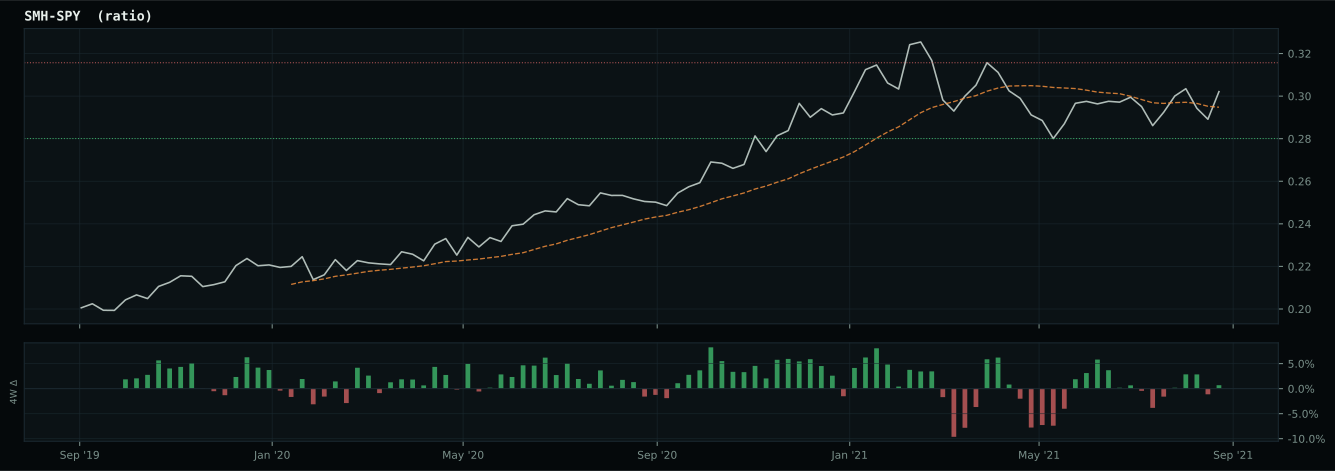
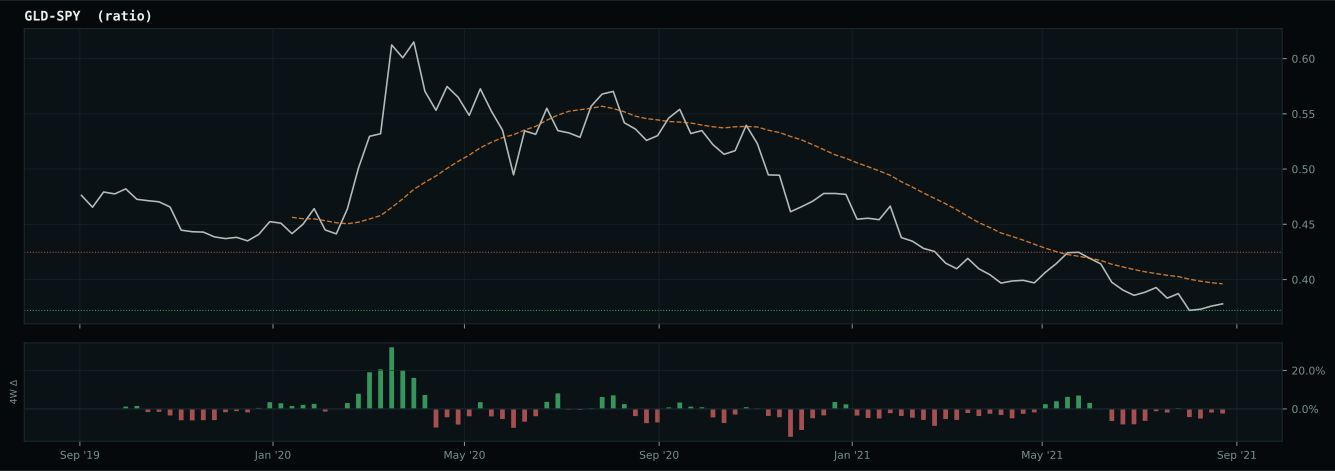
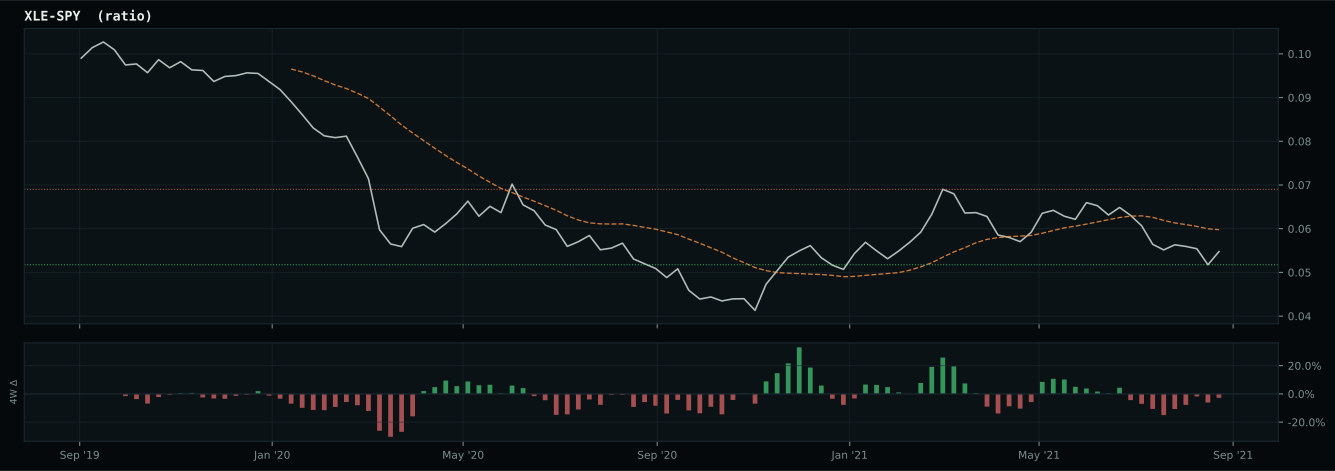
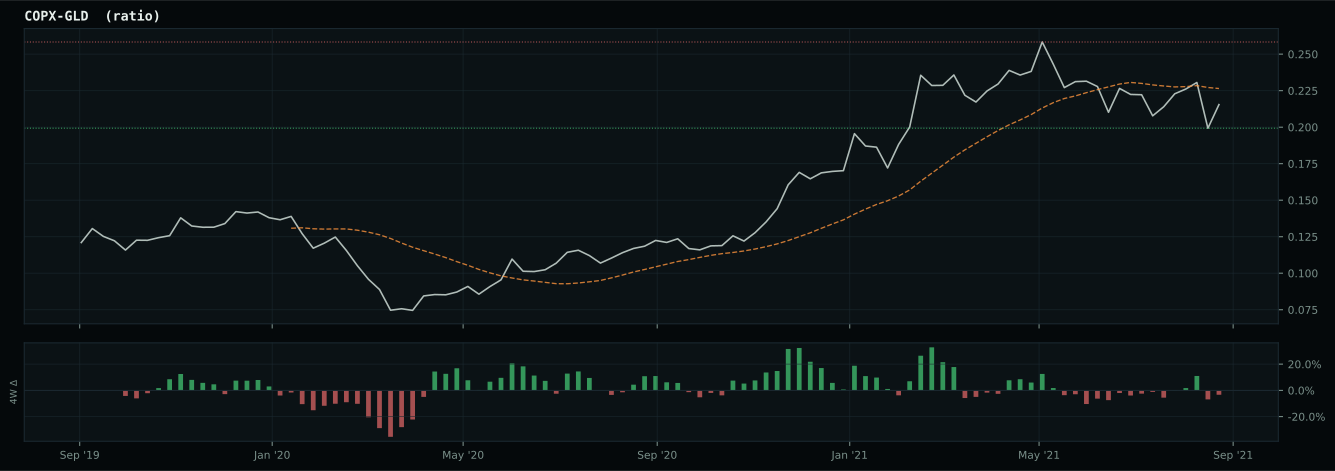
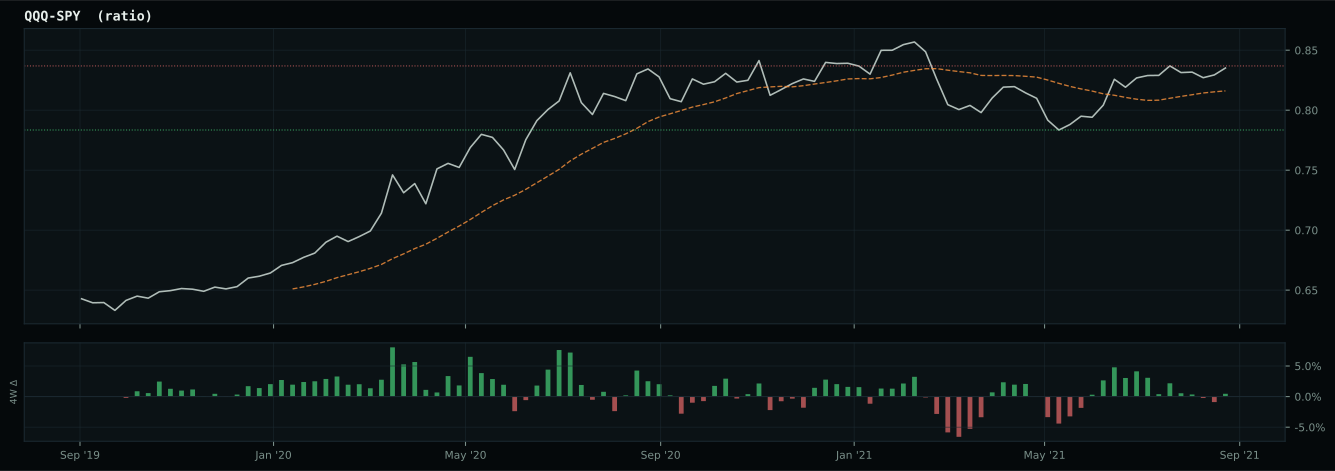
Macro Evidence Charts
Market-implied signals behind the macro regime scores. Each ratio compares two assets; the direction and slope of the ratio is what the macro engine reads.
Crypto Regime — AltSeason
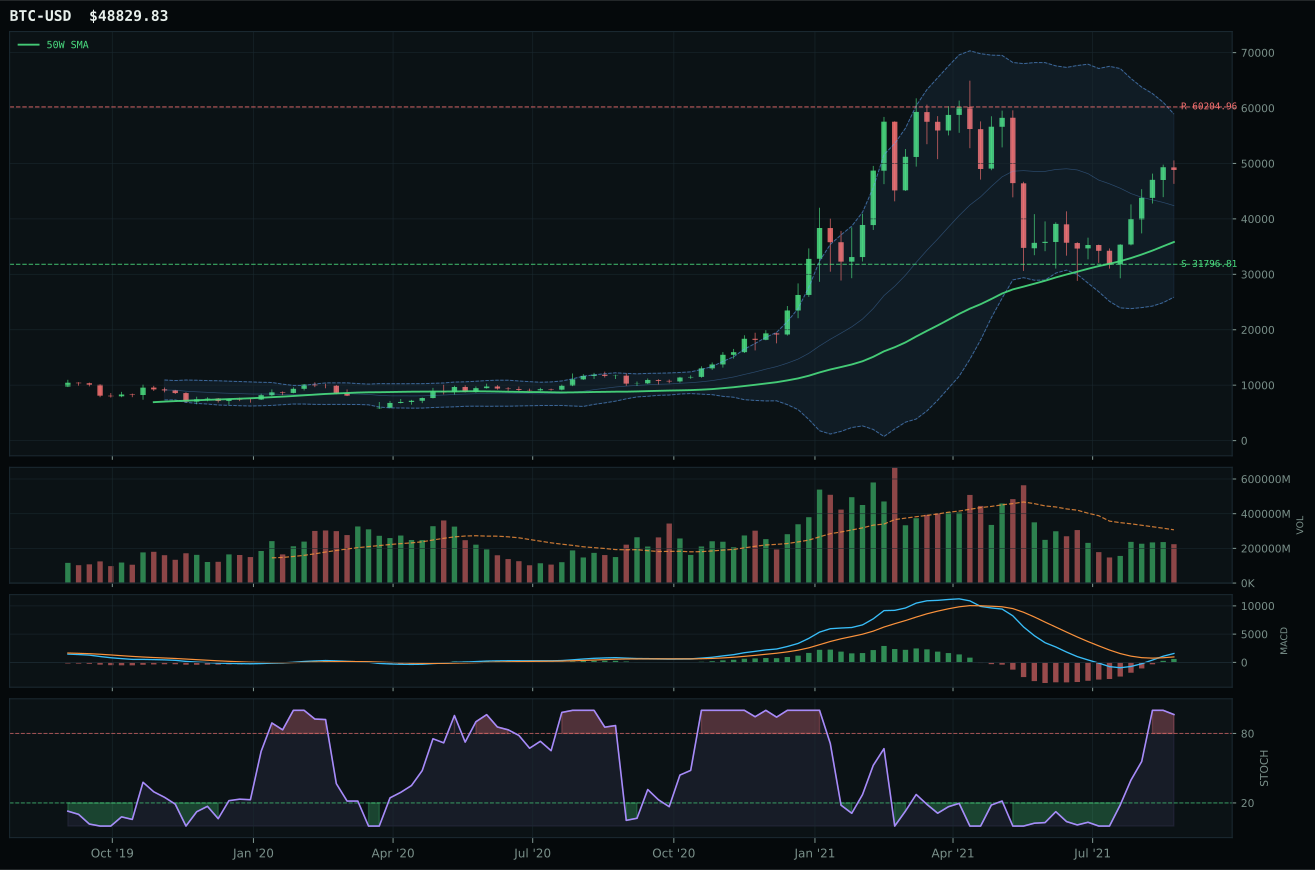
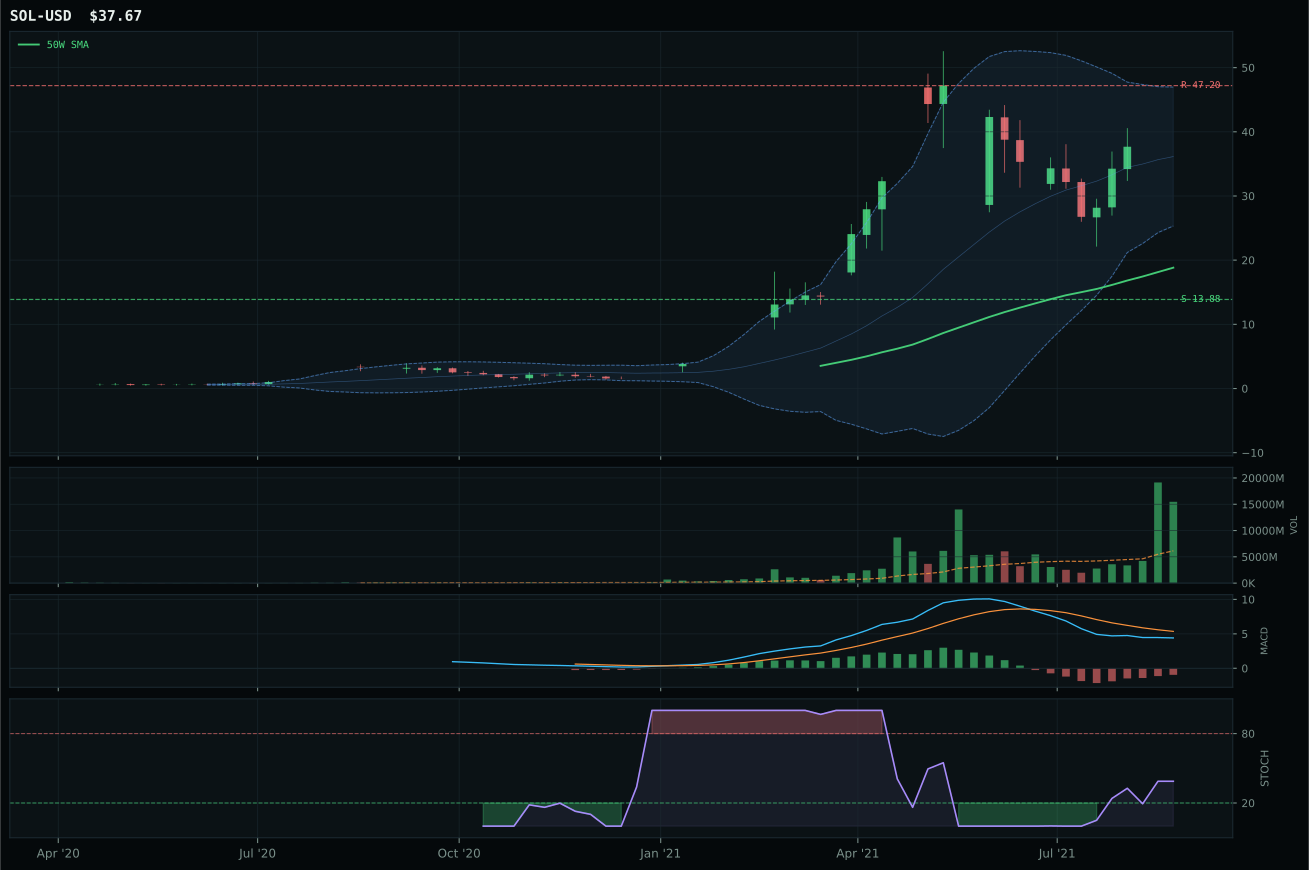
ValueBTC not armed: BTC has not made the first post-breakdown touch of the 200W buy zone after losing the 50W
TrendBTC confirmed: 2 consecutive closes above rising/flat 50W SMA
all available AltSeason conditions pass; missing optional confirmations skipped
Category Rankings
| Rank | Category | Winner | Score | Alloc | 4W Ret | Peers (4W) |
|---|---|---|---|---|---|---|
| 1 | Utilities & Infrastructure | XLU | 64.4 | 20% | -5.07% | PAVE -5.7% · IGF -0.1% |
| 2 | Technology | CIBR | 61.8 | 20% | -1.97% | IGV -1.3% · XLK -1.9% |
| 3 | Industrial Metals | COPX | 54.8 | 10% | -7.27% | REMX -6.8% · PICK -10.2% |
| 4 | Agriculture & Livestock | MOO | 43.3 | 10% | +0.41% | WEAT -1.5% · VEGI -1.3% |
| 5 | Nuclear Energy | URNM | 33.8 | 10% | +30.04% | NLR -0.9% · URA +17.8% |
| 6 | Precious Metals | GLD | 30.9 | 10% | -3.42% | SLV -6.2% · GDX -8.5% |
| 7 | AI | BOTZ | 30.8 | 10% | +4.13% | SMH -1.5% · AIQ -0.8% |
| 8 | Defense & Aerospace | ITA | 29.3 | 10% | -1.52% | XAR -2.7% · ROKT -0.8% |
| 9 | Emerging Markets | INDA | 16.2 | 0% | +3.56% | ILF -8.0% · IEMG -1.4% |
| 10 | Traditional Energy | XLE | 8.2 | 0% | +5.09% | FCG +15.6% · XOP +12.7% |
Utilities & Infrastructure — XLU
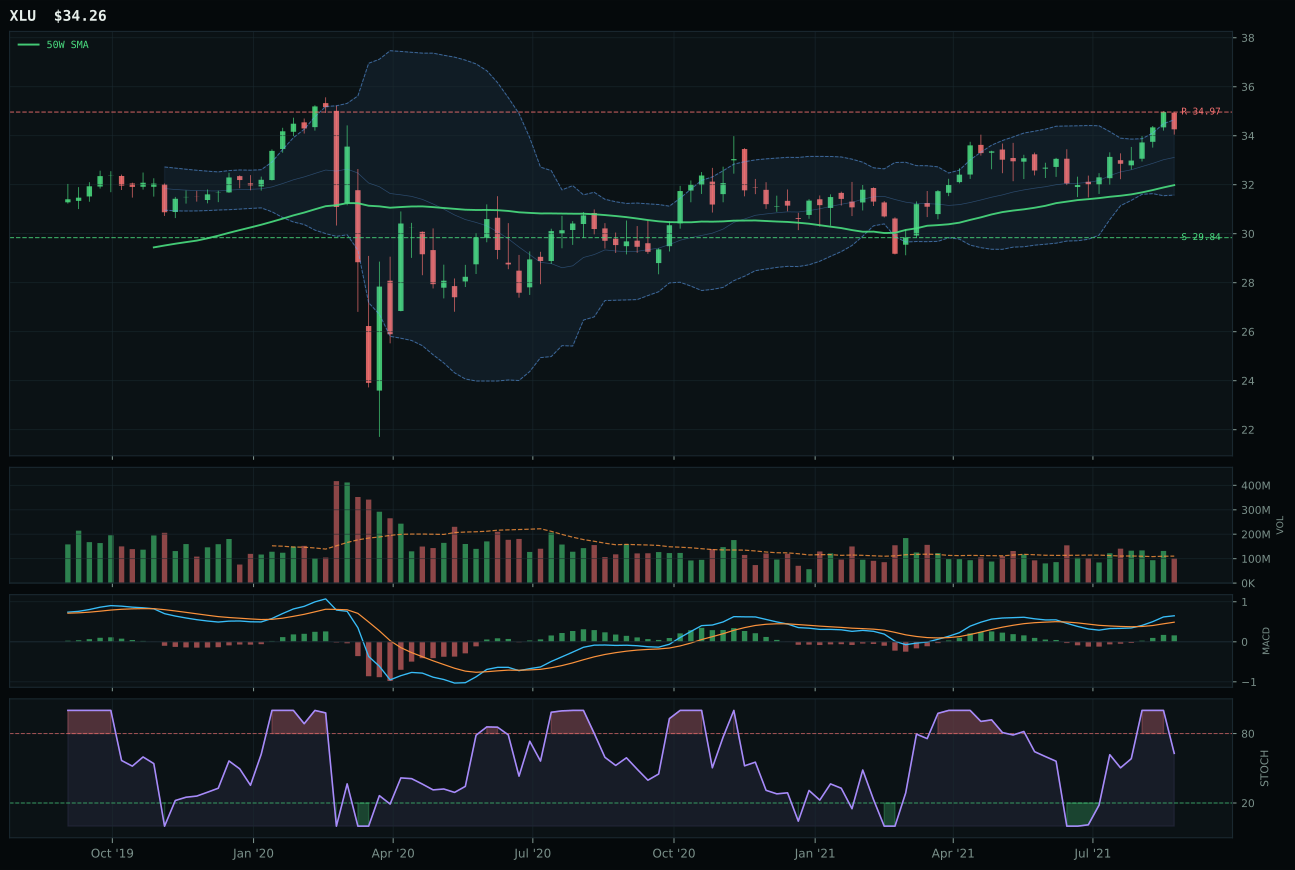
XLU has a neutral structure profile with -2.0% 13-week relative strength versus SPY.
A failed hold above support would weaken the setup.
Actionable but governed by invalidation levels.
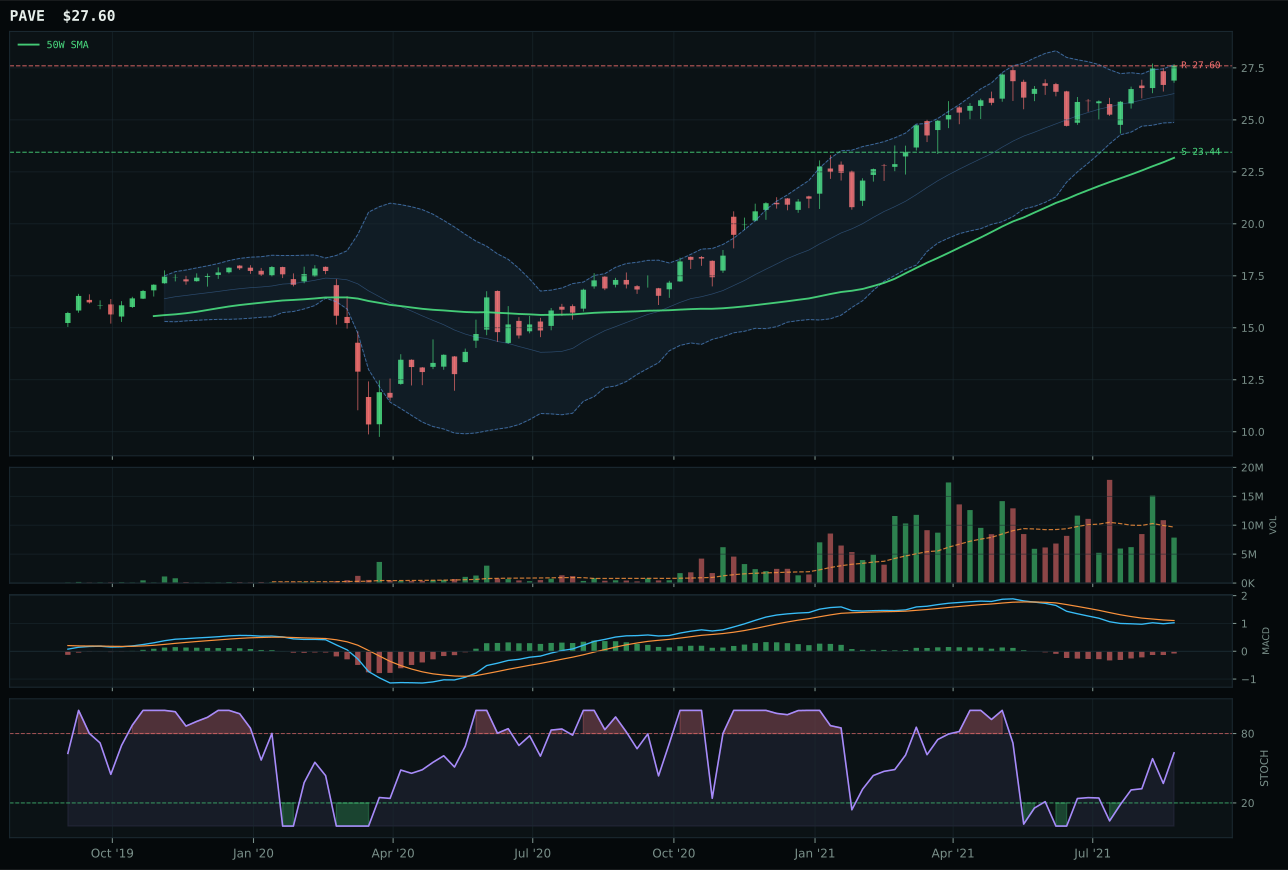
PAVE has a vertical extension profile with -3.0% 13-week relative strength versus SPY.
A failed hold above support would weaken the setup.
Actionable but governed by invalidation levels.
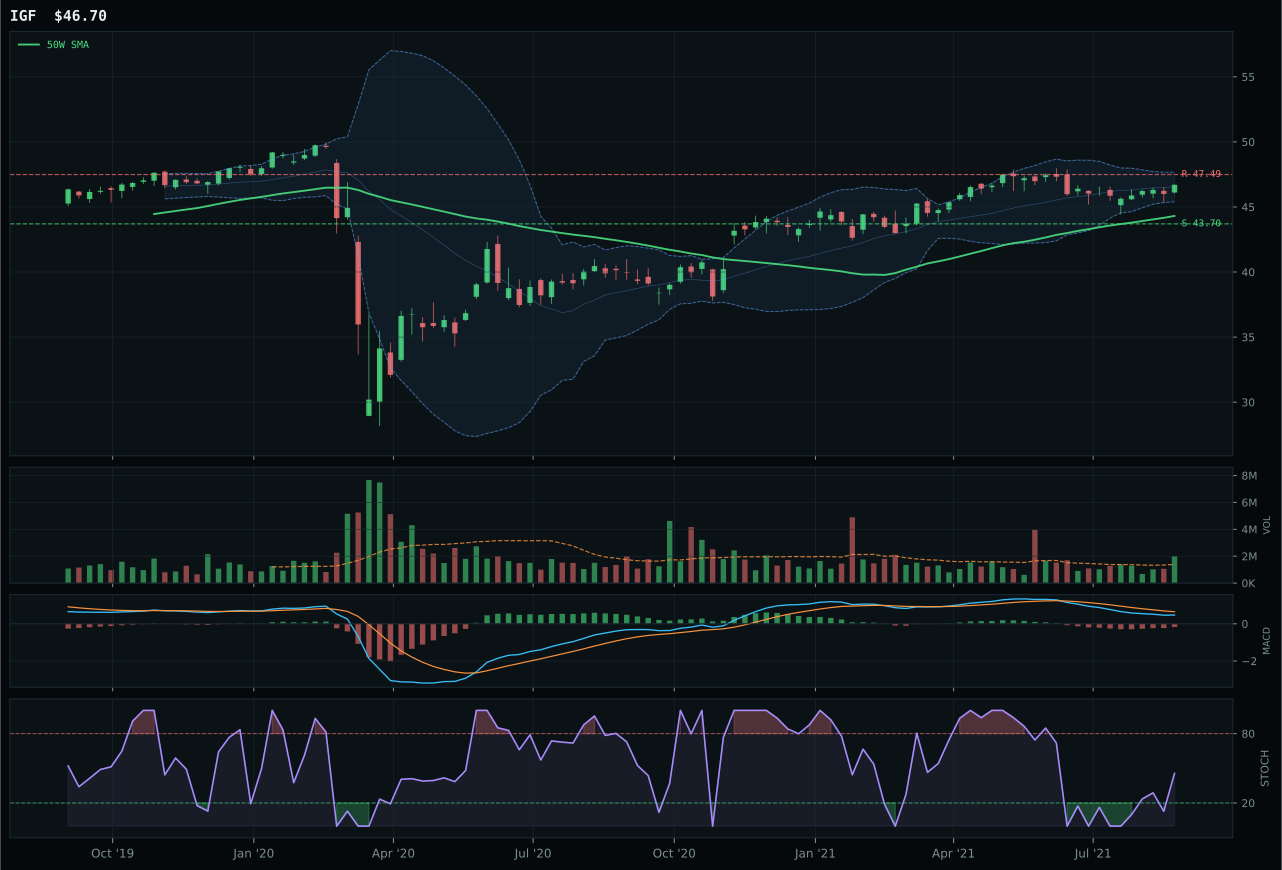
IGF has a neutral structure profile with -7.8% 13-week relative strength versus SPY.
A failed hold above support would weaken the setup.
Actionable but governed by invalidation levels.
XLU wins decisively—ranked first with a 72.5 reasoned score versus PAVE's 56.8 and IGF's 59.8—because it combines the best trend score (97.0) with superior timing (75.0) and structural cleanliness (78.0), all while sitting only 7.1% from its 50-week moving average. The setup is in the upper retracement momentum zone with MACD bullish and improving, stochastic RSI falling (neutral, not overbought), and a 5.2% 13-week return that's modest but steadily accumulated on neutral volume. PAVE, the runner-up, is stretched 19.1% from its 50-week in vertical extension with MACD bearish but improving and stochastic RSI rising mid-zone—extension without momentum confirmation is the opposite of XLU's disciplined advance. The category-relative strength difference (1.0% for XLU vs 0.0% for PAVE) reflects real utility outperformance within the broader infrastructure sleeve, telling you utilities are the actual bid right now, not infrastructure.
Utilities & Infrastructure earns 10% top-2 allocation, matching Technology's overweight, because the category scores 64.4 composite—the second-highest in the portfolio—and represents the portfolio's defensive anchor in a Goldilocks regime with active broad market bear and disinflation pressure descriptors. XLU's 76.9 technical evidence score combined with 60.0 macro fit creates a resilient setup that works in multiple scenarios: rate cuts or flat rates favor utilities' duration and dividend yields, while broad market stress drives flight-to-quality into regulated monopolies. The allocation decision reflects a two-pronged strategy: Technology earns 10% for momentum leadership (61.8 composite), and Utilities earns 10% as the defensive hedge (64.4 composite). XLU's neutral relative strength (-2.0% vs SPY) is actually a feature in this allocation—it means the category has decoupled from broad market volatility, providing true diversification rather than correlation. The 10% sleeve acknowledges that rate environment uncertainty and growth concerns are best hedged via defensive equity income, not economic optimism.
Technology — CIBR
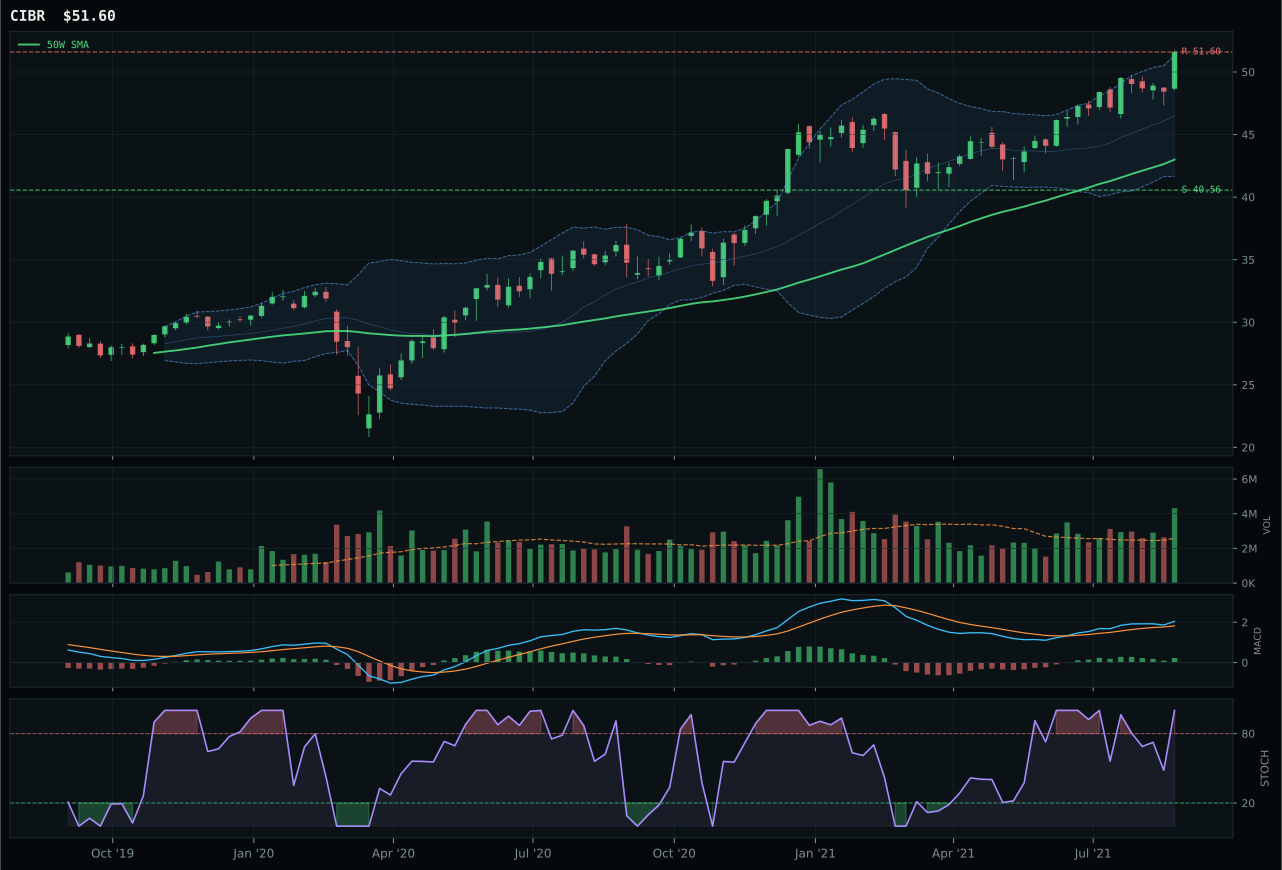
CIBR has a vertical extension profile with 8.8% 13-week relative strength versus SPY.
A failed hold above support would weaken the setup.
Actionable but governed by invalidation levels.
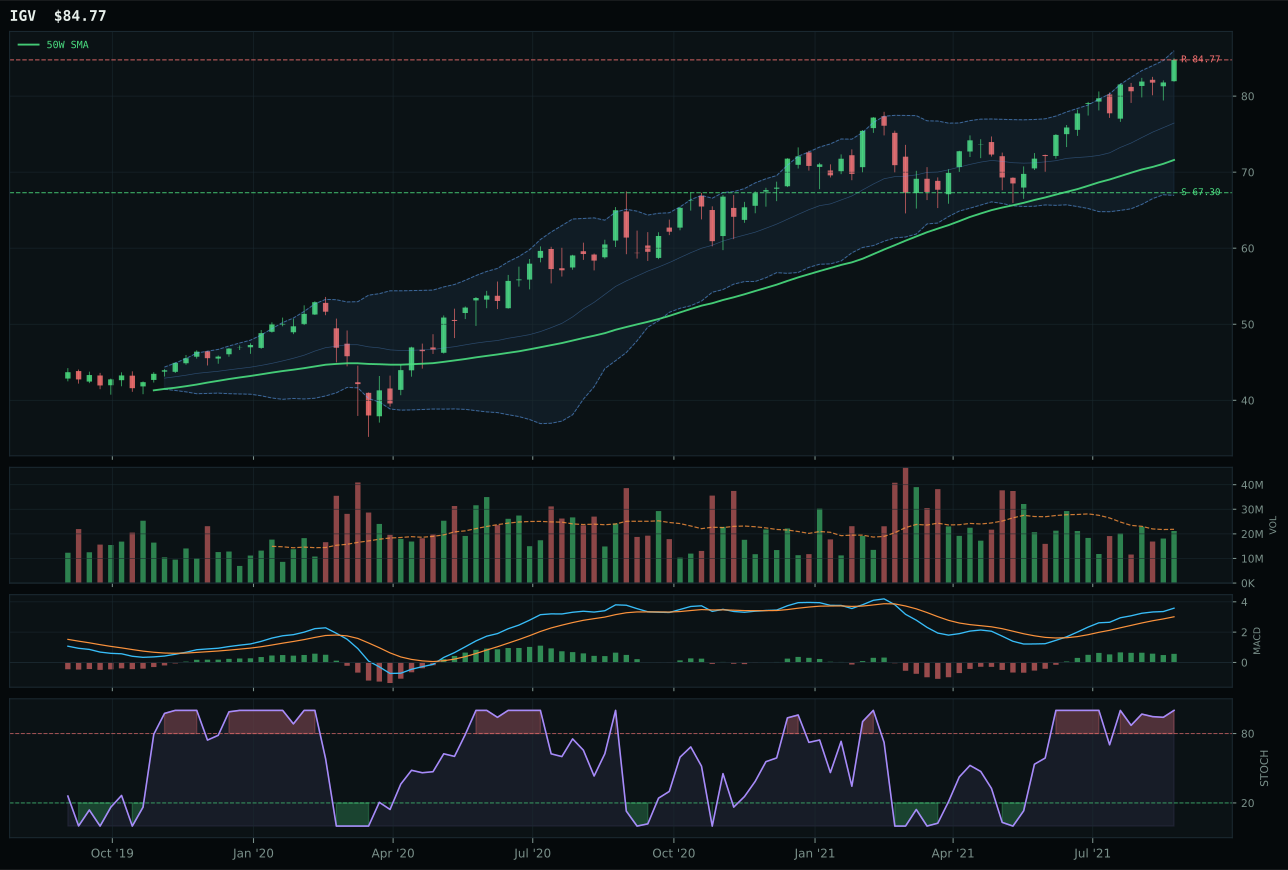
IGV has a vertical extension profile with 10.9% 13-week relative strength versus SPY.
A failed hold above support would weaken the setup.
Actionable but governed by invalidation levels.
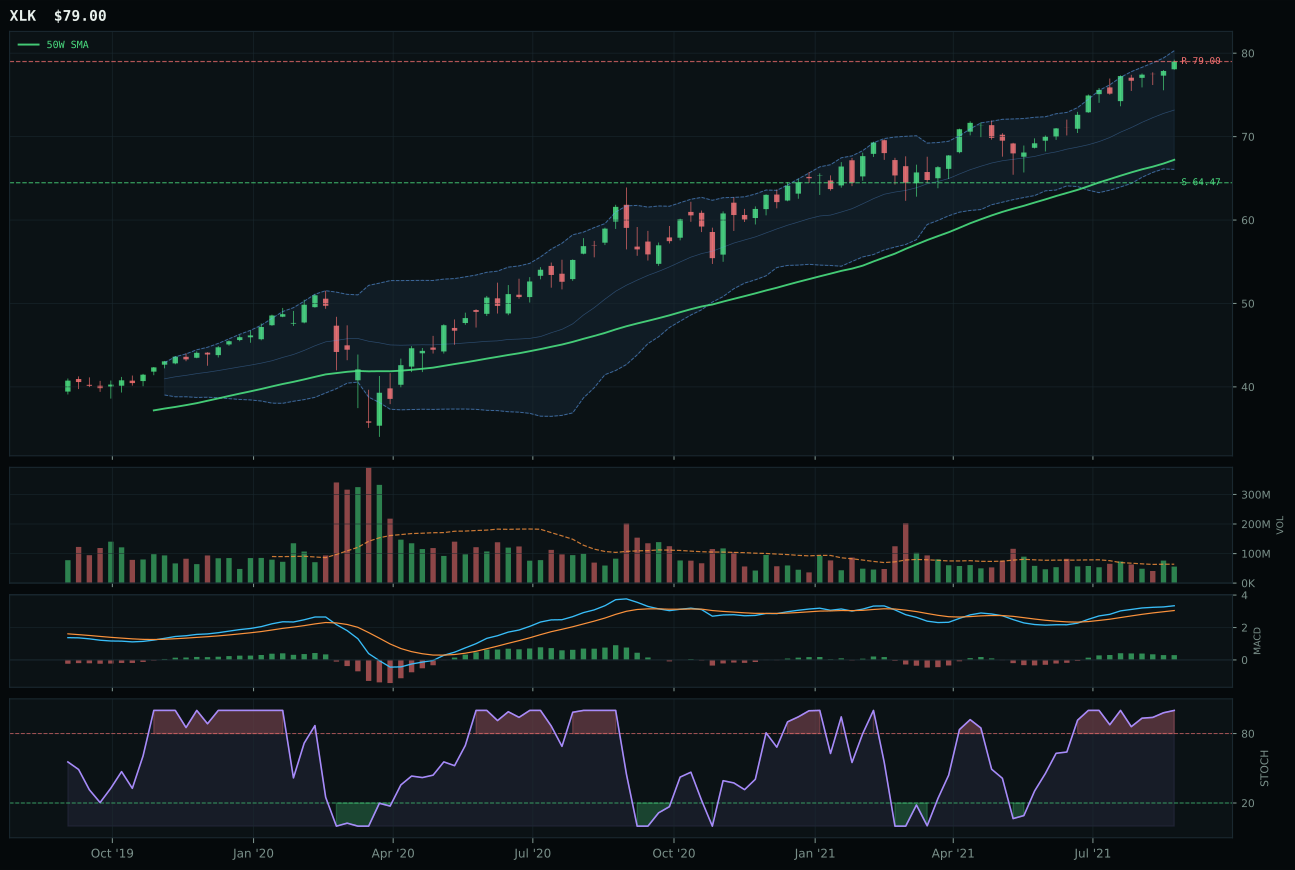
XLK has a vertical extension profile with 7.0% 13-week relative strength versus SPY.
A failed hold above support would weaken the setup.
Actionable but governed by invalidation levels.
CIBR wins because it sits 20.0% above its 50-week moving average with accumulation-level volume at 1.67x its 20-week average, telling you institutional buyers are actively defending this level rather than merely riding momentum. The chart is extended but supported: MACD is bullish though flattening, and stochastic RSI sits at overbought 1.00 in a setup near the Fibonacci 0.236 extension. IGV, the runner-up, lagged on three counts—weaker risk/reward (42.5 vs 47.3), less clean structure (79.8 vs 81.2), and neutral rather than accumulating volume—which means it's extended without the sponsorship to justify the valuation. CIBR's 16.0% 13-week return and 8.8% relative strength versus SPY confirm the setup is owned by real capital, not just technical mean-reversion trades chasing the last quarter's move.
Technology earns 10% allocation as a top-2 category, reflecting its rank among the highest-scoring opportunities this week at 61.8 composite. The macro environment—Goldilocks regime with active disinflation and broad market bear descriptors—provides structural tailwinds for defensive tech and cybersecurity plays, which explains the category-level 52.0 macro fit score. XLU and CIBR occupy the two top allocation slots precisely because they combine clean technical setups (both with above-average structure and timing scores) with macro fit that rewards quality defensiveness in a risk-off environment. The broad market bear active descriptor adds six points to the category reasoning, and that tail wind matters most for names holding above their moving averages with real volume confirmation rather than those coasting on early-cycle optimism.
Industrial Metals — COPX
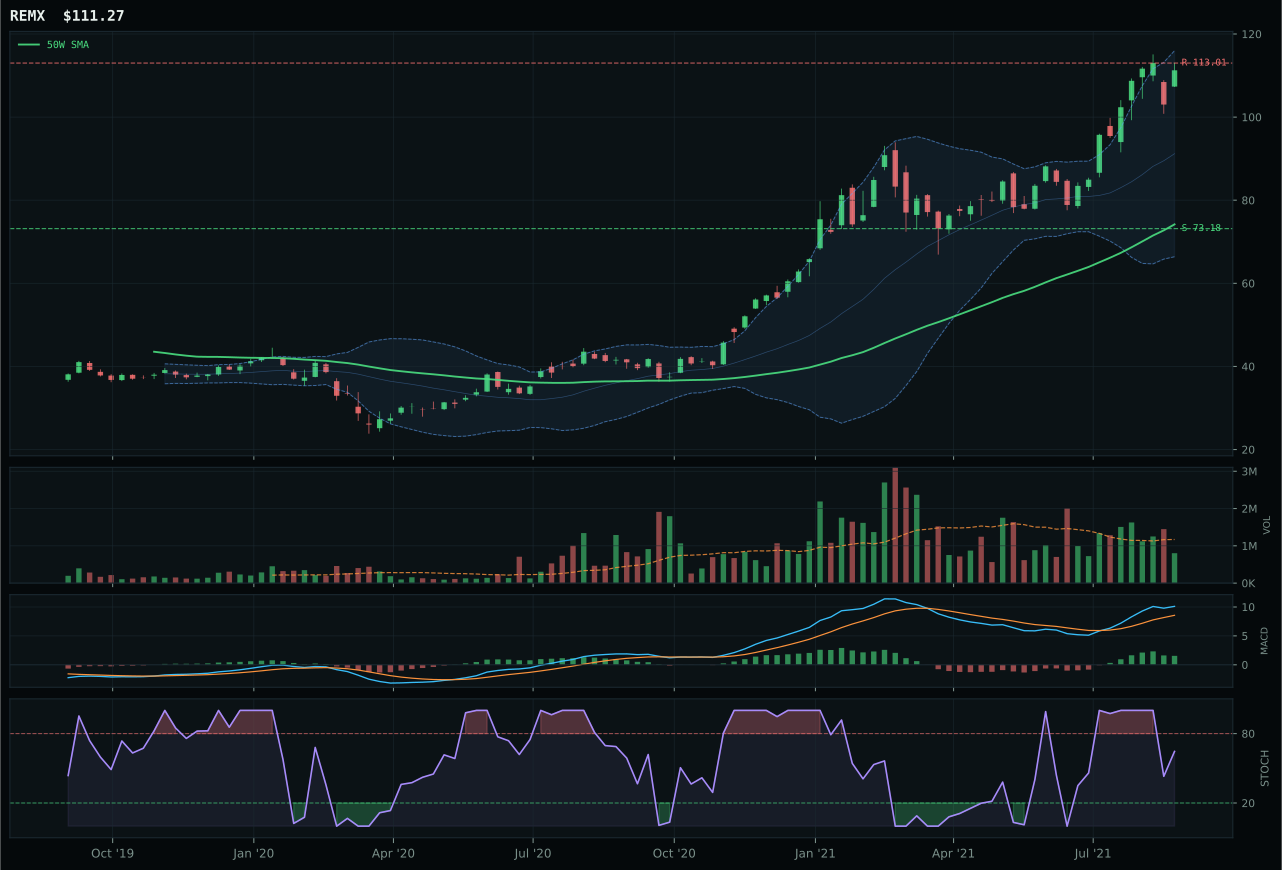
REMX has a vertical extension profile with 26.1% 13-week relative strength versus SPY.
A failed hold above support would weaken the setup.
Actionable but governed by invalidation levels.
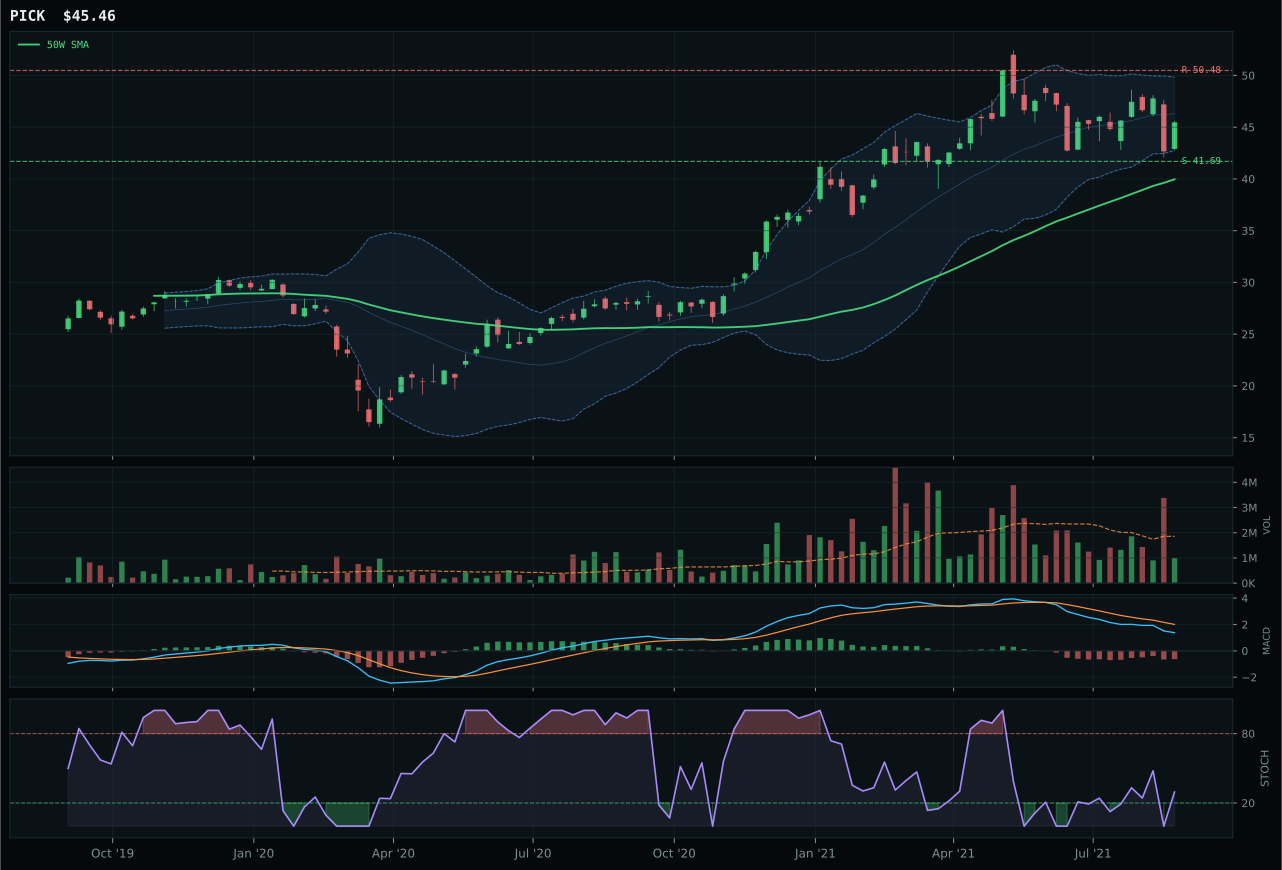
PICK has a neutral structure profile with -11.6% 13-week relative strength versus SPY.
A failed hold above support would weaken the setup.
Actionable but governed by invalidation levels.
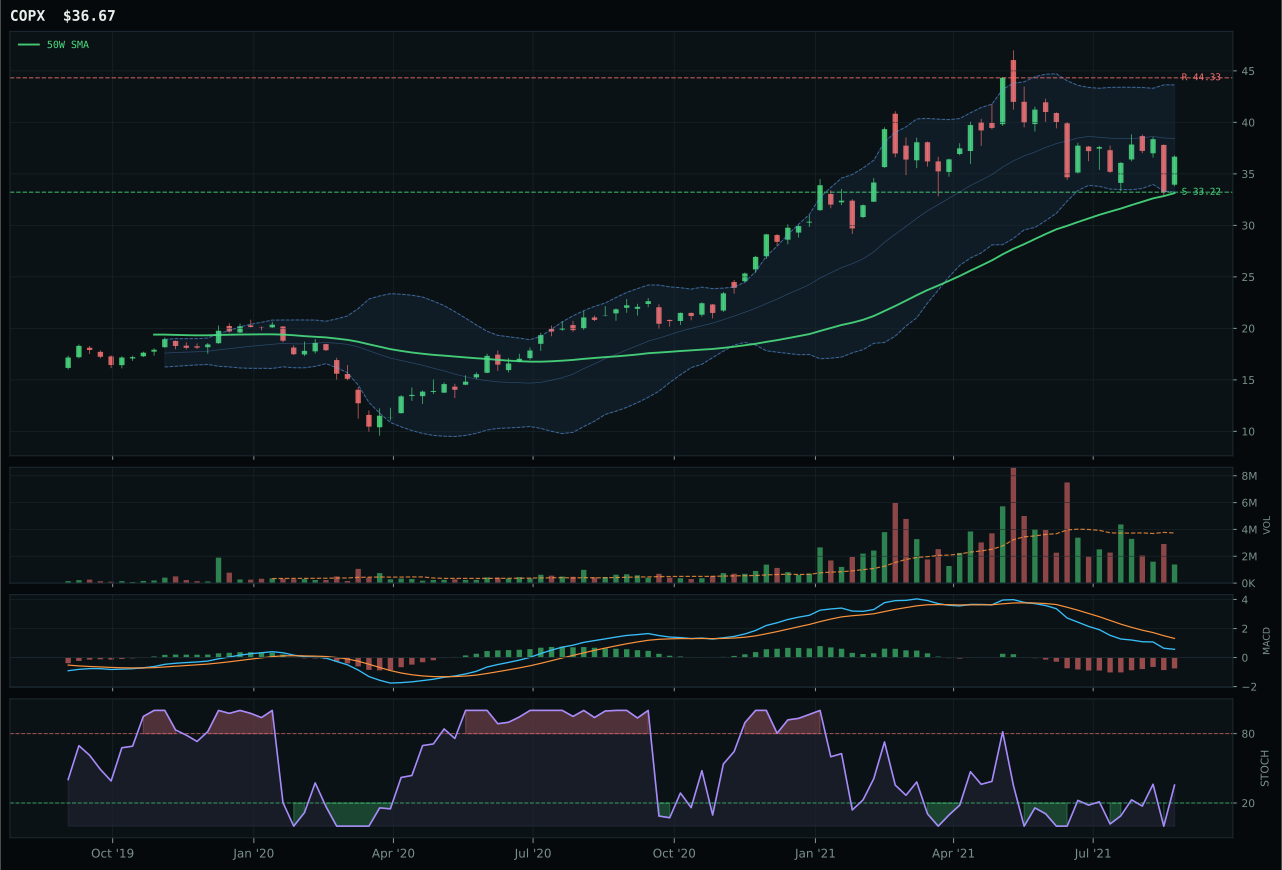
COPX has a neutral structure profile with -18.3% 13-week relative strength versus SPY.
A failed hold above support would weaken the setup.
Actionable but governed by invalidation levels.
COPX wins despite REMX's superior technical evidence (79.3 vs 48.1) because the timing and risk/reward asymmetry favor the pullback. REMX sits 50.0% extended from its 50-week moving average in a vertical extension setup with MACD bullish but flattening and stochastic RSI falling/neutral—all red flags for new entry. COPX, meanwhile, is only 10.7% from the 50-week with MACD bearish but improving and stochastic RSI rising mid-zone, occupying the exact same Fibonacci upper retracement zone but with vastly superior timing (83.0 vs 40.0). REMX's 26.1% relative strength versus SPY and 33.3% 13-week return are seductive, but they're extension markers, not confirmation of continuous sponsorship—that overbought momentum rolling over (stochastic falling) into a flattening MACD warns that the move has price-exhausted. COPX's zero momentum confirmation is honest: it admits the move is dead, but the setup is clean enough to own the reset.
Industrial Metals earns 5% tier-2 allocation because the category scores 54.8 composite and ranks within the tier-2 group, benefiting significantly from the active metals scarcity descriptor (+14 at the category level) and commodity breadth positive (+10). The macro fit of 72.0/100 is among the strongest in the portfolio, reflecting genuine real-asset sponsorship and Goldilocks regime support. REMX's extended vertical rally is excluded from representation despite its technical leadership because the timing penalty (MACD flattening, stochastic rolling over, 50% extension) violates the reasoner's entry-quality gates. COPX's appointment as representative is defensive: the metals complex is recognized as strategically important to portfolio balance in an inflationary-tail regime, but entry must occur on pullback into rising stochastic support rather than chasing momentum at 52-week highs. The 5% sleeve is appropriate because macro tailwinds (scarcity, commodity breadth) are real but technical setups remain weak across the basket.
Agriculture & Livestock — MOO
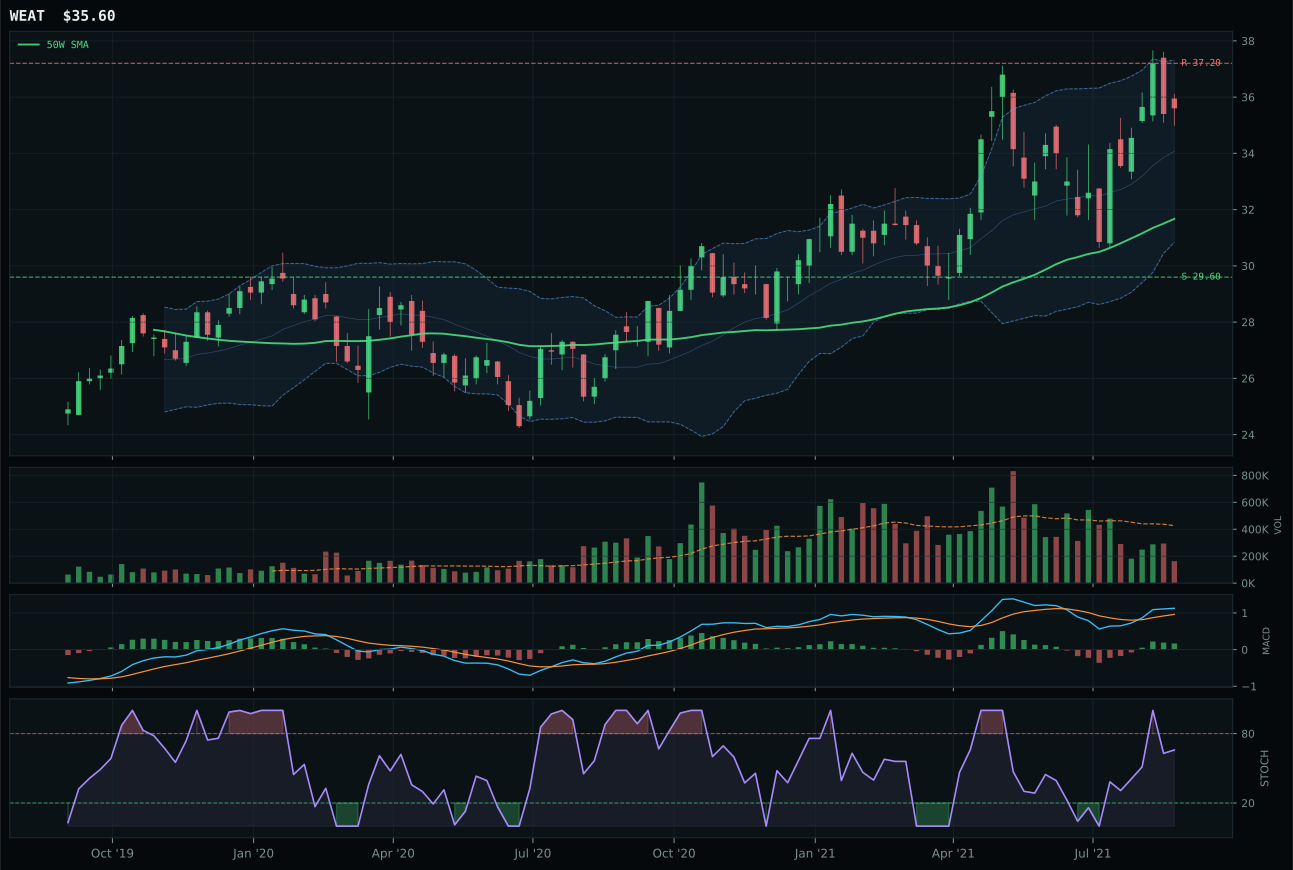
WEAT has a neutral structure profile with 0.7% 13-week relative strength versus SPY.
A failed hold above support would weaken the setup.
Actionable but governed by invalidation levels.
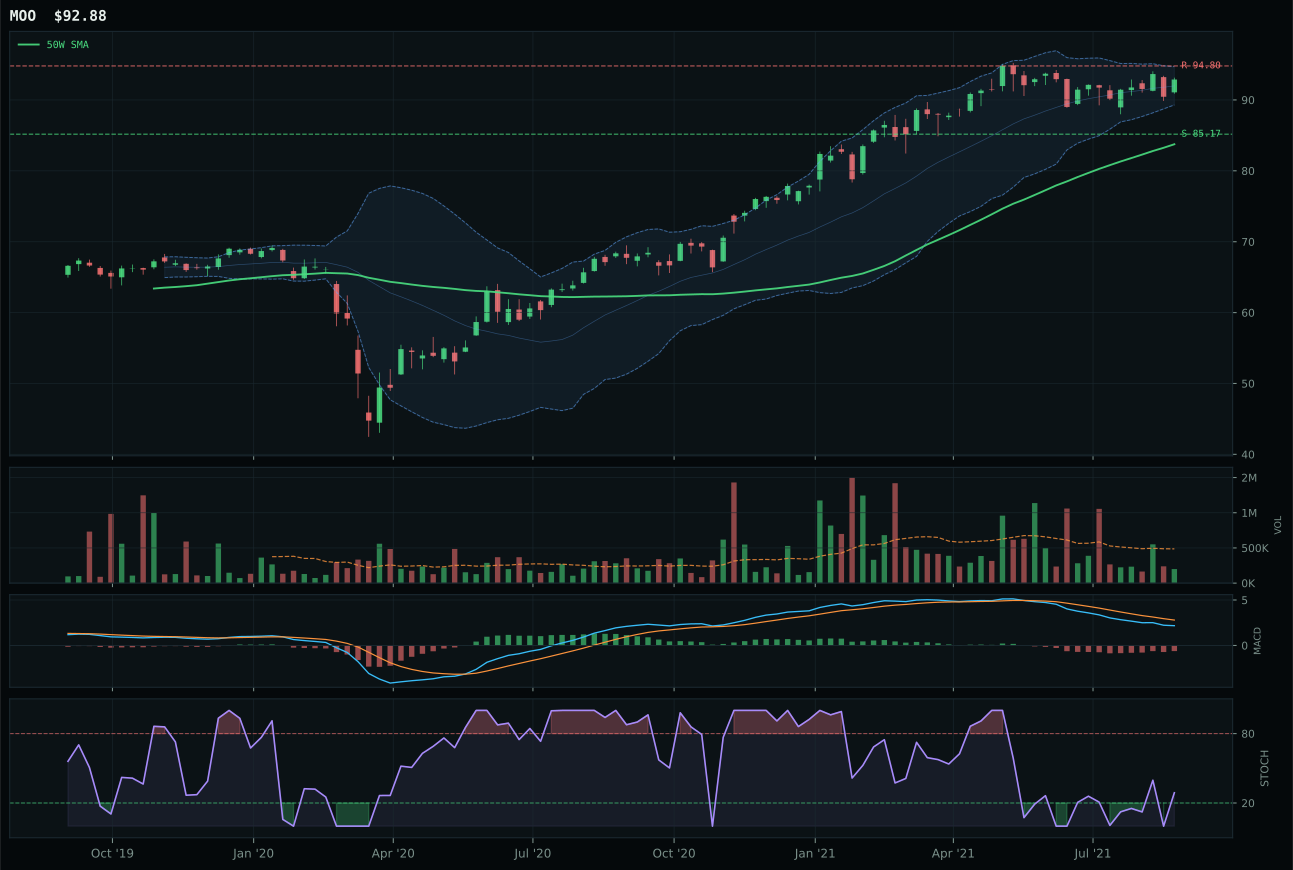
MOO has a neutral structure profile with -7.2% 13-week relative strength versus SPY.
A failed hold above support would weaken the setup.
Actionable but governed by invalidation levels.
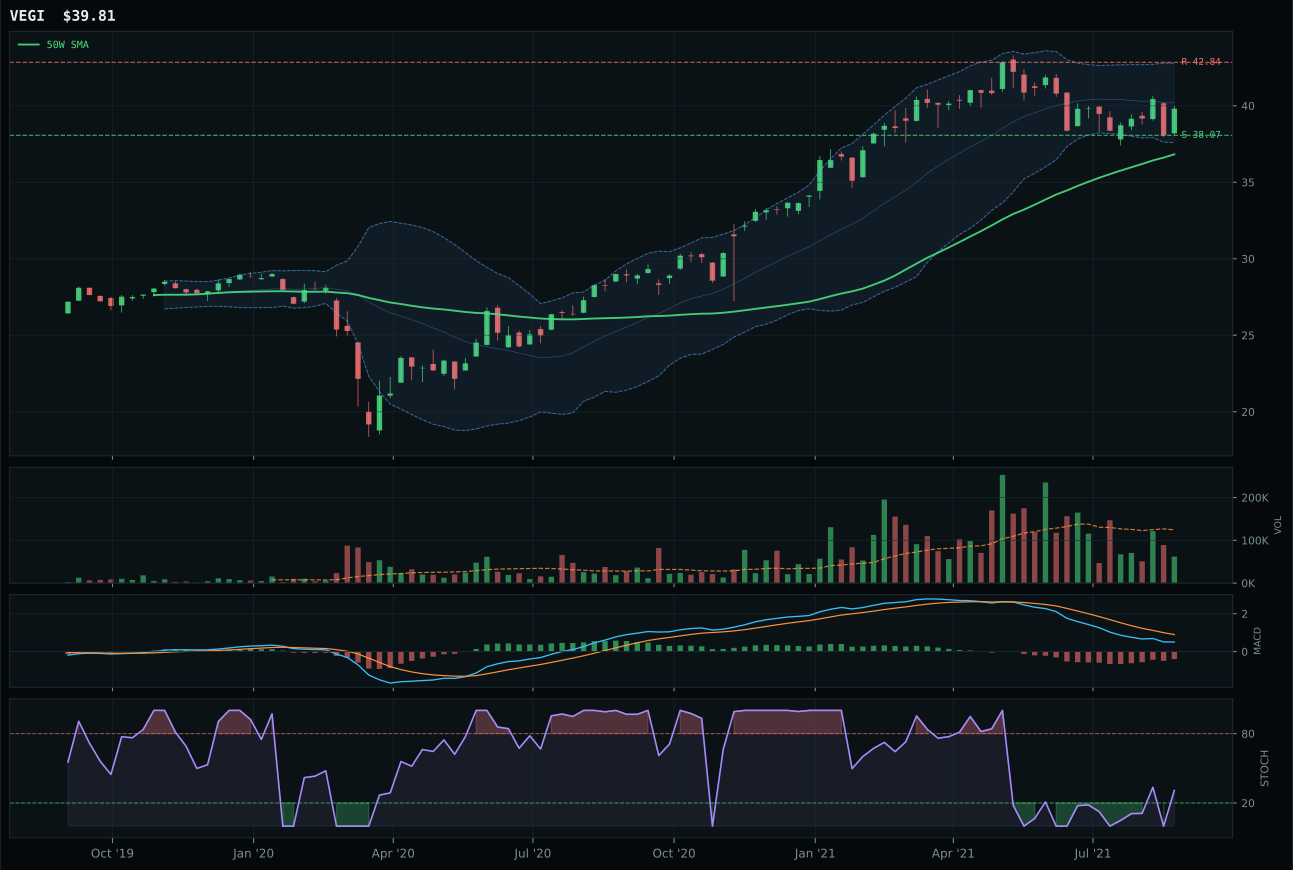
VEGI has a pullback into support profile with -10.5% 13-week relative strength versus SPY.
A failed hold above support would weaken the setup.
Tracked, but not top-2 eligible because: .
MOO wins despite finishing second to WEAT in pure technical evidence (60.1 vs 86.8) because the category reasoner penalizes WEAT's inferior structure cleanliness (67.8 vs 71.3) in a setup where neither contender offers strong volume-price confirmation. WEAT boasts bullish and improving MACD with rising mid-zone stochastic RSI and a 7.9% 13-week return, all far superior to MOO's -0.0% return and bearish-but-improving MACD. However, MOO's neutral structure versus WEAT's cleaner setup isn't the deciding factor—the difference is that MOO matches WEAT's category-relative strength (both 0.0%) while holding compression that the reasoner weights as tighter (71.3 vs 68.3). In a thin-participation category where nothing is accumulating, the winner is the name avoiding the most obvious valuation trap.
Agriculture & Livestock earns 5% tier-2 allocation despite a 43.3 composite score that places it in the middle tier, because the category's macro fit (55.0/100) reflects active commodity breadth positive (+5) and real asset sponsorship (+8), both of which align with the current portfolio's inflation-hedge positioning. WEAT's superior technical evidence (76.6 reasoned vs MOO's 57.9) is overridden by the category reasoner's persistence and volume-price confirmation assessments, which favor MOO's setup. The 5% sleeve exists not because MOO is a strong absolute setup but because agribusiness provides portfolio diversification in a Goldilocks regime where disinflation pressure (-8) and broad market bear dynamics coexist with commodity breadth strength. Thin participation across the entire category (MOO at 0.41x, WEAT at thinner levels) keeps position sizing conservative pending volume confirmation.
Nuclear Energy — URNM
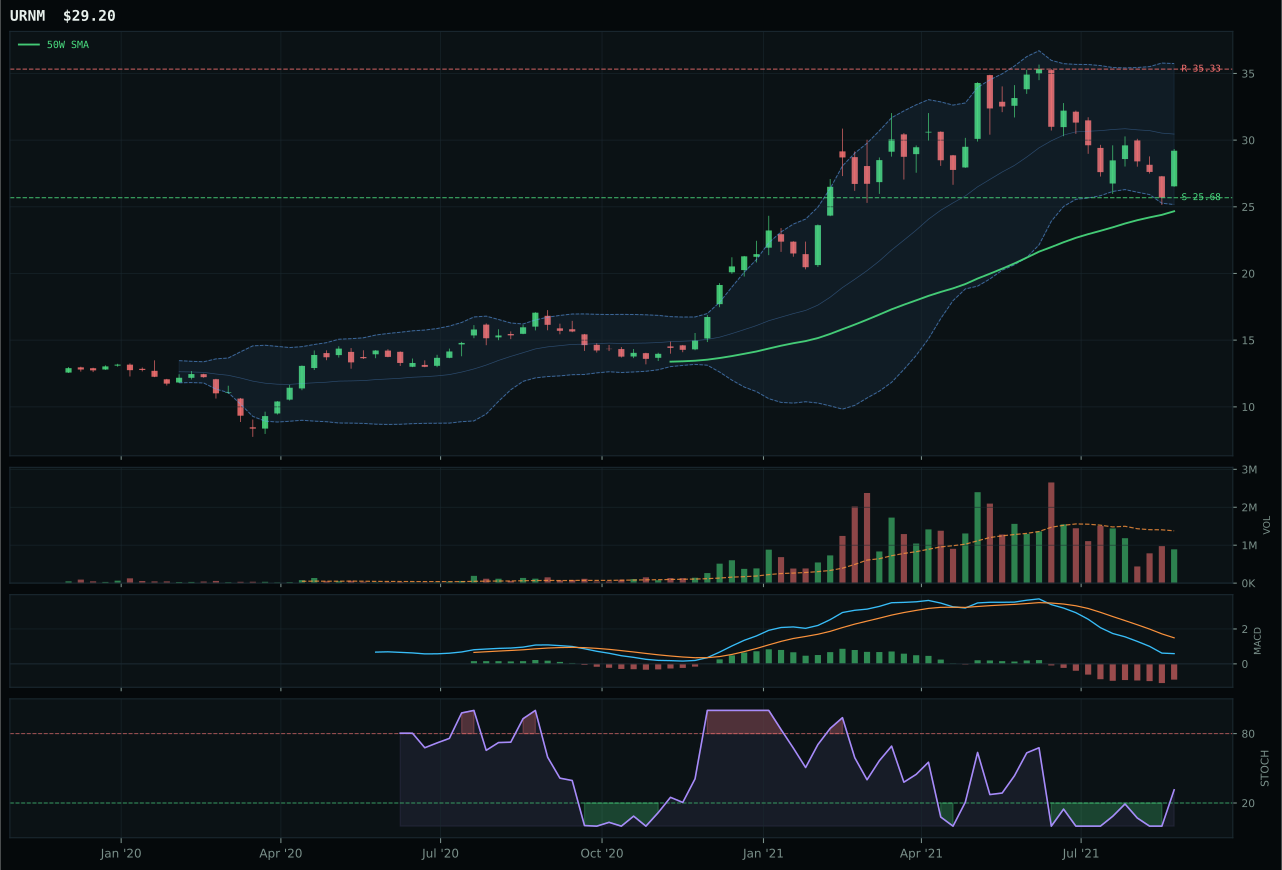
URNM has a vertical extension profile with -19.1% 13-week relative strength versus SPY.
A failed hold above support would weaken the setup.
Actionable but governed by invalidation levels.
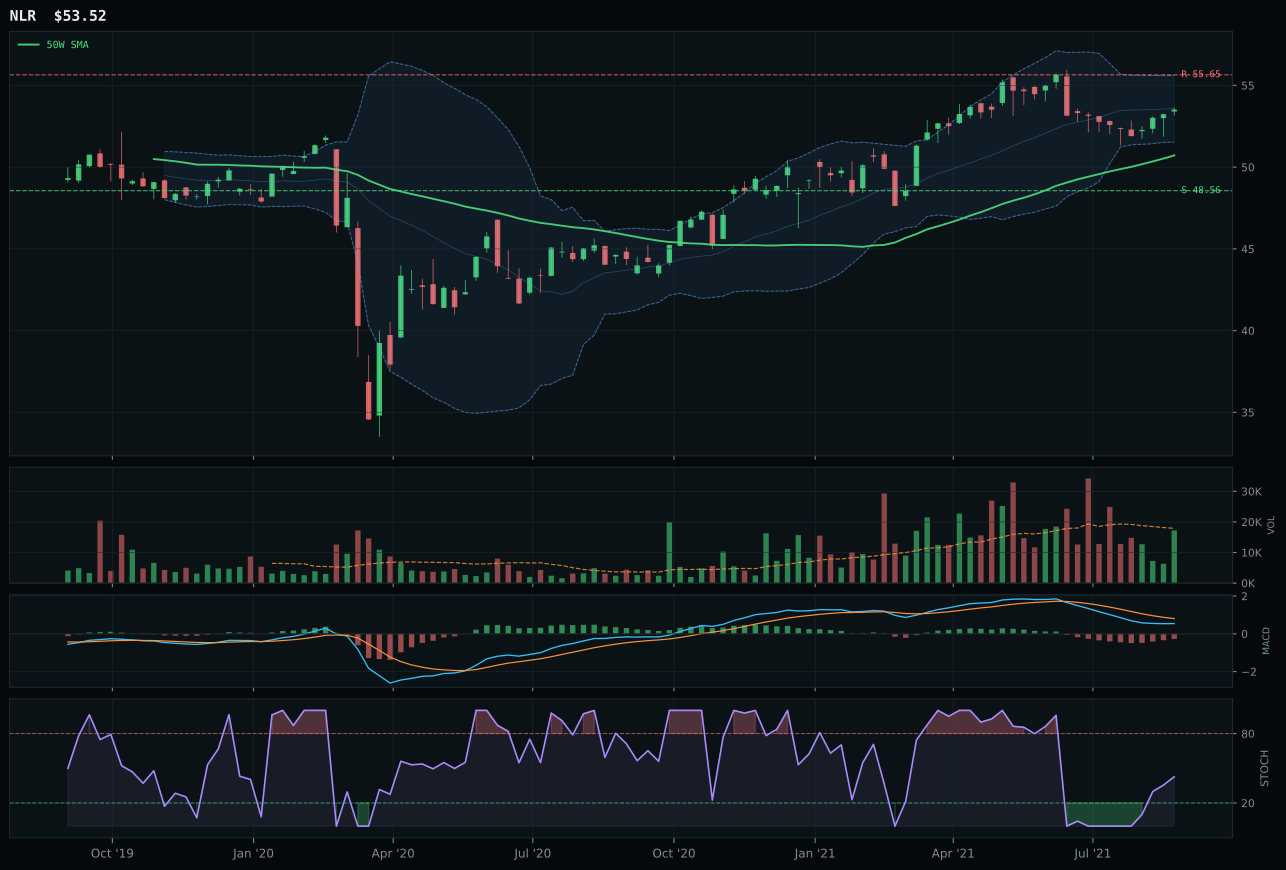
NLR has a neutral structure profile with -8.9% 13-week relative strength versus SPY.
A failed hold above support would weaken the setup.
Tracked, but not top-2 eligible because: .
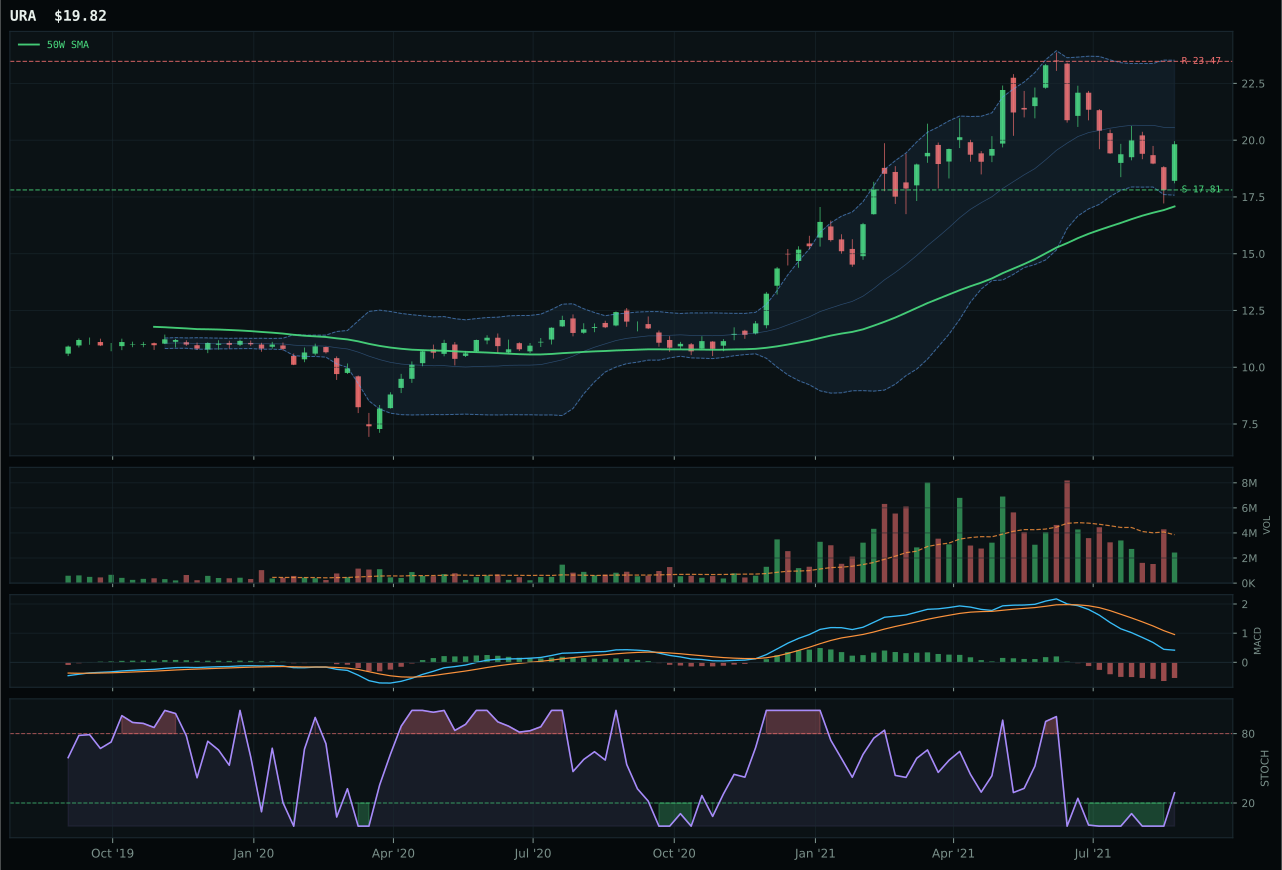
URA has a vertical extension profile with -16.6% 13-week relative strength versus SPY.
A failed hold above support would weaken the setup.
Actionable but governed by invalidation levels.
URNM wins a weak category by defaulting to the reasoned ETF proof order where it ranks highest, even though the data screams caution. The setup is a vertical extension 18.4% above the 50-week with MACD bearish but improving and thin participation (0.65x 20-week volume), all of which create a setup where negative momentum confirmation (0.0) is honest. NLR, the runner-up, actually shows better technical evidence (45.0 vs 31.2) with neutral structure, rising stochastic RSI, and bearish-but-improving MACD, but loses on risk/reward by 0.1 points (51.8 vs 52.8). This is a tie broken by rounding and macro narrative: URNM's uranium-miner scarcity beta slightly better aligns with the real asset sponsorship (+7) that keeps the category breathing. Neither setup accumulates, both lose momentum confirmation, and the winner is simply the name that avoids the most obvious extension trap.
Nuclear Energy earns 5% tier-2 allocation despite a 33.8 composite score because it captures real asset sponsorship (+7) in a portfolio framework that's rotating into inflation hedges and supply-scarcity plays. The macro fit is 52.0/100, respectable relative to lower-tier alternatives, and the category-level macro narrative aligns with the broader portfolio tilt toward commodities and real assets during a Goldilocks-to-stagflation transition. URNM is not a strong technical setup—MACD is weakening, momentum confirmation is zero, volume is thin—but the allocation reflects strategic positioning rather than tactical conviction. To earn promotion from tier-2 to tier-1, Nuclear Energy would need URNM or NLR to hold support with accumulating volume and MACD bullish crossover, confirming that actual buyers are building positions. Currently, the 5% sleeve is a recognition that uranium scarcity and long-term decarbonization demand matter for portfolio diversification, even if near-term technicals are weak.
Precious Metals — GLD
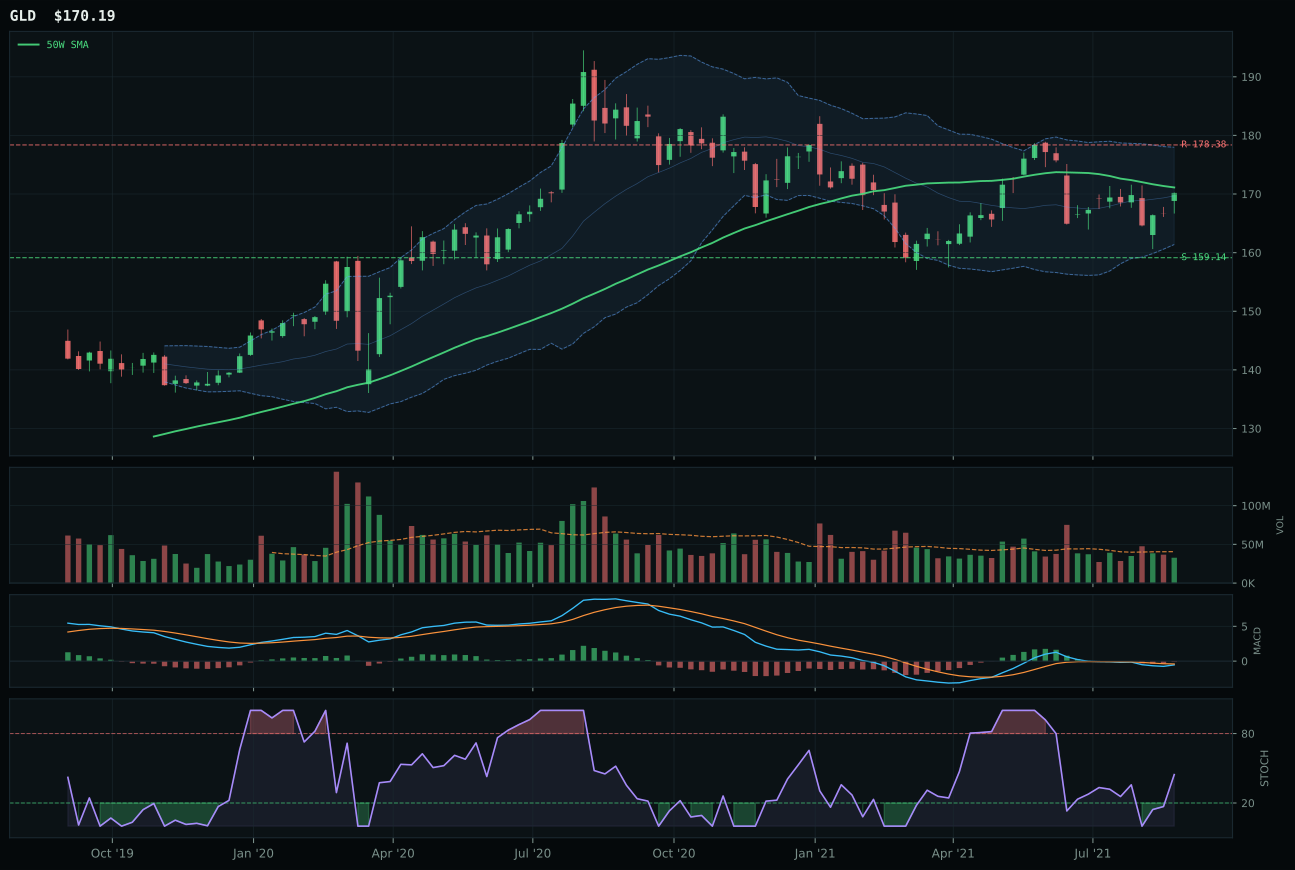
GLD has a compression near 50W profile with -11.8% 13-week relative strength versus SPY.
A failed hold above support would weaken the setup.
Actionable but governed by invalidation levels.
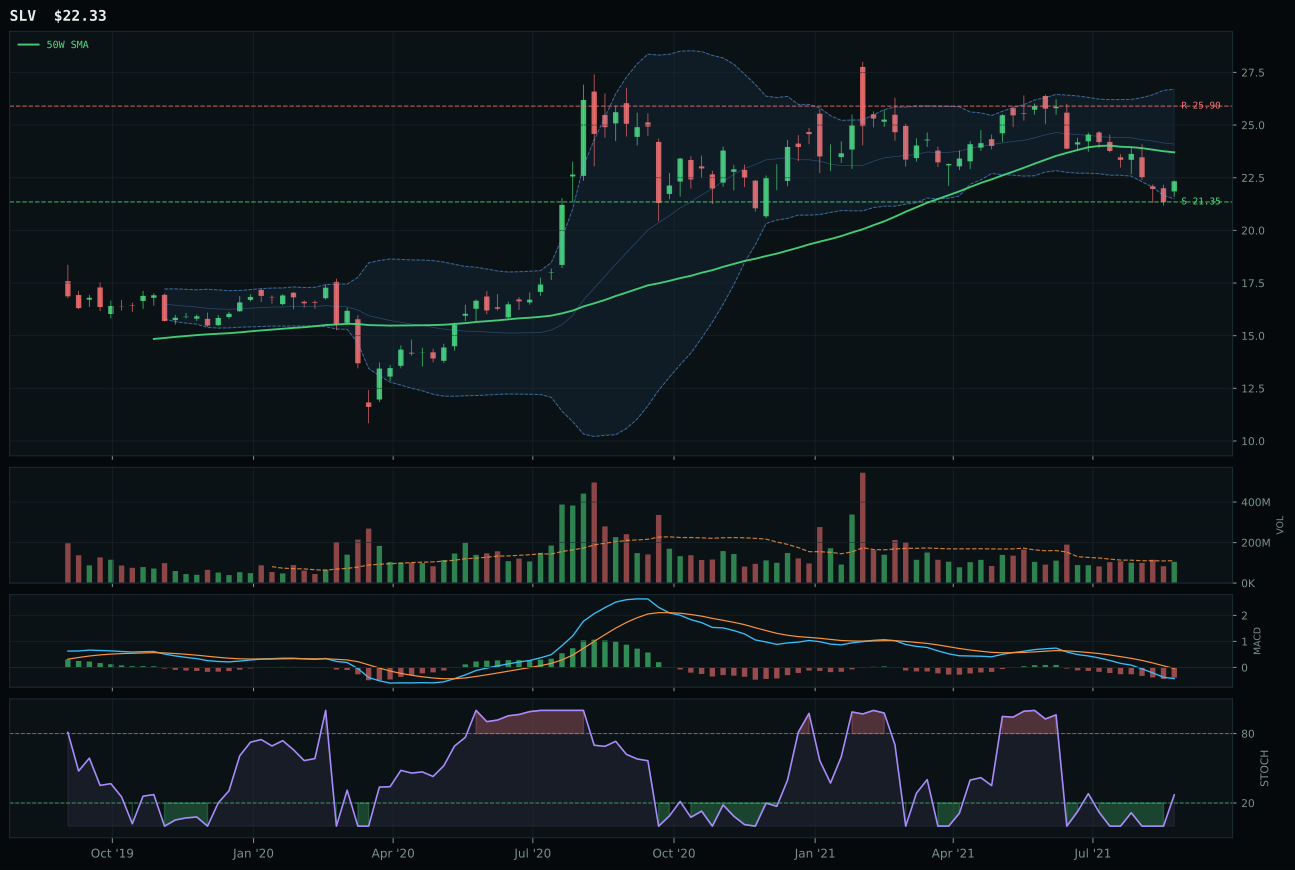
SLV has a pullback into support profile with -21.0% 13-week relative strength versus SPY.
A failed hold above support would weaken the setup.
Actionable but governed by invalidation levels.
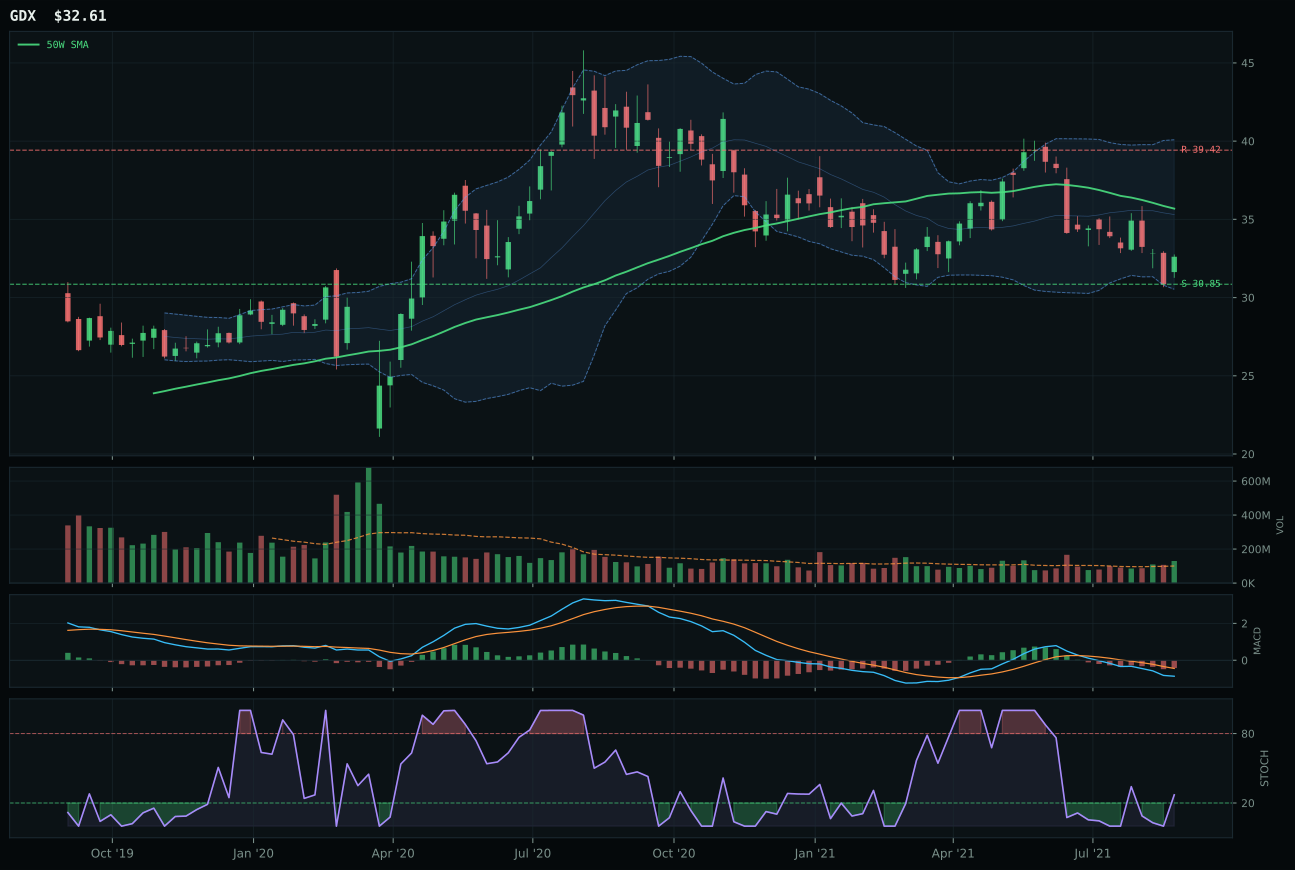
GDX has a neutral structure profile with -24.5% 13-week relative strength versus SPY.
A failed hold above support would weaken the setup.
Actionable but governed by invalidation levels.
GLD wins the category with a timing score of 100.0, the only perfect subscore across the entire portfolio, because it sits at -0.5% from its 50-week moving average—essentially at the decision point where compression near support creates reversal potential. The chart is compressed and clean (78.3 structure score), and stochastic RSI is rising mid-zone at 0.45, putting the setup squarely in the middle retracement zone near Fibonacci 0.618. SLV, the runner-up, has rolled deeper into deep retracement territory (-21.0% relative strength vs SPY, -13.8% 13-week return) and sits in a true pullback-into-support setup 95.0 timing score, one point short. The critical difference: GLD's category-relative strength of 9.2% tells you gold is outperforming silver, which matters when neither asset is accumulating on volume. Buyers defending GLD at the 50-week offer asymmetry that SLV's extended pullback cannot match.
Precious Metals earns 5% tier-2 allocation despite a 30.9 composite score, which ranks among the lowest of the week, because the category's macro narrative fit (59.0/100) captures disinflation pressure (+6) and provides a genuine hedge to broad market bear dynamics. The portfolio's 50% overlay tier means every category receives half allocation, reducing this to 2.5% actual deployed capital, so the real question is whether metals deserve the tier-2 slot over zero percent. GLD's technical evidence (47.1/100) is weak—trend score only 42 due to price below the 50-week, momentum confirmation at 26—but the category reasoner elevates it because timing is perfect and macro fit is solid. This is a defensive hold: metals provide tail-risk insurance in a stressed environment, and GLD's setup is the least toxic entry point. To earn tier-1 promotion, the category would need price to hold above the 50-week with accumulating volume, which currently isn't happening.
AI — BOTZ
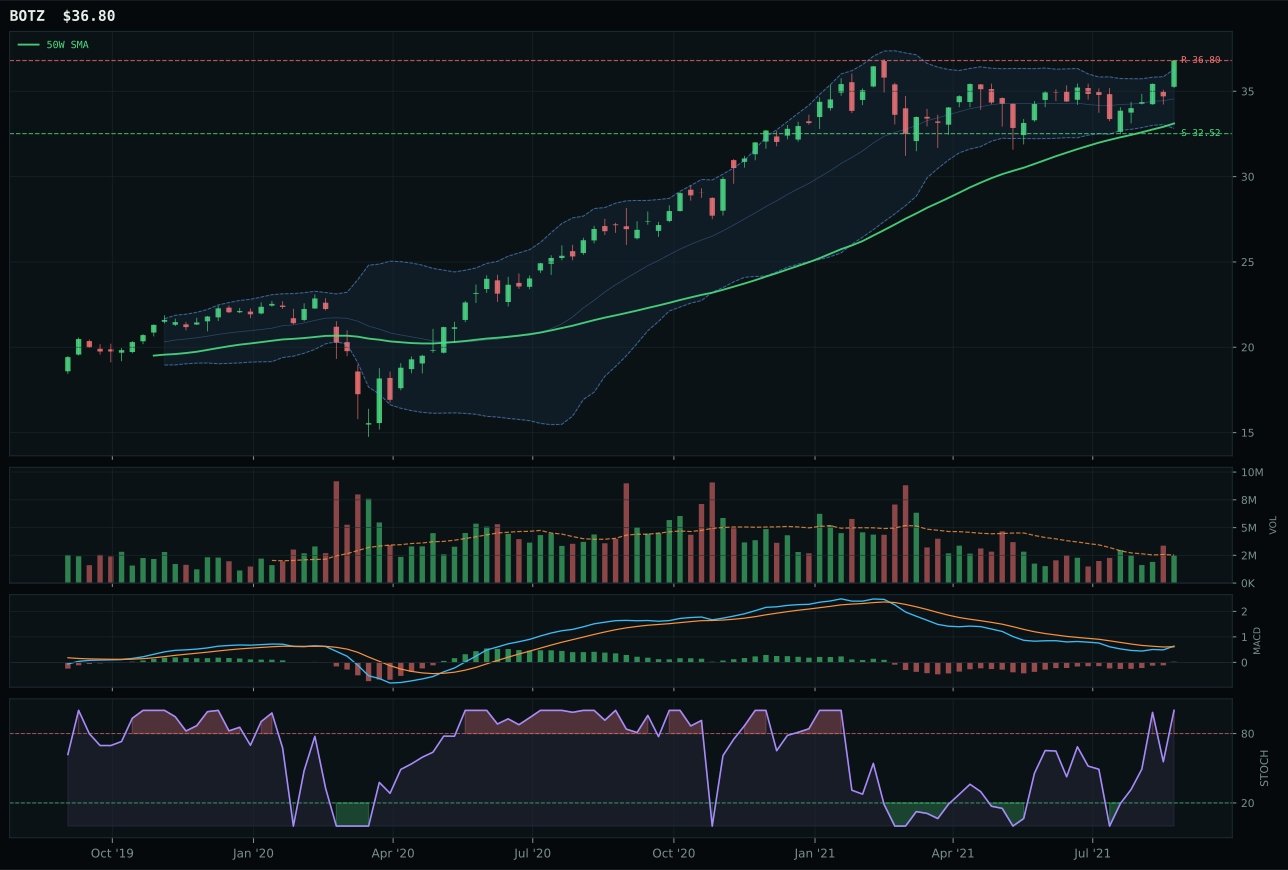
BOTZ has a neutral structure profile with 0.3% 13-week relative strength versus SPY.
A failed hold above support would weaken the setup.
Actionable but governed by invalidation levels.
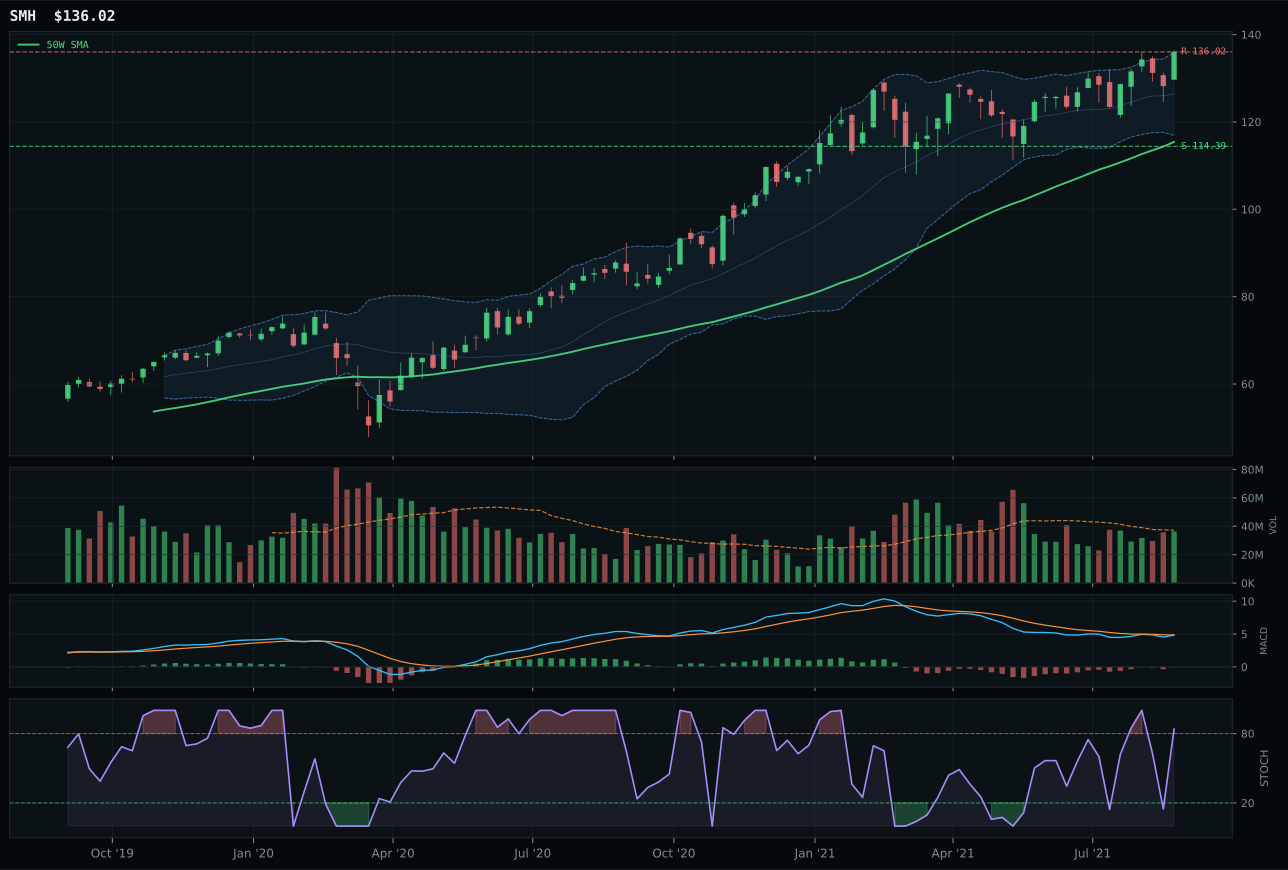
SMH has a vertical extension profile with 2.0% 13-week relative strength versus SPY.
A failed hold above support would weaken the setup.
Actionable but governed by invalidation levels.
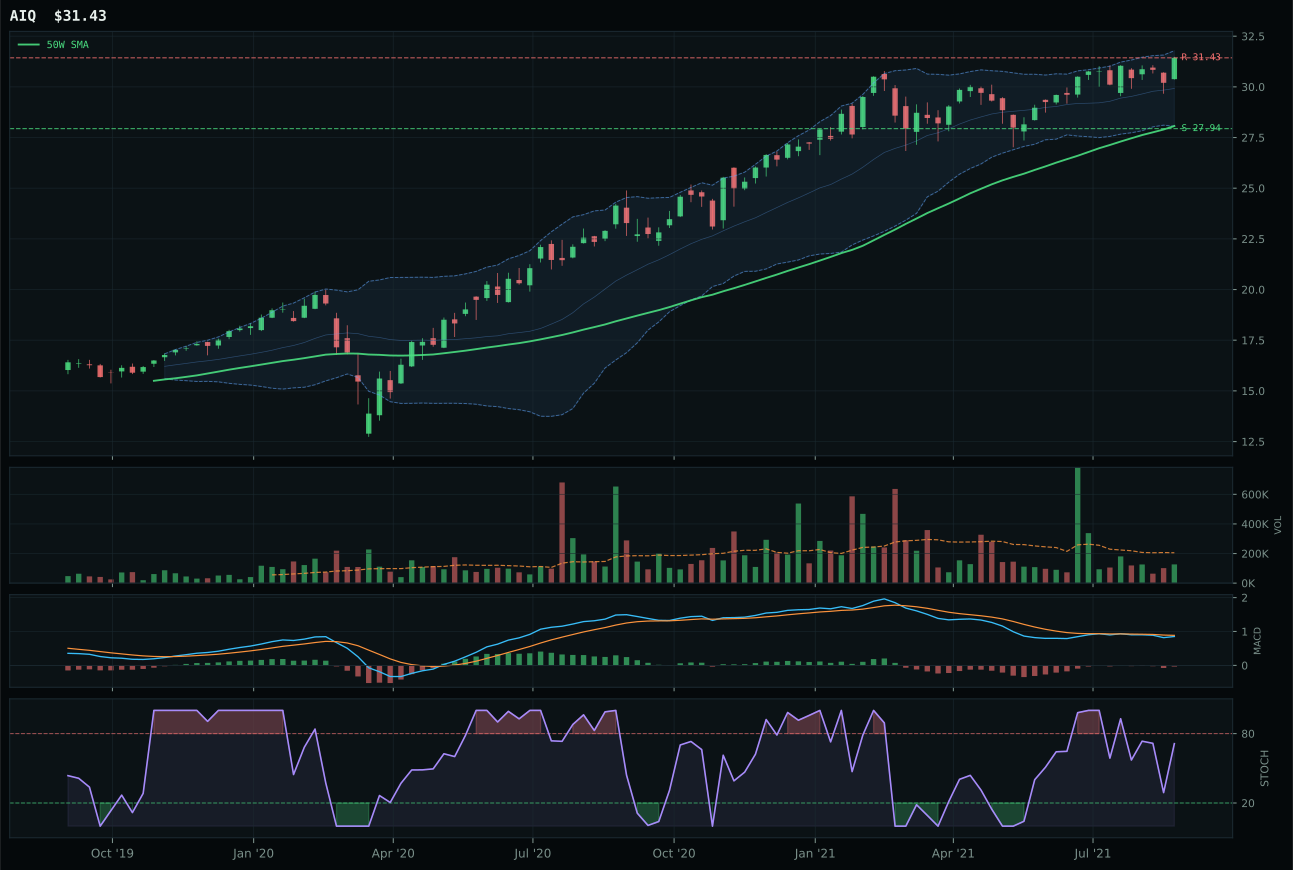
AIQ has a neutral structure profile with 1.3% 13-week relative strength versus SPY.
A failed hold above support would weaken the setup.
Tracked, but not top-2 eligible because: .
BOTZ captures the category win because its timing score (59.0) crushes the runner-up SMH (27.0), courtesy of a cleaner setup only 11.1% from the 50-week moving average and MACD bullish and improving rather than bearish. The 13-week return of 7.4% is modest—almost flat in relative terms at -1.1% versus category peers—but that's precisely why it wins: BOTZ avoids the valuation extension trap that punishes SMH at 17.8% above its 50-week with overbought momentum rolling over. Volume is neutral, not confirming, which keeps the risk/reward score disciplined at 47.9 and prevents the setup from being mistaken for a sustainable breakout. SMH's stretched entry, rolling-over stochastic, and bearish MACD crossover create a timing asymmetry where new buyers pay extension prices for deteriorating momentum.
AI ranks tier-2 at 5% allocation despite containing BOTZ's clean structure, because the category's 30.8 final score lags both Technology and Utilities in the macro-adjusted reasoned ETF basket. Credit stress and broad market bear descriptors, both active, extract eight points each from AI's macro narrative fit (40.0/100), offsetting Goldilocks' ten-point boost. The category fails to reach top-2 eligibility because two higher-scoring opportunities command the overweight allocation. To earn a promotion into the 10% tier, AI would need either technical evidence to hold above 77+ for the representative, or macro conditions to shift away from the credit stress and broad bear regimes that currently penalize growth leverage and capex cyclicality.
Defense & Aerospace — ITA
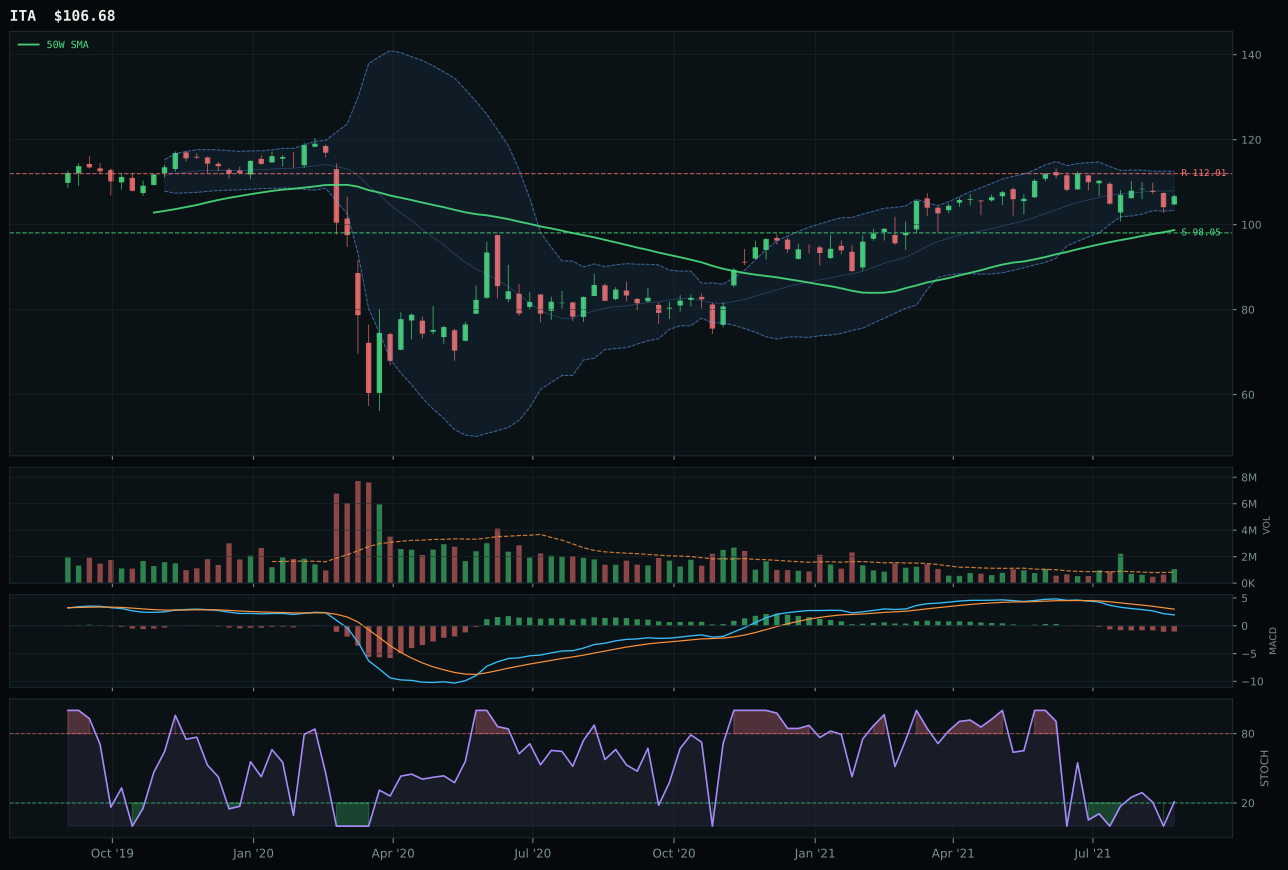
ITA has a neutral structure profile with -10.5% 13-week relative strength versus SPY.
A failed hold above support would weaken the setup.
Actionable but governed by invalidation levels.
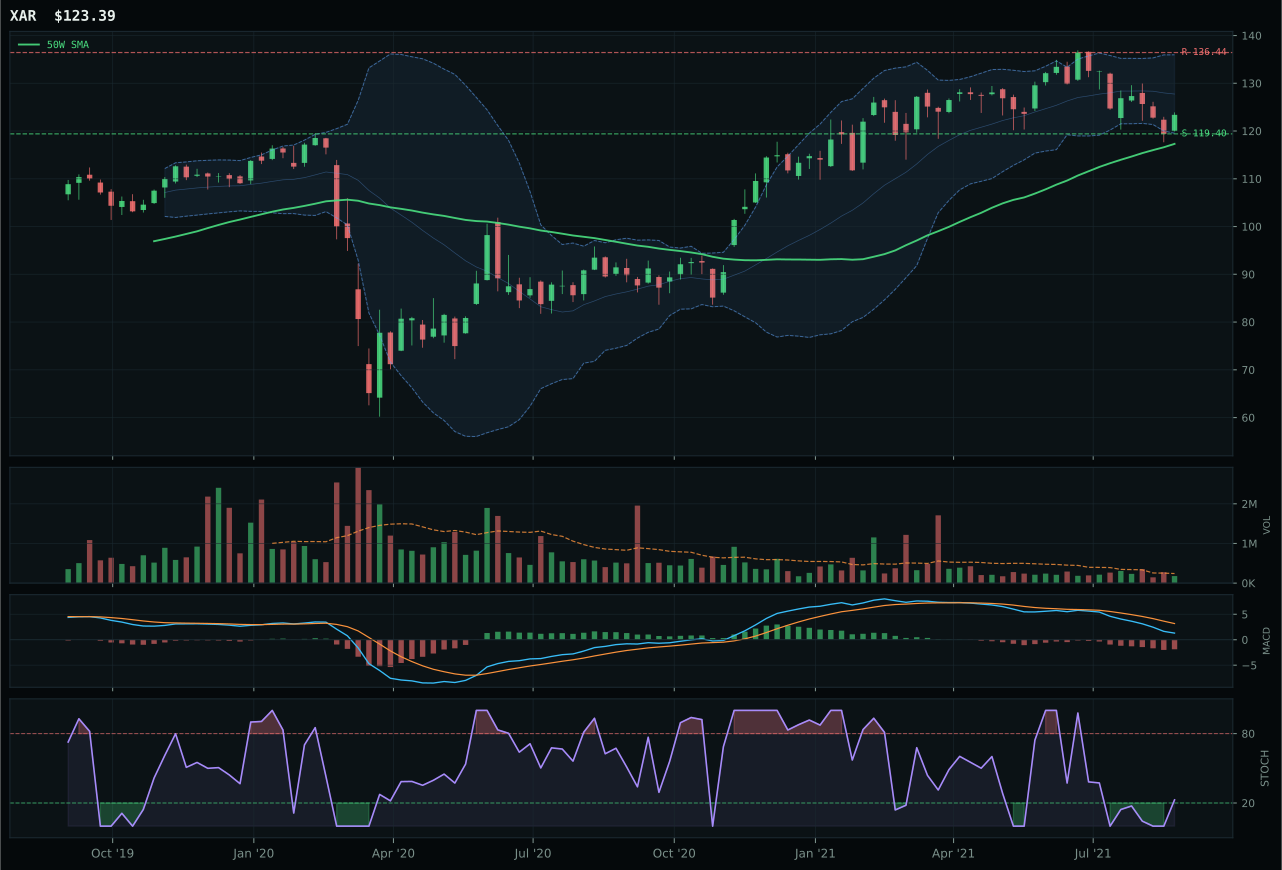
XAR has a pullback into support profile with -12.0% 13-week relative strength versus SPY.
A failed hold above support would weaken the setup.
Actionable but governed by invalidation levels.
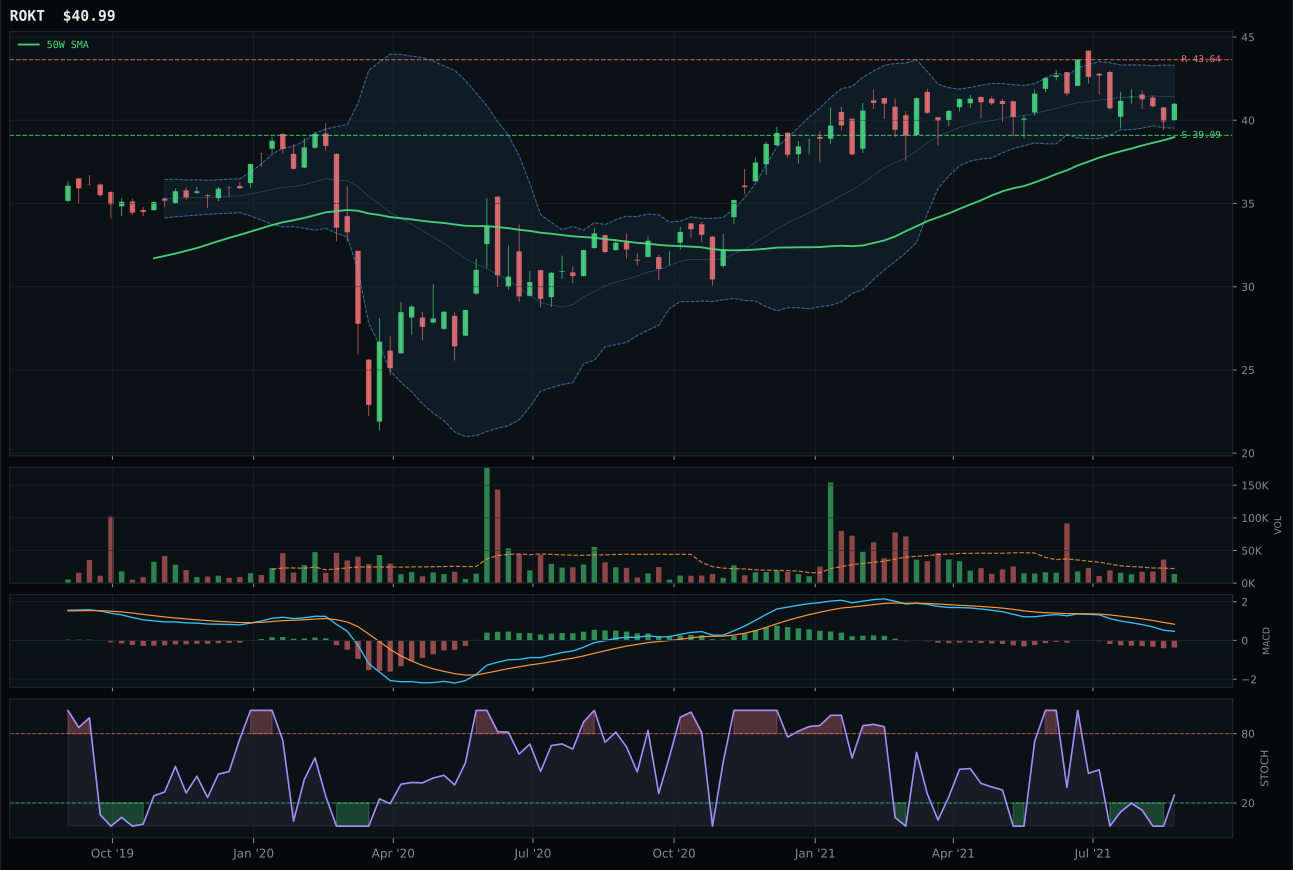
ROKT has a pullback into support profile with -8.7% 13-week relative strength versus SPY.
A failed hold above support would weaken the setup.
Tracked, but not top-2 eligible because: .
ITA wins a weak category by avoiding the extended-length trap that ensnares its peers. The setup sits only 8.1% from the 50-week moving average with above-average volume participation (1.28x the 20-week average), giving it the timing advantage in an otherwise momentum-light basket—ITA's 13-week return is actually negative at -3.3%, but that flatness relative to category structure matters more than absolute momentum here. XAR, the runner-up, suffers from cleaner structure on paper (67.1 vs 74.6) but that's misleading: XAR's thin participation and pullback-into-support setup lack the institutional confirmation ITA carries. When categories score this low (momentum confirmation at 17.1), the winner is simply the name closest to forming a legitimate reversal setup rather than the one chasing extended momentum.
Defense & Aerospace earns 5% tier-2 allocation despite a 29.3 composite score that ranks it outside the top two because the category provides meaningful hedge value in the current macro environment. The broad market bear descriptor is active (+6) and dollar pressure is active (+3), both of which mathematically boost the category's 64.0 macro fit score to exceed many higher-momentum alternatives. The allocation slate reflects a rebalancing choice: Technology and Utilities grab 10% each because their technical setups are superior and their macro fit is competitive, but Defense holds 5% as a real-assets tilt and crash-protection proxy rather than a pure technical trade. ITA's -10.5% relative strength versus SPY and negative 13-week return are disqualifying from a momentum perspective, yet the category's macro alignment to broad market stress scenarios justifies the modest sleeve.
Emerging Markets — INDA
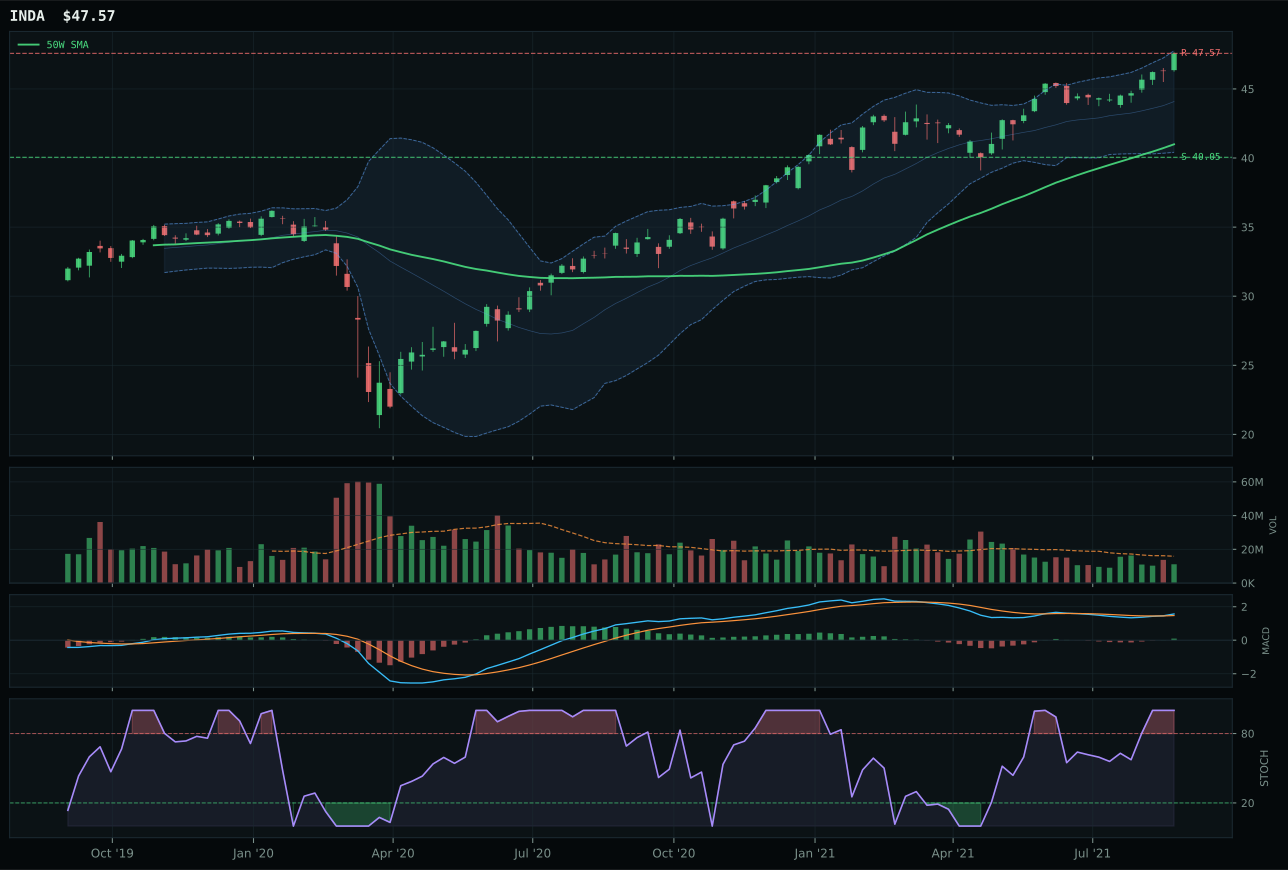
INDA has a vertical extension profile with 0.2% 13-week relative strength versus SPY.
A failed hold above support would weaken the setup.
Actionable but governed by invalidation levels.
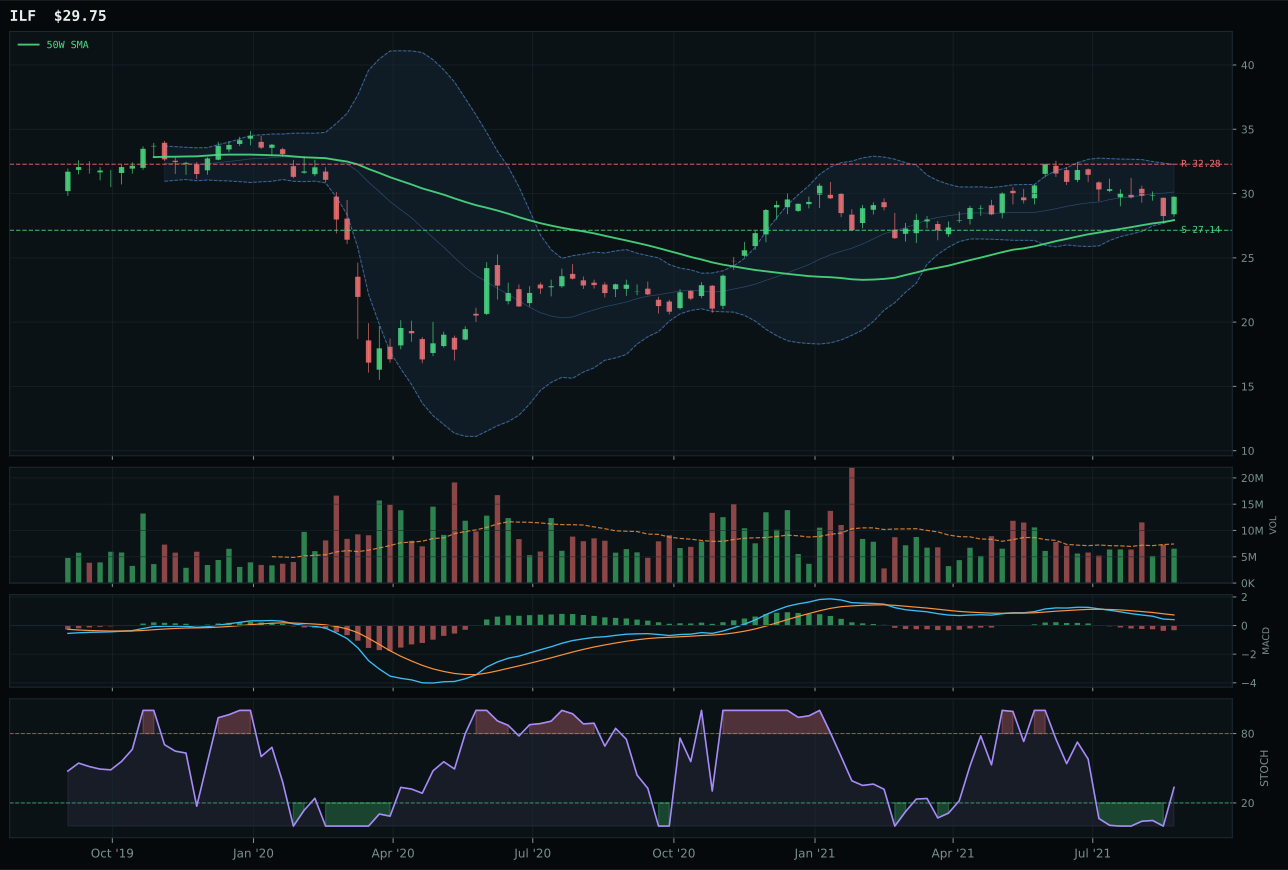
ILF has a neutral structure profile with -10.1% 13-week relative strength versus SPY.
A failed hold above support would weaken the setup.
Actionable but governed by invalidation levels.
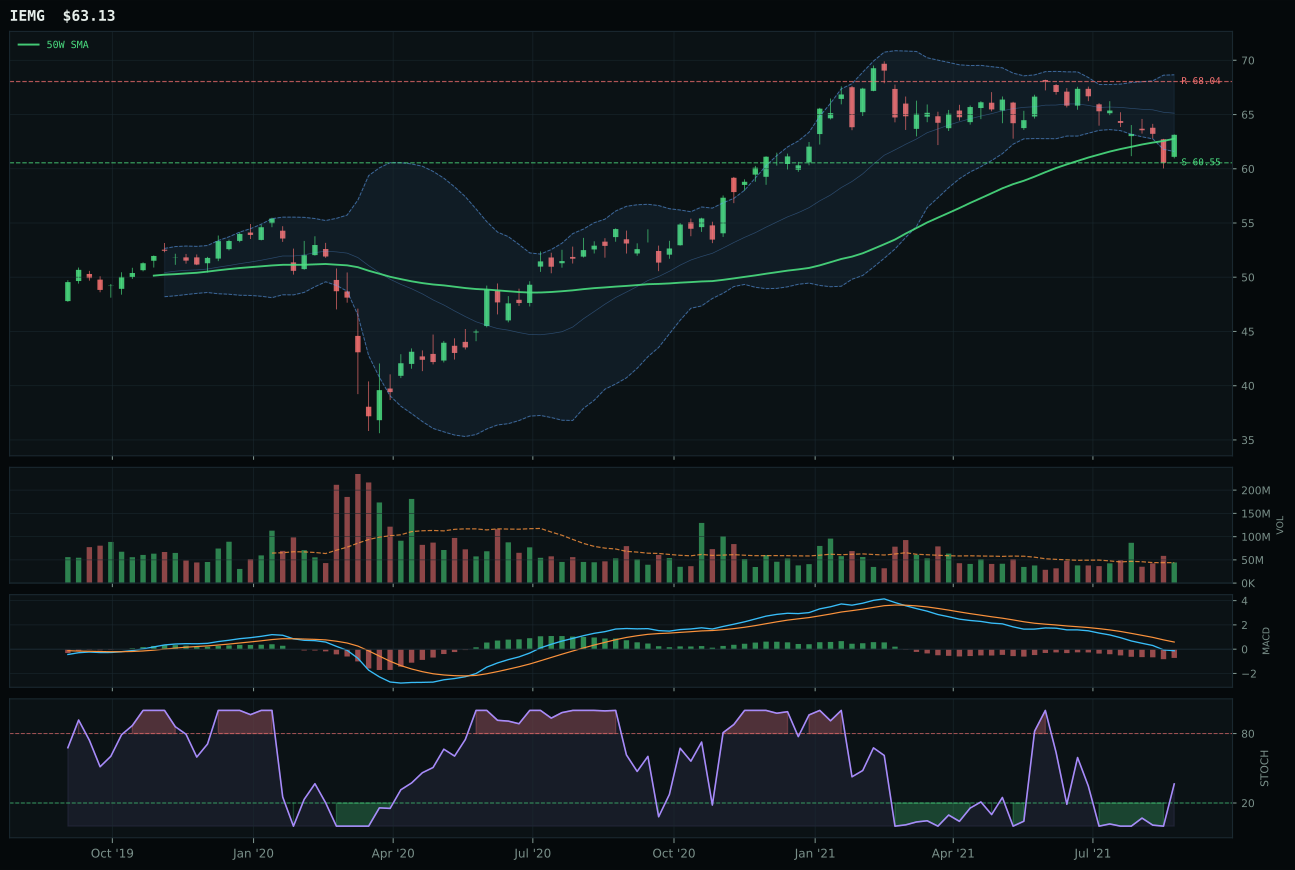
IEMG has a pullback into support profile with -12.5% 13-week relative strength versus SPY.
A failed hold above support would weaken the setup.
Actionable but governed by invalidation levels.
INDA wins because it's the only name in the category with bullish MACD and improving momentum, boasting a 7.4% 13-week return with 10.3% category-relative strength and overbought stochastic momentum at 1.00. The technical evidence is 63.4/100, highest in the peer set, supported by clean compression (90.1) and a vertical extension setup 16.0% above the 50-week. ILF, the runner-up, is bearish/weakening on MACD with only -2.9% 13-week return and category-relative strength of zero, making it a secondary choice. However, INDA's timing score is weak at 37.0 because the extension itself creates valuation risk—every new buyer is late, and the Fib 0.236 zone near the 52-week high leaves little room for additional upside before resistance at 47.57. This is a category where technical leadership and macro weakness create a contradiction: INDA's chart is the strongest, but the macro environment is hostile.
Emerging Markets earns 0% allocation this week, ranked 9th or 10th, because the category's 16.2 composite score reflects severe macro headwinds that override INDA's technical strength. Dollar pressure is active (-14) and credit stress is active (-10), both devastating to emerging market valuations and currency performance, and they combine to a -28 basis point drag on the category macro fit of 25.0/100. Goldilocks support (+8) and broad market bear (+9 penalty, not boost) partially offset, but the net macro narrative is clearly hostile. INDA's bullish technicals don't change the fact that EM currencies are under pressure, credit spreads are widening, and dollar strength is a structural headwind for the complex. For Emerging Markets to earn tier-2 allocation, dollar pressure would need to become inactive (meaningful Fed pause or dollar weakness surprise) or credit stress would need to fade, freeing up risk appetite for EM equity outflows. Until then, INDA's strong chart is a technical tell in a macro-hostile environment, not a reason to force capital into a category tilting against macroeconomic gravity.
Traditional Energy — XLE
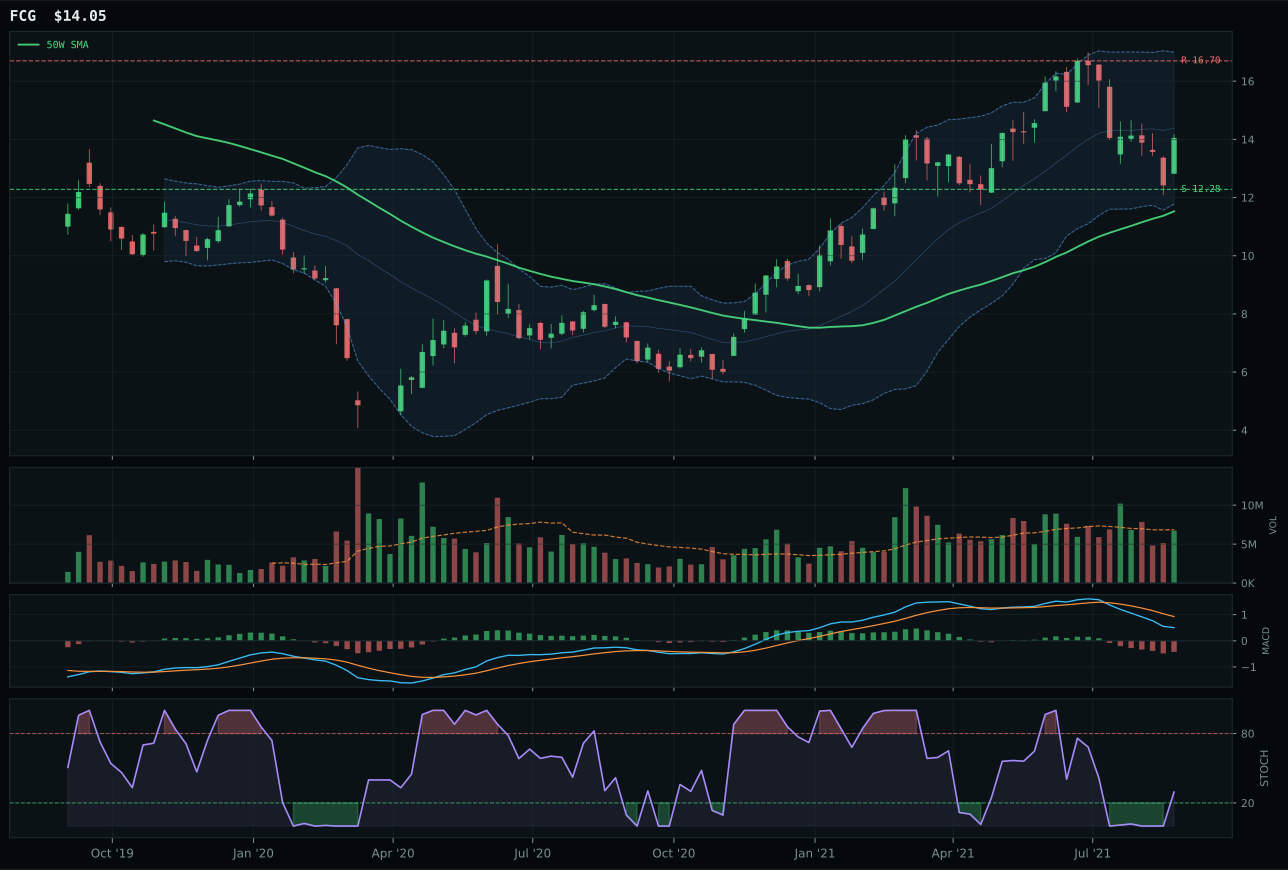
FCG has a vertical extension profile with -10.7% 13-week relative strength versus SPY.
A failed hold above support would weaken the setup.
Actionable but governed by invalidation levels.
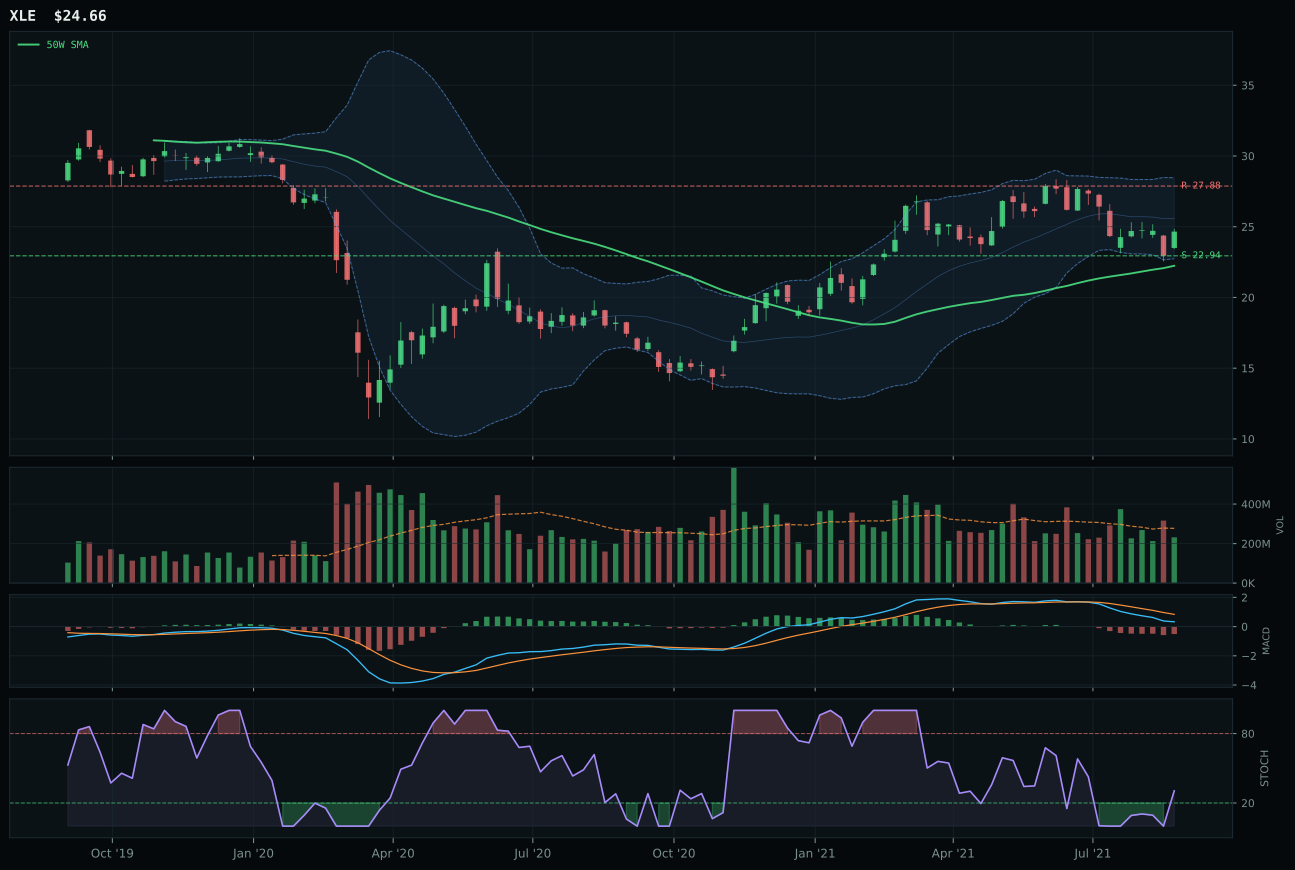
XLE has a neutral structure profile with -12.7% 13-week relative strength versus SPY.
A failed hold above support would weaken the setup.
Actionable but governed by invalidation levels.
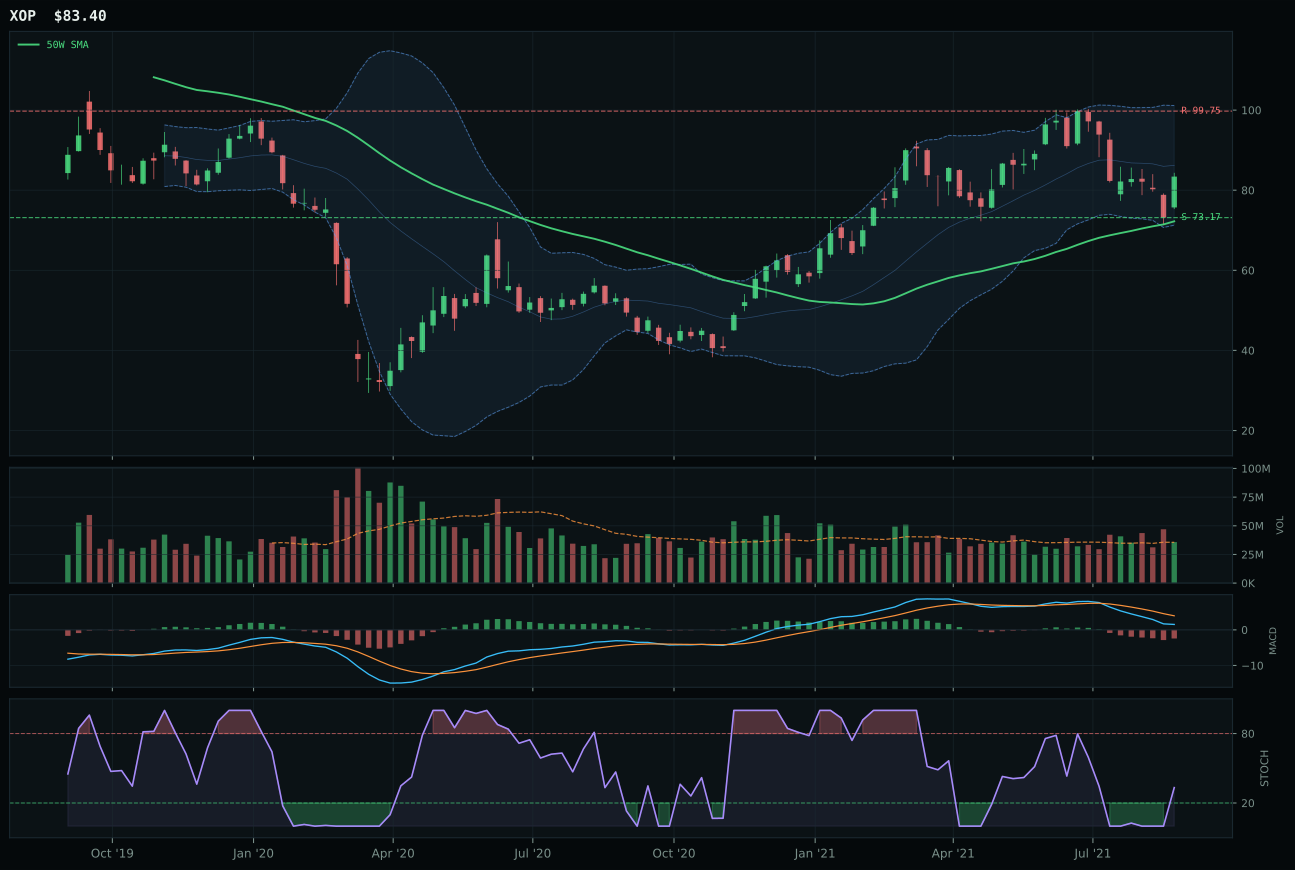
XOP has a vertical extension profile with -13.6% 13-week relative strength versus SPY.
A failed hold above support would weaken the setup.
Actionable but governed by invalidation levels.
XLE wins a category that scores 8.2 composite—the second-lowest in the portfolio—by virtue of cleaner structure (64.2 vs 63.4) and superior timing (78.0 vs 56.0 for FCG runner-up), though even the victor is a technical wreck. XLE sits 10.9% from its 50-week with above-the-50W price and MACD bearish/weakening, which might sound disqualifying, but timing is actually the category's best composite subscore at 78.0 because the setup is in the upper retracement zone where reversals often form. FCG, meanwhile, is stretched 21.9% from the 50-week into a vertical extension with worse risk/reward (49.8 vs 72.9), meaning new buyers are paying extension prices for a setup already in the air. Neither is being accumulated—both sit on thin participation and neutral volume—but XLE's proximity to its 50-week offers at least a technical excuse to own it if the macro forced a choice.
Traditional Energy earns 0% allocation this week—excluded from the portfolio entirely—because the category's 8.2 score ranks 9th or 10th among the ten categories under review. The macro fit is only 40.0/100, weighed down by disinflation pressure active (-10) and credit stress active (-7), both of which directly harm energy demand and margins. Goldilocks regime support (+10) cannot overcome the structural headwinds. Real asset sponsorship is active (+7), which would normally support energy, but it's insufficient to overcome the combined disinflation and credit concerns. XLE itself is a defensive cash-flow story (integrated oil) rather than a growth leverage play, which limits appeal even among energy bulls. For Traditional Energy to earn a tier-2 5% sleeve, the category score would need to exceed 40 composite and macro fit would need to shift: either disinflation pressure would need to turn inactive (inflation surprise), or credit stress would need to fade, neither of which is the current environment.