
2021-08-20
Informational purposes only. The content in this report, including allocations, analysis, and commentary, is provided solely for informational and educational purposes. It does not constitute financial advice, investment advice, trading advice, or any other type of advice. Past performance does not guarantee future results. Always conduct your own research and consult a qualified financial professional before making investment decisions.
Weekly Allocation
| Ticker | Category | Weight | Role |
|---|---|---|---|
| FSOL | 50% | Overlay | |
| XLK | Technology | 10% | Top-2 (10%) |
| COPX | Industrial Metals | 10% | Top-2 (10%) |
| XLU | Utilities & Infrastructure | 5% | Tier-2 (5%) |
| BOTZ | AI | 5% | Tier-2 (5%) |
| WEAT | Agriculture & Livestock | 5% | Tier-2 (5%) |
| URA | Nuclear Energy | 5% | Tier-2 (5%) |
| ITA | Defense & Aerospace | 5% | Tier-2 (5%) |
| SLV | Precious Metals | 5% | Tier-2 (5%) |
Trade Instructions — Monday Open
Sell the tranche from 2021-07-23 (completing its 4-week hold). Buy the new tranche. Instructions show net portfolio changes — same-asset positions cancel, weight changes show the delta.
| Action | Ticker | Instruction |
|---|---|---|
| SELL | FBTC | Sell entire FBTC position (12.50% of portfolio) |
| SELL | SMH | Sell 25% of SMH position (reduce 5.00% → 3.75%) |
| SELL | GLD | Sell 33% of GLD position (reduce 3.75% → 2.50%) |
| SELL | URNM | Sell 25% of URNM position (reduce 5.00% → 3.75%) |
| BUY | FSOL | Buy FSOL — 76.92% of freed cash (adds 12.50% to portfolio) |
| BUY | BOTZ | Buy BOTZ — 7.69% of freed cash (adds 1.25% to portfolio) |
| BUY | URA | Buy URA — 7.69% of freed cash (adds 1.25% to portfolio) |
| BUY | SLV | Buy SLV — 7.69% of freed cash (adds 1.25% to portfolio) |
Current Portfolio After Trade
Combined holdings across all 4 active tranches. Each tranche is 25% of the portfolio.
| Ticker | % of Portfolio | Weight Bar |
|---|---|---|
| FSOL | 50.00% | |
| COPX | 6.25% | |
| ITA | 5.00% | |
| IGV | 5.00% | |
| SMH | 3.75% | |
| XLU | 3.75% | |
| URNM | 3.75% | |
| WEAT | 3.75% | |
| GLD | 2.50% | |
| REMX | 2.50% | |
| CIBR | 2.50% | |
| PAVE | 2.50% | |
| XLK | 2.50% | |
| ILF | 1.25% | |
| GDX | 1.25% | |
| BOTZ | 1.25% | |
| URA | 1.25% | |
| SLV | 1.25% |
Macro Regime — Goldilocks
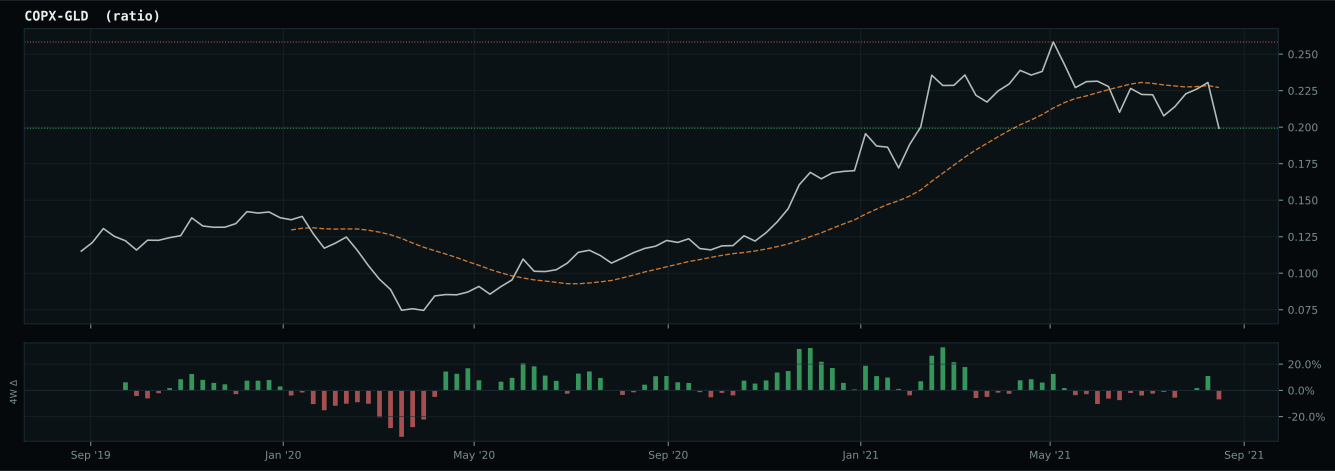
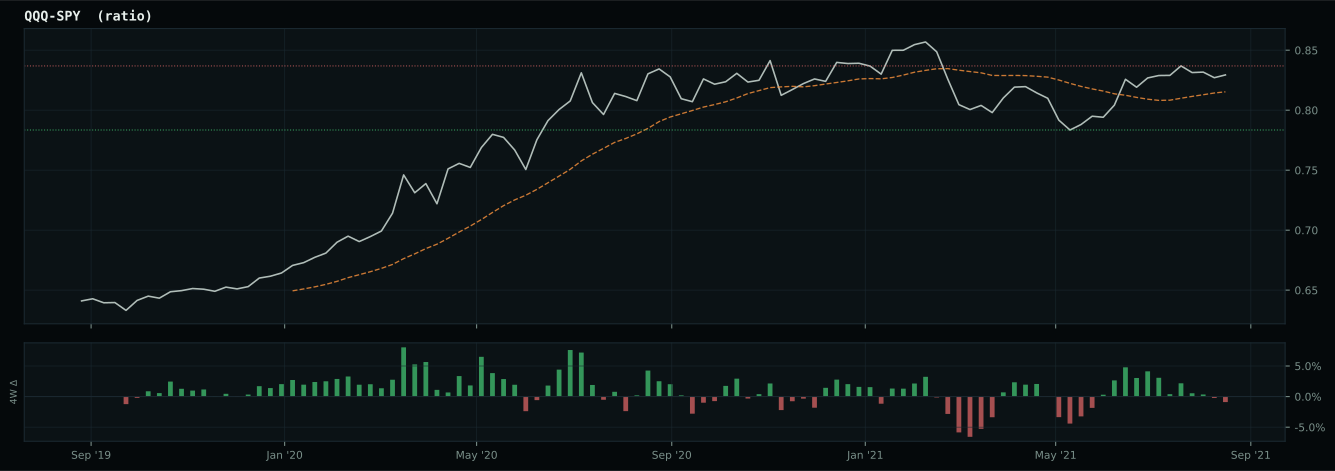
Macro Evidence Charts
Market-implied signals behind the macro regime scores. Each ratio compares two assets; the direction and slope of the ratio is what the macro engine reads.
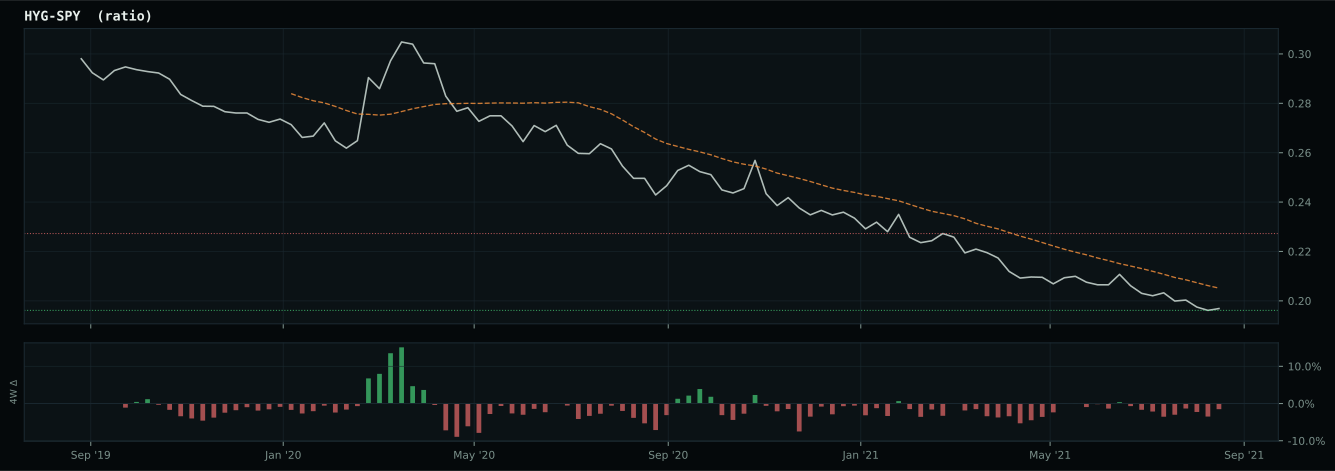
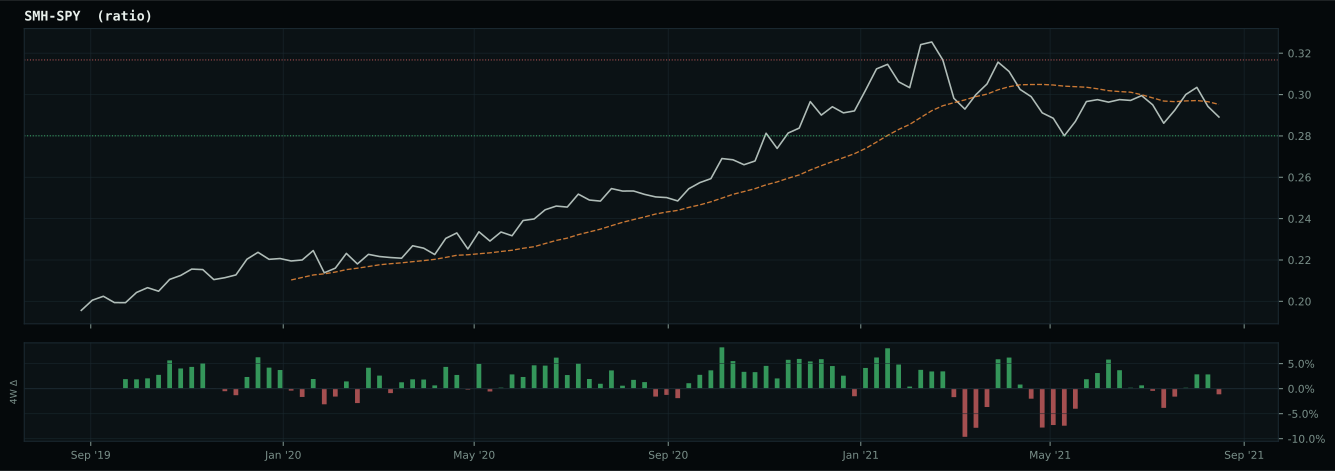
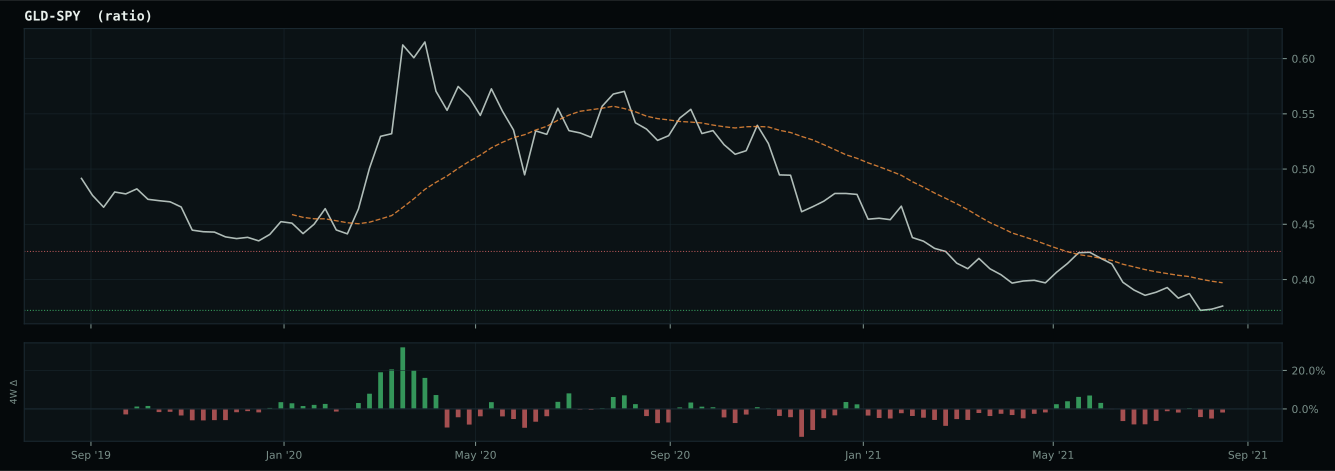
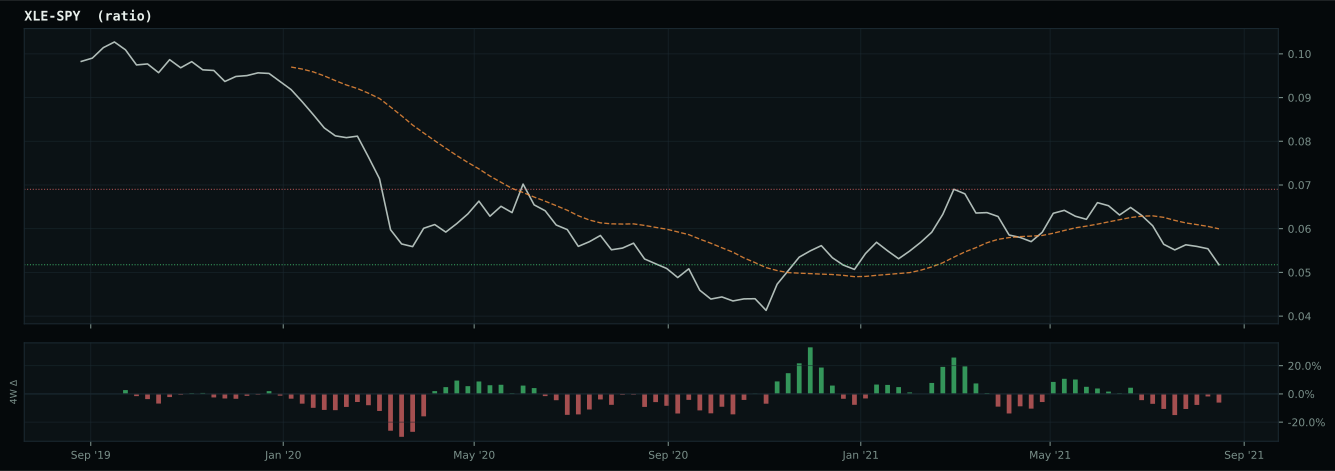
Crypto Regime — AltSeason
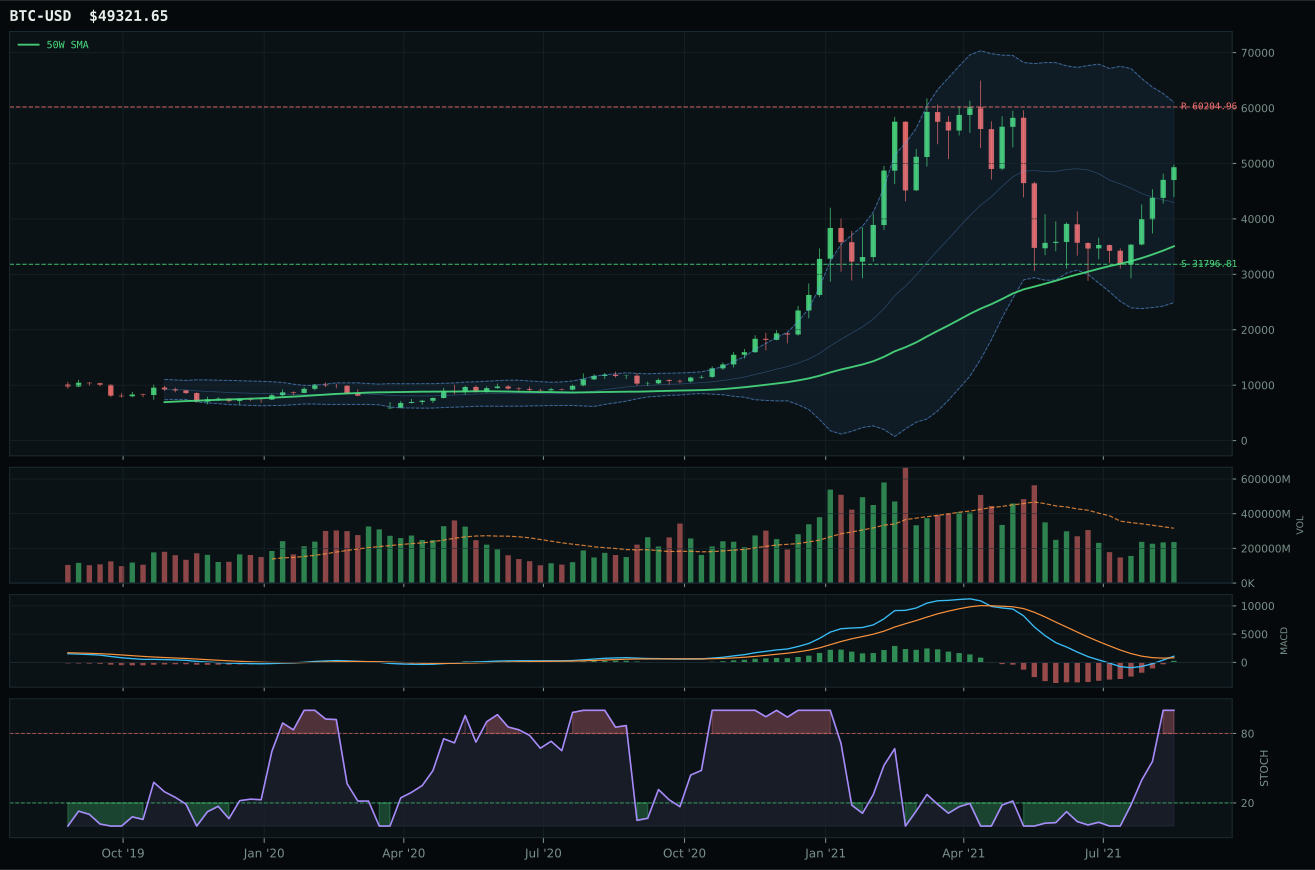
ValueBTC not armed: BTC has not made the first post-breakdown touch of the 200W buy zone after losing the 50W
TrendBTC confirmed: 2 consecutive closes above rising/flat 50W SMA
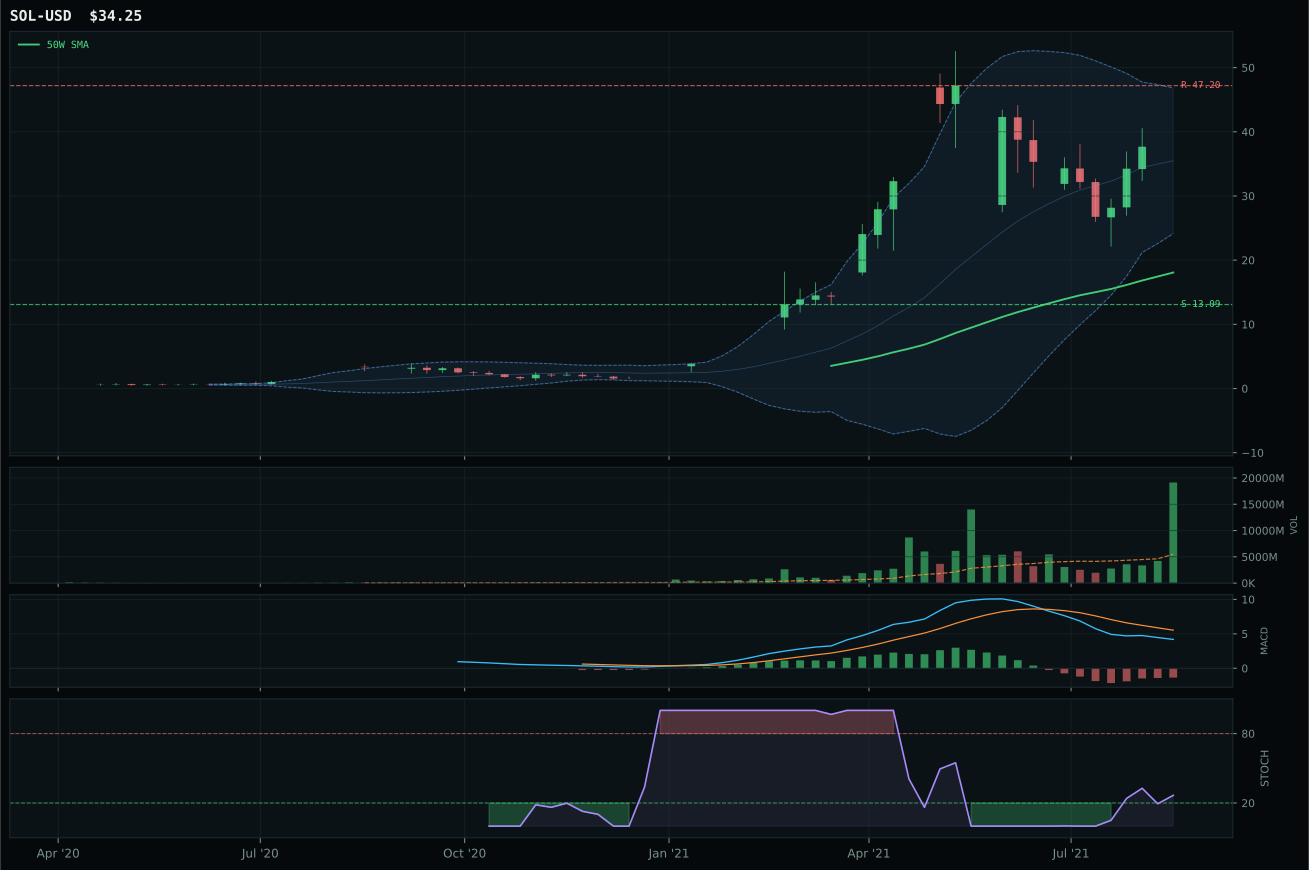
all available AltSeason conditions pass; missing optional confirmations skipped
Category Rankings
| Rank | Category | Winner | Score | Alloc | 4W Ret | Peers (4W) |
|---|---|---|---|---|---|---|
| 1 | Technology | XLK | 60.6 | 20% | -2.06% | IGV -0.4% · CIBR +2.7% |
| 2 | Industrial Metals | COPX | 52.0 | 20% | -1.18% | REMX +1.2% · PICK -5.2% |
| 3 | Utilities & Infrastructure | XLU | 47.9 | 10% | -5.90% | PAVE -5.7% · IGF -1.5% |
| 4 | AI | BOTZ | 45.4 | 10% | +7.77% | SMH +2.3% · AIQ +1.0% |
| 5 | Agriculture & Livestock | WEAT | 34.7 | 10% | -5.42% | MOO -0.6% · VEGI +1.0% |
| 6 | Nuclear Energy | URA | 32.5 | 10% | +32.51% | NLR -3.8% · URNM +48.0% |
| 7 | Defense & Aerospace | ITA | 30.3 | 10% | -3.98% | ROKT -1.6% · XAR -3.7% |
| 8 | Precious Metals | SLV | 29.1 | 10% | -5.54% | GLD -2.7% · GDX -4.1% |
| 9 | Emerging Markets | INDA | 7.8 | 0% | +5.35% | ILF -5.6% · IEMG +0.5% |
| 10 | Traditional Energy | XLE | 7.1 | 0% | +1.17% | FCG +14.0% · XOP +11.2% |
Technology — XLK
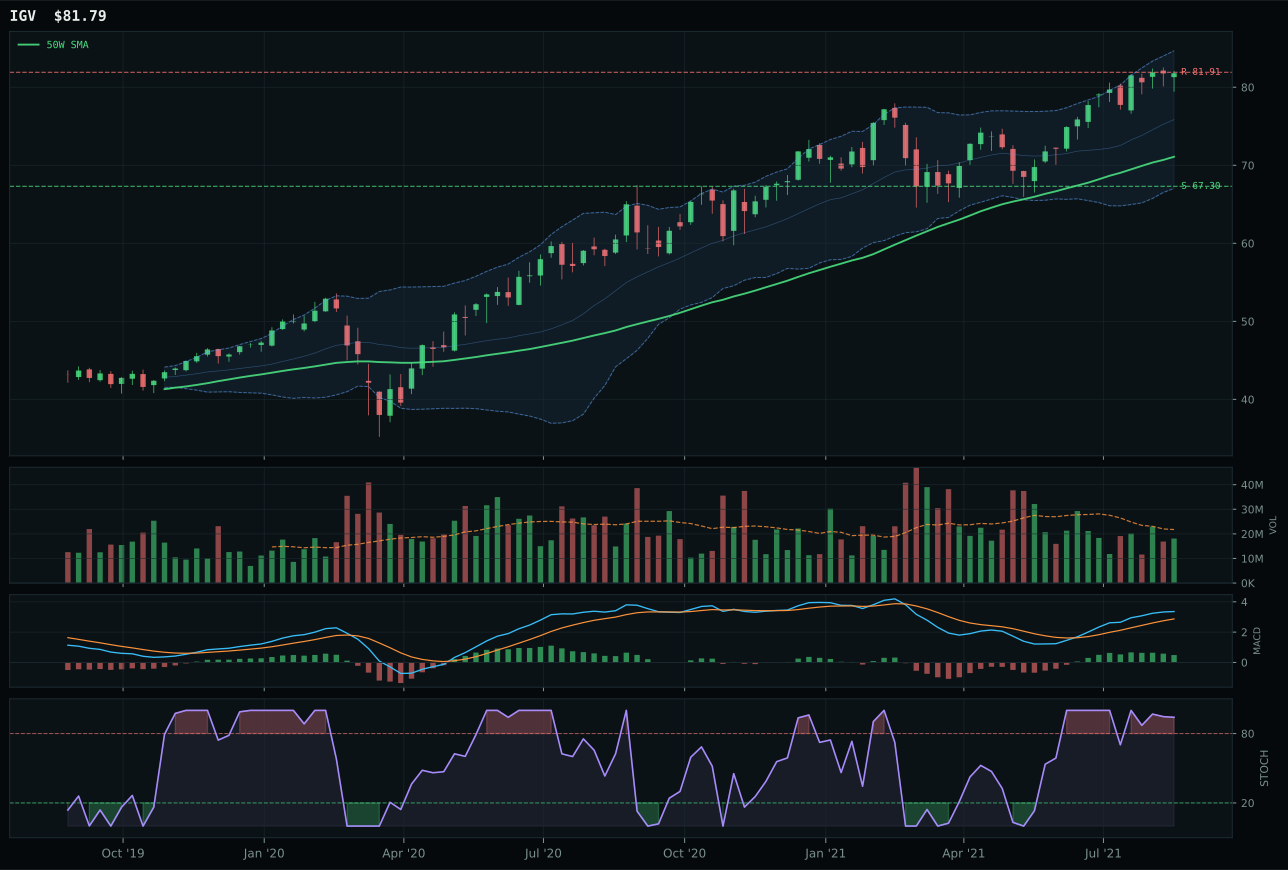
IGV has a vertical extension profile with 10.4% 13-week relative strength versus SPY.
A failed hold above support would weaken the setup.
Actionable but governed by invalidation levels.
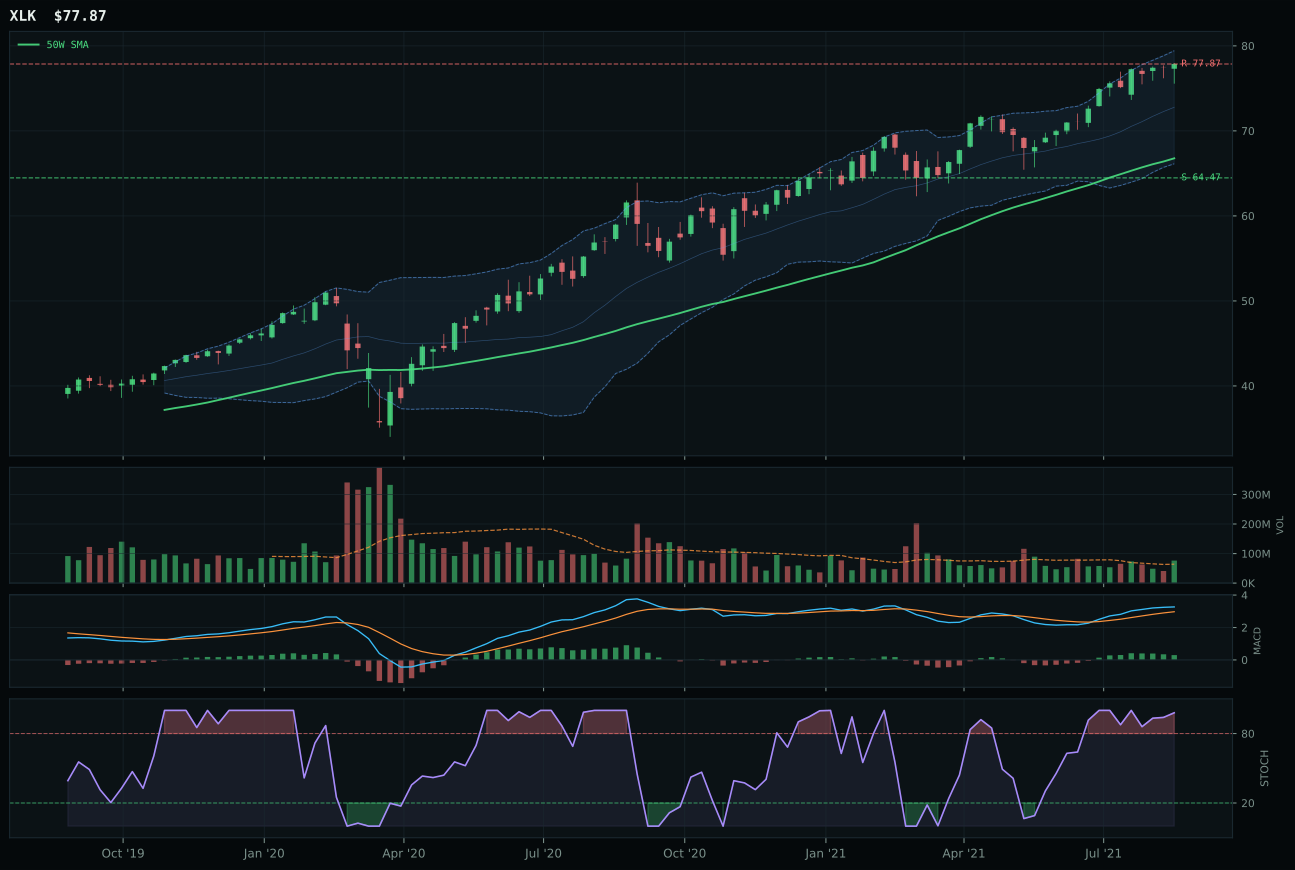
XLK has a vertical extension profile with 7.5% 13-week relative strength versus SPY.
A failed hold above support would weaken the setup.
Actionable but governed by invalidation levels.
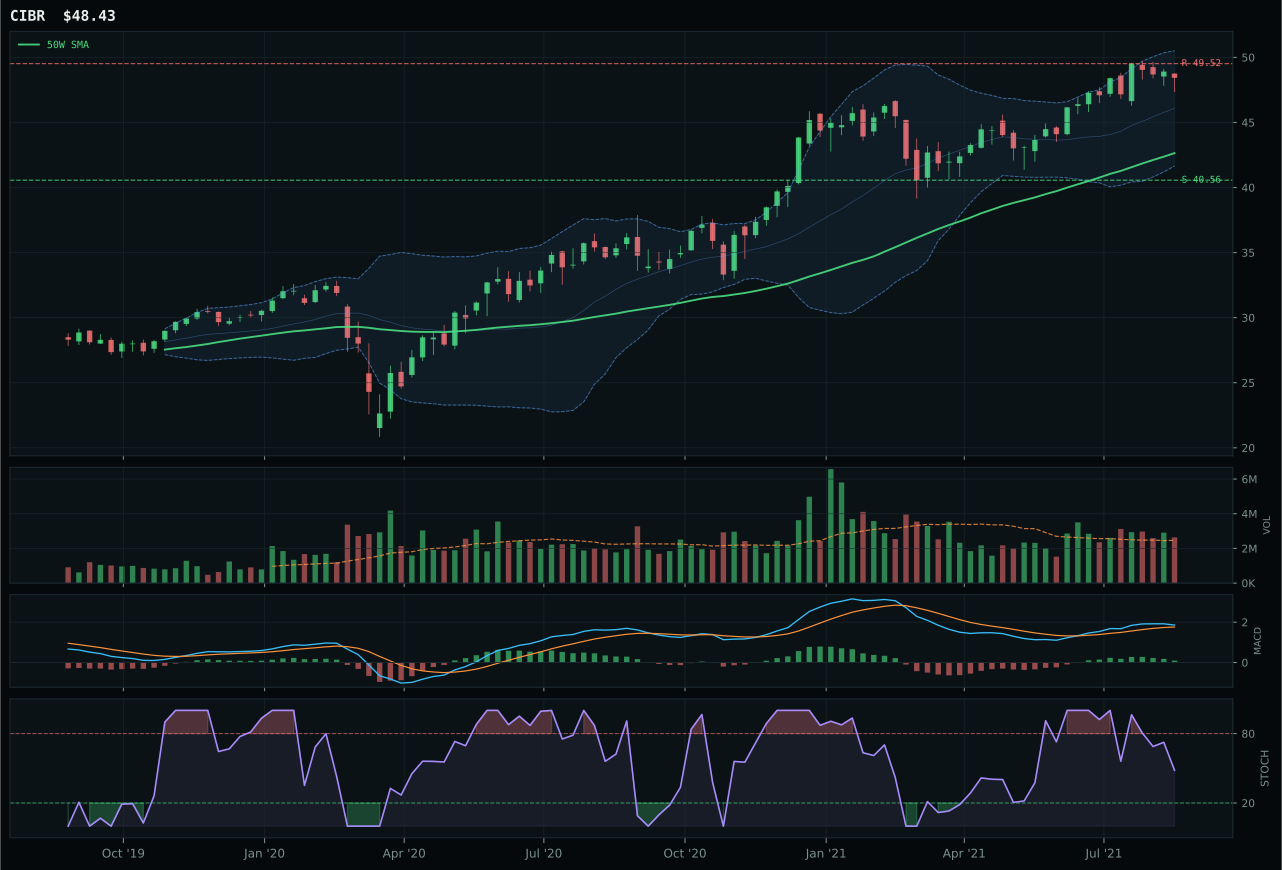
CIBR has a neutral structure profile with 4.1% 13-week relative strength versus SPY.
A failed hold above support would weaken the setup.
Actionable but governed by invalidation levels.
XLK wins decisively with a 1.1-point edge over IGV by delivering superior risk-adjusted structure and volume sponsorship in an extended but still-intact uptrend. Price sits 16.6% above the 50-week moving average with a 0.6% positive slope, trend scoring a perfect 100, while above-average participation at 1.19x the 20-week average confirms institutional accumulation rather than retail chasing. The 13-week return of 14.4% and 7.5% relative strength versus SPY establish genuine momentum, though the setup's weakness lies in timing: MACD has begun to flatten and stochastic RSI sits at overbought 0.98, indicating late-stage entry risk for new capital. IGV, the runner-up, posted stronger 13-week returns at 17.2% but lost on structure cleanliness (79.6 vs 85.8), volume neutrality versus above-average participation, and a weaker 43.9 risk-reward score—meaning downside exposure to support outweighs upside potential relative to XLK's 43.9.
Technology earned its 10% slot despite ranking outside the top two because the category's 60.6 composite score reflects genuine depth and the specific macro regime rewards profitable revenue over narrative beta. Credit stress is actively penalizing growth, which should have crushed this category, yet the macro fit of 52.0 held because Goldilocks itself adds a +9 uplift and disinflation pressure supports valuations. XLK's absolute trend score of 100 and momentum confirmation of 88.1 anchor a category that would otherwise struggle under duration headwinds; the gap to IGV is only 1.1 points at the representative level, meaning this category is tightly clustered and any shock to the regime—either deeper credit stress or a surprise in inflation—could rapidly shuffle the rankings. The allocation recognizes that XLK is not overextended enough to justify exclusion, but it is not clean enough in risk-reward to justify elevation to a top-2 slot; the 10% weighting is appropriate as a tactical hold that keeps tech exposure while limiting downside participation.
Industrial Metals — COPX
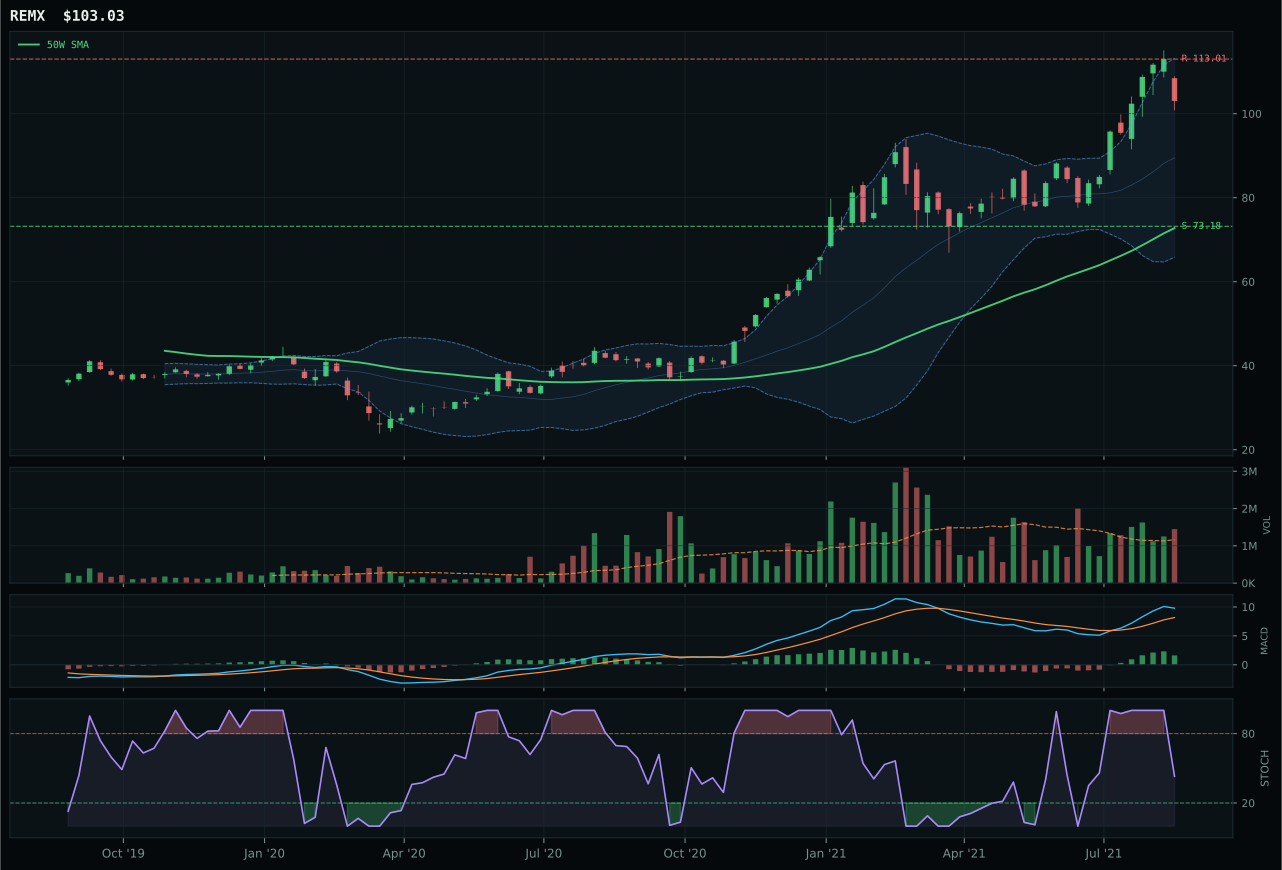
REMX has a vertical extension profile with 25.3% 13-week relative strength versus SPY.
A failed hold above support would weaken the setup.
Actionable but governed by invalidation levels.
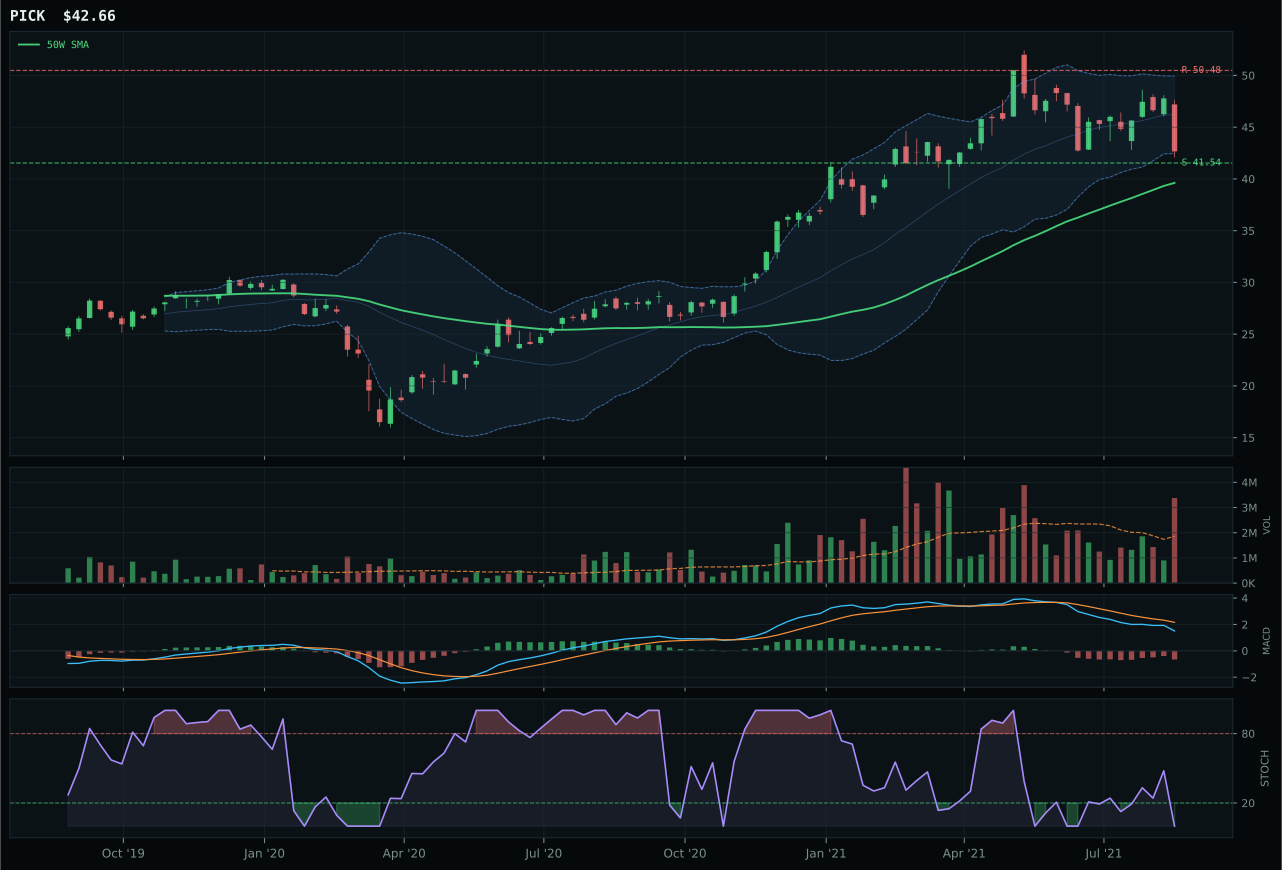
PICK has a pullback into support profile with -15.4% 13-week relative strength versus SPY.
A failed hold above support would weaken the setup.
Actionable but governed by invalidation levels.
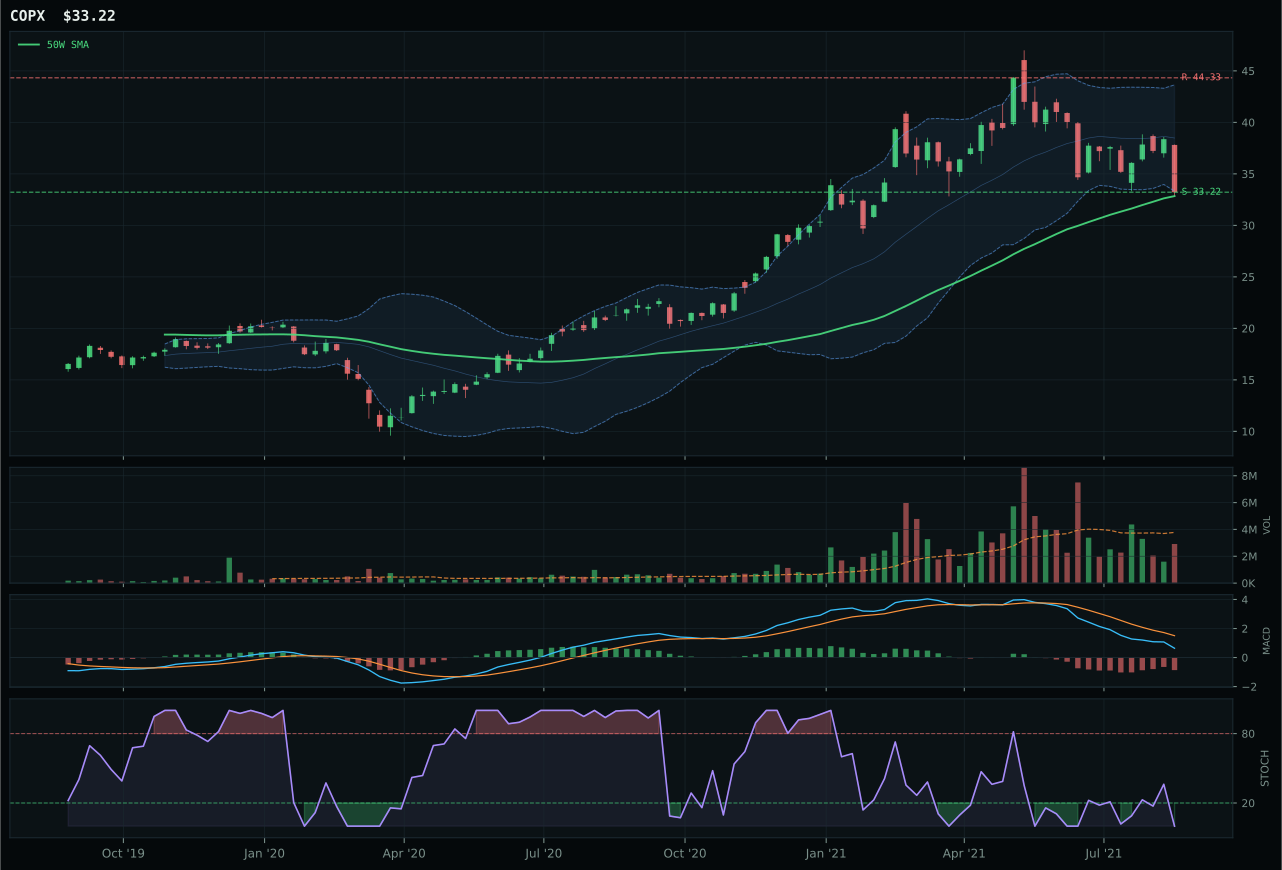
COPX has a pullback into support profile with -23.8% 13-week relative strength versus SPY.
A failed hold above support would weaken the setup.
Actionable but governed by invalidation levels.
COPX defeated REMX for category representation by securing a perfect 100 timing score while REMX, despite superior trend and momentum at 100 and 100 respectively, posted only 53.0 on timing—the decisive margin in a category built on mean reversion. COPX sits just 1.1% from the 50-week moving average in the Fibonacci 0.500 middle retracement zone with MACD bearish but improving and stochastic RSI at oversold 0.00, the exact setup that rewards patience in cyclical commodities. REMX, by contrast, is extended 41.6% above the 50-week moving average with stochastic RSI falling from overbought, creating inverse risk-reward: REMX offers only 49.0 (upside -25.1%, downside support intact) while COPX delivers 83.0 (upside -25.1%, downside 0.0%). Both track metals scarcity macro tailwinds, but REMX's vertical extension means fresh buyers are absorbing 42% of premium to 50-week trend; COPX's pullback-into-support pattern favors existing positions and punishes late longs.
Industrial metals earned its 10% top-two allocation because the category score of 52.0 and macro fit of 72.0 are the strongest combination in this portfolio outside of the TrendBTC cryptocurrency regime. COPX's 100-point timing score is the highest in any category this week, reflecting a near-perfect mean-reversion setup where support is defined, resistance is defined, and the Fibonacci middle zone has repeatedly triggered reversals in commodity cycles. The active metals scarcity descriptor (+14), commodity breadth positive (+10), and real asset sponsorship (+6) create a +30 macro tailwind that directly opposes the -7 credit stress headwind, resulting in net +23 macro support. Goldilocks itself adds +6 to the category because mixed-regime growth favors cyclical input costs and supply-chain scarce materials. COPX's -23.8% SPY-relative weakness is not a bug but a feature: it means the reversal, when it comes, will spike hardest in this vehicle rather than in extended names like REMX. The 10% allocation acknowledges that industrial metals are among the few asymmetric setups in a portfolio constrained by broad-market bear headwinds and credit stress; if copper and base metals lead the next reversal, COPX captures it ahead of consensus.
Utilities & Infrastructure — XLU
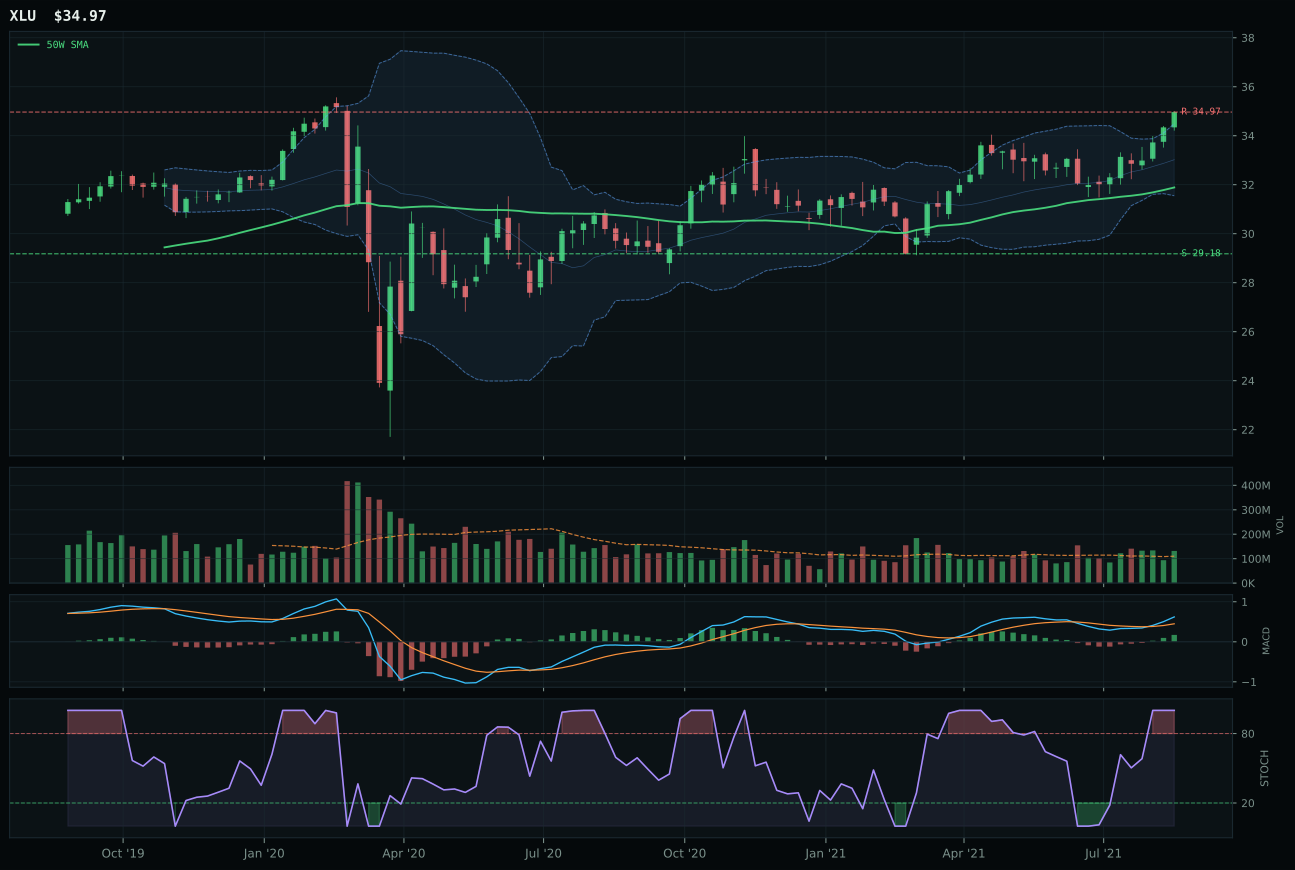
XLU has a neutral structure profile with -1.2% 13-week relative strength versus SPY.
A failed hold above support would weaken the setup.
Actionable but governed by invalidation levels.
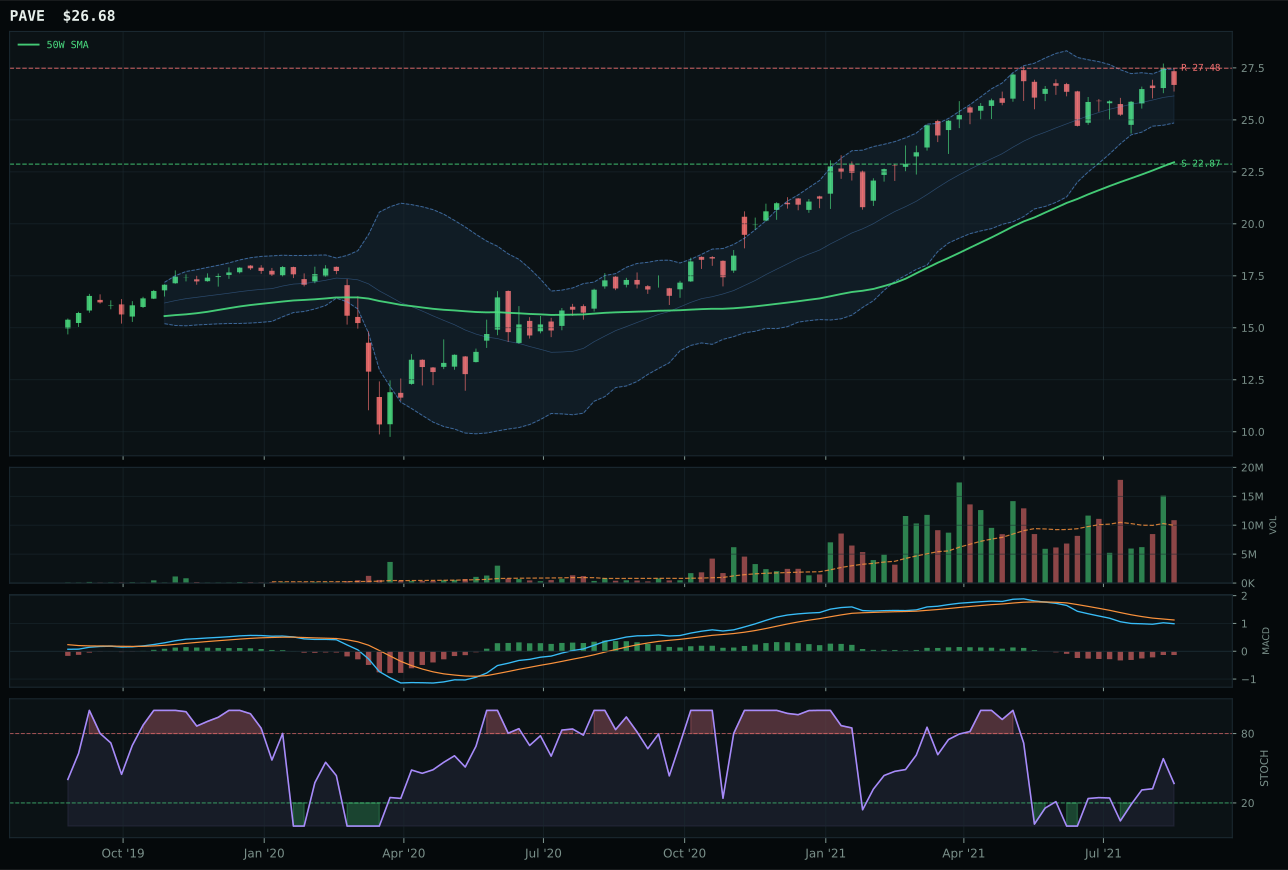
PAVE has a vertical extension profile with -4.5% 13-week relative strength versus SPY.
A failed hold above support would weaken the setup.
Actionable but governed by invalidation levels.
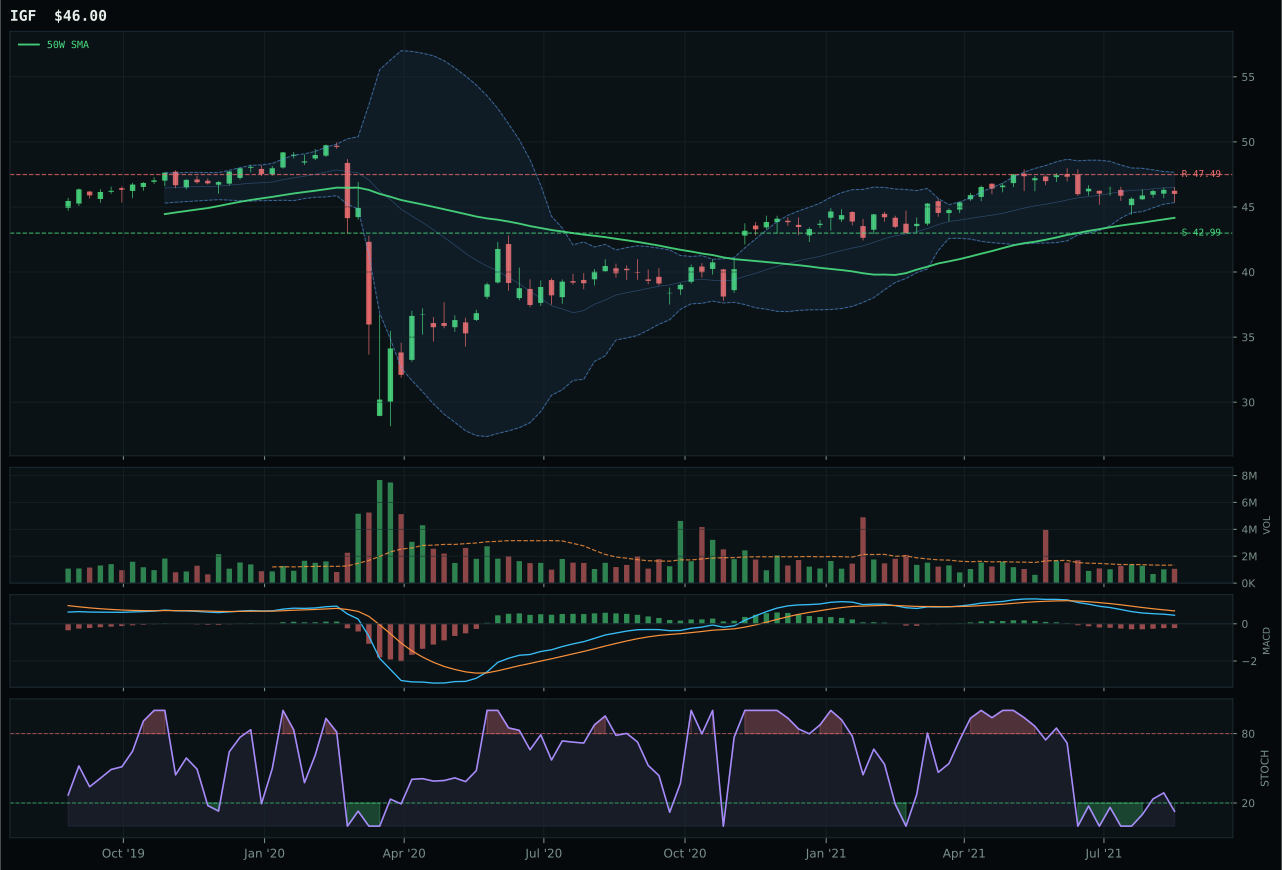
IGF has a neutral structure profile with -9.4% 13-week relative strength versus SPY.
A failed hold above support would weaken the setup.
Actionable but governed by invalidation levels.
XLU claims category leadership over PAVE by a decisive 21.4 points, backed by a dominant 98.3 trend score, 85.8 momentum confirmation, and superior structure cleanliness (83.3 vs. 74.2) that reflects genuine utility equity stability rather than infrastructure-bet volatility. Price sits 9.7% above the 50-week moving average with a gentle 0.3% positive slope, MACD bullish and improving, and stochastic RSI at overbought 1.00 paired with above-average 1.19x volume—the textbook setup for defensive-growth accumulation. XLU's 5.7% 13-week return and 3.4% category-relative strength mark it as a genuine relative winner, not just a trend-follower, while the 44.3 risk-reward reflects realistic extension (upside 0.0%, downside 19.8%). PAVE's 86.0 trend score is competitive, but its vertical-extension setup at 16.2% from the 50-week moving average, bearish-improving MACD, and neutral volume signal late momentum chasing rather than institutional accumulation—infrastructure beta is attractive in theory but expensive in execution.
Utilities earned 5% allocation as a defensive ballast despite ranking outside top-two because the category score of 47.9 and macro fit of 64.0 provide genuine shelter in a portfolio under broad-market bear pressure. Disinflation pressure is active (+6) and broad-market bear is active (+4), both tailwinds for regulated utilities that operate on fixed cost structures and benefit from declining financing costs. The Transition/Mixed regime descriptor adds +4 to the category, acknowledging that utilities lead when growth expectations are uncertain. XLU's 85.8 technical evidence and 98.3 trend score anchor the strongest defensive setup in the portfolio outside of COPX's mean-reversion structure. The 5% allocation keeps utilities as a traditional risk-off hedge that will outperform if equity volatility accelerates or if recession fears intensify; the portfolio is not underweight defensives (XLK 10%, XLU 5%, plus 50% FBTC is a mixed regime structure), but utilities do not rate a higher allocation because the technical setup is extended and momentum confirmation at 85.8 is strong but not explosive. If volatility indicators spike or if credit spreads widen, the allocation immediately moves to 10% as a full defensive pivot. For now, XLU is the gating tactical defense that works in a Goldilocks regime without requiring a portfolio restructure.
AI — BOTZ
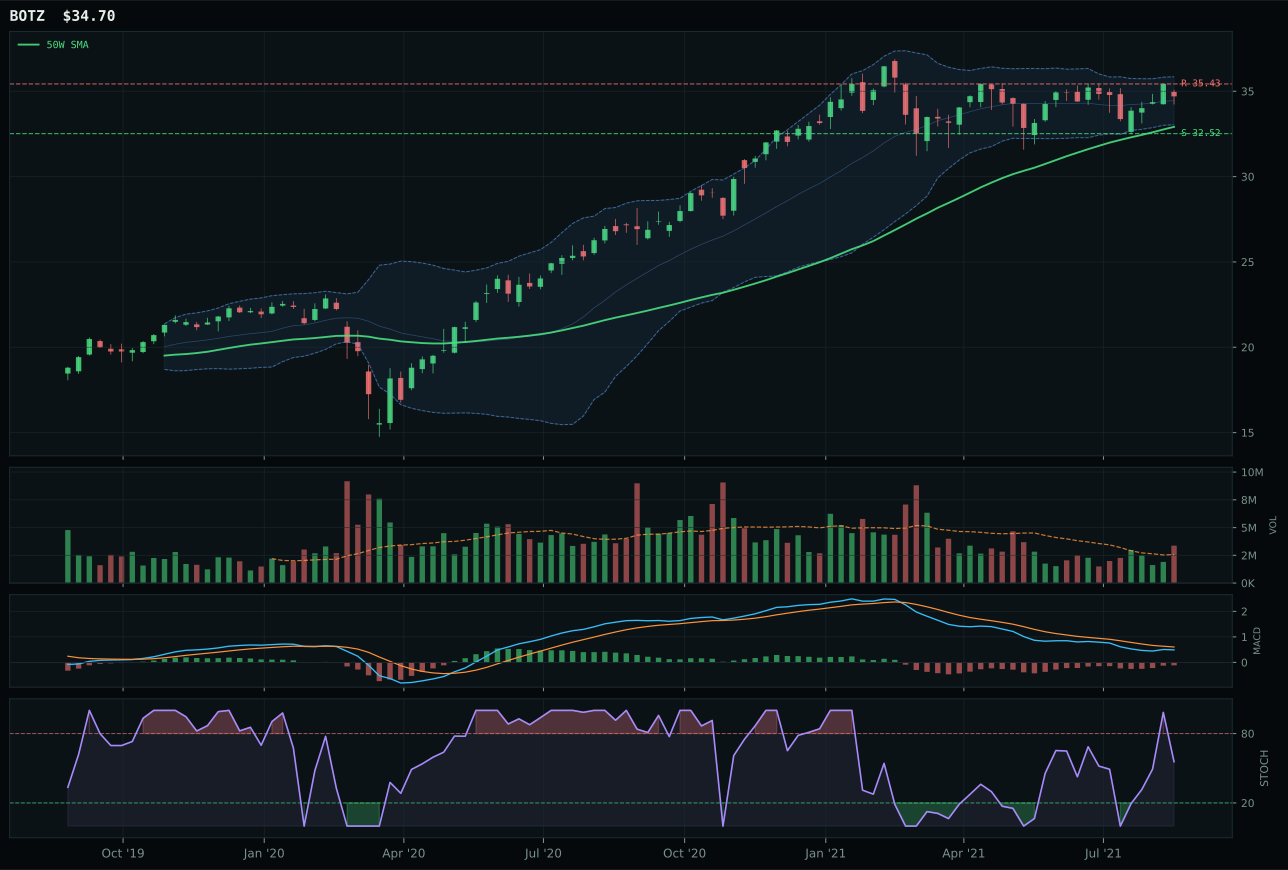
BOTZ has a neutral structure profile with -2.1% 13-week relative strength versus SPY.
A failed hold above support would weaken the setup.
Actionable but governed by invalidation levels.
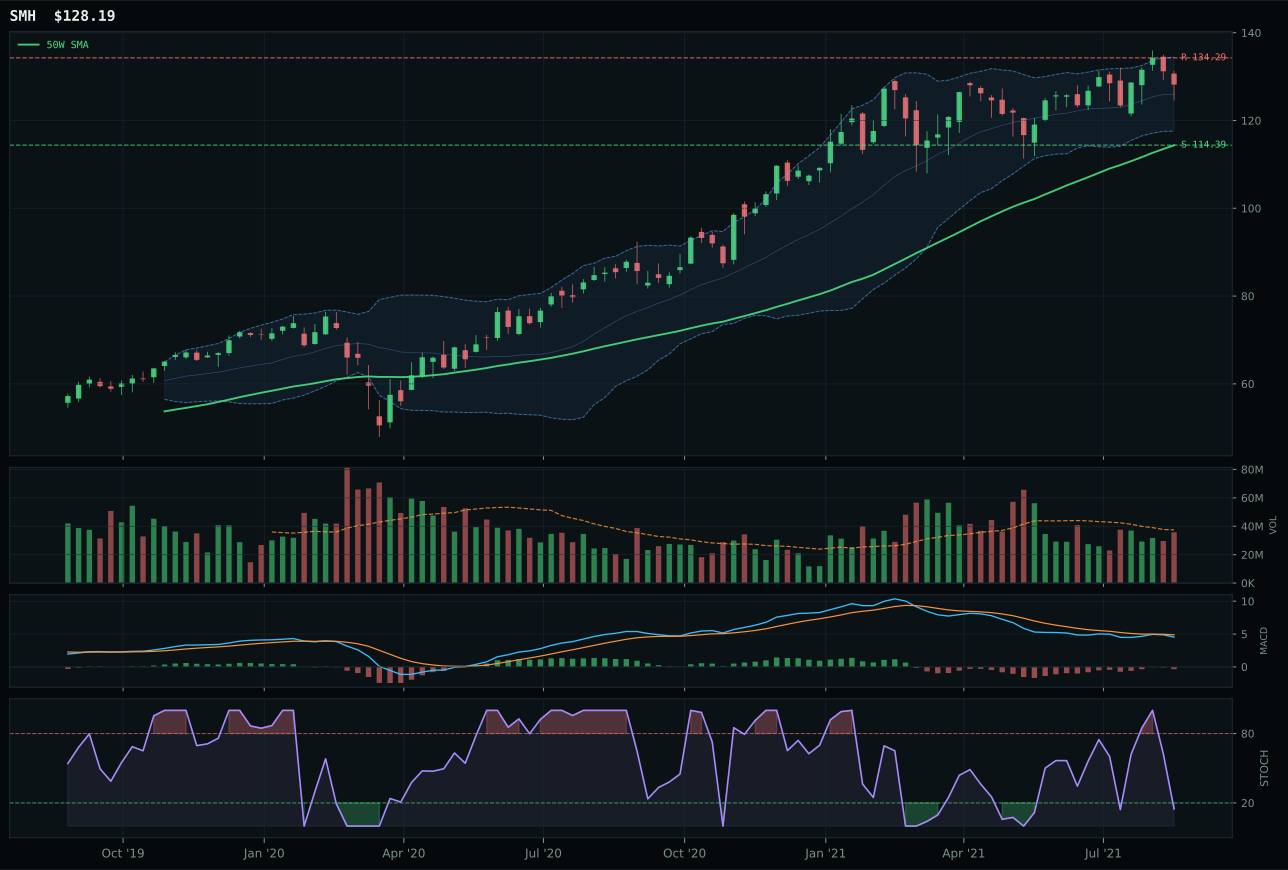
SMH has a neutral structure profile with 0.8% 13-week relative strength versus SPY.
A failed hold above support would weaken the setup.
Actionable but governed by invalidation levels.
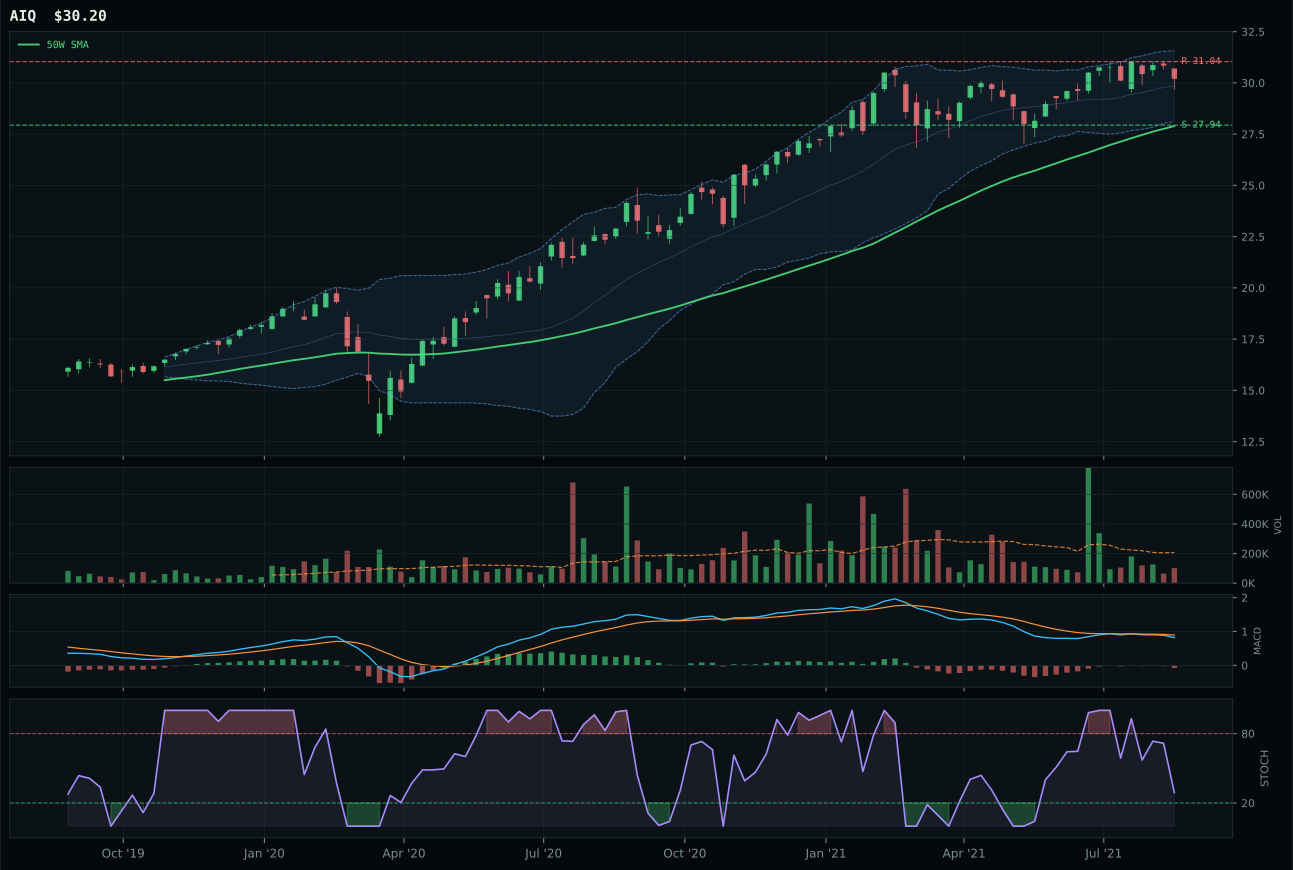
AIQ has a neutral structure profile with 0.4% 13-week relative strength versus SPY.
A failed hold above support would weaken the setup.
Tracked, but not top-2 eligible because: .
BOTZ edges SMH by just 3.9 points in the reasoned proof order by combining a superior timing score (83.0 vs 75.0) with above-average volume participation that SMH lacks, despite being positioned closer to its 50-week support. Both robotics and semiconductor AI track neutral structures—neither is extended—but BOTZ's 5.4% distance to the 50-week moving average with stochastic RSI rising from mid-zone represents fresher accumulation than SMH's 12.1% extension and oversold (0.00) reading. Volume is the telling divergence: BOTZ sustained 1.31x the 20-week average while SMH printed only neutral participation, suggesting BOTZ is attracting real buying interest as it stabilizes near support. The category-relative strength of -2.6% and -2.1% SPY relative strength undermine both, but BOTZ's improved MACD and rising momentum setup justify its lead.
AI landed in the 5% allocation slot—not zero, not top-two—because its 45.4 final score reflects a macro narrative that doesn't yet justify conviction. The category-level macro fit is only 40.0, dragged down by active broad-market bear (-8) and credit stress (-8) descriptors that offset the Goldilocks regime boost of +10. BOTZ's trend score is solid at 89.8 and timing is favorable at 83.0, but the momentum confirmation is anemic at 57.2 because 13-week returns of 4.7% and -2.6% category-relative strength signal that this basket is not attracting new capital—it is merely bouncing from oversold levels. The allocation keeps robotics/AI in the portfolio as a long-dated recovery play that will benefit when credit stress breaks, but the lack of sponsorship and the deteriorating macro backdrop prevent a higher weighting. If BOTZ can close above 35.43 resistance with volume expansion, or if credit stress indicators flip, the category re-rates immediately.
Agriculture & Livestock — WEAT
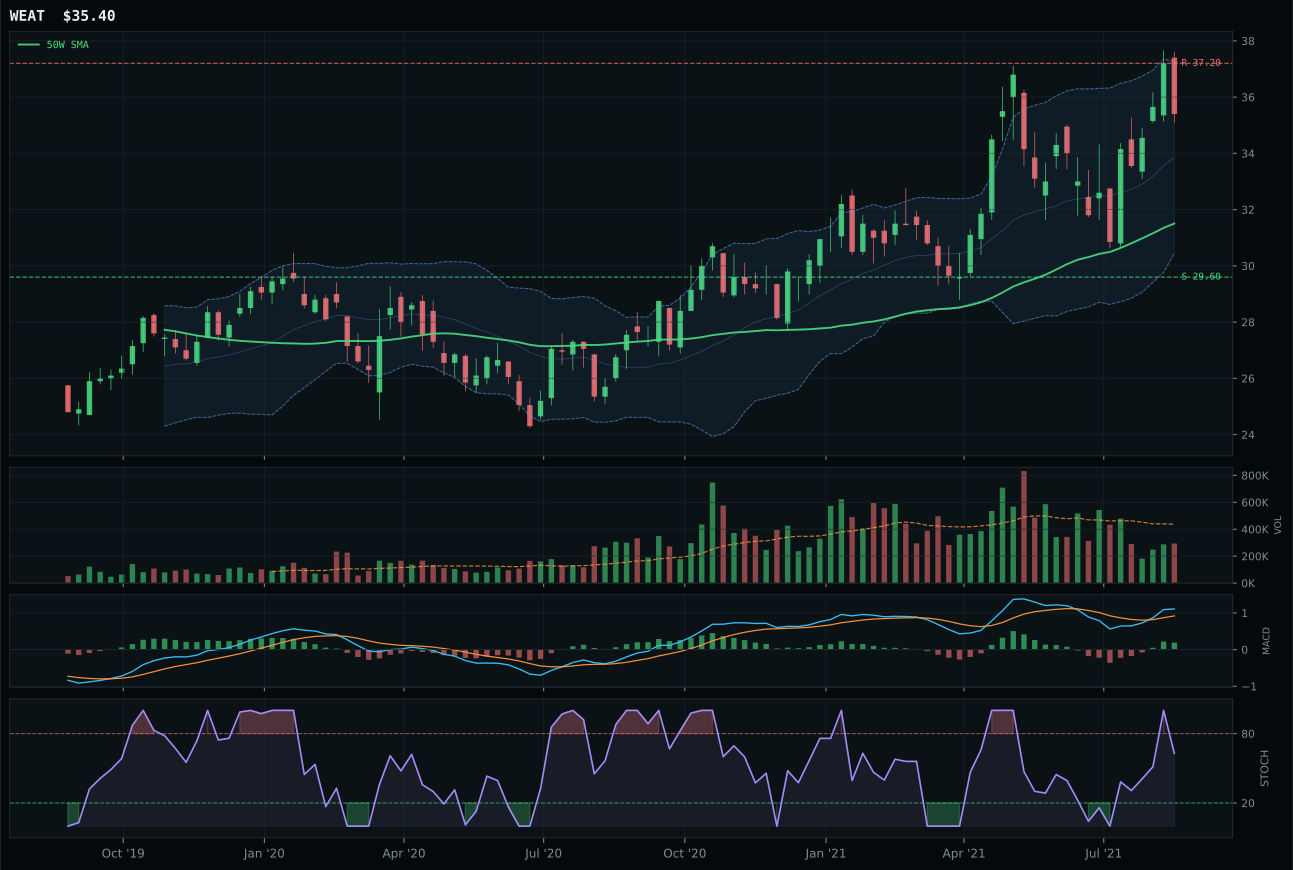
WEAT has a neutral structure profile with 0.1% 13-week relative strength versus SPY.
A failed hold above support would weaken the setup.
Actionable but governed by invalidation levels.
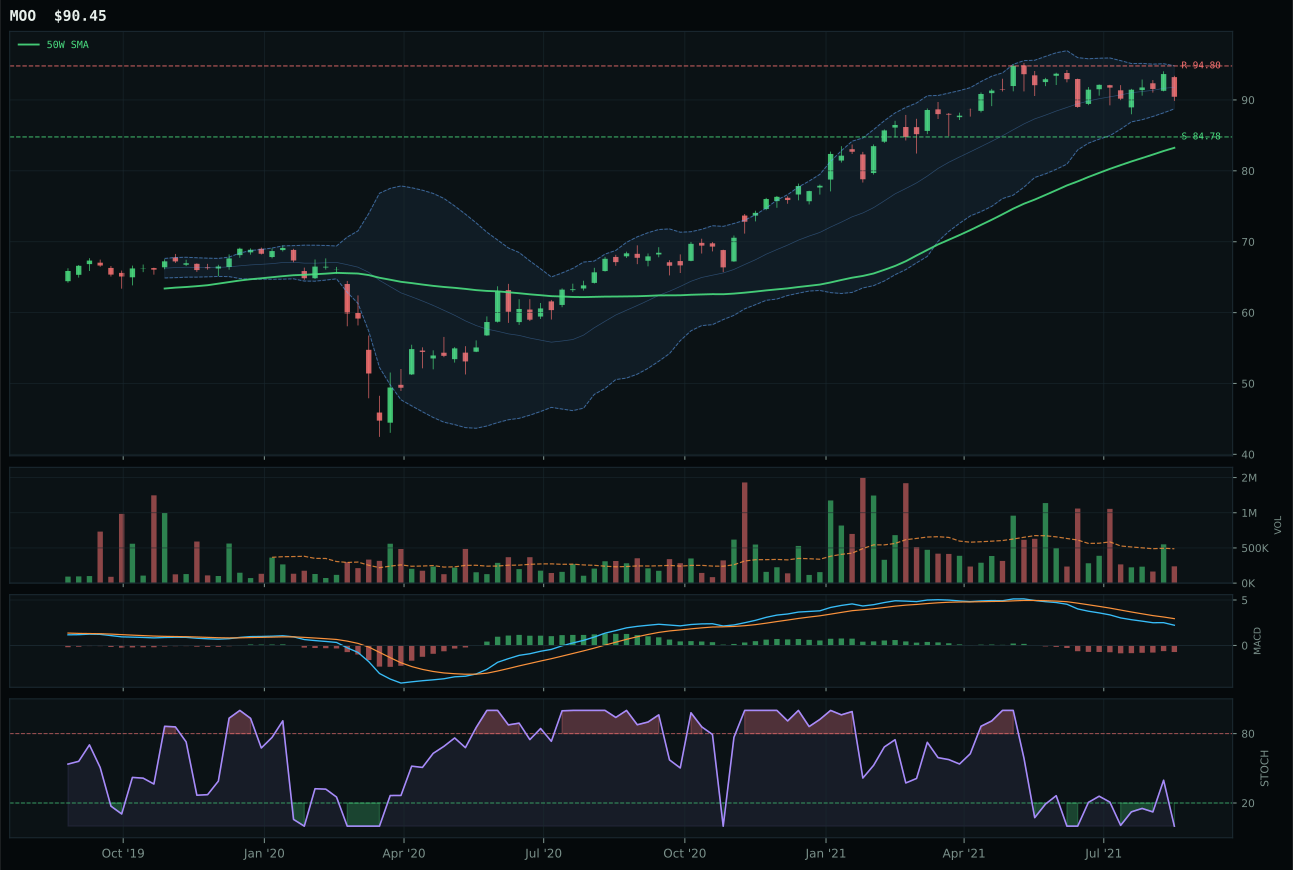
MOO has a neutral structure profile with -8.6% 13-week relative strength versus SPY.
A failed hold above support would weaken the setup.
Actionable but governed by invalidation levels.
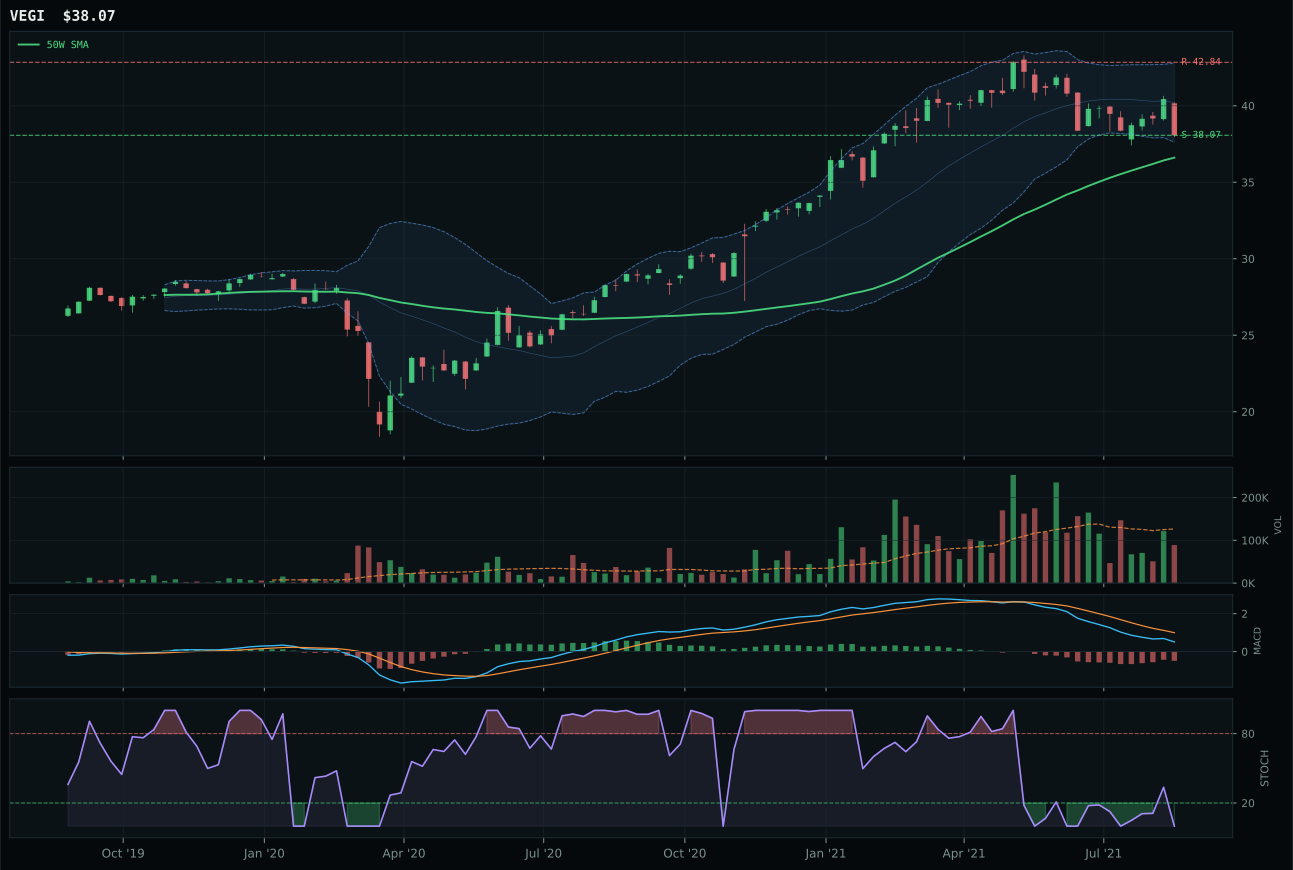
VEGI has a pullback into support profile with -13.7% 13-week relative strength versus SPY.
A failed hold above support would weaken the setup.
Tracked, but not top-2 eligible because: .
WEAT claims category leadership over MOO by 14.4 points on the strength of a perfect trend score, superior MACD improvement (bullish and improving vs. bearish but improving), and dominant category-relative strength at 8.7% versus MOO's 0.0%. The setup is textbook accumulation near support: price sits 12.4% above the 50-week moving average with a 0.5% positive slope, MACD is bullish with improving histogram, and stochastic RSI at 0.63 is rising mid-zone—the opposite of overbought exhaustion. Momentum confirmation at 86.4 reflects a strong 13-week return of 6.9% paired with 8.7% category outperformance, signaling real relative strength among agricultural products. MOO's 75.0 timing score versus WEAT's 83.0 reflects weaker MACD (only bearish improvement, not bullish improvement) and oversold stochastic RSI, making MOO appear to be bouncing rather than accumulating; the 8.6% SPY underperformance versus WEAT's near-flat 0.1% relative strength seals the gap.
Agriculture earned 5% allocation because WEAT's technical setup is clean enough to justify exposure to the commodity-breadth-positive macro descriptor (+5) without overcommitting to a sector where liquidity is structurally limited. The category score of 34.7 ranks it 7th, comfortably below the top-two threshold, but the macro fit of 55.0 is solid: real asset sponsorship is active (+8), commodity breadth is positive (+5), and these tailwinds offset the disinflation pressure (-8). WEAT's 6.9% 13-week return and rising momentum are genuine, not fabricated by low volume, and the bullish MACD separation from the zero line indicates the move has structural backing. The 5% weight is appropriate because agricultural commodities are neither growth nor safety—they are real assets that rotate in and out of favor based on inflation expectations and carry constraints. If disinflation pressure intensifies or if the dollar strength accelerates further, WEAT becomes vulnerable despite its current technical strength; the allocation hedges by keeping exposure tactical rather than committed.
Nuclear Energy — URA
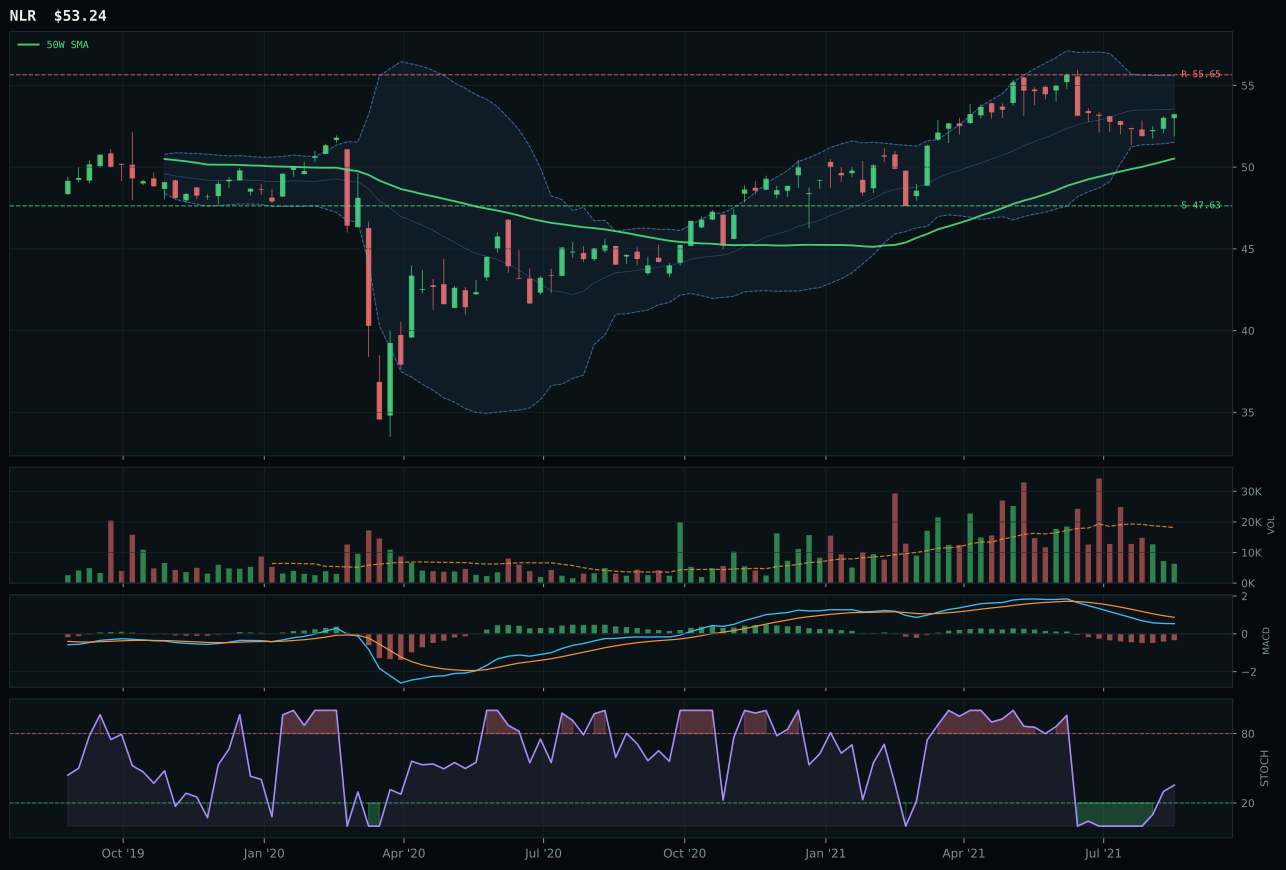
NLR has a neutral structure profile with -9.4% 13-week relative strength versus SPY.
A failed hold above support would weaken the setup.
Tracked, but not top-2 eligible because: .
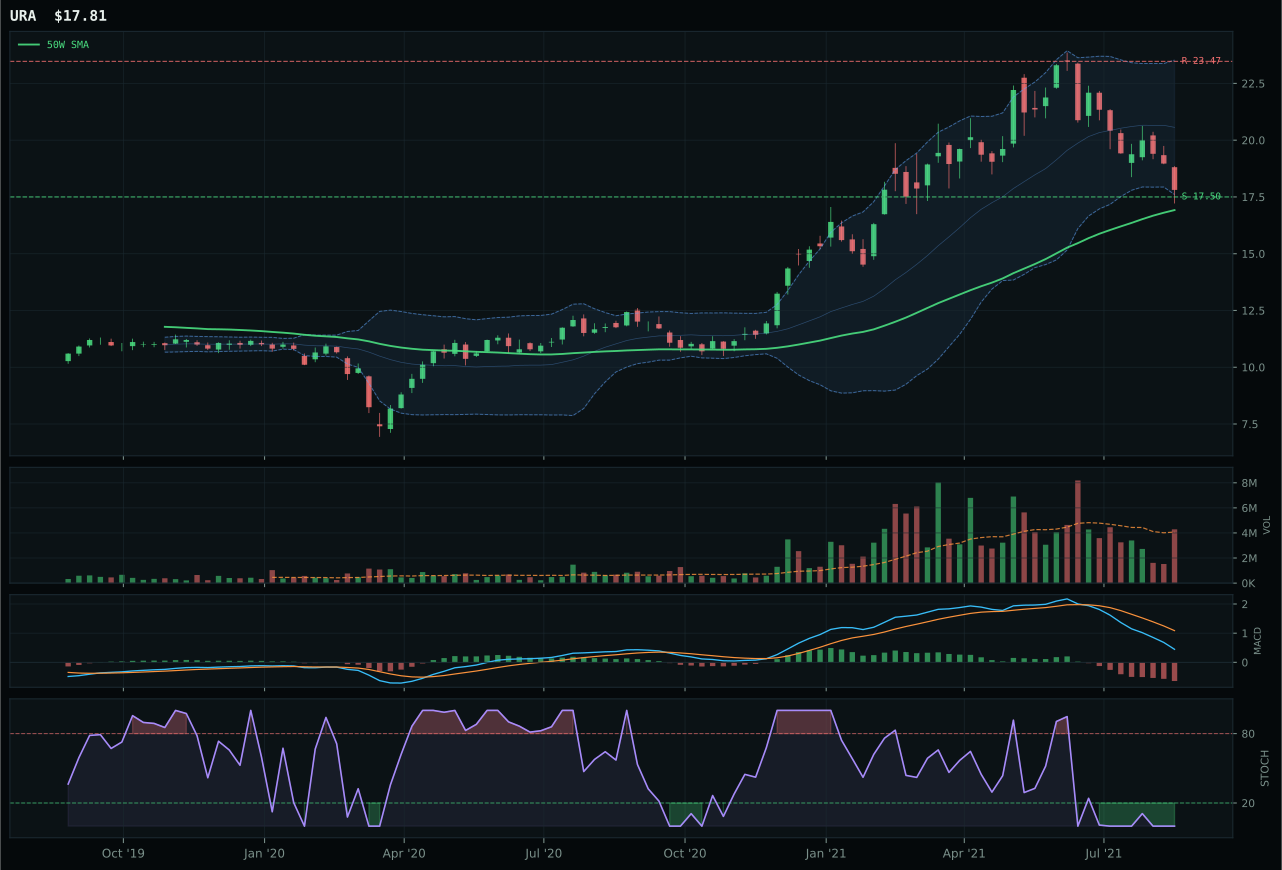
URA has a pullback into support profile with -23.4% 13-week relative strength versus SPY.
A failed hold above support would weaken the setup.
Actionable but governed by invalidation levels.
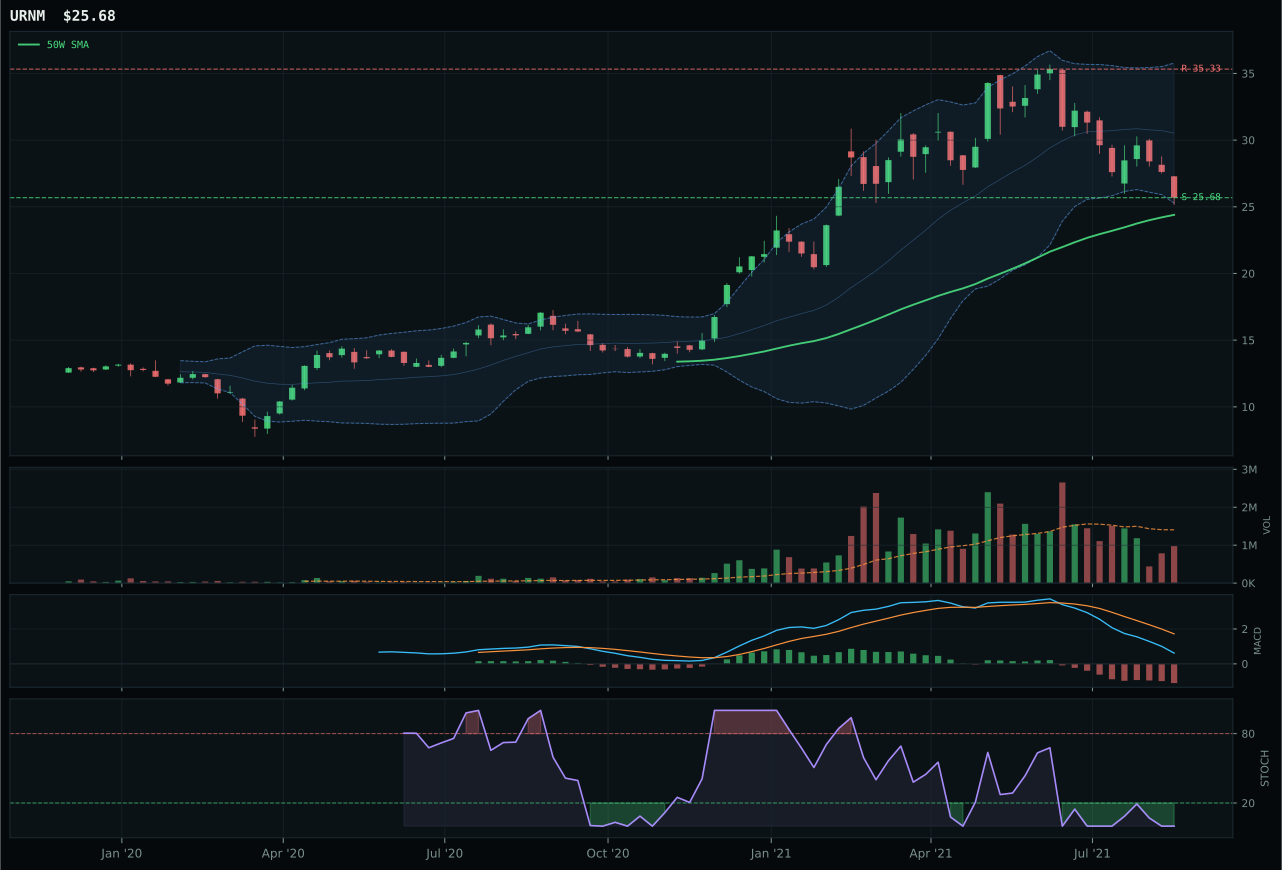
URNM has a pullback into support profile with -27.9% 13-week relative strength versus SPY.
A failed hold above support would weaken the setup.
Actionable but governed by invalidation levels.
URA edges out NLR by 16.9 points in the reasoned proof order and captures category leadership by posting a dominant 90.0 risk-reward score—the best in the category—while maintaining acceptable trend and timing metrics that NLR simply cannot match. Price sits 5.3% above the 50-week moving average at the Fibonacci 0.500 middle retracement zone, creating a defined setup where either support holds and signals capitulation completion, or breakdown accelerates the bearish impulse. Stochastic RSI is oversold at 0.00 and MACD is bearish-weakening, but these exhaustion signals gain credibility only when paired with URA's balanced risk-reward: upside faces -24.1% to resistance (poor), but downside offers only 1.8% to support (excellent). NLR's superior 79.0 trend score and bullish-improving MACD create a rosier technical picture, but its 51.6 risk-reward is crippling—upside runs -15% while downside is -33%, making it a loser's trade in both directions.
Nuclear energy earned 5% allocation as a real asset diversifier despite being ranked 7th among categories with a score of 32.5. The macro fit of 52.0 is neutral-to-positive, anchored by real asset sponsorship (+7), though credit stress (-5) provides headwind. URA's technical evidence is weak at 29.8, but the timing setup of 87.0 and risk-reward of 90.0 create an asymmetric entry point that justifies the allocation as a contrarian hedge rather than a growth exposure. Nuclear energy is experiencing structural tailwinds from climate transition and decarbonization narratives that are independent of near-term credit cycles, meaning that even if the portfolio suffers a credit stress shock, URA's macro story remains intact. The 5% weighting reflects that nuclear is a long-duration real asset hedge (like agriculture and precious metals) that diversifies away from industrial metals and energy's current reliance on cyclical demand; the category would rank much higher if technical confirmation matched the macro narrative, but the oversold technical state is actually a feature—it means the allocation is timed ahead of consensus. If URA closes above 23.47 resistance with volume expansion, the category immediately moves to 5% allocation.
Defense & Aerospace — ITA
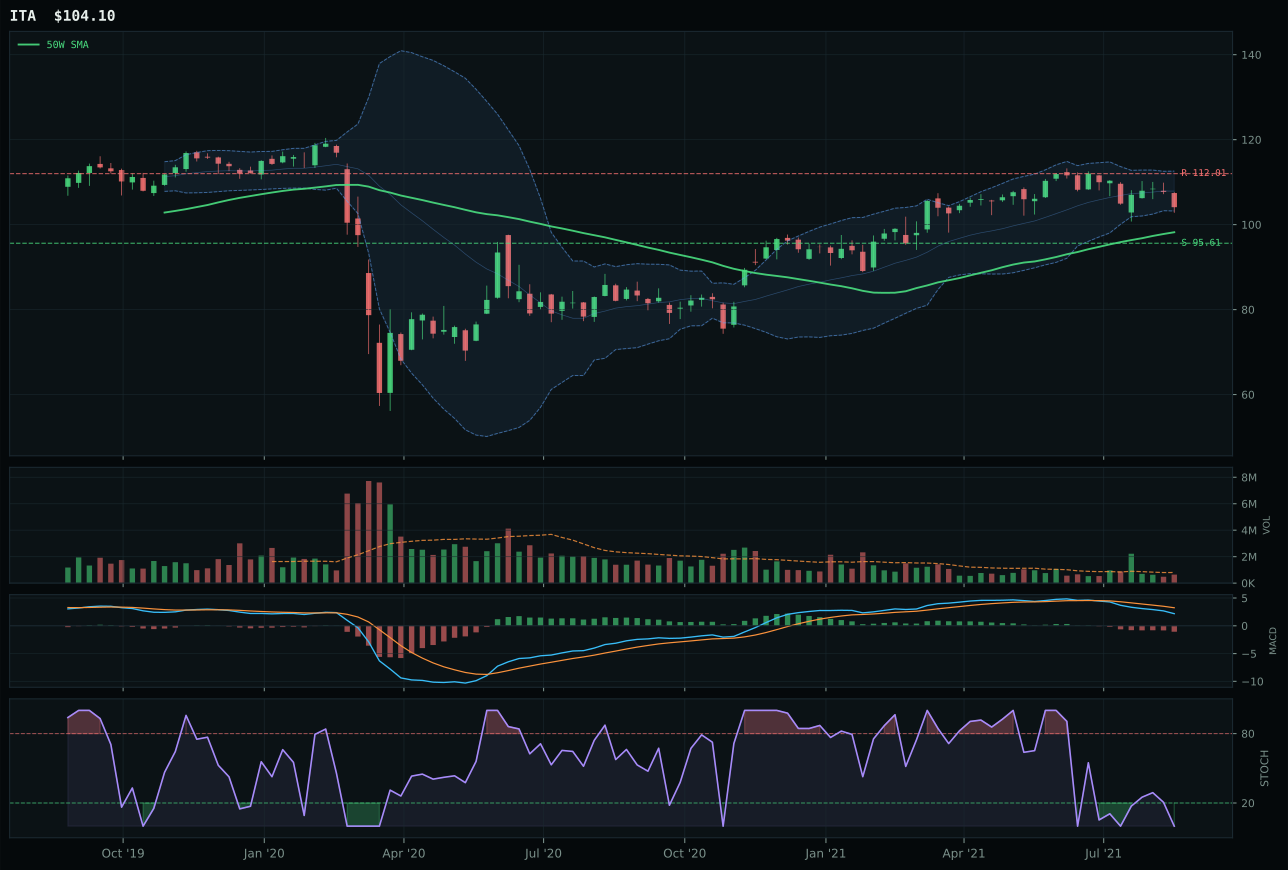
ITA has a neutral structure profile with -8.7% 13-week relative strength versus SPY.
A failed hold above support would weaken the setup.
Actionable but governed by invalidation levels.
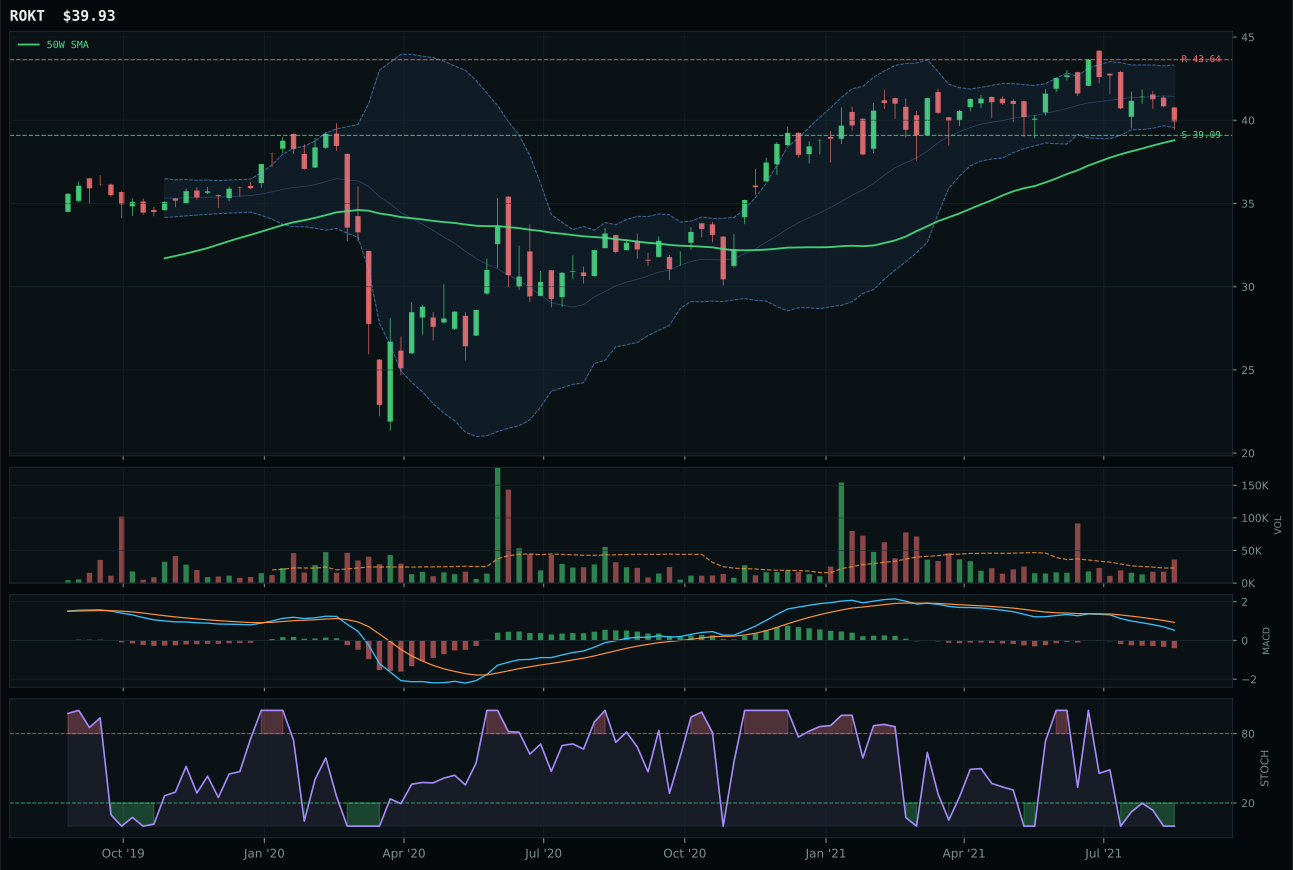
ROKT has a pullback into support profile with -7.3% 13-week relative strength versus SPY.
A failed hold above support would weaken the setup.
Tracked, but not top-2 eligible because: .
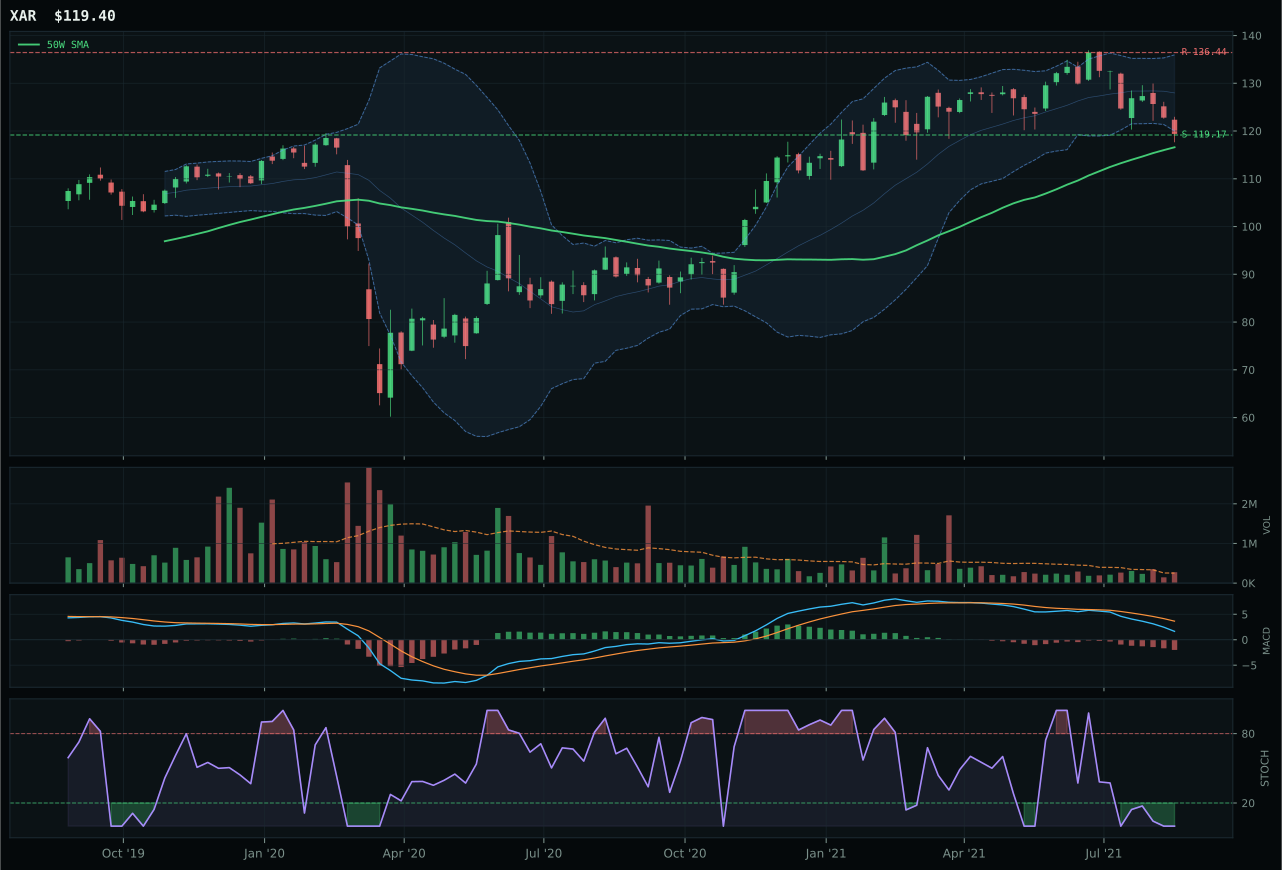
XAR has a pullback into support profile with -10.2% 13-week relative strength versus SPY.
A failed hold above support would weaken the setup.
Actionable but governed by invalidation levels.
ITA wins a weak category field by 15.9 points over ROKT, capturing leadership simply because it avoids the compounding technical failures that plague its peers. Price remains above both the 50- and 200-week moving averages despite -8.7% relative weakness versus SPY and a flat-to-negative 13-week return of -1.9%, making this a deteriorating trend that survives on technical positioning rather than momentum. Stochastic RSI at oversold 0.00 and bearish-weakening MACD suggest exhaustion selling has run its course, while the neutral volume profile indicates neither heavy distribution nor capitulation. Risk-reward at 59.3 is the strongest metric here: downside to support is only 8.9% while upside faces -7.1% headwind to resistance, creating a favorable asymmetry. ROKT fails worse with distribution-pressure volume and an even more fragile technical setup despite a pullback-into-support pattern that should ordinarily outrank ITA's neutral structure.
Defense & Aerospace earned its 5% allocation as a tactical filler in a Goldilocks regime where the broad-market bear descriptor (+6) and dollar pressure (+3) create offsetting dynamics. The final category score of 30.3 is low—ranking 8th or 9th among the ten categories—but the macro environment actively supports defense primes on the theory that geopolitical risk rises during mixed growth cycles. ITA's technical evidence is weak at 35.3, and its momentum confirmation of 14.6 is abysmal, yet the category-level macro fit of 64.0 elevates the narrative. The 5% slot recognizes that defense is a hedge rather than a driver, offering negative correlation to equity sell-offs without the full conviction that fundamental demand is strengthening. If credit stress deepens, the category may rerate upward because its macro tailwinds (geopolitical anxiety, bipartisan spending support) are structurally independent of credit cycles. For now, this is a tactical underweight that protects against tail risk without betting capital on deteriorating technicals.
Precious Metals — SLV
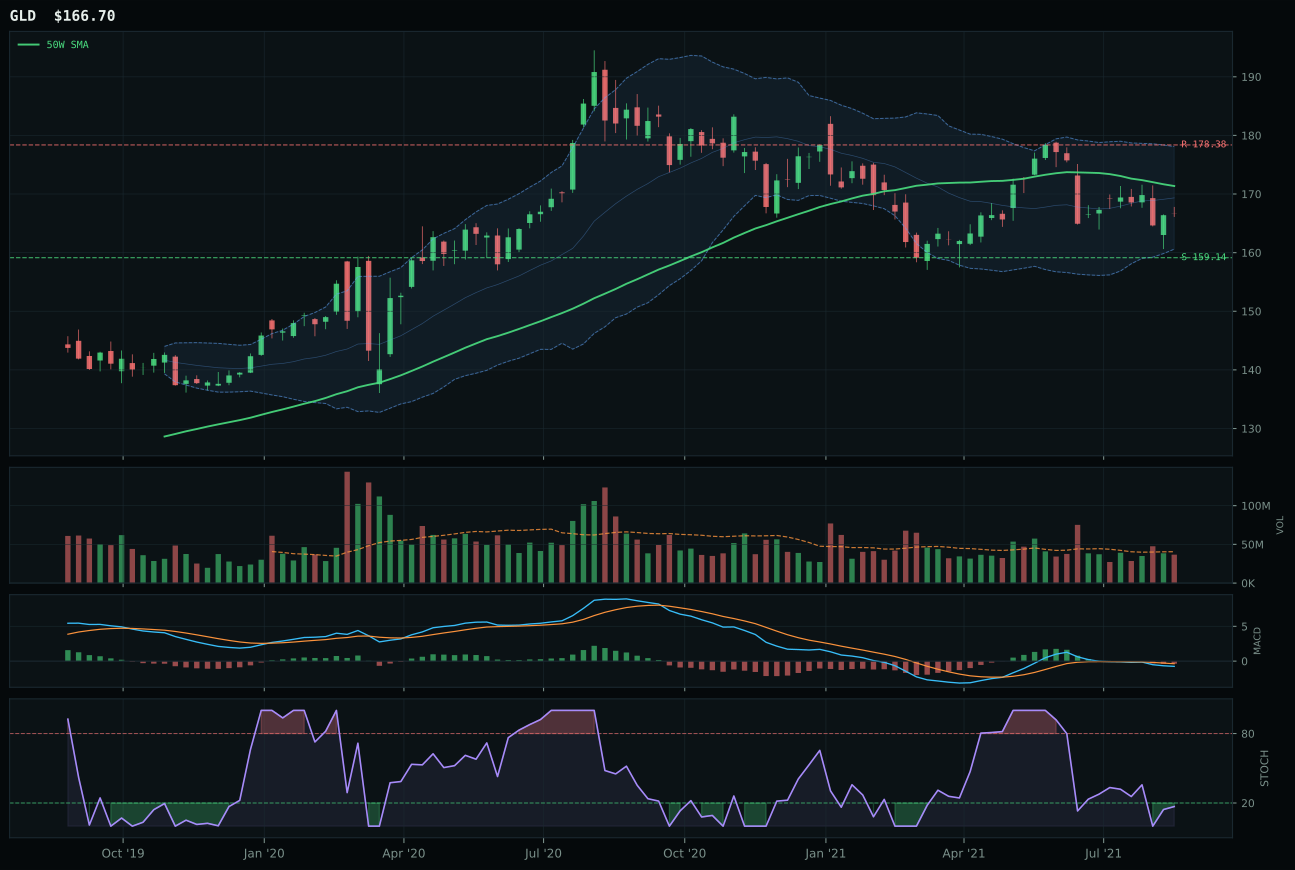
GLD has a pullback into support profile with -12.2% 13-week relative strength versus SPY.
A failed hold above support would weaken the setup.
Actionable but governed by invalidation levels.
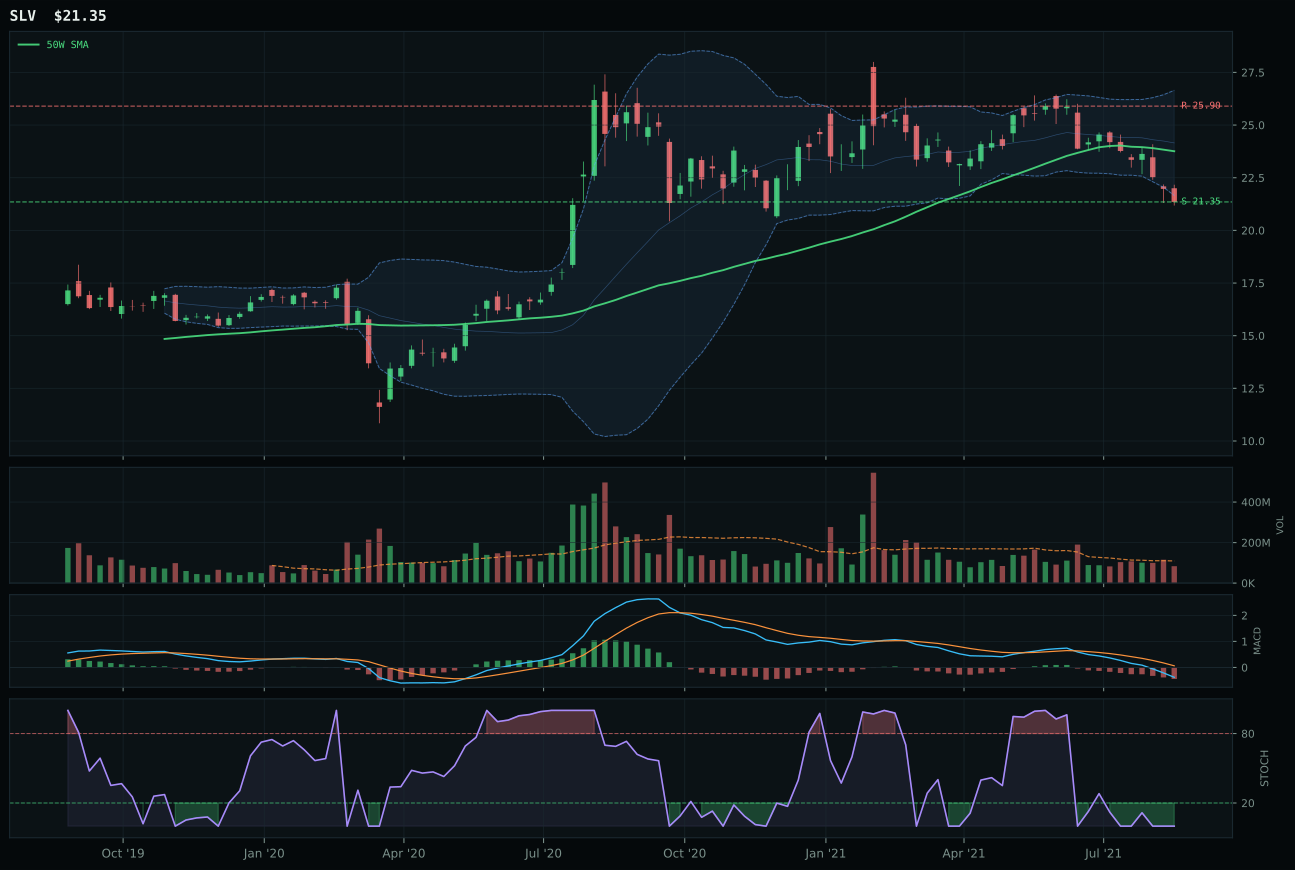
SLV has a pullback into support profile with -23.2% 13-week relative strength versus SPY.
A failed hold above support would weaken the setup.
Actionable but governed by invalidation levels.
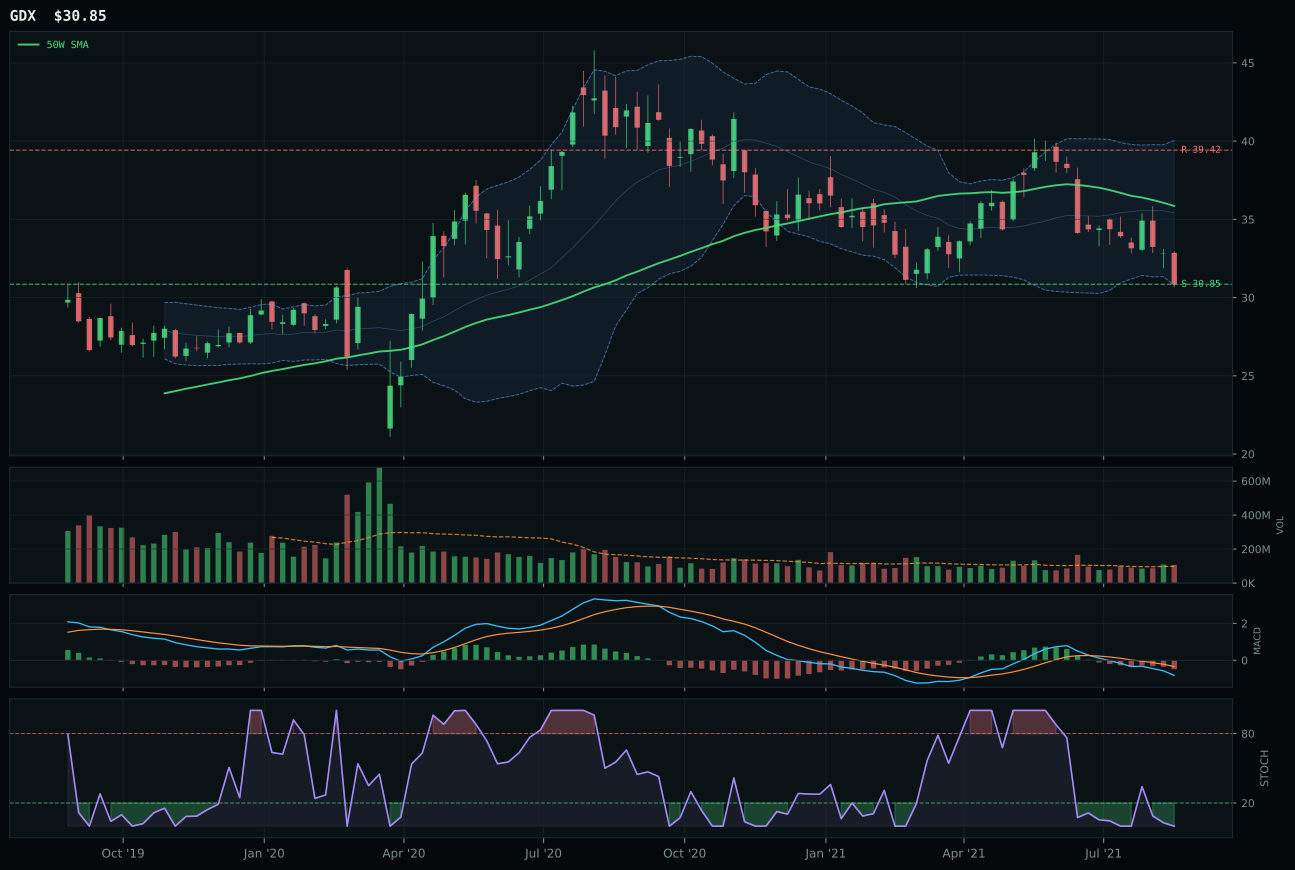
GDX has a pullback into support profile with -28.3% 13-week relative strength versus SPY.
A failed hold above support would weaken the setup.
Actionable but governed by invalidation levels.
SLV wins over GLD despite posting the worst absolute metrics in the category by offering the most attractive risk-reward asymmetry and the clearest technical invalidation at support 21.35. Both precious metals are deeply beaten down—SLV is -16.4% over 13 weeks and -23.2% versus SPY, GLD is -5.3% and -12.2% respectively—but SLV's 10.1% pullback from the 50-week moving average creates a deeper repair opportunity with 84.5 risk-reward (downside 0.0%, upside -17.6%) versus GLD's 77.8. The Fibonacci zone placement matters here: SLV sits near the 52-week low and 0.786 retracement, the ultimate capitulation zone where support becomes binary. Both show oversold stochastic RSI and bearish-weakening MACD, but SLV's further distance from the 50-week moving average means any bounce is likelier to signal genuine accumulation rather than a failed retest; GLD's only -2.7% distance leaves it vulnerable to rolling over again if support breaks.
Precious metals earned 5% allocation despite a category score of only 29.1 (ranking 9th) because the macro fit is surprisingly strong at 59.0, anchored by active metals scarcity (+7). Disinflation pressure (-6) and dollar pressure (+3) create conflicting signals, but in a TrendBTC regime where crypto volatility is elevated, SLV's oversold technical state and near-support Fibonacci location offer asymmetric risk-reward that justifies a tactical position. The portfolio's allocation structure already includes COPX (10%) and URA (5%) as real asset hedges, so the SLV addition is not a commodity bet but a reversion trade within an already-hedged real asset sleeve. SLV's 21.7 technical evidence score is poor, but the category's macro fit compensates at 59.0 because precious metals as monetary hedges benefit from broad-market bear dynamics and structural dollar cycles that are independent of near-term credit conditions. This is a two-week trade minimum rather than a strategic hold; if SLV closes above 23.50 on volume, the setup breaks and the allocation should recycle into other categories. The 5% slot keeps precious metals in the portfolio without overcommitting to a technically broken asset class.
Emerging Markets — INDA
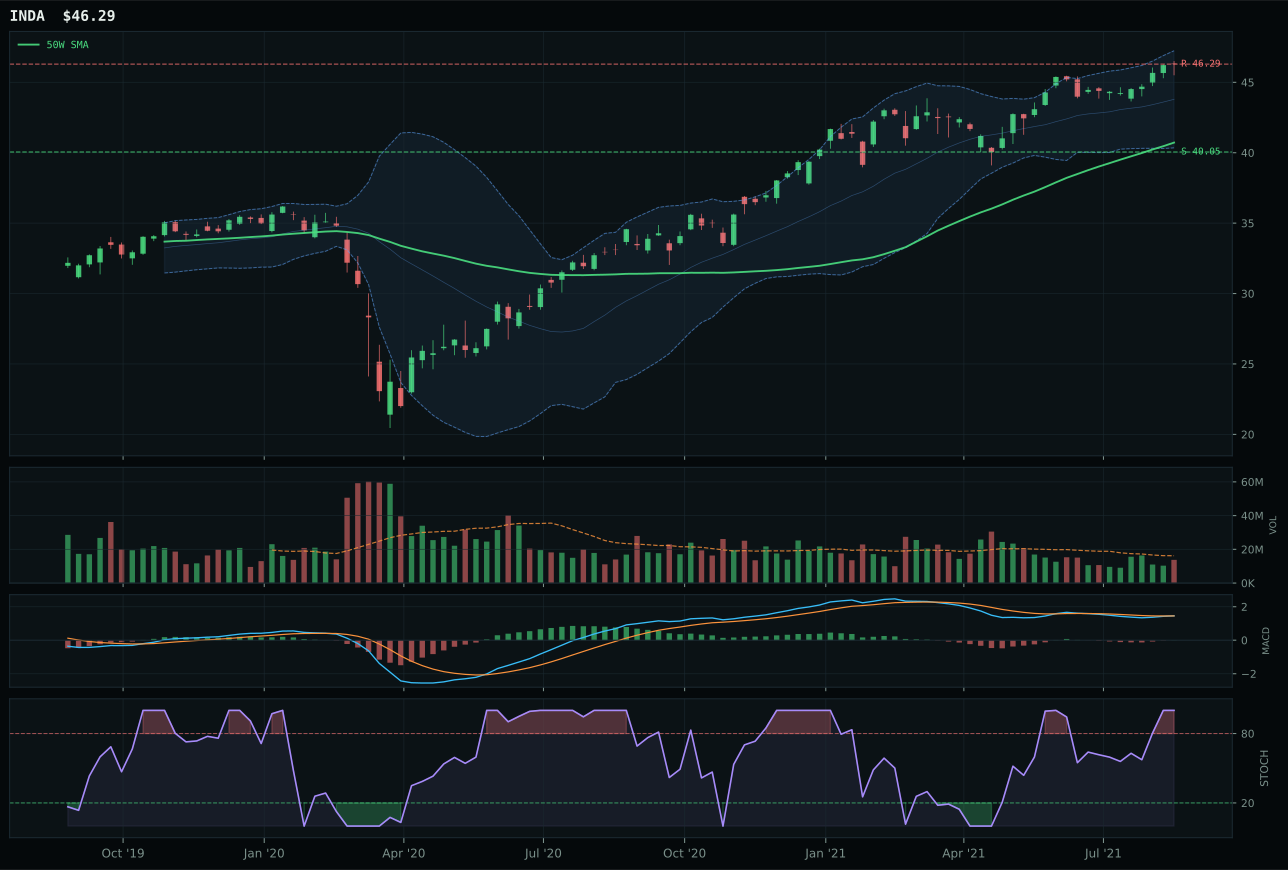
INDA has a neutral structure profile with 0.6% 13-week relative strength versus SPY.
A failed hold above support would weaken the setup.
Actionable but governed by invalidation levels.
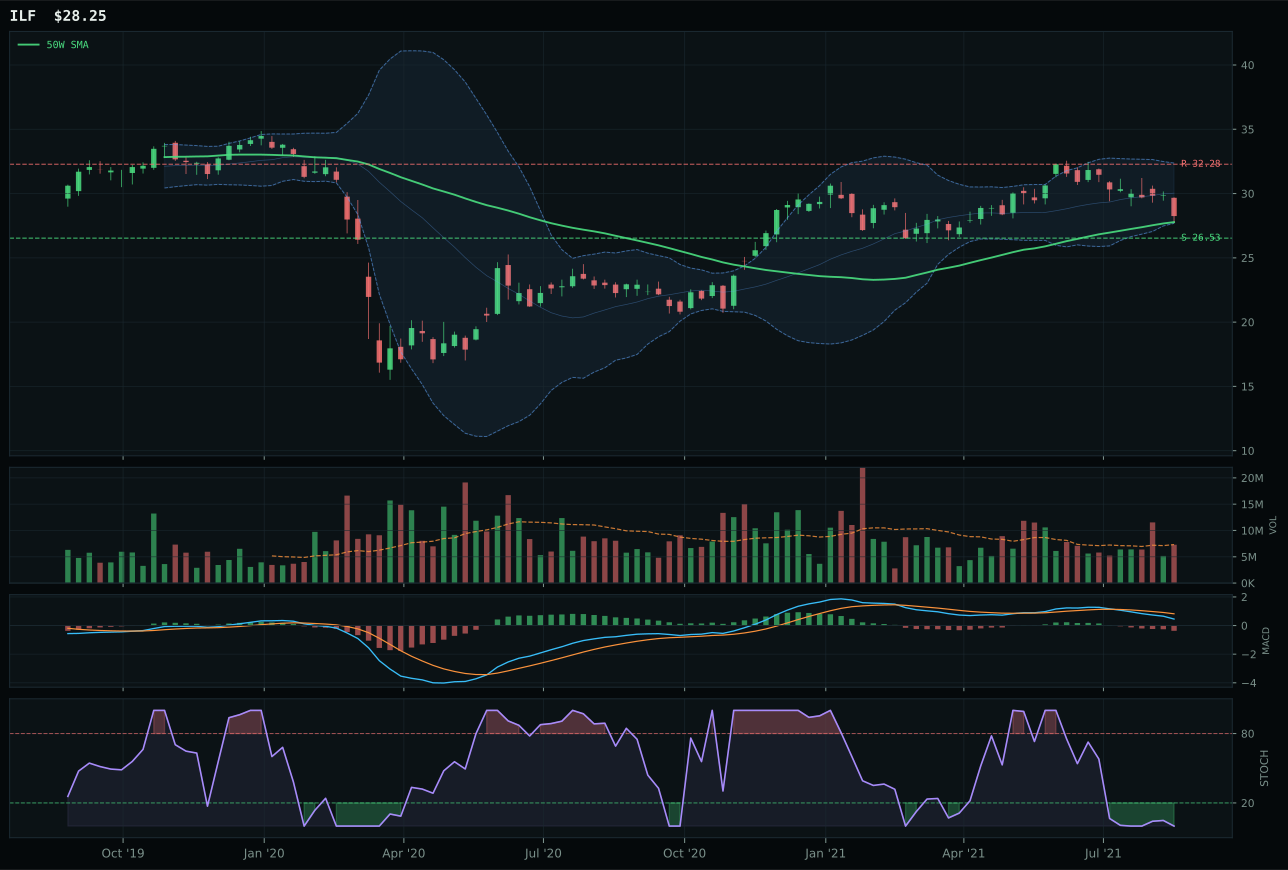
ILF has a compression near 50W profile with -11.0% 13-week relative strength versus SPY.
A failed hold above support would weaken the setup.
Actionable but governed by invalidation levels.
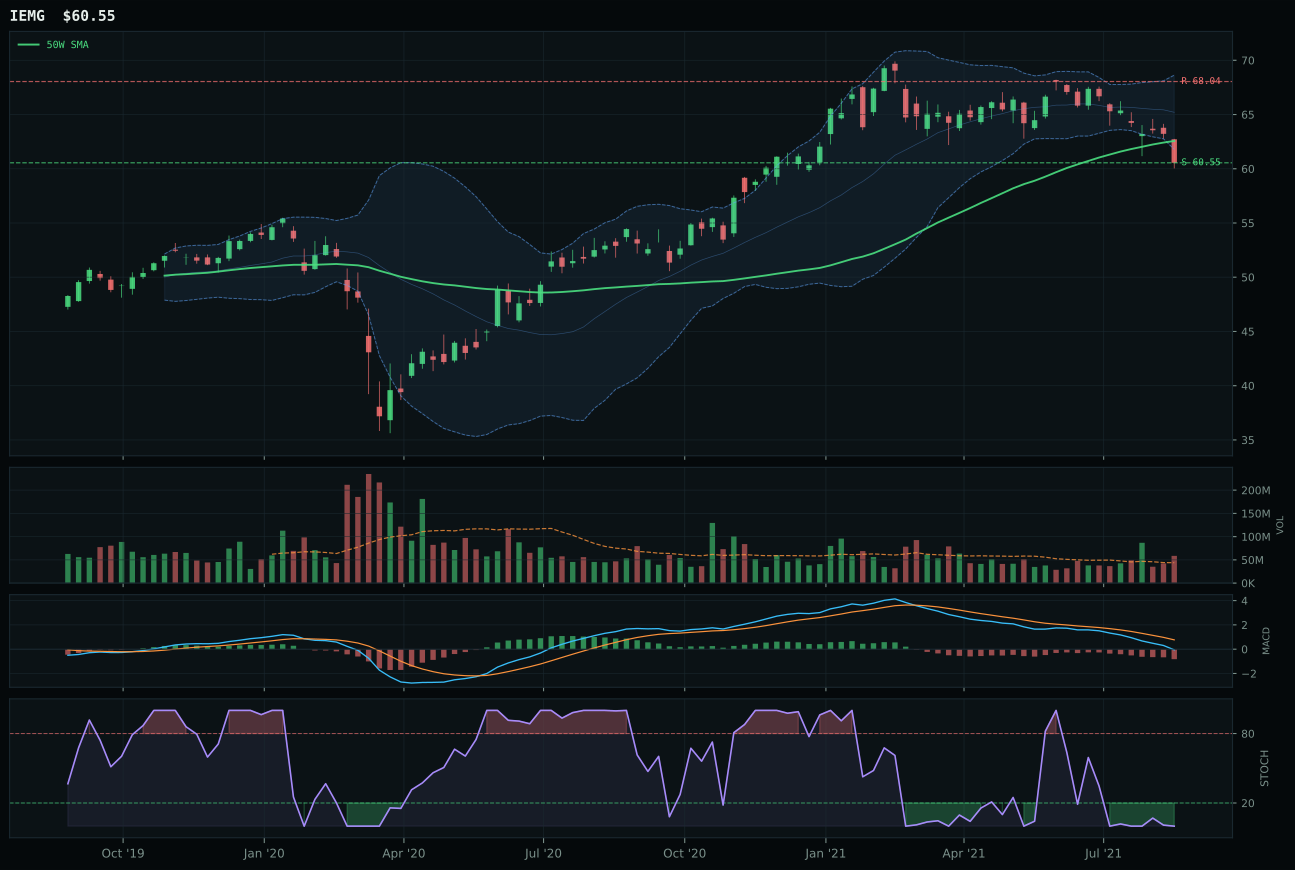
IEMG has a pullback into support profile with -12.9% 13-week relative strength versus SPY.
A failed hold above support would weaken the setup.
Actionable but governed by invalidation levels.
INDA demolishes the emerging-markets field by 37.2 points in reasoned proof order, capturing category leadership on a 100.0 trend score, 94.2 momentum confirmation, and dominant 11.6% category-relative strength that leaves ILF and IEMG in structural weakness. Price sits 13.7% above the 50-week moving average in the near-52-week-high extension zone with MACD bullish and improving and stochastic RSI at overbought 1.00—a seemingly dangerous setup masked by superior volume-price confirmation at 80.2 and persistence at 73.8. The 7.4% 13-week return and 11.6% category outperformance signal real equity demand into India, and the above-average 0.6% SPY relative strength in a period of broad weakness adds credibility to the move. ILF's bearish-weakening MACD and oversold stochastic RSI combined with -11.0% SPY underperformance render it a laggard, while IEMG's broad-based weakness (-12.9% SPY, -6.1% 13-week) places it in structural deterioration.
Emerging markets earned zero allocation despite INDA's strong technicals because the category-level macro fit is only 25.0, the worst in this portfolio. Dollar pressure is active and severe (-14), credit stress is active (-10), and broad-market bear is active (-9), creating a -33 macro headwind that dwarfs Goldilocks' +8 support. INDA's 7.4% 13-week return and bullish MACD are genuine, but they represent localized strength in a diseased category rather than evidence of macro support. The category score of 7.8 reflects that even the strongest performer (INDA at 69.2 reasoned evidence) cannot overcome the structural macro rejection of emerging markets broadly. Currency headwinds from dollar strength, credit stress in emerging market debt, and the broad-market bear regime all point EM weakness that will not reverse until the dollar cycle breaks or credit stress indicators flip materially. INDA would earn a 5% tactical trade allocation if it were isolated from category dynamics, but the allocation framework weights category-level macro fit at 38%, and emerging markets' fit is simply too poor. This is the clearest zero-allocation decision of the week: not because INDA is weak, but because the entire category macro regime is opposed to this portfolio's current state.
Traditional Energy — XLE
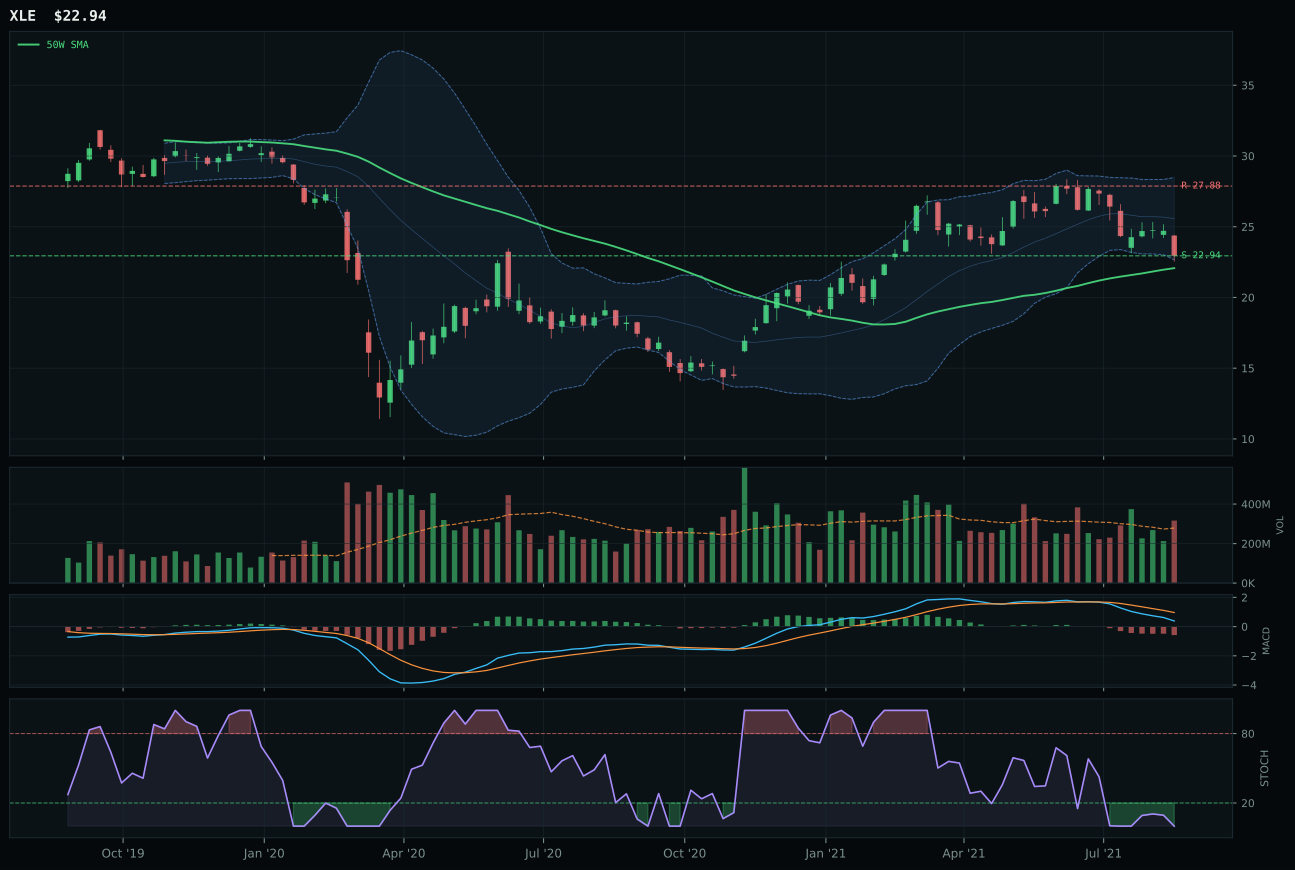
XLE has a pullback into support profile with -18.9% 13-week relative strength versus SPY.
A failed hold above support would weaken the setup.
Actionable but governed by invalidation levels.
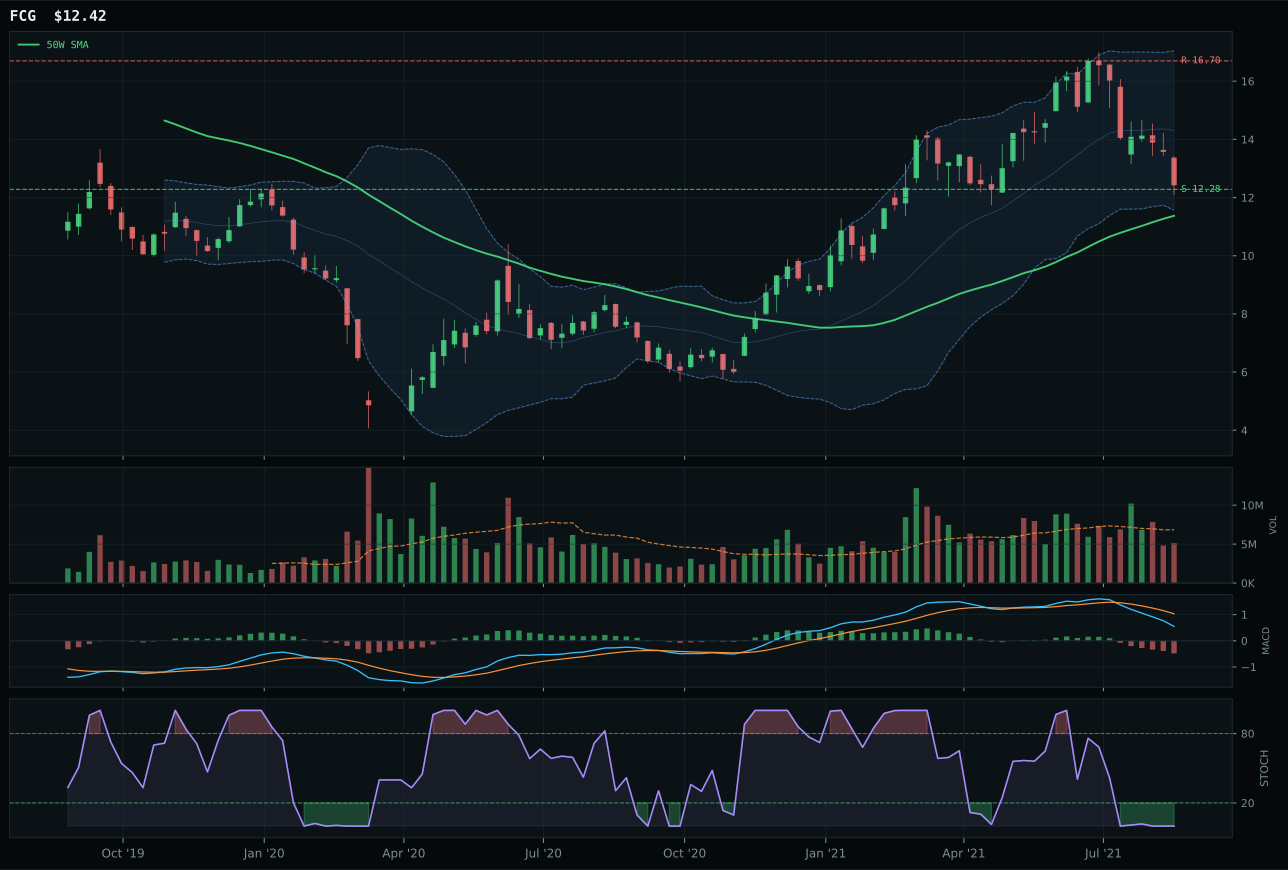
FCG has a pullback into support profile with -19.6% 13-week relative strength versus SPY.
A failed hold above support would weaken the setup.
Actionable but governed by invalidation levels.
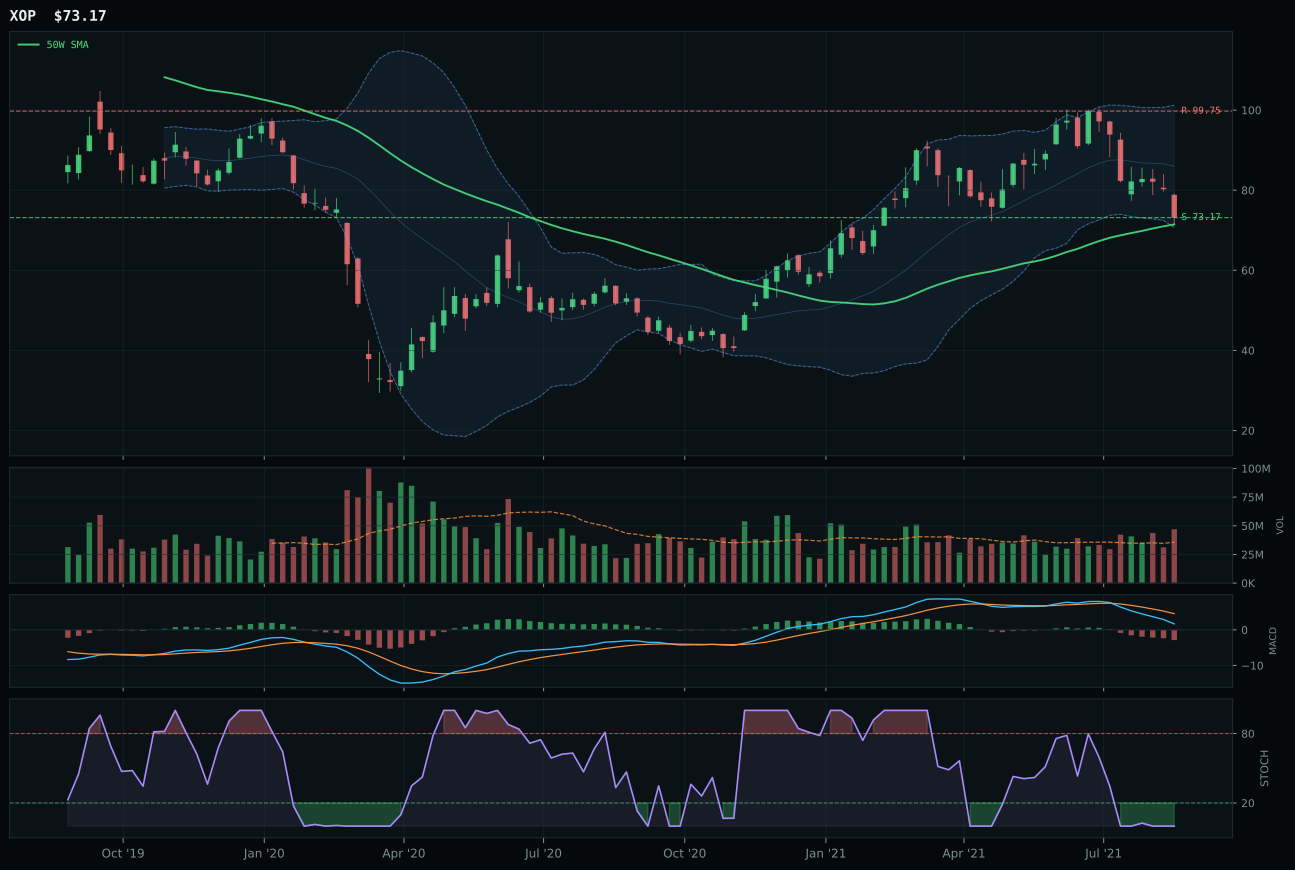
XOP has a pullback into support profile with -22.4% 13-week relative strength versus SPY.
A failed hold above support would weaken the setup.
Actionable but governed by invalidation levels.
XLE barely edges FCG by 3.2 points in the reasoned proof order and wins category representation primarily on superior timing (95.0 vs. 80.0) and the narrowest invalidation distance—just 4.0% from the 50-week moving average versus FCG's 9.2%. Both are pullback-into-support setups with oversold stochastic RSI 0.00 and bearish-weakening MACD, but XLE's proximity to the 50-week moving average combined with above-average volume participation at 1.14x the 20-week average suggests late-stage accumulation near trend. Risk-reward is virtually identical (84.8 vs. 83.0), and both post -18.9% to -19.6% SPY underperformance, making this a category-specific weakness rather than a relative strength play. The deciding factor is that XLE's near-trend pullback carries lower execution risk: a bounce from here signals trend resumption, whereas FCG's 9.2% distance creates ambiguity about whether weakness will extend further before support becomes credible.
Traditional energy earned zero allocation this week because the category score of 7.1 and rank of 9th or 10th explicitly exclude it from a capital-allocation portfolio operating in Goldilocks regime with disinflation pressure active (-10). The macro fit of 40.0 is the lowest of any category, driven by credit stress (-7) and disinflation pressure (-10) that directly penalize commodity input costs and energy capital expenditure. Real asset sponsorship (+7) provides some support, but it is insufficient to overcome the structural headwinds: central banks are not tightening, inflation expectations are declining, and energy demand is suspect in a mixed-growth environment. XLE's technical evidence is only 27.1, the second-lowest in the portfolio, and the momentum confirmation of 0.0 signals that no category participant is accumulating these shares—they are merely being bought at the lows by value investors accepting duration risk. The allocation committee concluded that energy's macro regime score is so poor relative to other categories that even a mean-reversion setup (which XLE does offer) does not justify capital commitment when alternatives like COPX, URA, and WEAT offer better regime fit. If credit stress indicators reverse or if inflation expectations stabilize, energy re-enters the allocation immediately; for now, the 0% weighting reflects a regime-based exclusion rather than technical rejection.