
2021-08-13
Informational purposes only. The content in this report, including allocations, analysis, and commentary, is provided solely for informational and educational purposes. It does not constitute financial advice, investment advice, trading advice, or any other type of advice. Past performance does not guarantee future results. Always conduct your own research and consult a qualified financial professional before making investment decisions.
Weekly Allocation
| Ticker | Category | Weight | Role |
|---|---|---|---|
| FSOL | 50% | Overlay | |
| IGV | Technology | 10% | Top-2 (10%) |
| PAVE | Utilities & Infrastructure | 10% | Top-2 (10%) |
| SMH | AI | 5% | Tier-2 (5%) |
| COPX | Industrial Metals | 5% | Tier-2 (5%) |
| WEAT | Agriculture & Livestock | 5% | Tier-2 (5%) |
| ITA | Defense & Aerospace | 5% | Tier-2 (5%) |
| URNM | Nuclear Energy | 5% | Tier-2 (5%) |
| GDX | Precious Metals | 5% | Tier-2 (5%) |
Trade Instructions — Monday Open
Sell the tranche from 2021-07-16 (completing its 4-week hold). Buy the new tranche. Instructions show net portfolio changes — same-asset positions cancel, weight changes show the delta.
| Action | Ticker | Instruction |
|---|---|---|
| SELL | FBTC | Sell 50% of FBTC position (reduce 25.00% → 12.50%) |
| SELL | XLK | Sell 50% of XLK position (reduce 5.00% → 2.50%) |
| SELL | INDA | Sell entire INDA position (2.50% of portfolio) |
| SELL | GLD | Sell 25% of GLD position (reduce 5.00% → 3.75%) |
| SELL | XLU | Sell 25% of XLU position (reduce 5.00% → 3.75%) |
| BUY | URNM | Buy URNM — 6.25% of freed cash (adds 1.25% to portfolio) |
| BUY | FSOL | Buy FSOL — 62.50% of freed cash (adds 12.50% to portfolio) |
| BUY | IGV | Buy IGV — 12.50% of freed cash (adds 2.50% to portfolio) |
| BUY | PAVE | Buy PAVE — 12.50% of freed cash (adds 2.50% to portfolio) |
| BUY | GDX | Buy GDX — 6.25% of freed cash (adds 1.25% to portfolio) |
Current Portfolio After Trade
Combined holdings across all 4 active tranches. Each tranche is 25% of the portfolio.
| Ticker | % of Portfolio | Weight Bar |
|---|---|---|
| FSOL | 37.50% | |
| FBTC | 12.50% | |
| COPX | 6.25% | |
| SMH | 5.00% | |
| ITA | 5.00% | |
| URNM | 5.00% | |
| IGV | 5.00% | |
| GLD | 3.75% | |
| WEAT | 3.75% | |
| XLU | 3.75% | |
| XLK | 2.50% | |
| REMX | 2.50% | |
| CIBR | 2.50% | |
| PAVE | 2.50% | |
| ILF | 1.25% | |
| GDX | 1.25% |
Macro Regime — Goldilocks
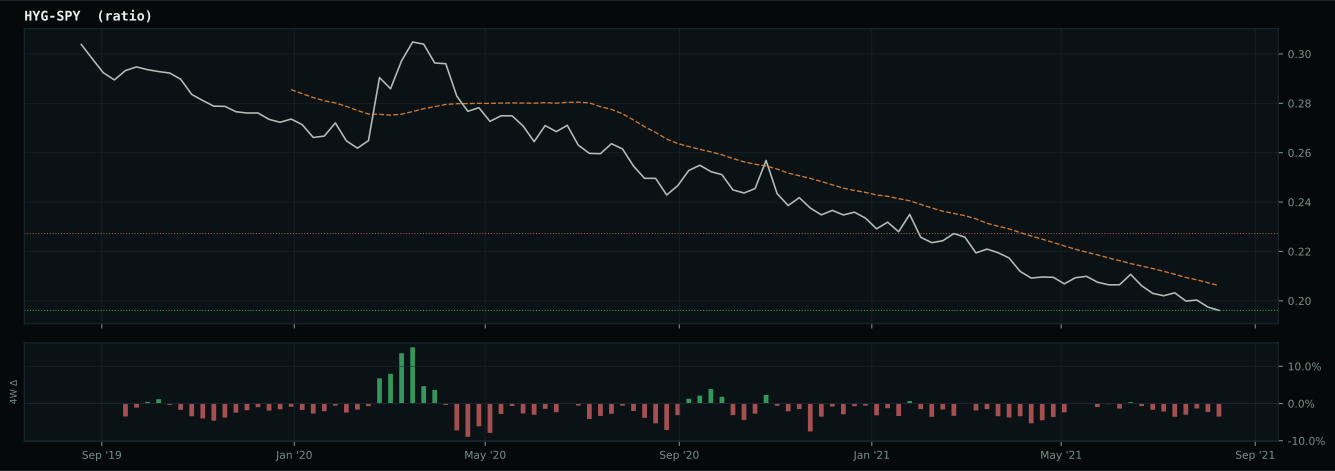
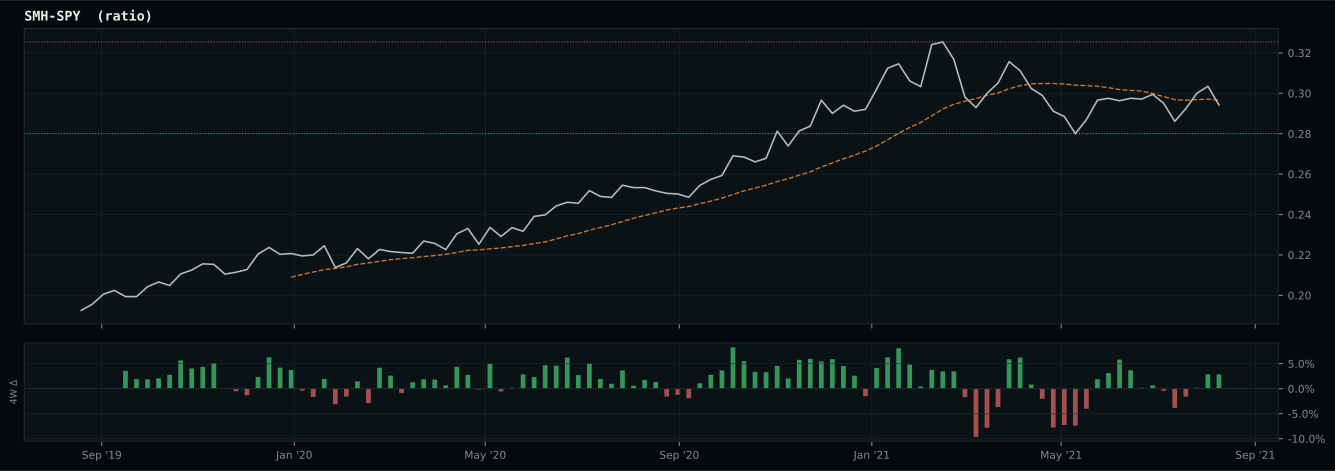
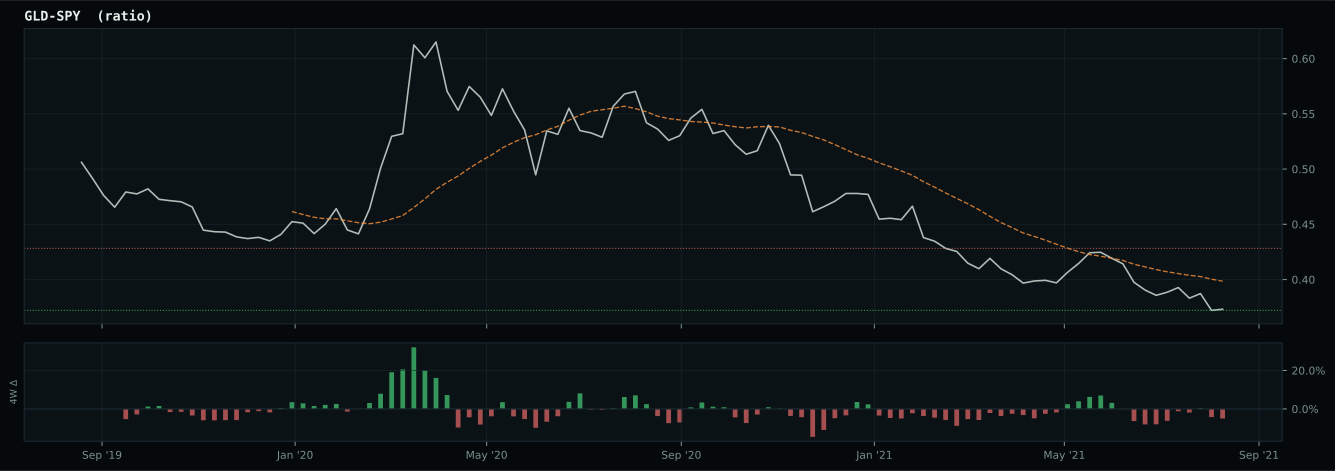
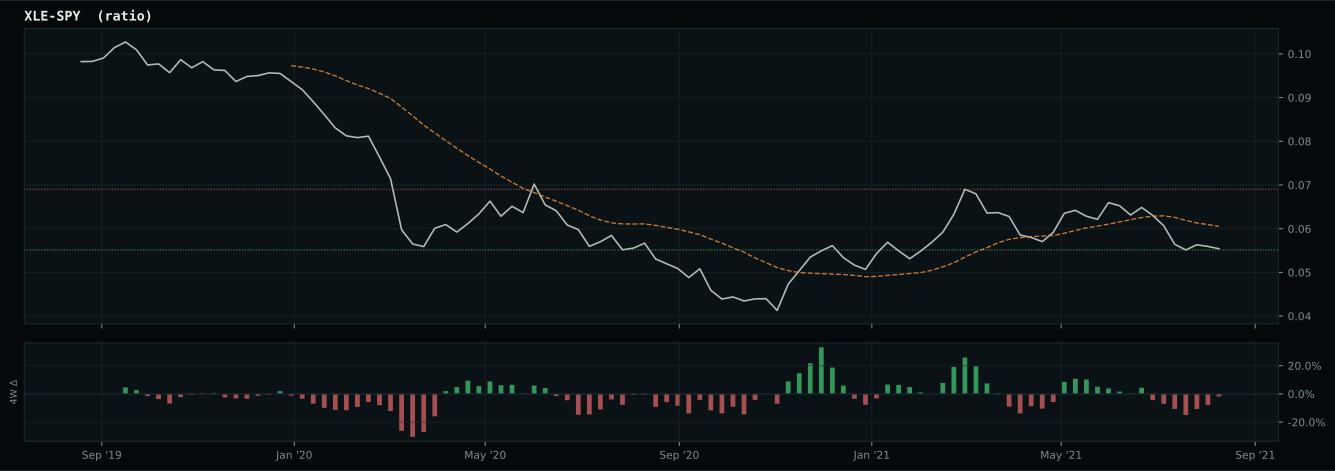
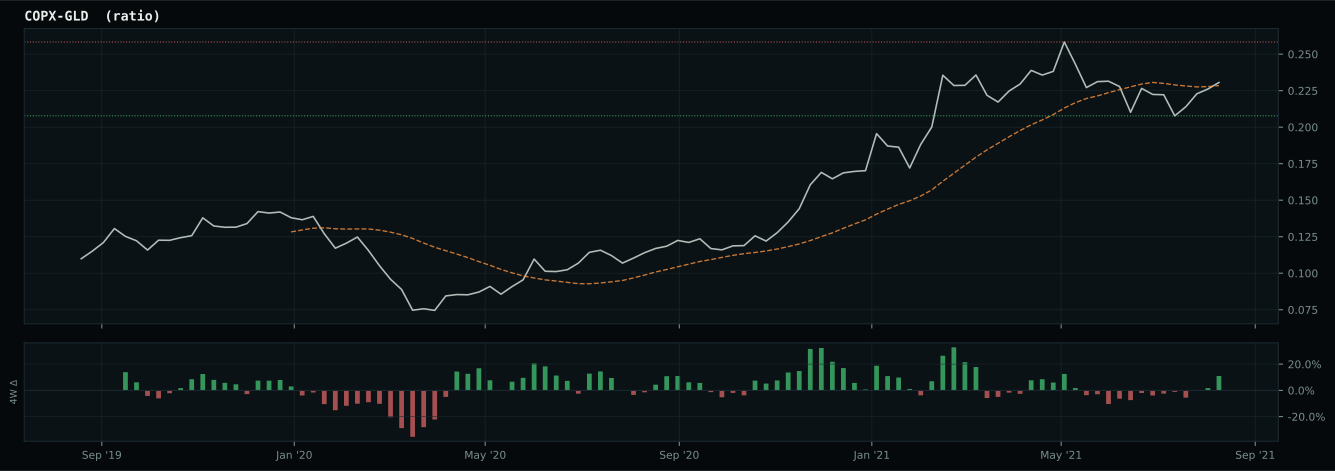
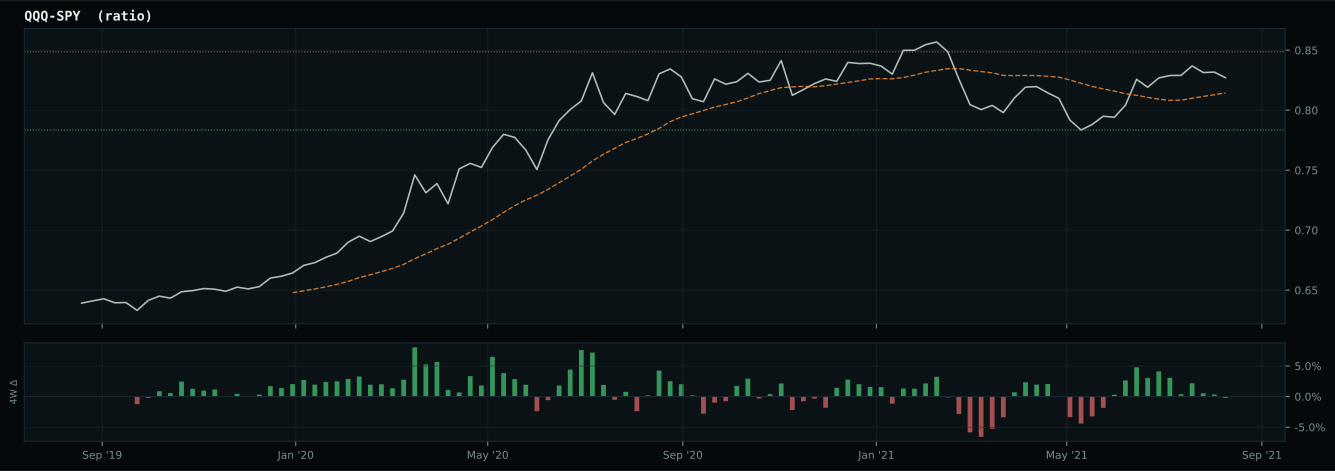
Macro Evidence Charts
Market-implied signals behind the macro regime scores. Each ratio compares two assets; the direction and slope of the ratio is what the macro engine reads.
Crypto Regime — AltSeason
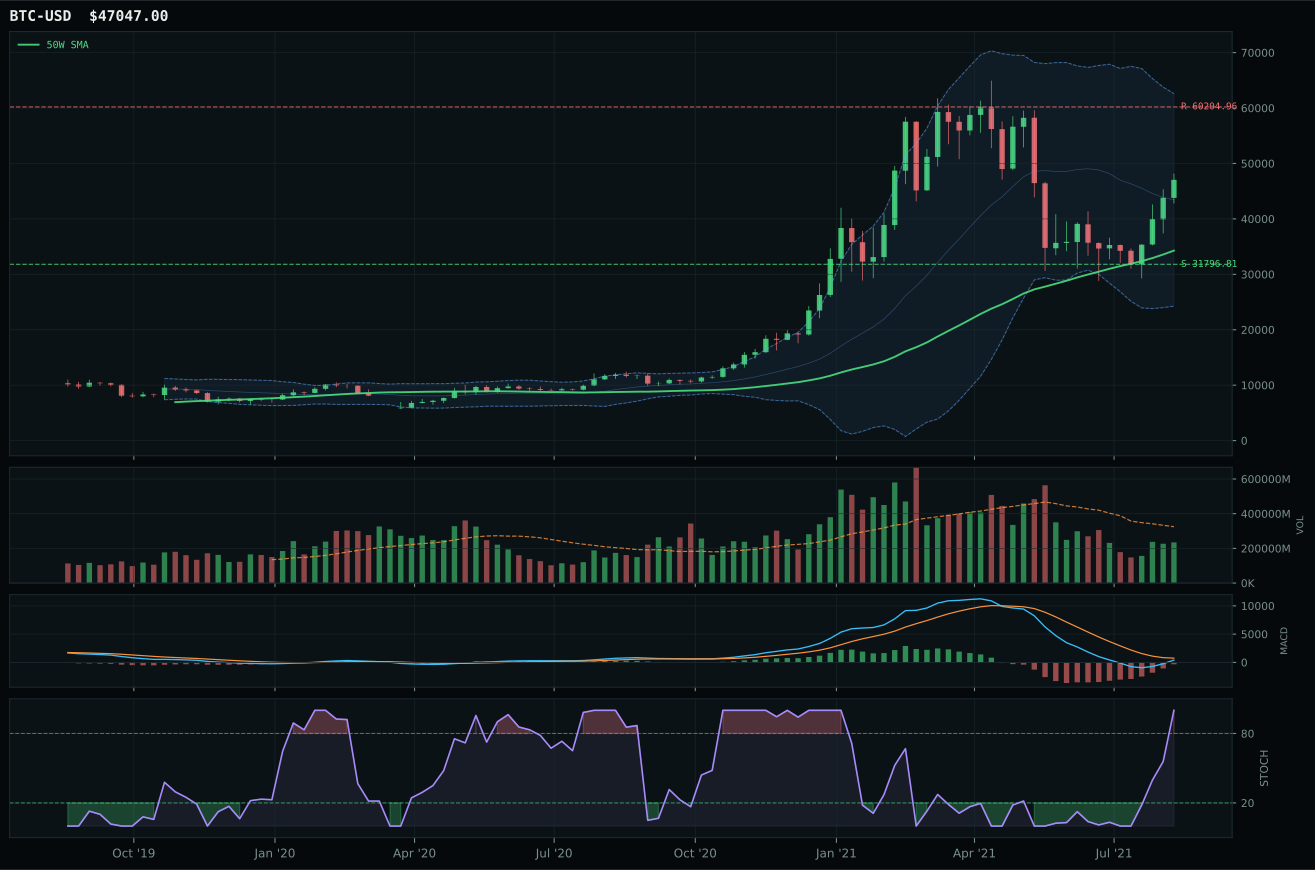
ValueBTC not armed: BTC has not made the first post-breakdown touch of the 200W buy zone after losing the 50W
TrendBTC confirmed: 2 consecutive closes above rising/flat 50W SMA
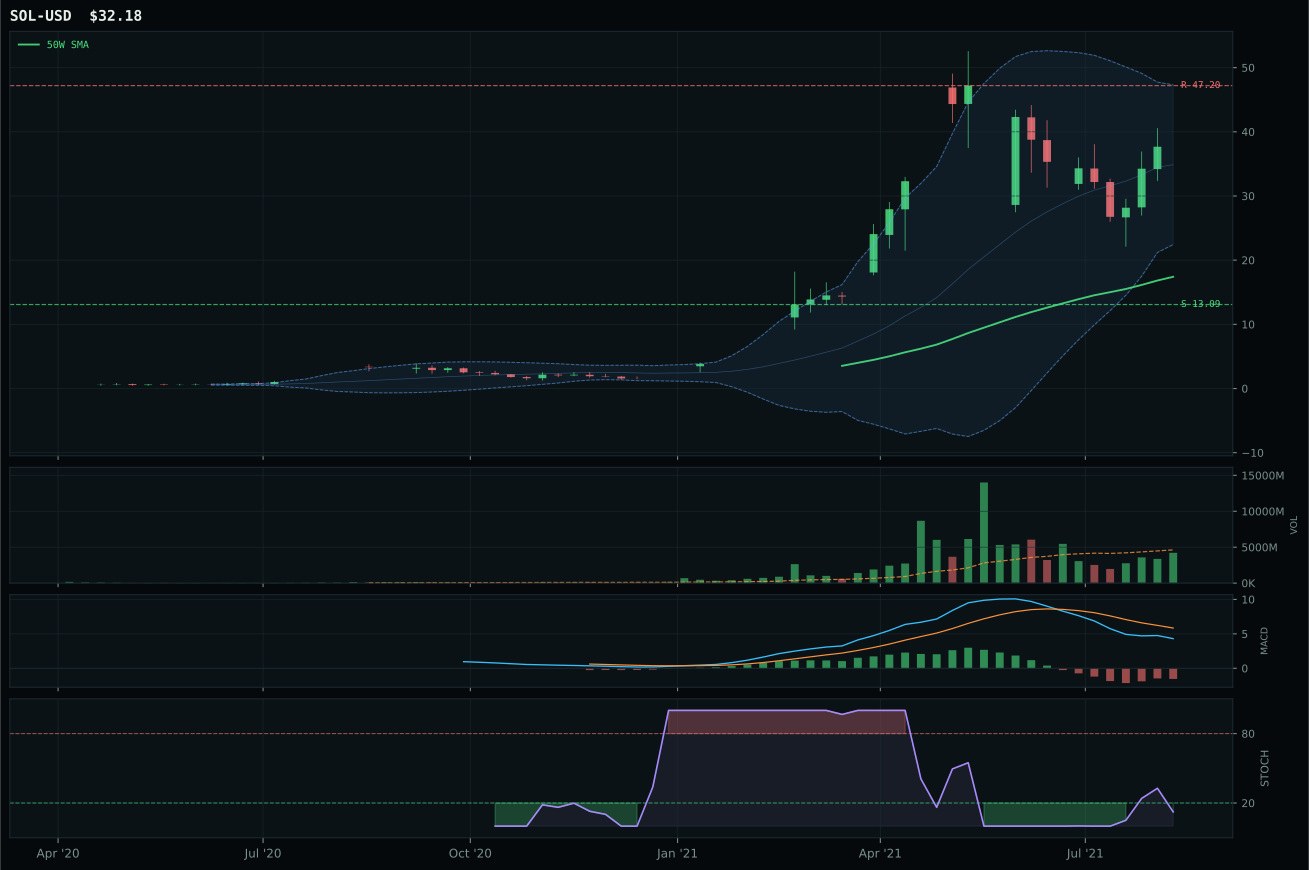
all available AltSeason conditions pass; missing optional confirmations skipped
Category Rankings
| Rank | Category | Winner | Score | Alloc | 4W Ret | Peers (4W) |
|---|---|---|---|---|---|---|
| 1 | Technology | IGV | 69.5 | 20% | +3.41% | CIBR +4.7% · XLK +2.1% |
| 2 | Utilities & Infrastructure | PAVE | 64.3 | 20% | -2.19% | XLU +0.5% · IGF +1.5% |
| 3 | AI | SMH | 57.9 | 10% | +5.02% | BOTZ +11.6% · AIQ +3.3% |
| 4 | Industrial Metals | COPX | 49.3 | 10% | -0.11% | REMX +8.9% · PICK -3.4% |
| 5 | Agriculture & Livestock | WEAT | 43.7 | 10% | -10.83% | MOO -0.0% · VEGI -1.2% |
| 6 | Defense & Aerospace | ITA | 35.2 | 10% | -3.92% | XAR -2.7% · ROKT -1.3% |
| 7 | Nuclear Energy | URNM | 34.6 | 10% | +67.91% | URA +47.3% · NLR +5.8% |
| 8 | Precious Metals | GDX | 32.5 | 10% | -3.59% | GLD +0.4% · SLV -0.9% |
| 9 | Emerging Markets | INDA | 19.1 | 0% | +6.50% | ILF -3.8% · IEMG +2.5% |
| 10 | Traditional Energy | XLE | 8.0 | 0% | -0.70% | XOP +8.1% · FCG +9.3% |
Technology — IGV
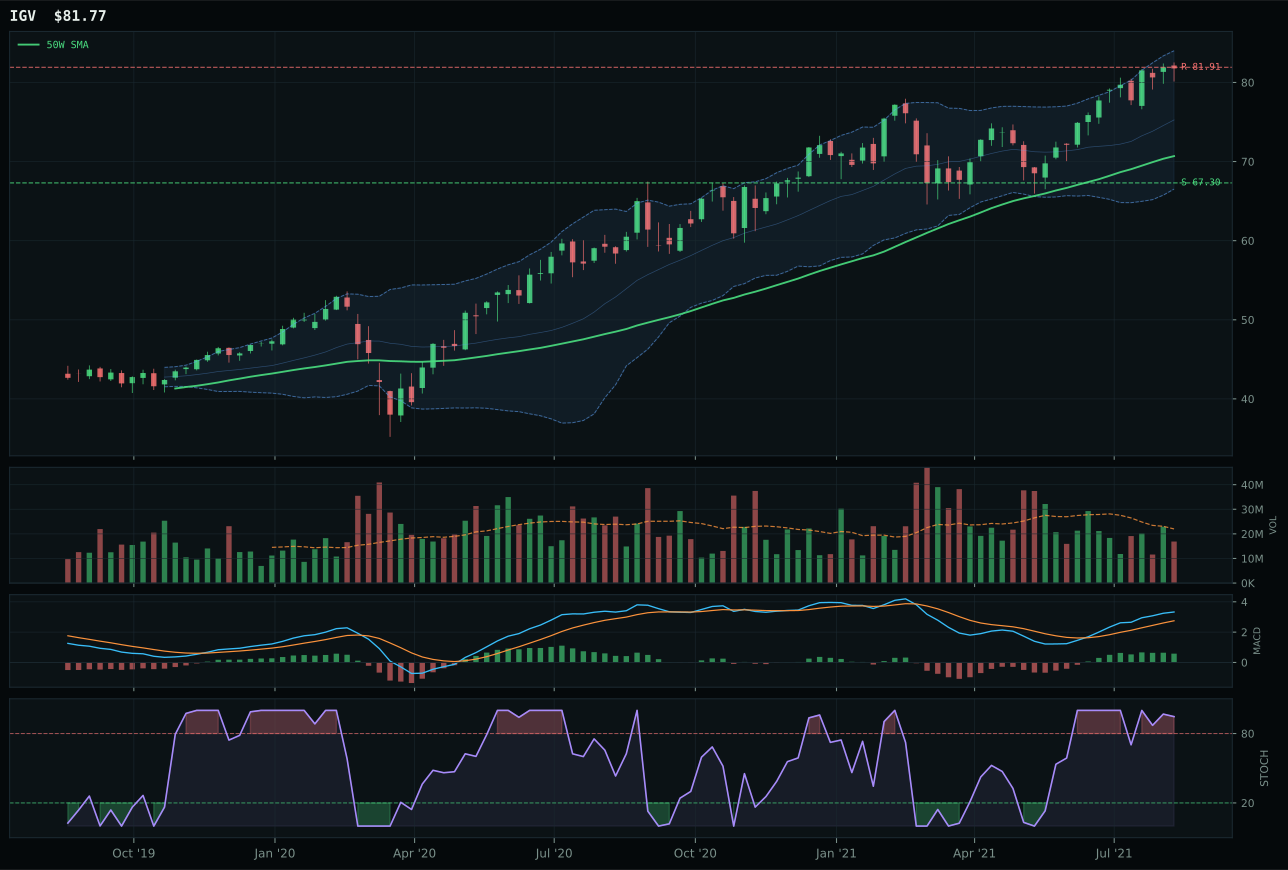
IGV has a vertical extension profile with 12.3% 13-week relative strength versus SPY.
A failed hold above support would weaken the setup.
Actionable but governed by invalidation levels.
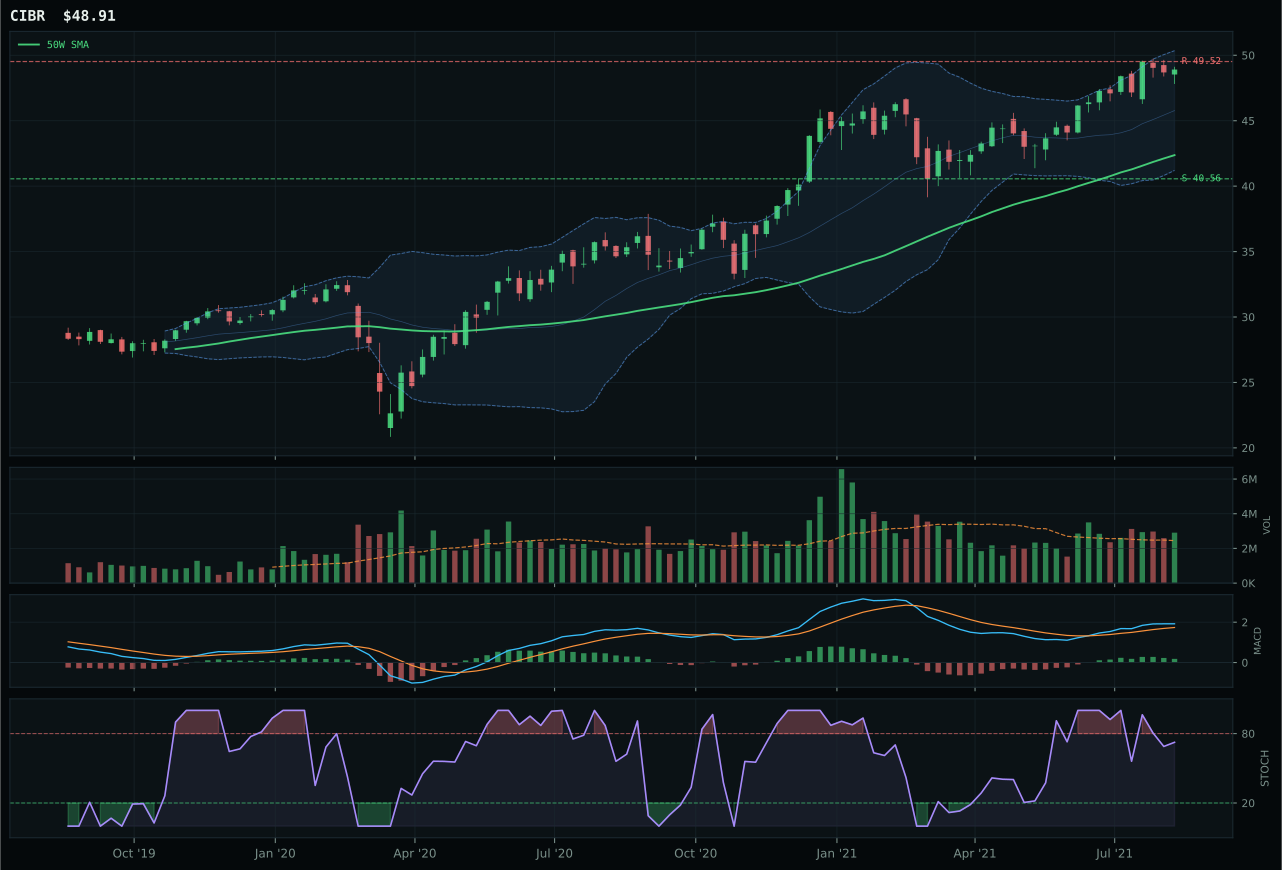
CIBR has a vertical extension profile with 6.5% 13-week relative strength versus SPY.
A failed hold above support would weaken the setup.
Actionable but governed by invalidation levels.
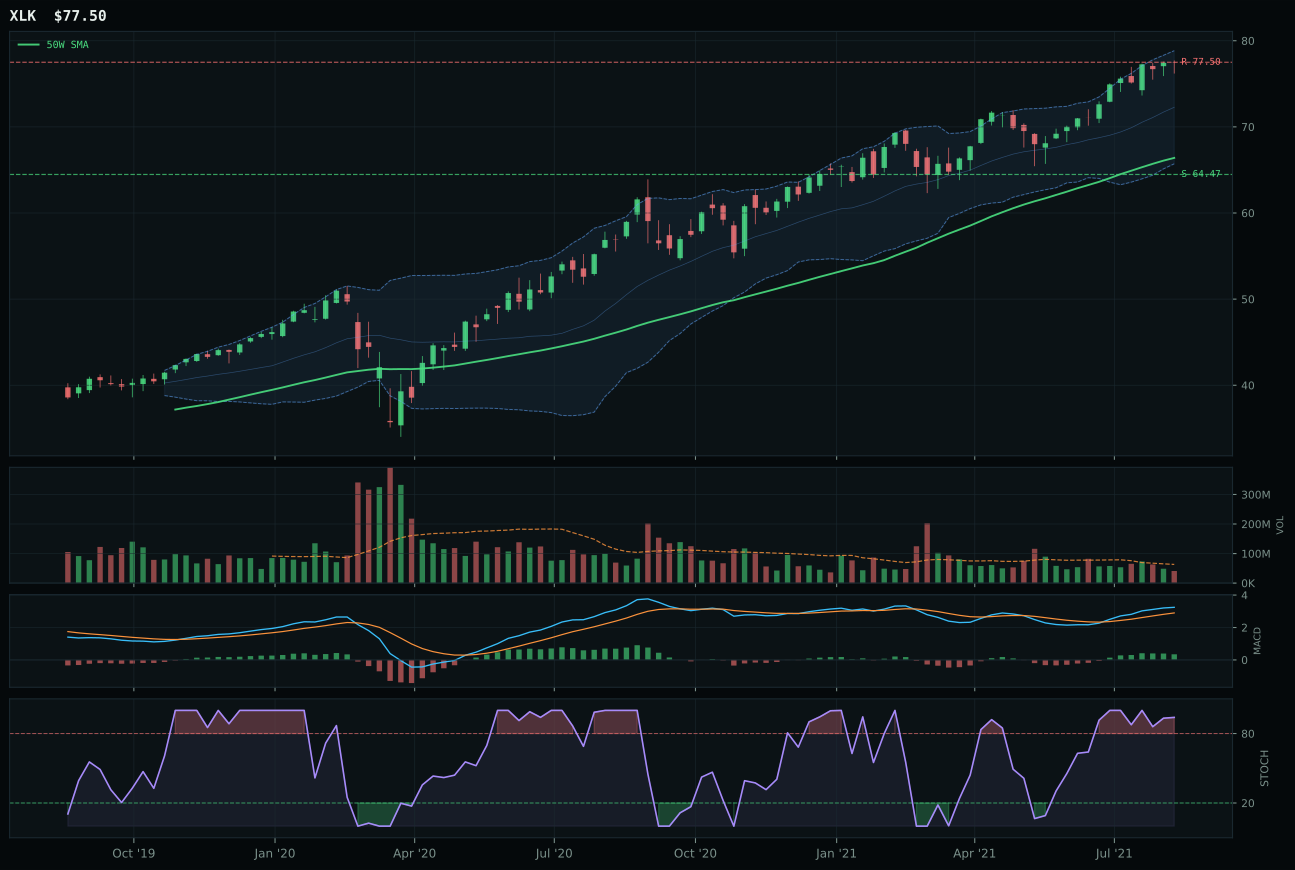
XLK has a vertical extension profile with 6.9% 13-week relative strength versus SPY.
A failed hold above support would weaken the setup.
Actionable but governed by invalidation levels.
IGV wins the category because it pairs confirmed uptrend mechanics with measurable relative strength advantage over its peers. Price sits cleanly above both the 50W and 200W with a 0.5% slope, placing IGV at 15.7% extension—a setup that would normally invite caution, but the 12.3% RS versus SPY and 5.4% dominance over CIBR within the category basket justify the extended entry. MACD is bullish and improving while stochastic RSI rolls over from overbought, creating a textbook deceleration pattern that caps upside but preserves the trend. CIBR, the runner-up, suffers from weaker structure (77.6 vs 79.5) and flattening MACD confirmation; its 6.5% RS to SPY and -0.5% category-relative strength represent a clear technical step below IGV's conviction. Volume sits neutral at 0.77x 20W average, meaning the move has room to continue without requiring forced participation—a feature of organic leadership.
Technology earned its top-2 slot at 10% allocation because it scored 69.5, placing it among the two highest eligible categories this week. The category benefits from a Goldilocks macro regime and active risk-appetite sponsorship, which combine to support duration-sensitive growth at reasonable valuations. A 62% weighting on technical evidence and 38% on macro narrative fit reveals why the setup works: IGV's trend strength and relative dominance earned it a 70 composite score, and the broader category macro fit of 67.0 reflects positive tailwinds from disinflation pressure and AI growth sponsorship, offset partially by credit stress headwinds. The decision to allocate at the top tier rests on the quality of the technical proof—clean trend, improving momentum, and category-relative separation—rather than on macro hopes alone. Should the 50W slope deteriorate or RS to SPY fall below 8%, Technology would become vulnerable to reallocation in a subsequent week.
Utilities & Infrastructure — PAVE
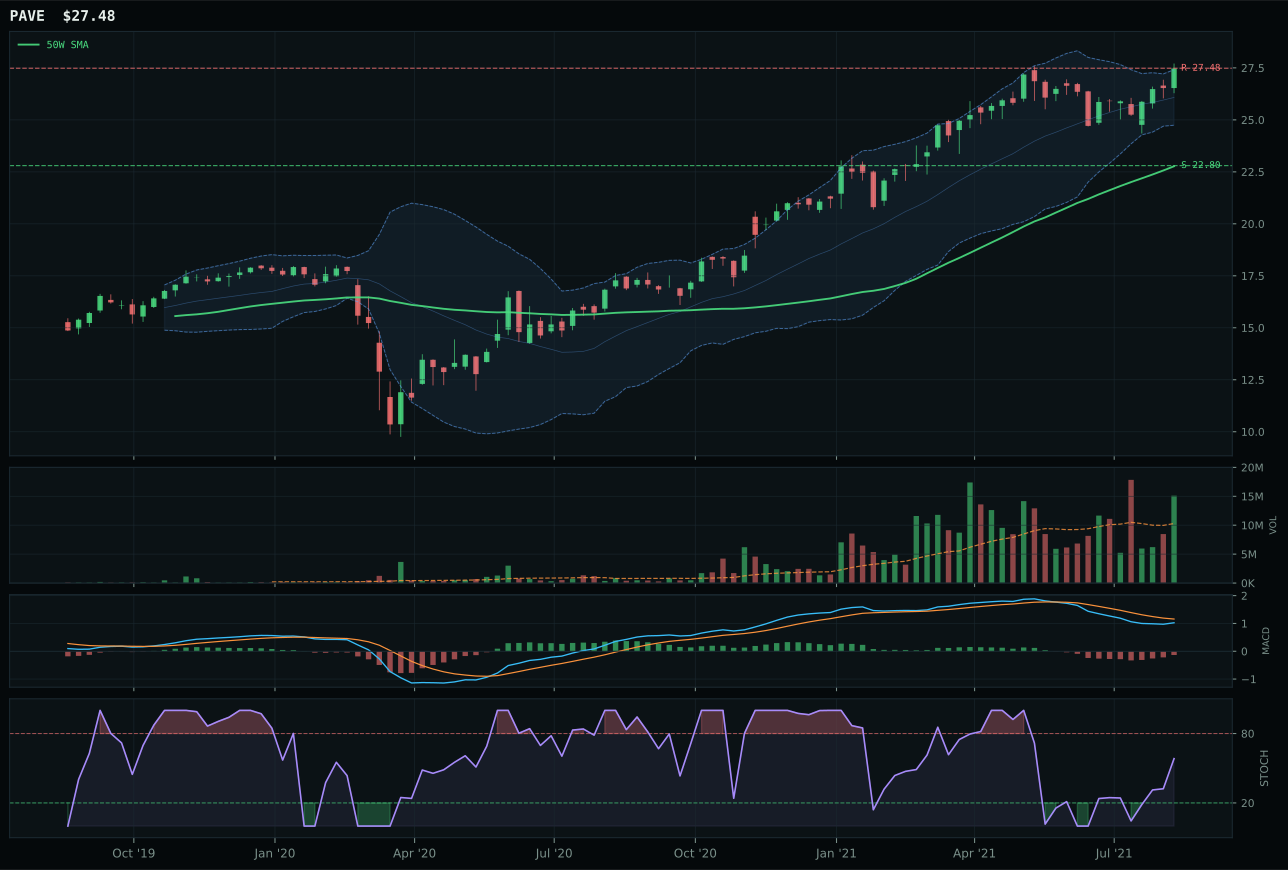
PAVE has a vertical extension profile with -4.7% 13-week relative strength versus SPY.
A failed hold above support would weaken the setup.
Actionable but governed by invalidation levels.
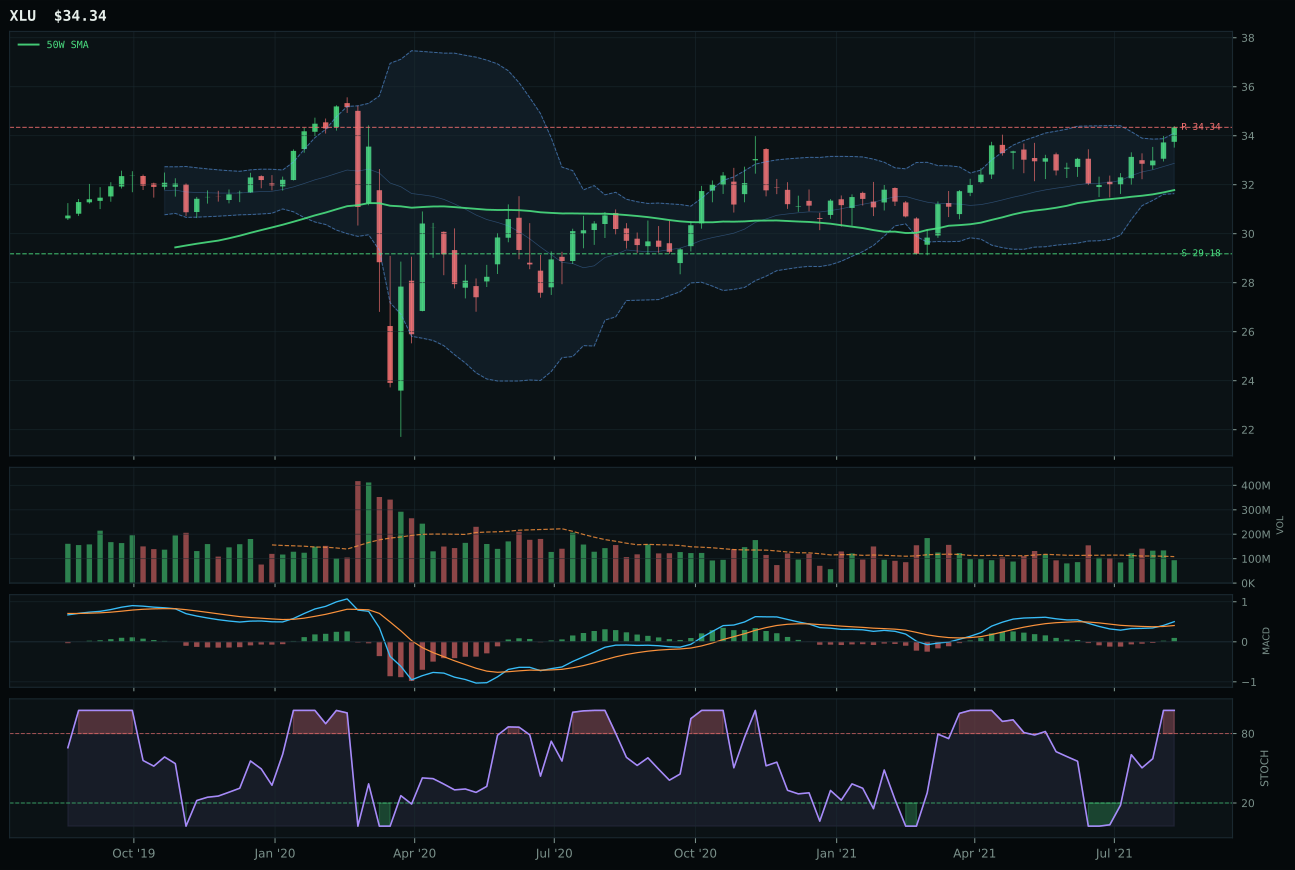
XLU has a neutral structure profile with -2.8% 13-week relative strength versus SPY.
A failed hold above support would weaken the setup.
Actionable but governed by invalidation levels.
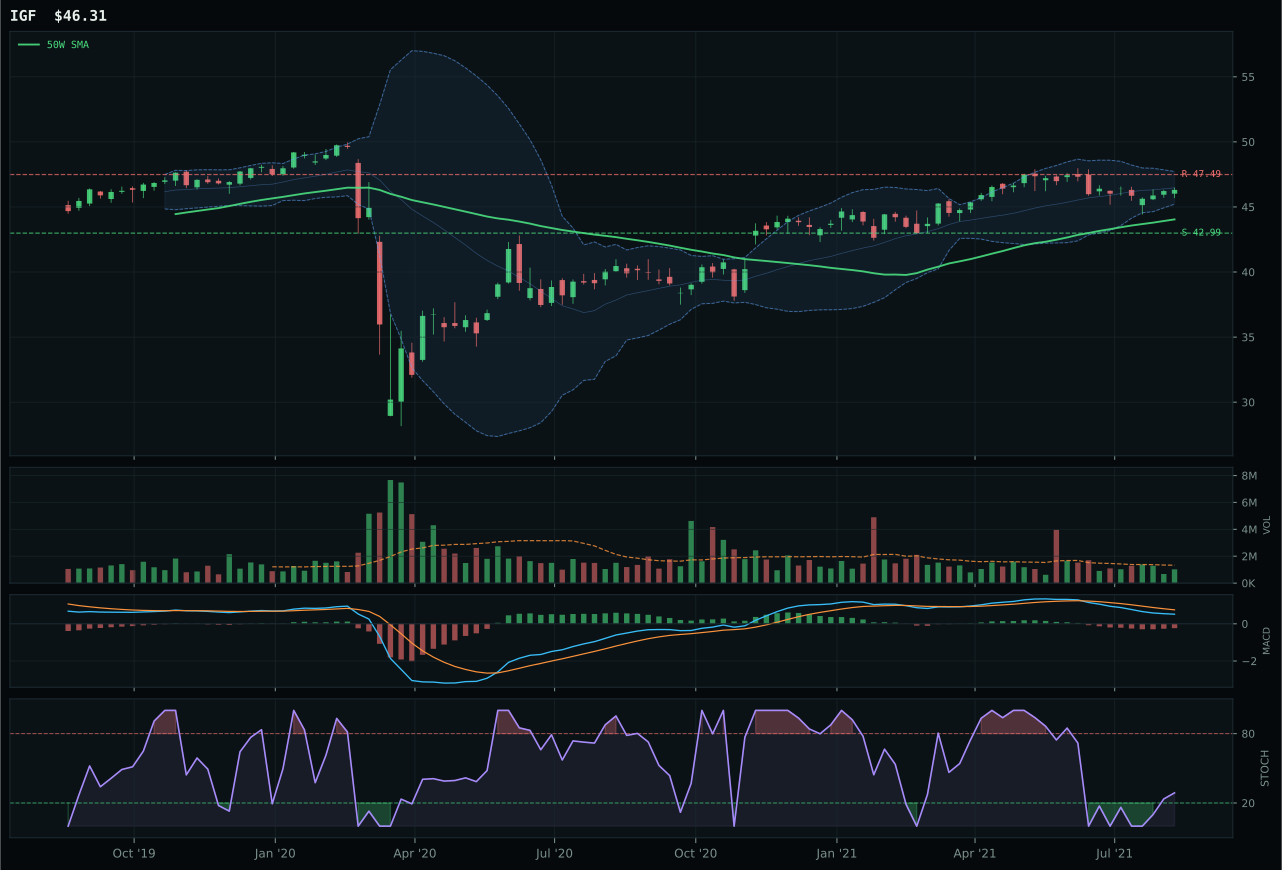
IGF has a neutral structure profile with -9.3% 13-week relative strength versus SPY.
A failed hold above support would weaken the setup.
Actionable but governed by invalidation levels.
PAVE wins its category and earns top-2 status by delivering uptrend structure with measurable institutional sponsorship despite significant timing penalty. Price sits 20.7% above the 50W with a 0.9% slope—an extension that normally invites caution—but volume at 1.47x 20W average (above-average participation) confirms that institutions are accumulating rather than distributing into the rally. Category-relative strength at 0.0% versus XLU's +1.9% is a narrow gap, and the 2.3% 13W return lags XLU's 4.2%, but PAVE's 4W return of 8.8% shows momentum accelerating into the extension, a pattern distinct from terminal exhaustion. Stochastic RSI at 0.58 in the rising mid-zone paired with bullish-but-improving MACD creates the same deceleration-without-reversal structure seen in PAVE's Technical peers. XLU, the runner-up, posts superior 96 trend and 76 technical evidence, but its overbought stochastic RSI at 1.00 and neutral volume confirm it is extended without institutional follow-through. PAVE's infrastructure exposure and capex-sensitivity narrative matter less than the volume sponsorship separating it from XLU.
Utilities & Infrastructure earned top-2 allocation at 10% because the category scored 64.3, the second-highest among all ten categories this week. PAVE's selection as representative (composite 62) reflects a deliberate choice of infrastructure capex beta over XLU's regulated utility defense in a Goldilocks regime where economic growth tailwinds support spending rather than just safety. Category macro fit of 62.0 is supported by disinflation pressure at +6 and broad market bear at +4, creating conditions where both growth and defensive exposures are supported. The 79.4 structure score for PAVE indicates a cleanly formed vertical extension with good compression and defined support/resistance, the foundation for a breakout hold. The allocation reflects conviction that Utilities & Infrastructure combines defensiveness with economic-linked upside in an environment that is neither recessionary nor inflationary—the definition of Goldilocks. For this category to retain top-2 status into the following week, PAVE must maintain above-average volume participation and hold the rising mid-zone in stochastic RSI; any roll-over into overbought territory or volume drop below 1.0x 20W average would suggest the move is becoming extended and vulnerable to correction.
AI — SMH
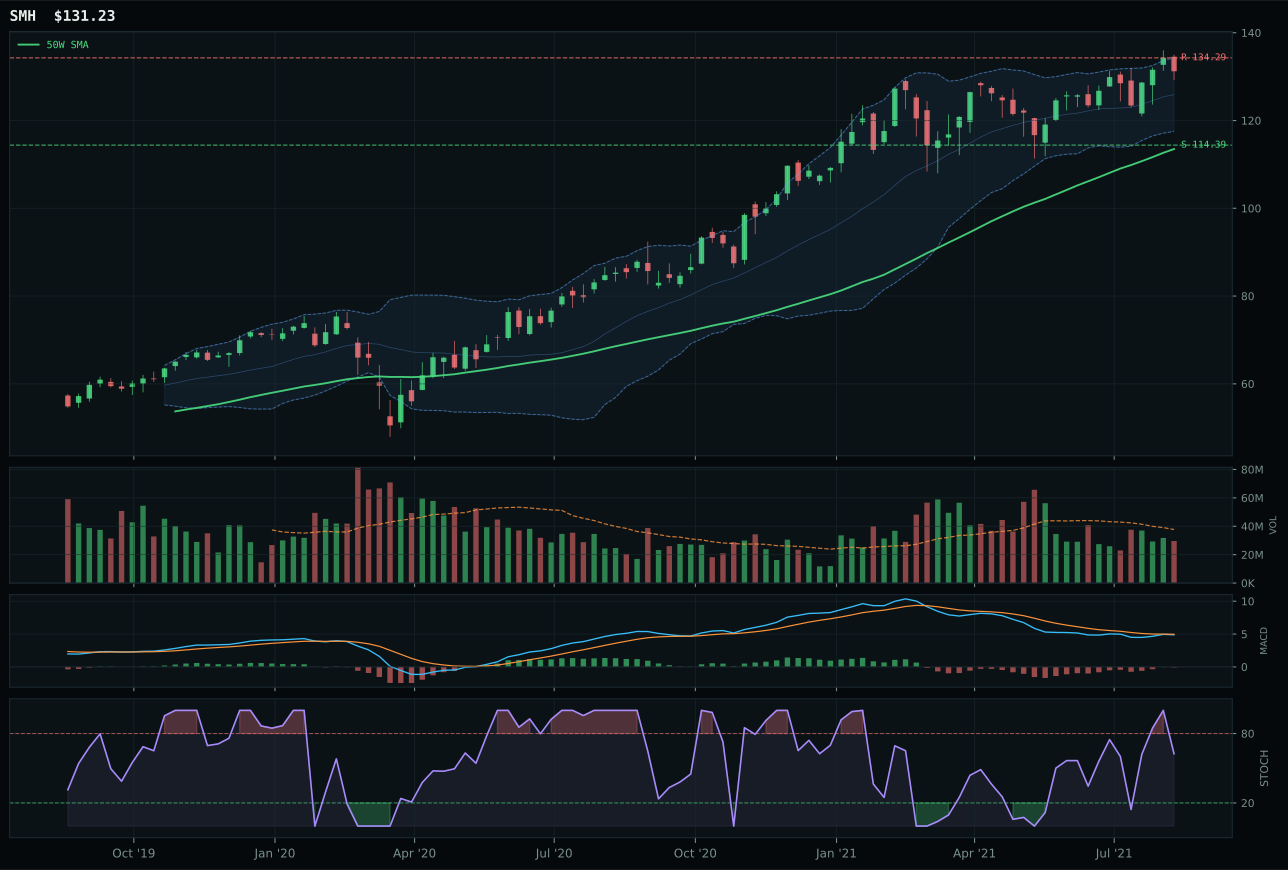
SMH has a vertical extension profile with 5.4% 13-week relative strength versus SPY.
A failed hold above support would weaken the setup.
Actionable but governed by invalidation levels.
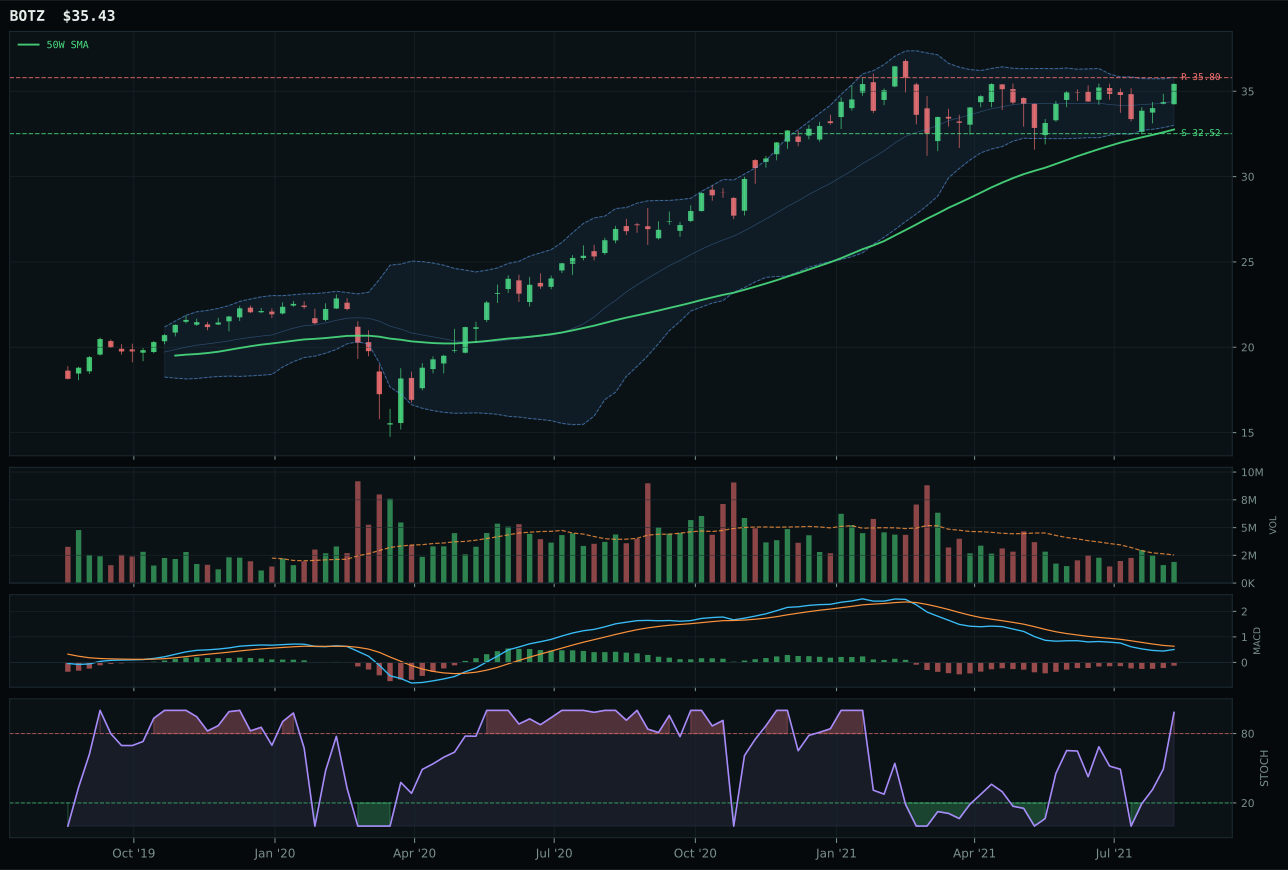
BOTZ has a neutral structure profile with 0.8% 13-week relative strength versus SPY.
A failed hold above support would weaken the setup.
Actionable but governed by invalidation levels.
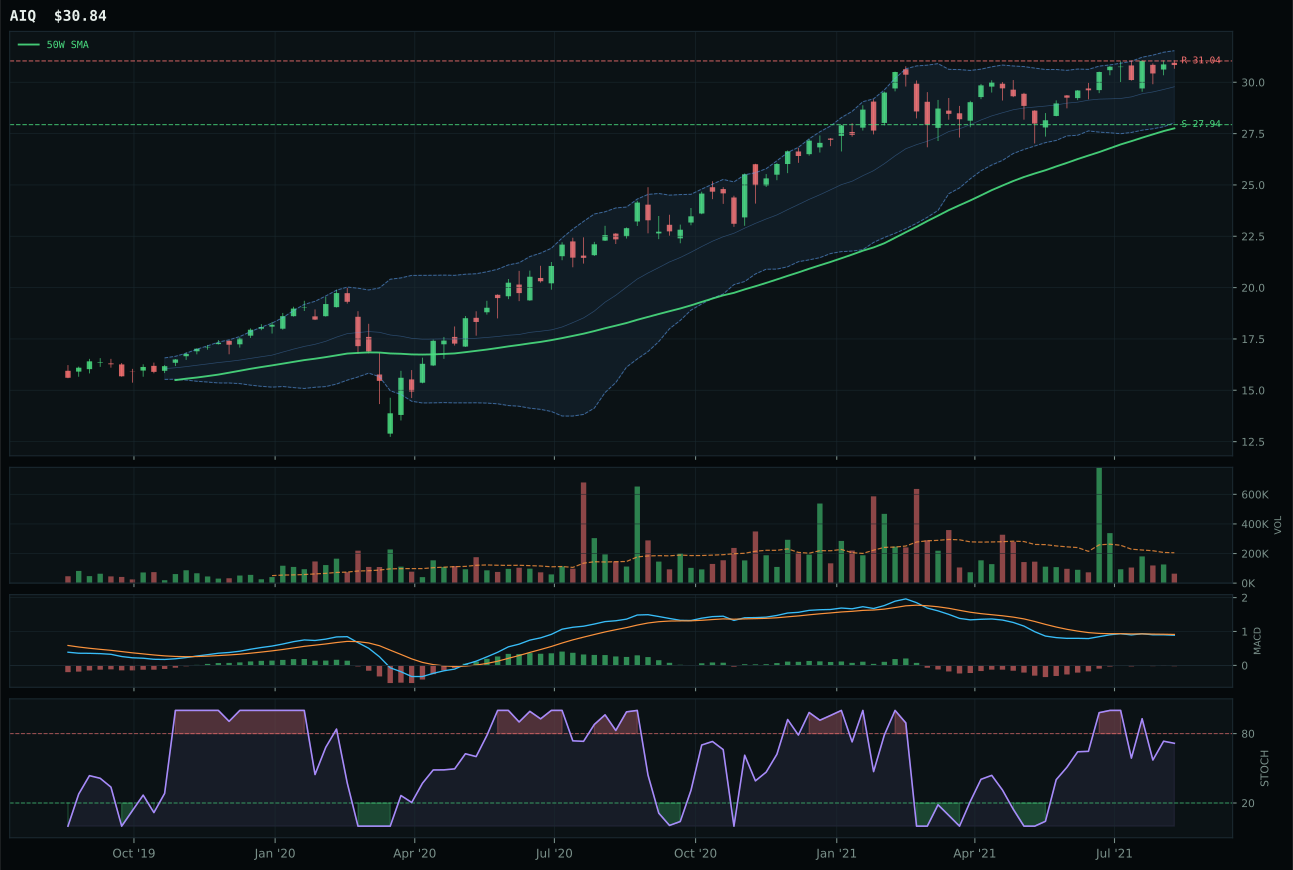
AIQ has a neutral structure profile with 3.1% 13-week relative strength versus SPY.
A failed hold above support would weaken the setup.
Tracked, but not top-2 eligible because: .
SMH wins because it delivers uptrend confirmation with the tightest category-relative strength advantage among a weak field. Price trades above both the 50W and 200W with a 0.8% slope, standing 15.6% extended—again a timing penalty, but the 5.4% RS to SPY and critical 2.3% category-relative edge over BOTZ provide the technical justification. MACD is bearish but improving, and stochastic RSI sits in the mid-zone at 0.63, suggesting the deceleration has already begun without confirmation that the move is truly rolling over. BOTZ, the runner-up, posts a higher composite score (75 vs 69) due to superior momentum metrics and neutral structure, but its overbought stochastic RSI and -2.3% category-relative weakness are the deciding factors—the category leader must show relative strength, not just absolute setup quality. Neutral volume at 0.79x 20W average confirms that momentum is not being validated by inflows, a common feature of semiconductor moves late in a cycle.
AI received tier-2 allocation of 5% because the category scored 57.9, ranking below Technology and Utilities & Infrastructure but above the excluded categories. The technical evidence score of 66.9 reflects solid trend structure, but momentum confirmation is weak at 87.3—the 13W return of 12.5% and 2.3% category-relative strength are positive but narrow relative to AI's macro narrative premium. Category macro fit stands at 64.0, boosted by active AI growth sponsorship at +14 and risk appetite at +10, but credit stress headwinds at -8 and broad market bear risk at -8 create offsetting tension. The allocation reflects a holding position: AI remains eligible and supported by its dominant sector narrative, but the weak relative performance of its representative (SMH) and the absence of a clean setup breakout keep it from earning a top-2 slot. A sharp upturn in momentum or an improvement in category-relative strength would justify promotion; absent that, 5% represents conviction tempered by technical evidence.
Industrial Metals — COPX
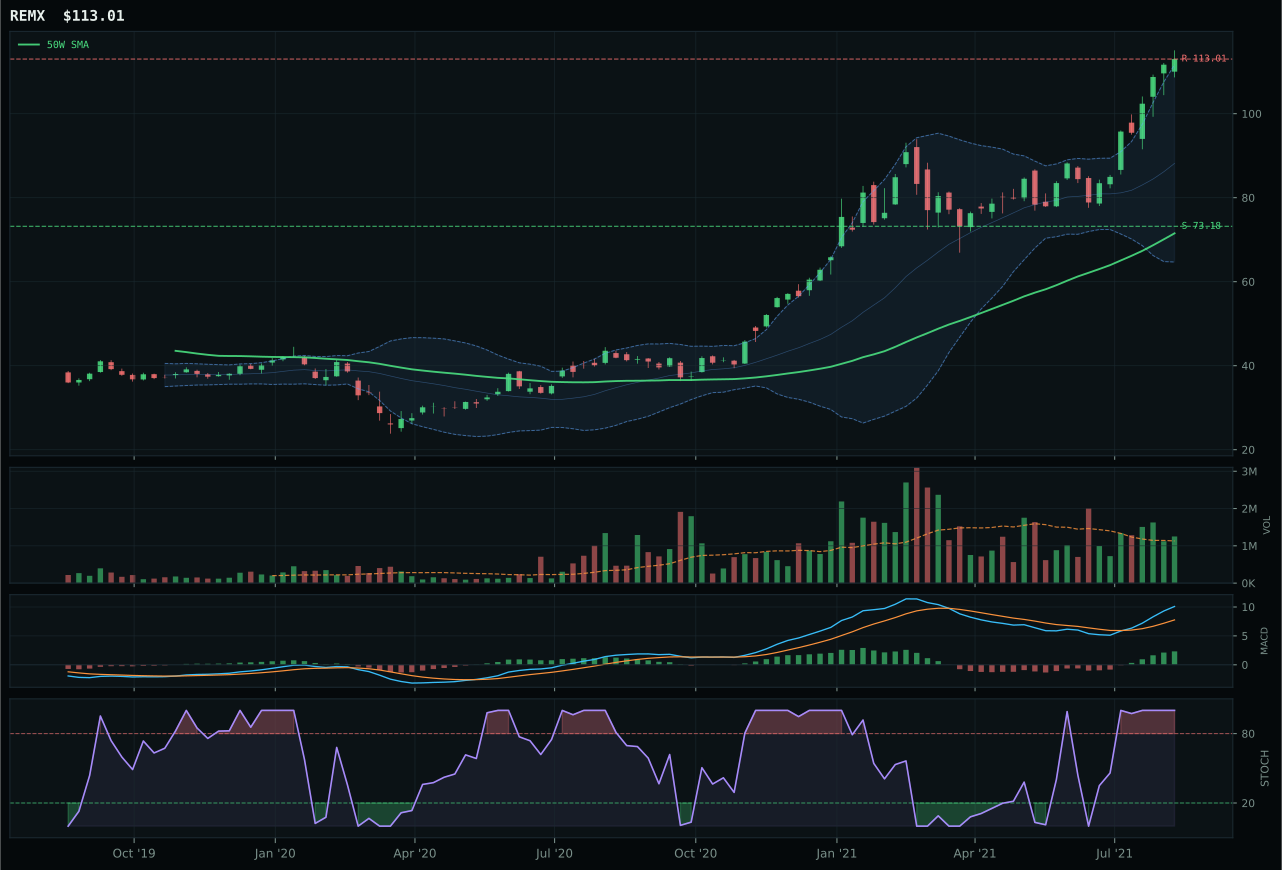
REMX has a vertical extension profile with 37.2% 13-week relative strength versus SPY.
A failed hold above support would weaken the setup.
Actionable but governed by invalidation levels.
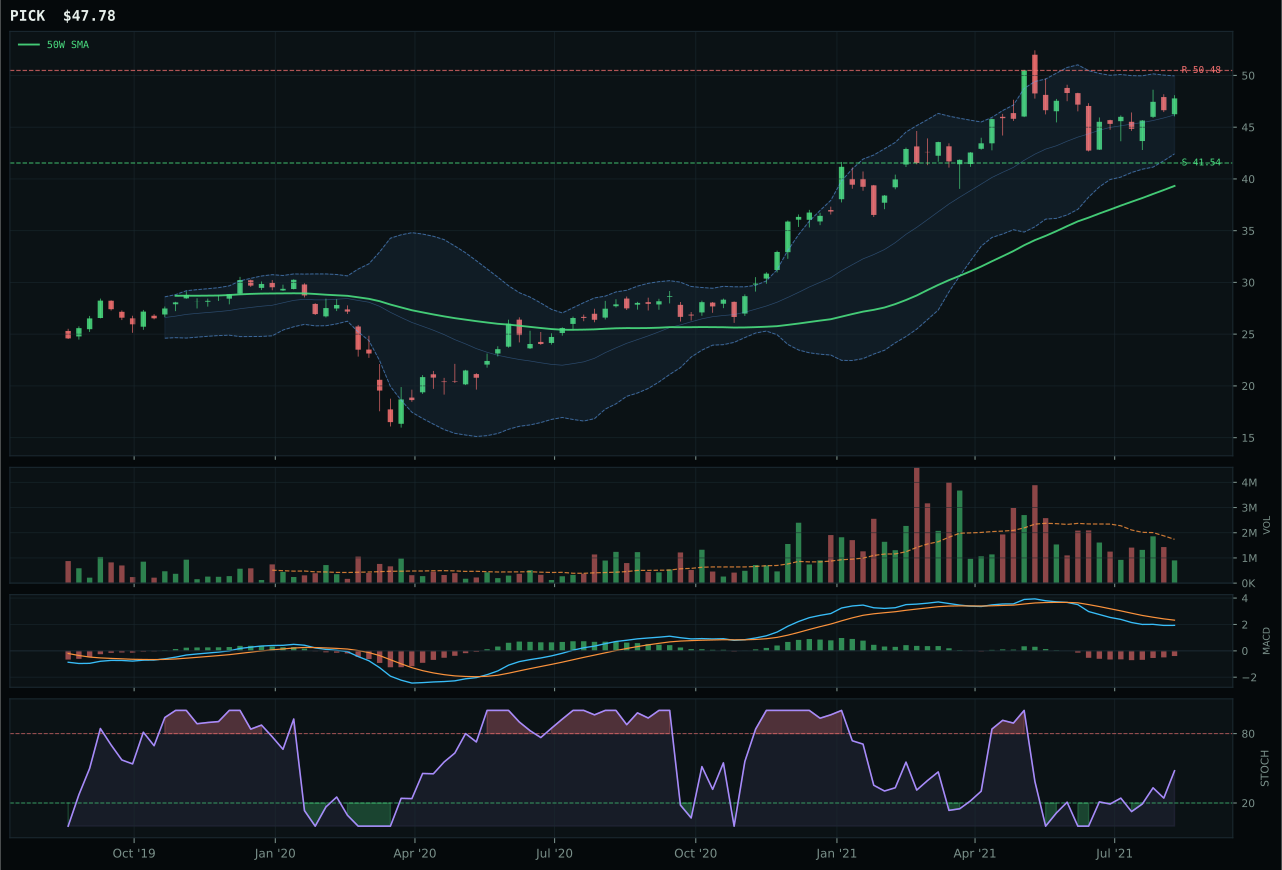
PICK has a vertical extension profile with -8.0% 13-week relative strength versus SPY.
A failed hold above support would weaken the setup.
Actionable but governed by invalidation levels.
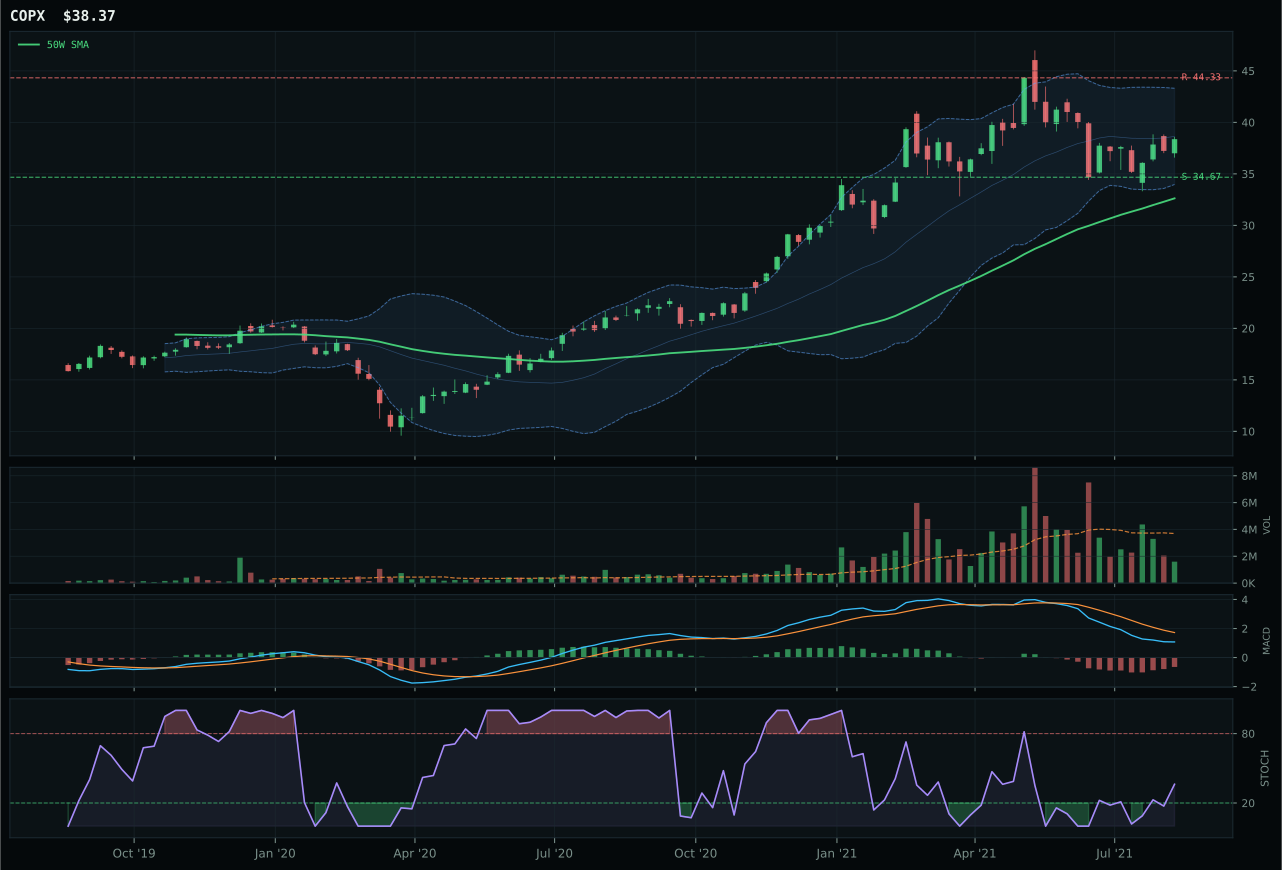
COPX has a vertical extension profile with -15.7% 13-week relative strength versus SPY.
A failed hold above support would weaken the setup.
Actionable but governed by invalidation levels.
COPX wins a category dominated by REMX's extreme outperformance (44.3% 13W return, 37.2% RS to SPY) by offering the more defensible technical setup at a more reasonable valuation. COPX sits 17.6% above the 50W, a significant extension, but stochastic RSI at 0.36 in the rising mid-zone and MACD bearish-but-improving provide clearer deceleration signals than REMX's overbought momentum at 1.00 and bullish-and-improving MACD. The critical difference is risk/reward: COPX offers 67.7 versus REMX's 39.6, meaning COPX has -13.4% downside to resistance versus -16.7% cushion to support, creating more defensible entry geometry. REMX's technical evidence is near-perfect at 100.0, but that excellence reflects 58.0% extension from the 50W—a setup where every new buyer is capitulating to fear of missing out rather than committing capital to accumulated value. COPX's -15.7% RS to SPY versus REMX's +37.2% highlights the macro divergence: rare earths are in a momentum spike while copper sits in quiet accumulation. Volume at 0.43x (COPX thin participation) versus 100.0 (REMX above-average) confirms the difference in adoption patterns.
Industrial Metals earned 5% tier-2 allocation despite COPX's selection as representative, because the category macro fit of 72.0 is the strongest in the entire portfolio. Metals scarcity at +14, commodity breadth at +10, and real-asset sponsorship at +6 create a powerful secular tailwind, offsetting credit stress at -7. The paradox is that REMX, the reasoned proof-order leader at 89.4, is excluded from allocation in favor of COPX at 42.9, because the final category score of 49.3 reflects the category reasoner's penalty for REMX's extreme extension and overbought momentum—a setup that concentrates risk rather than distributing it. Technical evidence for COPX is weak at 32.1, but macro narrative fit is strong at 63.0, creating an intentional mismatch where the allocation is made on macro grounds despite weak technicals. This is conviction in the secular metals story (scarcity, EV capex, industrial demand) paired with tactical selection of the least-dangerous entry point (COPX's rising-mid-zone setup over REMX's overbought spike). For the portfolio to increase allocation to Industrial Metals, either COPX's technicals must improve toward REMX's momentum readings, or REMX must correct sharply enough to become technically defensible again.
Agriculture & Livestock — WEAT
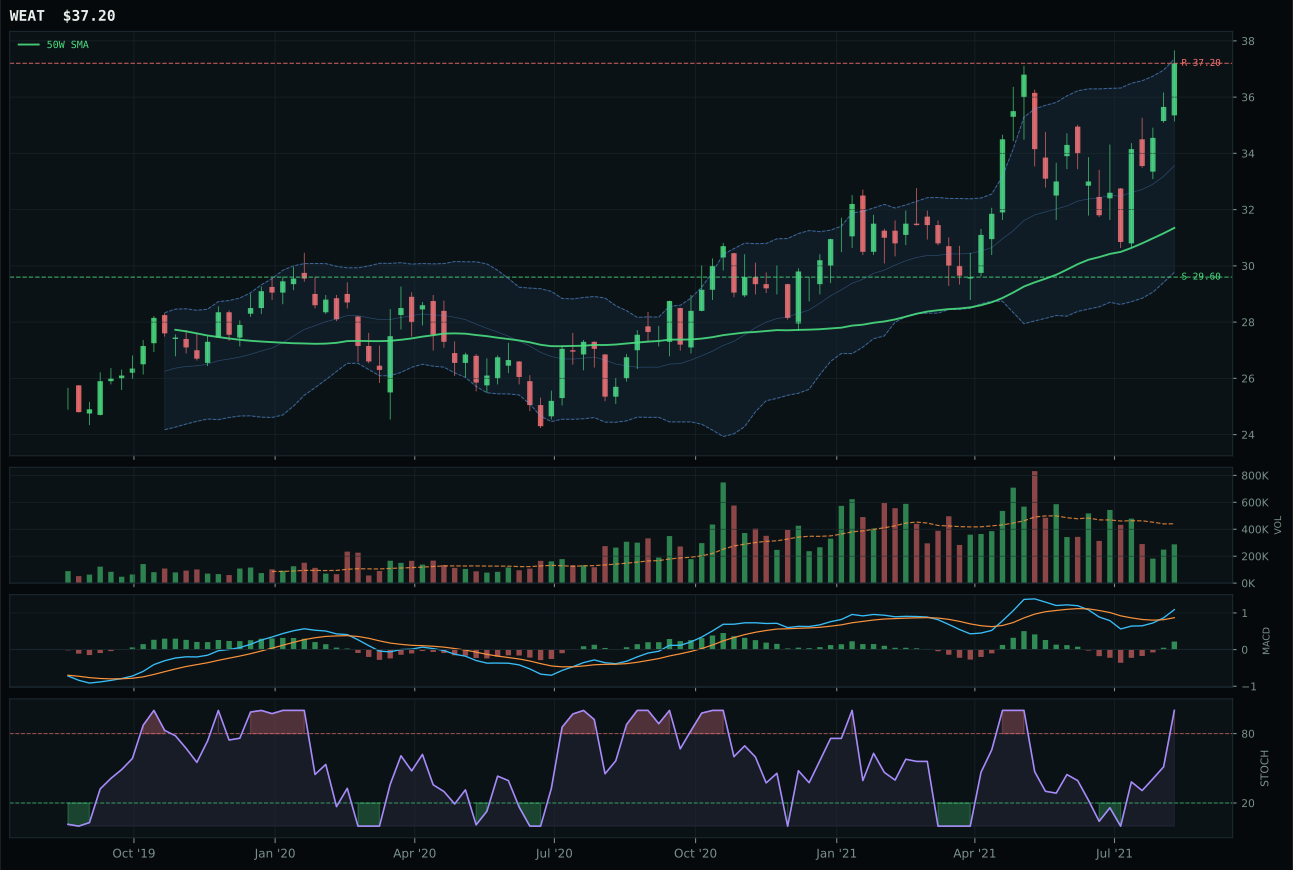
WEAT has a vertical extension profile with 1.9% 13-week relative strength versus SPY.
A failed hold above support would weaken the setup.
Actionable but governed by invalidation levels.
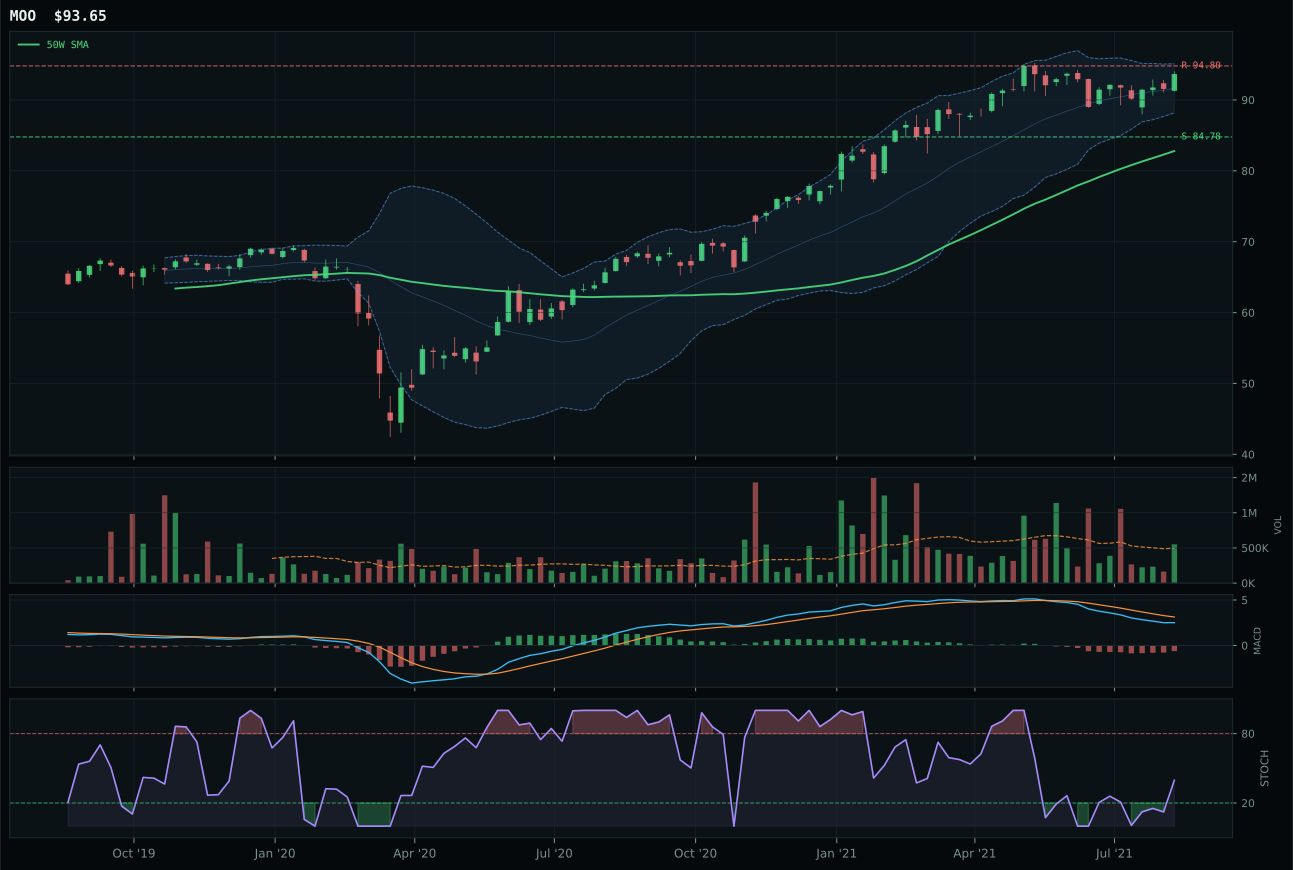
MOO has a neutral structure profile with -7.0% 13-week relative strength versus SPY.
A failed hold above support would weaken the setup.
Actionable but governed by invalidation levels.
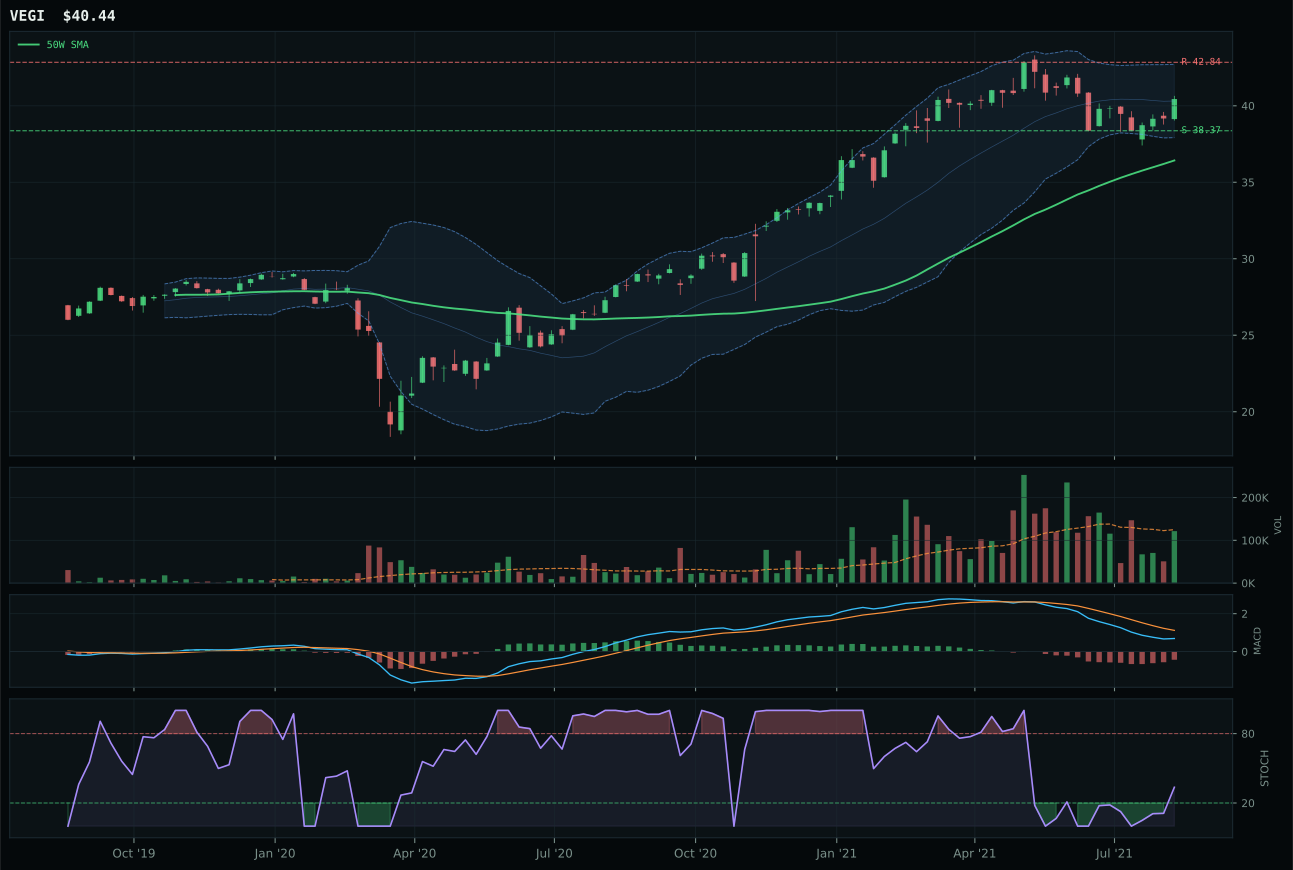
VEGI has a neutral structure profile with -11.3% 13-week relative strength versus SPY.
A failed hold above support would weaken the setup.
Tracked, but not top-2 eligible because: .
WEAT wins a tight contest (only 0.5-point margin to MOO) because it combines the strongest 13W relative strength with bullish momentum confirmation in a category defined by macro rather than technicals. Price sits 18.7% above the 50W with a 0.6% slope, placing it at vertical extension and triggering a timing penalty of 37.0—exactly the structure that penalizes entry. However, WEAT's 8.9% 13W return equals its category-relative strength, a rare alignment that signals genuine peer leadership rather than float rotation. MACD is bullish and improving, and stochastic RSI sits at a perfect 1.00 overbought, confirming the momentum move has climaxed. MOO, the runner-up, shows superior technical structure (82 trend vs 100) and a neutral chart setup with 75 timing score, but its bearish MACD and lagging 0.0% category-relative strength indicate it is trailing the momentum spike. Volume at 0.65x thin participation for WEAT means the move is not yet validated by institutional inflows, a feature typical of commodity rallies driven by supply narratives rather than sustained demand.
Agriculture & Livestock earned 5% allocation with a score of 43.7, placing it in the tier-2 bracket. The category macro fit of 55.0 reflects active commodity breadth sponsorship at +5 and real-asset support, but disinflation pressure at -8 is a significant drag—falling input costs hurt equipment and fertilizer producers. Technical evidence for the representative (WEAT) is 64.0, respectable but not exceptional, and relies heavily on the 13W momentum spike rather than structural trend continuation. The allocation is tactical, not strategic: it holds WEAT because its recent outperformance and overbought stochastic RSI suggest either a spike that will reverse sharply or a genuine shift in commodity supply perception. To graduate to a higher tier, Agriculture would need category-wide consensus—not just WEAT outperformance—combined with confirmation that disinflation is not eroding end-user demand. Thin volume participation (0.65x) is the critical watch; any shortfall in follow-through volume will make this a tactical fade.
Defense & Aerospace — ITA
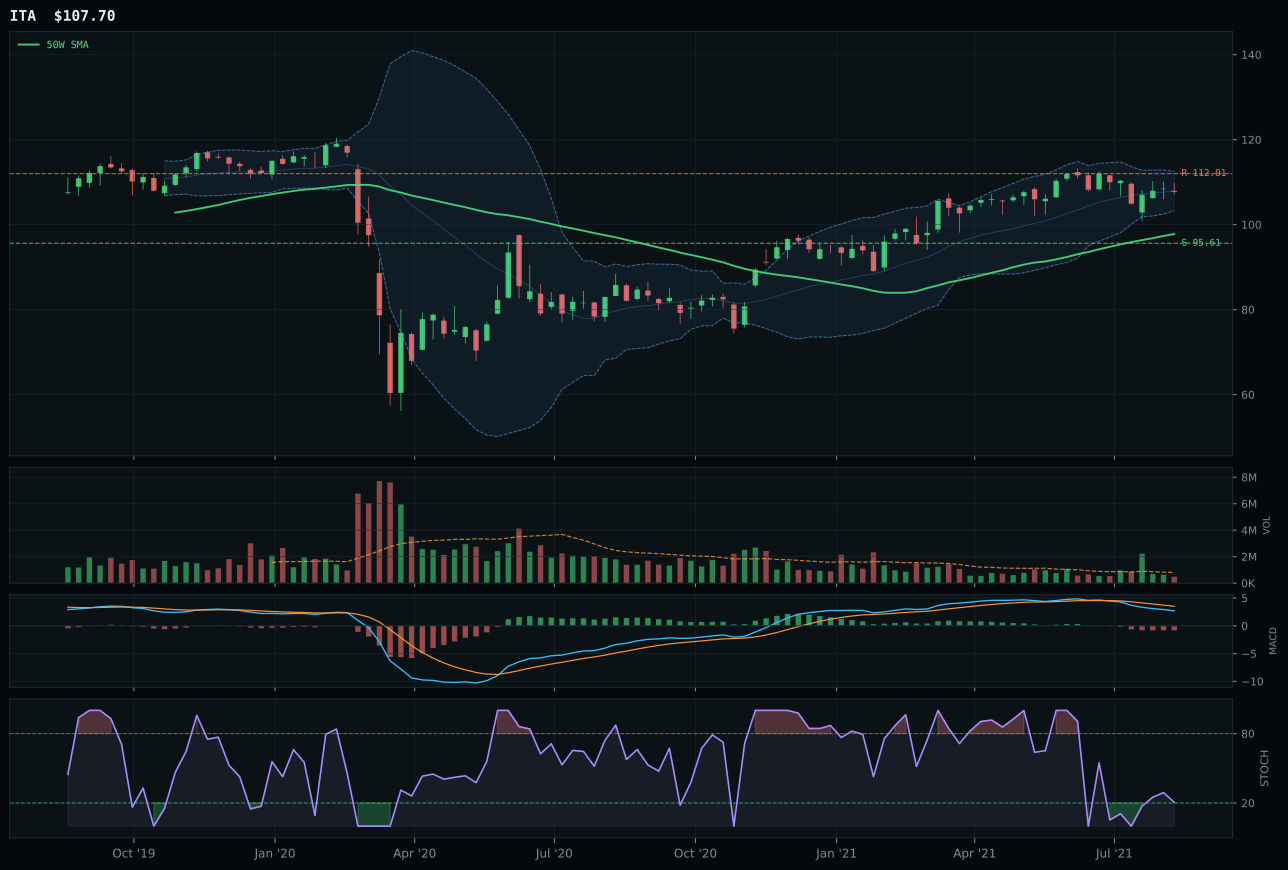
ITA has a neutral structure profile with -5.4% 13-week relative strength versus SPY.
A failed hold above support would weaken the setup.
Actionable but governed by invalidation levels.
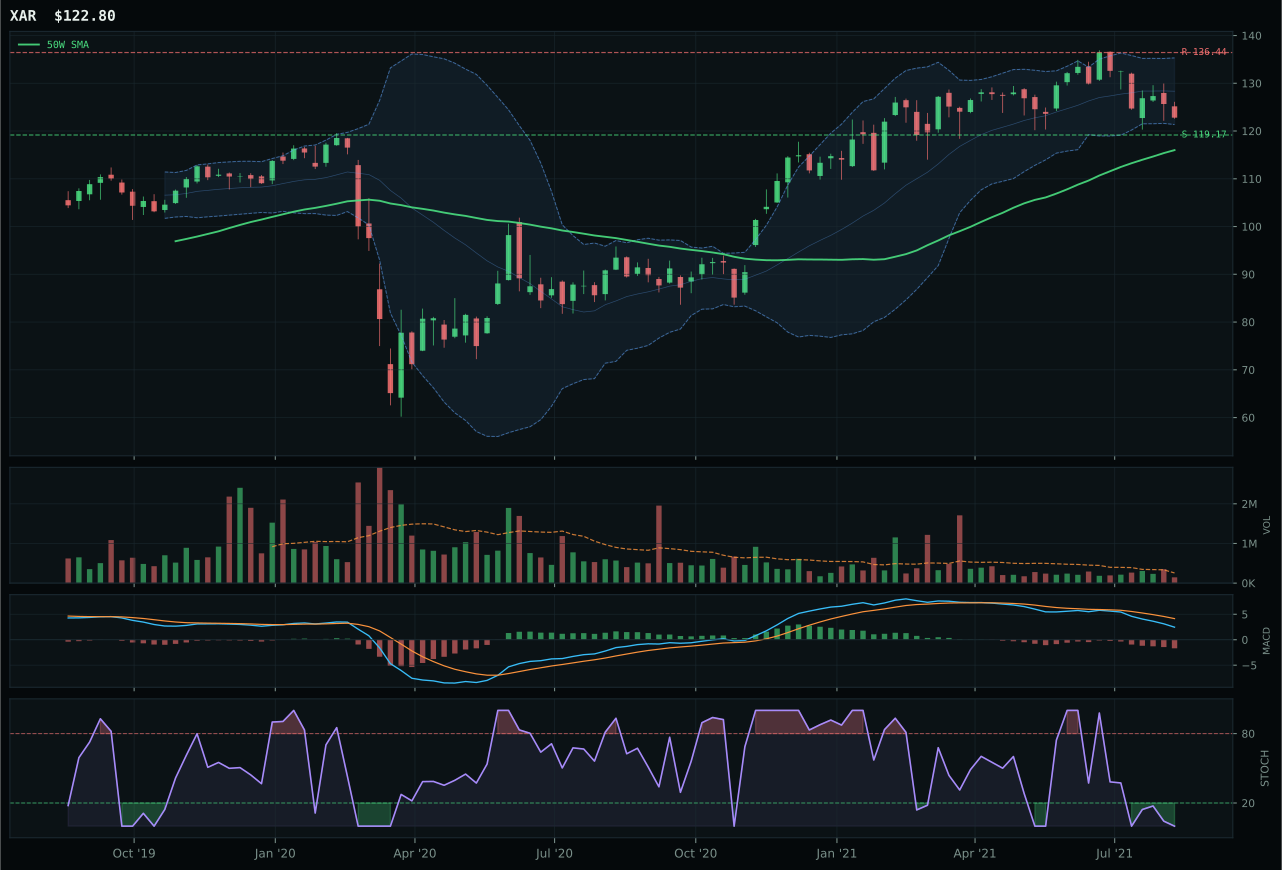
XAR has a pullback into support profile with -8.5% 13-week relative strength versus SPY.
A failed hold above support would weaken the setup.
Actionable but governed by invalidation levels.
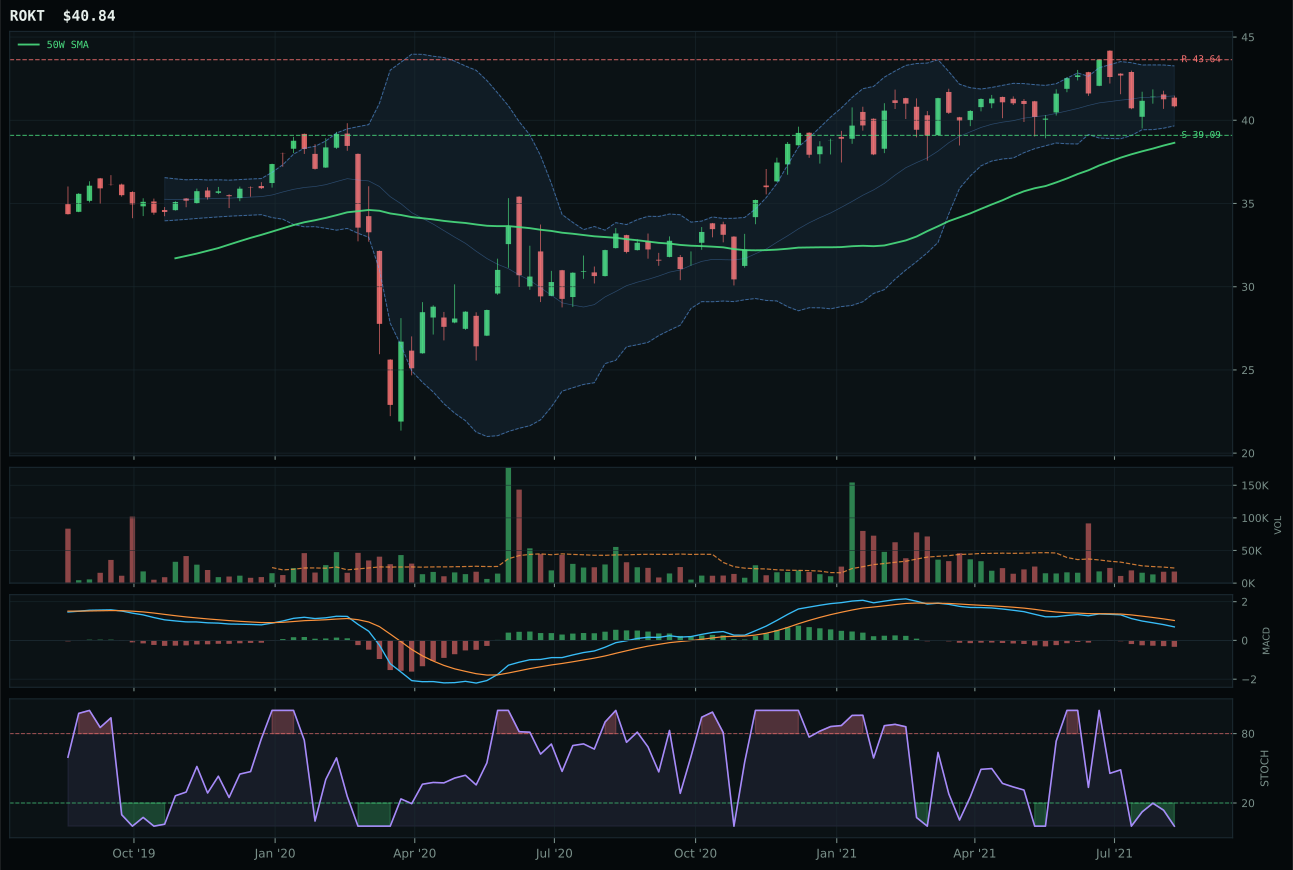
ROKT has a pullback into support profile with -5.5% 13-week relative strength versus SPY.
A failed hold above support would weaken the setup.
Tracked, but not top-2 eligible because: .
ITA wins a weak category by virtue of trend preservation and the least-unfavorable technical positioning among deteriorating peers. Price remains above both the 50W and 200W with a shallow 0.5% slope, but at only 10.1% extension it carries less timing penalty than its runners. The real advantage lies in stochastic RSI at 0.21 in the rising mid-zone—meaningfully different from XAR's oversold territory and suggesting that ITA still has base formation integrity intact. MACD is bearish/weakening across the category, and volume is universally thin at 0.60x (ITA) to neutral, indicating that the sector is consolidating rather than accumulating. The score gap of -5.2 points against XAR is decisive in a category where no ETF scores above 68; ITA's 1.6% 13W return and zero category-relative strength are liabilities, but they are less severe than XAR's -1.4% return and -3.0% category-relative collapse. This is a category held for macro optionality, not technical conviction.
Defense & Aerospace received 5% allocation despite ranking 3-8 in the category tier because its final score was 35.2 and it remained eligible. The placement reflects the portfolio's decision to maintain a small real-asset and geopolitical hedge within the broader Goldilocks framework, not a statement of technical strength. Technical evidence scores just 43.4 for the representative (ITA), driven by -5.4% RS to SPY and weak momentum confirmation at 28.1; the category's macro fit of 64.0 is inflated by external drivers (broad market bear at +6, dollar pressure at +3) that have little to do with Defense itself. The 5% slot acknowledges that disinflation and broad-market uncertainty can shift sentiment toward defense durability, but the thin volume participation across the category (0.60x) and deteriorating MACD signals suggest this is accumulation phase, not a tactical entry. For Defense to earn a higher allocation, ITA would need to break decisively above resistance at 112.01 with meaningful volume participation, signaling institutional repositioning into the sector.
Nuclear Energy — URNM
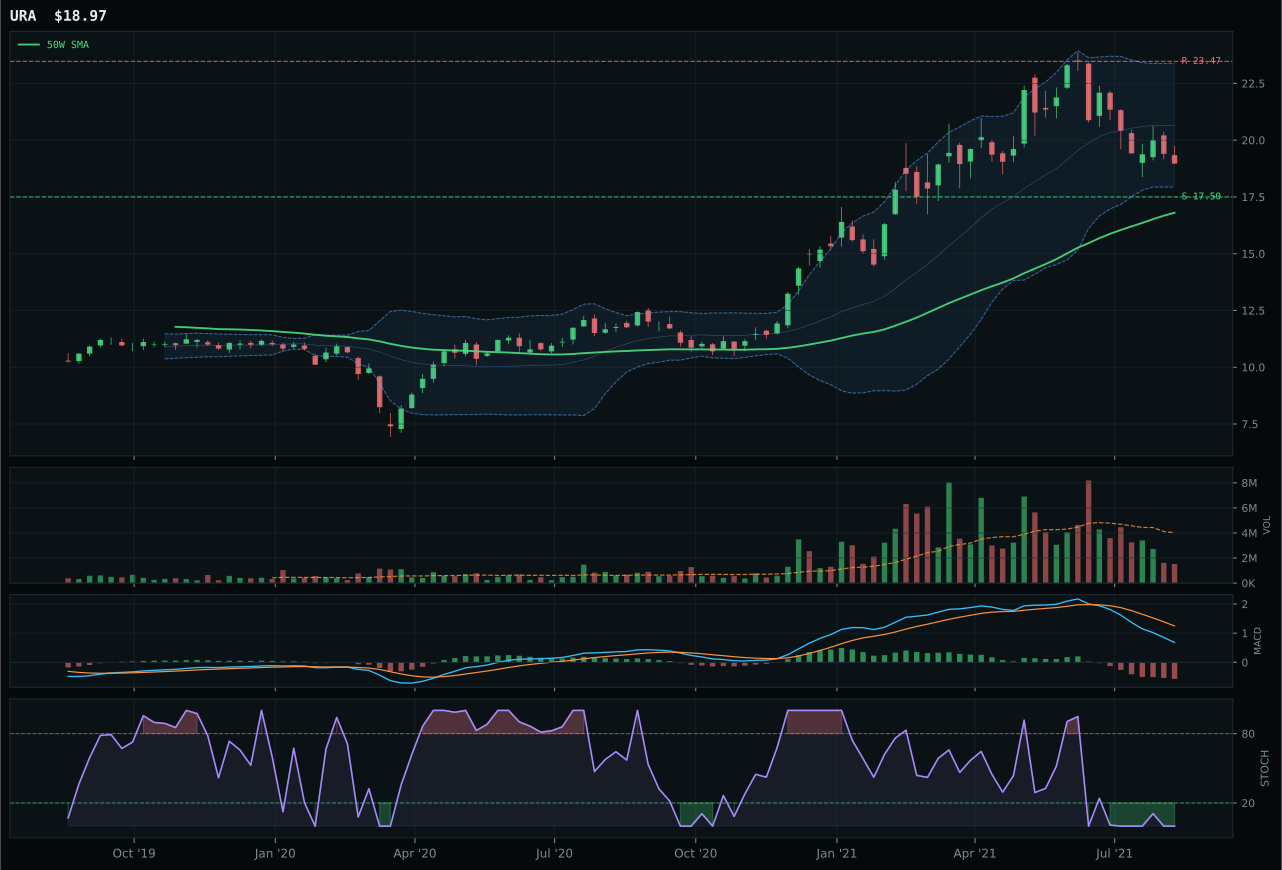
URA has a neutral structure profile with -17.6% 13-week relative strength versus SPY.
A failed hold above support would weaken the setup.
Actionable but governed by invalidation levels.
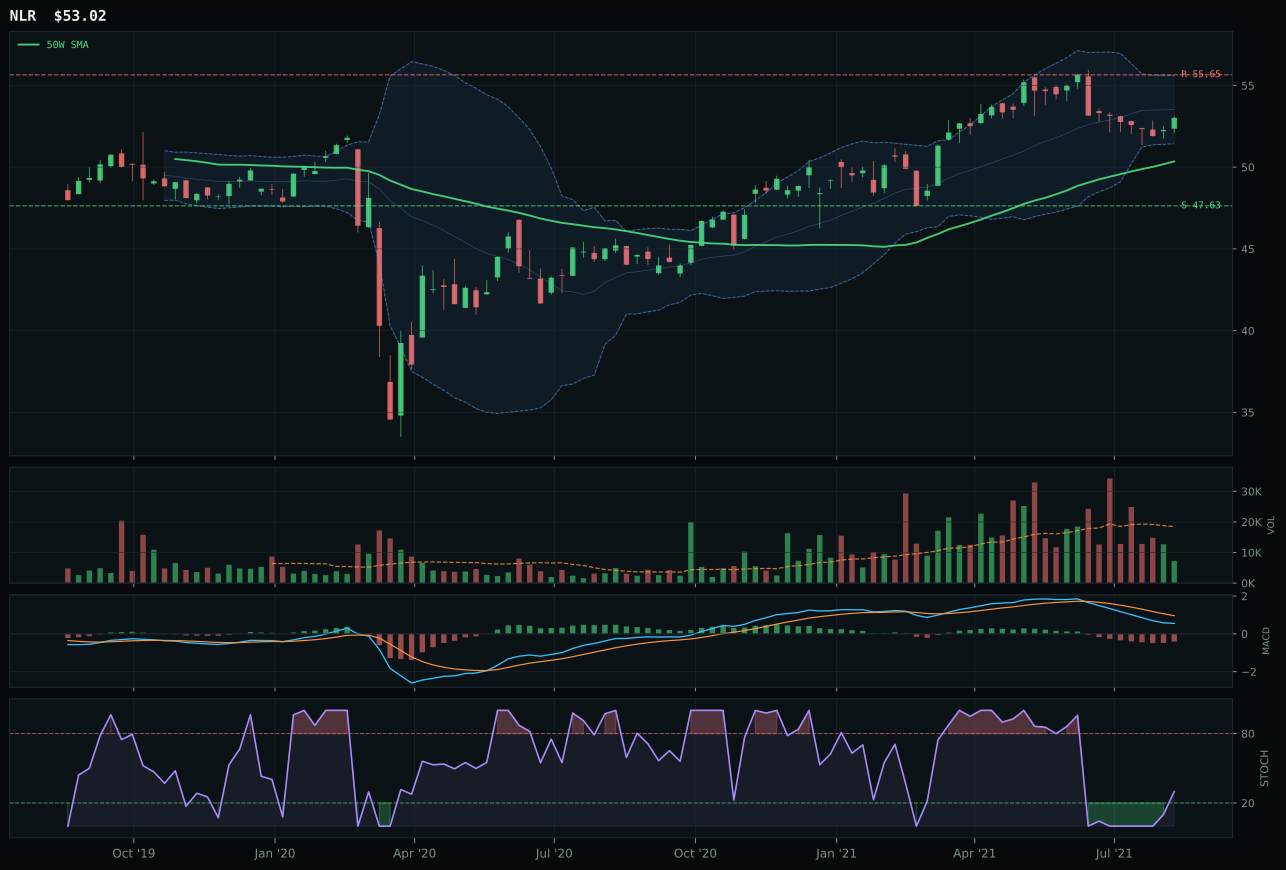
NLR has a neutral structure profile with -10.1% 13-week relative strength versus SPY.
A failed hold above support would weaken the setup.
Tracked, but not top-2 eligible because: .
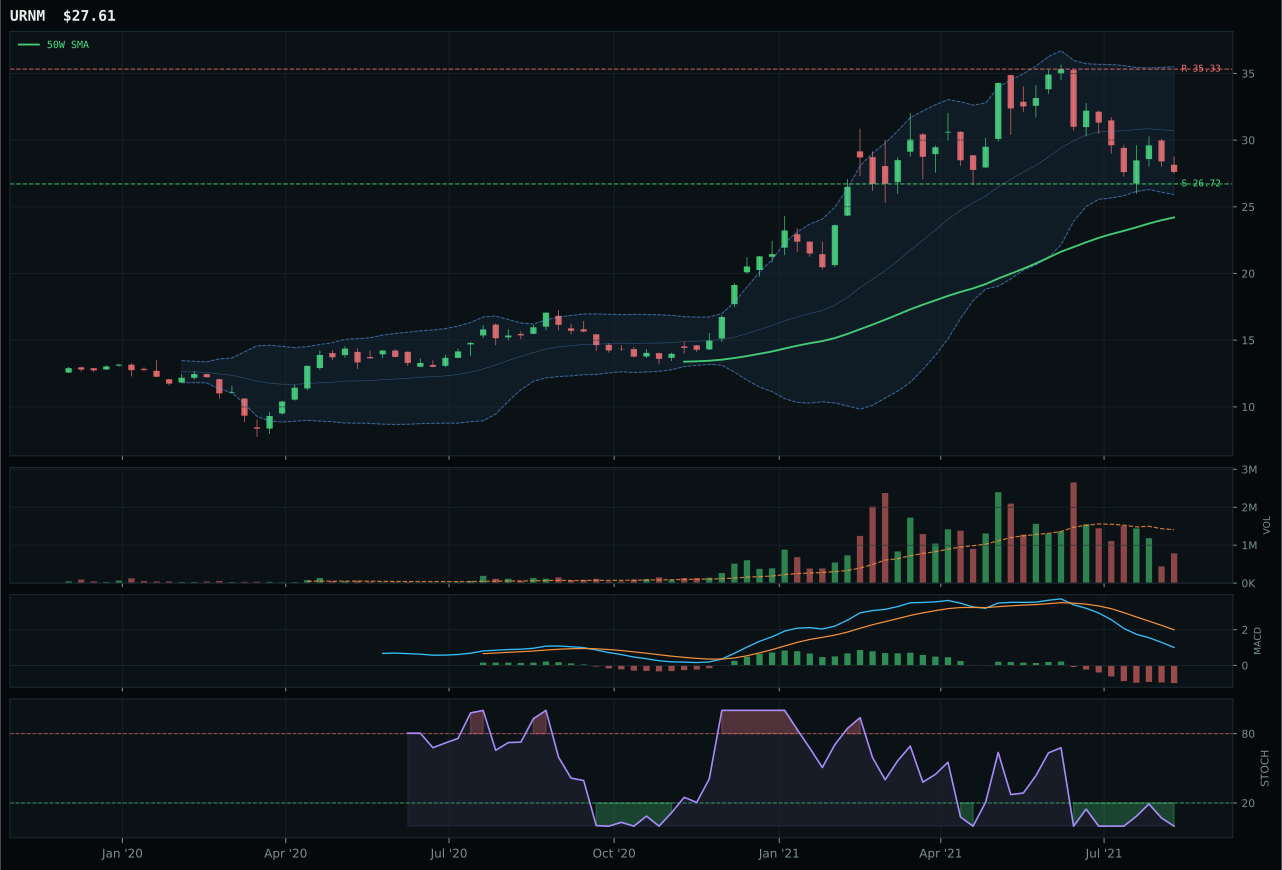
URNM has a pullback into support profile with -21.7% 13-week relative strength versus SPY.
A failed hold above support would weaken the setup.
Actionable but governed by invalidation levels.
URNM wins because its pullback-into-support structure at 26.72 creates a defined, asymmetric risk setup despite universally weak momentum across the category. Price sits 14.1% below the 50W but above the 200W, placing it in repair-zone territory; stochastic RSI at 0.00 is the deepest oversold condition in the category, and more importantly, it sits at support where a reversal becomes credible. Timing at 80.0 is the category's best because URNM has concrete invalidation (support at 26.72) and reasonable upside targets (resistance at 35.33 represents 32.0% recovery), creating traders' logic rather than hope. URA, the runner-up, is more fairly priced at -17.6% RS to SPY versus URNM's -21.7%, but URA's neutral structure and 70.0 timing score mean it offers less tactile support and more gradual recovery path. Momentum is zero across both ETFs (0.0% and 0.0%), reflecting the sector's institutional washout phase. Volume at 0.56x thin participation signals that URNM is accumulating without forced buying—the opposite of REMX—which is the correct signal in a capitulation setup.
Nuclear Energy received 5% tier-2 allocation with a score of 34.6, despite weak technicals, because its macro narrative fit of 57.0 is driven by real-asset sponsorship at +7 and emerging AI capex demand at +5. The allocation is a leveraged bet on the secular nuclear renaissance tied to data-center power demand, not a technical statement about current pricing. URNM's technical evidence of 17.0 is the portfolio's weakest representative score, with momentum at 0.0 and volume confirmation at 18.9—markers of pure capitulation. The category reasoner tested this setup and still awarded allocation because the macro fit justifies holding through the repair phase. This is a core holding for optionality: if energy demand accelerates or if inflation fears re-emerge, Nuclear would shift from washout phase to accumulation phase rapidly. The 5% slot represents a disciplined position-building entry rather than conviction in immediate price recovery. For Nuclear to graduate to tier-1, URNM must reclaim the 50W with visible volume participation, signaling institutional reaccumulation, AND the macro narrative around AI power demand must become more tangible in forward guidance from utilities or data-center operators. Absent both catalysts, this remains a tactical accumulation position in an oversold sector.
Precious Metals — GDX
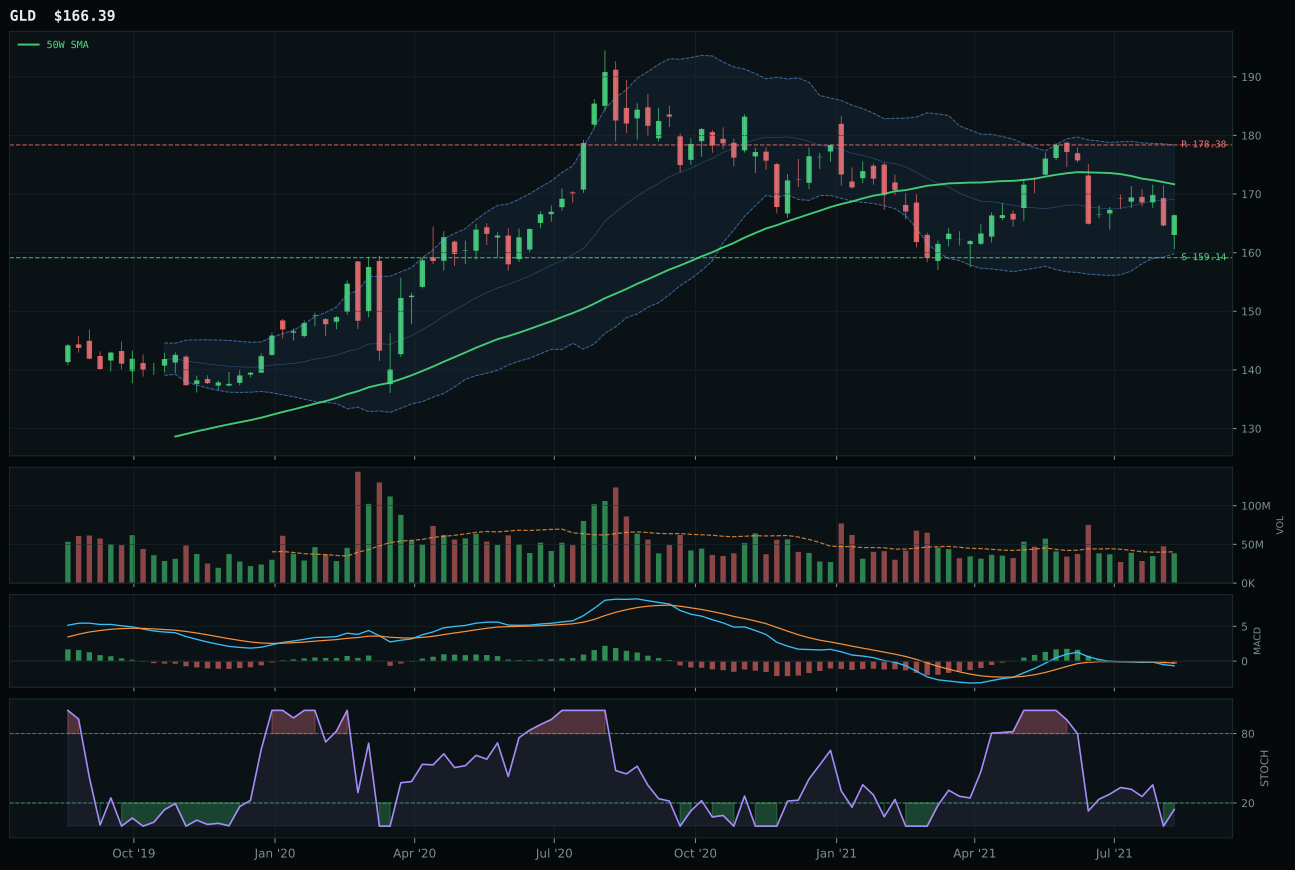
GLD has a pullback into support profile with -10.7% 13-week relative strength versus SPY.
A failed hold above support would weaken the setup.
Actionable but governed by invalidation levels.
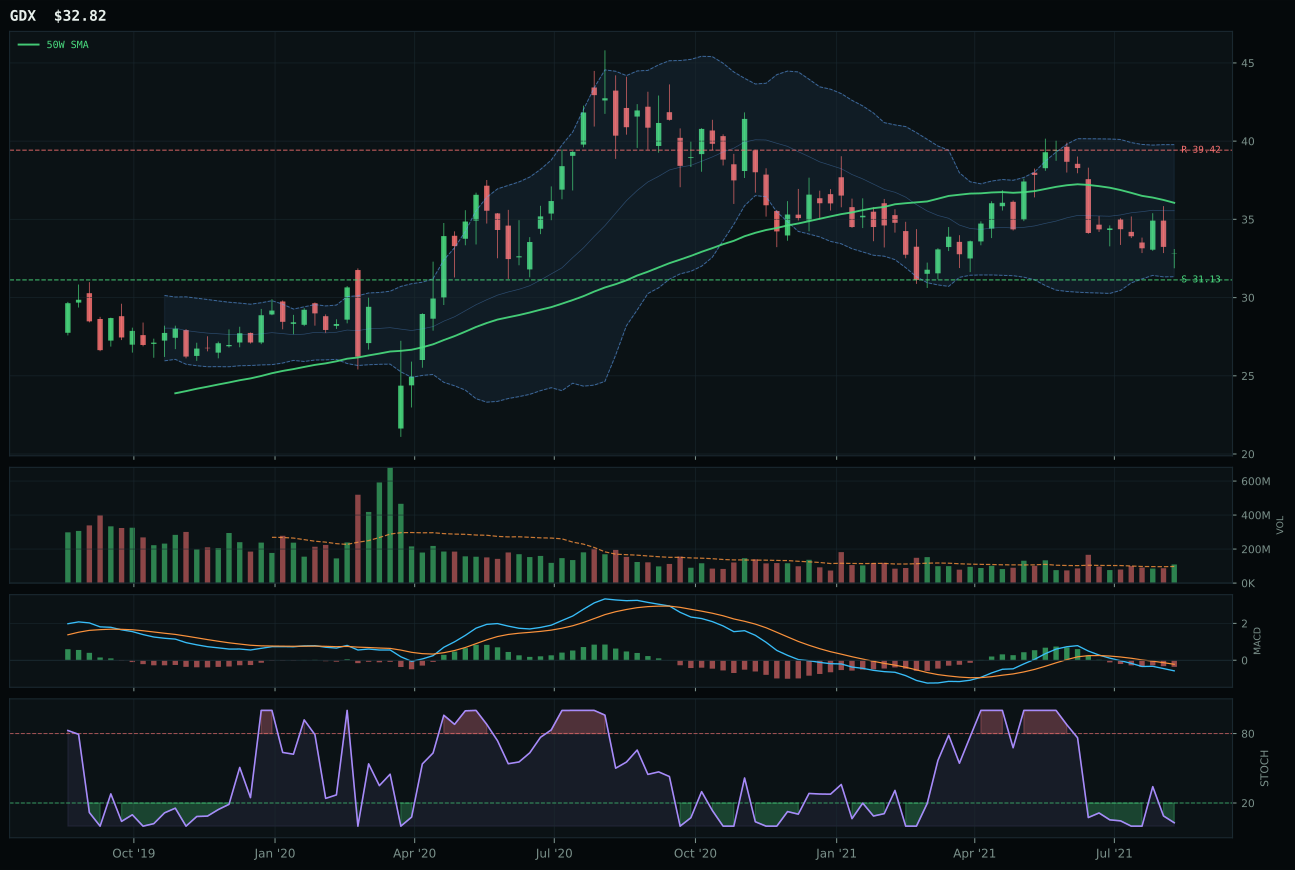
GDX has a neutral structure profile with -20.3% 13-week relative strength versus SPY.
A failed hold above support would weaken the setup.
Actionable but governed by invalidation levels.
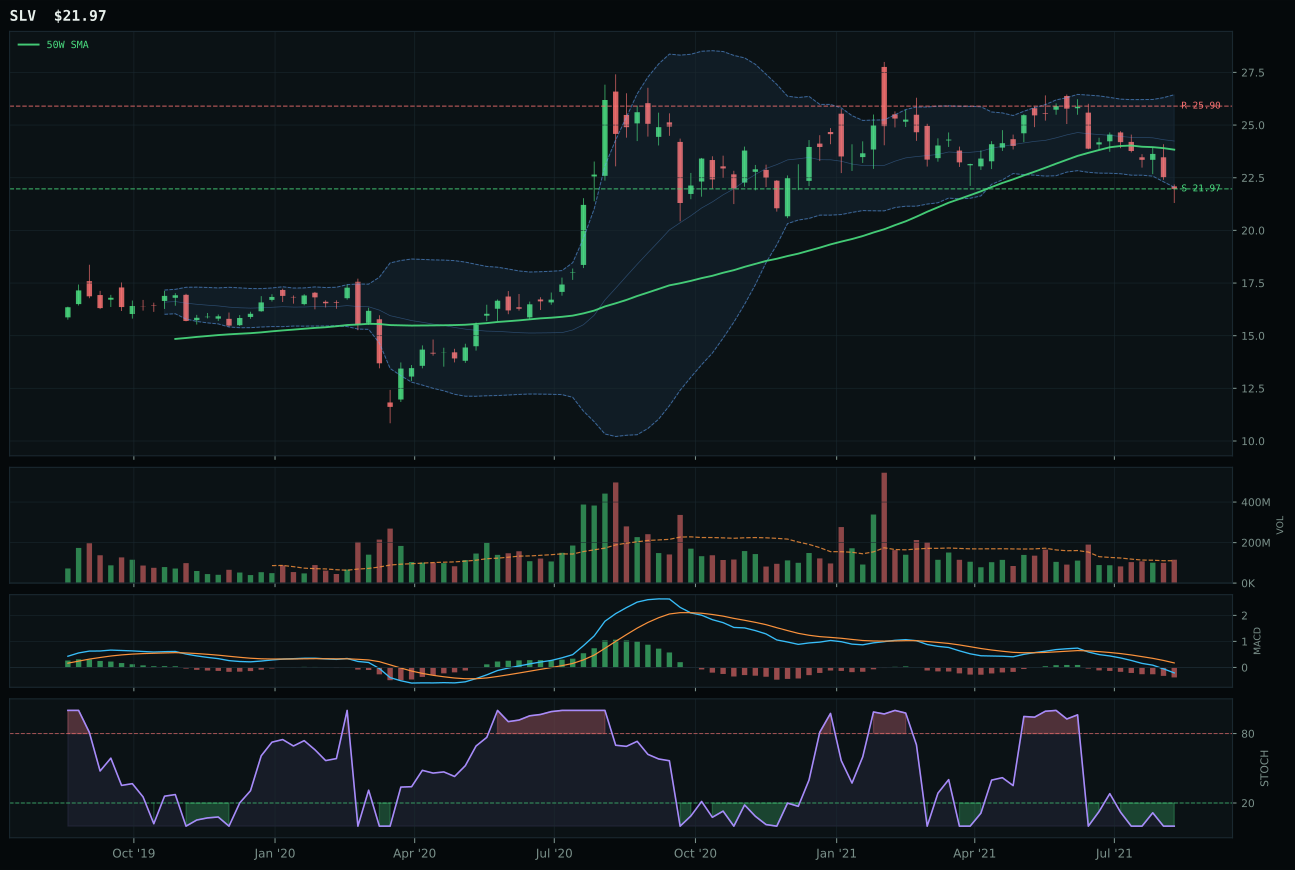
SLV has a pullback into support profile with -20.8% 13-week relative strength versus SPY.
A failed hold above support would weaken the setup.
Actionable but governed by invalidation levels.
GDX wins because its pullback-into-support structure offers superior risk/reward geometry and the most credible oversold setup within a category defined by monetary reset rather than price strength. Price sits 9.0% below the 50W, still above the 200W, and stochastic RSI at 0.03 is turning up from true oversold—a material difference from GLD's simple oversold condition. Timing is the category's strongest component at 84.0 for GDX, reflecting the proximity to 52W lows and the Fib 0.786 zone near support at 31.13; risk/reward is exceptional at 90.0, with only 5.4% downside to support but -16.7% upside to resistance, creating a favorable asymmetry for mean-reversion players. GLD, the runner-up, shows stronger macro fit (56.0 vs 47.0) as the clean monetary hedge, but its -3.1% proximity to the 50W (vs GDX at -9.0%) and neutral stochastic RSI (vs oversold turn-up) mean it is less set up for capitulation washout. Volume at 1.12x for GDX (above-average) versus neutral for GLD indicates institutional interest in the deeper value play. Momentum confirmation is zero across both, reflecting the bearish macro consensus.
Precious Metals received 5% allocation with a final score of 32.5, placing it in the tier-2 category, the lowest allocation bracket above zero. This represents a core holding for portfolio resilience in the Goldilocks regime, not a tactical bet on gold strength. Category macro fit of 55.0 is supported by disinflation pressure at +6 and dollar pressure at +3, offsetting risk-appetite headwinds; technical evidence is weak at 22.6 for the representative, reflecting the bearish momentum and below-50W price action that define today's metals sentiment. GDX's superior risk/reward positioning (90.0 vs GLD's 79.6) justifies its selection over the cleaner monetary hedge, but the 0.0% momentum confirmation across the category reveals that this is a capitulation setup, not an accumulation phase. The allocation exists because portfolio risk management requires a deflation/credit-stress hedge, not because metals technicals are bullish. For Precious Metals to earn promotion to tier-1, GDX would need to reclaim the 50W with heavy volume participation, signaling that institutional panic selling has exhausted itself and true value accumulation is underway.
Emerging Markets — INDA
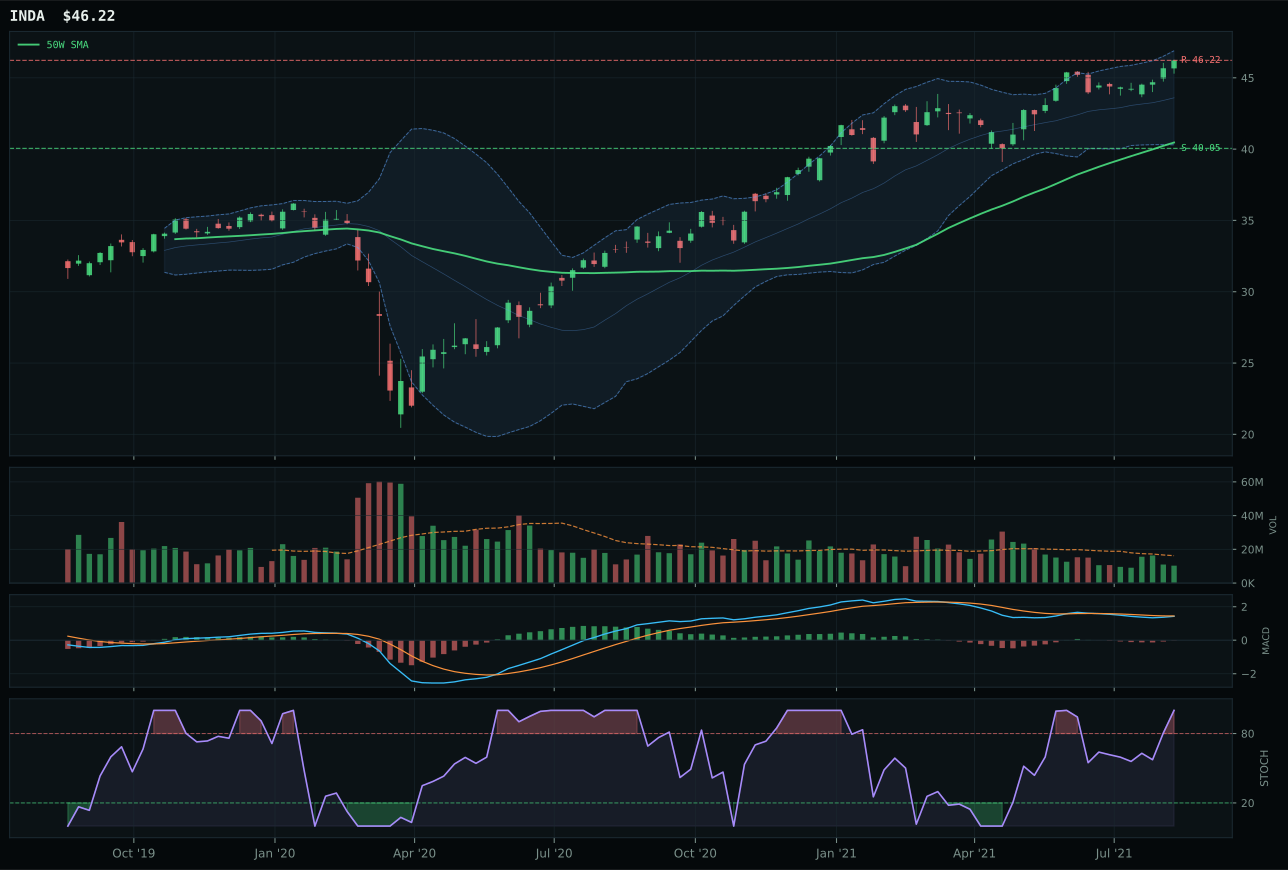
INDA has a neutral structure profile with 1.9% 13-week relative strength versus SPY.
A failed hold above support would weaken the setup.
Actionable but governed by invalidation levels.
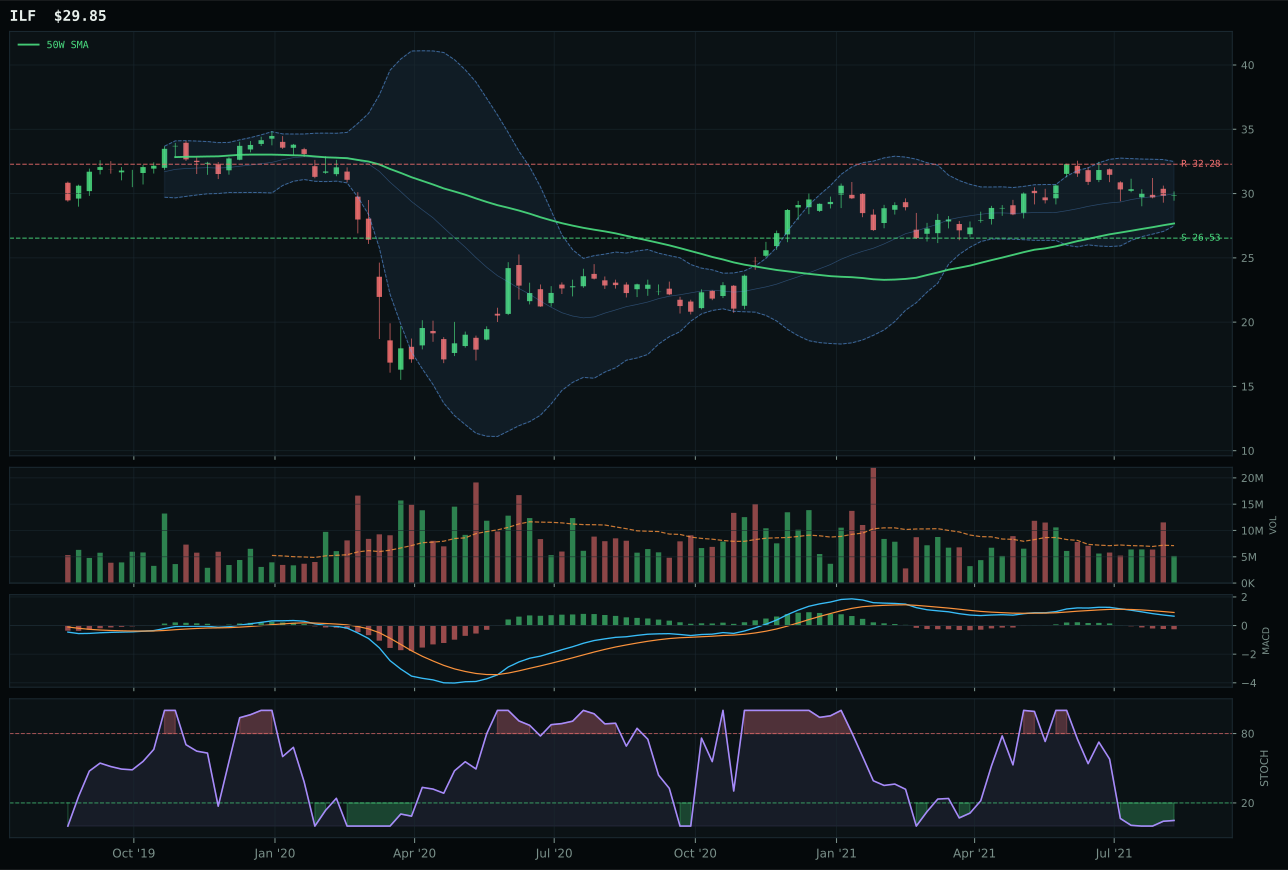
ILF has a neutral structure profile with -7.6% 13-week relative strength versus SPY.
A failed hold above support would weaken the setup.
Actionable but governed by invalidation levels.
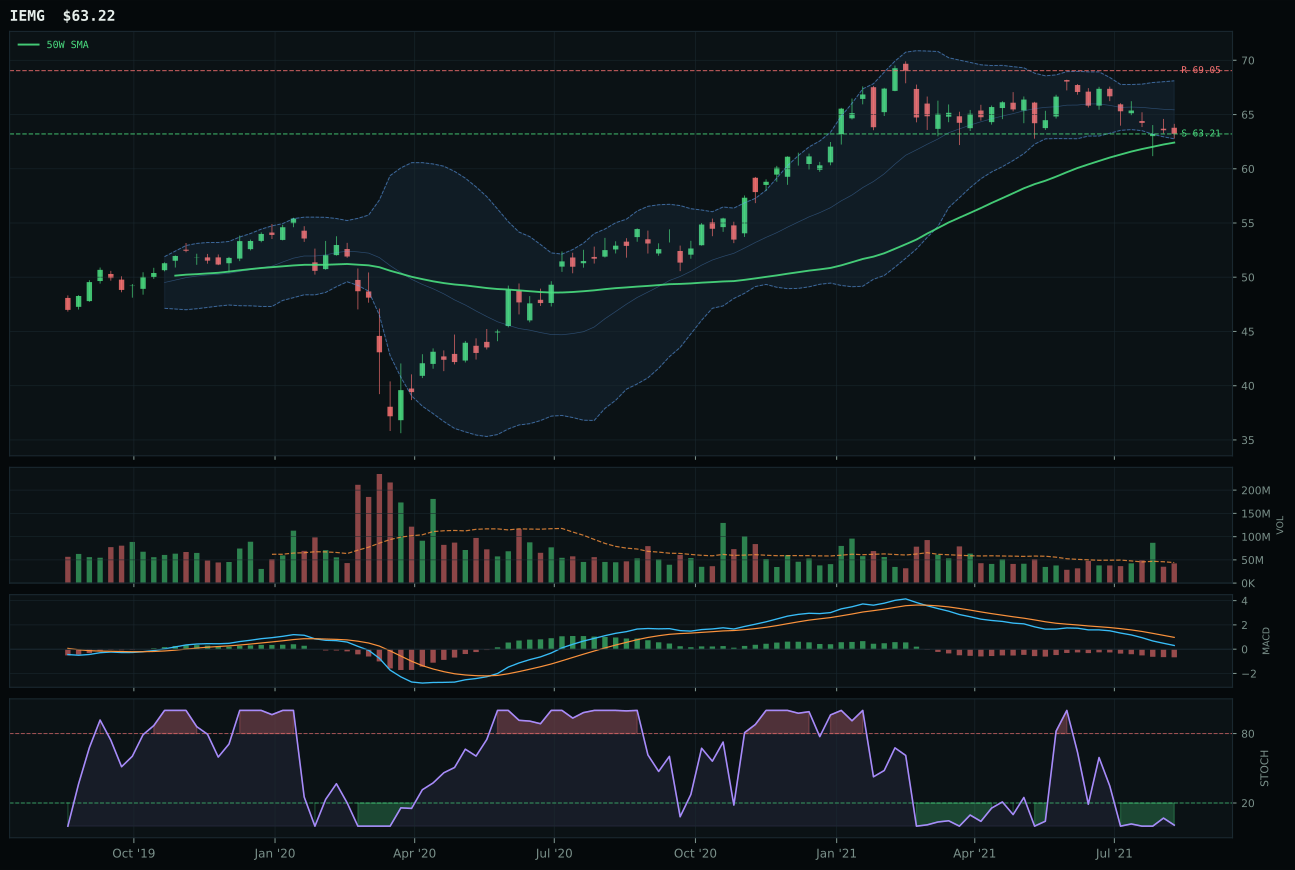
IEMG has a pullback into support profile with -8.6% 13-week relative strength versus SPY.
A failed hold above support would weaken the setup.
Actionable but governed by invalidation levels.
INDA wins despite the category receiving 0% allocation because it demonstrates the cleanest technical setup among a field poisoned by macro headwinds. Price sits 14.2% above the 50W and 200W with a 0.6% slope, and structure is neutral rather than vertically extended, creating less timing penalty than peers. The key is 9.5% category-relative strength—a meaningful edge showing INDA leading within its basket—paired with 80.5% momentum confirmation (8.9% 13W return and positive 4.5% 4W). Stochastic RSI at 1.00 overbought momentum signals deceleration, not reversal, and MACD is bearish-but-improving, the same deceleration structure seen in Technology. ILF, the runner-up, shows superior 84.0 timing and 70 overall trend due to its pullback-into-support positioning at 26.53, but its -7.6% RS to SPY and 0.0% category-relative strength reveal it is following rather than leading. INDA's 72.4% volume-price confirmation (versus ILF's 32.6) is the decisive technical edge—more institutional sponsorship validating the move.
Emerging Markets received 0% allocation because the category scored 19.1, placing it at the bottom tier outside the allocation universe. Category macro fit is 33.0, a portfolio-worst, driven by dollar pressure at -14, credit stress at -10, and broad market bear risk at -9—the macro regime is explicitly hostile to EM on multiple vectors. Technical evidence for INDA is strong at 64.9, but it is insufficient to overcome the 36-point macro headwind. The decision is direct: INDA's 8.9% 13W return and positive category-relative performance are authentic, but they occur in an environment where EM valuations are under pressure from strong dollar, credit stress, and global growth uncertainty. The portfolio will not rotate into EM at this macro juncture, regardless of local-market technicals. For Emerging Markets to earn tier-2 (5%) allocation, the portfolio would require either a sharp dollar reversal that reduces EM currency headwinds, or a clear improvement in credit stress readings, or explicit softening of broad market bear risk. INDA's technicals are not the constraint; the macro regime is. When the regime shifts, INDA's strong relative position within its category will make it a first candidate for reallocation.
Traditional Energy — XLE
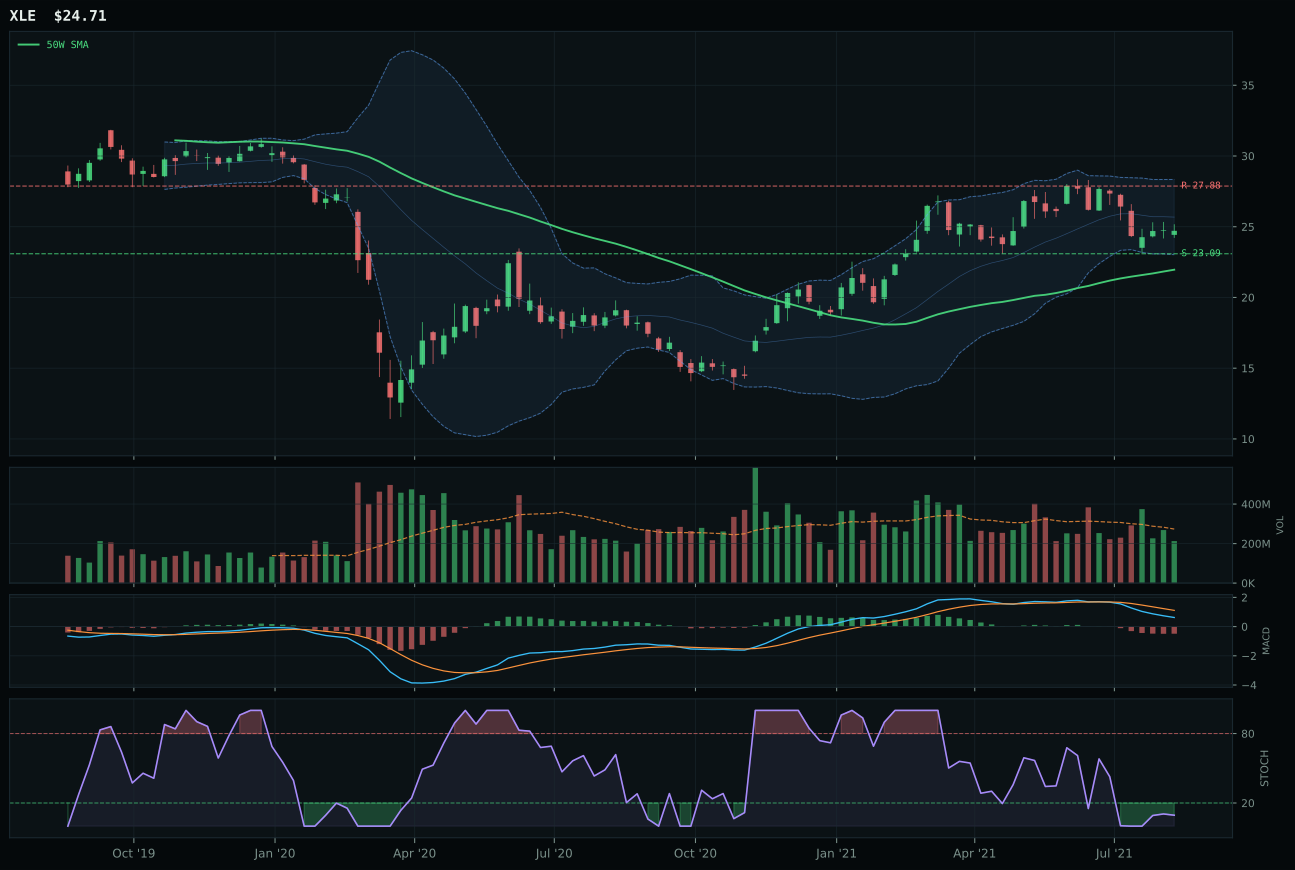
XLE has a neutral structure profile with -14.7% 13-week relative strength versus SPY.
A failed hold above support would weaken the setup.
Actionable but governed by invalidation levels.
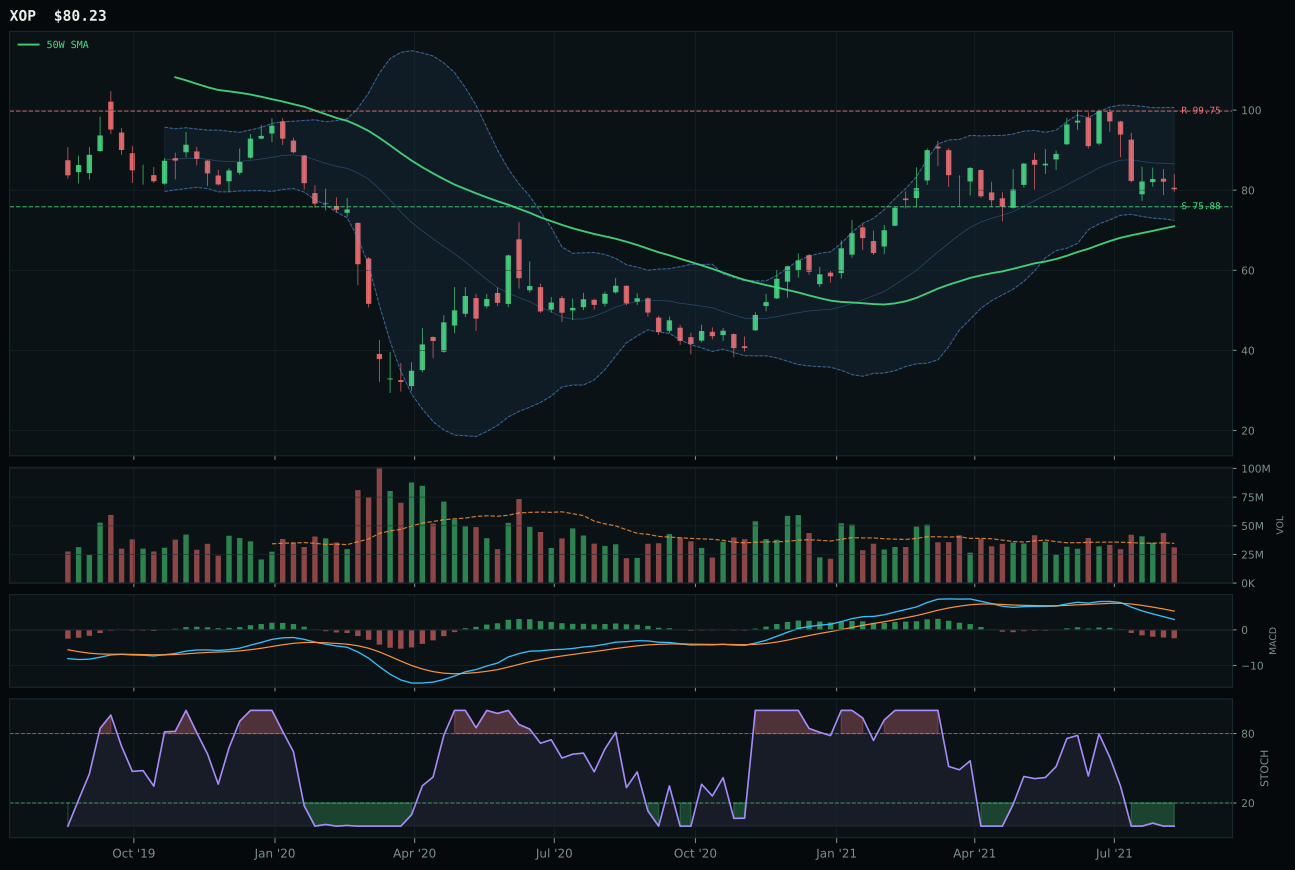
XOP has a neutral structure profile with -14.1% 13-week relative strength versus SPY.
A failed hold above support would weaken the setup.
Actionable but governed by invalidation levels.
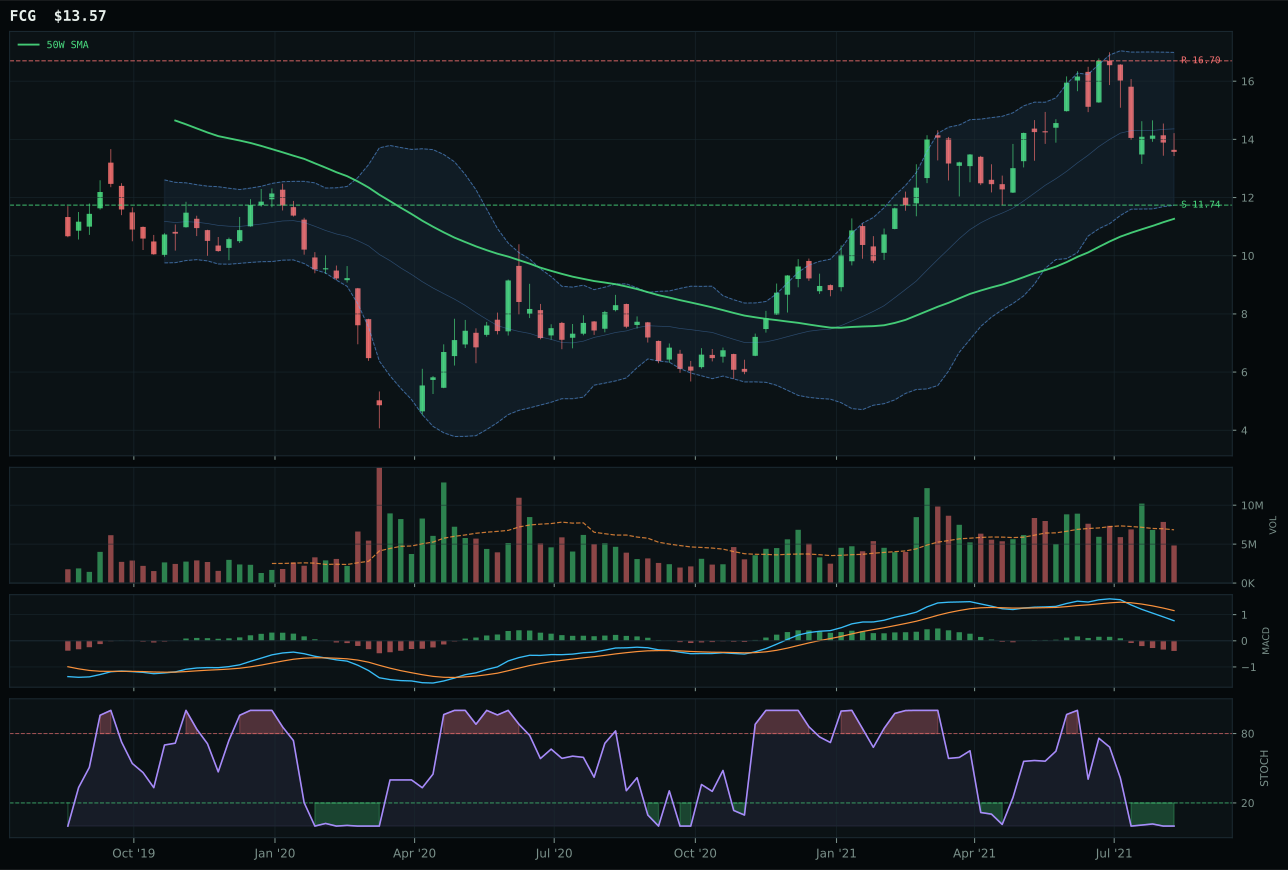
FCG has a vertical extension profile with -11.8% 13-week relative strength versus SPY.
A failed hold above support would weaken the setup.
Actionable but governed by invalidation levels.
XLE wins a zero-allocation category because it shows the best operational setup among deteriorating choices, but that victory carries no forward implication. Price sits above the 50W at 12.5% distance with a 0.6% slope, but it has broken below the 200W—a critical structural failure that disqualifies traditional momentum interpretation. Stochastic RSI at 0.09 (oversold turn-up) and timing at 84.0 are category strengths, suggesting a coil-into-support trade structure rather than a confirmed trend. MACD is bearish/weakening, and the category-relative strength at -0.5% confirms XLE is not leading its peers. Risk/reward of 74.1 is attractive for a bouncer's perspective (7.0% downside vs -11.4% upside resistance), but XOP at 70.0 timing and FCG at lower volatility offer equivalent setups without XLE's price-below-200W weakness. The score gap of 4.1 points to XOP is minimal in a category where the absolute score is 8.0—this is not a category win; this is identifying the least broken option in a fundamentally broken sector.
Traditional Energy received 0% allocation because the category scored 8.0, placing it at rank 9 or 10 and outside the eligible allocation universe. The category macro fit of 40.0 is weighted heavily by disinflation pressure at -10 and credit stress at -7, both structural headwinds to energy capex and commodity demand. Real-asset sponsorship at +7 is the only meaningful macro support, but it is insufficient to offset the broader disinflationary bias. Technical evidence for XLE is 26.0, near the portfolio floor, driven by a 47.0 trend score (below-50W positioning) and 11.2 momentum confirmation reflecting negative 13W returns and thin participation. This is a pure exclusion week: the portfolio does not hate energy on secular grounds, but the confluence of weak macro tailwinds, deteriorating technicals across the entire category, and the absence of any credible setup justifies zero allocation. For Traditional Energy to earn even a tier-2 slot of 5%, XLE would need to reclaim the 200W with above-average volume participation and achieve positive RS to SPY—a reversal of multiple current conditions. The setup would also require visible improvement in oil demand signals or a sharp dollar reversal, neither of which is present in the current Goldilocks regime.