
2021-08-06
Informational purposes only. The content in this report, including allocations, analysis, and commentary, is provided solely for informational and educational purposes. It does not constitute financial advice, investment advice, trading advice, or any other type of advice. Past performance does not guarantee future results. Always conduct your own research and consult a qualified financial professional before making investment decisions.
Weekly Allocation
| Ticker | Category | Weight | Role |
|---|---|---|---|
| FSOL | 50% | Overlay | |
| IGV | Technology | 10% | Top-2 (10%) |
| COPX | Industrial Metals | 10% | Top-2 (10%) |
| SMH | AI | 5% | Tier-2 (5%) |
| XLU | Utilities & Infrastructure | 5% | Tier-2 (5%) |
| ITA | Defense & Aerospace | 5% | Tier-2 (5%) |
| GLD | Precious Metals | 5% | Tier-2 (5%) |
| URNM | Nuclear Energy | 5% | Tier-2 (5%) |
| WEAT | Agriculture & Livestock | 5% | Tier-2 (5%) |
Trade Instructions — Monday Open
Sell the tranche from 2021-07-09 (completing its 4-week hold). Buy the new tranche. Instructions show net portfolio changes — same-asset positions cancel, weight changes show the delta.
| Action | Ticker | Instruction |
|---|---|---|
| SELL | XLK | Sell 33% of XLK position (reduce 7.50% → 5.00%) |
| SELL | FCG | Sell entire FCG position (2.50% of portfolio) |
| SELL | REMX | Sell 33% of REMX position (reduce 3.75% → 2.50%) |
| SELL | INDA | Sell 33% of INDA position (reduce 3.75% → 2.50%) |
| SELL | SLV | Sell entire SLV position (1.25% of portfolio) |
| BUY | COPX | Buy COPX — 28.57% of freed cash (adds 2.50% to portfolio) |
| BUY | GLD | Buy GLD — 14.29% of freed cash (adds 1.25% to portfolio) |
| BUY | WEAT | Buy WEAT — 14.29% of freed cash (adds 1.25% to portfolio) |
| BUY | URNM | Buy URNM — 14.29% of freed cash (adds 1.25% to portfolio) |
| BUY | IGV | Buy IGV — 28.57% of freed cash (adds 2.50% to portfolio) |
Current Portfolio After Trade
Combined holdings across all 4 active tranches. Each tranche is 25% of the portfolio.
| Ticker | % of Portfolio | Weight Bar |
|---|---|---|
| FSOL | 25.00% | |
| FBTC | 25.00% | |
| COPX | 6.25% | |
| XLK | 5.00% | |
| SMH | 5.00% | |
| XLU | 5.00% | |
| ITA | 5.00% | |
| GLD | 5.00% | |
| WEAT | 3.75% | |
| URNM | 3.75% | |
| REMX | 2.50% | |
| INDA | 2.50% | |
| CIBR | 2.50% | |
| IGV | 2.50% | |
| ILF | 1.25% |
Macro Regime — Goldilocks
Macro Evidence Charts
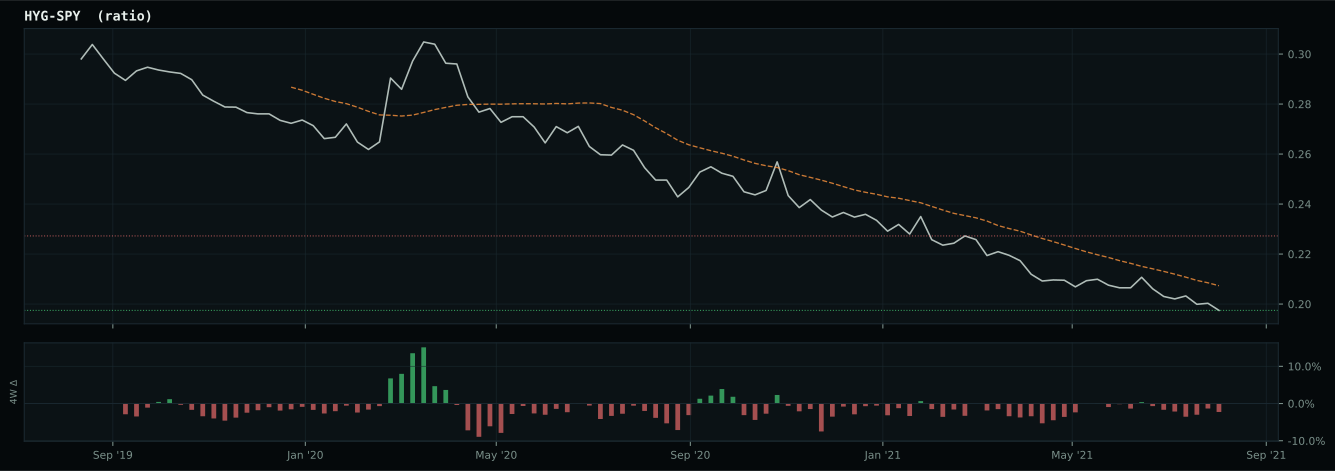
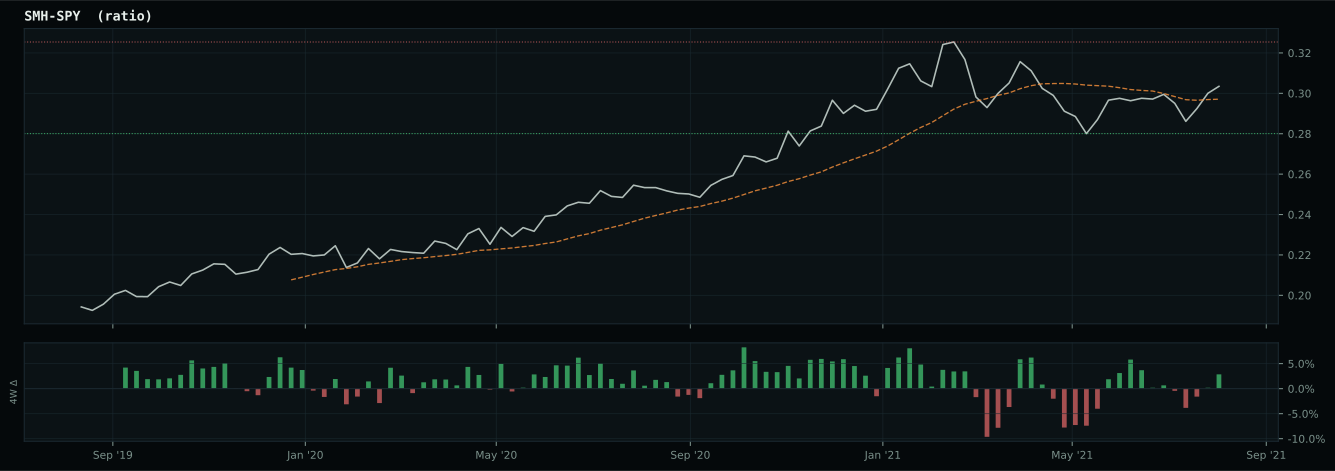
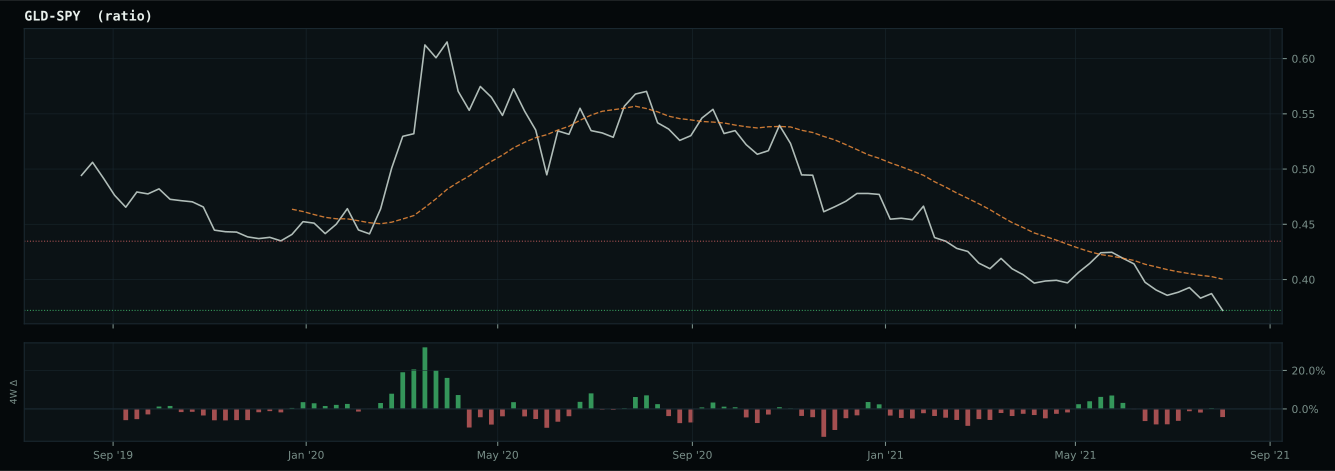
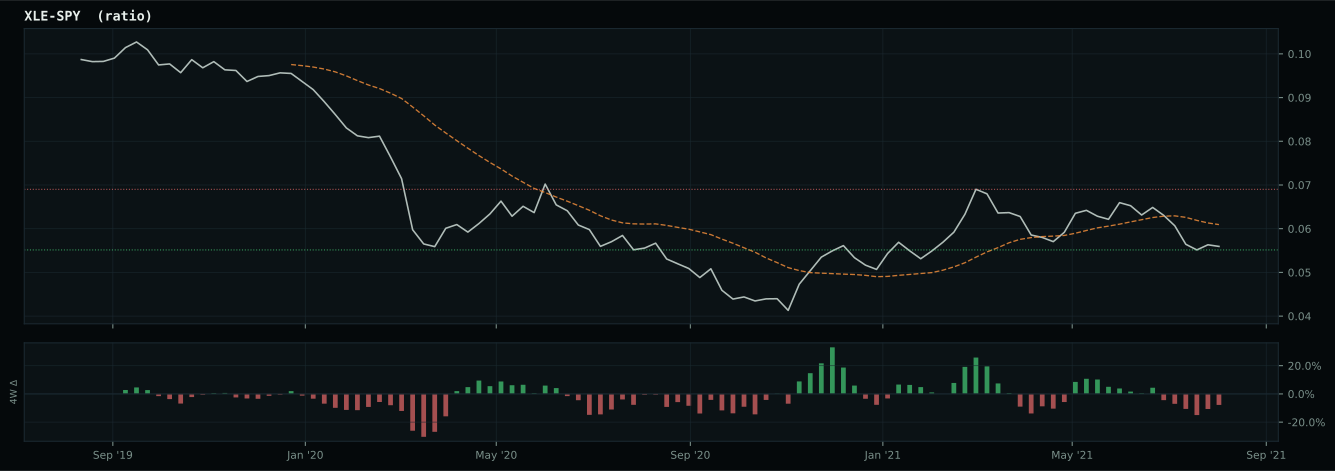
Market-implied signals behind the macro regime scores. Each ratio compares two assets; the direction and slope of the ratio is what the macro engine reads.
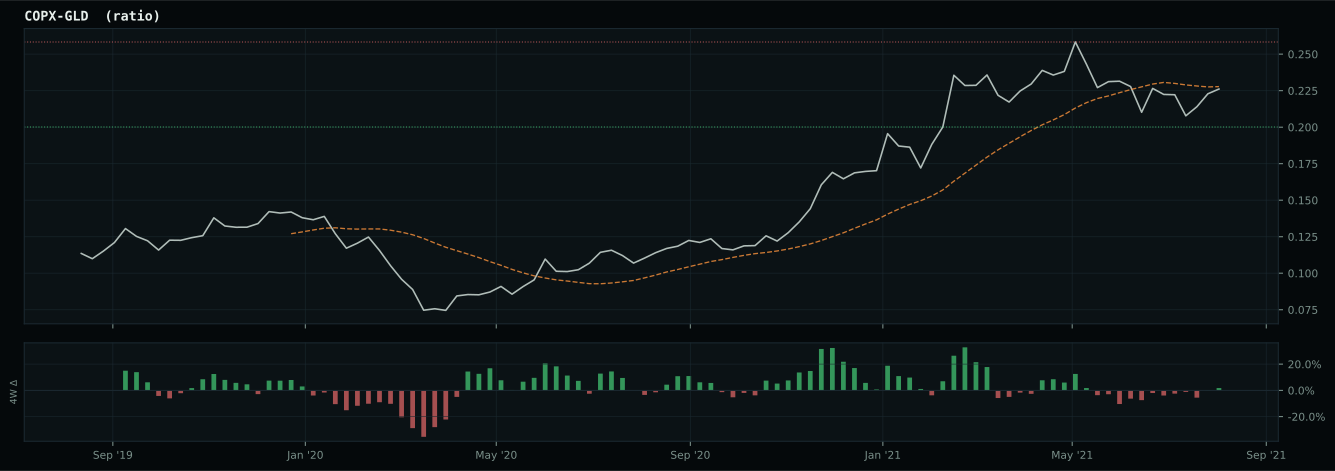
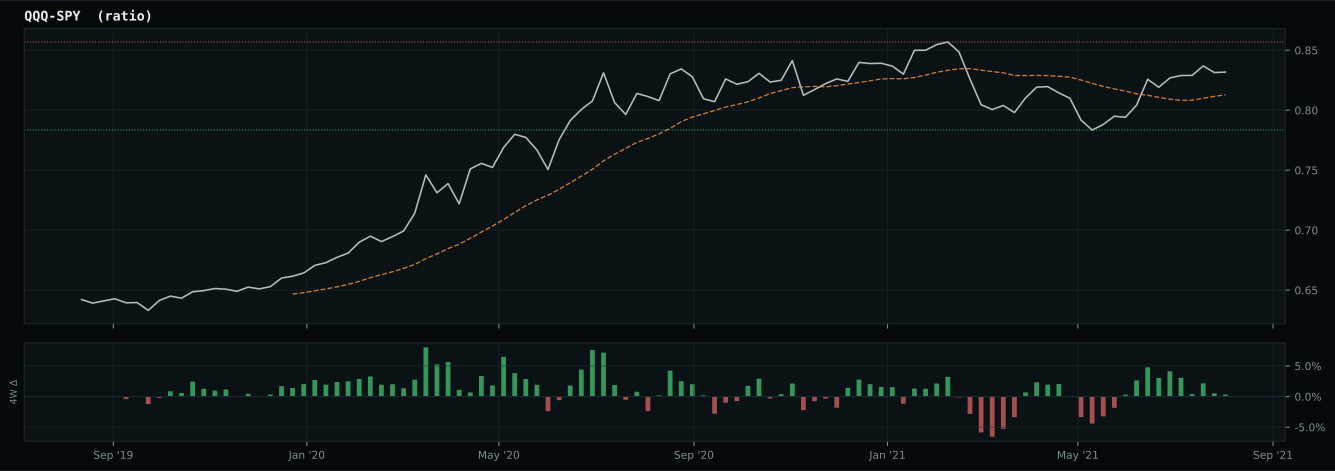
Crypto Regime — AltSeason
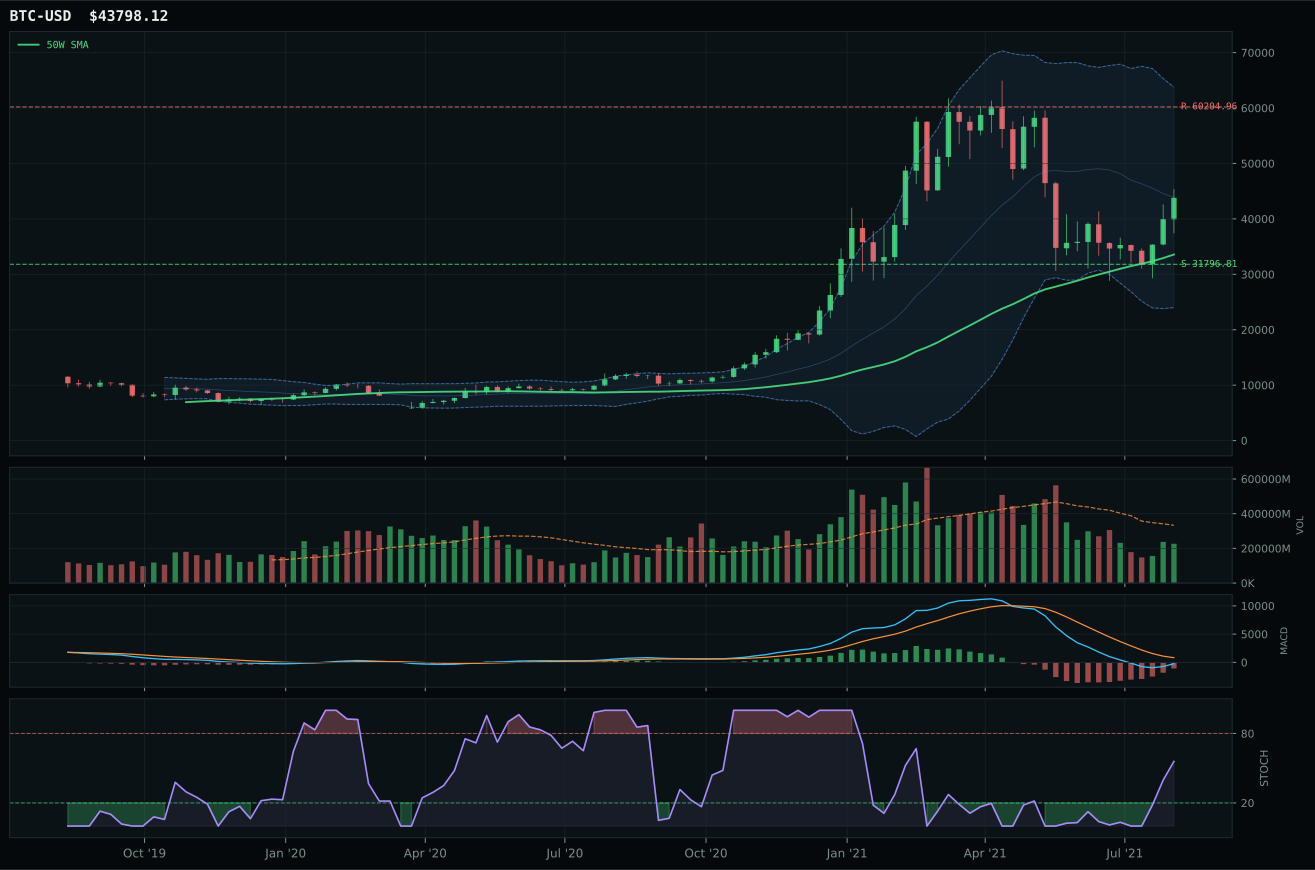
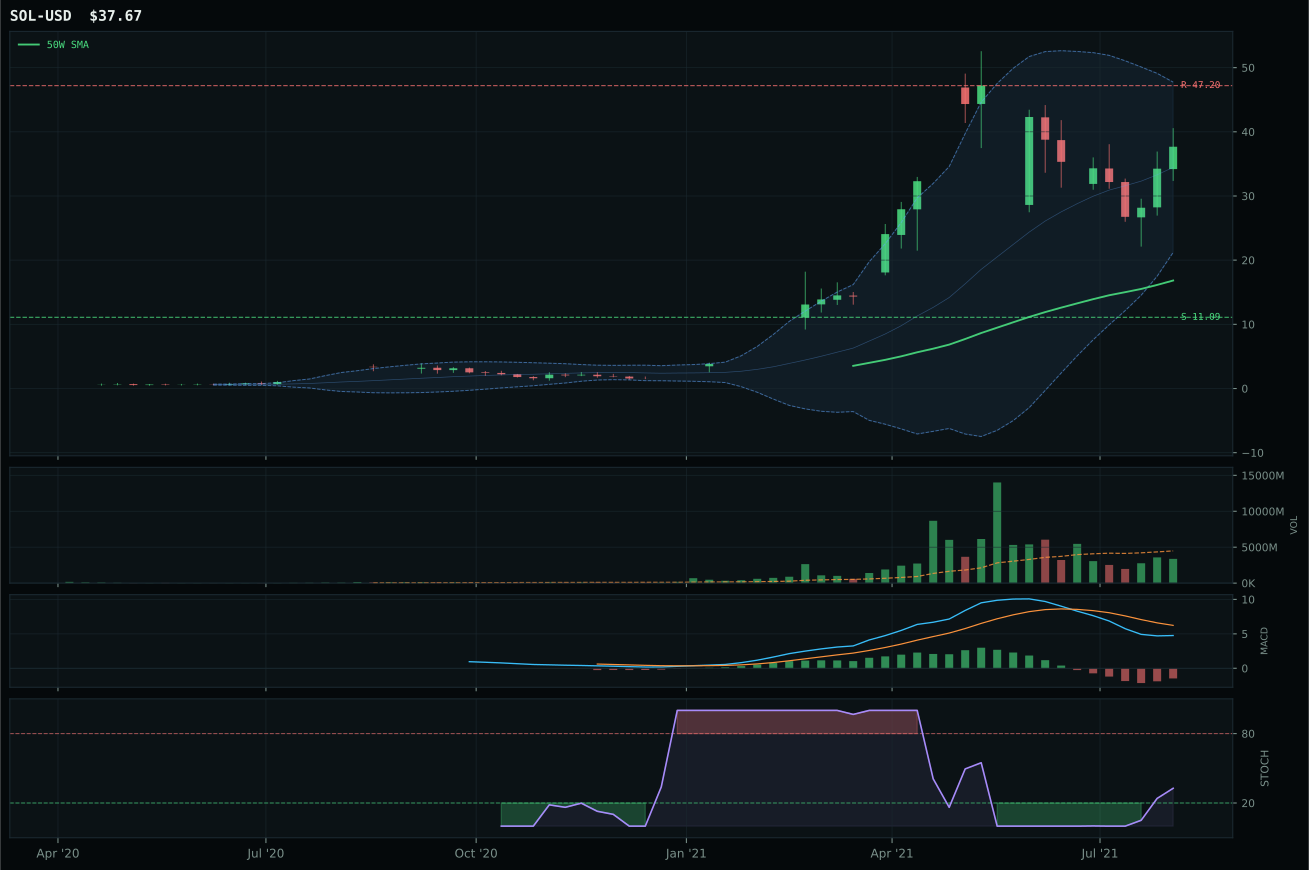
ValueBTC not armed: BTC has not made the first post-breakdown touch of the 200W buy zone after losing the 50W
TrendBTC confirmed: 2 consecutive closes above rising/flat 50W SMA
all available AltSeason conditions pass; missing optional confirmations skipped
Category Rankings
| Rank | Category | Winner | Score | Alloc | 4W Ret | Peers (4W) |
|---|---|---|---|---|---|---|
| 1 | Technology | IGV | 72.6 | 20% | +3.90% | CIBR +8.4% · XLK +2.9% |
| 2 | Industrial Metals | COPX | 52.3 | 20% | +1.51% | REMX +5.6% · PICK -0.6% |
| 3 | AI | SMH | 49.4 | 10% | +1.71% | AIQ +3.7% · BOTZ +13.2% |
| 4 | Utilities & Infrastructure | XLU | 43.5 | 10% | +2.86% | PAVE +2.5% · IGF +2.4% |
| 5 | Defense & Aerospace | ITA | 35.8 | 10% | -2.78% | XAR -3.0% · ROKT -1.6% |
| 6 | Precious Metals | GLD | 32.3 | 10% | +4.02% | GDX +0.3% · SLV +2.6% |
| 7 | Nuclear Energy | URNM | 31.4 | 10% | +38.51% | NLR +5.3% · URA +27.1% |
| 8 | Agriculture & Livestock | WEAT | 30.3 | 10% | +0.00% | MOO +2.7% · VEGI +2.8% |
| 9 | Emerging Markets | ILF | 24.5 | 0% | -2.38% | INDA +7.8% · IEMG +2.1% |
| 10 | Traditional Energy | XLE | 8.2 | 0% | -0.94% | XOP +3.9% · FCG +5.5% |
Technology — IGV
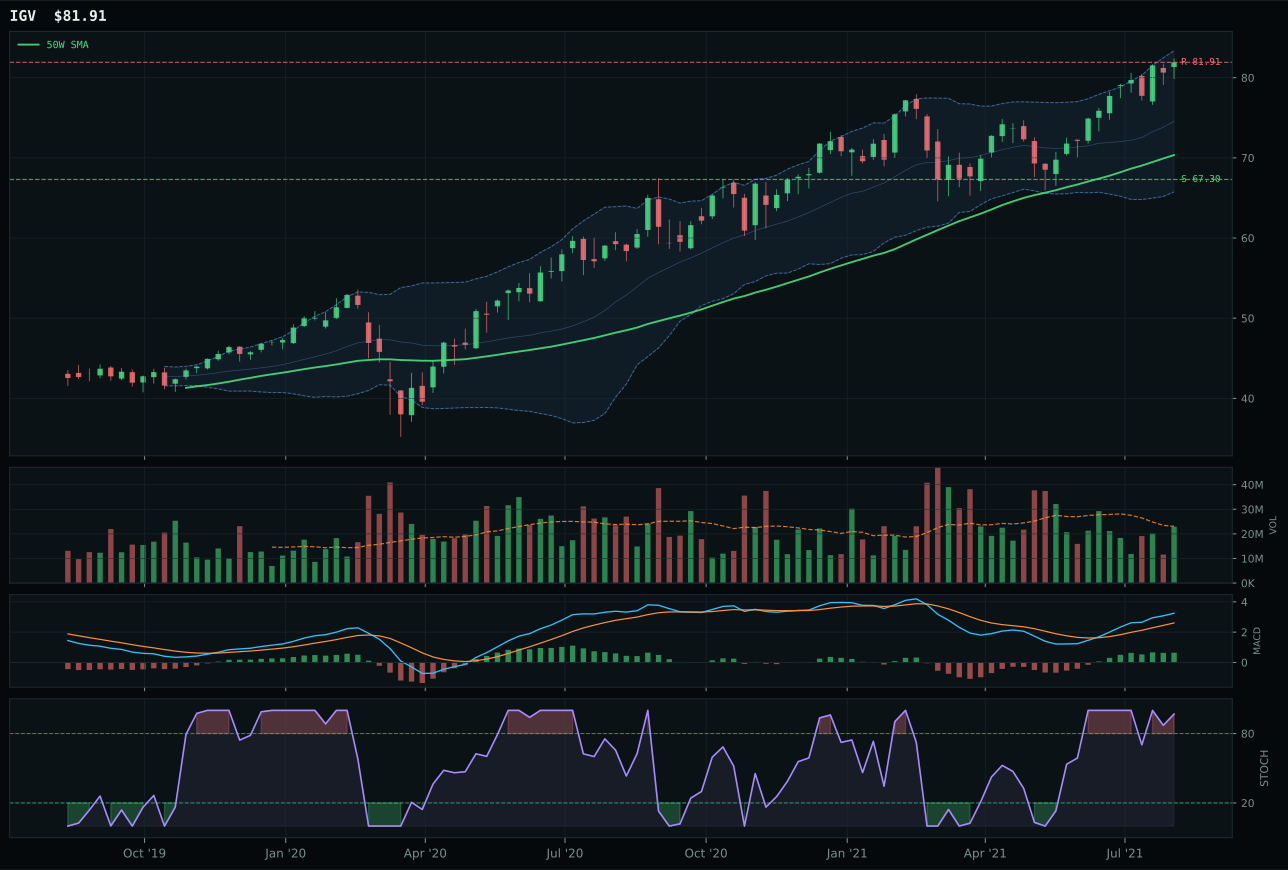
IGV has a vertical extension profile with 13.4% 13-week relative strength versus SPY.
A failed hold above support would weaken the setup.
Actionable but governed by invalidation levels.
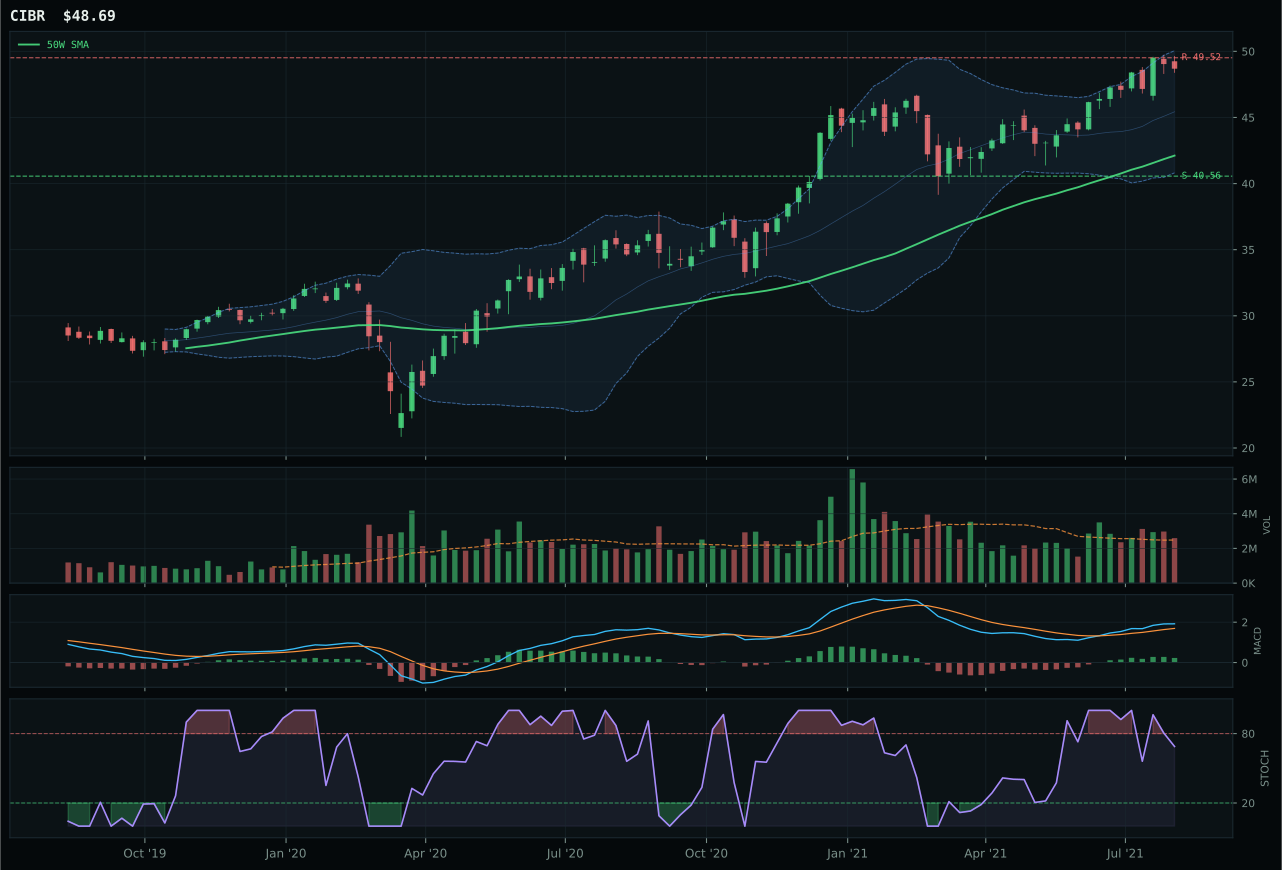
CIBR has a vertical extension profile with 8.4% 13-week relative strength versus SPY.
A failed hold above support would weaken the setup.
Actionable but governed by invalidation levels.
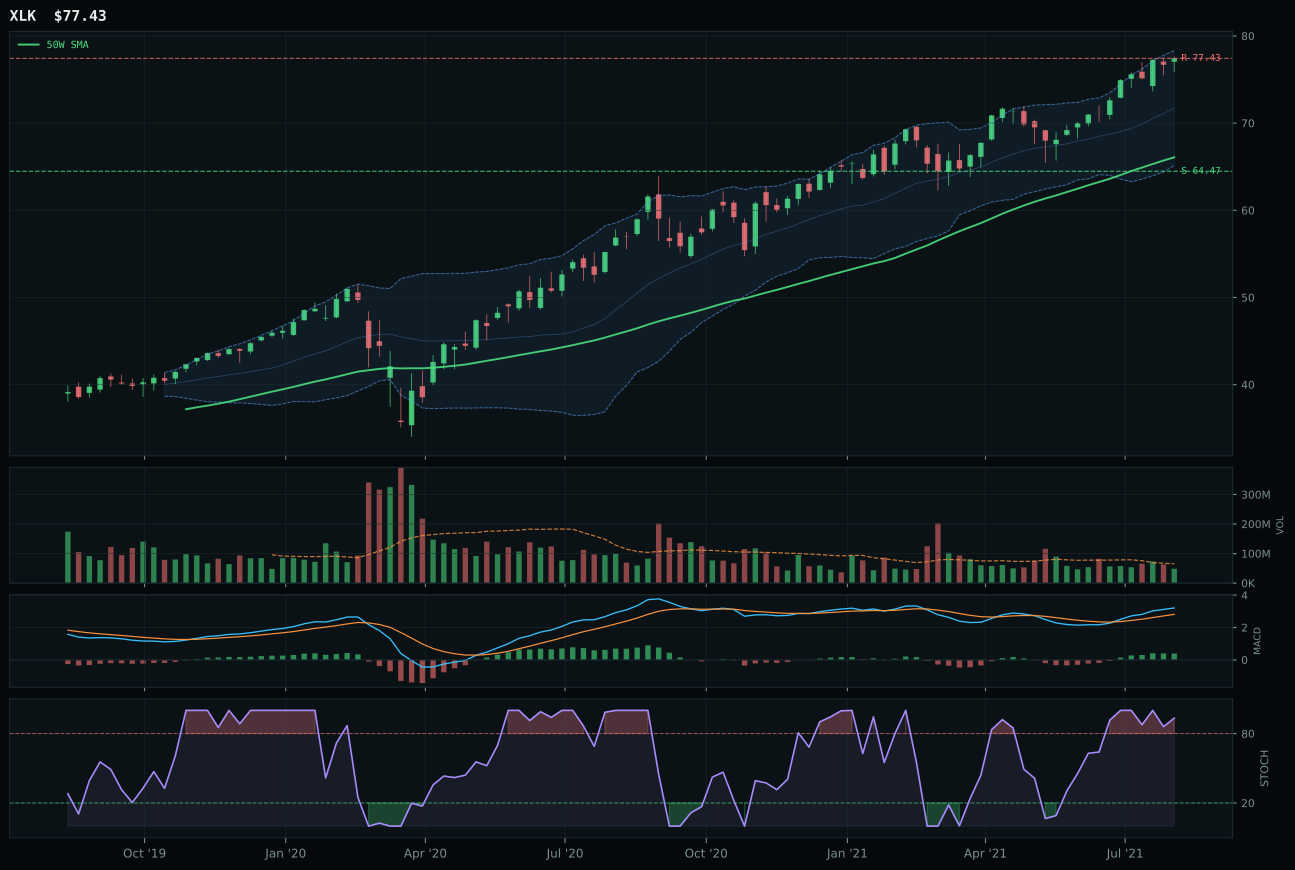
XLK has a vertical extension profile with 6.6% 13-week relative strength versus SPY.
A failed hold above support would weaken the setup.
Actionable but governed by invalidation levels.
IGV wins because it holds above both the 50W and 200W moving averages with a steady 0.6% slope, paired with 13.4% relative strength versus SPY—a signal that institutional buyers are accumulating despite the 16.4% extension above the 50W. CIBR lost ground because its MACD, though bullish, is flattening rather than improving, and its 0.0% category-relative strength reveals no peer leadership inside the three-ETF basket. The setup is clean: vertical extension with 83.3/100 structure quality, MACD improving into overbought stochastic momentum, and neutral volume participation at 0.99x the 20W average. Entry risk is real at this altitude, but the persistence score of 79.2/100 shows institutional accumulation is sustaining the move rather than merely pushing it toward resistance at 81.91.
Technology earned the second allocation slot at 10% on the strength of a 72.6 composite score anchored by deterministic trend evidence and the Goldilocks macro regime. Liquidity expansion, risk appetite, and AI growth sponsorship all favor duration-sensitive software in the current environment, offsetting the extended valuation visible in price sitting near Fibonacci 0.236. IGV's momentum confirmation score of 100 reflects both the four-week return and improving MACD, which separates it cleanly from the broader market's tentative footing. The category would need to fall below 70 or lose relative strength to the broader tech sector to justify reduction—current positioning reflects confidence that entry timing, while late, still rewards disciplined conviction.
Industrial Metals — COPX
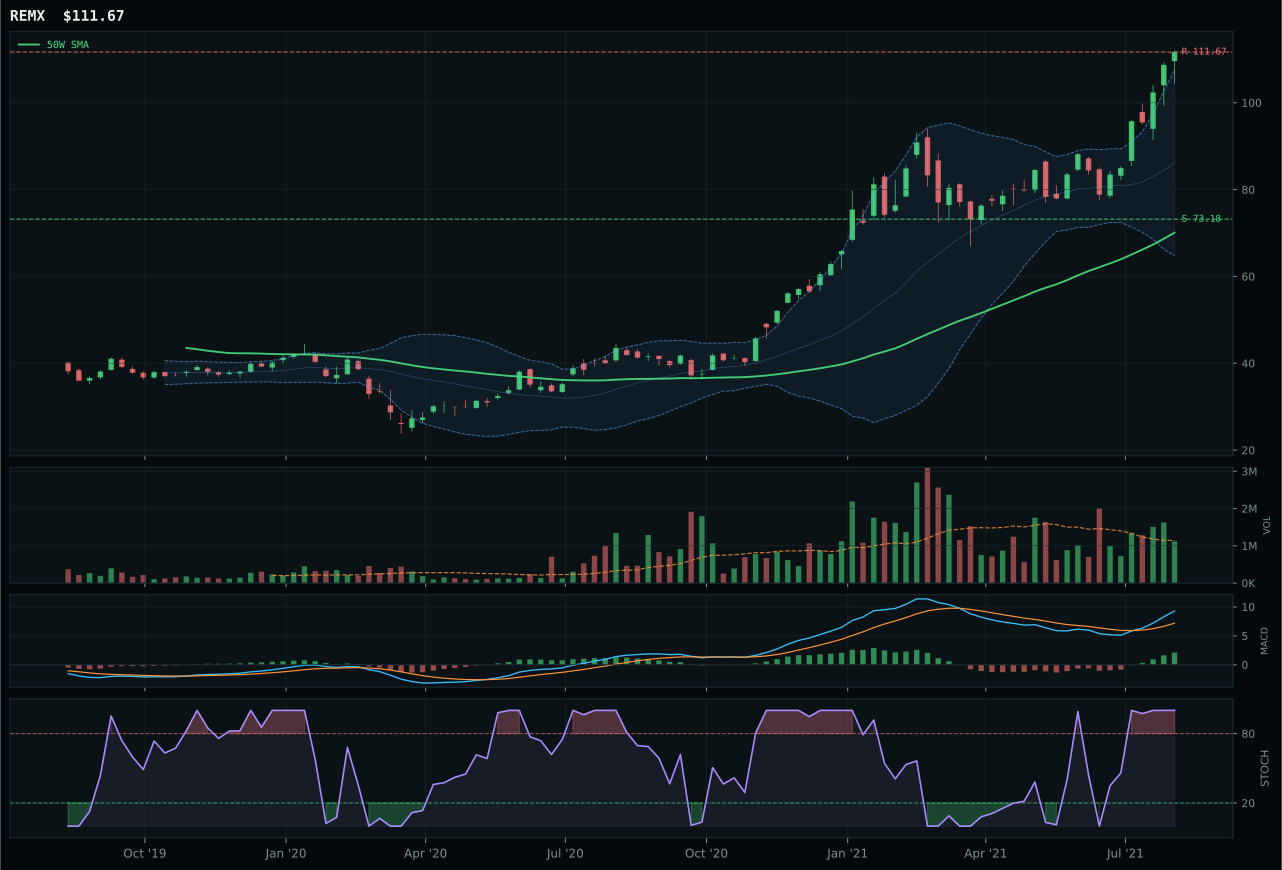
REMX has a vertical extension profile with 27.3% 13-week relative strength versus SPY.
A failed hold above support would weaken the setup.
Actionable but governed by invalidation levels.
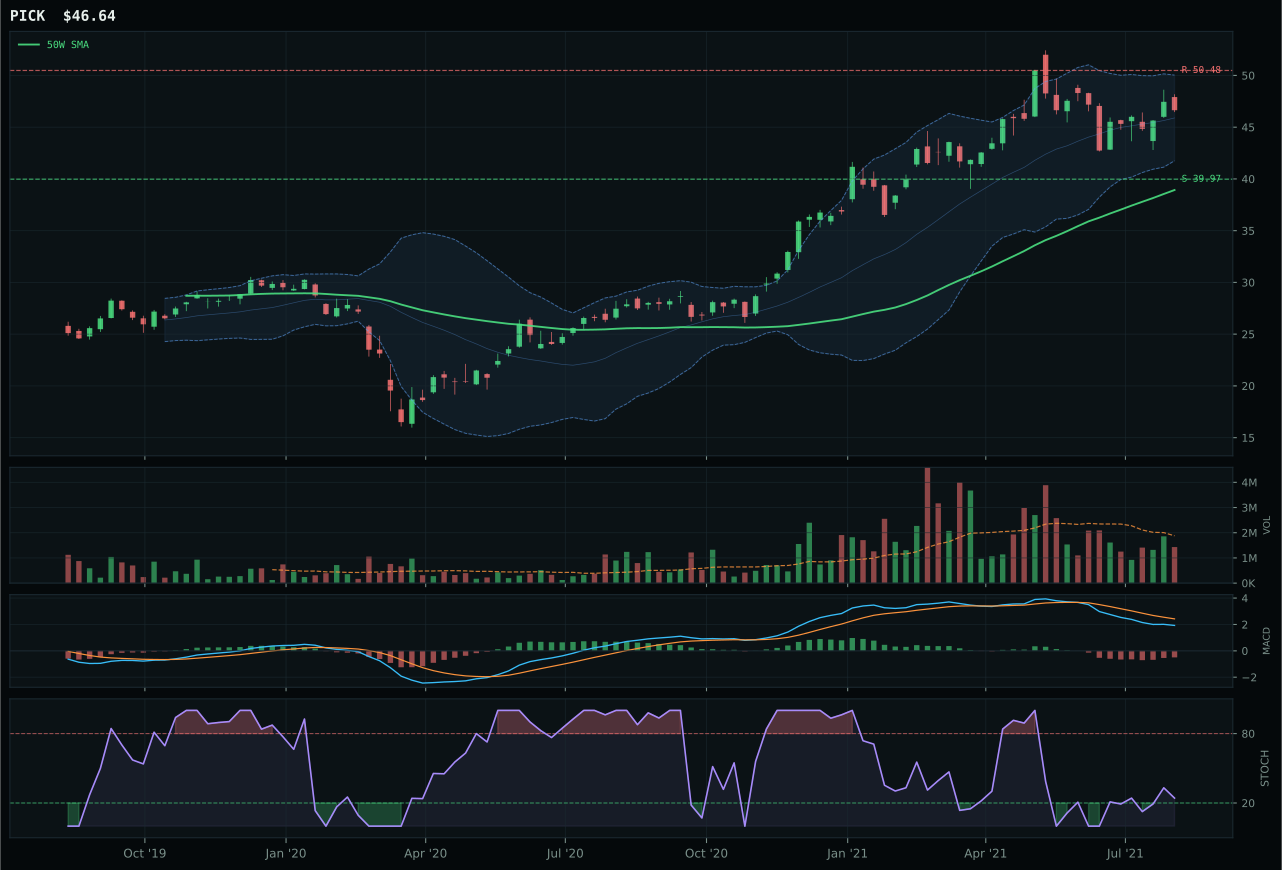
PICK has a vertical extension profile with -12.4% 13-week relative strength versus SPY.
A failed hold above support would weaken the setup.
Actionable but governed by invalidation levels.
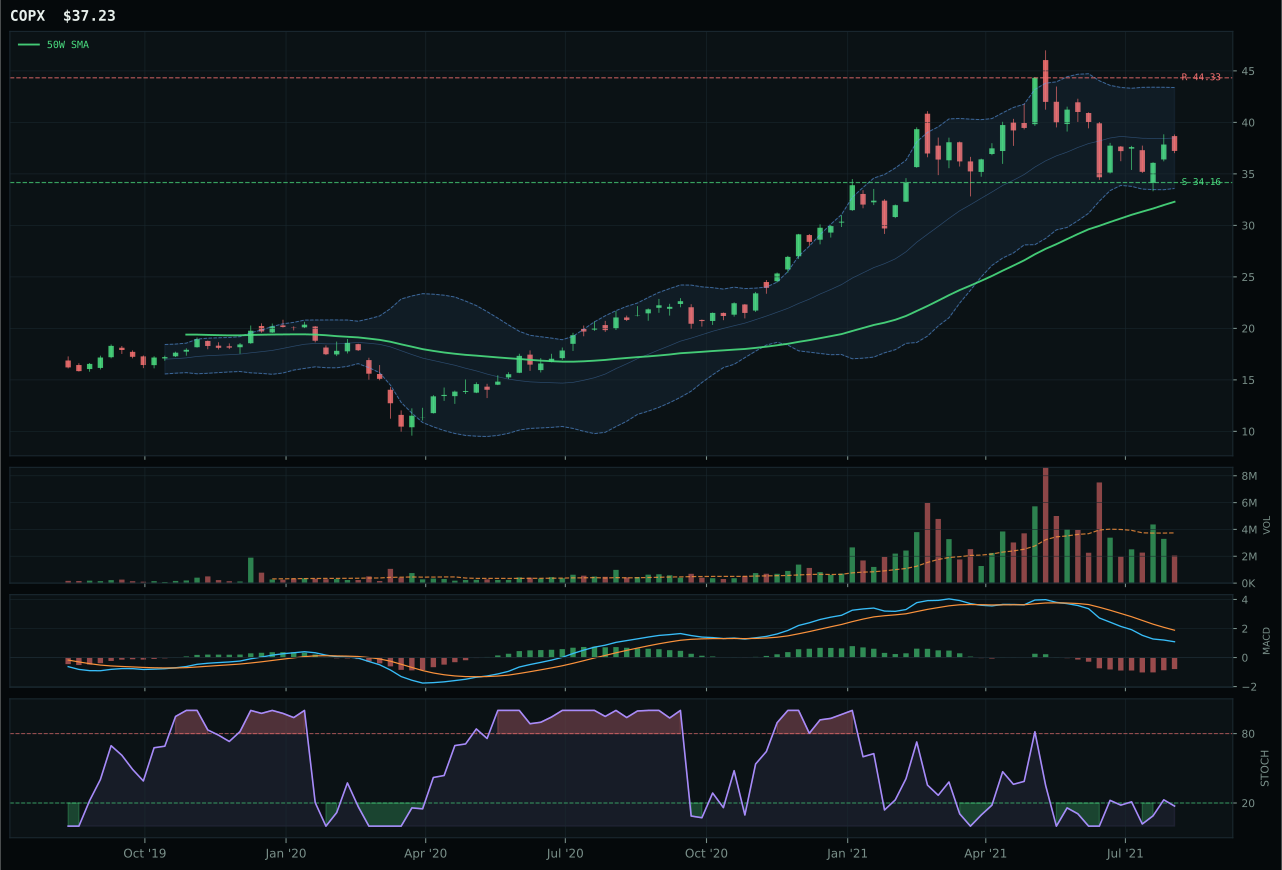
COPX has a vertical extension profile with -20.8% 13-week relative strength versus SPY.
A failed hold above support would weaken the setup.
Actionable but governed by invalidation levels.
COPX wins with a counterintuitive setup: price is 15.3% above the 50W in vertical extension (67.0/100 timing), yet MACD is bearish but improving and stochastic RSI is oversold turn up (0.17)—a divergence that rewards contrarian entry over momentum chasing. REMX, the runner-up, is the opposite problem: it is 59.3% extended above the 50W with MACD bullish and improving, stochastic RSI at overbought extremes, and 27.3% SPY-relative strength that screams late entry into rare earth enthusiasm. The score gap is -12.5 points in favor of REMX on raw technical evidence (87.9/100 vs 31.8/100), but COPX's 62.1/100 risk-reward ratio crushes REMX's 39.7/100 because every new buyer in REMX is paying extension prices for a parabolic move. Copper scarcity sponsorship (+12 macro descriptor) justifies contrarian accumulation at support levels, not chasing strength at resistance.
Industrial Metals earned top-2 selection at 10% allocation driven by macro sponsorship rather than technical confirmation. Metals scarcity is +14, commodity breadth positive is +10, and real asset sponsorship is +6—a powerful macro triplet in Goldilocks. The category score of 52.3 is supported by a reasoned ETF basket that weights the strongest performer (REMX at 80.9) triple and COPX last, yet COPX's oversold timing makes it the representative. This allocation is a conviction trade on the macro thesis that supply constraints will drive upside, not a validation of current price action. COPX's 0.0% momentum confirmation and -20.8% relative strength are yellow flags; the position should be monitored closely for deterioration in category-relative strength, which would signal that the scarcity narrative is failing to drive follow-through buying.
AI — SMH
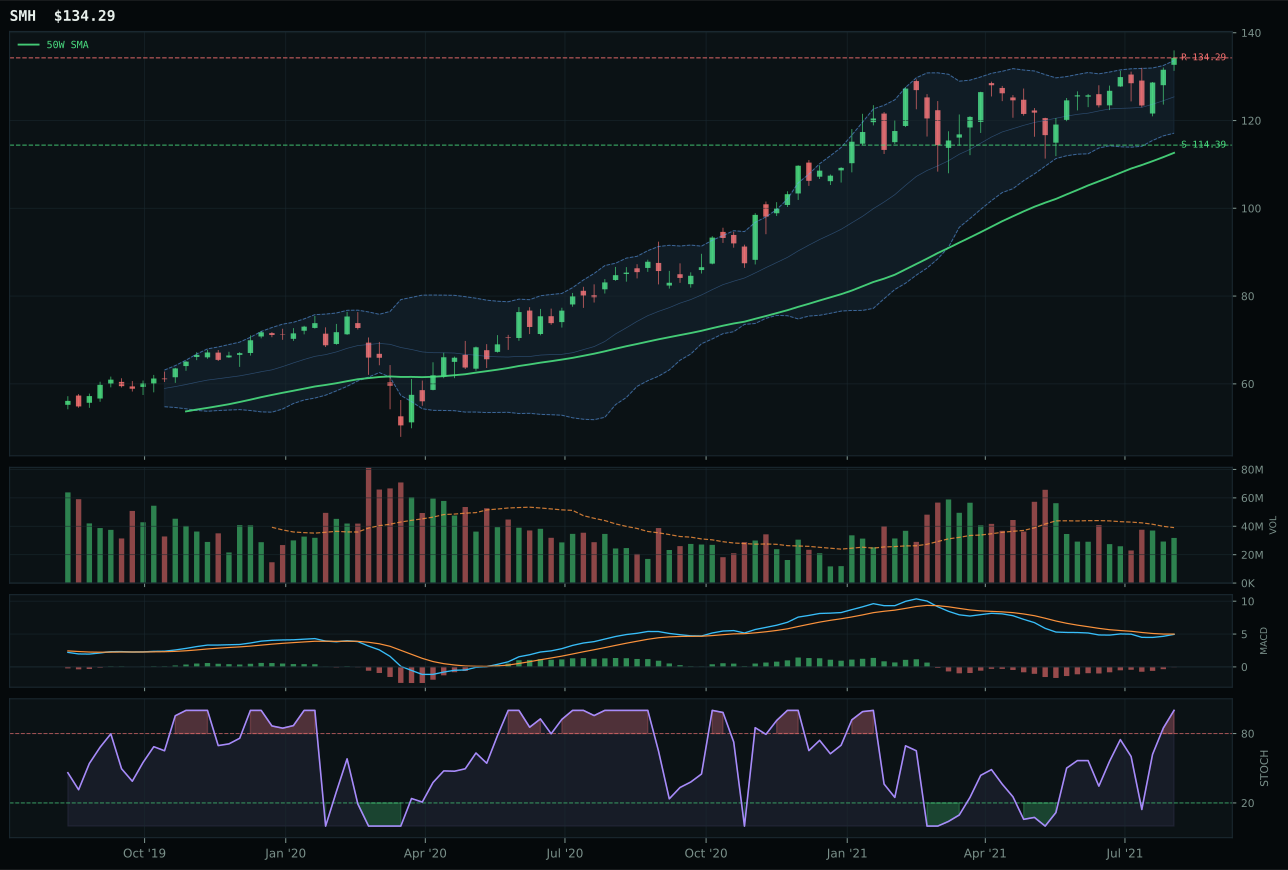
SMH has a vertical extension profile with 5.4% 13-week relative strength versus SPY.
A failed hold above support would weaken the setup.
Actionable but governed by invalidation levels.
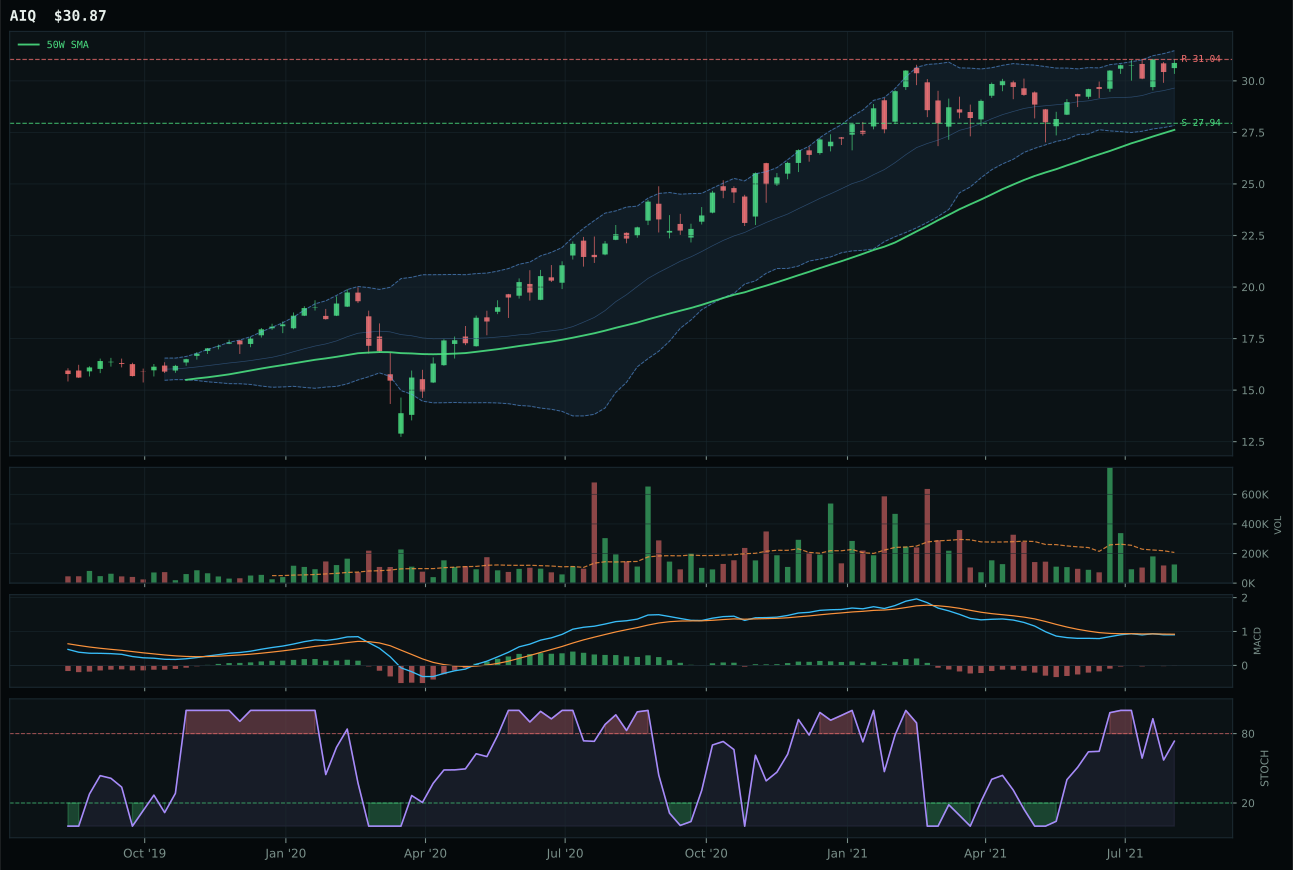
AIQ has a neutral structure profile with 2.2% 13-week relative strength versus SPY.
A failed hold above support would weaken the setup.
Tracked, but not top-2 eligible because: .
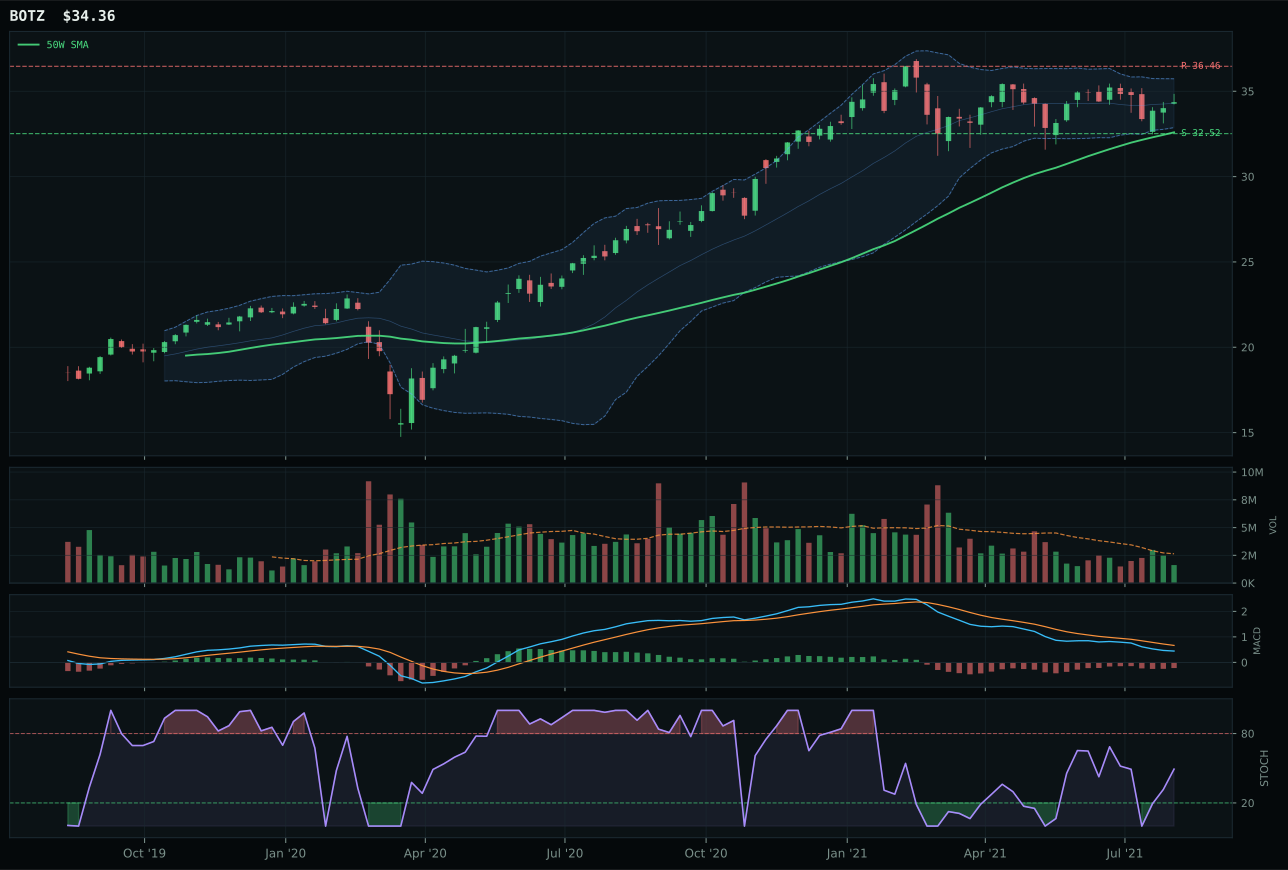
BOTZ has a neutral structure profile with -4.6% 13-week relative strength versus SPY.
A failed hold above support would weaken the setup.
Actionable but governed by invalidation levels.
SMH wins because it sits above both key moving averages with a robust 0.9% 50W slope, yet carries enough of a speed bump—19.2% above the 50W—that the system penalizes entry timing. Its 5.4% relative strength versus SPY and 3.2% category-relative strength confirm there is buyer conviction, even though AIQ's 2.2% SPY-relative strength and thin volume participation failed to establish peer leadership. MACD is bearish but improving for SMH, stochastic RSI sits at overbought extremes, and the risk-reward ratio of 45.3/100 reflects a pullback setup disguised as extension—the real strength is that 0.81x volume is neutral, not rejecting the move. Semiconductors, as the compute layer beneath AI infrastructure, enjoy macro sponsorship from the +14 AI growth descriptor that software and application ETFs cannot match.
AI received 5% allocation despite a final score of 49.4, well below the top two categories. The allocation reflects macro conviction rather than technical opportunity—AI growth sponsorship is active at +14, and liquidity expansion supports risk assets broadly in Goldilocks. SMH's trend score of 100 carries the category, but the 0.0% momentum confirmation screams caution: 13-week returns across the three-ETF basket are weak, and category-relative strength is underwater. This is a position held for narrative exposure, not technical quality. The category must prove it can sustain upside without deteriorating further on relative strength metrics to earn promotion to the 10% tier.
Utilities & Infrastructure — XLU
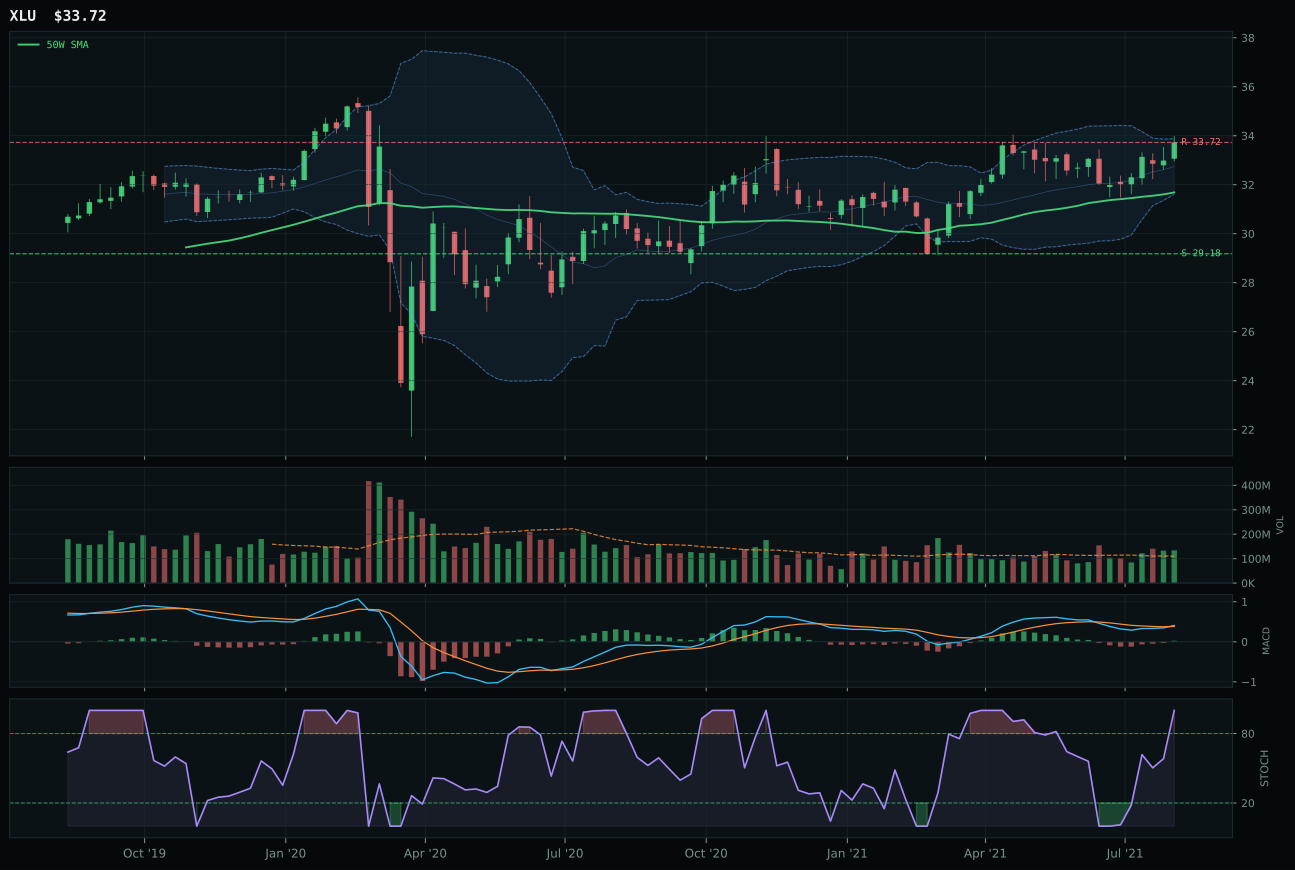
XLU has a neutral structure profile with -2.7% 13-week relative strength versus SPY.
A failed hold above support would weaken the setup.
Actionable but governed by invalidation levels.
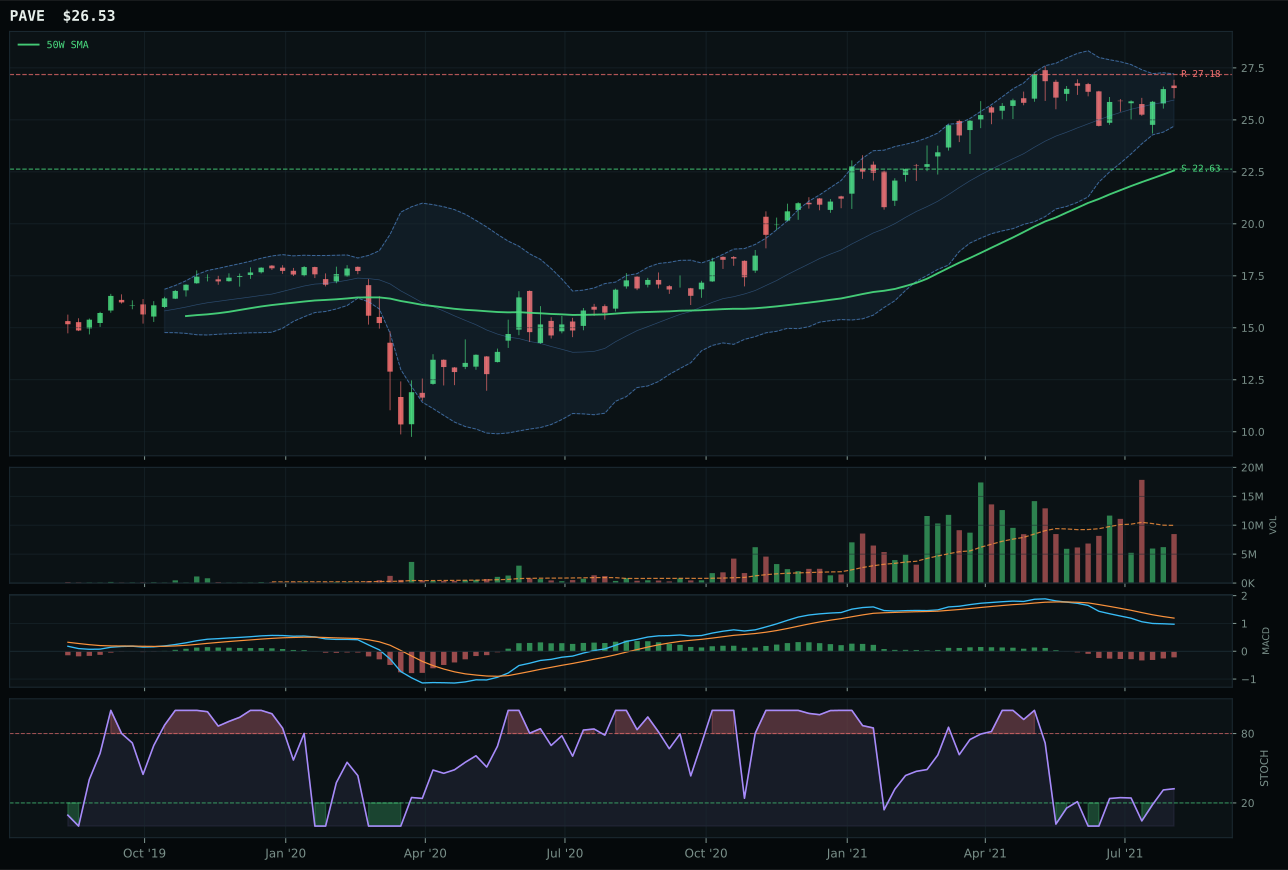
PAVE has a vertical extension profile with -7.2% 13-week relative strength versus SPY.
A failed hold above support would weaken the setup.
Actionable but governed by invalidation levels.
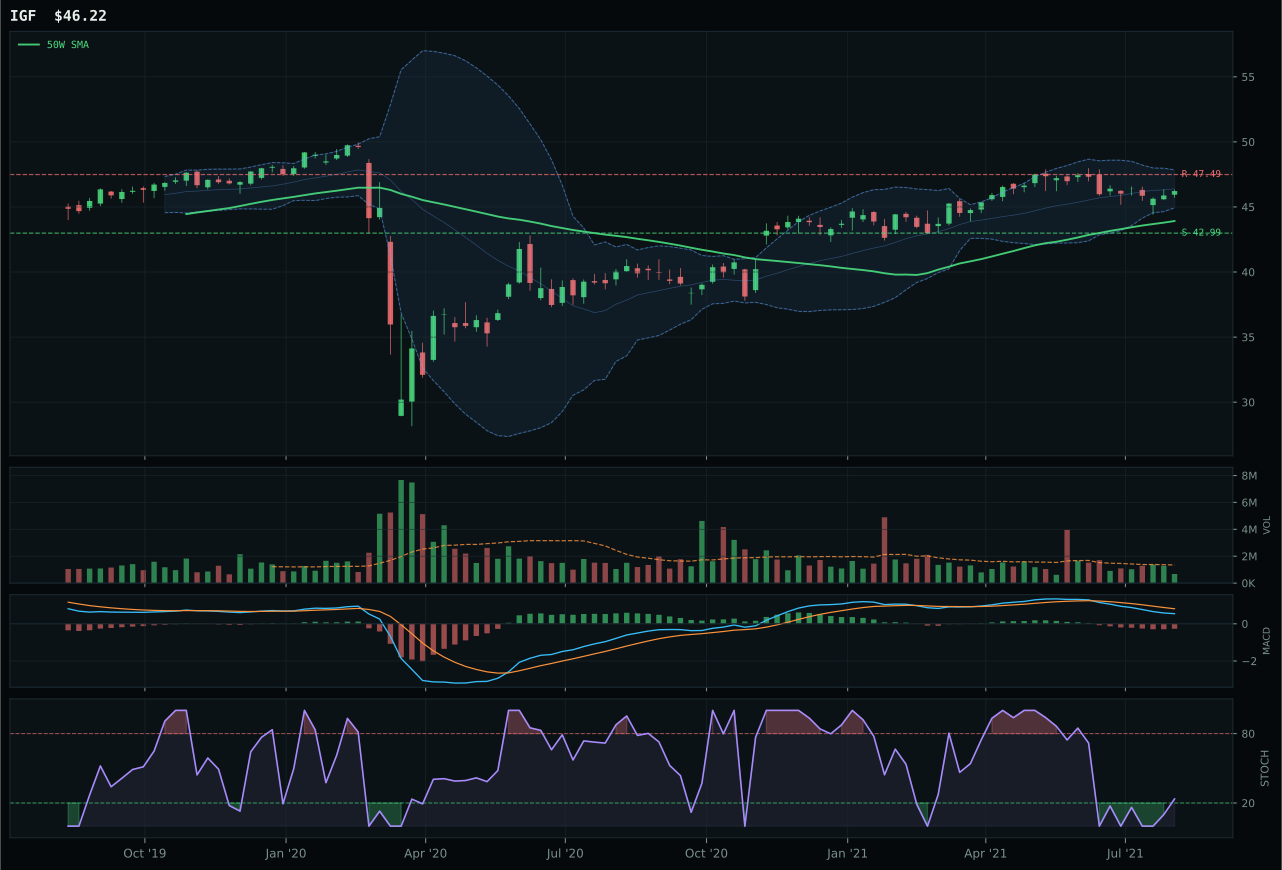
IGF has a neutral structure profile with -7.5% 13-week relative strength versus SPY.
A failed hold above support would weaken the setup.
Actionable but governed by invalidation levels.
XLU wins decisively because it is the only ETF showing clean uptrend confirmation: price sits 6.4% above the 50W (close enough to ride the trend, far enough to avoid noise), MACD is bullish and improving, stochastic RSI is at overbought extremes, and volume at 1.22x the 20W average is above-average participation confirming accumulation. PAVE lost a 22.3-point gap because it is 17.6% extended above the 50W in classic overbought vertical extension, its MACD is bearish but improving (not bullish), stochastic RSI is rising mid-zone (not confirmation), and volume is neutral, signaling weak sponsorship. XLU's 96.0/100 trend score is the category's only genuine strength marker; it benefits from a 0.3% 50W slope that is the steadiest in any category, reflecting institutional accumulation at a measured pace. The 78.1/100 momentum confirmation and 73.4/100 volume-price confirmation pair to show that this move is real, not a bounce.
Utilities earned 5% allocation on XLU's technical merit combined with moderate macro tailwinds: disinflation pressure is +6 and broad market bear provides +4 shelter. The category score of 43.5 ranks it sixth, below high-conviction growth plays but ahead of rejected categories like Traditional Energy and Emerging Markets. XLU's combination of strong trend (96.0), solid timing (75.0), and robust momentum confirmation (78.1) makes it the cleanest entry in a defensive category. However, the 0.0% risk-reward upside to resistance signals that price is at the retest level; upside is constrained while downside to support of 15.6% offers reasonable cushion. Risk appetite positive is a -3 headwind, meaning this allocation is defensive positioning. Scale this position aggressively only if equities accelerate higher; if disinflation fears spike or credit stress widens, XLU can re-test support with conviction.
Defense & Aerospace — ITA
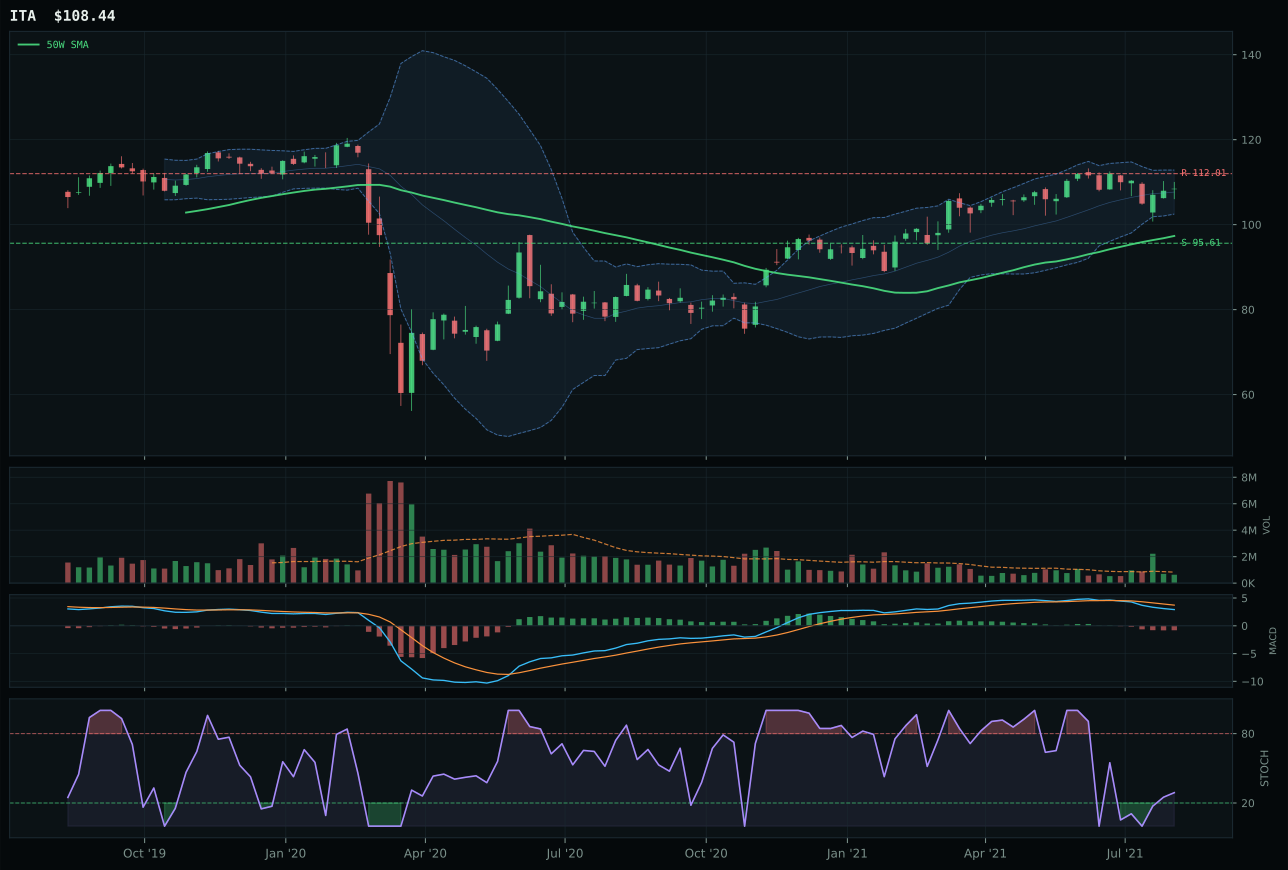
ITA has a neutral structure profile with -4.1% 13-week relative strength versus SPY.
A failed hold above support would weaken the setup.
Actionable but governed by invalidation levels.
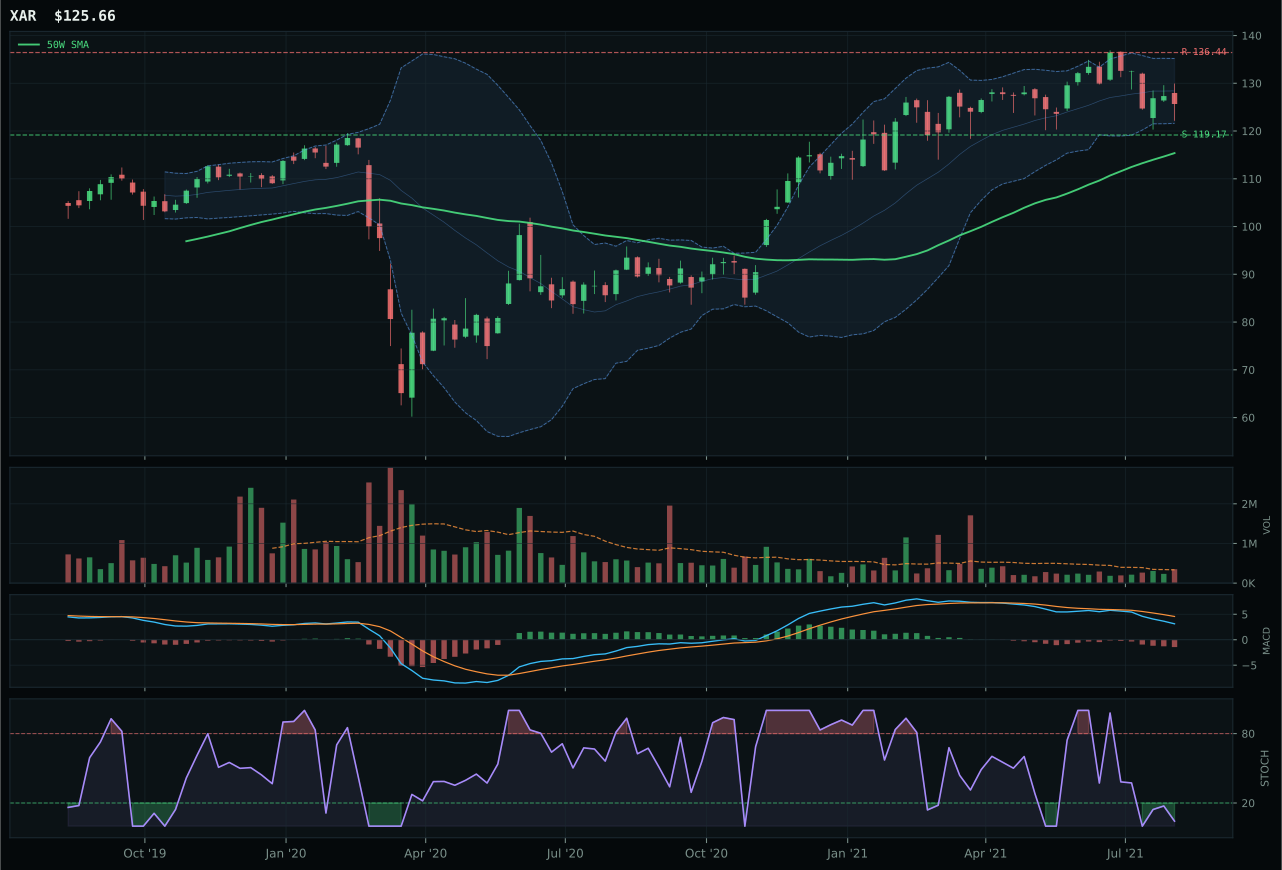
XAR has a neutral structure profile with -5.8% 13-week relative strength versus SPY.
A failed hold above support would weaken the setup.
Actionable but governed by invalidation levels.
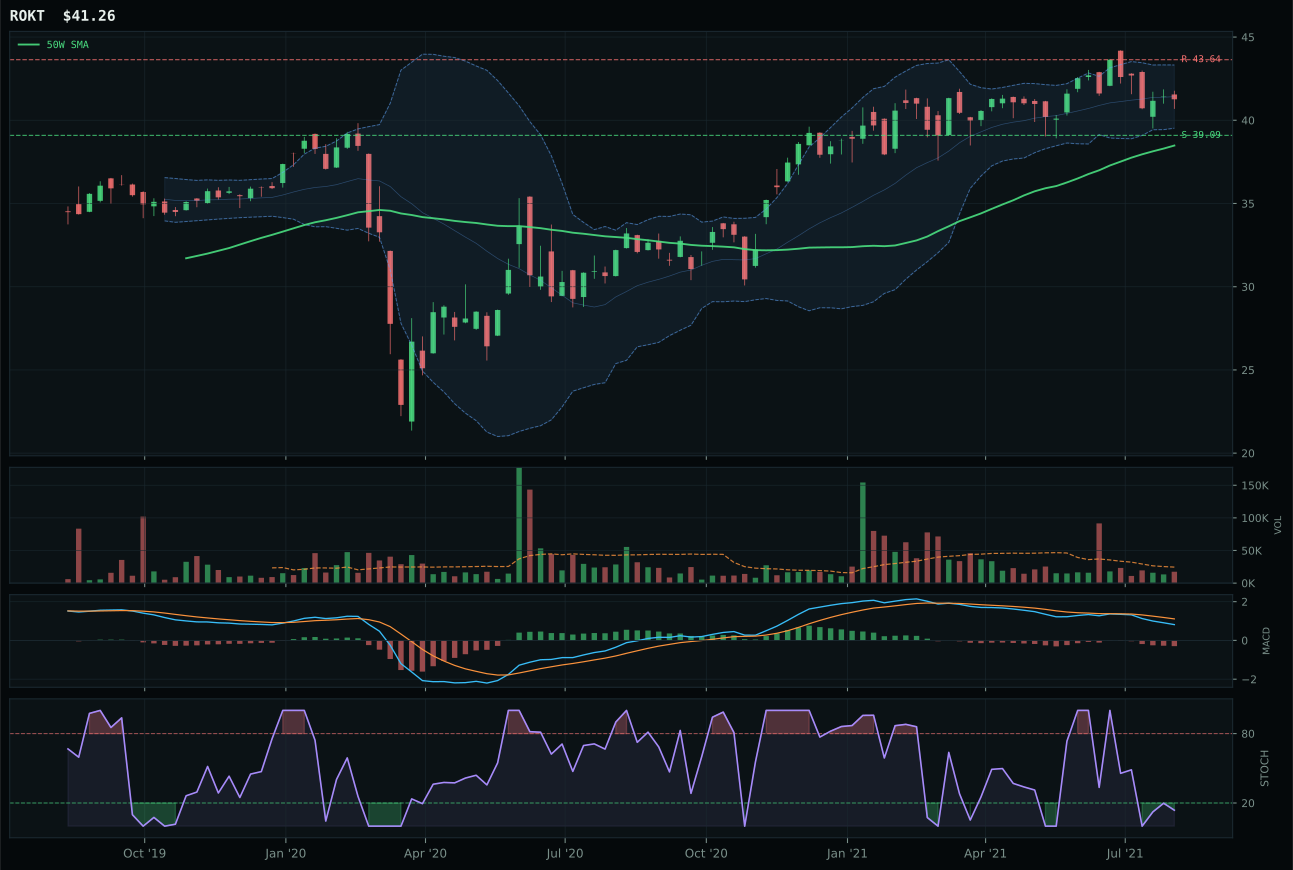
ROKT has a neutral structure profile with -4.1% 13-week relative strength versus SPY.
A failed hold above support would weaken the setup.
Tracked, but not top-2 eligible because: .
ITA wins by a razor-thin 1.1-point margin over XAR despite scoring only 44.7/100 on technical evidence, which signals a defensive, low-conviction category win driven by macro and structure rather than momentum. Price sits 11.4% above the 50W in neutral structure, MACD is bearish and weakening, stochastic RSI is rising mid-zone—none of these are bullish signals. ITA edges ahead because its 76.7/100 structure score is cleaner than XAR's 71.2, and the timing score of 78.0/100 reflects better positioning relative to Fibonacci zones, even though the momentum confirmation of only 26.8/100 exposes how little conviction exists behind this setup. The 0.1% category-relative strength is noise, and the -4.1% SPY-relative weakness tells the story: broad equity strength is leaving defense behind, not pulling it forward.
Defense & Aerospace ranked 9th among the categories with a final score of 35.8 and landed 5% allocation—a holding position justified by limited downside risk rather than upside conviction. The macro environment is mixed for defense: broad market bear is a small tailwind at +6, but dollar pressure and credit stress provide no sponsorship. ITA's trend score of 75.9 and timing score of 78 are the category's only technical bright spots, but momentum confirmation sits at just 26.8, revealing that neither price movement nor relative strength is cooperating. This allocation should be viewed as dry powder to be redeployed if technical deterioration triggers an exit; current positioning reflects caution about committing capital to a sector offering neither growth nor defensive shelter.
Precious Metals — GLD
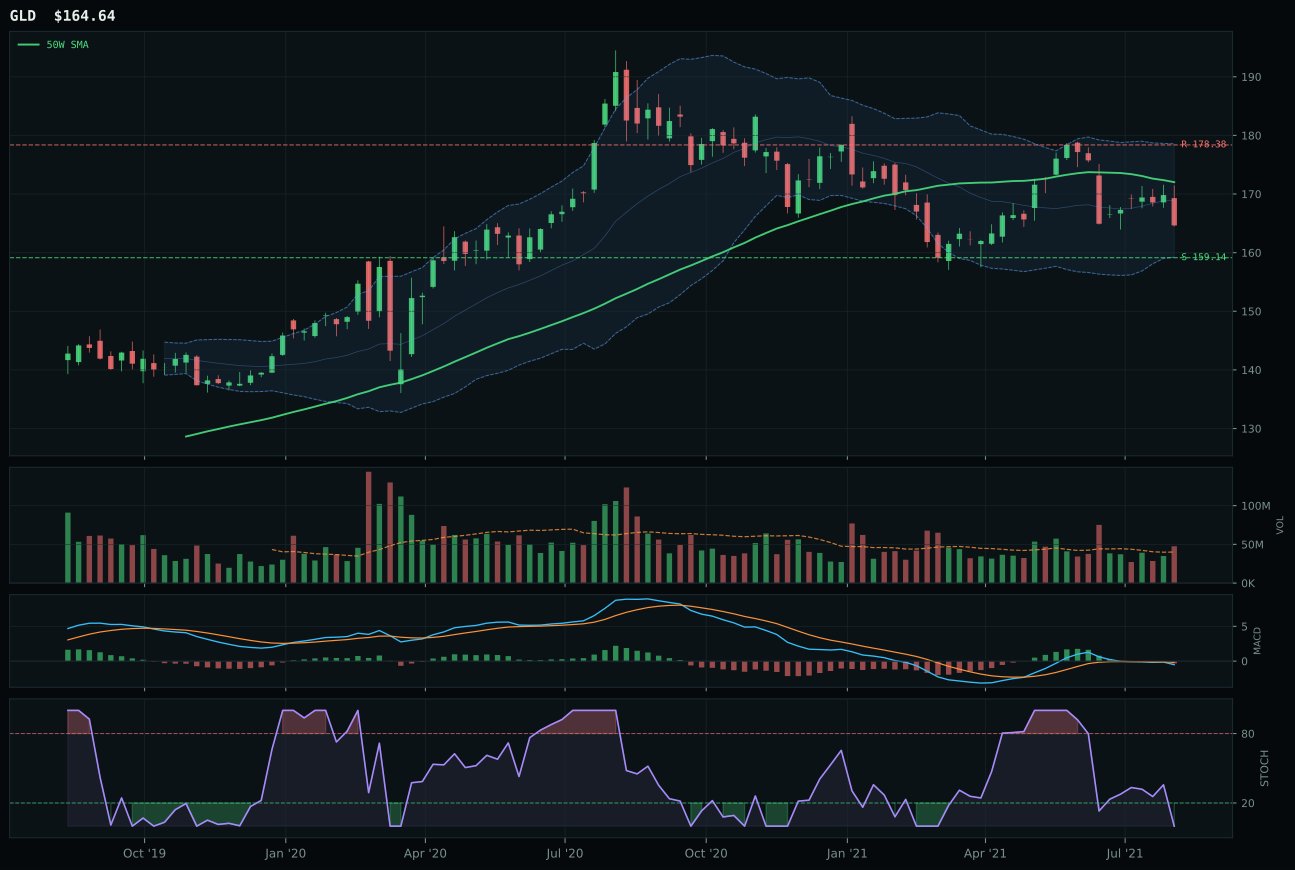
GLD has a pullback into support profile with -8.9% 13-week relative strength versus SPY.
A failed hold above support would weaken the setup.
Actionable but governed by invalidation levels.
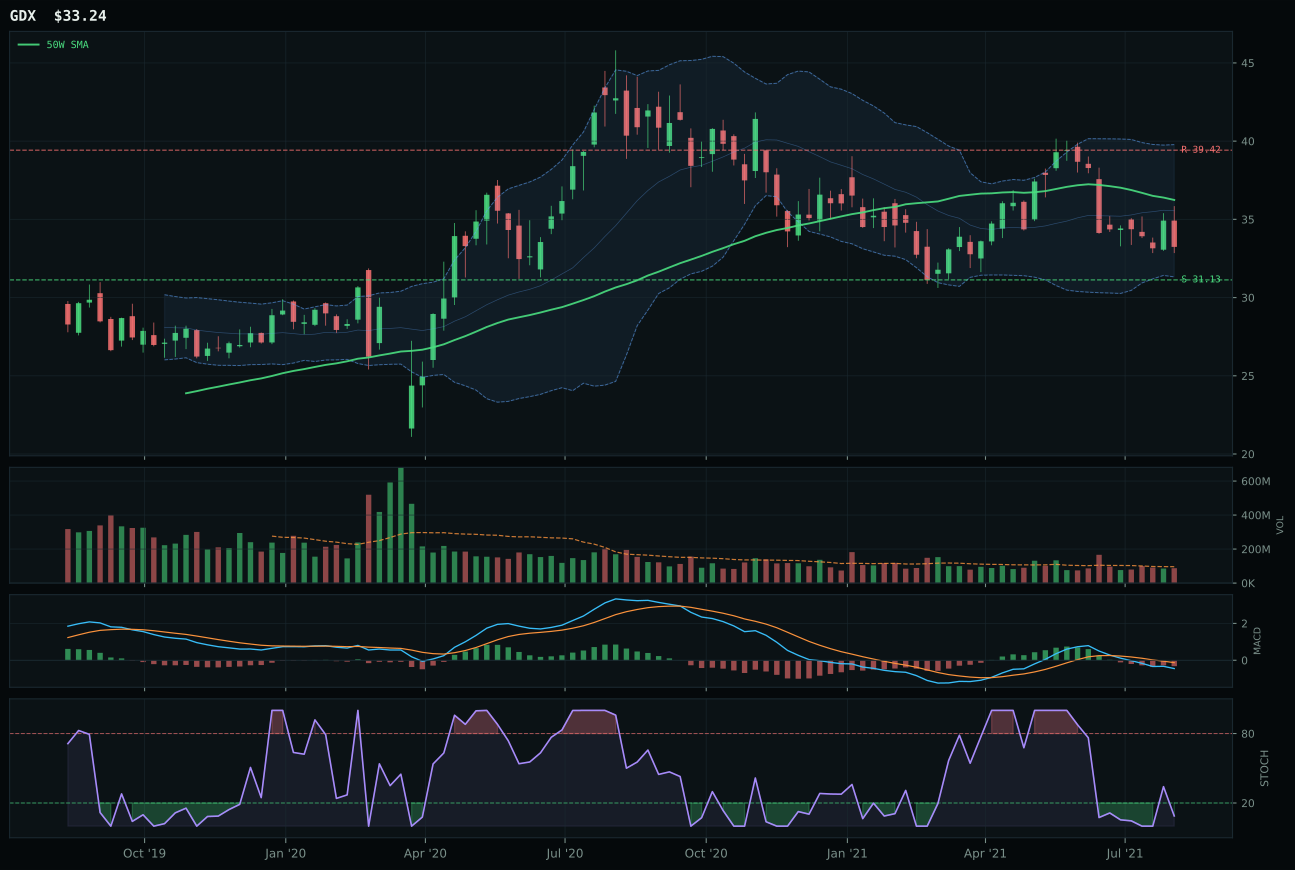
GDX has a neutral structure profile with -16.0% 13-week relative strength versus SPY.
A failed hold above support would weaken the setup.
Actionable but governed by invalidation levels.
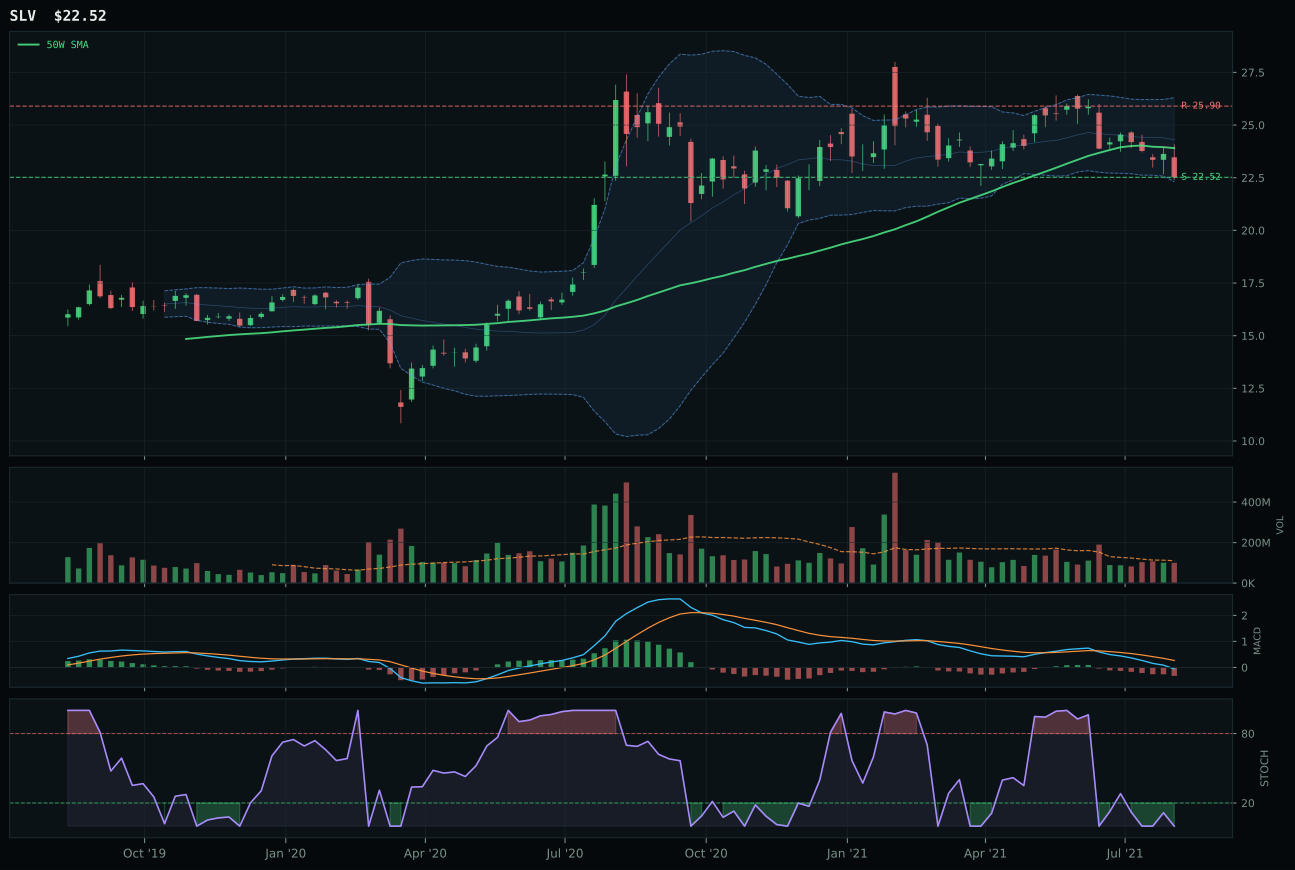
SLV has a pullback into support profile with -16.4% 13-week relative strength versus SPY.
A failed hold above support would weaken the setup.
Actionable but governed by invalidation levels.
GLD wins because it is the only ETF in the basket holding a defined pullback-into-support setup at 159.14, with stochastic RSI at oversold extremes (0.00) and MACD bearish but not yet capitulating—the textbook mean-reversion entry. Its 95.0/100 timing score is the category's only genuine strength signal; price sits -4.3% below the 50W, placing it in repair mode rather than extension mode, which makes the 85.1/100 risk-reward ratio exceptional—only 3.5% downside to support versus -7.7% to resistance. GDX lost because its -16.0% SPY-relative strength signals leverage is working against it, and GLD's 7.1% category-relative strength shows the market is choosing the unlevered, stable monetary hedge. Volume at 1.19x the 20W average is above-average participation, confirming accumulation into the dip rather than panic distribution.
Precious Metals earned 5% allocation despite a category score of just 32.3, justified entirely by GLD's pullback-into-support setup in a disinflation regime. The macro alignment is real: disinflation pressure is +8, and dollar pressure is +2, both of which favor gold as a deflation hedge. However, bearish MACD and oversold stochastic momentum tell you GLD is a mean-reversion position, not a growth allocation. The 27.1% momentum confirmation score reflects weakness in 13-week returns, making this a tactical play dependent on near-term support holding rather than a strategic commitment. Risk appetite positive is a -4 headwind, suggesting gold can retest lows if equities surprise to the upside; maintain this position but scale aggressively into any 5%+ rally above the 50-week moving average.
Nuclear Energy — URNM
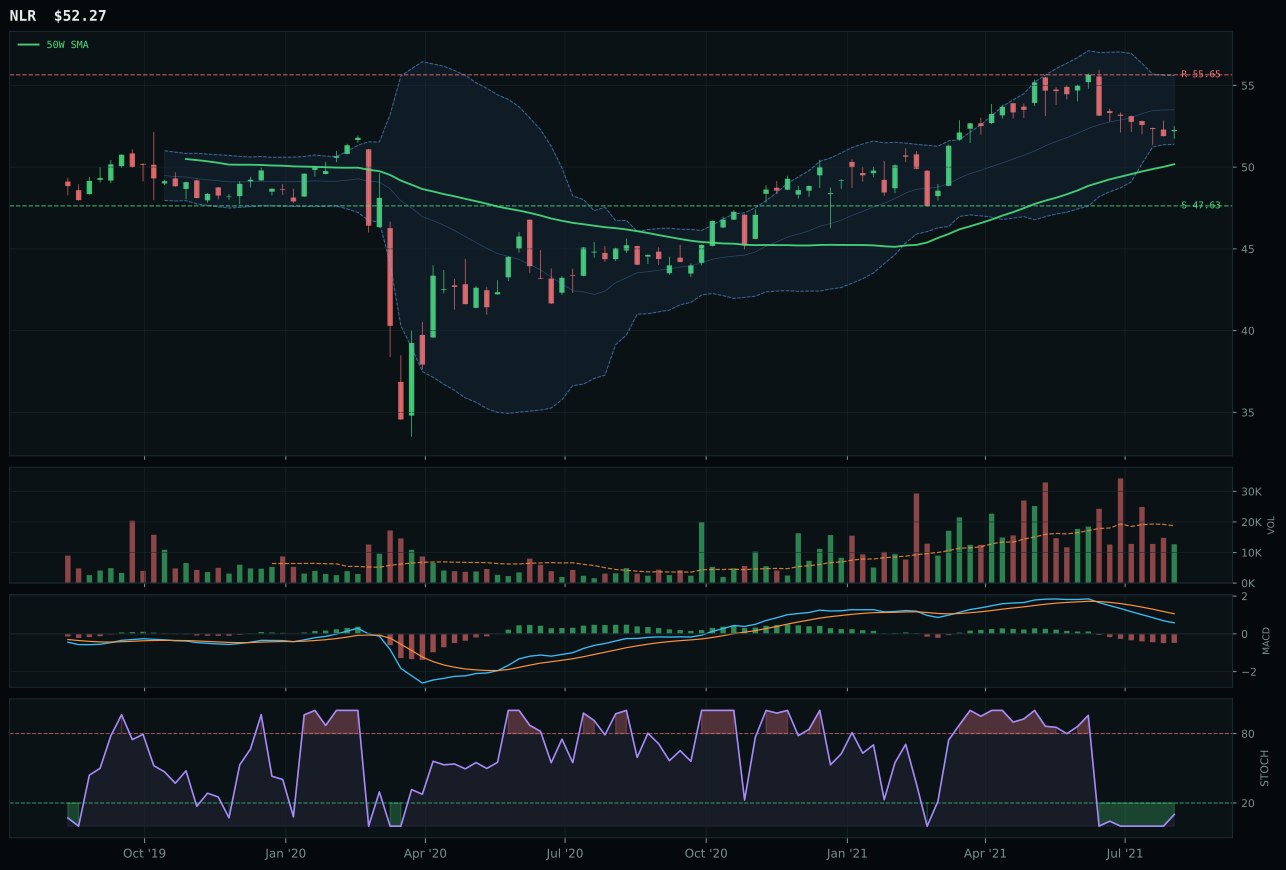
NLR has a neutral structure profile with -10.1% 13-week relative strength versus SPY.
A failed hold above support would weaken the setup.
Tracked, but not top-2 eligible because: .
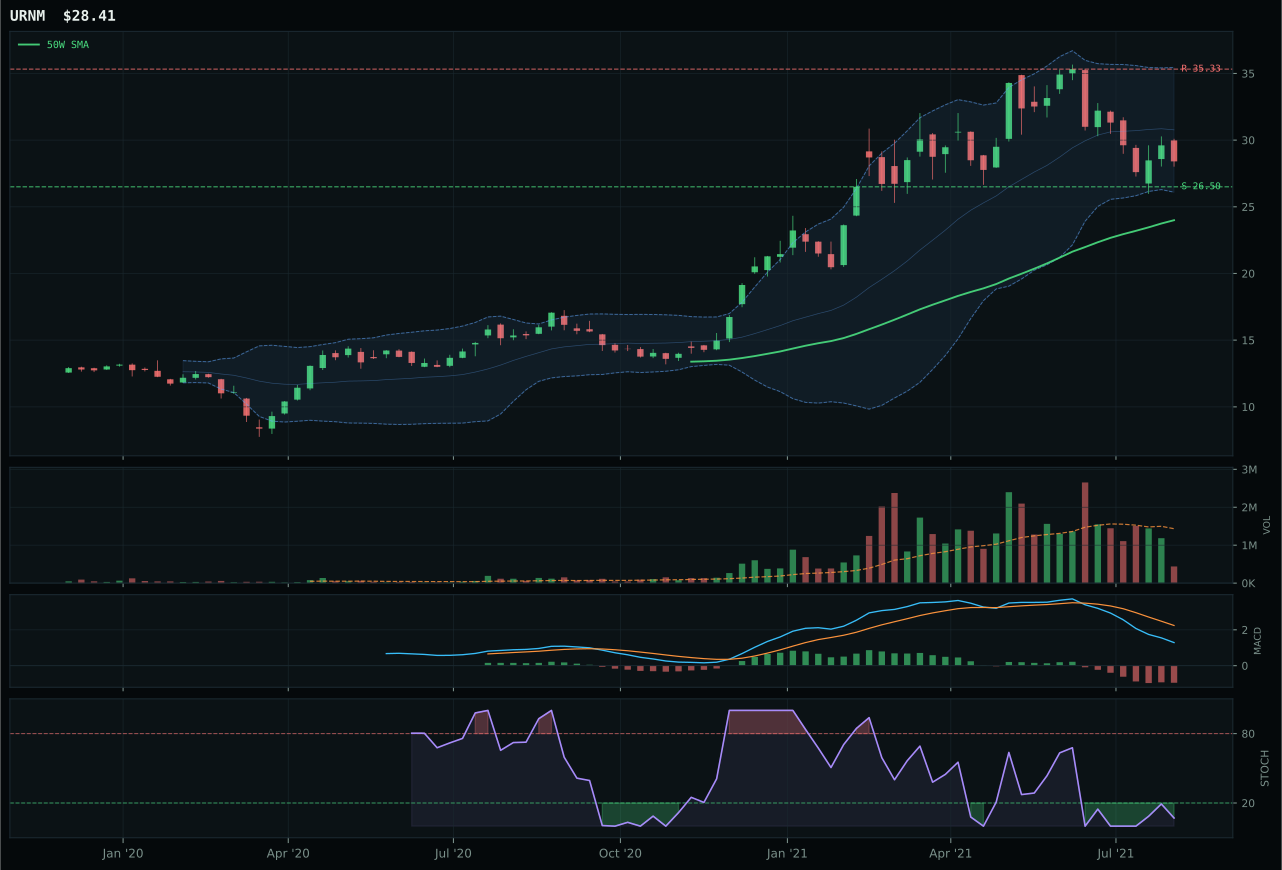
URNM has a vertical extension profile with -22.0% 13-week relative strength versus SPY.
A failed hold above support would weaken the setup.
Actionable but governed by invalidation levels.
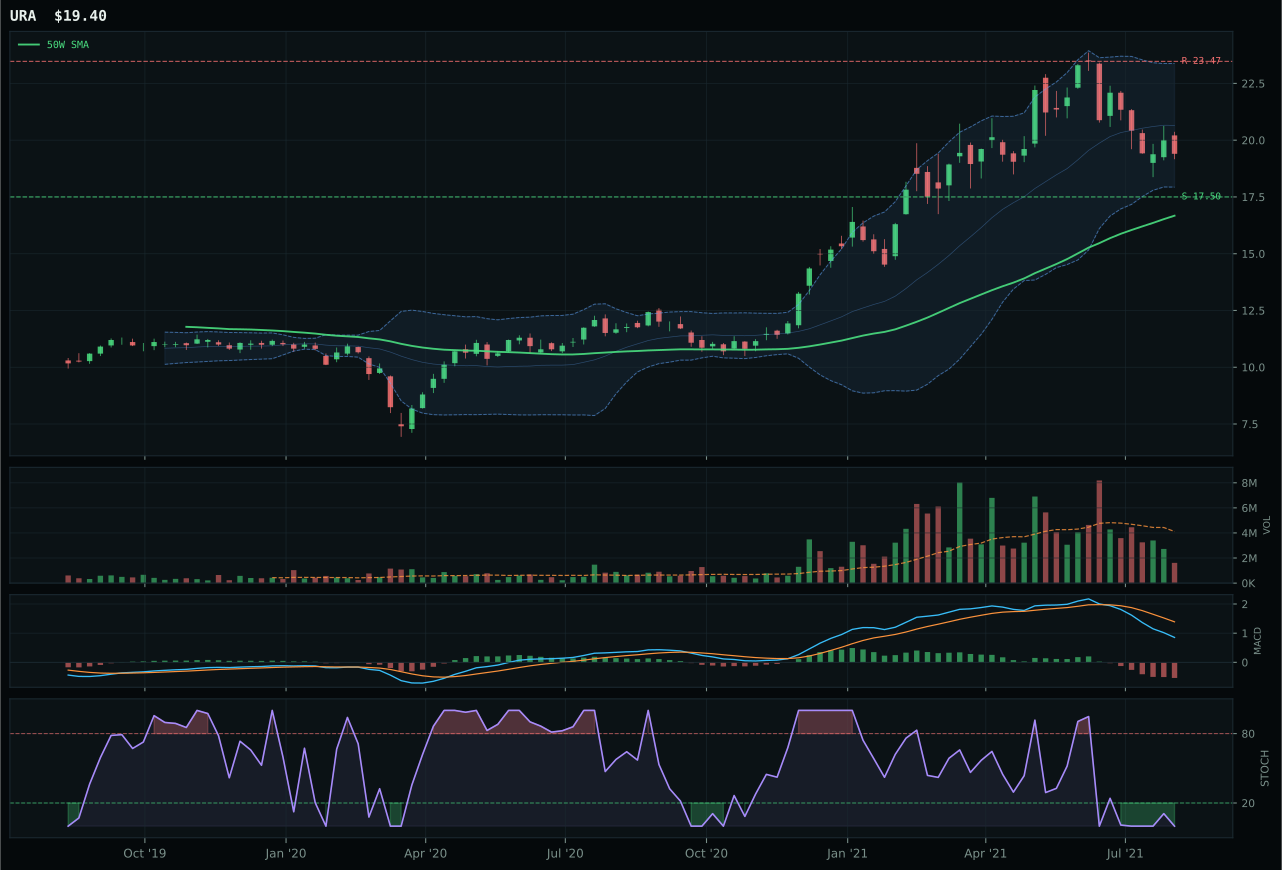
URA has a vertical extension profile with -17.5% 13-week relative strength versus SPY.
A failed hold above support would weaken the setup.
Actionable but governed by invalidation levels.
URNM wins because NLR's risk-reward is weaker at 56.2/100 versus 75.0/100, but this is a purely technical tiebreaker in a category where both ETFs show 0.0/100 momentum confirmation and weak technical evidence under 6.0/100 and 40.3/100 respectively. URNM sits 18.4% above the 50W in vertical extension, price is below the 200W, MACD is bearish and weakening, yet stochastic RSI is oversold turn up at 0.07—a mean-reversion setup that defines the entry rather than confirms strength. NLR, the runner-up, offers better structural stability with a 99.0/100 timing score (closer to support), but that steadiness is a liability when category conviction is zero. Volume at 0.31x the 20W average is thin participation, confirming that real accumulation is absent. This is not a winner; it is the least-bad option in a basket where every ETF is broken.
Nuclear Energy received 5% allocation driven by real asset sponsorship (+7) and AI growth sponsorship (+5), not by technical strength. URNM's category score of 31.4 places it sixth among ten categories, a defensive hold rather than a conviction position. The 0.0% momentum confirmation and thin participation volume (0.31x average) reveal that no sponsored buyer is accumulating at current prices. The setup is oversold-turn-up with MACD bearish-and-weakening, creating a mean-reversion coil rather than a breakout opportunity. This allocation should be treated as dry powder: hold the position for its scarcity narrative, but plan to scale aggressively only if volume participation increases to 0.75x average or higher, which would signal institutional accumulation. Any deterioration in risk appetite positive would trigger an immediate reallocation to higher-ranked categories.
Agriculture & Livestock — WEAT
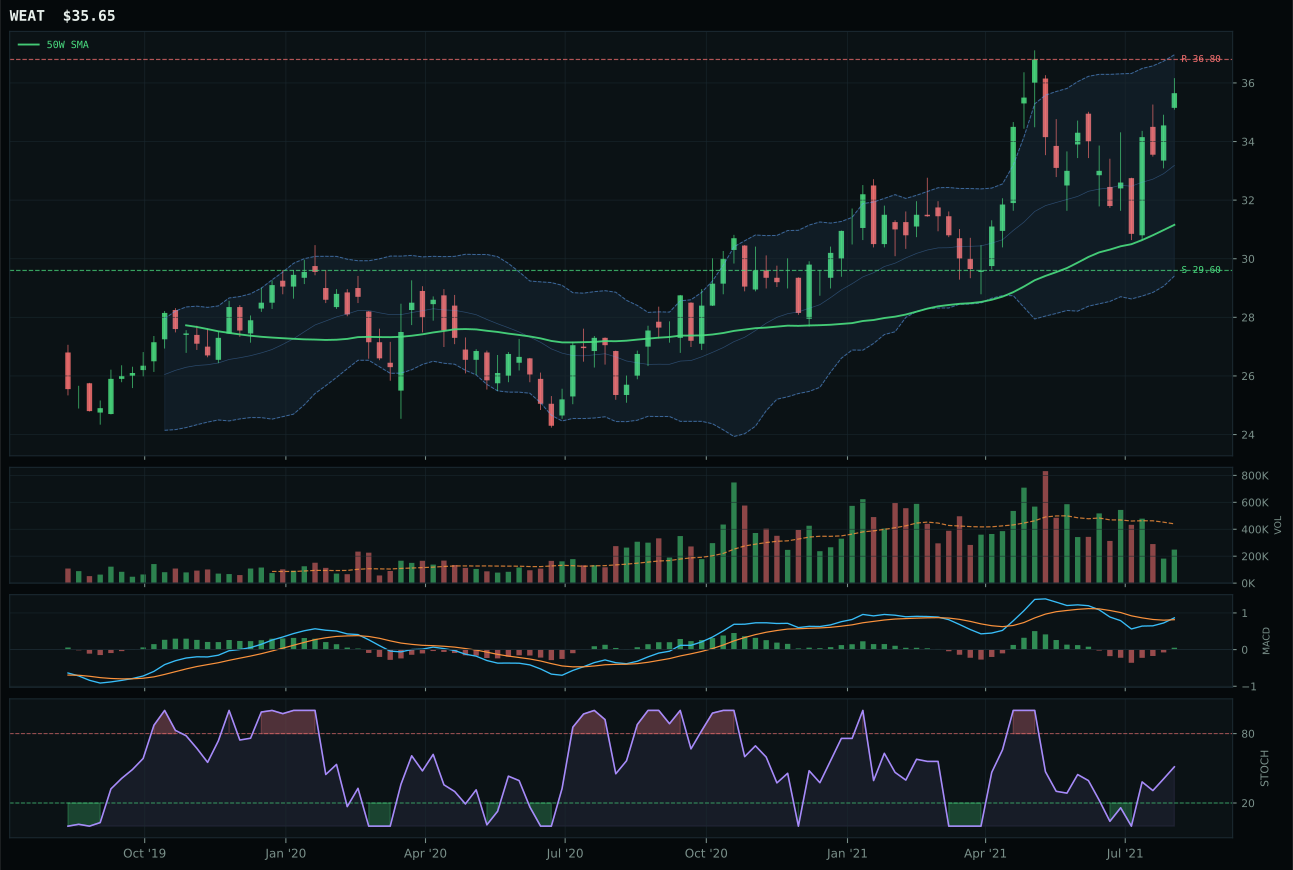
WEAT has a neutral structure profile with -8.0% 13-week relative strength versus SPY.
A failed hold above support would weaken the setup.
Actionable but governed by invalidation levels.
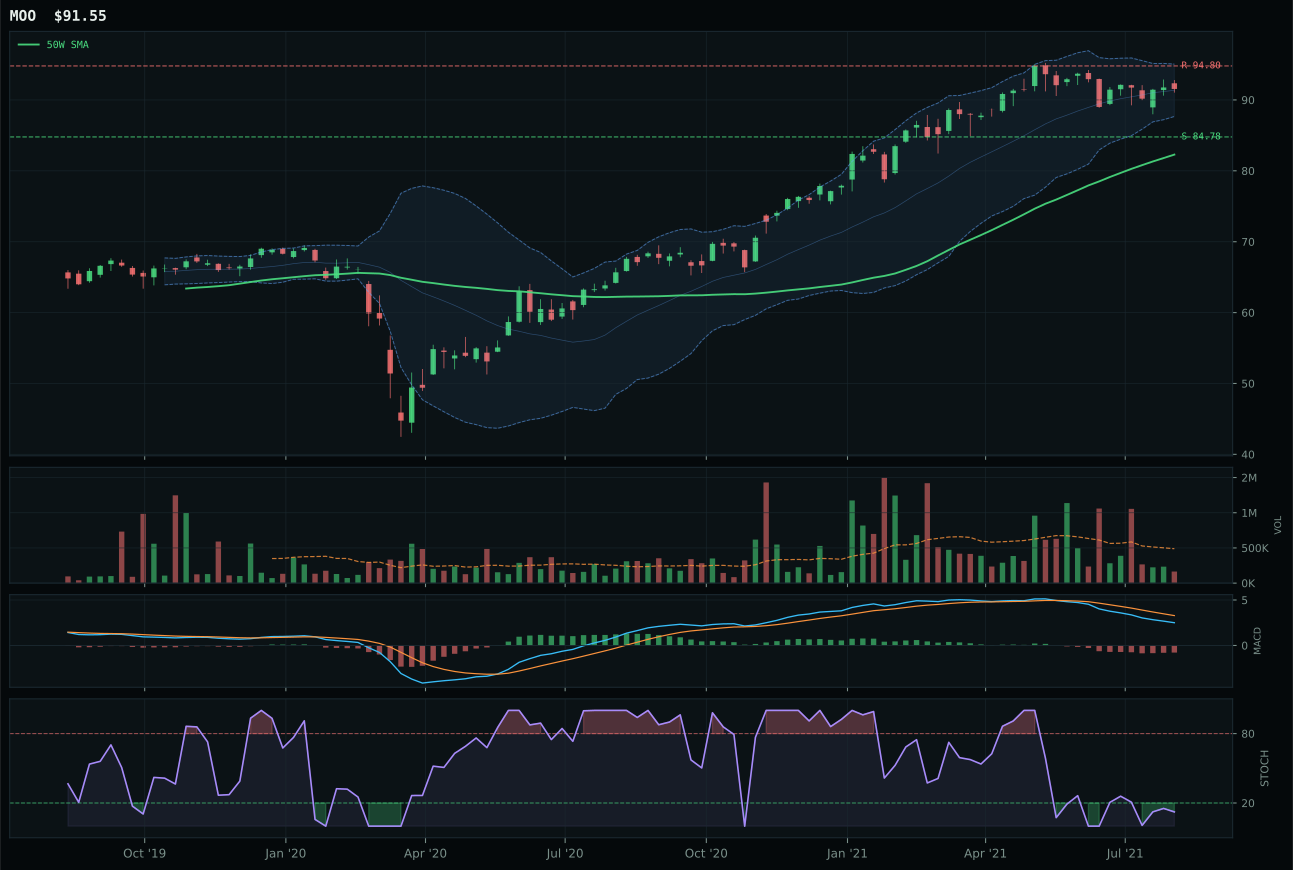
MOO has a neutral structure profile with -8.3% 13-week relative strength versus SPY.
A failed hold above support would weaken the setup.
Actionable but governed by invalidation levels.
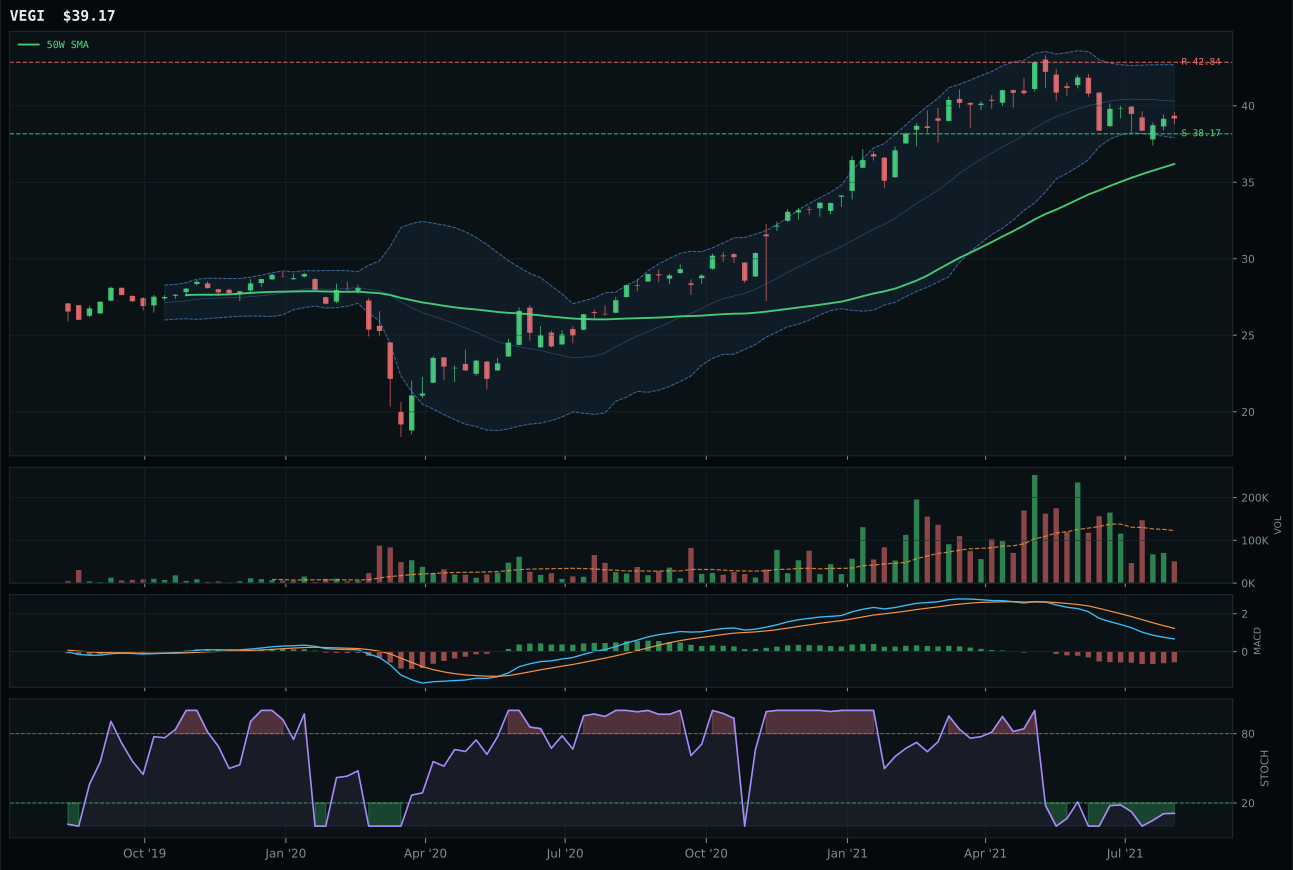
VEGI has a pullback into support profile with -13.4% 13-week relative strength versus SPY.
A failed hold above support would weaken the setup.
Tracked, but not top-2 eligible because: .
WEAT wins because its MACD is bullish and improving while both MOO and VEGI suffer from bearish or weakening momentum, making this a directional momentum divergence inside a basket with no strong leadership. The setup is neutral structure at 65.0/100 cleanliness, price is 14.4% above the 50W, and volume sits at thin participation (0.57x)—signals that breadth is lacking. Yet the 83.0/100 timing score reflects accurate positioning relative to Fibonacci zones and oversold stochastic RSI conditions, which favor mean-reversion entries. WEAT's 88.1/100 trend score masks the weakness: RS versus SPY is -8.0%, placing agricultural commodities in genuine relative decline. The win margin of 11.5 points over MOO is not competence but the absence of better alternatives; MACD improvement is the single differentiator when all three ETFs show poor momentum confirmation.
Agriculture received 5% allocation based on real asset sponsorship (+8) and positive commodity breadth, despite a final category score of just 30.3. The macro case is stronger than the technical case: disinflation pressure is a -8 headwind, but WEAT's bullish MACD and rising stochastic create the only credible timing setup in a weak category. The -8.0% relative strength to SPY and thin participation volumes reveal that this allocation is contrarian positioning rather than momentum following. Entry risk is contained because WEAT sits only 14.4% above the 50-week moving average, but conviction should remain light until either relative strength improves or volume participation confirms the setup.
Emerging Markets — ILF
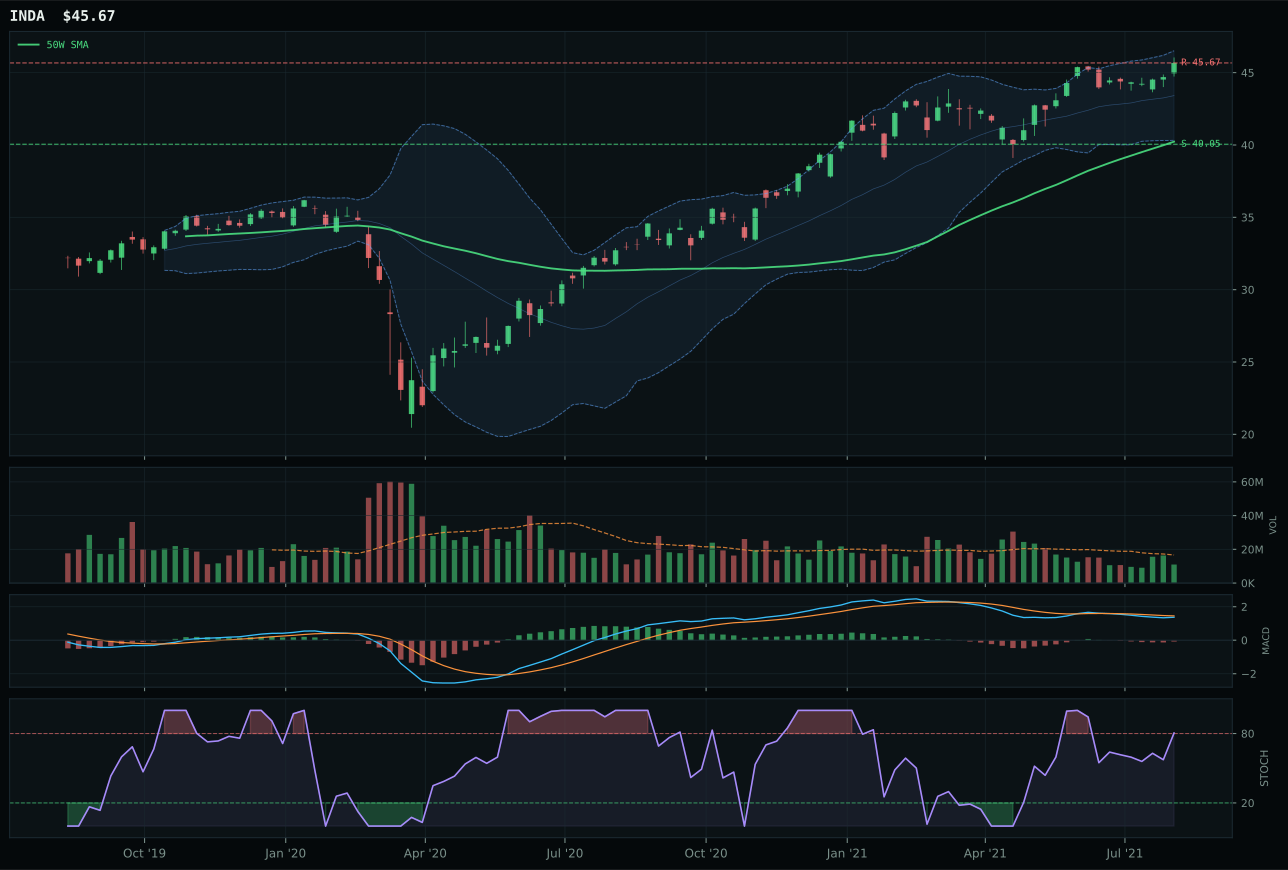
INDA has a neutral structure profile with 2.0% 13-week relative strength versus SPY.
A failed hold above support would weaken the setup.
Actionable but governed by invalidation levels.
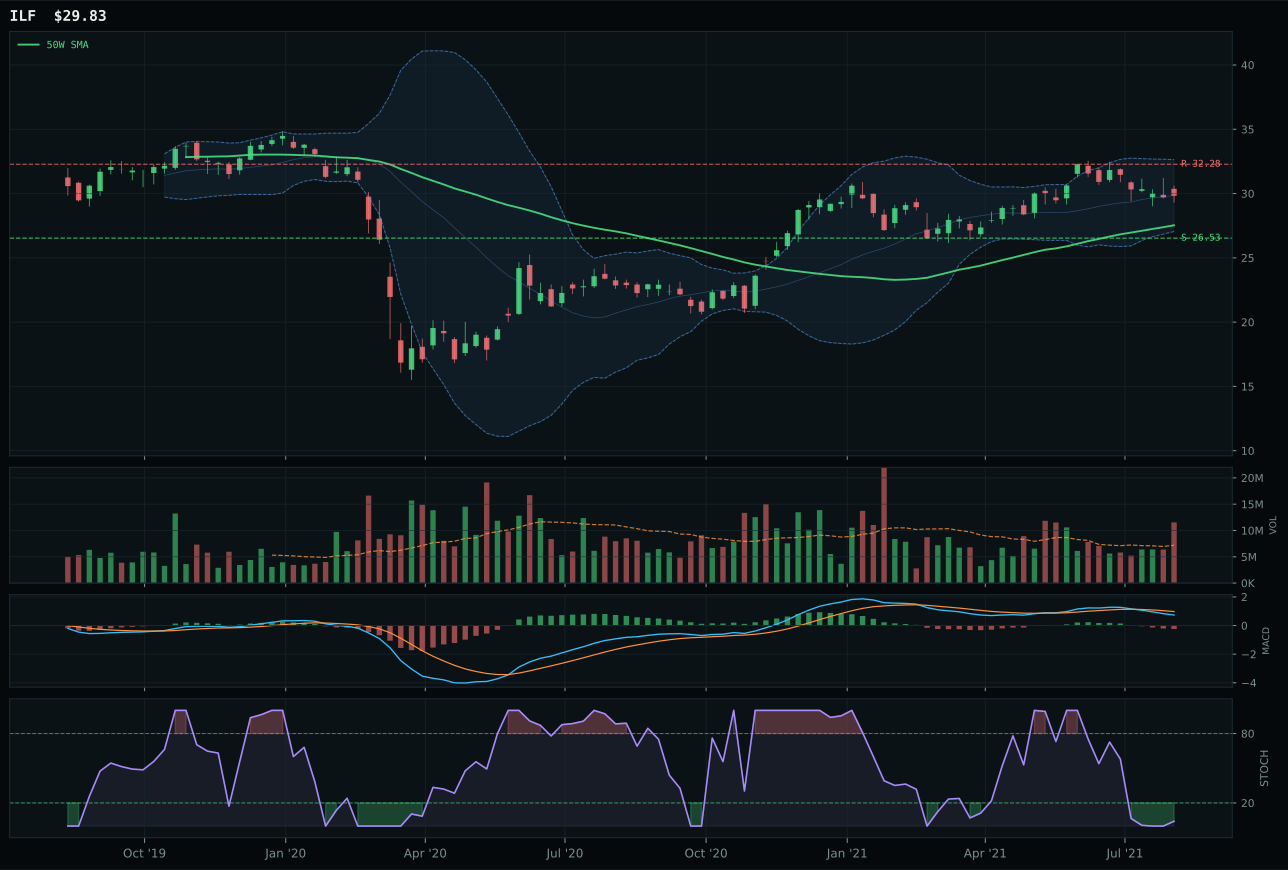
ILF has a neutral structure profile with -5.5% 13-week relative strength versus SPY.
A failed hold above support would weaken the setup.
Actionable but governed by invalidation levels.
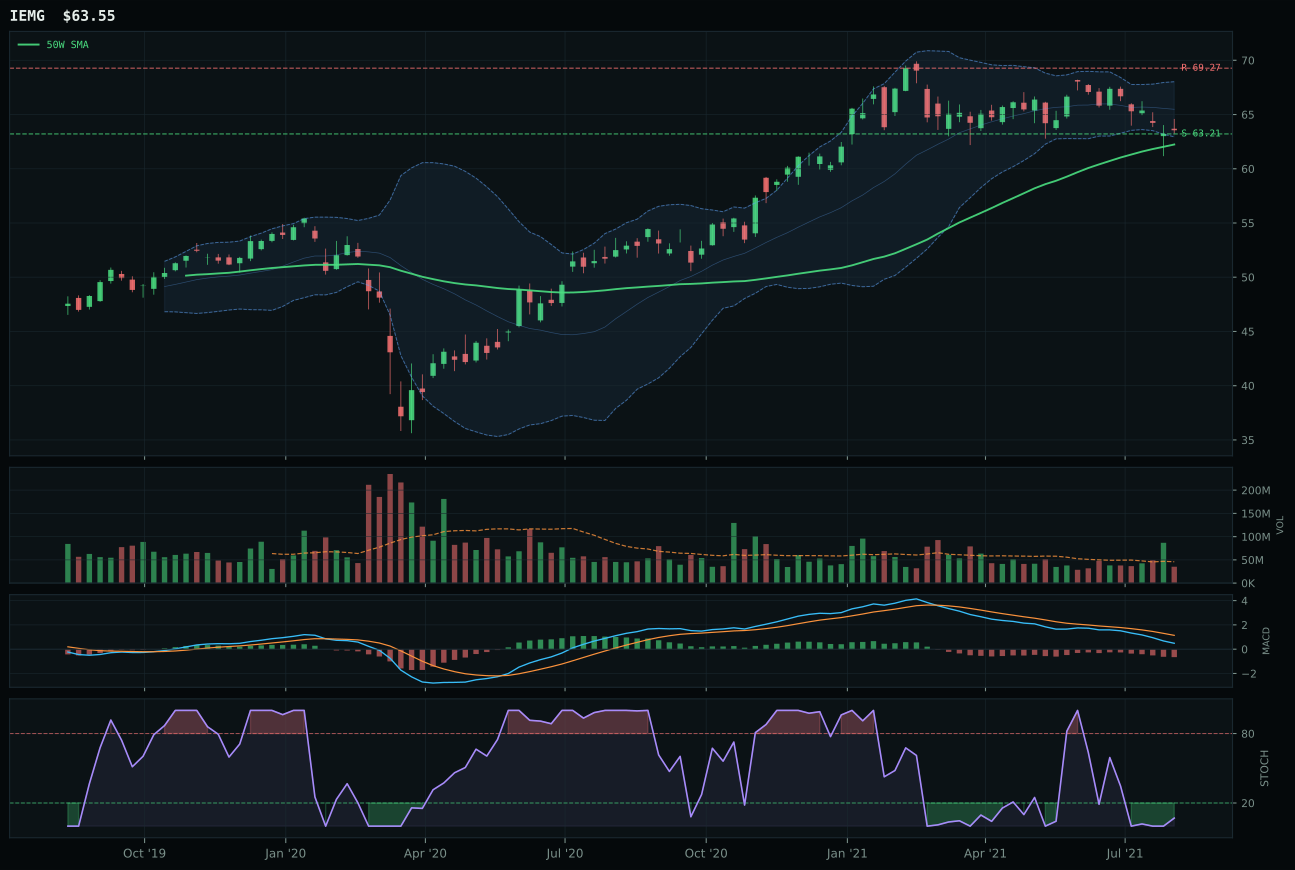
IEMG has a pullback into support profile with -9.1% 13-week relative strength versus SPY.
A failed hold above support would weaken the setup.
Actionable but governed by invalidation levels.
ILF wins because it is the only ETF showing above-average volume participation at 1.60x the 20W average, paired with stochastic RSI at oversold turn up (0.04)—classic accumulation into a mean-reversion setup in a bear flag. INDA lost because its stochastic RSI is overbought momentum at high altitude (13.5% above the 50W), volume is thin participation (0.57x), and its -5.5% SPY-relative weakness shows emerging market strength is being rejected by broad equity momentum. ILF's 84.0/100 timing score reflects disciplined positioning—it is -7.6% from resistance, 12.4% from support at 26.53—which provides room for a bounce without extended risk. Structure is identical at 74.6/100, but volume-price confirmation at 53.8/100 for ILF crushes INDA's thin participation, signaling institutional accumulation rather than retail speculation.
Emerging Markets received 0% allocation despite ILF's technical setup, placing the category in the bottom tier. The final category score of 24.5 reflects severe macro headwinds: dollar pressure is -14 and credit stress is -10, overwhelming the +8 from liquidity expansion and +8 from risk appetite. ILF's oversold-turn-up timing and volume accumulation create a legitimate tactical entry, but the macro regime is actively rejecting EM exposure. The -5.5% relative strength to SPY combined with weak category-relative leadership tells you the entire basket is being deselected. Allocate zero capital until dollar strength softens or credit stress reverses to positive territory; current conditions reward avoiding EM entirely despite ILF's attractive setup. This is a category to monitor for a future allocation window, not a current portfolio position.
Traditional Energy — XLE
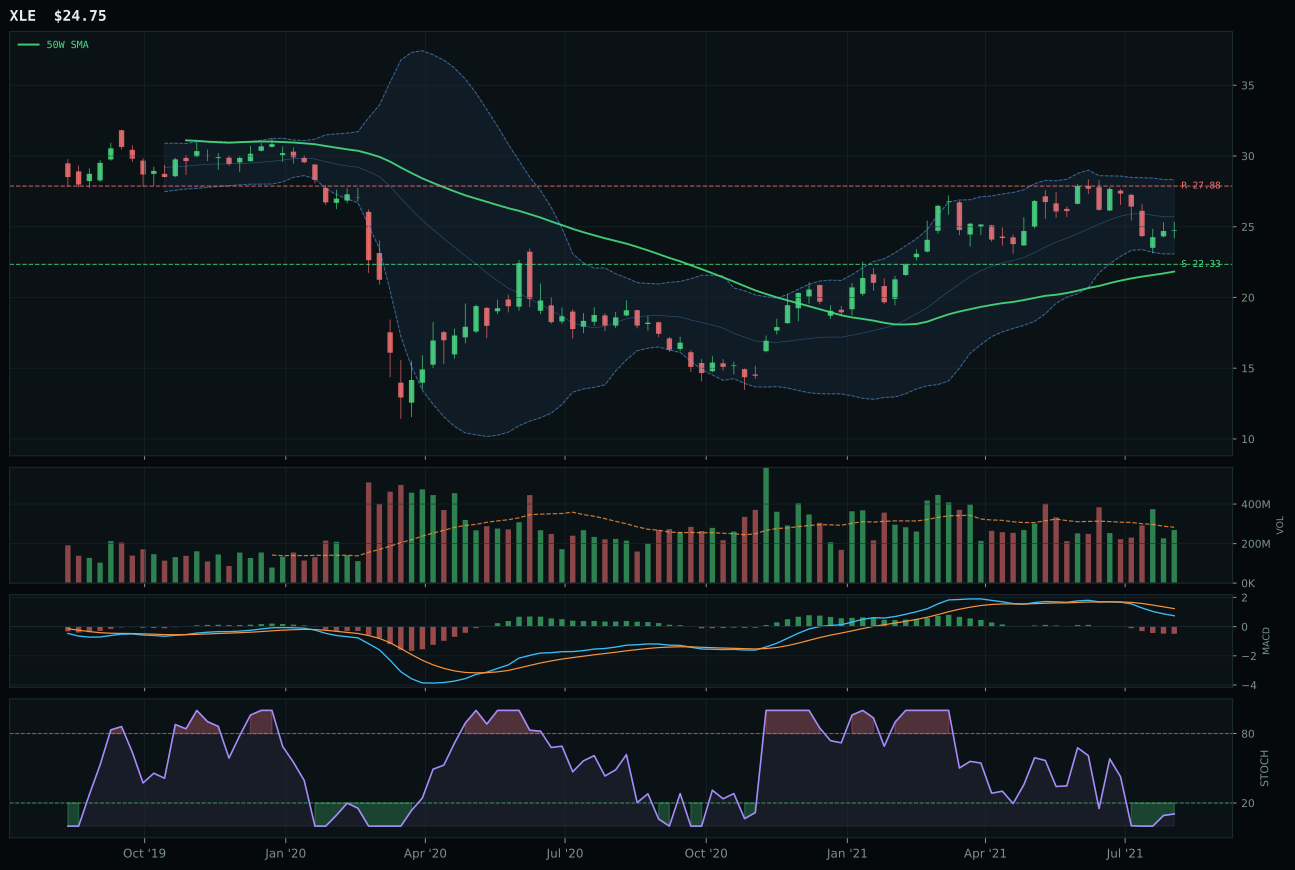
XLE has a neutral structure profile with -12.5% 13-week relative strength versus SPY.
A failed hold above support would weaken the setup.
Actionable but governed by invalidation levels.
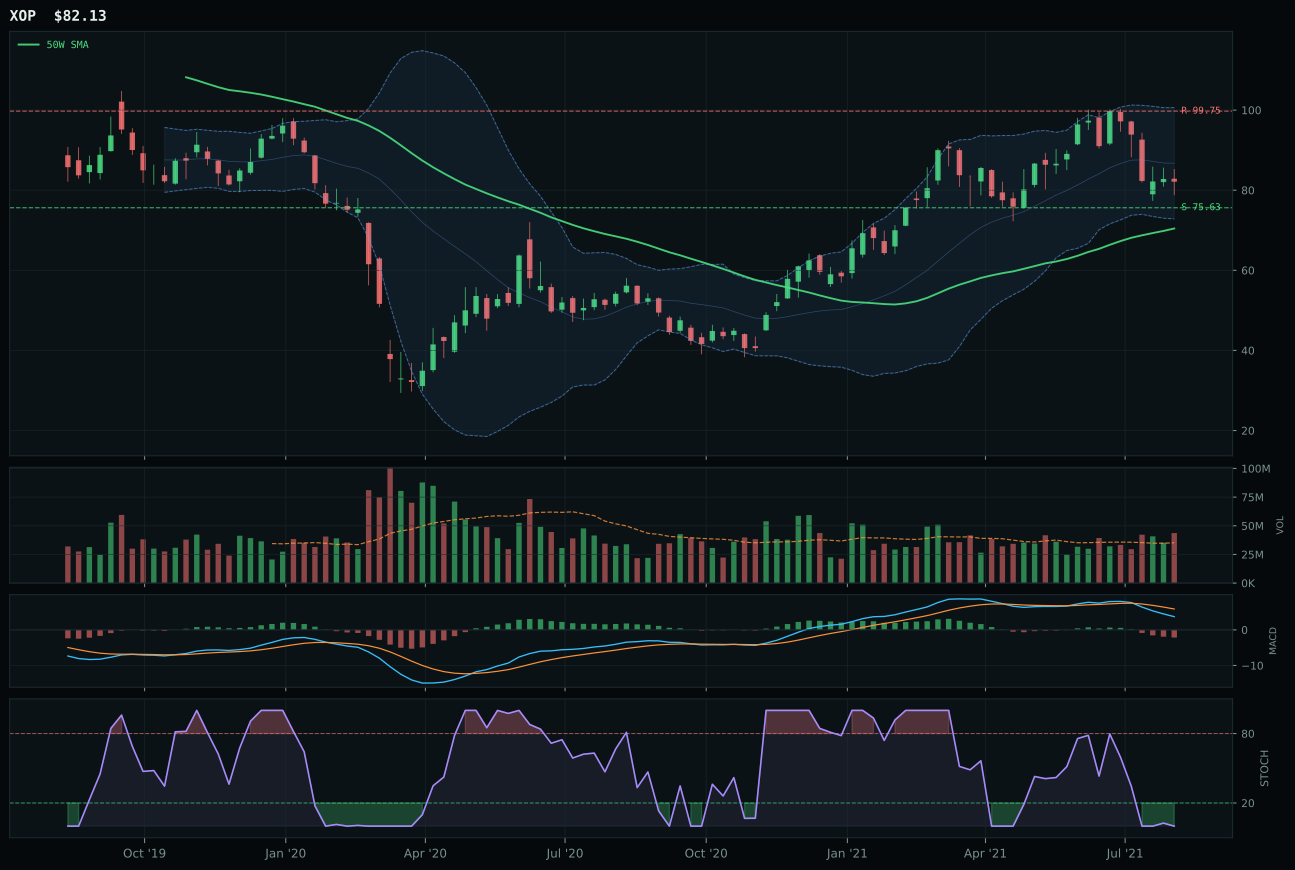
XOP has a vertical extension profile with -10.0% 13-week relative strength versus SPY.
A failed hold above support would weaken the setup.
Actionable but governed by invalidation levels.
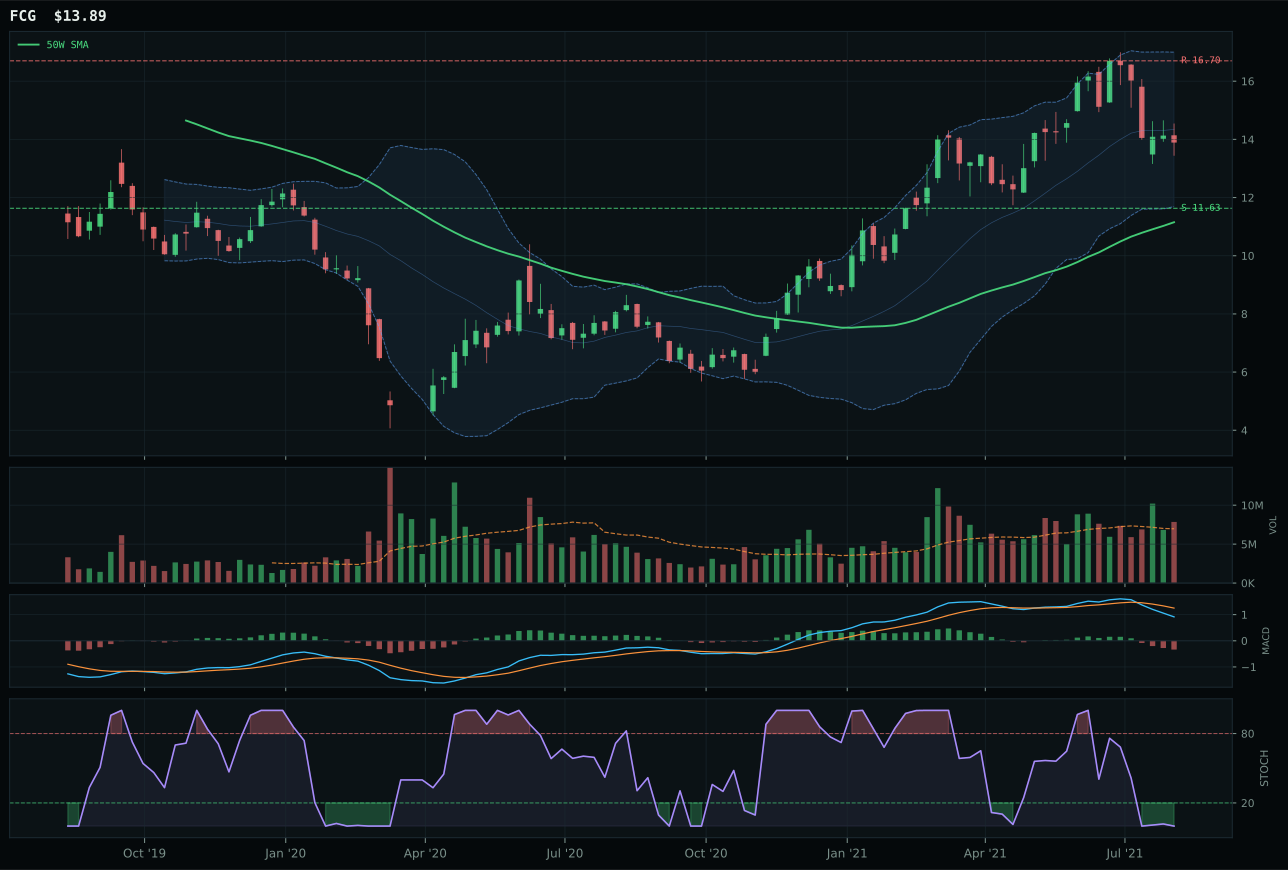
FCG has a vertical extension profile with -7.1% 13-week relative strength versus SPY.
A failed hold above support would weaken the setup.
Actionable but governed by invalidation levels.
XLE wins a hollow victory because price sits above the 50W but below the 200W, signaling a failed reversal attempt rather than confirmed strength. Timing is the only 84.0/100 score XLE can claim; price is 13.4% above the 50W in upper retracement, MACD is bearish and weakening, stochastic RSI is oversold turn up at 0.11—all mean-reversion signals with no bullish confirmation. XOP lost because its stochastic RSI is oversold (not turn up), and it sits in vertical extension at 59.3% above the 50W, making it the riskier entry despite better 13W momentum at -5.2% versus XLE's -7.7%. Category-relative strength is near zero for both, volume participation is neutral at 0.95x, and momentum confirmation sits at a dismal 0.0/100 because the 4W return is -6.3%. This is not a technical setup; it is a macro graveyard where disinflation pressure (-10 active) and credit stress (-7 active) leave no room for upside.
Traditional Energy received 0% allocation and ranked outside the eligible top eight due to category-level macro rejection and deteriorating technical sponsorship. Disinflation pressure is -10, credit stress is -7, and real asset sponsorship is only +7—insufficient tailwinds in a Goldilocks environment where investors are rotating to technology and AI. The category score of 8.2 reflects how badly the 3/2/1 weighted basket (FCG, XOP, XLE) is performing; XLE's win represents choosing the least broken player in a losing category. Relative strength versus SPY is deeply negative across all three ETFs, and volume-price confirmation is absent. Do not allocate to this category until either crude stabilizes above key moving averages with confirmed volume or until credit stress becomes a flight-to-safety tailwind; current conditions offer neither technical nor macro justification for a position.