
2021-07-30
Informational purposes only. The content in this report, including allocations, analysis, and commentary, is provided solely for informational and educational purposes. It does not constitute financial advice, investment advice, trading advice, or any other type of advice. Past performance does not guarantee future results. Always conduct your own research and consult a qualified financial professional before making investment decisions.
Weekly Allocation
| Ticker | Category | Weight | Role |
|---|---|---|---|
| FSOL | 50% | Overlay | |
| REMX | Industrial Metals | 10% | Top-2 (10%) |
| CIBR | Technology | 10% | Top-2 (10%) |
| SMH | AI | 5% | Tier-2 (5%) |
| ILF | Emerging Markets | 5% | Tier-2 (5%) |
| XLU | Utilities & Infrastructure | 5% | Tier-2 (5%) |
| GLD | Precious Metals | 5% | Tier-2 (5%) |
| ITA | Defense & Aerospace | 5% | Tier-2 (5%) |
| URNM | Nuclear Energy | 5% | Tier-2 (5%) |
Trade Instructions — Monday Open
Sell the tranche from 2021-07-02 (completing its 4-week hold). Buy the new tranche. Instructions show net portfolio changes — same-asset positions cancel, weight changes show the delta.
| Action | Ticker | Instruction |
|---|---|---|
| SELL | FCG | Sell 50% of FCG position (reduce 5.00% → 2.50%) |
| SELL | IGV | Sell entire IGV position (2.50% of portfolio) |
| SELL | COPX | Sell 25% of COPX position (reduce 5.00% → 3.75%) |
| SELL | INDA | Sell 25% of INDA position (reduce 5.00% → 3.75%) |
| SELL | SLV | Sell 50% of SLV position (reduce 2.50% → 1.25%) |
| SELL | XAR | Sell entire XAR position (1.25% of portfolio) |
| SELL | MOO | Sell entire MOO position (1.25% of portfolio) |
| BUY | REMX | Buy REMX — 22.22% of freed cash (adds 2.50% to portfolio) |
| BUY | SMH | Buy SMH — 11.11% of freed cash (adds 1.25% to portfolio) |
| BUY | ITA | Buy ITA — 11.11% of freed cash (adds 1.25% to portfolio) |
| BUY | GLD | Buy GLD — 11.11% of freed cash (adds 1.25% to portfolio) |
| BUY | URNM | Buy URNM — 11.11% of freed cash (adds 1.25% to portfolio) |
| BUY | CIBR | Buy CIBR — 22.22% of freed cash (adds 2.50% to portfolio) |
| BUY | ILF | Buy ILF — 11.11% of freed cash (adds 1.25% to portfolio) |
Current Portfolio After Trade
Combined holdings across all 4 active tranches. Each tranche is 25% of the portfolio.
| Ticker | % of Portfolio | Weight Bar |
|---|---|---|
| FSOL | 25.00% | |
| FBTC | 25.00% | |
| XLK | 7.50% | |
| XLU | 5.00% | |
| SMH | 5.00% | |
| ITA | 5.00% | |
| COPX | 3.75% | |
| INDA | 3.75% | |
| REMX | 3.75% | |
| GLD | 3.75% | |
| FCG | 2.50% | |
| WEAT | 2.50% | |
| URNM | 2.50% | |
| CIBR | 2.50% | |
| SLV | 1.25% | |
| ILF | 1.25% |
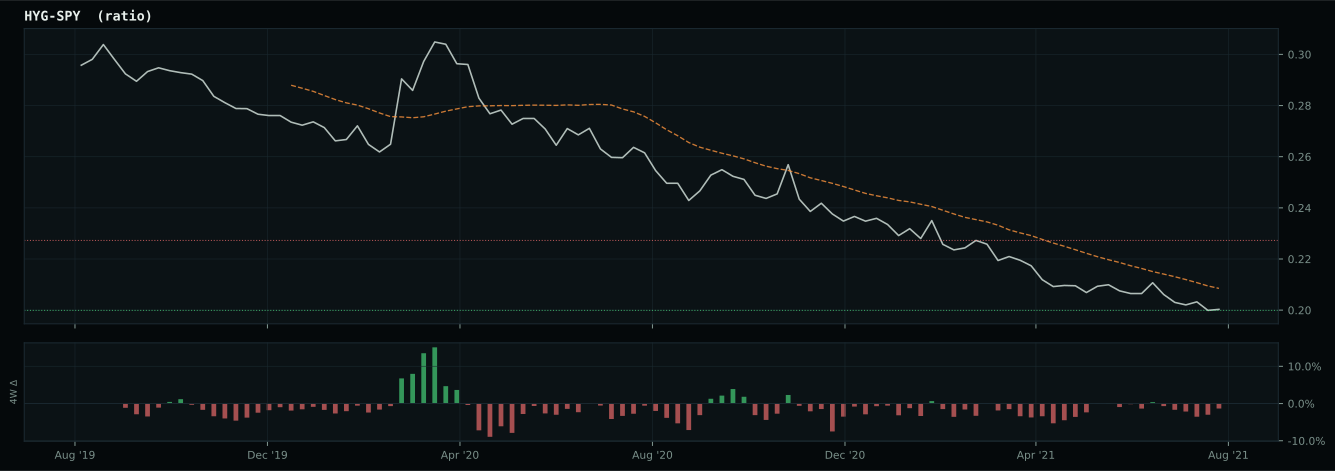
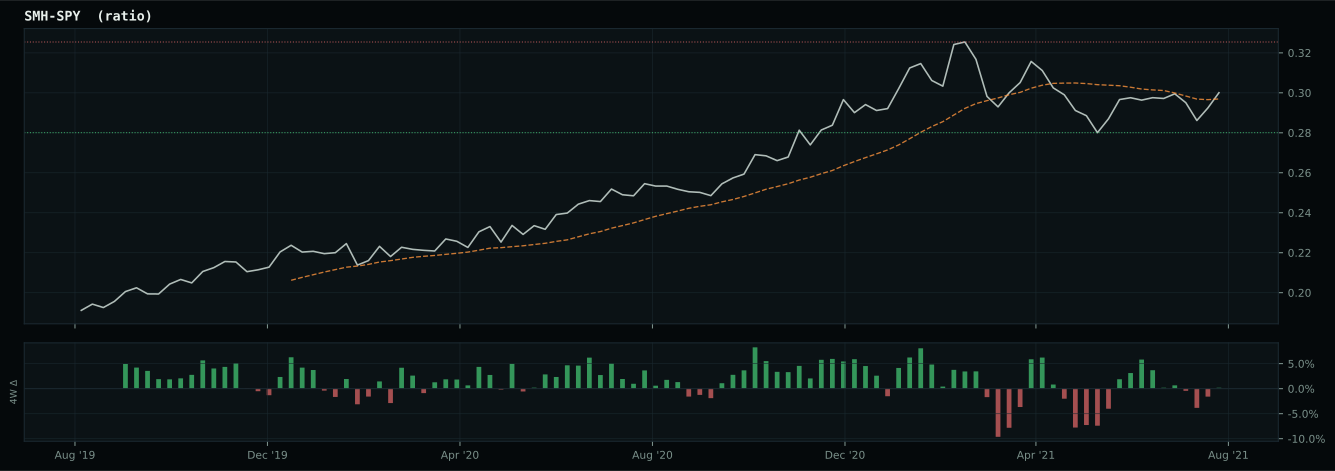
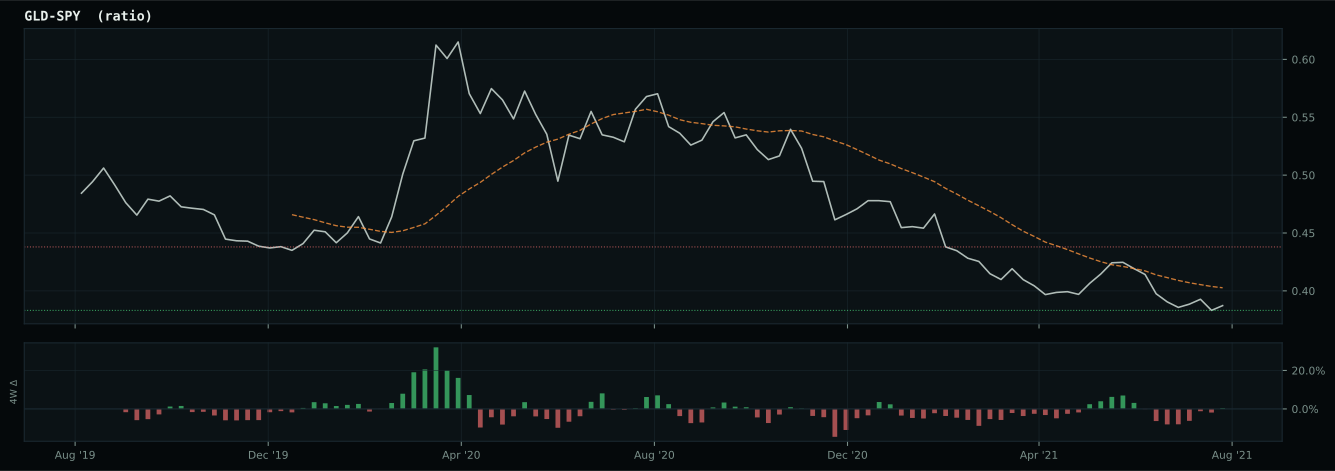
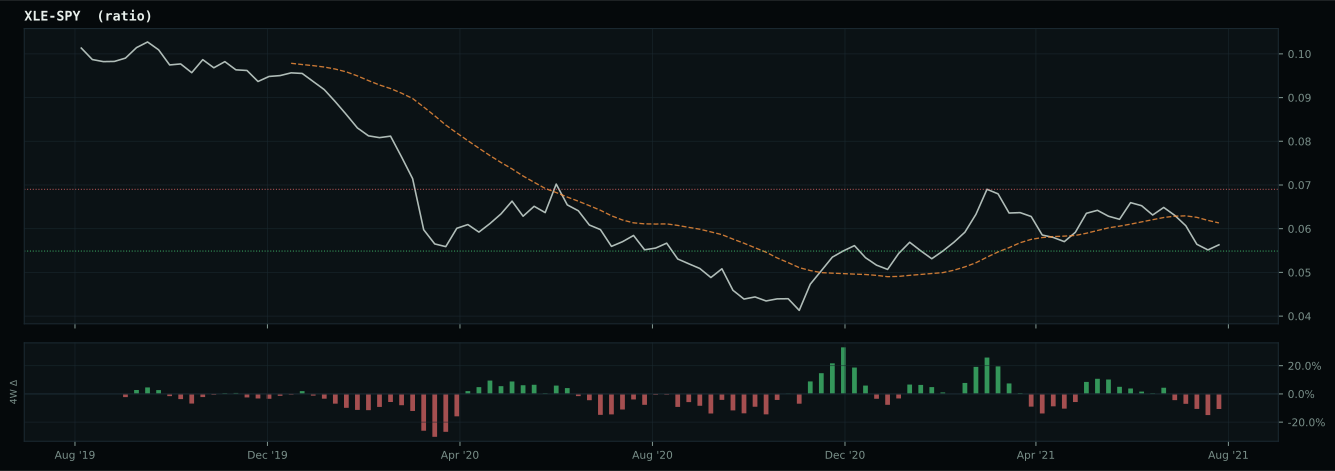
Macro Regime — Goldilocks
Macro Evidence Charts
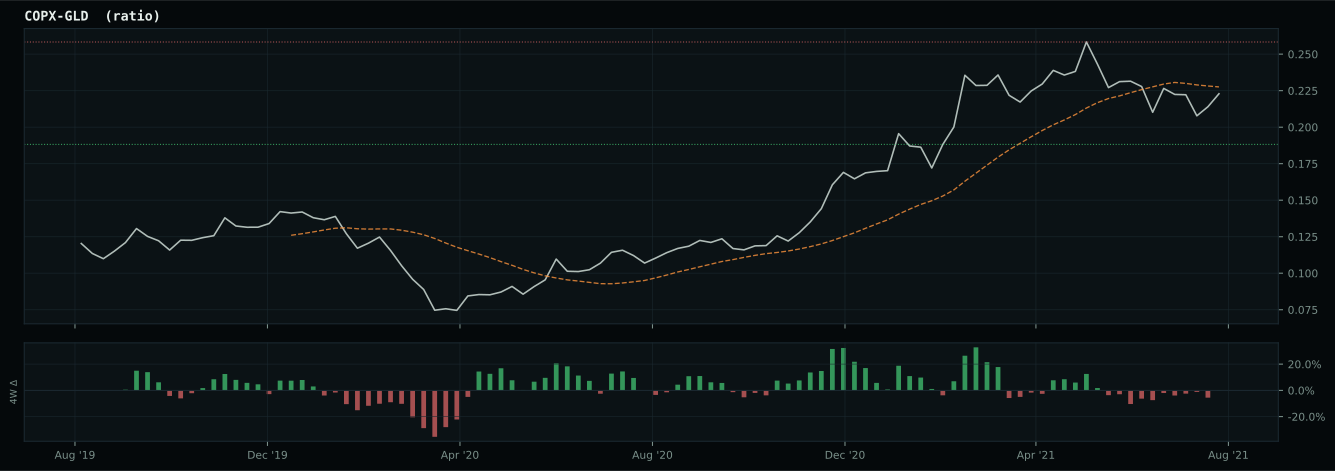
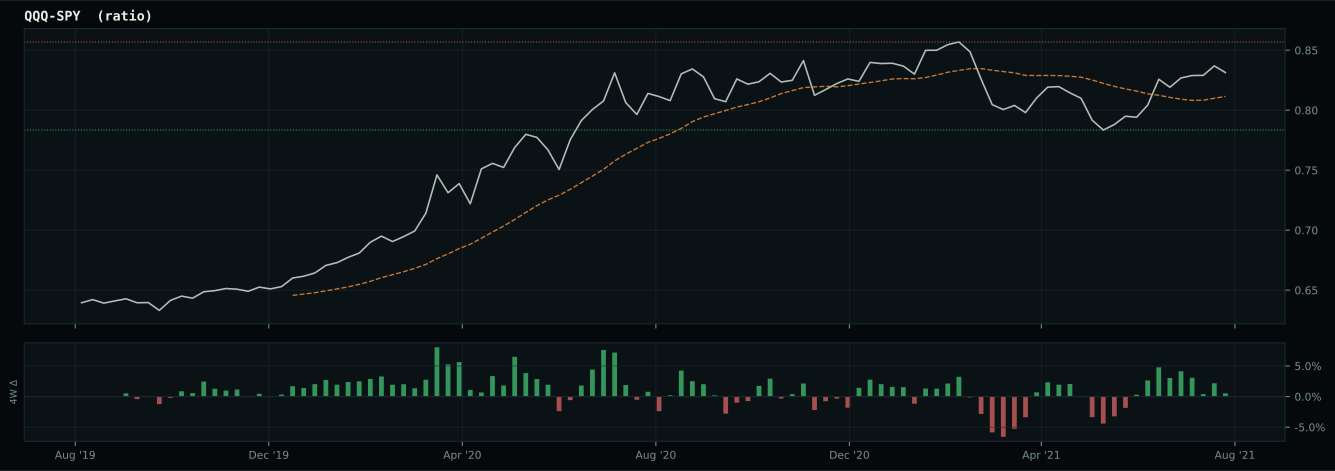
Market-implied signals behind the macro regime scores. Each ratio compares two assets; the direction and slope of the ratio is what the macro engine reads.
Crypto Regime — AltSeason
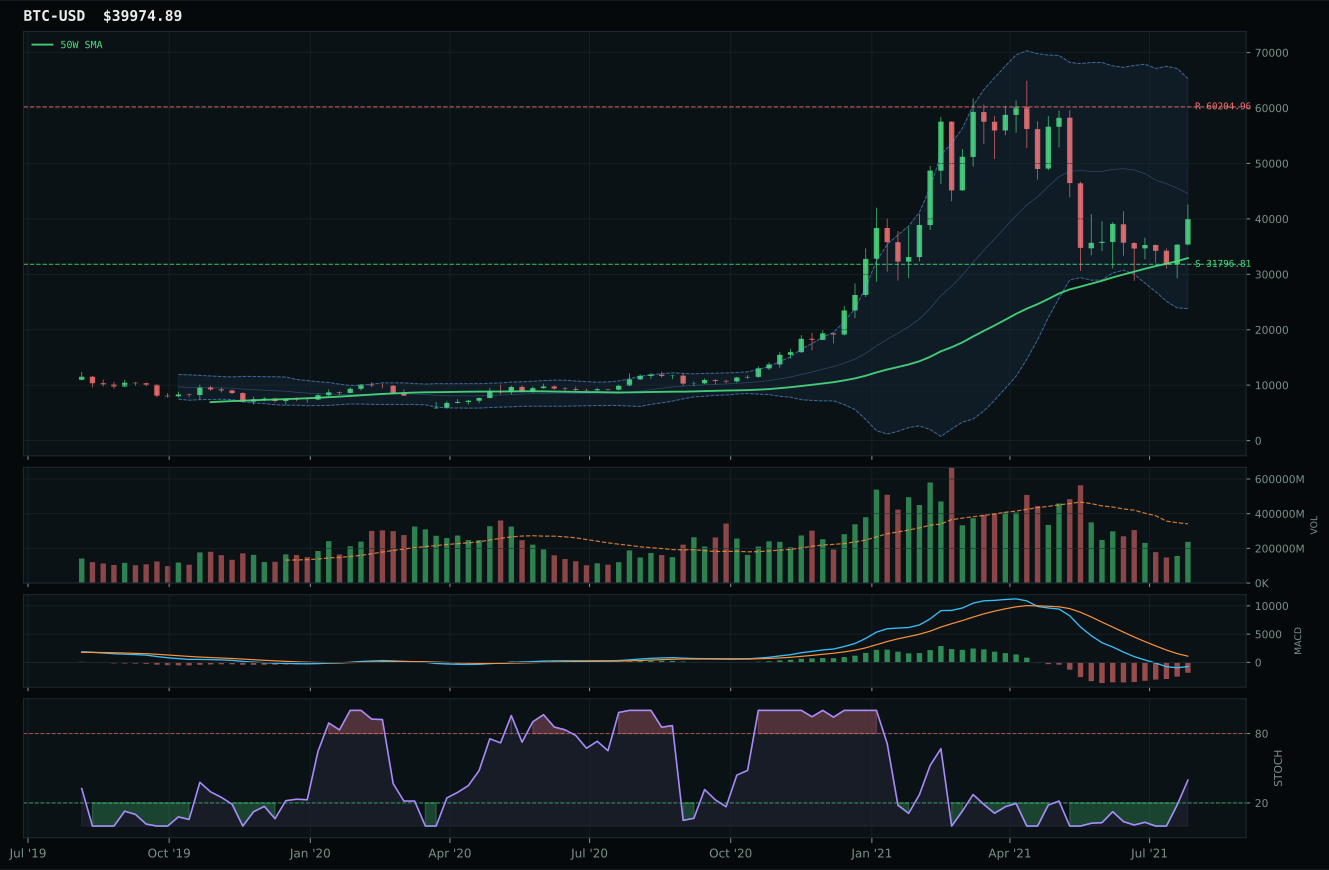
ValueBTC not armed: BTC has not made the first post-breakdown touch of the 200W buy zone after losing the 50W
TrendBTC confirmed: 2 consecutive closes above rising/flat 50W SMA
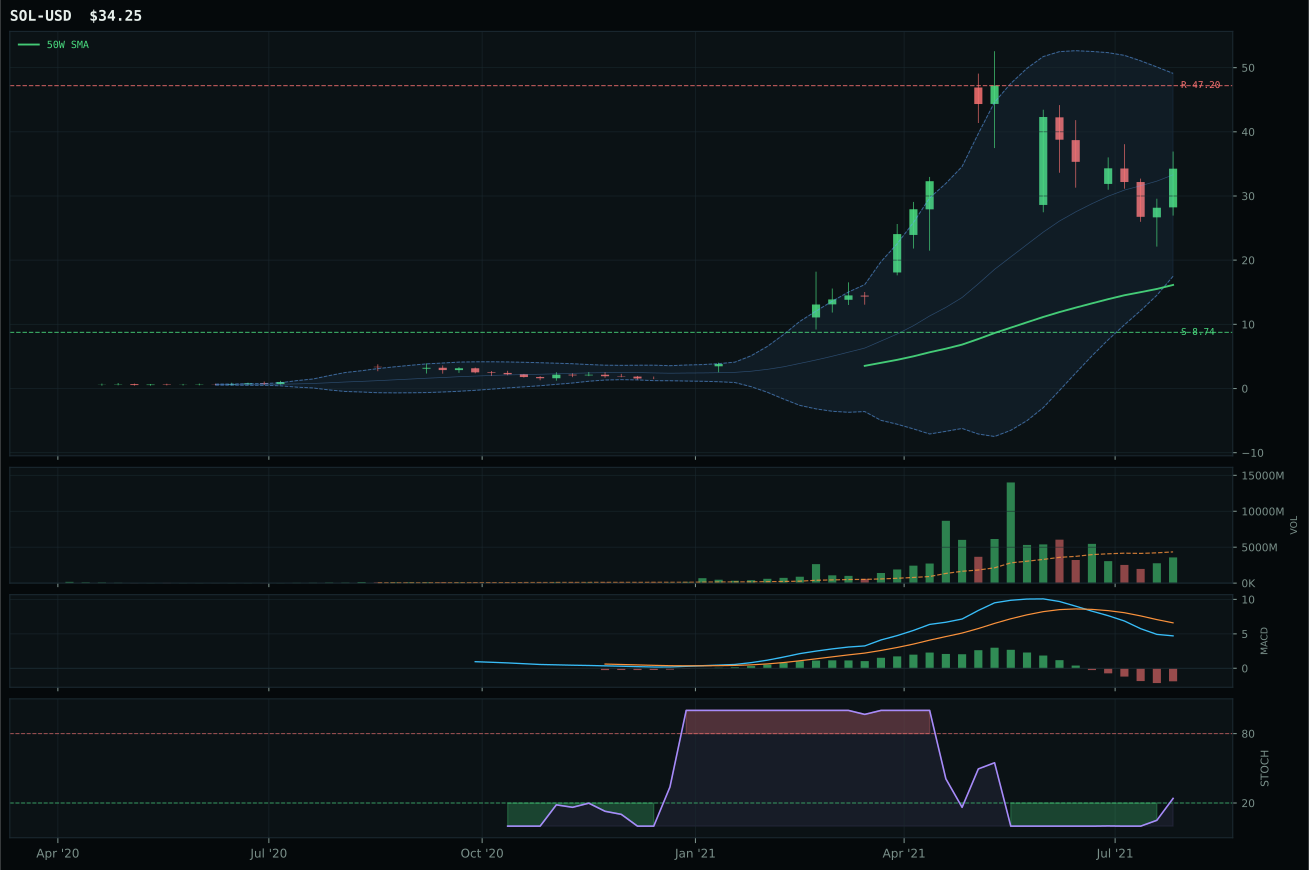
all available AltSeason conditions pass; missing optional confirmations skipped
Category Rankings
| Rank | Category | Winner | Score | Alloc | 4W Ret | Peers (4W) |
|---|---|---|---|---|---|---|
| 1 | Industrial Metals | REMX | 70.4 | 20% | +4.58% | PICK -4.6% · COPX -4.0% |
| 2 | Technology | CIBR | 64.0 | 20% | +5.32% | XLK +2.8% · IGV +4.6% |
| 3 | AI | SMH | 53.9 | 10% | +3.13% | AIQ +2.9% · BOTZ +7.4% |
| 4 | Emerging Markets | ILF | 50.7 | 10% | -2.30% | INDA +6.9% · IEMG -0.7% |
| 5 | Utilities & Infrastructure | XLU | 43.6 | 10% | +3.60% | PAVE +3.9% · IGF +1.2% |
| 6 | Precious Metals | GLD | 37.6 | 10% | +0.21% | GDX -6.6% · SLV -4.8% |
| 7 | Defense & Aerospace | ITA | 36.4 | 10% | -1.20% | ROKT -0.9% · XAR -3.5% |
| 8 | Nuclear Energy | URNM | 35.7 | 10% | -1.08% | URA -1.0% · NLR +3.1% |
| 9 | Agriculture & Livestock | WEAT | 28.4 | 0% | +1.71% | MOO +0.9% · VEGI +1.7% |
| 10 | Traditional Energy | XLE | 18.1 | 0% | +0.16% | XOP +1.3% · FCG +0.0% |
Industrial Metals — REMX
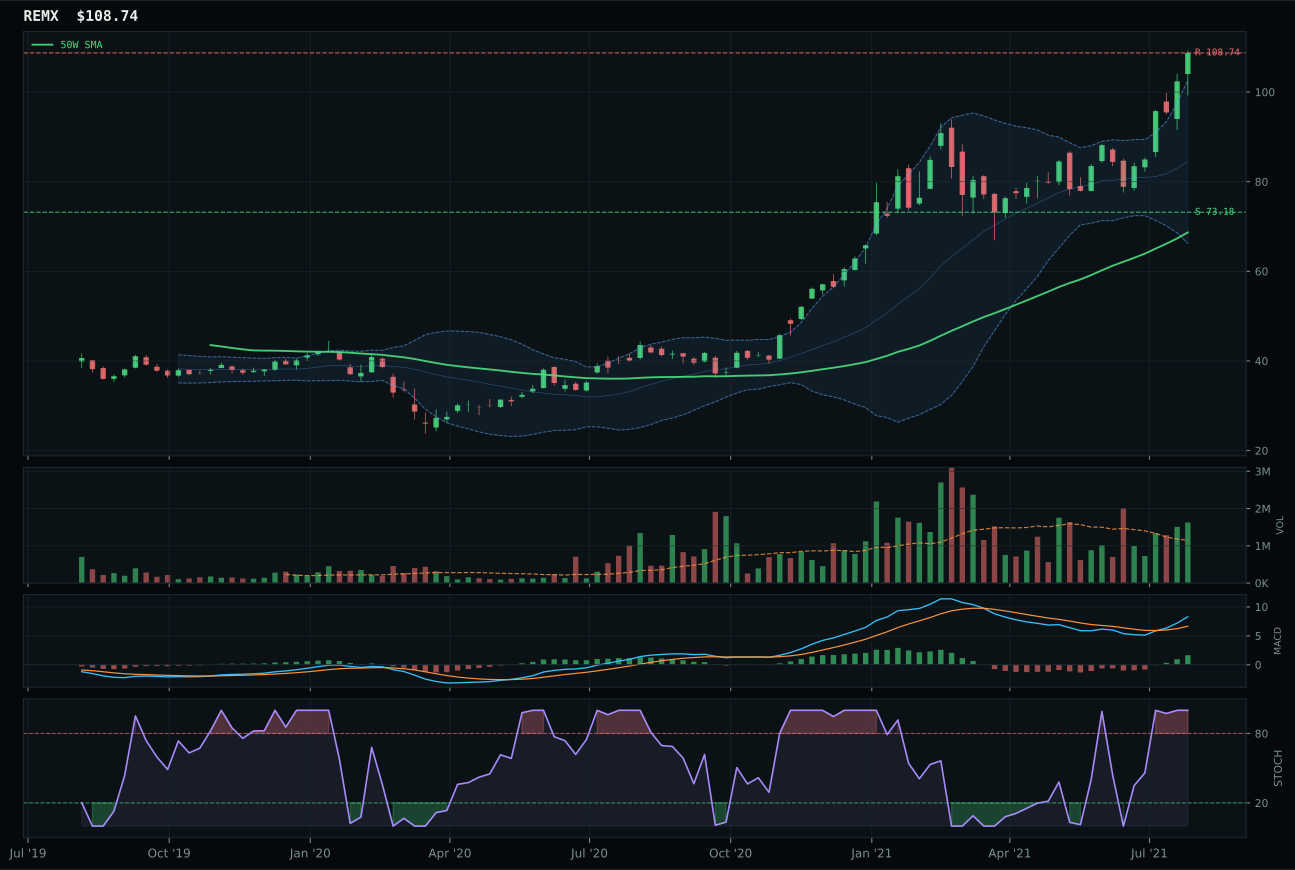
REMX has a vertical extension profile with 31.2% 13-week relative strength versus SPY.
A failed hold above support would weaken the setup.
Actionable but governed by invalidation levels.
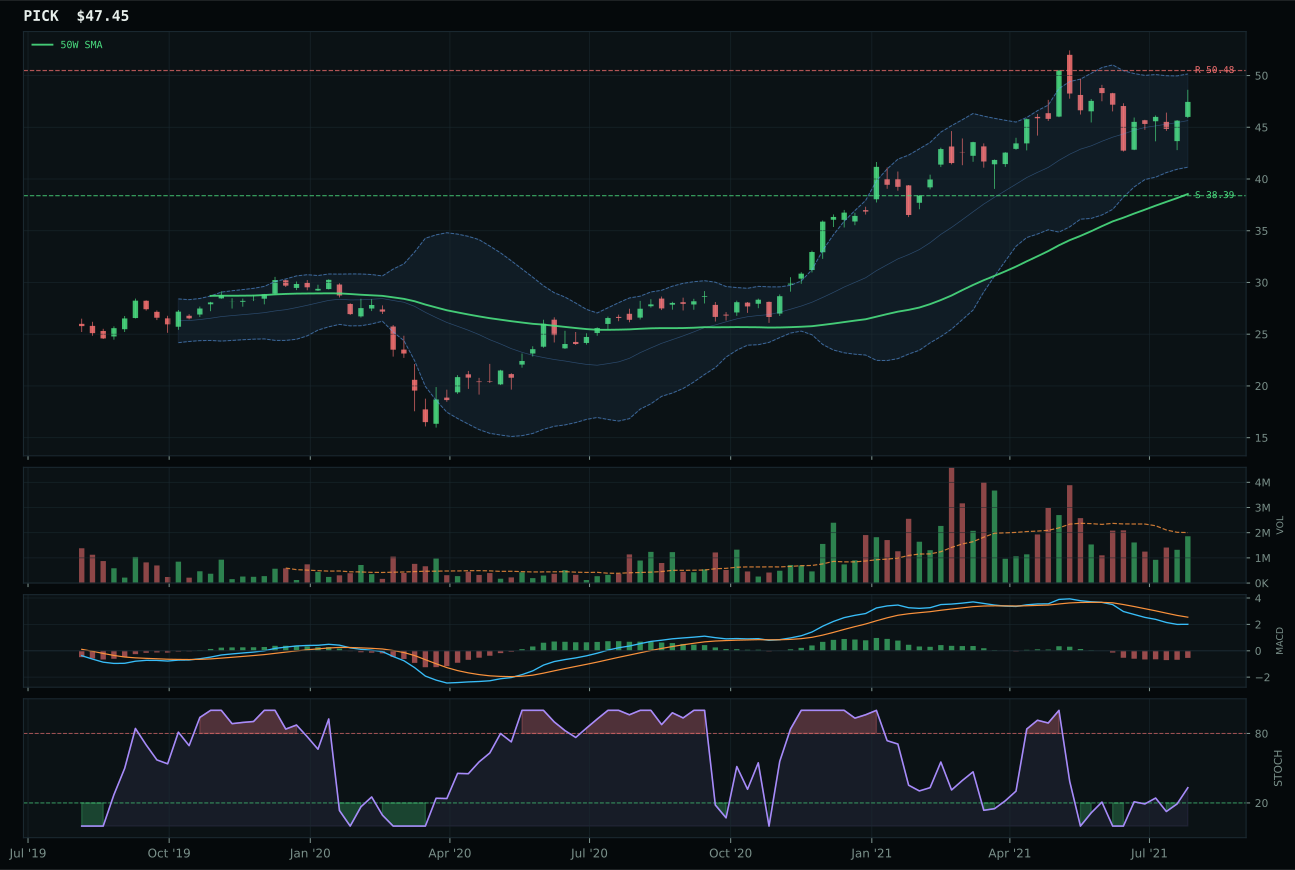
PICK has a vertical extension profile with -1.5% 13-week relative strength versus SPY.
A failed hold above support would weaken the setup.
Actionable but governed by invalidation levels.
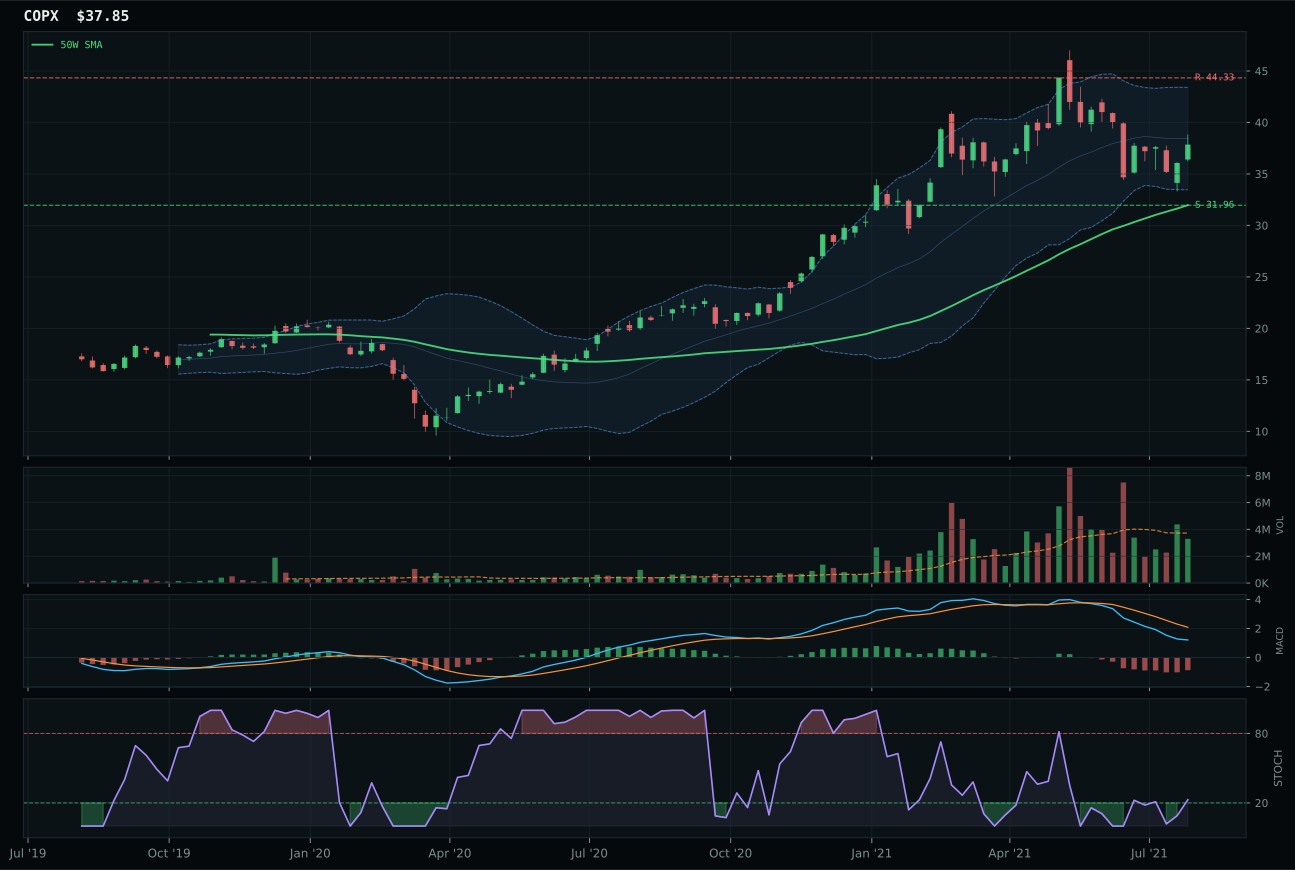
COPX has a vertical extension profile with -9.2% 13-week relative strength versus SPY.
A failed hold above support would weaken the setup.
Actionable but governed by invalidation levels.
REMX wins with a commanding 94.6/100 technical evidence score—the highest representative score in the entire portfolio—by delivering 36.2% 13W returns, 31.2% SPY-relative strength, and 32.7% category-relative strength while maintaining bullish MACD and above-average 1.42x volume participation. The 100.0/100 trend composite reflects price above both moving averages with a 2.0% 50W slope, the steepest slope in the category, while the 100.0/100 momentum confirmation from 28.0% 4W returns proves this is not a late-stage exhaustion setup despite being 58.3% extended above the 50W. The 93.1% volume-price confirmation and 100.0% persistence scores indicate institutional accumulation across a vertical extension, exactly the pattern that justifies premium pricing. PICK lost despite being only 0.9 points behind on the final category score because its MACD is bearish but improving rather than bullish, volume is neutral rather than above-average, and category-relative strength lags at 0.0% versus REMX's dominant 32.7%. Rare earth and metals scarcity narratives are being actively accumulated, not passively held.
Industrial Metals ranks second among all ten categories at 70.4, earning a 10% top-2 allocation alongside Technology. The category-level macro fit of 79.0/100 is the strongest in the portfolio, driven by active metals scarcity (+14), commodity breadth positive (+10), and real asset sponsorship (+6), while the Goldilocks regime provides +6 additional support and credit stress only penalizes by -7. REMX's 86.8 reasoned ETF score reflects technical evidence at 94.6/100 weighted heavily (62%) in the allocation model, amplified by macro support that makes supply-chain scarcity a genuine structural macro theme rather than a technical anomaly. The portfolio's two top-2 allocations (Technology 10%, Industrial Metals 10%) together account for 20% of the capital under the 50% overlay, creating a 10%/10% net position that reflects a Goldilocks regime where AI growth and rare earth scarcity are the two highest-conviction narratives. REMX's 58.3% extension creates entry risk, but the volume sponsorship and momentum persistence prove the market is pricing scarcity, not exhaustion; this allocation would maintain at 10% even if REMX pulled back to the 50W, because the macro thesis would strengthen with improved entry risk.
Technology — CIBR
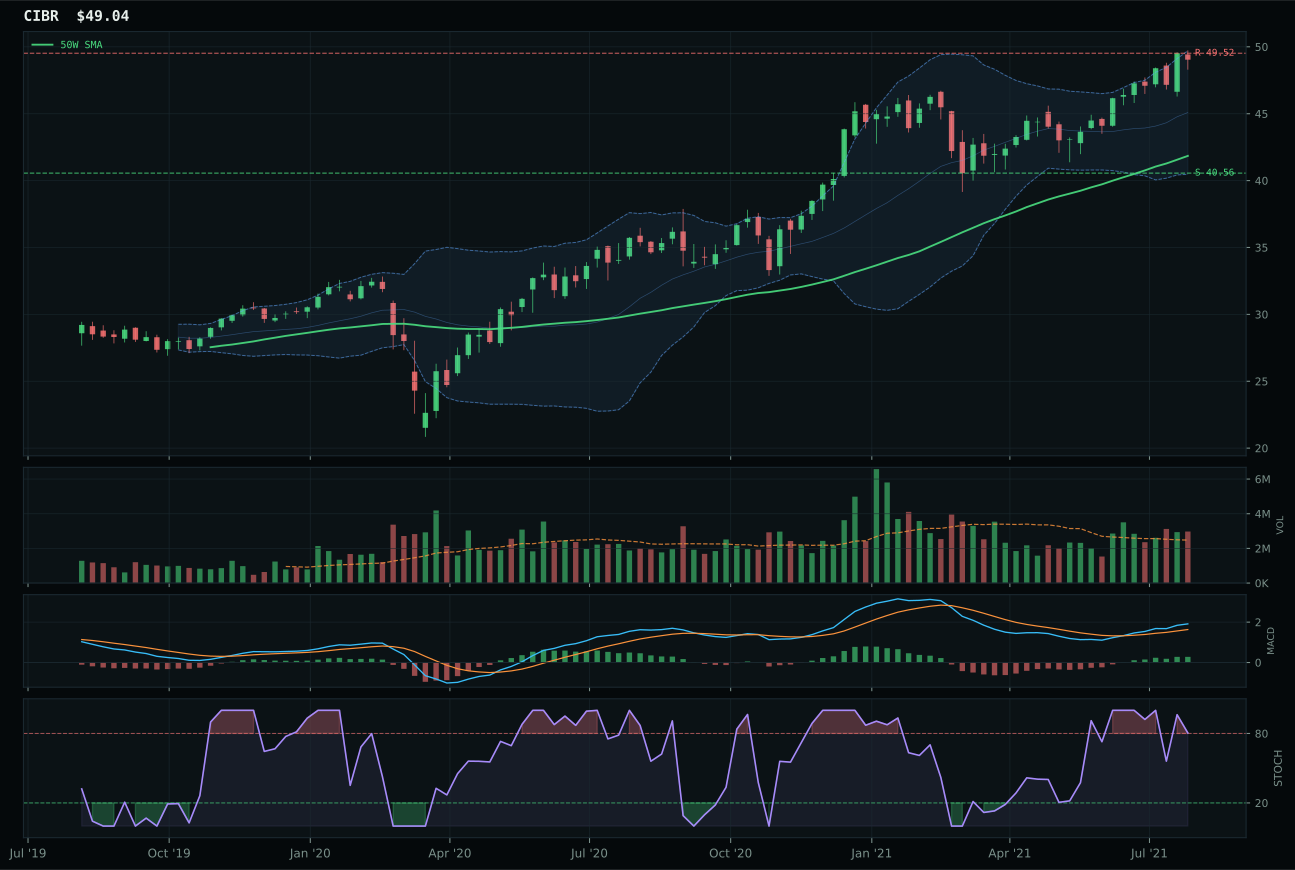
CIBR has a vertical extension profile with 6.3% 13-week relative strength versus SPY.
A failed hold above support would weaken the setup.
Actionable but governed by invalidation levels.
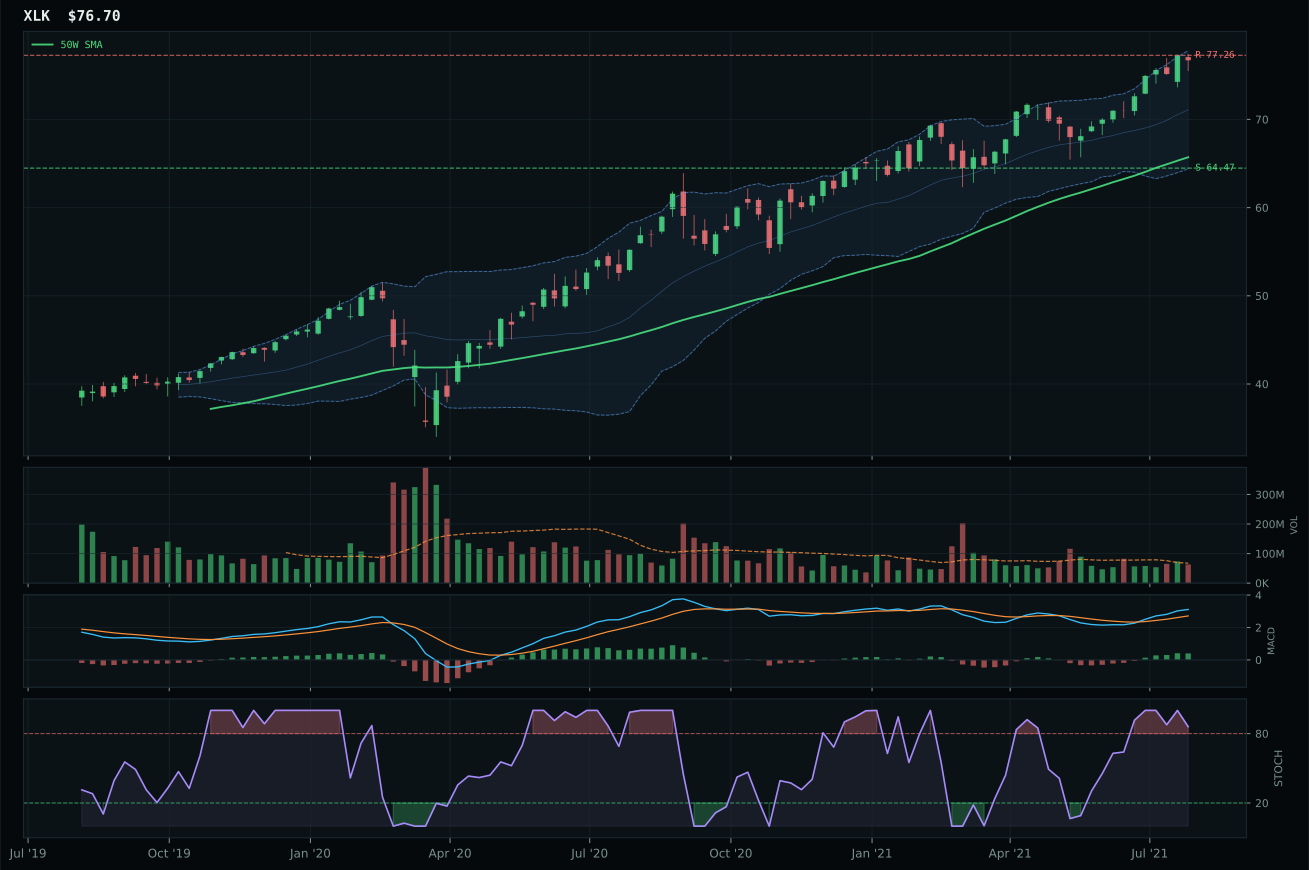
XLK has a vertical extension profile with 4.7% 13-week relative strength versus SPY.
A failed hold above support would weaken the setup.
Actionable but governed by invalidation levels.
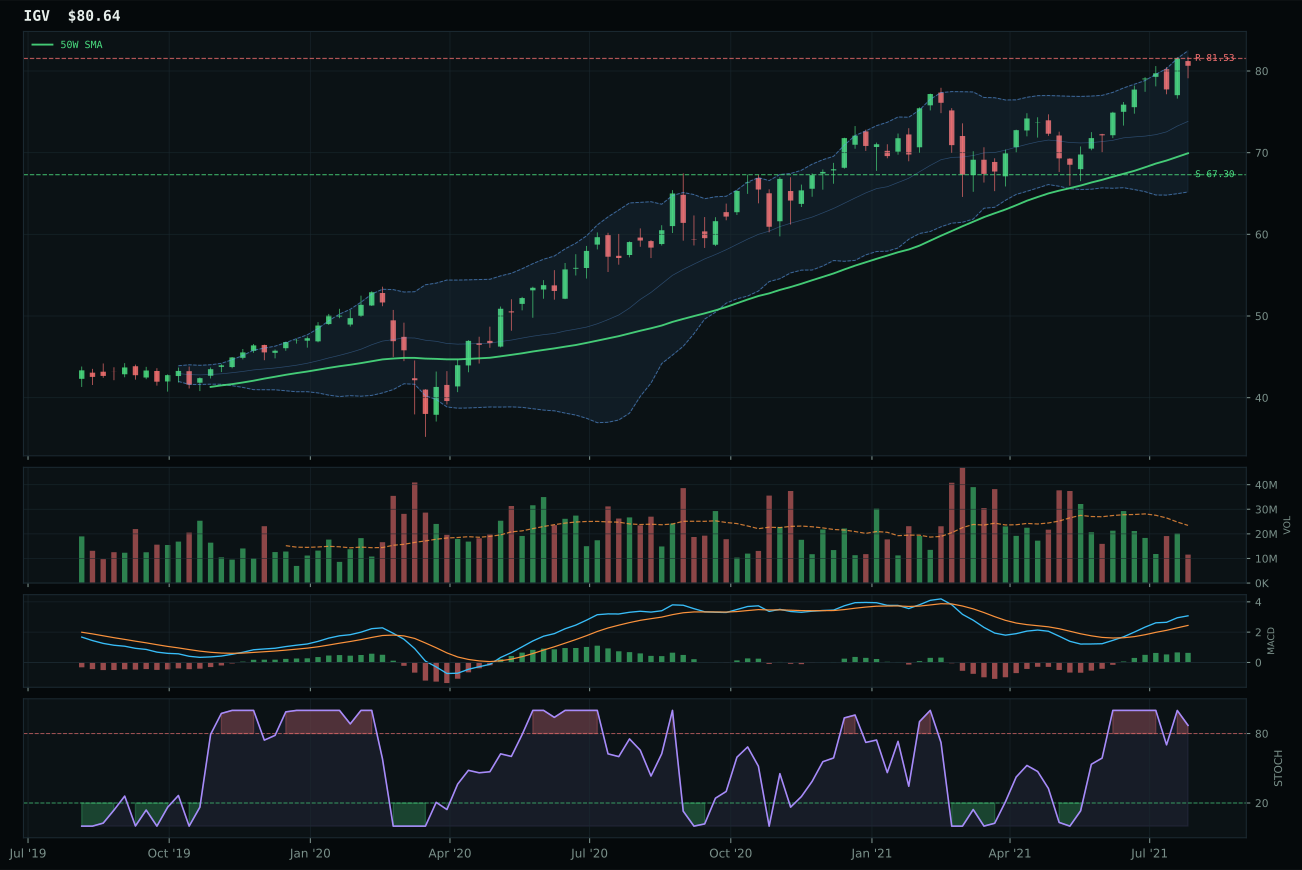
IGV has a vertical extension profile with 6.4% 13-week relative strength versus SPY.
A failed hold above support would weaken the setup.
Actionable but governed by invalidation levels.
CIBR wins the category with a 64.0 score by combining a clean trend above both the 50-week and 200-week moving averages with above-average volume participation at 1.20x its 20-week average, signaling active accumulation rather than passive bouncing. The 6.3% relative strength versus SPY and category-relative strength of 0.0% demonstrate peer leadership within the three-ETF basket, while MACD bullish and improving conditions confirm momentum isn't rolling over despite the stochastic RSI overbought signal. XLK lost to CIBR on three technical counts: neutral volume confirmation versus above-average participation, a 1.6% deficit in category-relative strength, and weaker risk-reward asymmetry of 37.7 versus 38.0. The vertical extension setup at 17.2% above the 50W does penalize entry risk, but the volume sponsorship and momentum persistence justify the score gap of 2.8 points over the runner-up.
Technology earns a 10% allocation as one of two top-2 ranked categories this week, tied with Industrial Metals at the highest composite opportunity. In a Goldilocks macro regime with liquidity expansion, risk appetite positive, and AI growth sponsorship all active, cybersecurity as a steadier technology subtheme offers better timing asymmetry than broad-market technology exposure: CIBR's distance to the 50W at 17.2% is penalized in the timing subscore, but the above-average volume participation and bullish MACD prove the extension is being accumulated. The category-level macro fit of 81.0/100 reflects strong support from five active descriptors, offsetting the technical evidence score of 69.7/100, which lags momentum leaders due to entry risk. Capital allocation at 10% reflects the top-2 ranking; the next six categories split 5% each, creating a meaningful but not overwhelming conviction position in a market where AI-enabled semiconductors and cybersecurity infrastructure remain the proven growth drivers.
AI — SMH
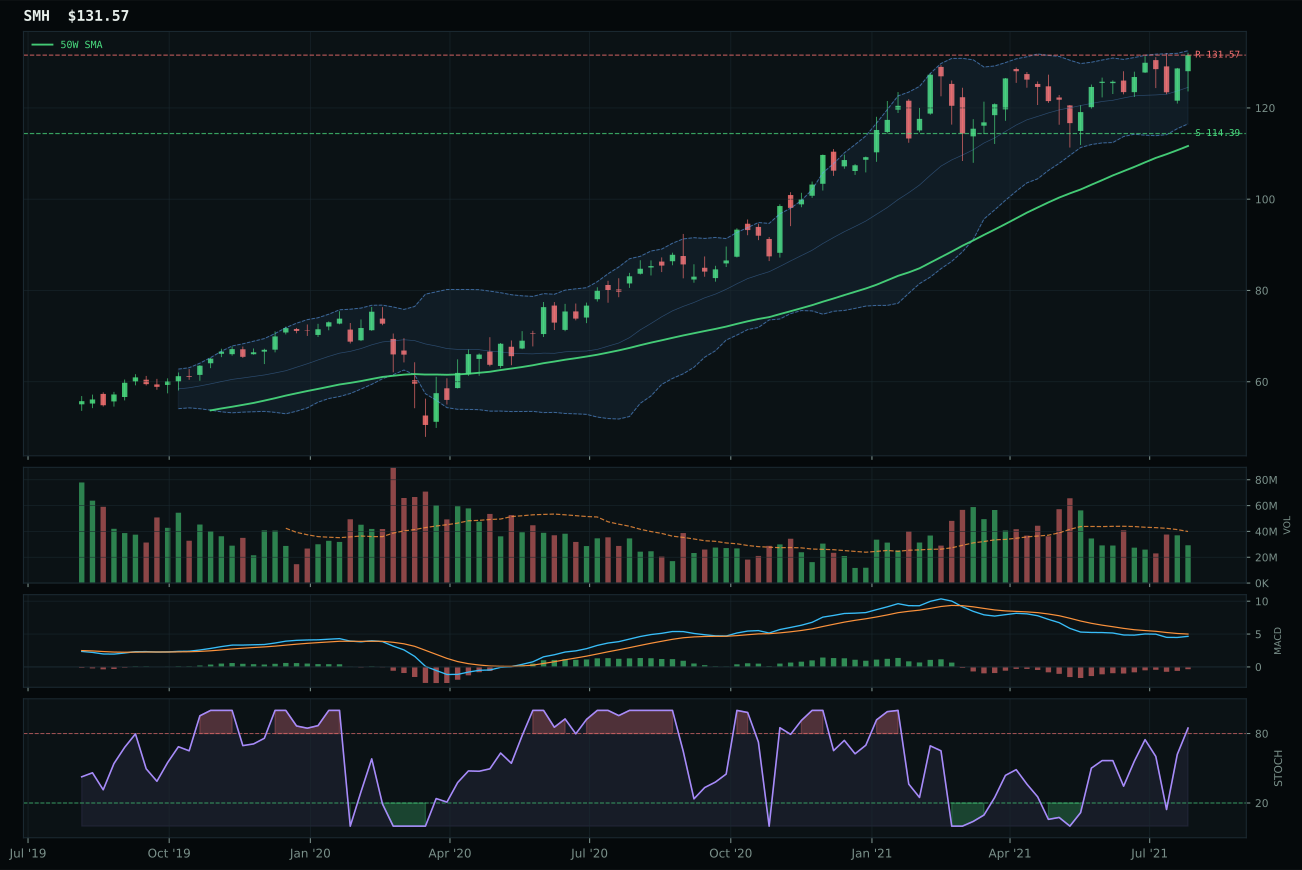
SMH has a vertical extension profile with 3.2% 13-week relative strength versus SPY.
A failed hold above support would weaken the setup.
Actionable but governed by invalidation levels.
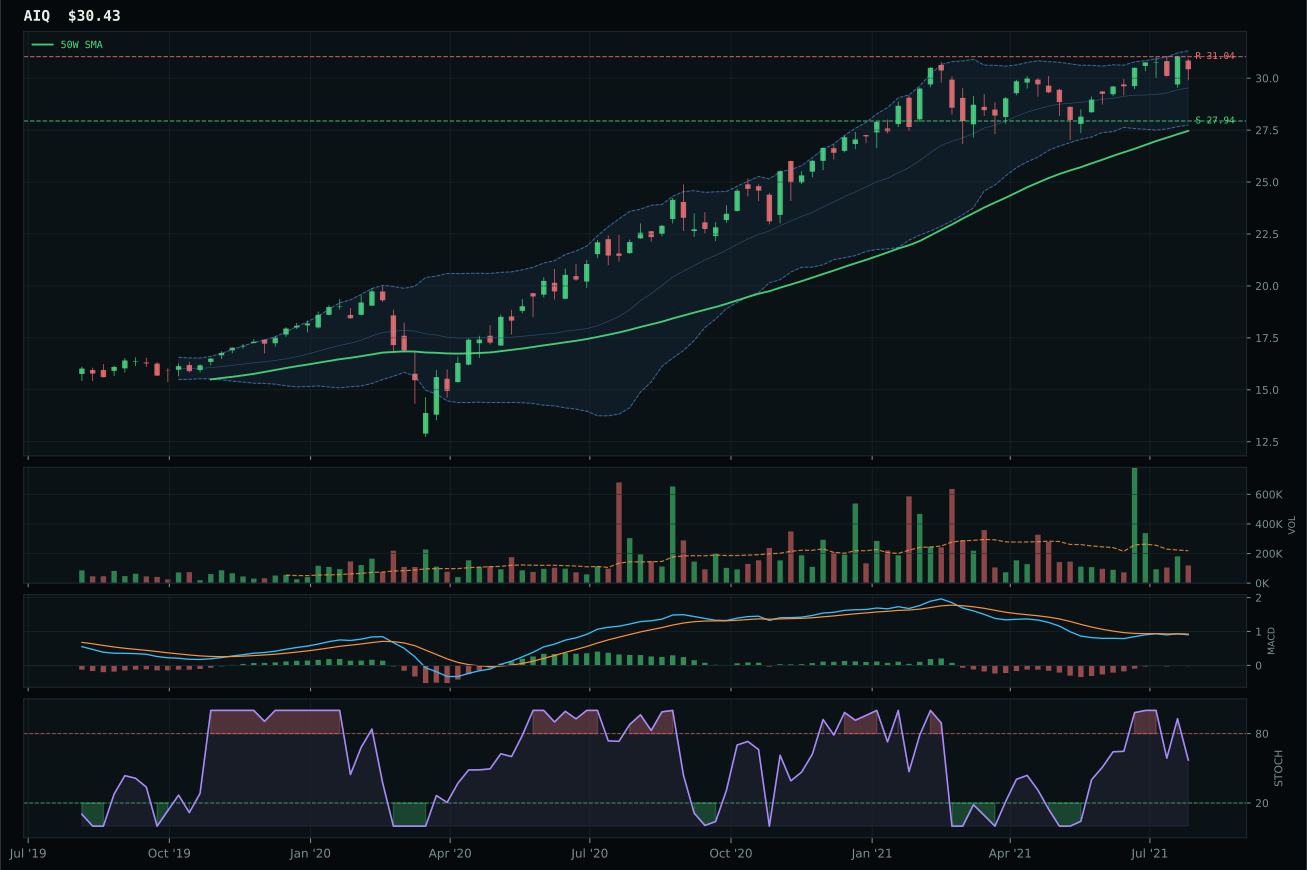
AIQ has a neutral structure profile with -1.3% 13-week relative strength versus SPY.
A failed hold above support would weaken the setup.
Tracked, but not top-2 eligible because: .
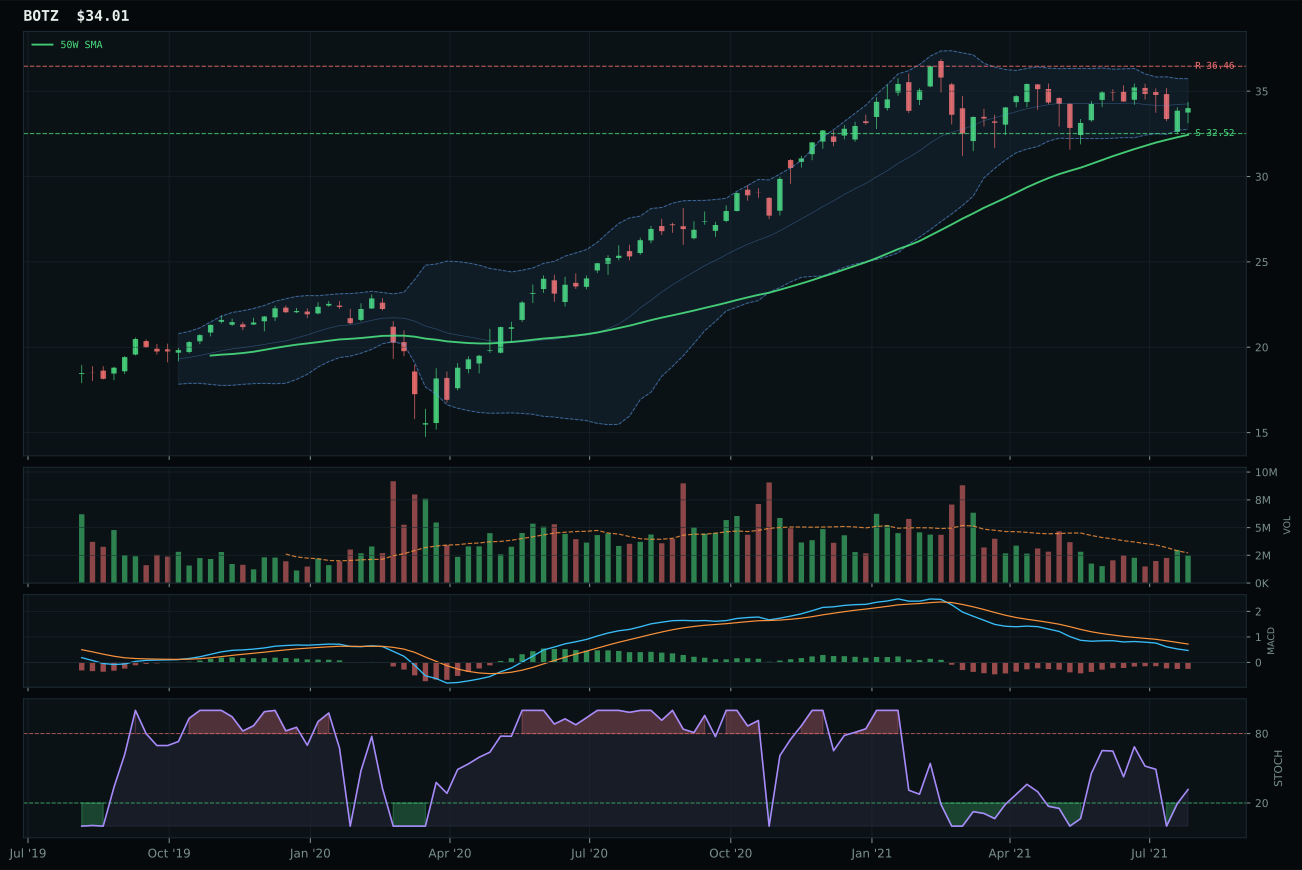
BOTZ has a pullback into support profile with -6.0% 13-week relative strength versus SPY.
A failed hold above support would weaken the setup.
Actionable but governed by invalidation levels.
SMH wins by delivering category-relative strength of 4.5% versus AIQ's 0.0%, a 5.6-point gap in risk-reward scoring, and a 13W return of 8.3% that exceeds the category median despite thin participation at 0.73x its 20-week average. The vertical extension setup at 17.8% above the 50W would normally be a disqualifying entry point, but the trend composite of 97.8/100 (price above both moving averages with a 0.8% 50W slope) and MACD bearish but improving dynamics anchor the score above pullback-reliant alternatives. AIQ stumbled on technical structure: its 3.8% 13W return and -1.3% SPY-relative strength expose software-application exposure as lagging the hardware-compute narrative, while its neutral structure setup and falling stochastic RSI create lower confidence in continuation. The 20.5-point score gap versus AIQ is decisive because semiconductor and compute leadership is macro-sponsored, and execution matters more than breadth in this regime.
AI ranks third among the ten categories at 53.9, earning a 5% tier-2 allocation rather than a top-2 10% slot. Despite AI growth sponsorship generating a +14 macro boost and category-level macro fit of 86.0/100—the highest of any category—the representative technical evidence of 58.4/100 creates a ceiling: SMH's trend of 97.8/100 cannot overcome a momentum confirmation score of 69.0/100 and thin volume participation that suggests retail enthusiasm rather than institutional accumulation. The 13W return of 8.3% is respectable but trails Industrial Metals' 36.2% and Technology's 11.4%, which both ranked higher this week. Goldilocks conditions and positive risk appetite do support holding AI at tier-2 allocation; what would upgrade it to top-2 is either a recovery in volume-price confirmation with above-average participation or a pullback into the 50W that resets entry risk and allows momentum to build from a cleaner technical setup.
Emerging Markets — ILF
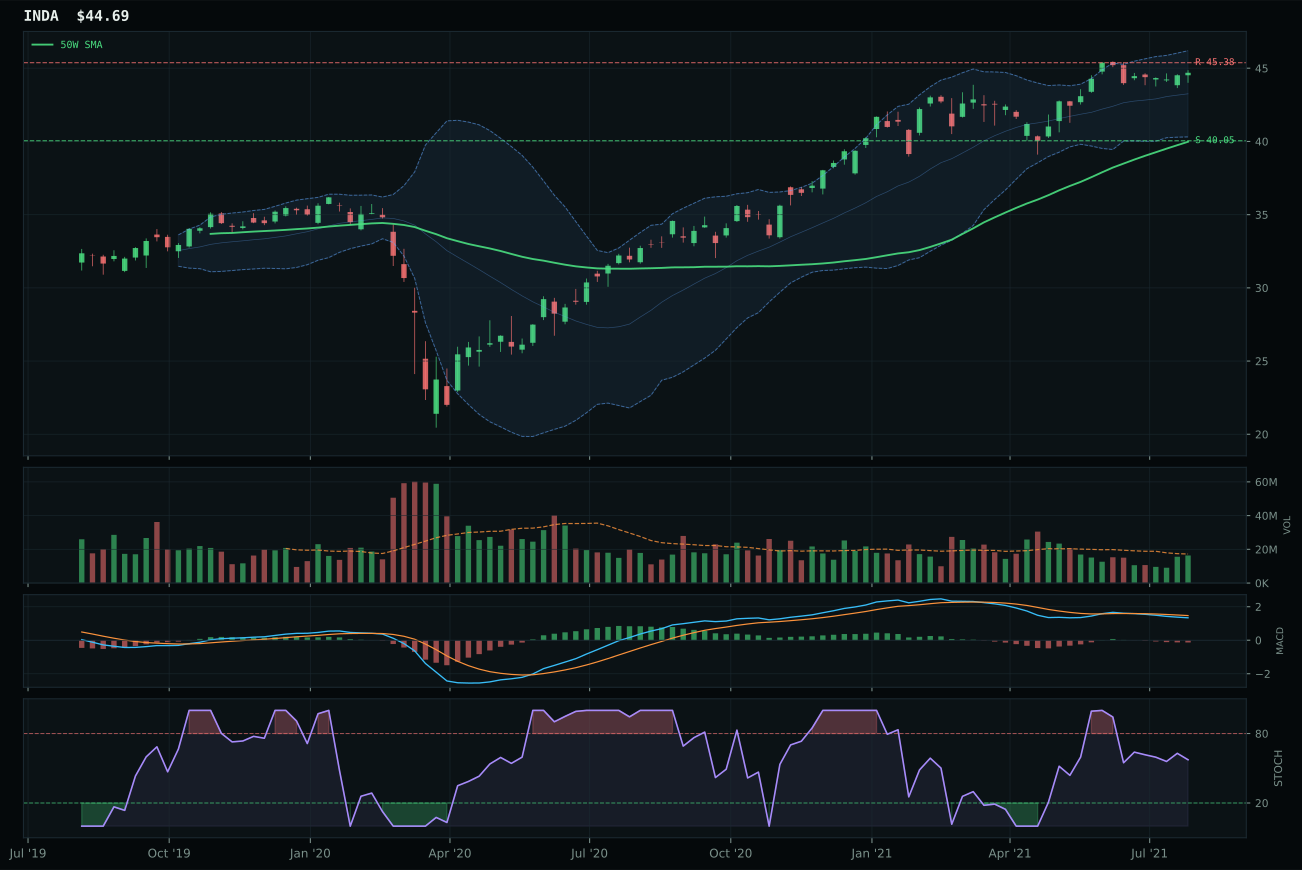
INDA has a neutral structure profile with 3.9% 13-week relative strength versus SPY.
A failed hold above support would weaken the setup.
Actionable but governed by invalidation levels.
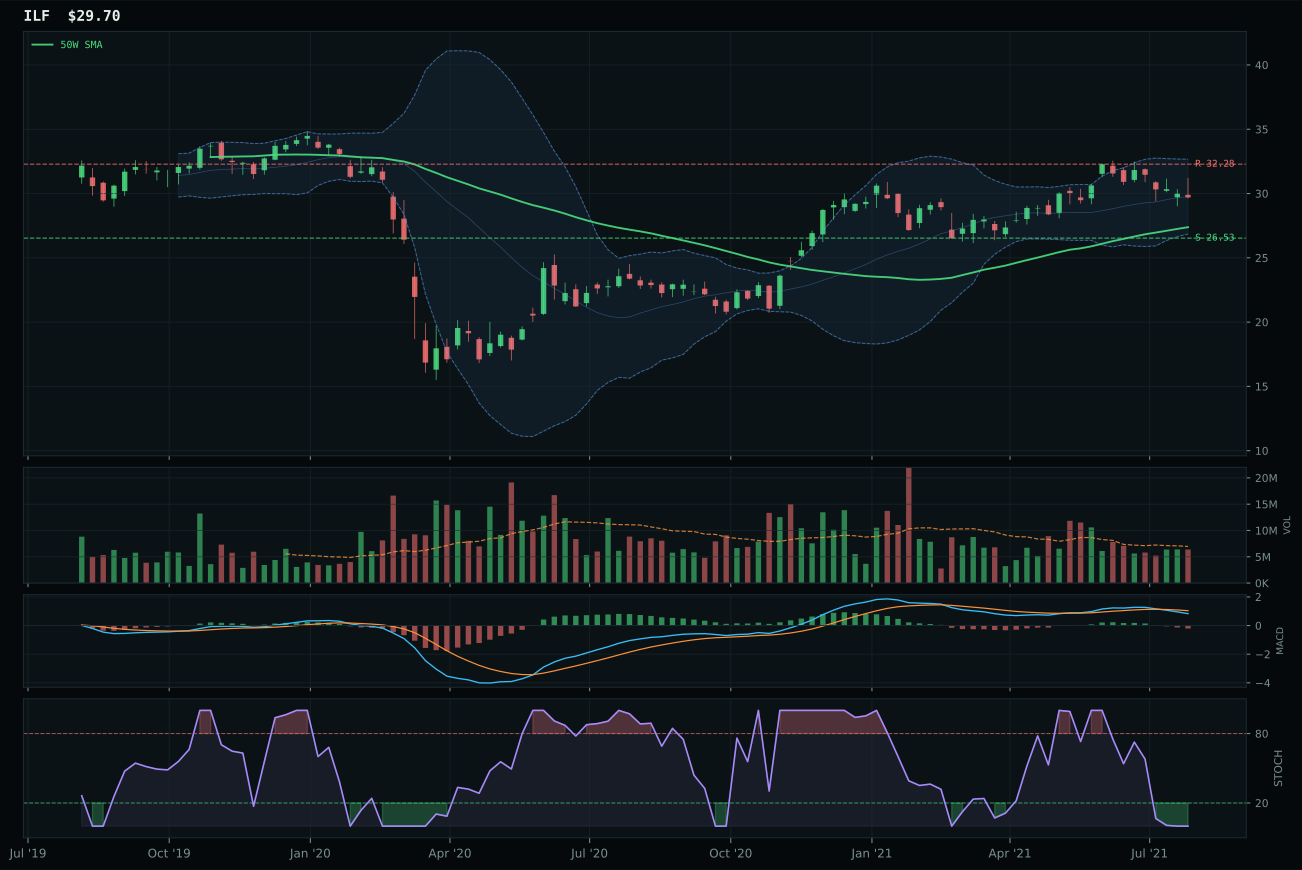
ILF has a neutral structure profile with -0.4% 13-week relative strength versus SPY.
A failed hold above support would weaken the setup.
Actionable but governed by invalidation levels.
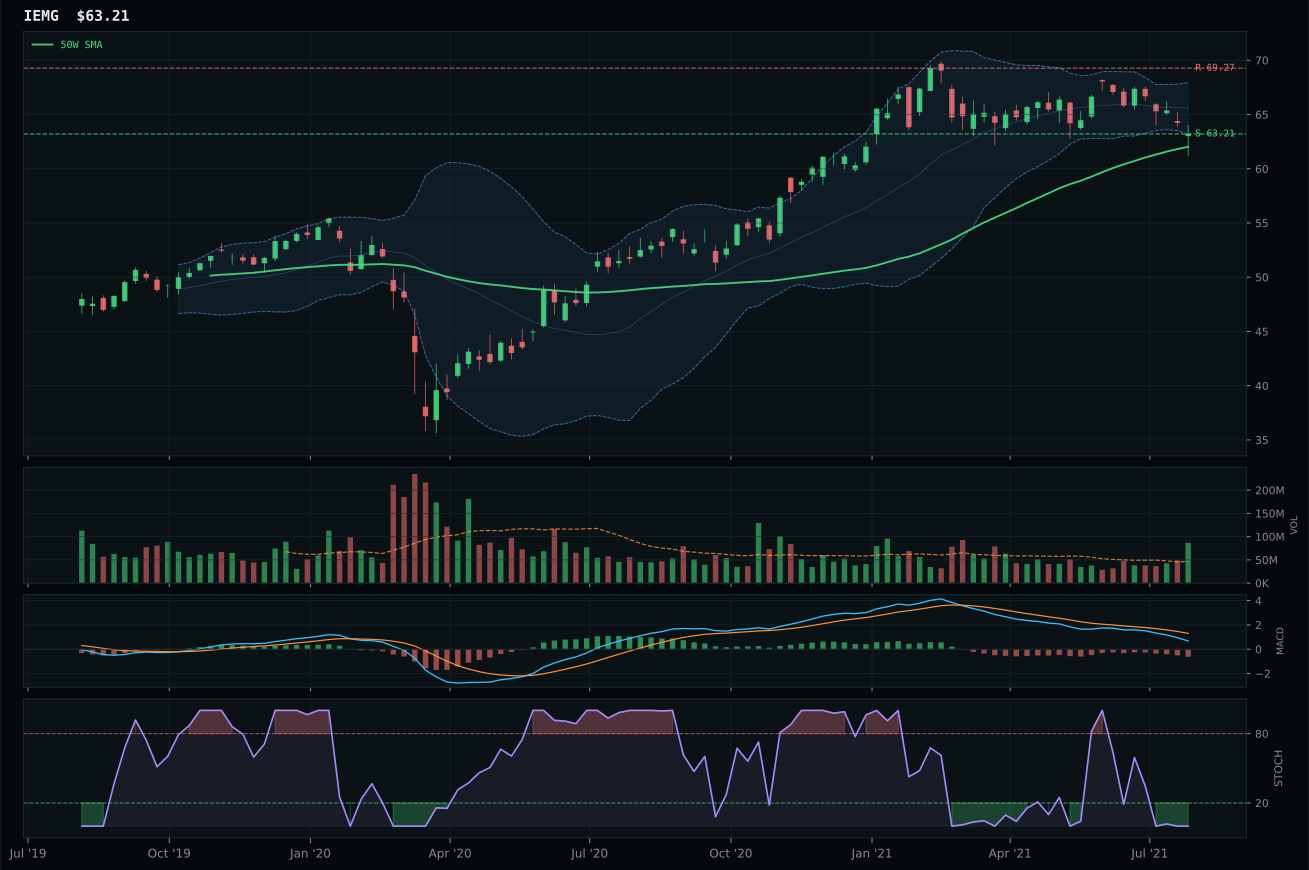
IEMG has a pullback into support profile with -8.5% 13-week relative strength versus SPY.
A failed hold above support would weaken the setup.
Actionable but governed by invalidation levels.
ILF wins over INDA despite a 56.2 vs 47.0 reasoned ETF score spread of 9.2 points by demonstrating superior timing discipline and risk-reward asymmetry. Price sits 8.5% from the 50W in a rising-mid-zone oversold setup—exactly where mean reversion is highest confidence—while INDA trades at near 52W high extension with falling stochastic RSI, creating a technical discord between bullish SPY-relative strength (+3.9%) and deteriorating stochastic RSI momentum. ILF's timing score of 70.0/100 versus INDA's 62.0/100 reflects this positioning: one is coiled, the other is extended. The risk-reward differential is material: ILF offers 11.9% downside to support versus only -8.0% upside to resistance, while INDA's 39.4% risk-reward score versus ILF's 57.0% penalizes extension risk despite higher momentum confirmation. Category-relative strength of 0.0% for ILF versus 4.3% for INDA is close, but INDA's bearish/weakening MACD diverges from its near-52W-high positioning, raising exhaustion risk. The -10.3-point final score gap validates the timing discipline over momentum extrapolation.
Emerging Markets earns a 5% tier-2 allocation at a 50.7 final score, fifth-ranked among tier-2 categories with strong macro support that does not translate to top-2 ranking due to technical limitations. The category-level macro fit of 78.0/100 is the second-highest in the portfolio after Industrial Metals, driven by EM liquidity support (+14), Goldilocks regime (+8), liquidity expansion (+8), and risk appetite positive (+8), only partially offset by credit stress at -10. ILF's technical evidence of 37.1/100 represents the limiting factor: while the category macro case is institutional-grade, the representative's neutral structure setup, 4.7% 13W return, and -0.4% SPY-relative strength prevent capital allocation above tier-2 levels. The portfolio's allocation framework weights technical evidence at 62% and macro fit at 38%, creating a ceiling where strong macro cannot overcome weak technicals. Emerging Markets would require ILF to break above resistance at 32.28 with volume acceleration while the 50W accelerates higher, proving that EM liquidity support is translating to accumulation rather than remaining a macro narrative without market participation. Current 5% allocation reflects portfolio diversification and macro hedging; conviction upgrade would require technical follow-through on the institutional macro thesis.
Utilities & Infrastructure — XLU
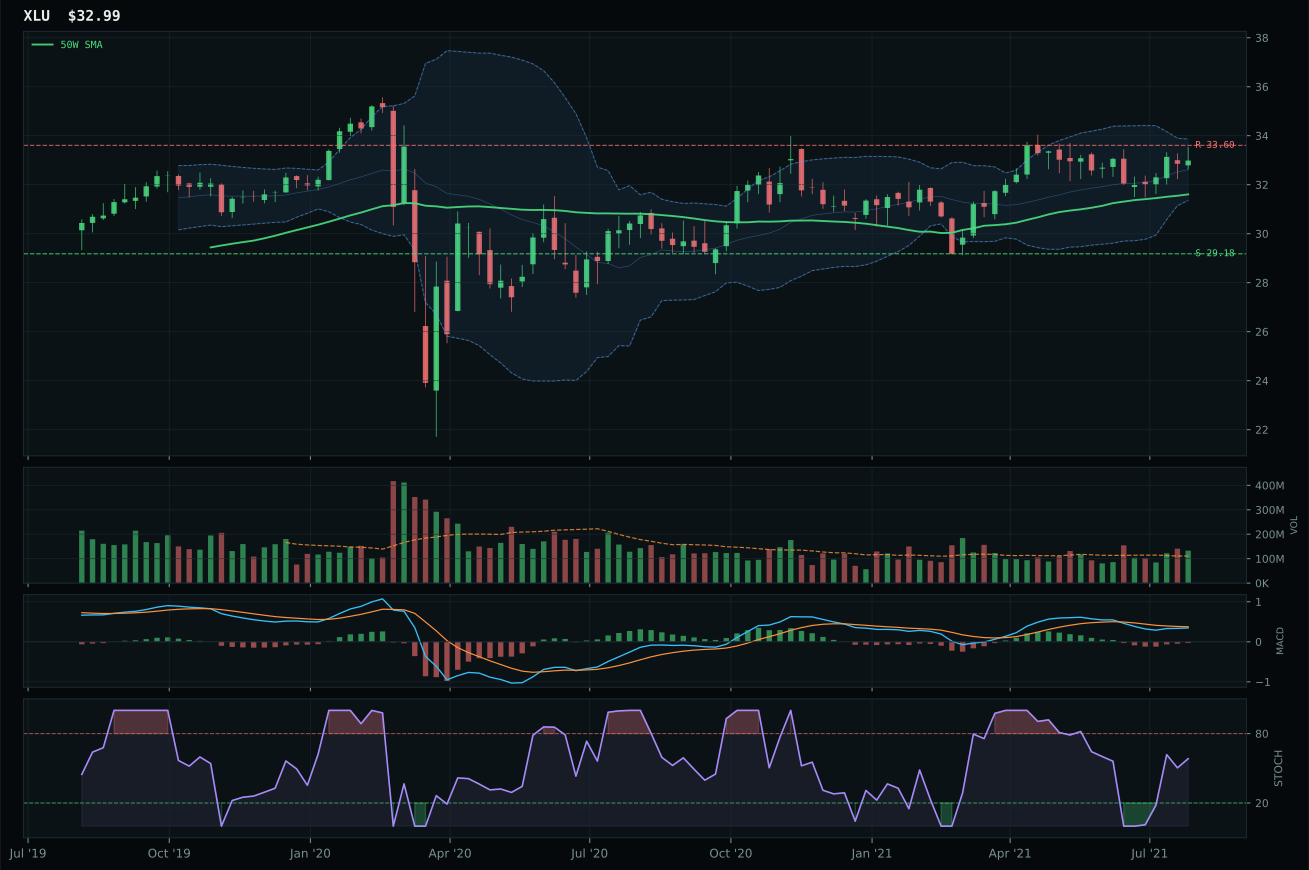
XLU has a neutral structure profile with -6.2% 13-week relative strength versus SPY.
A failed hold above support would weaken the setup.
Actionable but governed by invalidation levels.
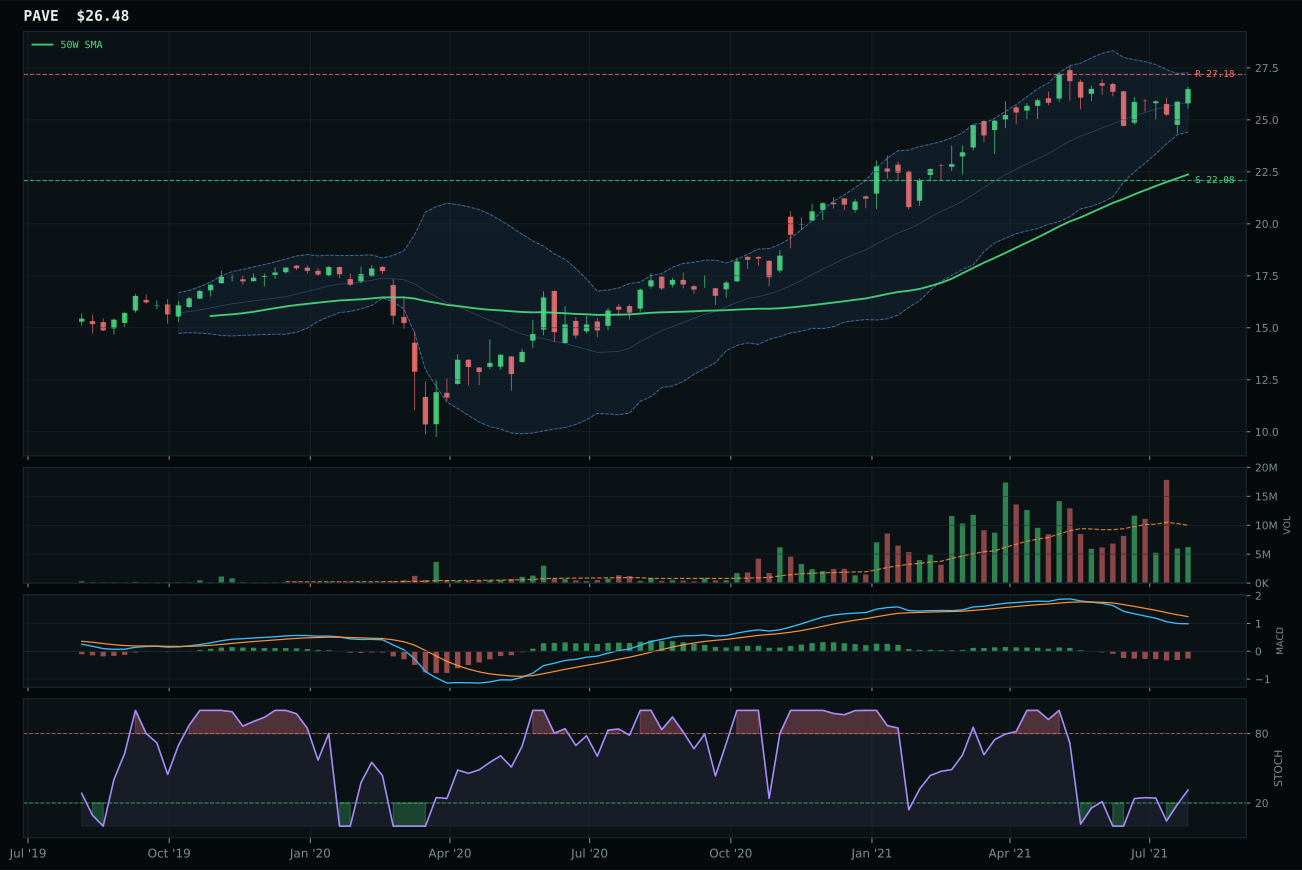
PAVE has a vertical extension profile with -2.5% 13-week relative strength versus SPY.
A failed hold above support would weaken the setup.
Actionable but governed by invalidation levels.
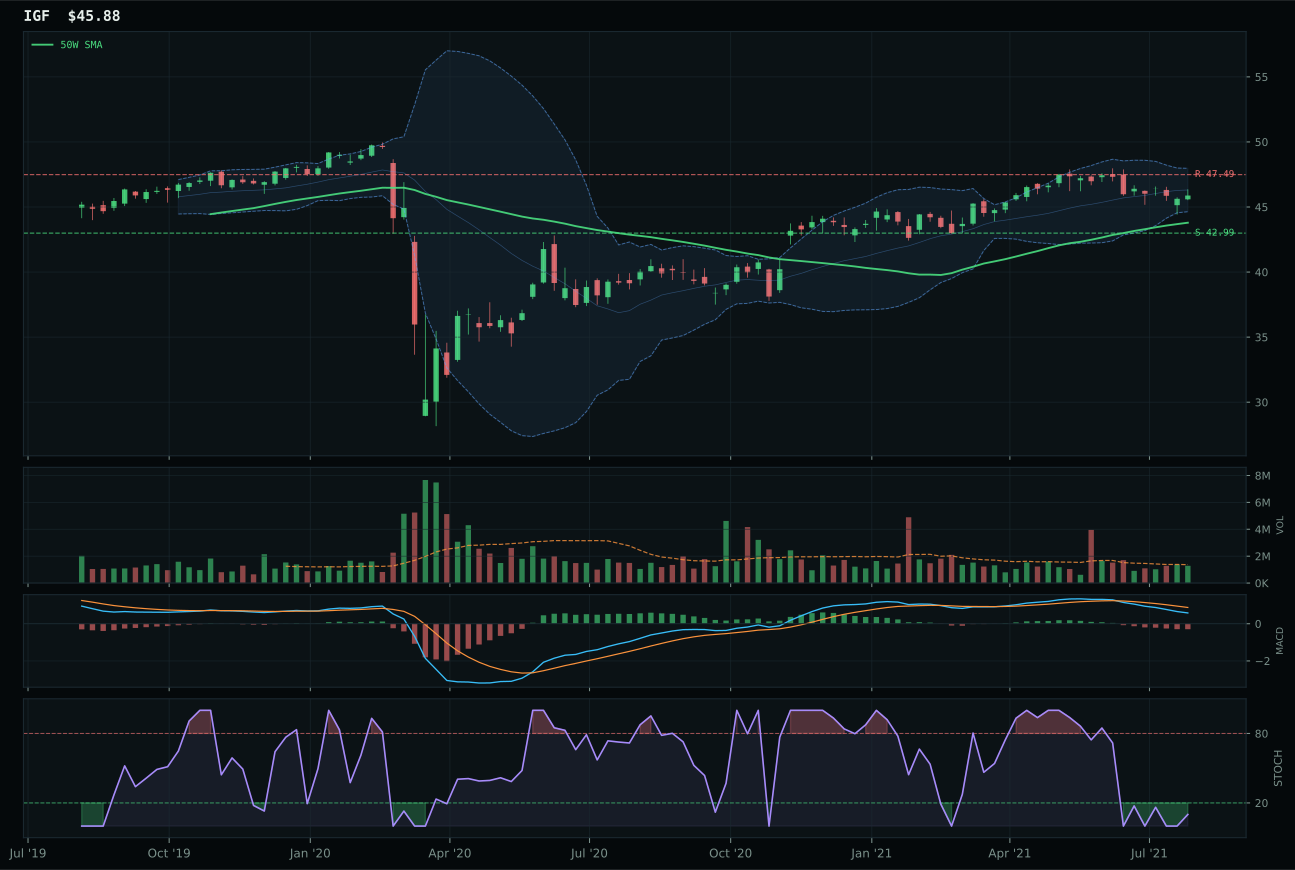
IGF has a neutral structure profile with -6.7% 13-week relative strength versus SPY.
A failed hold above support would weaken the setup.
Actionable but governed by invalidation levels.
XLU wins by combining the highest timing score in the category at 98.0/100—reflecting price sitting just 4.4% from the 50W in a rising mid-zone stochastic RSI setup with MACD bearish but improving—with above-average volume participation at 1.19x that no other candidate in the category achieves. The trend composite of 83.7/100 confirms price remains above both moving averages without dangerous extension, while the structure score of 77.9/100 reflects 85.1% compression, the tightest setup among the three candidates and foundational for expansion if buyers defend support. PAVE lost decisively on timing: its 18.4% distance from the 50W in a vertical extension setup creates entry risk that no amount of 2.6% 13W momentum can overcome, and its thin volume participation at 0.40x signals weak accumulation for a breakout pattern. The 14.0-point score gap between winner and runner-up is decisive because XLU's timing is exceptional—98.0/100 is in the top quartile of all category components this week—making it the portfolio's premier mean-reversion setup if support holds. The -6.2% SPY-relative strength reflects defensive beta, not weakness in the entry setup.
Utilities & Infrastructure earns a 5% tier-2 allocation at a 43.6 final score, fourth-ranked among the six tier-2 categories, because technical timing combined with defensive macro utility justifies portfolio inclusion despite below-neutral momentum. Category-level macro fit of 58.0/100 reflects a Goldilocks regime (+4), disinflation pressure (+6), and credit stress (-2), creating modest structural tailwinds that support regulated utilities as inflation hedges in periods of rate-peak expectations. XLU's technical evidence of 70.8/100 is solid for a defensive sector, while its 98.0/100 timing score represents the portfolio's best mean-reversion setup on a per-category basis: price is coiled 4.4% below the 50W with rising momentum. The -1.1% 13W return confirms this is a consolidation sector, not a growth narrative, but the above-average volume participation proves institutional accumulation is occurring despite negative short-term returns. Tier-2 allocation reflects the timing opportunity without pretending utilities are cyclical drivers; the 5% position would rotate downward if support breaks near 29.18, but would upgrade to tier-1 if XLU breaks above 33.60 resistance with volume acceleration alongside a macro shift toward stagflationary fears that would make regulated yield assets structurally preferred. Current positioning captures the compression setup without committing capital to a secular low-growth thesis.
Precious Metals — GLD
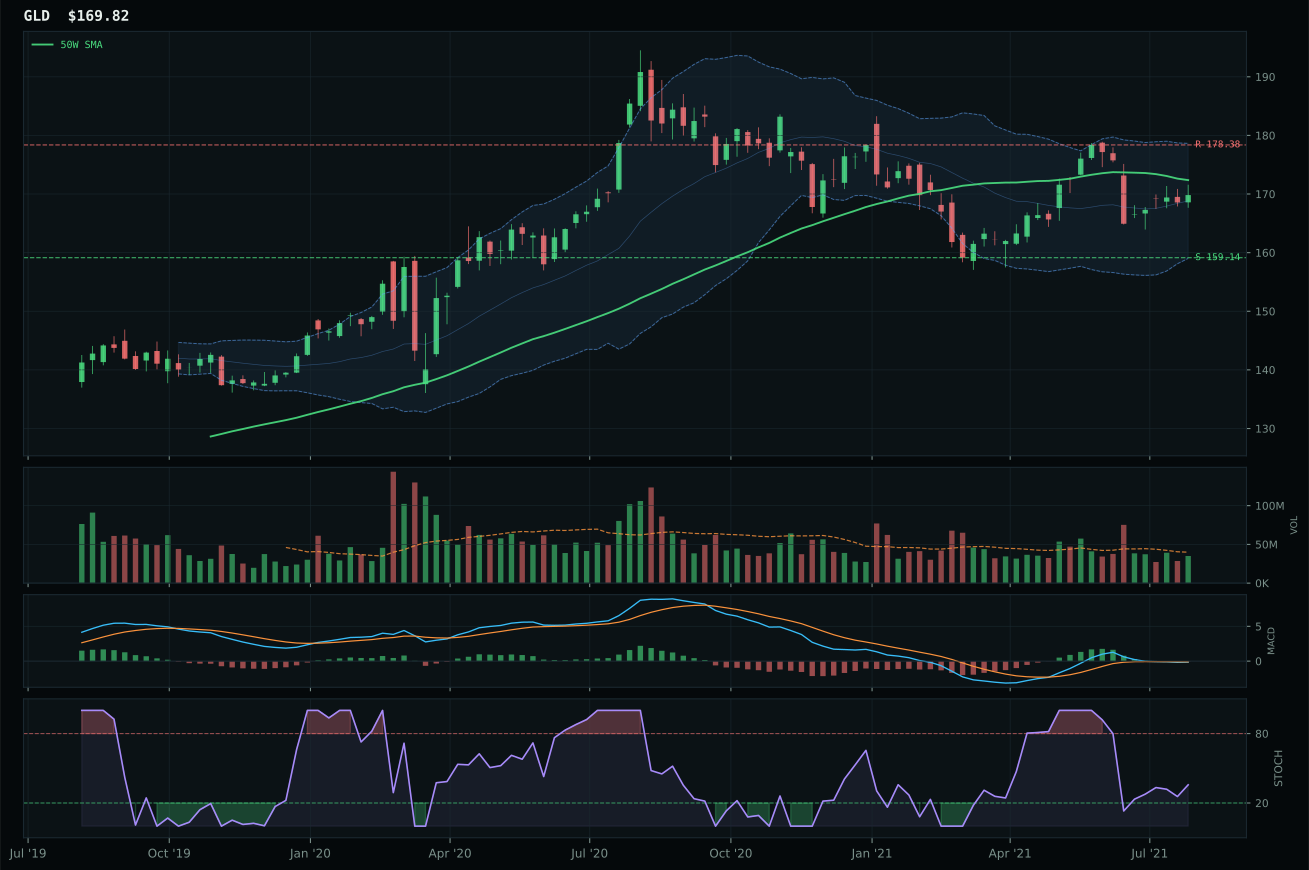
GLD has a compression near 50W profile with -2.6% 13-week relative strength versus SPY.
A failed hold above support would weaken the setup.
Actionable but governed by invalidation levels.
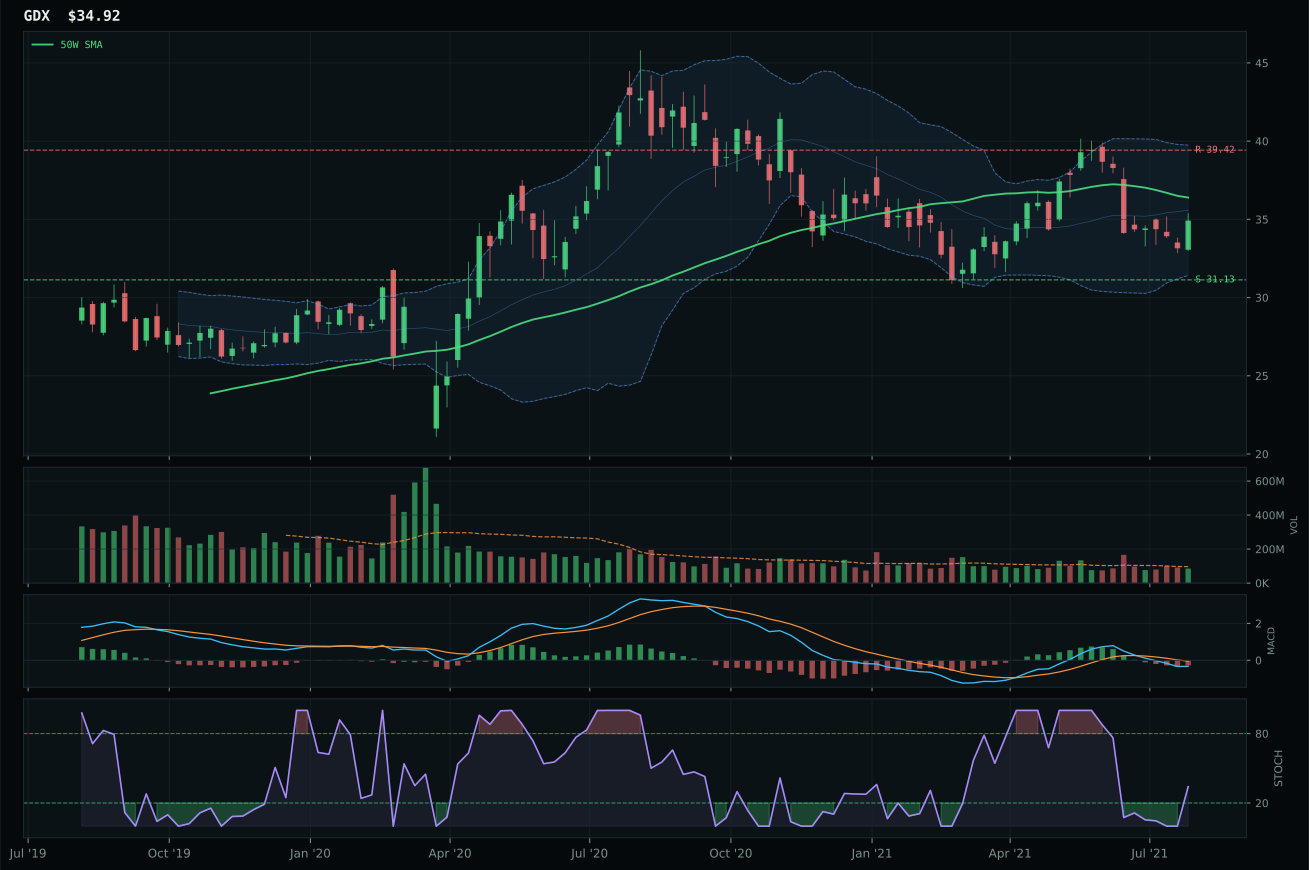
GDX has a neutral structure profile with -3.5% 13-week relative strength versus SPY.
A failed hold above support would weaken the setup.
Actionable but governed by invalidation levels.
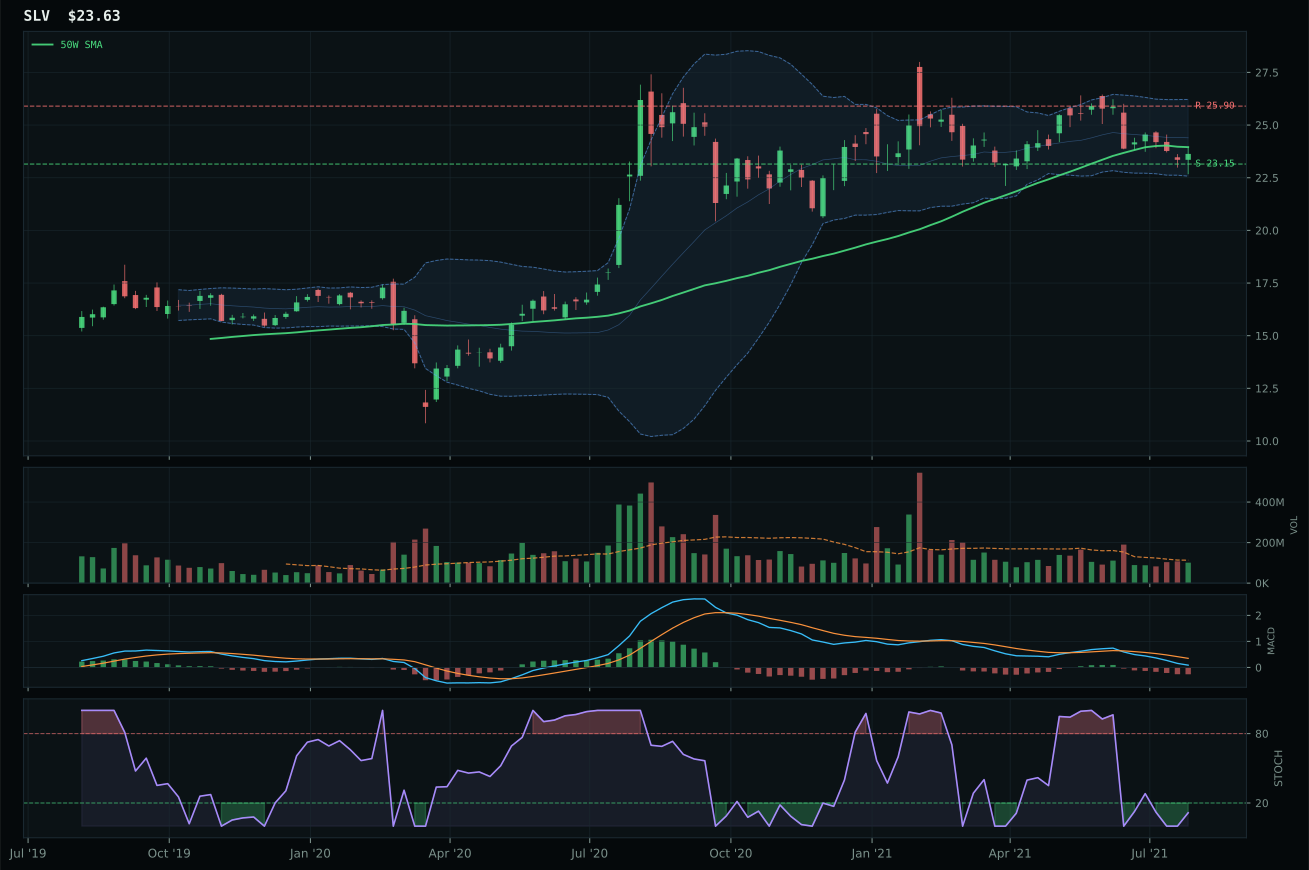
SLV has a pullback into support profile with -6.7% 13-week relative strength versus SPY.
A failed hold above support would weaken the setup.
Actionable but governed by invalidation levels.
GLD wins a category where all three candidates trade below or near the 50W, making mean-reversion timing the dominant scoring factor rather than trend momentum. The 100.0/100 timing score—the highest individual subscore in the category—comes from being only 1.5% below the 50W in a rising mid-zone stochastic RSI setup at the deep retracement / value zone near Fib 0.618, setting up a compression-based expansion pattern if buyers defend support at 159.14. The 78.4/100 structure score reflects 88.1% compression strength, which is tighter than GDX's 70.1%, signaling lower noise and a cleaner coil. GDX lost on risk-reward (61.9 vs 65.9) and structure cleanliness, but also on the margin: a 0.9% category-relative strength edge provided the tiebreaker in a 8.6-point gap, marginal enough to trigger if GDX can establish volume participation above neutral. The 2.5% 13W return and bullish structure create a defensive allocation within a category that benefits more from disinflation (macro fit +8) than risk appetite positive.
Precious Metals earns a 5% tier-2 allocation despite a category score of only 37.6, the lowest among the six tier-2 categories, because macro conditions actively support it: disinflation pressure is +8 and risk appetite positive is -4, creating a net bearish setup for equities that makes gold's non-correlation valuable. The category-level macro fit of 50.0/100 and representative technical evidence of 50.2/100 for GLD create a balanced case driven by defensive utility rather than technical momentum. With Goldilocks conditions in place but equity valuations extended through Technology and Industrial Metals, precious metals serves as a portfolio ballast for what macro theoretically calls a period of disinflation headwinds and compressed real yields. GLD's compression setup near the 50W offers a lower-risk entry point than stretched equities; the 5% position reflects tactical defense rather than conviction growth. To upgrade Precious Metals to top-2, the category would need either a breakdown in equity momentum (triggering risk-off flow into gold) or a sharp move in the stochastic RSI above 0.5 with volume acceleration, proving institutional accumulation rather than just mean-reversion positioning.
Defense & Aerospace — ITA
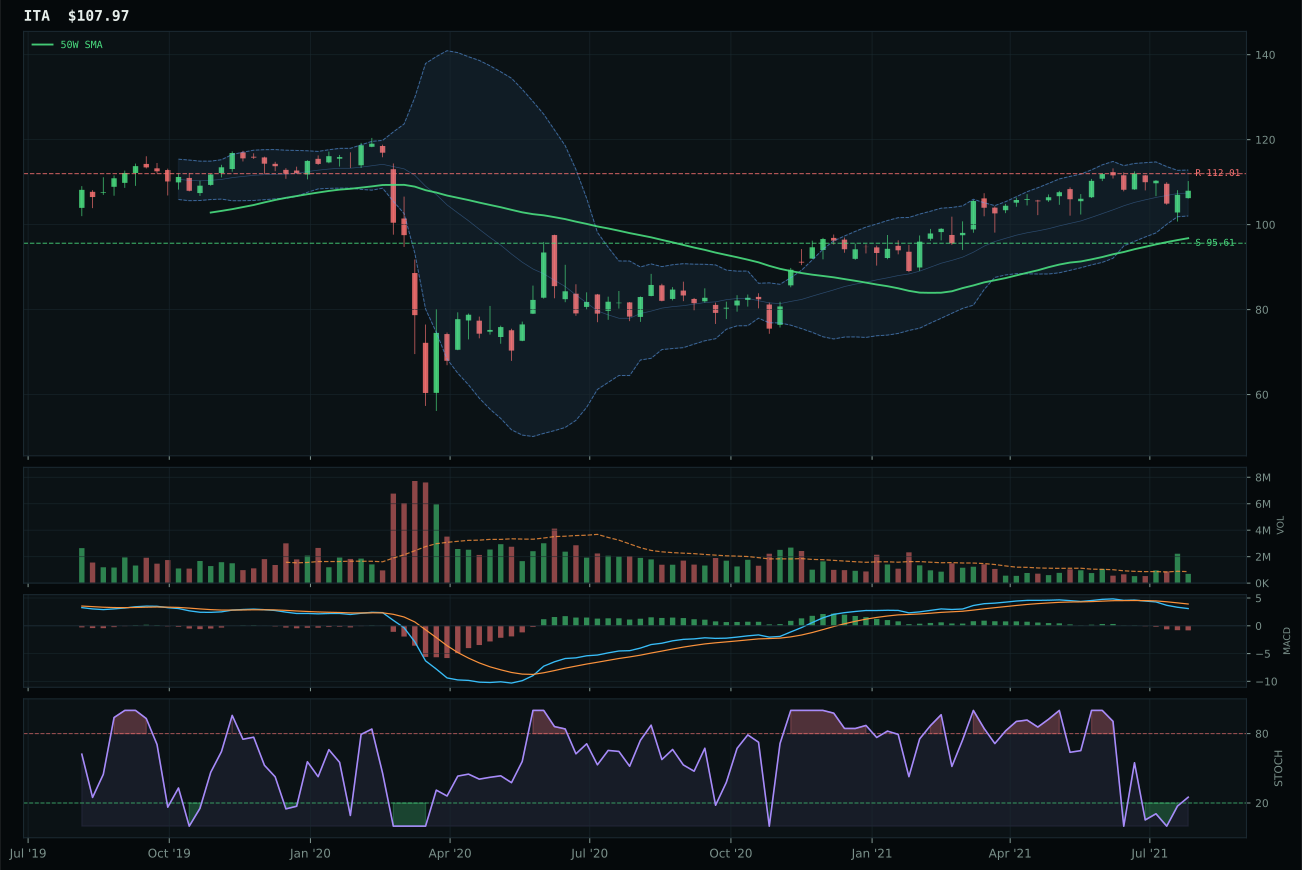
ITA has a neutral structure profile with -3.6% 13-week relative strength versus SPY.
A failed hold above support would weaken the setup.
Actionable but governed by invalidation levels.
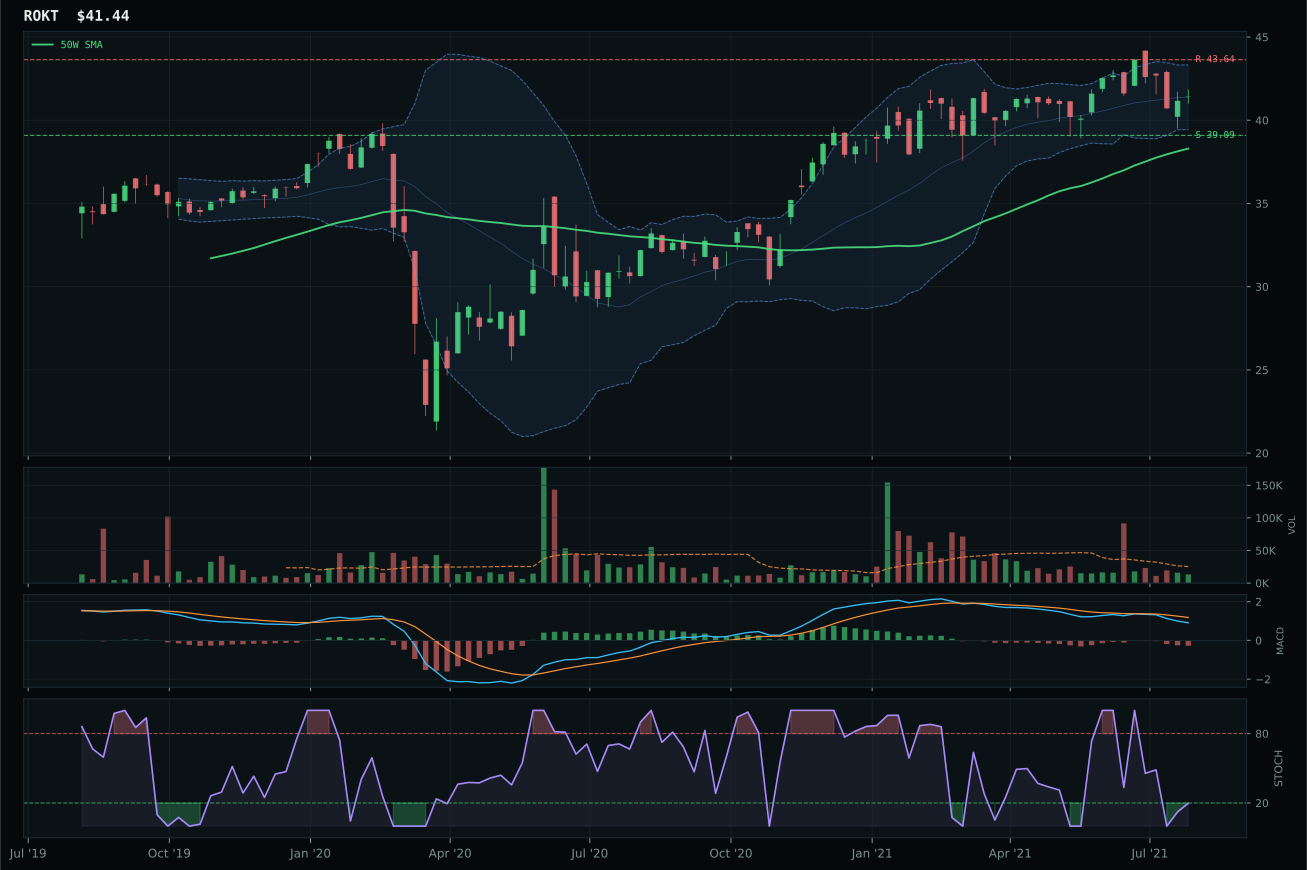
ROKT has a neutral structure profile with -4.1% 13-week relative strength versus SPY.
A failed hold above support would weaken the setup.
Tracked, but not top-2 eligible because: .
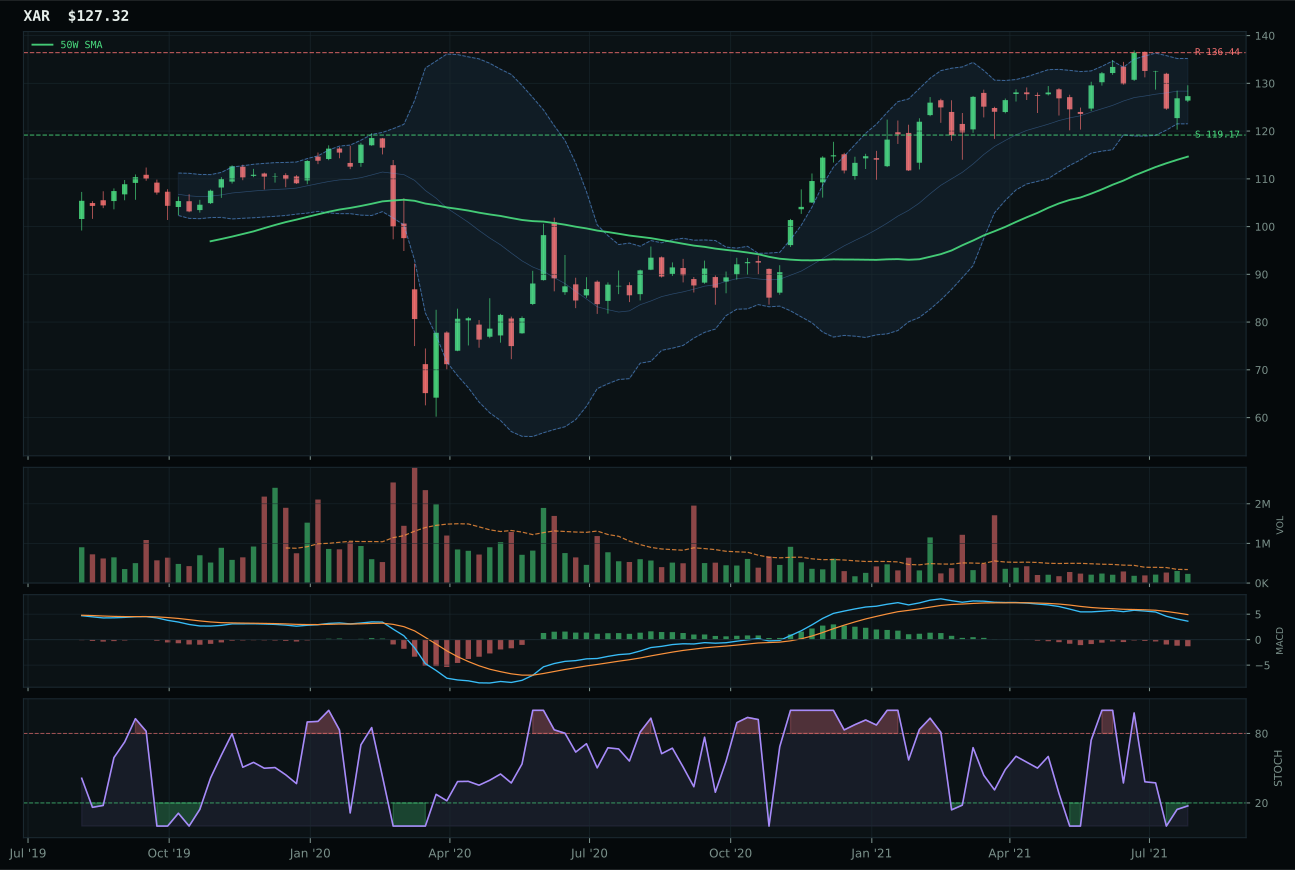
XAR has a neutral structure profile with -5.7% 13-week relative strength versus SPY.
A failed hold above support would weaken the setup.
Actionable but governed by invalidation levels.
ITA wins a crowded middle-tier field by combining a timing score of 78.0/100—driven by price sitting 11.5% from the 50W in a rising mid-zone stochastic RSI setup—with neutral structure that avoids the overextension penalty ROKT and XAR both face. The 50W slope of 0.5% and trend composite of 76.5/100 establish that price is still above both moving averages without being stretched, while the category-relative strength of 0.4% edge past ROKT's 0.0% provides the tiebreaker in a category where momentum confirmation scores range from 28.4% to just 11%. ROKT lost primarily on timing: its oversold stochastic RSI, thin volume participation, and less clean structure (72.8 vs 74.4) create lower confidence in mean-reversion than ITA's rising mid-zone setup. The 27.8-point score gap versus ROKT reflects the category's fundamental weakness—defense beta is neither sponsored by macro conditions nor technically extended—making the winner a relative choice among weak setups.
Defense & Aerospace earns a 5% tier-2 allocation despite a final category score of only 36.4, ranked among the middle tier where the allocation framework places tiers 3–8 at 5% each. The category's low macro fit of 55.0/100 and weaker-than-neutral technical evidence of 45.5/100 for the representative mean both neutral support and mild headwinds from active descriptors: credit stress provides a +2 boost, but the Goldilocks regime and broader risk appetite do not specifically favor defense durability when more cyclical sectors like industrial metals and technology offer higher momentum returns. ITA's 1.4% 13W return and -3.6% SPY-relative strength reflect a sector in consolidation rather than growth, held primarily by macroeconomic safety arguments rather than technical sponsorship. The 5% allocation honors tier positioning; tier-2 categories would exit entirely if one of the six tier-2 positions needed to reallocate upward, but this week's score hierarchy keeps defense in the portfolio at minimum conviction.
Nuclear Energy — URNM
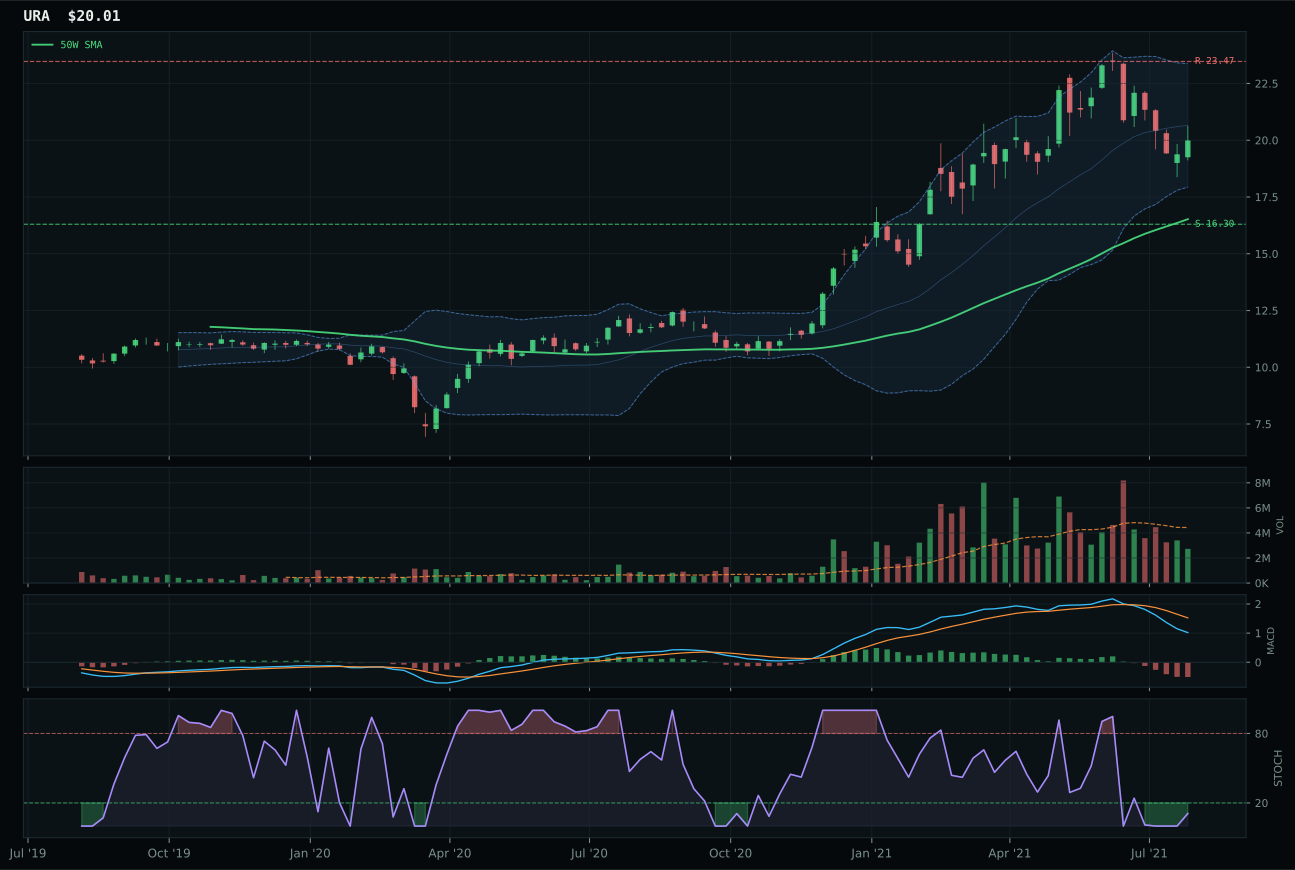
URA has a vertical extension profile with -3.0% 13-week relative strength versus SPY.
A failed hold above support would weaken the setup.
Actionable but governed by invalidation levels.
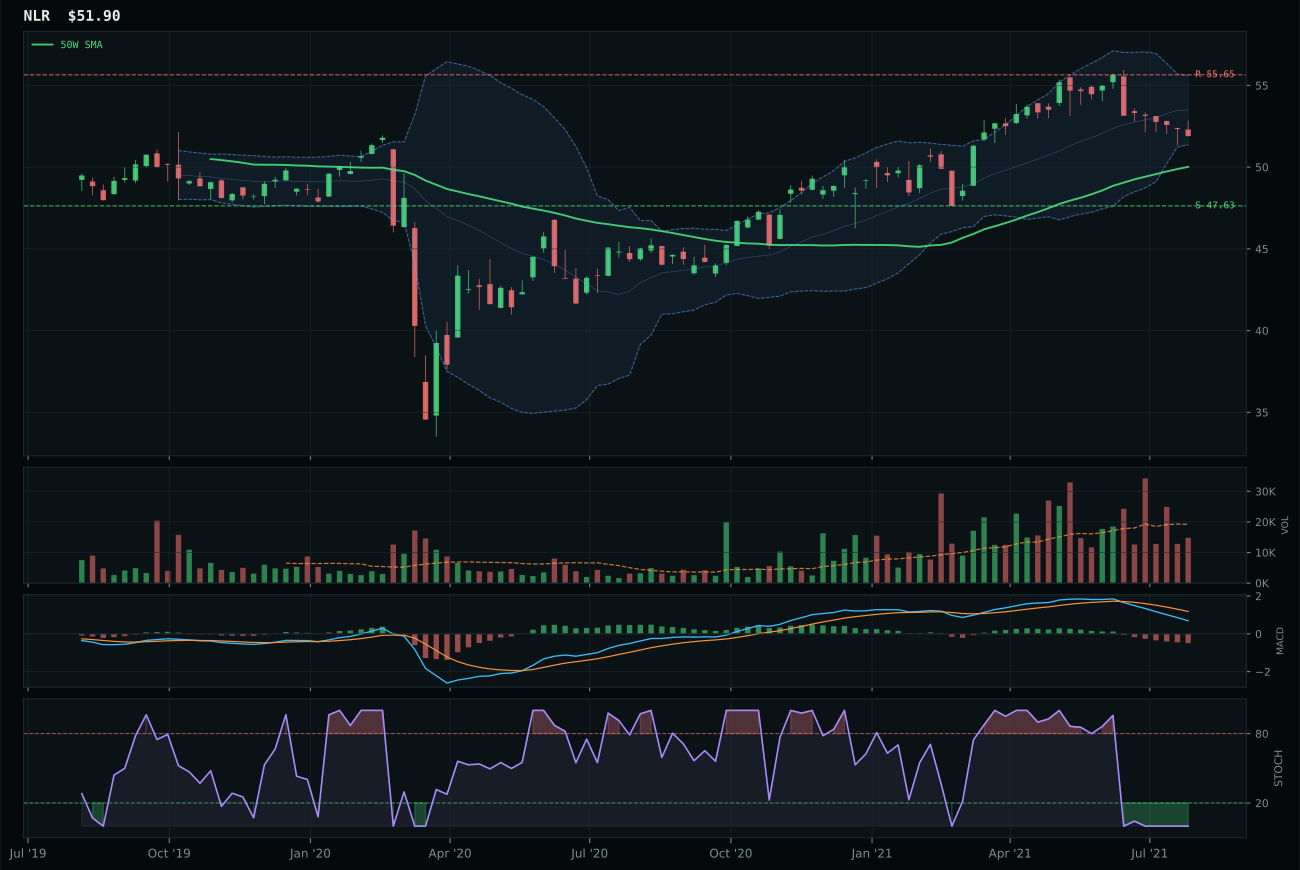
NLR has a neutral structure profile with -8.1% 13-week relative strength versus SPY.
A failed hold above support would weaken the setup.
Tracked, but not top-2 eligible because: .
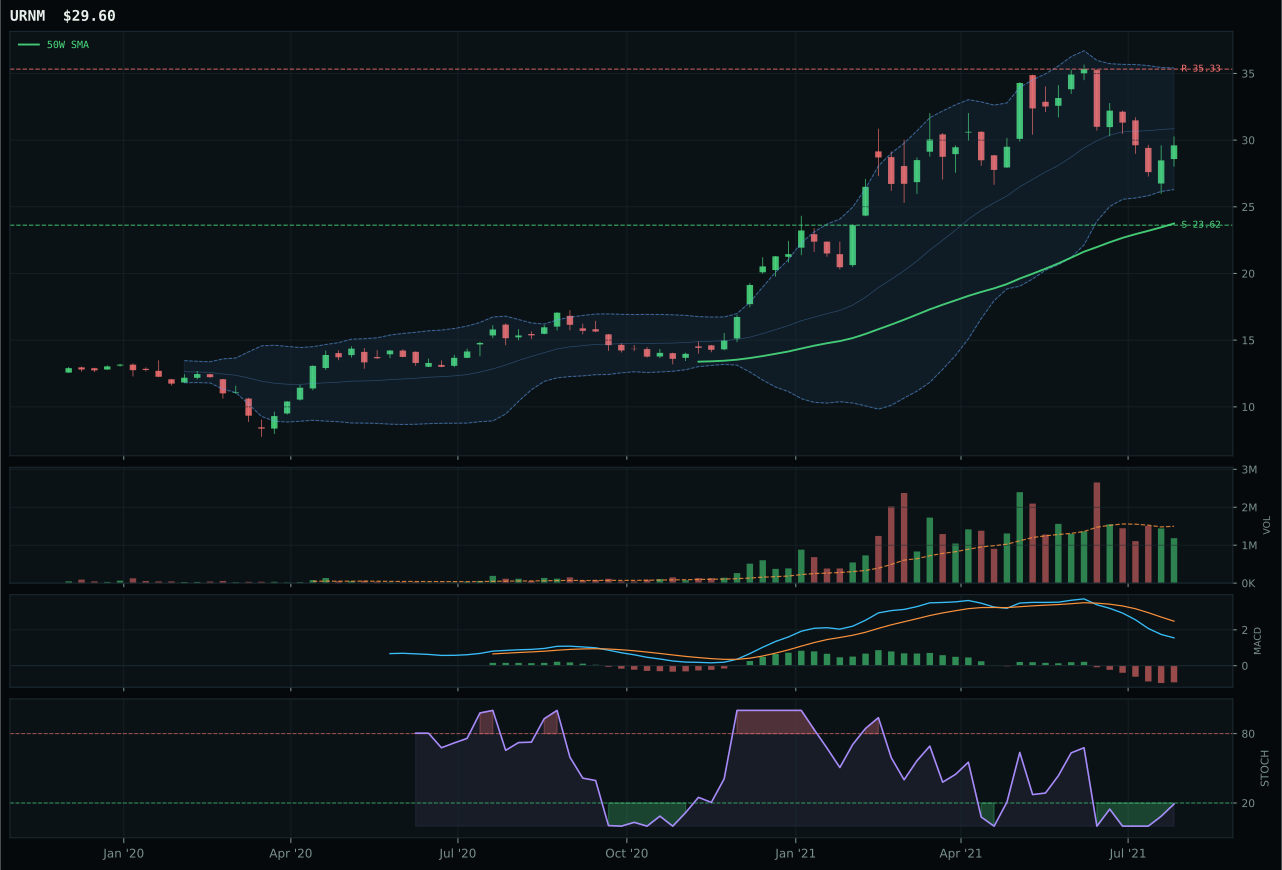
URNM has a vertical extension profile with -4.7% 13-week relative strength versus SPY.
A failed hold above support would weaken the setup.
Actionable but governed by invalidation levels.
URNM wins by the narrowest margin in the portfolio: just 3.0 points separate it from runner-up URA in the reasoned ETF proof order, reflecting a category where all three candidates score in the 31–37 range with none commanding conviction. URNM's vertical extension at 24.7% above the 50W would normally disqualify an entry point, but the stochastic RSI oversold turn-up at 0.19 creates the mechanical setup to own the category's best-positioned candidate despite bearish/weakening MACD. The structure score of 68.3/100 exceeds URA's 65.3%, providing the tiebreaker in a category where timing is neutral (62.0/100 vs 62.0/100) and momentum confirmation is weak across the board (23.5% for the winner). URA's thin volume participation further penalizes it versus URNM's neutral participation, a marginal distinction in a category where above-average participation is absent from all candidates. The -4.7% SPY-relative strength and 0.4% 13W return confirm that nuclear energy is neither technically strong nor macro-driven; ownership is justified only by real asset sponsorship and a stochastic RSI turn-up that may signal capitulation buying.
Nuclear Energy earns a 5% tier-2 allocation at a 35.7 final score, ranking it sixth among tier-2 categories just above Precious Metals at 37.6. The category-level macro fit of 57.0/100 is supported by real asset sponsorship (+7), AI growth sponsorship (+5), and credit stress (-5), providing modest structural tailwinds in a Goldilocks regime that does not actively sponsor energy or commodities. URNM's technical evidence of 19.9/100 is the weakest among all representatives, reflecting a setup where price is below both moving averages, momentum confirmation scores only 23.5/100, and the stochastic RSI turn-up represents desperation-driven mean reversion rather than institutional accumulation. The 5% allocation honors the tier-2 framework but represents minimum conviction: Nuclear would exit allocation entirely if any tier-2 category needed to be demoted to zero, as its macro support remains tangential to the Goldilocks regime. For Nuclear to upgrade to a higher tier, URNM would need to establish support near 23.62 with volume participation above neutral while the trend composite improves, requiring price to recapture the 50W alongside renewed momentum. Current allocation reflects a hedge against deflationary assumptions, not a growth thesis.
Agriculture & Livestock — WEAT
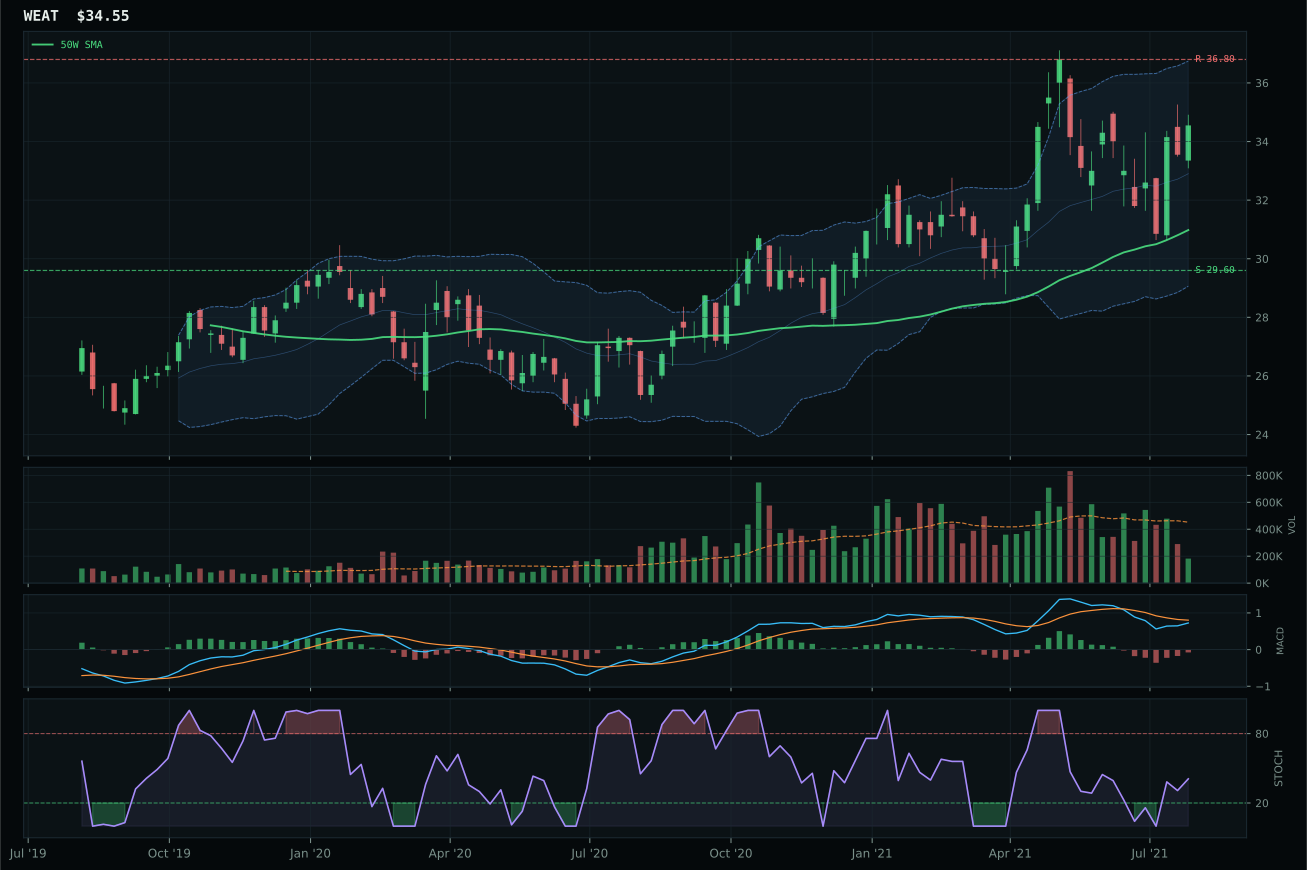
WEAT has a neutral structure profile with -7.8% 13-week relative strength versus SPY.
A failed hold above support would weaken the setup.
Actionable but governed by invalidation levels.
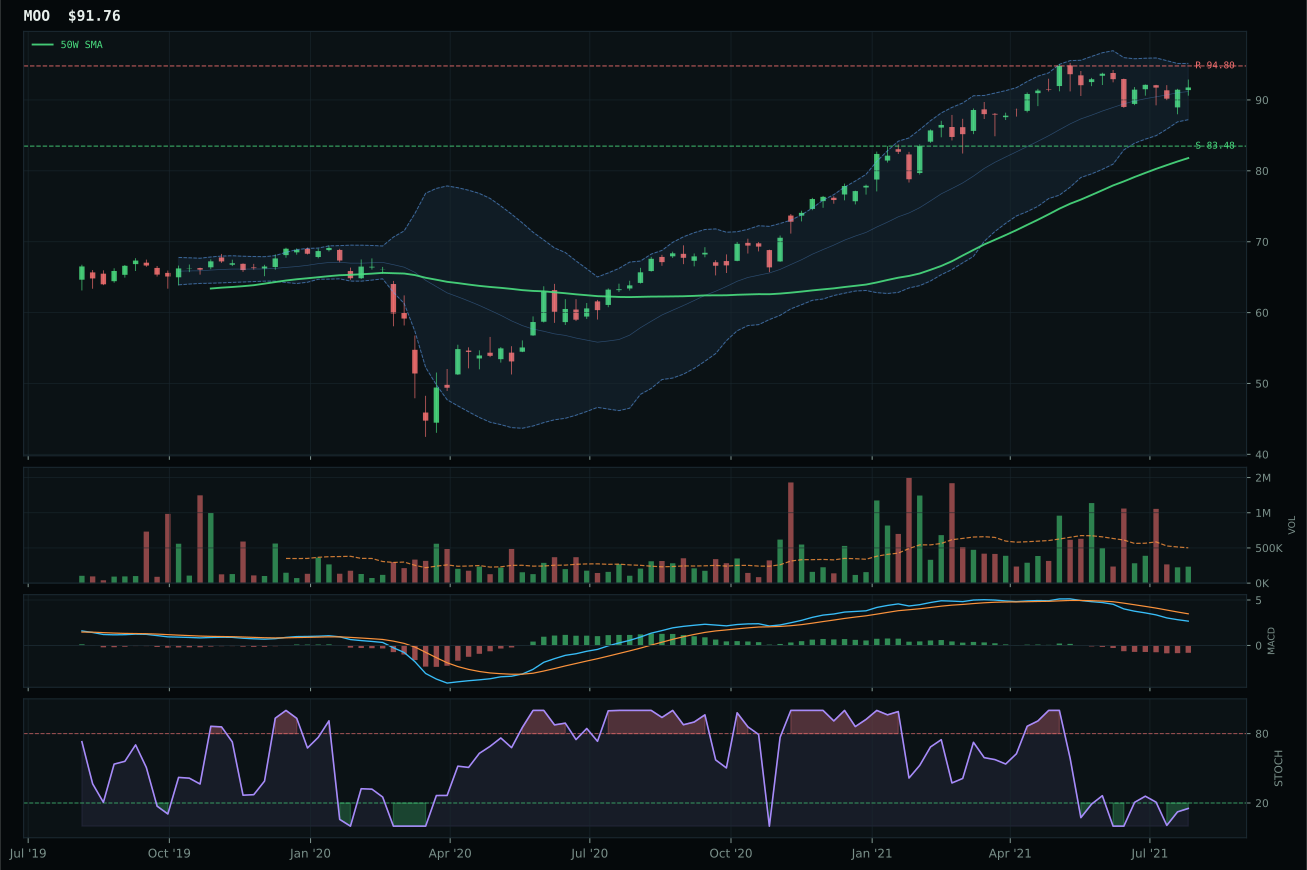
MOO has a neutral structure profile with -4.7% 13-week relative strength versus SPY.
A failed hold above support would weaken the setup.
Actionable but governed by invalidation levels.
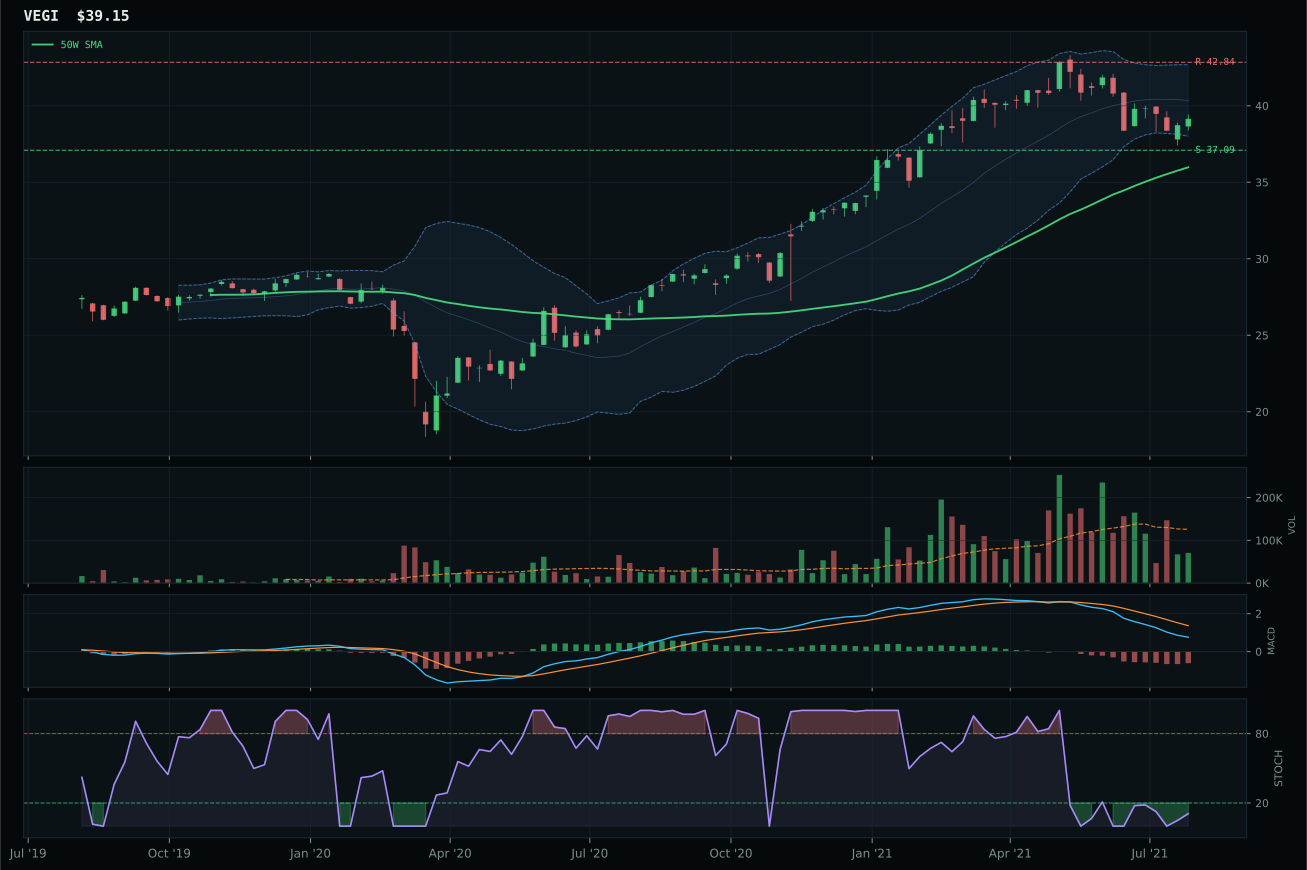
VEGI has a neutral structure profile with -9.2% 13-week relative strength versus SPY.
A failed hold above support would weaken the setup.
Tracked, but not top-2 eligible because: .
WEAT wins the excluded category on technical merit despite a weak macro setup and -7.8% SPY-relative strength that would normally disqualify the entire category from allocation. The timing score of 83.0/100—the second-highest component score across the entire portfolio—comes from price sitting 11.5% from the 50W in an upper retracement zone with MACD bearish but improving and stochastic RSI rising mid-zone, creating a textbook mean-reversion setup if support holds. The 81.4% trend composite from price above the 200W with a 0.6% 50W slope provides structural confidence, while the 4.7-point score gap versus MOO reflects superior timing mechanics. MOO's oversold stochastic RSI and weakening MACD create lower confidence in reversal timing, while its 70.0 timing score—despite better SPY-relative performance at -4.7%—penalizes worse technical setup. Structure remains neutral and volume is thin at 0.40x participation, which constraints the overall category score to 28.4.
Agriculture & Livestock receives 0% allocation this week, ranked 9th or 10th depending on how the category competes against the tenth category tier. The final score of 28.4 reflects a macro environment where real asset sponsorship and commodity breadth positive both support exposure, but disinflation pressure—active and -8 points—directly penalizes agricultural demand expectations in a Goldilocks regime that favors technology and industrial metals growth over food-commodity hedges. Category-level macro fit sits at 55.0/100, and representative technical evidence at 53.2/100 for WEAT is well below the threshold for allocation consideration when other categories offer stronger risk-adjusted returns. The tier-2 categories (Utilities, Precious Metals, Nuclear, Emerging Markets, AI, Defense) all score higher than 35.7, creating a natural exclusion line. For Agriculture to earn a 5% tier-2 slot, either WEAT would need to consolidate closer to support (reducing distance to the 50W from 11.5%) to improve timing without sacrificing trend, or macro conditions would need to shift away from disinflation toward stagflationary fears where commodity demand accelerates.
Traditional Energy — XLE
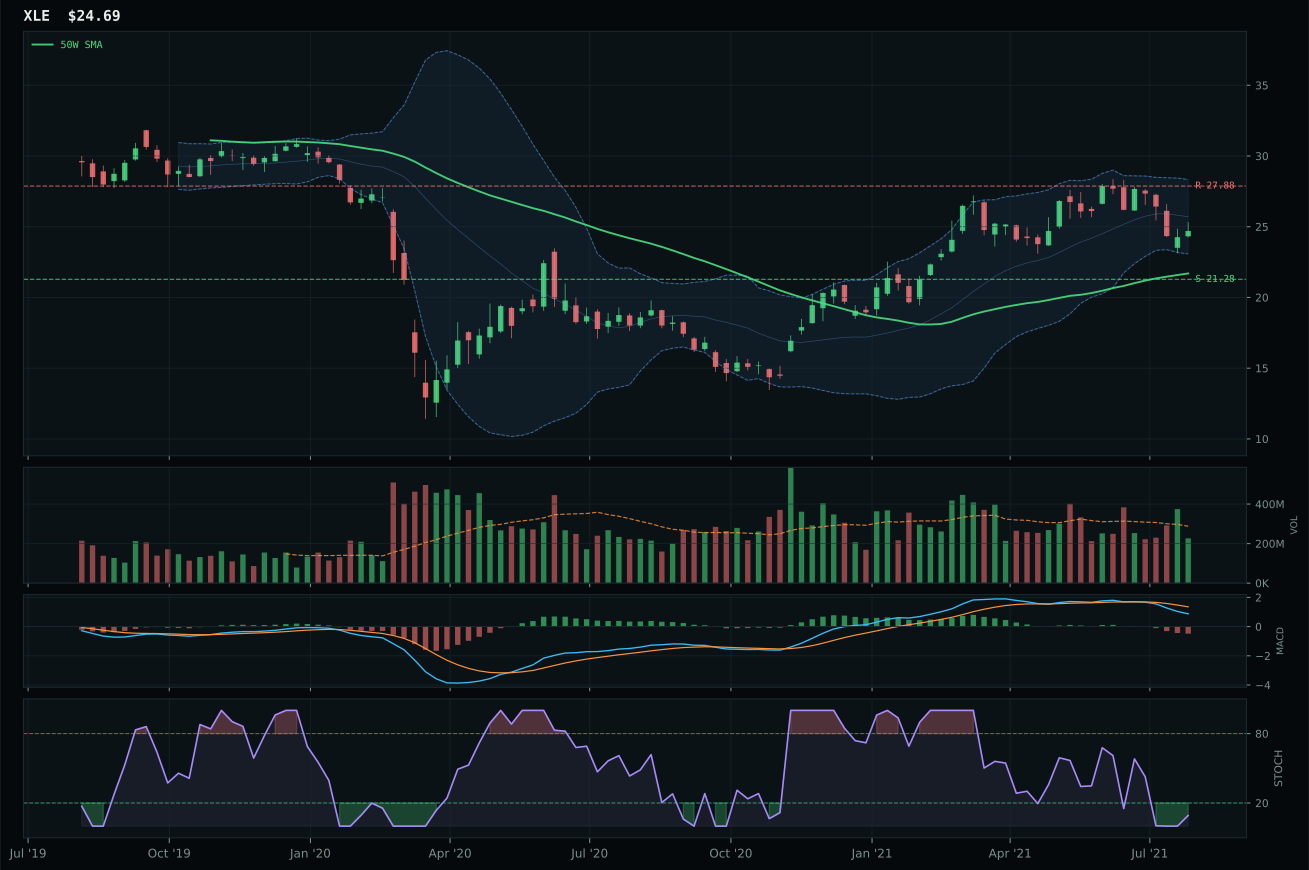
XLE has a neutral structure profile with -5.1% 13-week relative strength versus SPY.
A failed hold above support would weaken the setup.
Actionable but governed by invalidation levels.
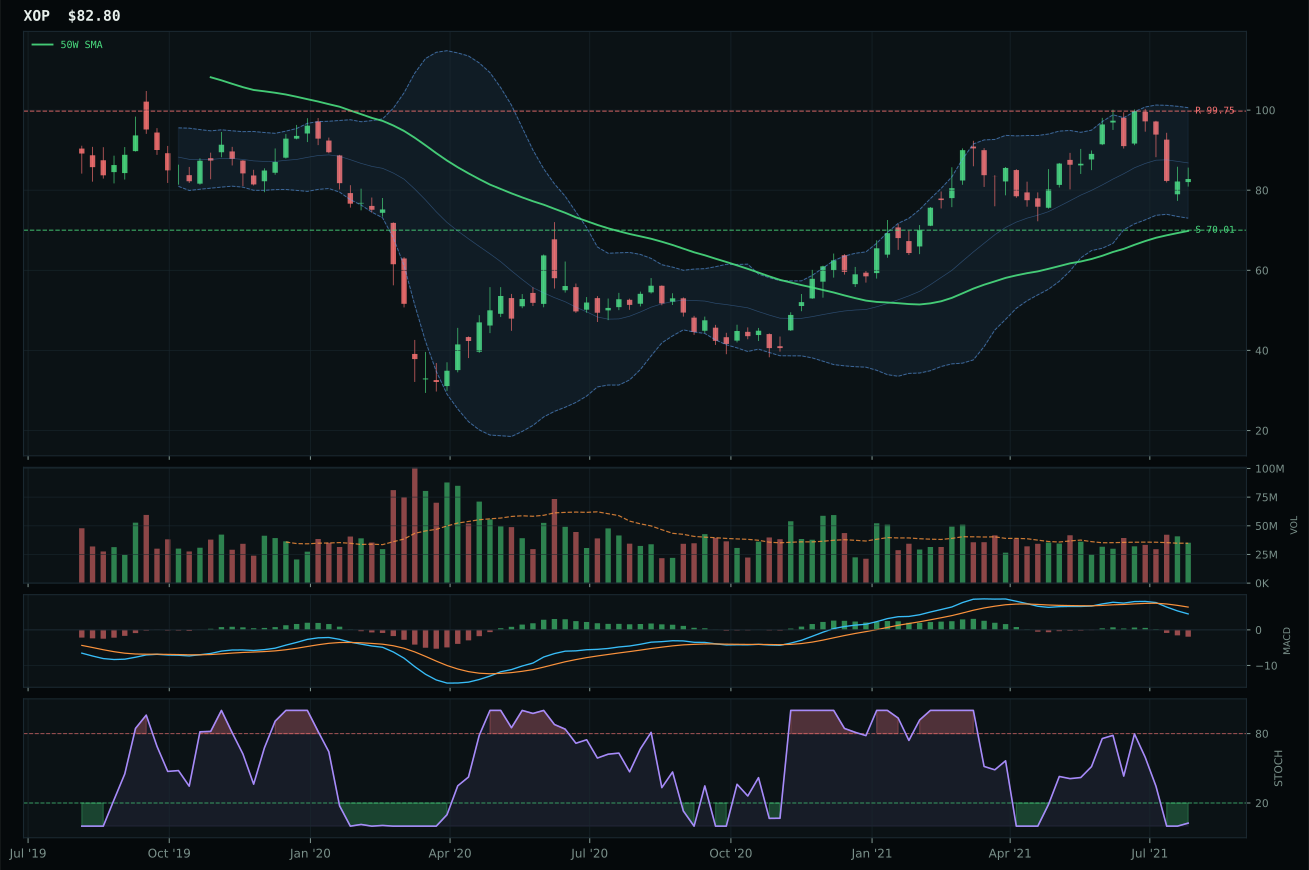
XOP has a vertical extension profile with -1.8% 13-week relative strength versus SPY.
A failed hold above support would weaken the setup.
Actionable but governed by invalidation levels.
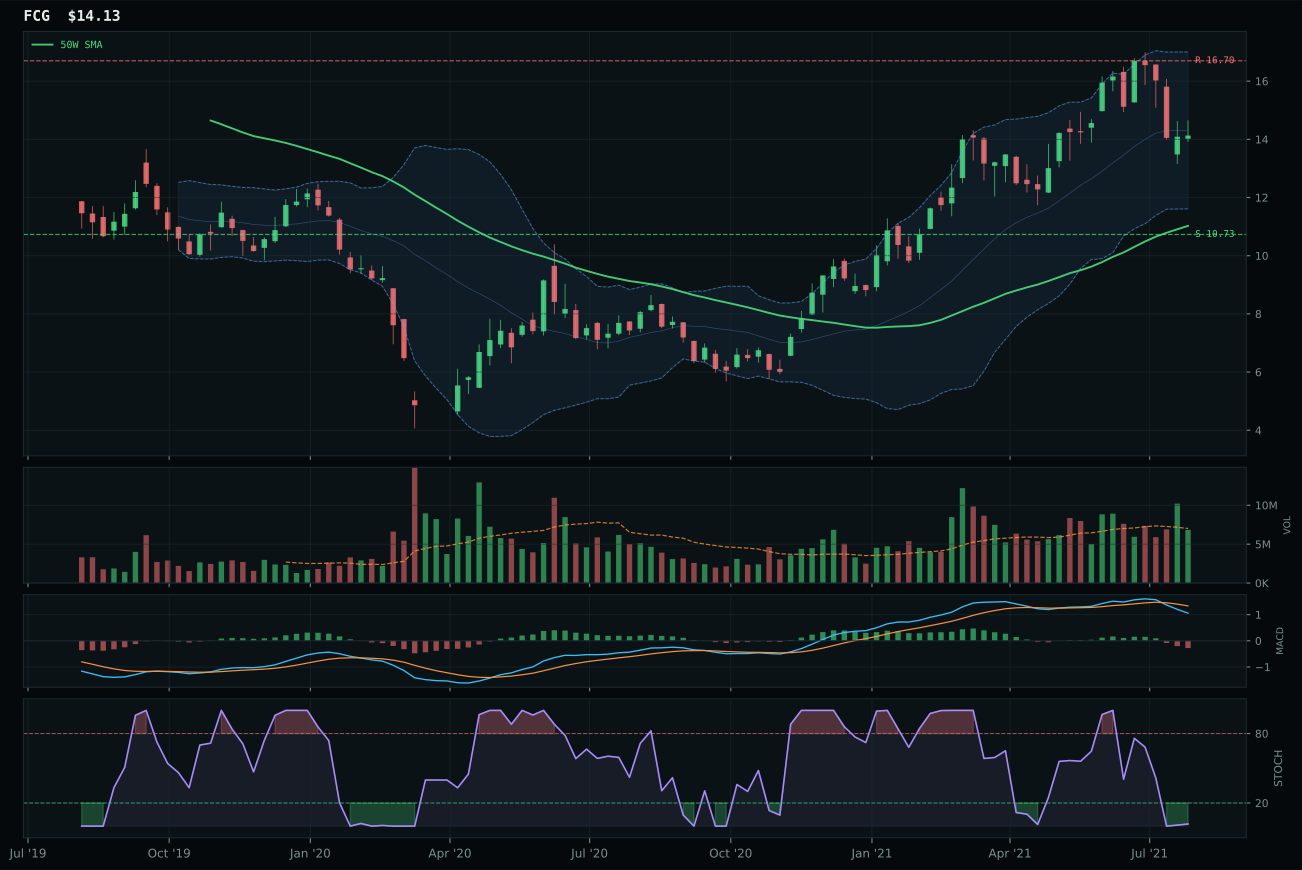
FCG has a vertical extension profile with 3.5% 13-week relative strength versus SPY.
A failed hold above support would weaken the setup.
Actionable but governed by invalidation levels.
XLE wins a deeply troubled category by default: all three candidates score below 32.0/100 in technical evidence, with XLE's 26.9/100 representing the least-damaged setup. The 84.0/100 timing score comes from price sitting 13.8% above the 50W with a stochastic RSI oversold turn-up at 0.09, creating the mechanical appearance of mean-reversion without the supporting momentum—the 13W return is exactly 0.0%, confirming that energy has gone nowhere in thirteen weeks despite a 25.6% 26W return that now appears to be a bear-trap reversal. XOP lost on timing (48.0 vs 84.0) because it sits in an oversold state without the turn-up confirmation, while its vertical extension setup creates further entry risk when the trend is already broken. XLE's -5.1% SPY-relative strength and neutral volume participation reflect institutional abandonment of energy in a risk-on regime, while the MACD bearish/weakening condition indicates no structural support below. The 12.2-point score gap versus XOP is decisive only because XLE's oversold turn-up signal provides a technical excuse to own the category's best-positioned candidate.
Traditional Energy receives 0% allocation this week, ranked as the bottom tier of the ten categories at a 18.1 final score. The category-level macro fit of 40.0/100 is disqualifying: disinflation pressure is -10, credit stress is -7, and real asset sponsorship provides only +7, creating a net 10-point macro headwind in a Goldilocks regime that favors technology and scarcity themes over commodity demand recovery. XLE's technical evidence of 26.9/100 is the weakest representative score in the portfolio, reflecting a 0.0% 13W return that suggests energy's recent 26W rally was a bear trap into distribution, not institutional accumulation. The category's macro fit of 40.0 and technical evidence averaging below 30/100 create a hard floor at zero allocation: capital must flow to the tier-2 categories ranked 5–8 before energy can reclaim a portfolio slot. For Traditional Energy to earn a 5% tier-2 position, XLE would need to break above 27.88 resistance with volume above 1.0x average participation while commodity breadth positive remains active; absent that dual confirmation, energy remains structurally weak in a deflationary Goldilocks regime.