
2021-07-23
Informational purposes only. The content in this report, including allocations, analysis, and commentary, is provided solely for informational and educational purposes. It does not constitute financial advice, investment advice, trading advice, or any other type of advice. Past performance does not guarantee future results. Always conduct your own research and consult a qualified financial professional before making investment decisions.
Weekly Allocation
| Ticker | Category | Weight | Role |
|---|---|---|---|
| FBTC | 50% | Overlay | |
| XLK | Technology | 10% | Top-2 (10%) |
| COPX | Industrial Metals | 10% | Top-2 (10%) |
| SMH | AI | 5% | Tier-2 (5%) |
| XLU | Utilities & Infrastructure | 5% | Tier-2 (5%) |
| GLD | Precious Metals | 5% | Tier-2 (5%) |
| ITA | Defense & Aerospace | 5% | Tier-2 (5%) |
| URNM | Nuclear Energy | 5% | Tier-2 (5%) |
| WEAT | Agriculture & Livestock | 5% | Tier-2 (5%) |
Trade Instructions — Monday Open
Sell the tranche from 2021-06-25 (completing its 4-week hold). Buy the new tranche. Instructions show net portfolio changes — same-asset positions cancel, weight changes show the delta.
| Action | Ticker | Instruction |
|---|---|---|
| SELL | FSOL | Sell 33% of FSOL position (reduce 37.50% → 25.00%) |
| SELL | FCG | Sell 33% of FCG position (reduce 7.50% → 5.00%) |
| SELL | ILF | Sell entire ILF position (2.50% of portfolio) |
| SELL | IGV | Sell 33% of IGV position (reduce 3.75% → 2.50%) |
| SELL | REMX | Sell 50% of REMX position (reduce 2.50% → 1.25%) |
| SELL | SLV | Sell 33% of SLV position (reduce 3.75% → 2.50%) |
| SELL | XAR | Sell 50% of XAR position (reduce 2.50% → 1.25%) |
| SELL | MOO | Sell 50% of MOO position (reduce 2.50% → 1.25%) |
| BUY | COPX | Buy COPX — 10.53% of freed cash (adds 2.50% to portfolio) |
| BUY | XLK | Buy XLK — 10.53% of freed cash (adds 2.50% to portfolio) |
| BUY | SMH | Buy SMH — 5.26% of freed cash (adds 1.25% to portfolio) |
| BUY | ITA | Buy ITA — 5.26% of freed cash (adds 1.25% to portfolio) |
| BUY | FBTC | Buy FBTC — 52.63% of freed cash (adds 12.50% to portfolio) |
| BUY | GLD | Buy GLD — 5.26% of freed cash (adds 1.25% to portfolio) |
| BUY | WEAT | Buy WEAT — 5.26% of freed cash (adds 1.25% to portfolio) |
| BUY | URNM | Buy URNM — 5.26% of freed cash (adds 1.25% to portfolio) |
Current Portfolio After Trade
Combined holdings across all 4 active tranches. Each tranche is 25% of the portfolio.
| Ticker | % of Portfolio | Weight Bar |
|---|---|---|
| FSOL | 25.00% | |
| FBTC | 25.00% | |
| XLK | 7.50% | |
| FCG | 5.00% | |
| XLU | 5.00% | |
| COPX | 5.00% | |
| INDA | 5.00% | |
| SMH | 3.75% | |
| ITA | 3.75% | |
| IGV | 2.50% | |
| SLV | 2.50% | |
| GLD | 2.50% | |
| WEAT | 2.50% | |
| REMX | 1.25% | |
| XAR | 1.25% | |
| MOO | 1.25% | |
| URNM | 1.25% |
Macro Regime — Goldilocks
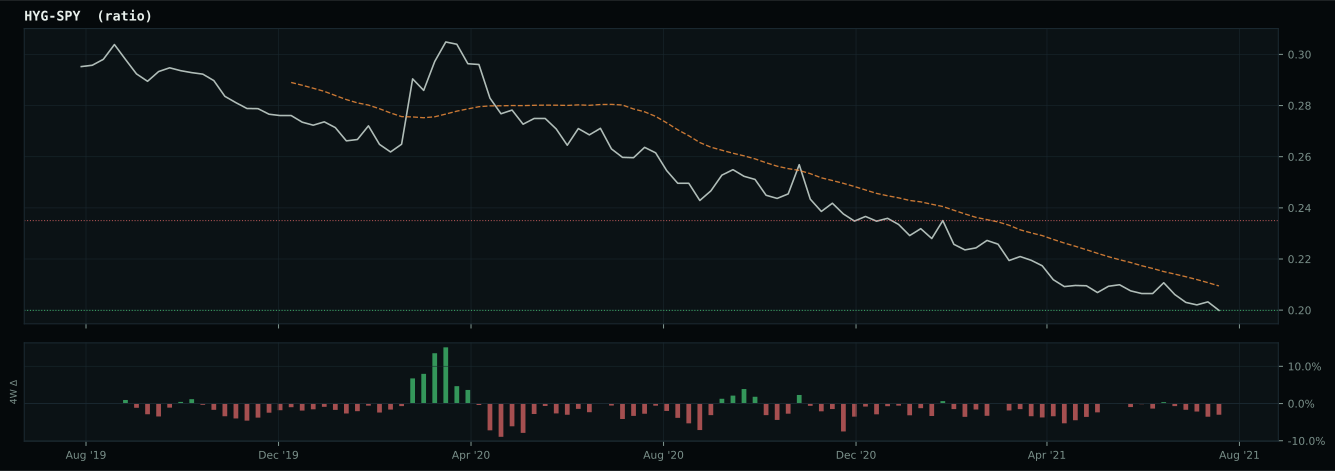
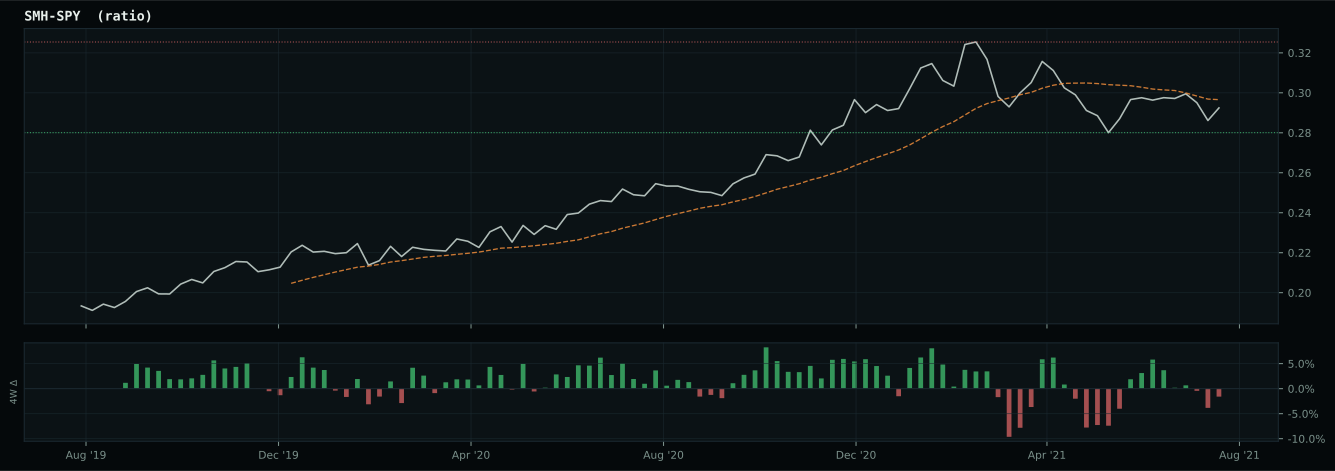
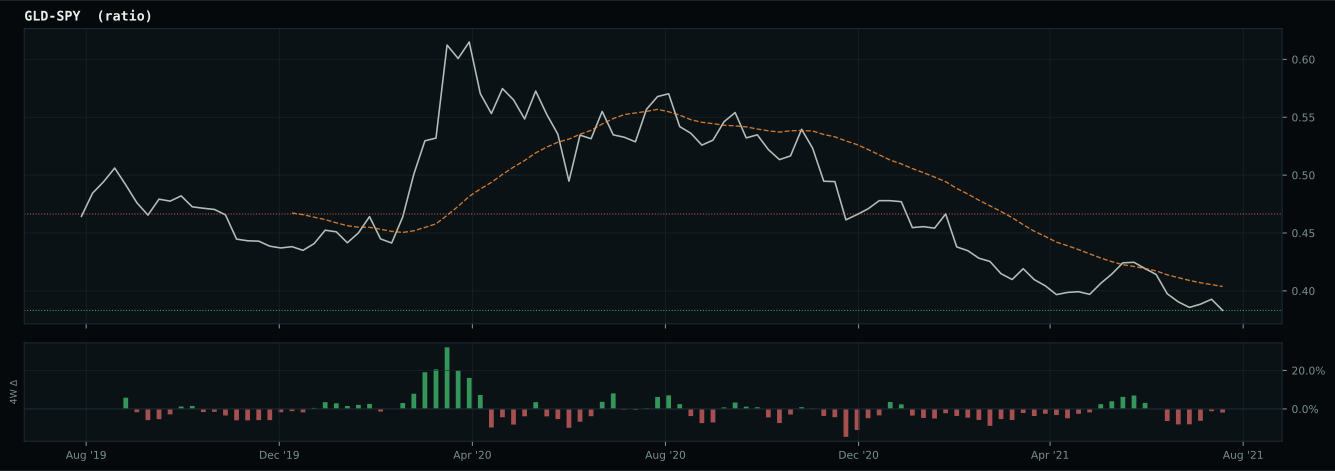
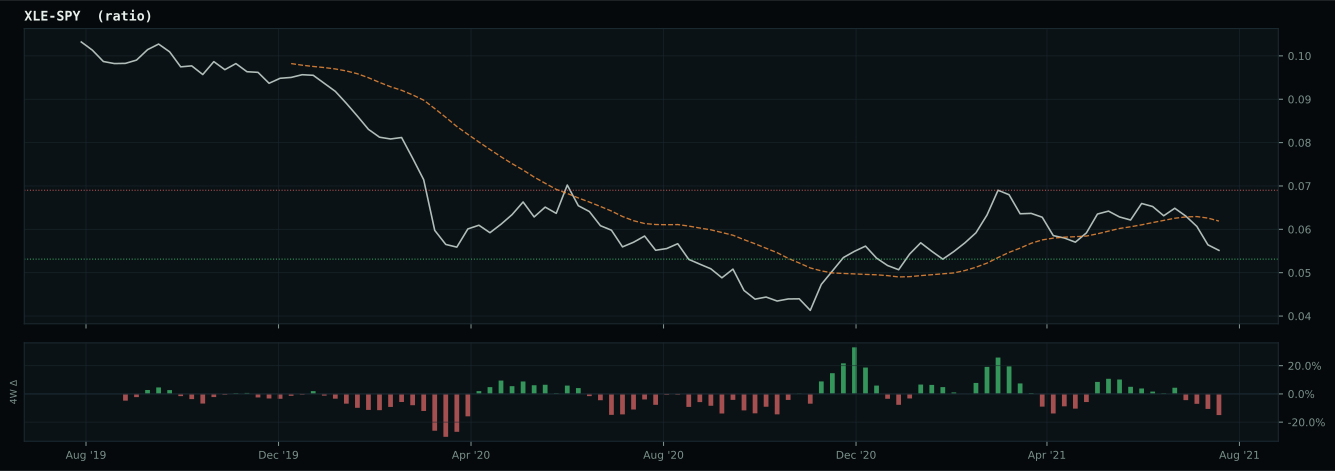
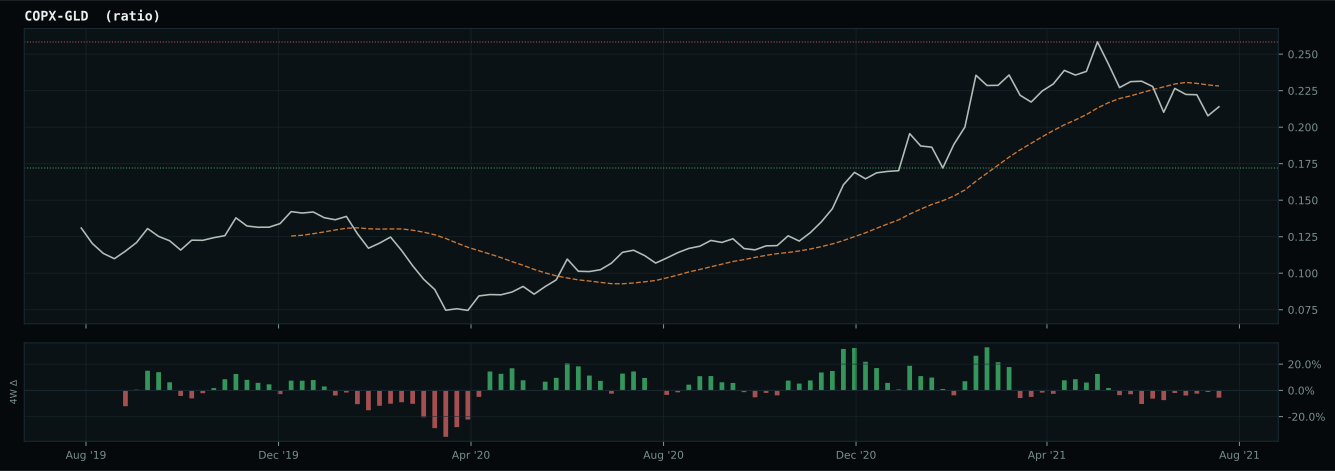
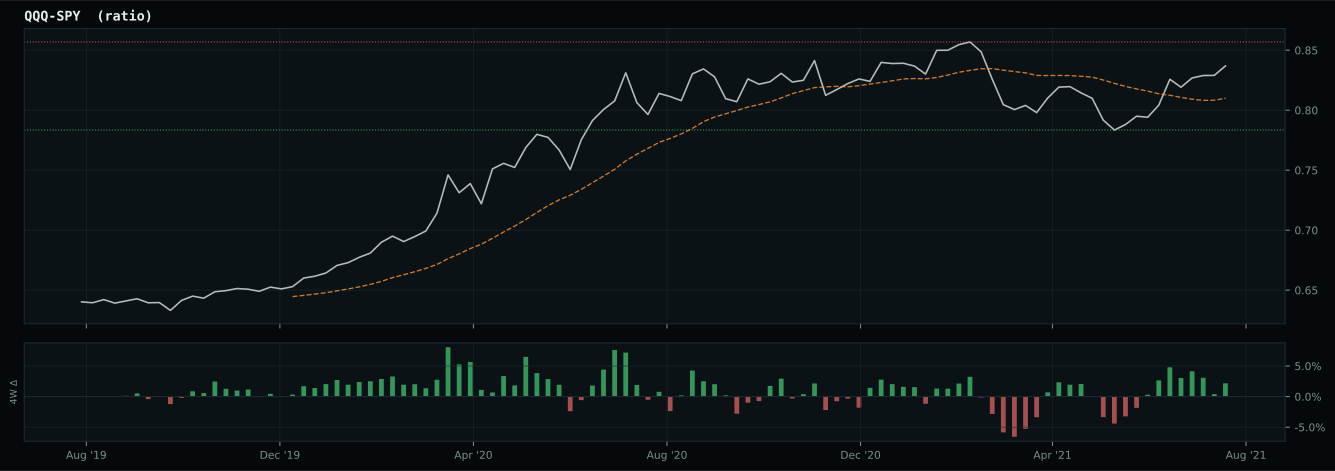
Macro Evidence Charts
Market-implied signals behind the macro regime scores. Each ratio compares two assets; the direction and slope of the ratio is what the macro engine reads.
Crypto Regime — TrendBTC
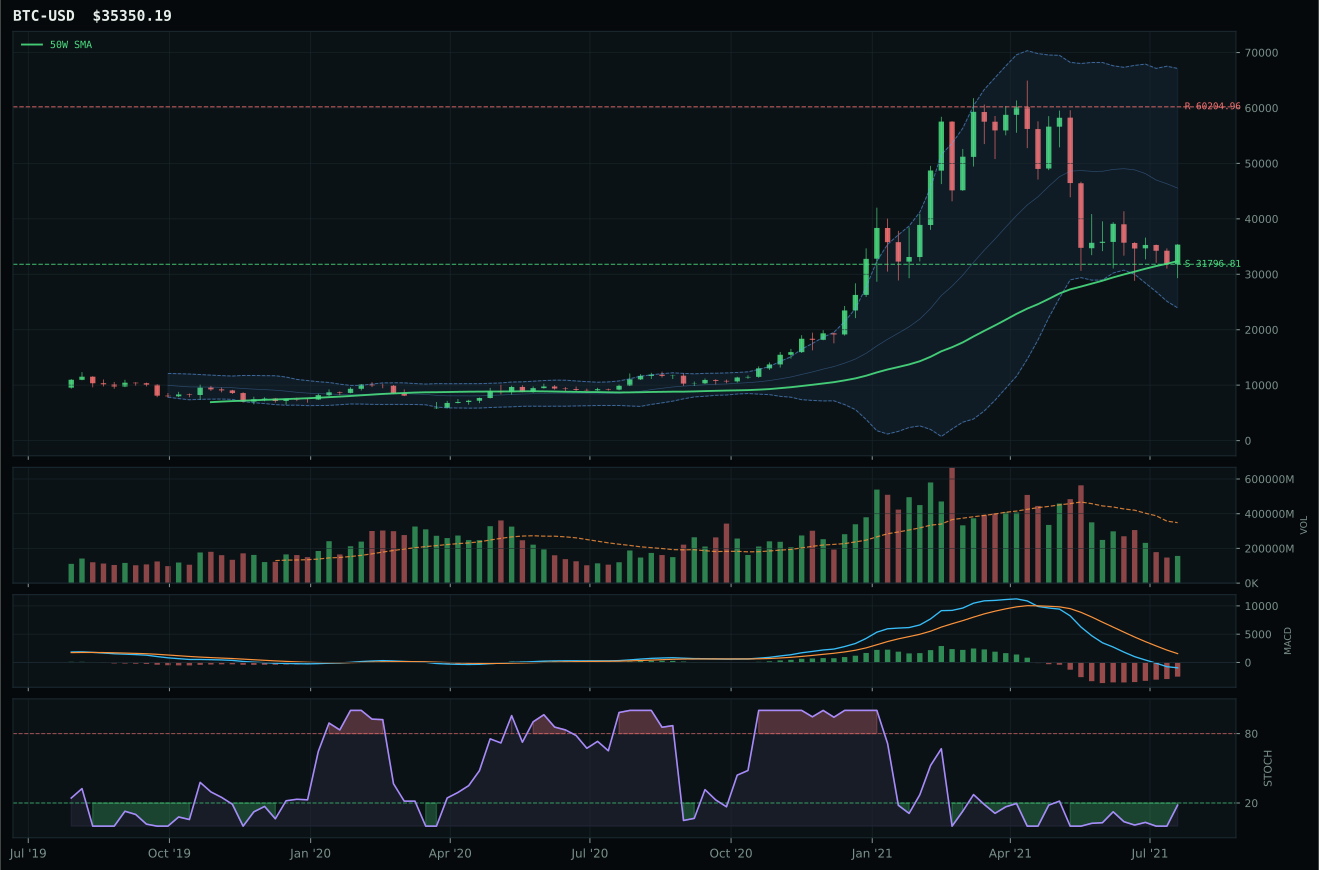
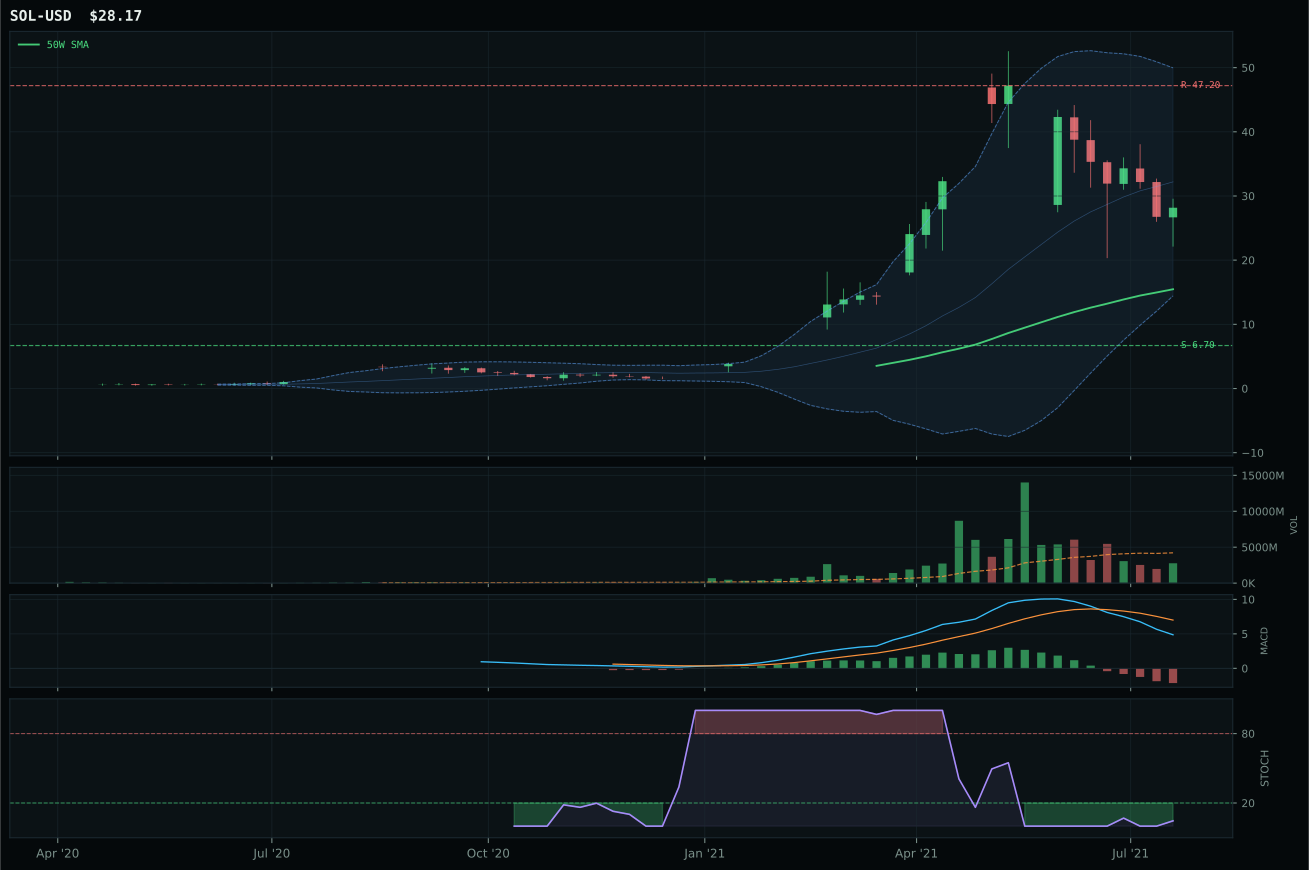
ValueBTC not armed: BTC has not made the first post-breakdown touch of the 200W buy zone after losing the 50W
TrendBTC not confirmed
one or more available conditions failed
Category Rankings
| Rank | Category | Winner | Score | Alloc | 4W Ret | Peers (4W) |
|---|---|---|---|---|---|---|
| 1 | Technology | XLK | 66.8 | 20% | +1.31% | CIBR -1.6% · IGV +0.9% |
| 2 | Industrial Metals | COPX | 45.2 | 20% | -6.73% | REMX +3.2% · PICK -6.7% |
| 3 | AI | SMH | 41.8 | 10% | +1.26% | AIQ -1.5% · BOTZ +4.5% |
| 4 | Utilities & Infrastructure | XLU | 38.1 | 10% | +6.56% | IGF +1.1% · PAVE +4.3% |
| 5 | Precious Metals | GLD | 36.9 | 10% | +0.14% | SLV -6.4% · GDX -4.3% |
| 6 | Defense & Aerospace | ITA | 35.4 | 10% | -1.40% | ROKT -3.4% · XAR -5.1% |
| 7 | Nuclear Energy | URNM | 32.5 | 10% | -7.16% | NLR +2.1% · URA -5.4% |
| 8 | Agriculture & Livestock | WEAT | 27.6 | 10% | +7.80% | MOO -0.4% · VEGI -1.2% |
| 9 | Traditional Energy | XLE | 20.3 | 0% | -3.37% | FCG -8.6% · XOP -7.7% |
| 10 | Emerging Markets | INDA | 20.2 | 0% | +4.13% | ILF -5.1% · IEMG -3.0% |
Technology — XLK
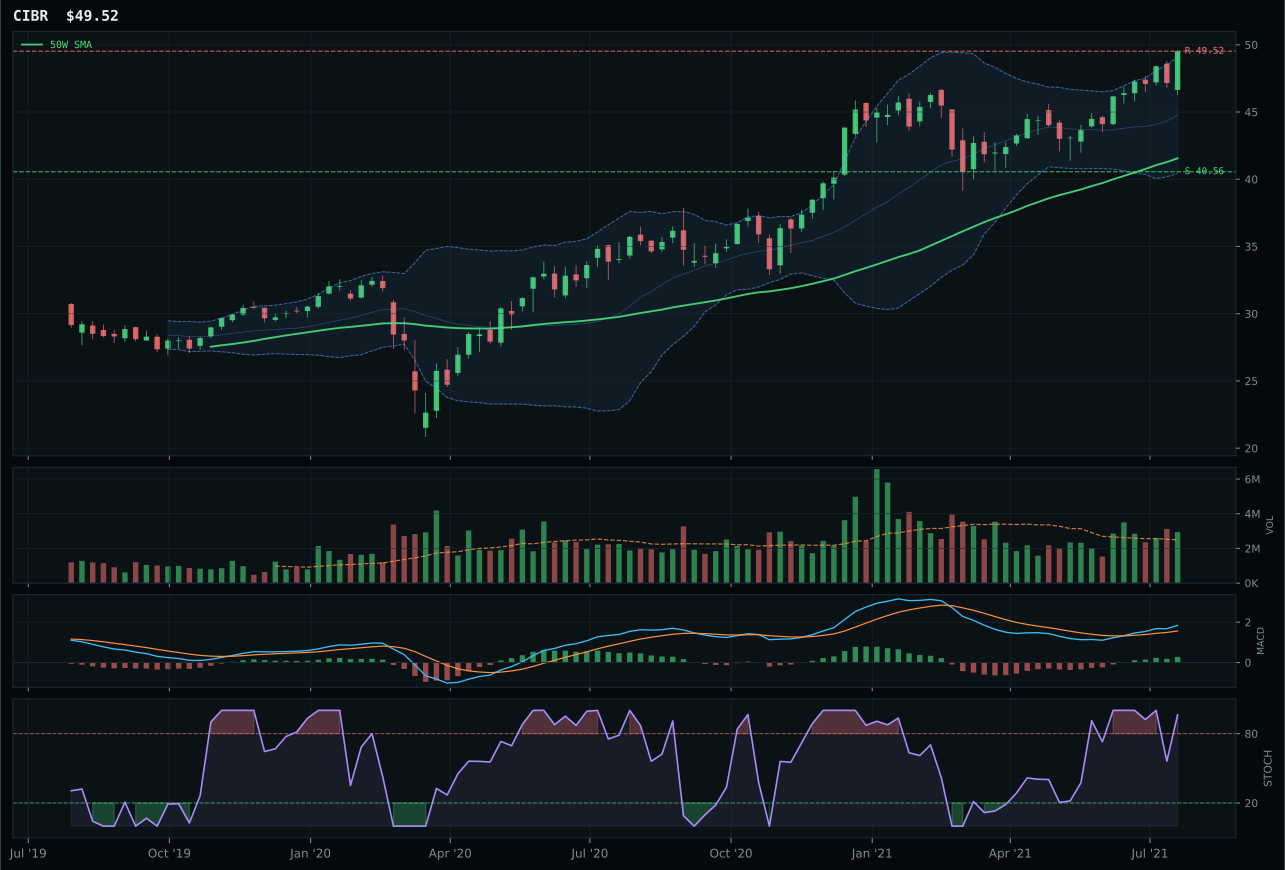
CIBR has a vertical extension profile with 6.0% 13-week relative strength versus SPY.
A failed hold above support would weaken the setup.
Actionable but governed by invalidation levels.
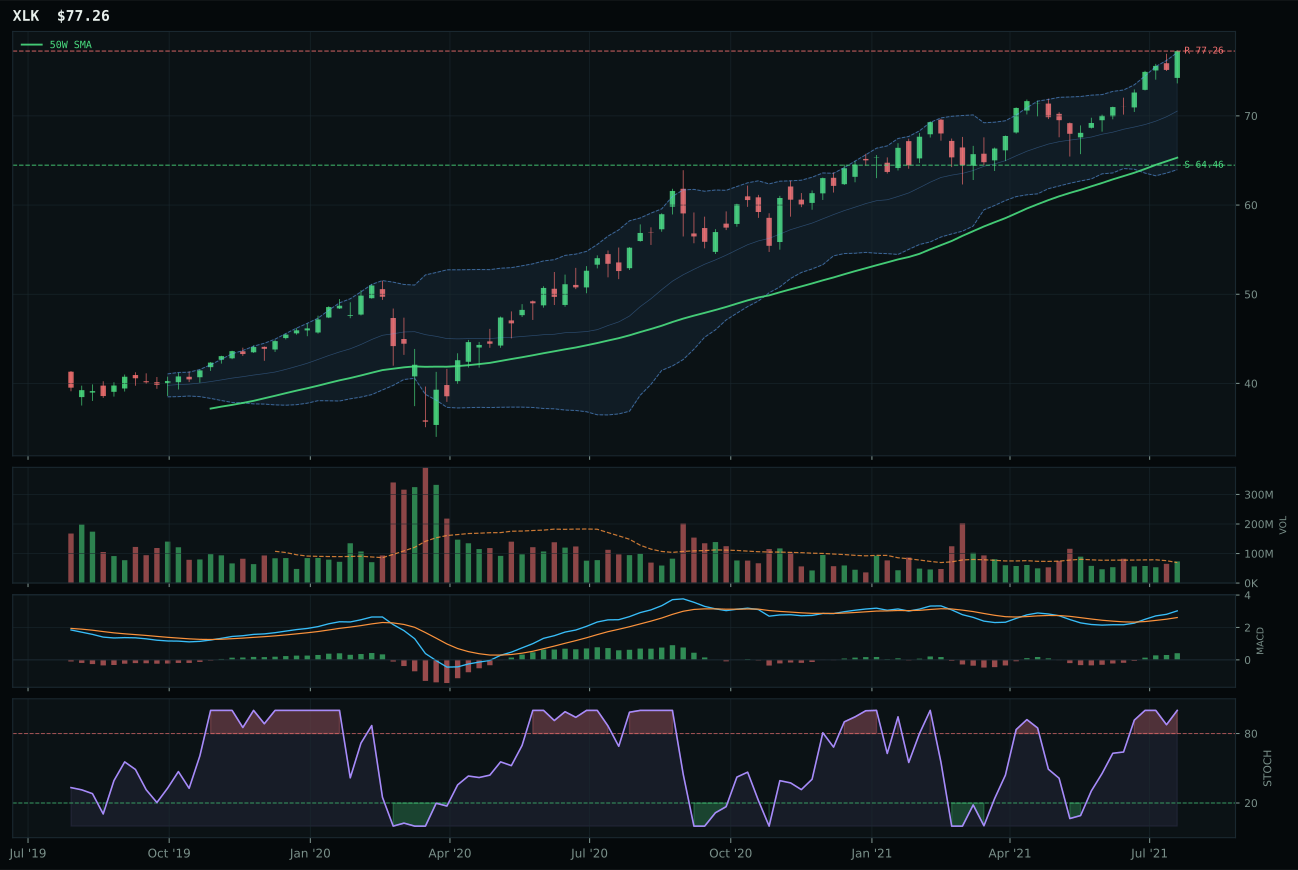
XLK has a vertical extension profile with 2.7% 13-week relative strength versus SPY.
A failed hold above support would weaken the setup.
Actionable but governed by invalidation levels.
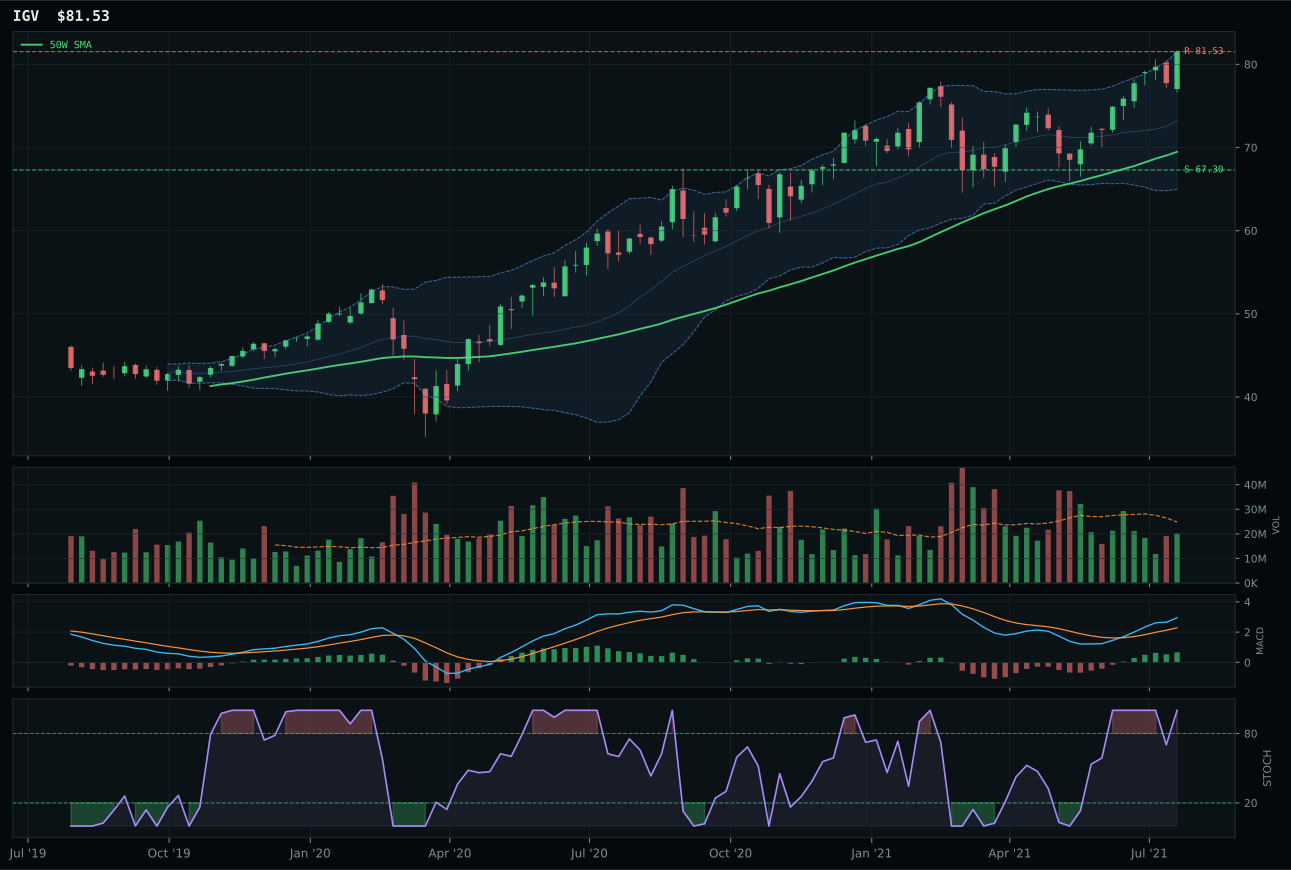
IGV has a vertical extension profile with 5.1% 13-week relative strength versus SPY.
A failed hold above support would weaken the setup.
Actionable but governed by invalidation levels.
XLK wins the category by virtue of cleaner structure and superior category-relative sponsorship, despite CIBR's stronger 13-week momentum at 11.5% versus XLK's 8.3%. The deciding factors are tight: XLK's risk-reward setup (44.3 vs 43.5) and structure cleanliness (80.2 vs 79.9) give it the edge when both setups are extended at near 52-week highs with overbought stochastic RSI momentum. CIBR, evaluated as cybersecurity steady-state, posts stronger SPY-relative strength at 6.0% and leads on absolute returns, but XLK's broader profit-driven leadership and neutral volume participation prove more durable in the current Goldilocks regime where liquidity expansion is active. The chart quality matters more than recency here: XLK sits 18.3% above its 50-week moving average with a non-deteriorating slope, and both its MACD and stochastic RSI confirm continuation without distribution signals, making it the representative choice for broad technology exposure.
Technology claims the 10% top-2 allocation as one of the two highest-scoring categories at 66.8, a position earned through technical merit rather than macro tailwind. The category's strength rests on trend confirmation (100/100 on price position and slope), where XLK's seated above both the 50- and 200-week averages with persistent momentum across the 13-week and 26-week horizons. Goldilocks helps modestly at +9 basis points, and active liquidity expansion provides +9 more, but credit stress drains -7 and dollar pressure costs another -5, leaving macro/narrative fit at 61.0/100—a support role, not a driver. The 10% allocation reflects that in a regime favoring growth with contained inflation, profitable technology leadership deserves equal footing with Industrial Metals. This is a momentum-driven decision: XLK's Fibonacci extension near 0.236 combined with non-deteriorating trend structure justifies commitment despite entry risk and despite relative-strength weakness inside its own three-ETF basket (where CIBR's 0.9% outpaces XLK's -2.4%). The portfolio is betting trend persistence outweighs timing risk.
Industrial Metals — COPX
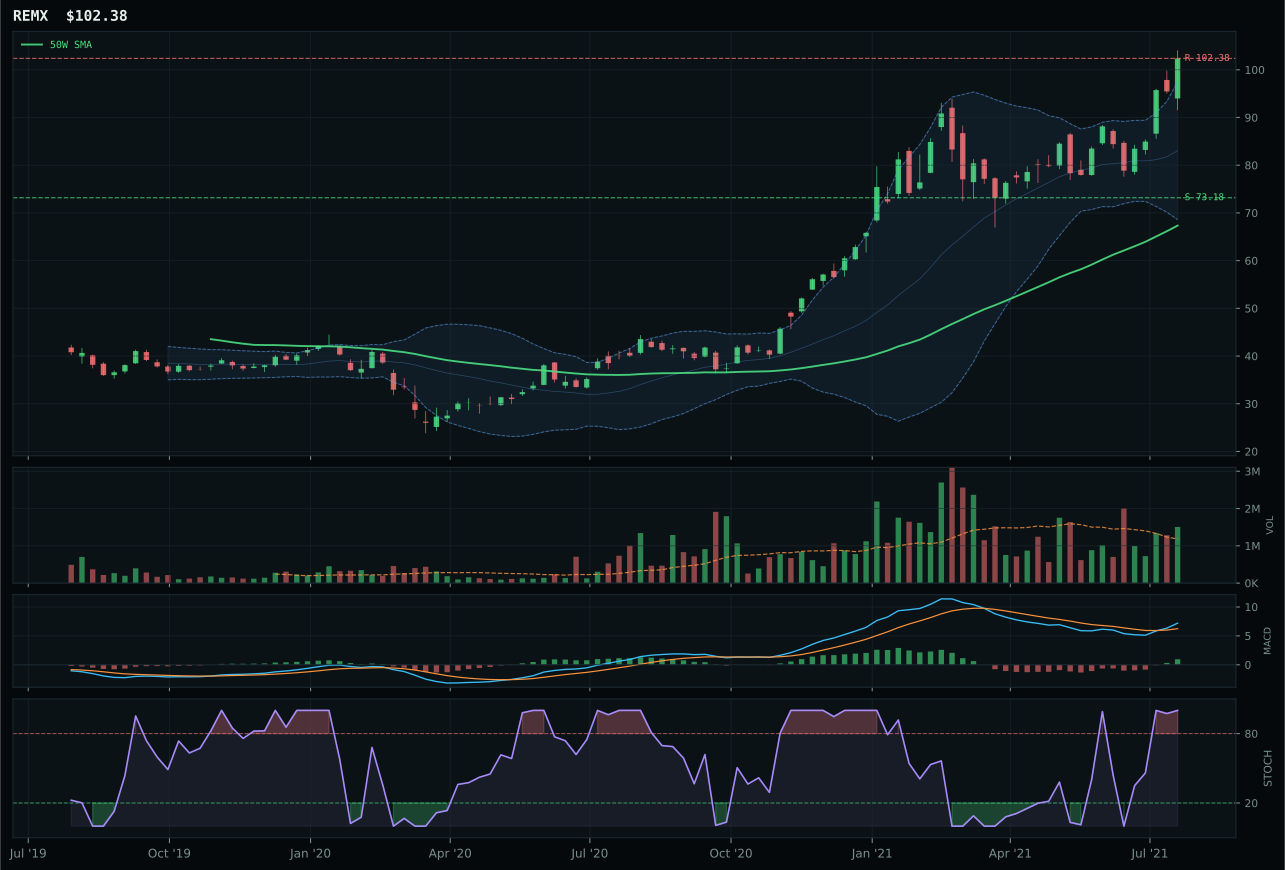
REMX has a vertical extension profile with 22.3% 13-week relative strength versus SPY.
A failed hold above support would weaken the setup.
Actionable but governed by invalidation levels.
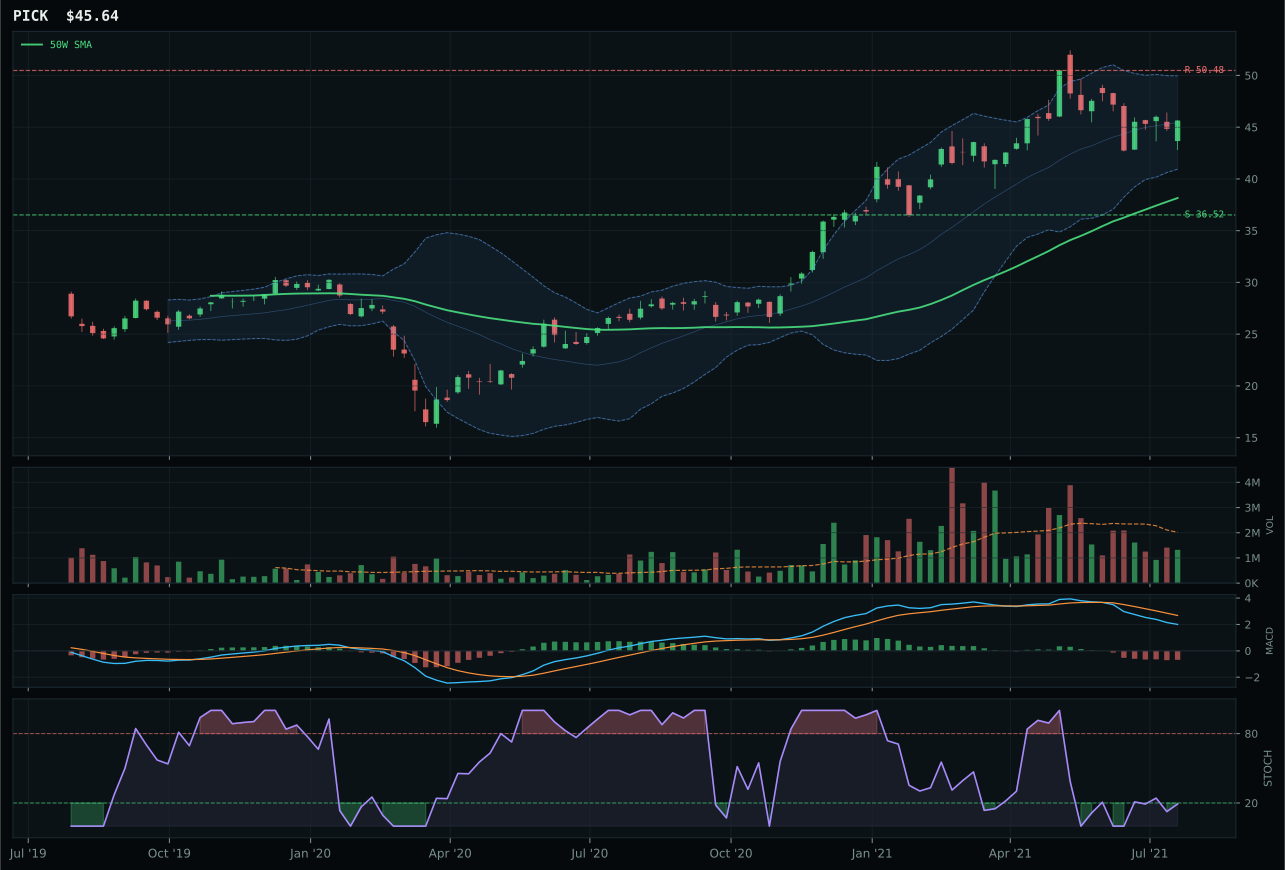
PICK has a vertical extension profile with -6.1% 13-week relative strength versus SPY.
A failed hold above support would weaken the setup.
Actionable but governed by invalidation levels.
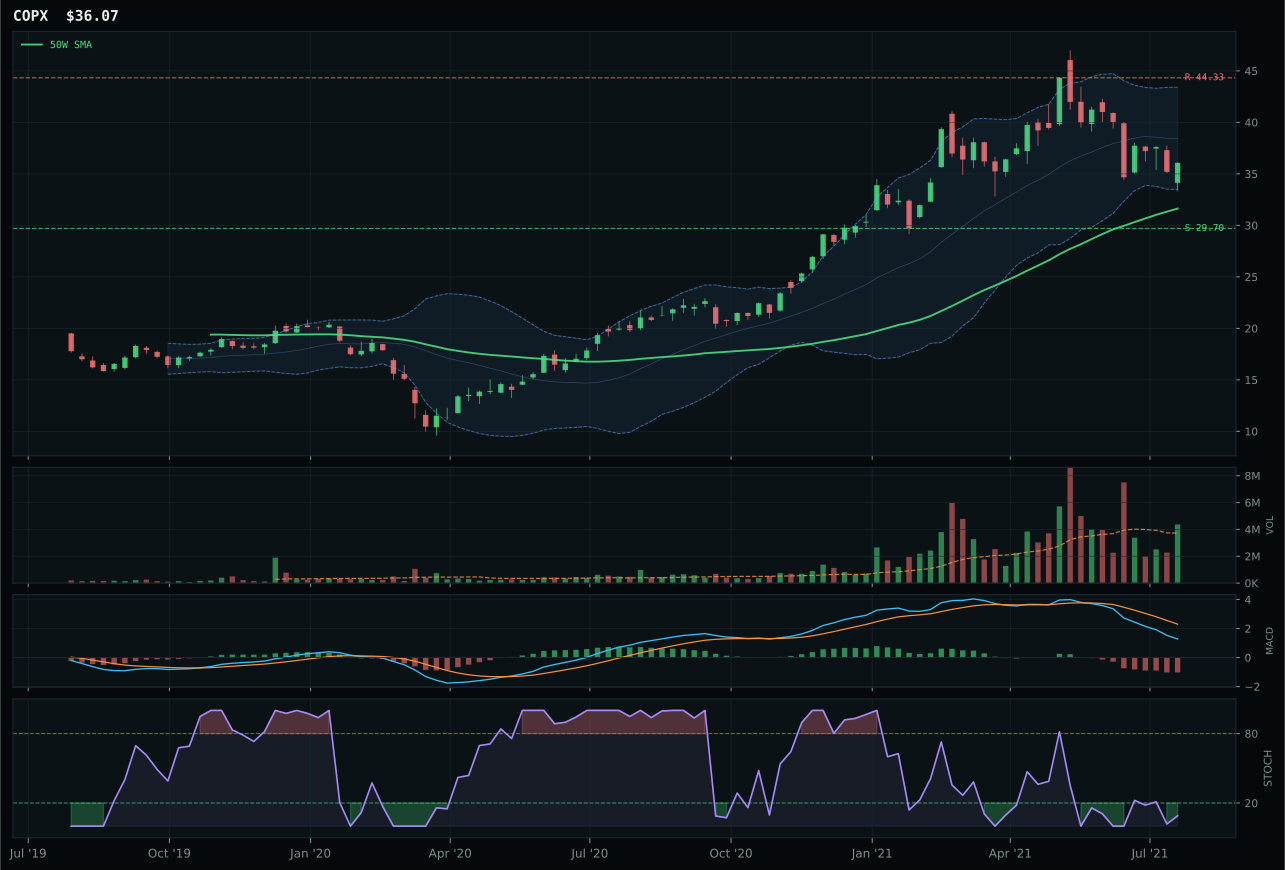
COPX has a neutral structure profile with -13.6% 13-week relative strength versus SPY.
A failed hold above support would weaken the setup.
Actionable but governed by invalidation levels.
COPX wins the industrial metals category not on momentum—it shows 0.0% momentum confirmation from a -8.0% 13-week decline and -13.6% SPY relative weakness—but on its superior timing and risk-reward structure relative to the extended momentum leader REMX. REMX posts blisteringly strong technical evidence (91.3/100 vs COPX's 21.6/100), a 27.8% 13-week return, and +22.3% SPY relative strength, but sits 52.0% extended above the 50-week in vertical extension, a chart so stretched that risk-reward inverts badly: -18.6% downside to resistance vs 0.0% upside. COPX, by contrast, sits 14.0% above the 50-week in neutral structure at the Fib 0.382 middle-retracement zone with an oversold stochastic RSI at 0.09, creating a 21.4% downside to support and -18.6% to resistance. REMX is the trend; COPX is the setup. In a category where metals scarcity (+14) and commodity breadth (+10) are both active and powerful, the allocator chooses the oversold, accumulating name over the overbought, distributive momentum chase.
Industrial Metals earns top-2 status with a 10% allocation, the same weight as Technology, despite a lower absolute score of 45.2. This signals that the category's macro fit (72.0/100) and opportunity set outweigh near-term technical weakness in COPX. Goldilocks helps moderately (+6), but metals scarcity is the true driver: +14 basis points combined with commodity breadth positive (+10), real asset sponsorship (+6), offset partially by credit stress (-7). The 3/2/1 weighted basket starts at 60.2 when REMX leads on pure technical merit, but the category reasoner penalizes REMX's extended setup and timing weakness (37.0 vs 77.0), causing COPX's lower technical evidence to actually win the representative slot. This is a rare case where macro and setup merit override momentum: the portfolio is betting that copper scarcity and industrial demand will reassert with COPX as the vehicle when the broad-market bear exhausts. The 10% allocation is a conviction trade in supply-constrained commodities during a period when liquidity and growth are still present (Goldilocks). COPX must hold support at 29.70 and show volume acceleration above 36.80 resistance to justify continued top-2 weighting; any breakdown into the 26–28 zone redirects the allocation back to tier-2.
AI — SMH
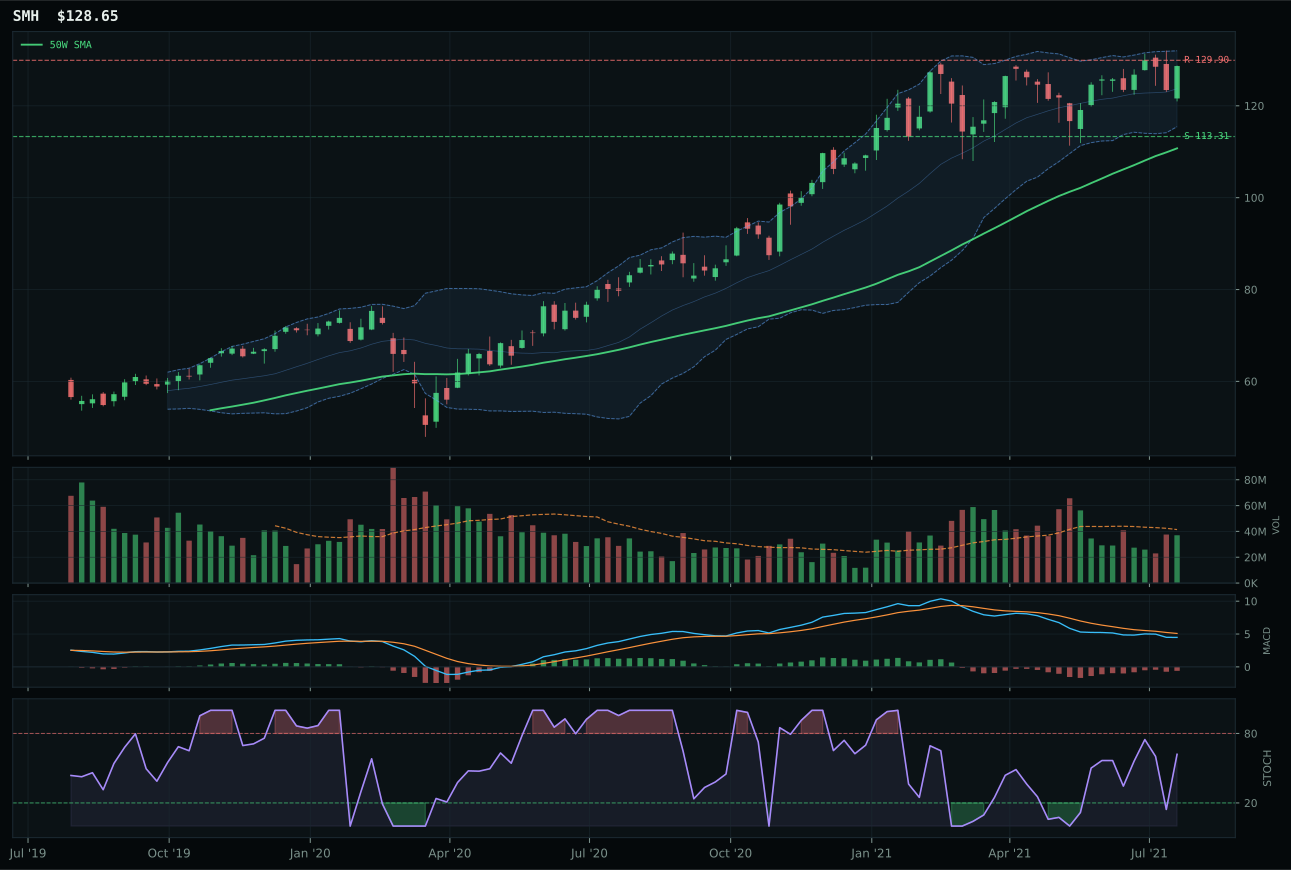
SMH has a vertical extension profile with -2.3% 13-week relative strength versus SPY.
A failed hold above support would weaken the setup.
Actionable but governed by invalidation levels.
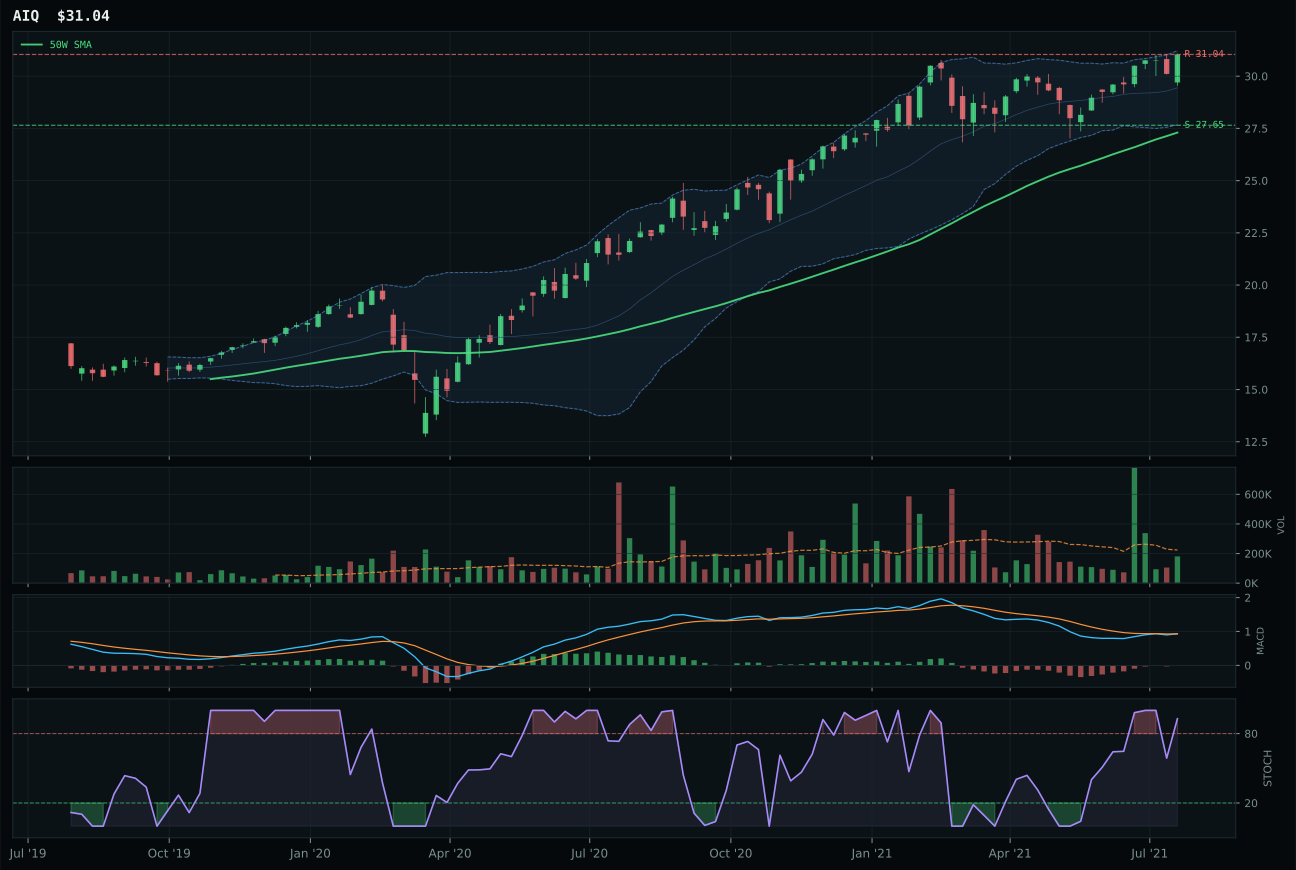
AIQ has a neutral structure profile with -1.1% 13-week relative strength versus SPY.
A failed hold above support would weaken the setup.
Tracked, but not top-2 eligible because: .
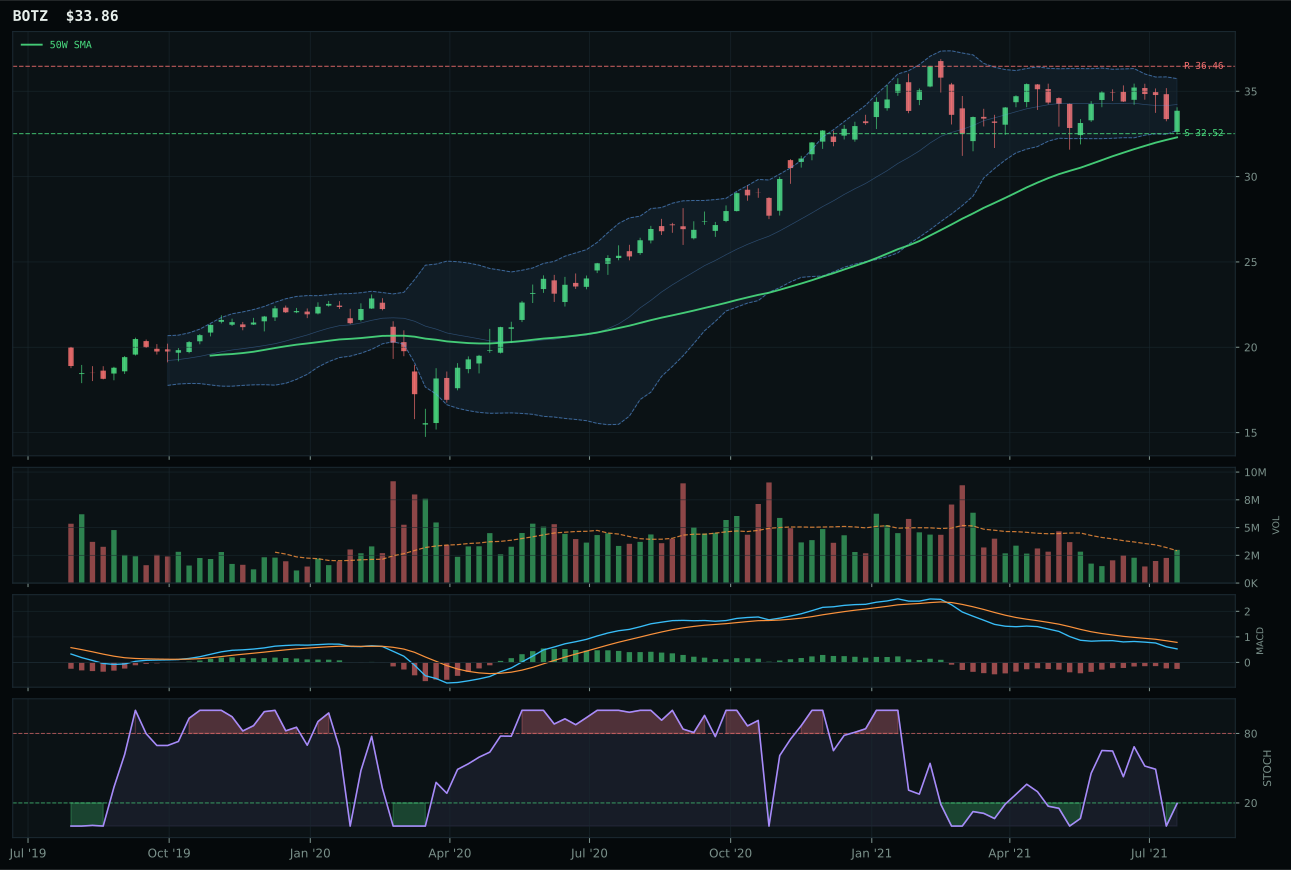
BOTZ has a pullback into support profile with -9.2% 13-week relative strength versus SPY.
A failed hold above support would weaken the setup.
Actionable but governed by invalidation levels.
SMH wins a weak field by 12.5 points over AIQ because its trend structure (89.5 vs 78), timing score (45.0 vs 49), and overall setup cohesion prove marginally more durable in a pullback environment. Both names are extended above the 50-week by 16.2% and 14.1% respectively, but SMH's neutral volume participation at 0.89x average paired with its falling stochastic RSI at 0.62 suggest exhaustion without panic selling—a cleaner reset than AIQ's overbought-rolling-over condition. The 13-week returns favor neither (3.3% vs 4.5%), and both show negative SPY relative strength, but SMH's category-relative strength of 0.0% versus AIQ's 1.2% tells the true story: SMH is the category median, which in a 50.0/100 macro environment means it earns the representative slot through pedestrian durability. BOTZ scores higher on structure but collapses on momentum and relative strength, disqualifying it despite its 67 composite.
AI earns tier-2 status at 5% allocation despite a final score of only 41.8, the third-highest-ranked category but shut out of the top-2 overweight tier by Technology and Industrial Metals. The category itself struggles with a Goldilocks regime that offers modest help (+10) but faces headwinds from broad market bear (-8), credit stress (-8), and dollar pressure (-4), leaving macro/narrative fit at 50.0/100. Technical evidence of 50.6/100 barely supports the macro, reflecting the sector's exposure to high valuations and the risk-off stochastic RSI positioning across all three ETFs. SMH's bearish-but-improving MACD and oversold-momentum condition suggest a washout buy, but the 3/2/1 weighted basket (45.8 unrounded) must clear multiple eligibility filters before deployment. The 5% allocation holds AI as a secondary speculative position, betting that the oversold condition and neutral-to-improving technical setup will outperform the weak macro backdrop. It is a hedge against further semiconductor strength, not a core belief in near-term rebound.
Utilities & Infrastructure — XLU
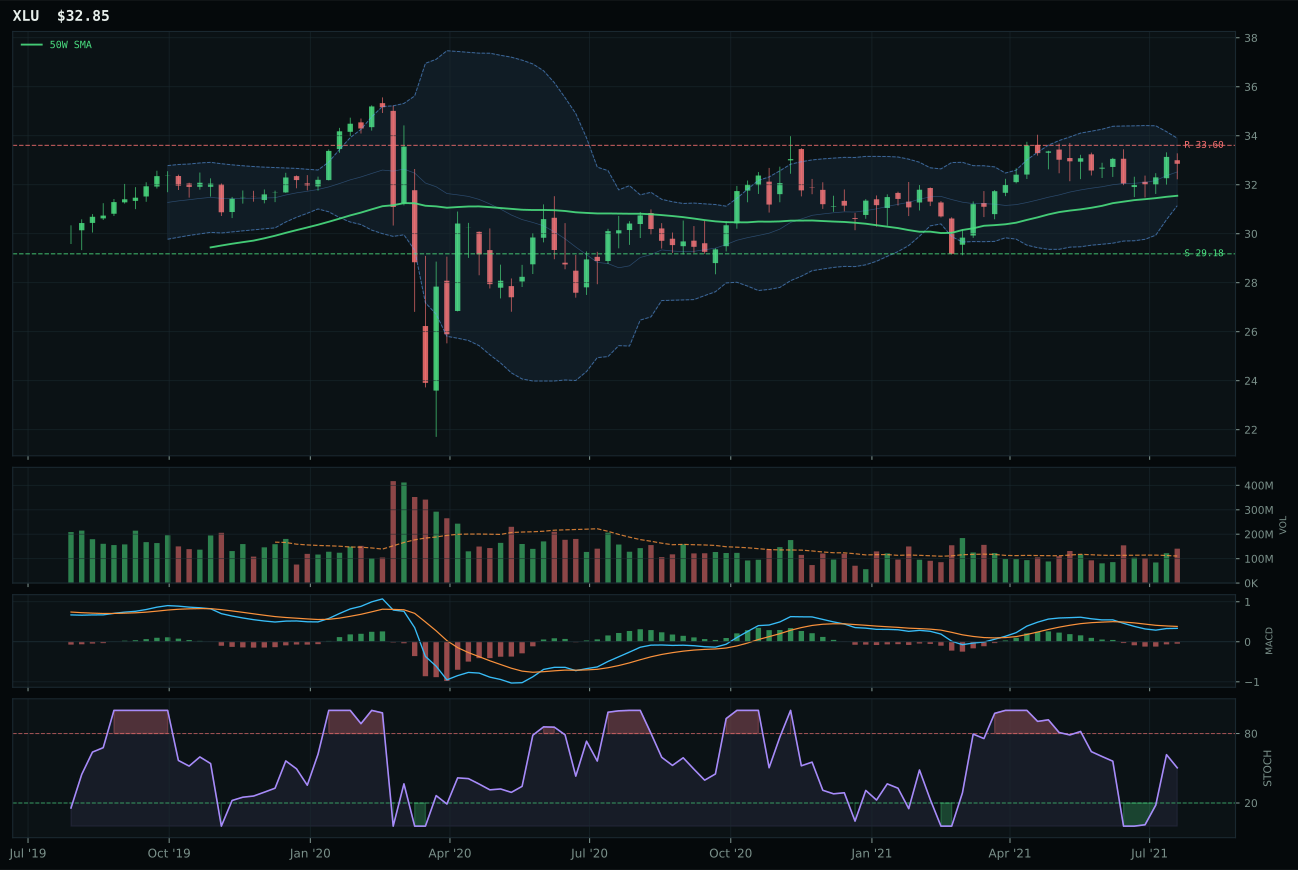
XLU has a neutral structure profile with -6.9% 13-week relative strength versus SPY.
A failed hold above support would weaken the setup.
Actionable but governed by invalidation levels.
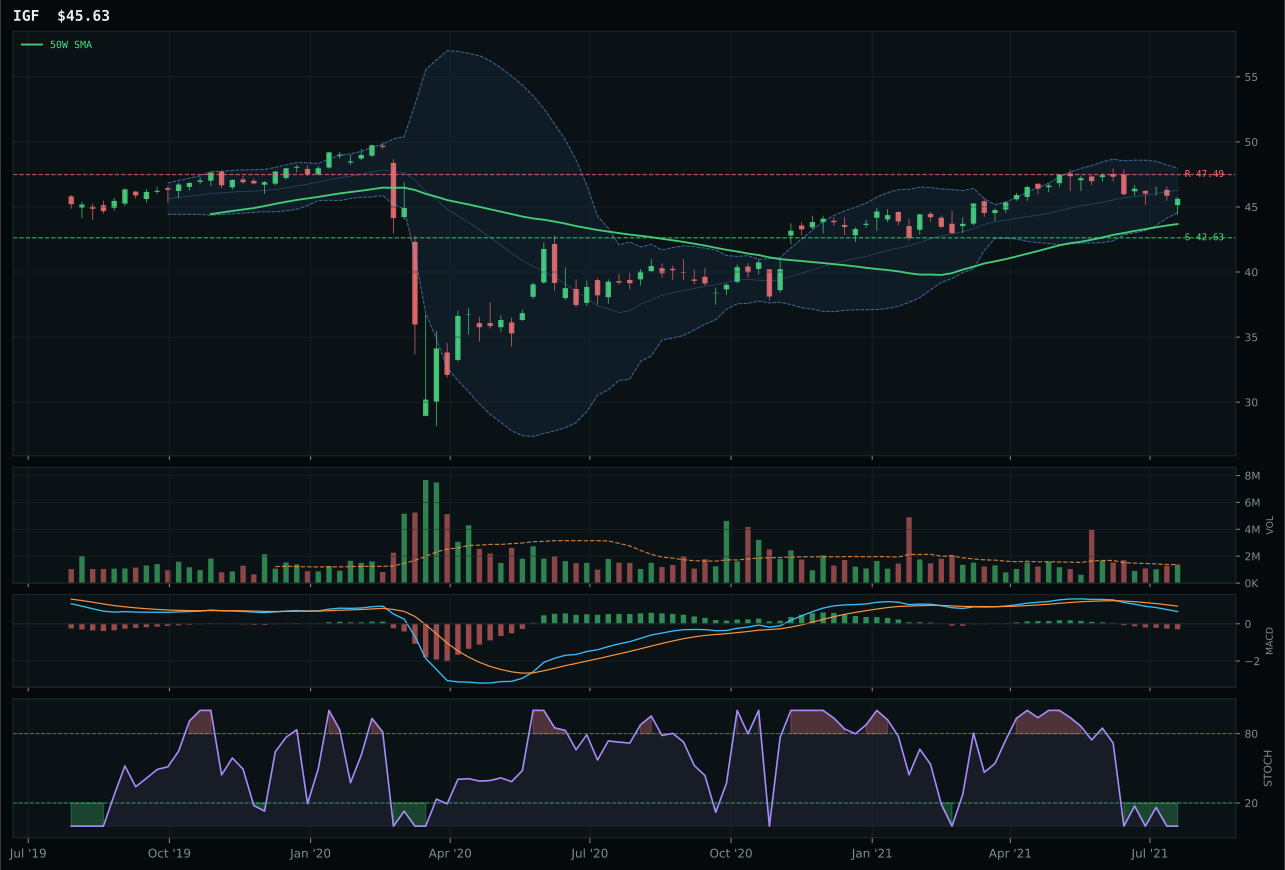
IGF has a neutral structure profile with -7.2% 13-week relative strength versus SPY.
A failed hold above support would weaken the setup.
Actionable but governed by invalidation levels.
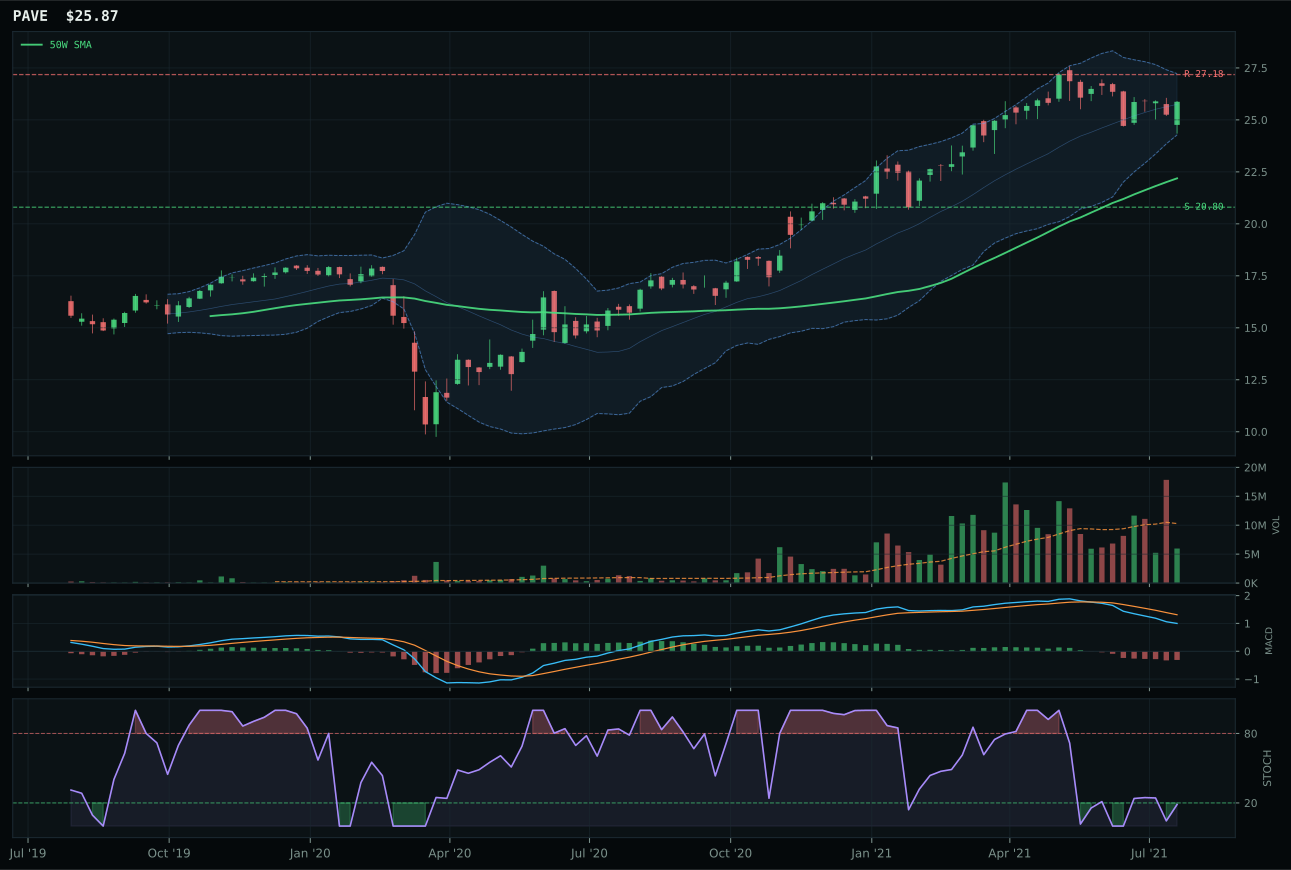
PAVE has a vertical extension profile with -5.8% 13-week relative strength versus SPY.
A failed hold above support would weaken the setup.
Actionable but governed by invalidation levels.
XLU wins utilities by a decisive 10.3-point margin over IGF because its timing score (98.0 vs 85.0), structure cleanliness (75.4 vs 68.5), stochastic RSI timing (rising mid-zone at 0.50 vs oversold at 0.00), and volume sponsorship (1.27x above-average vs neutral) combine to signal active accumulation in a near-term reset. XLU sits just 4.1% above its 50-week in neutral compression, with MACD bearish but improving and stochastic rising mid-zone—the textbook accumulation setup. Price in the upper retracement zone (Fib 0.236) with above-average volume participation suggests defensive capital is entering before any broader relief rally. IGF's oversold stochastic without turn-up, neutral volume, and -0.3% category-relative strength position it as a passive value trap rather than an active accumulation point. XLU's category-relative strength at 0.0% versus IGF's -0.4% is marginally better, but the volume and stochastic turn-up condition are the deciding technical factors.
Utilities & Infrastructure holds the 5% tier-2 allocation with a category score of 38.1, benefiting from modest macro tailwind (disinflation pressure at +6, broad market bear at +4) and XLU's strong timing score (98.0/100), which signals value accumulation rather than crisis defensiveness. Category-level macro fit is 64.0/100, respectable for a defensive play in Goldilocks. XLU's 69.9/100 technical evidence reflects the high timing score offset by weak momentum confirmation (48.0/100), a pattern typical of yield defensives during early-stage resets. The 5% allocation is a prudent hedge: utilities provide downside dampening and income in an environment where growth is still intact but pullbacks are sharp. XLU's rising-mid-zone stochastic suggests the initial capitulation flush is over, making near-term entry constructive. However, the allocation must be monitored: if XLU fails to hold the 29.18 support or if momentum confirmation deteriorates (which it will if the rebound stalls), the 5% should rotate to higher-conviction real assets or cyclicals. This is a tactical position, not a structural tilt; it earns the tier-2 slot as portfolio ballast, not as outperformance vehicle.
Precious Metals — GLD
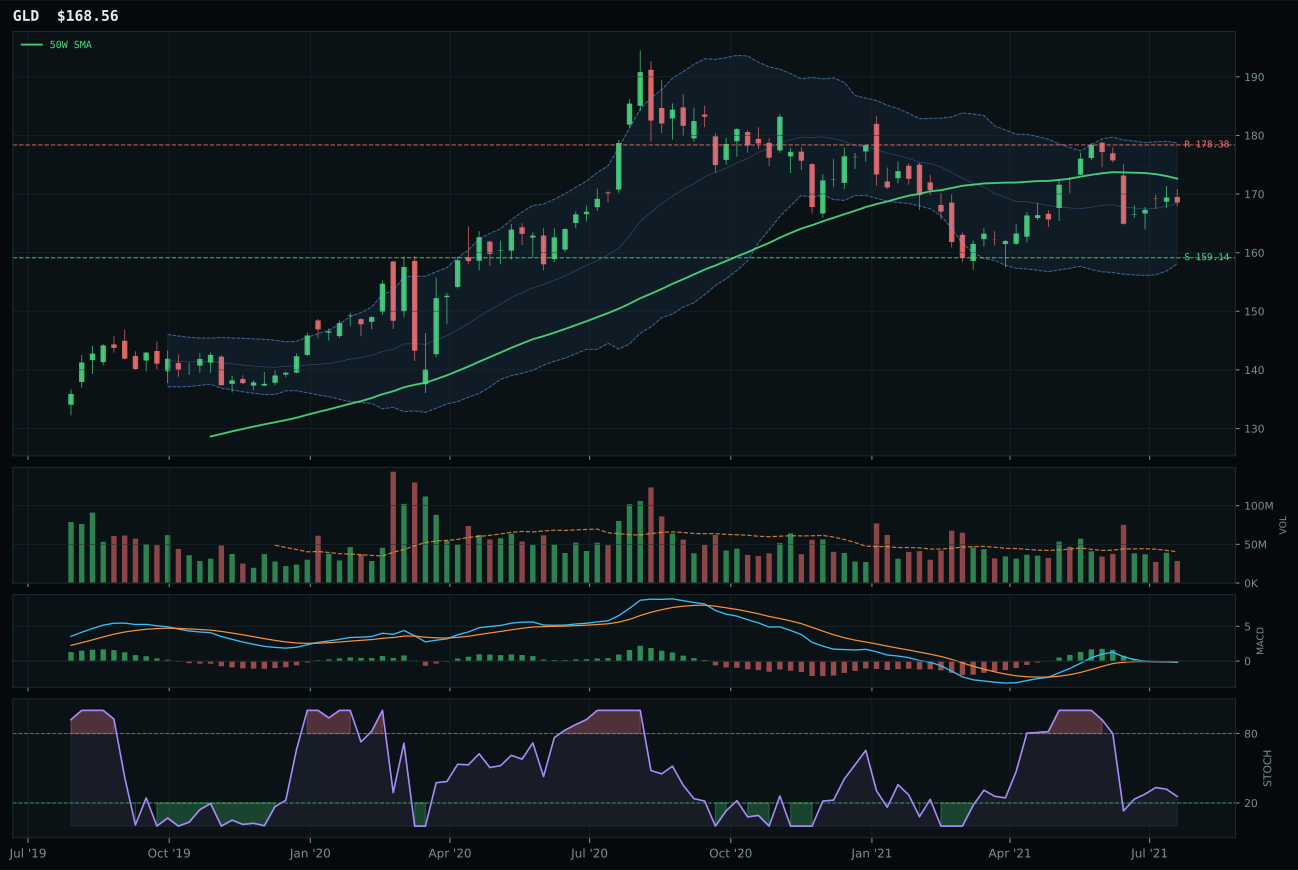
GLD has a compression near 50W profile with -4.3% 13-week relative strength versus SPY.
A failed hold above support would weaken the setup.
Actionable but governed by invalidation levels.
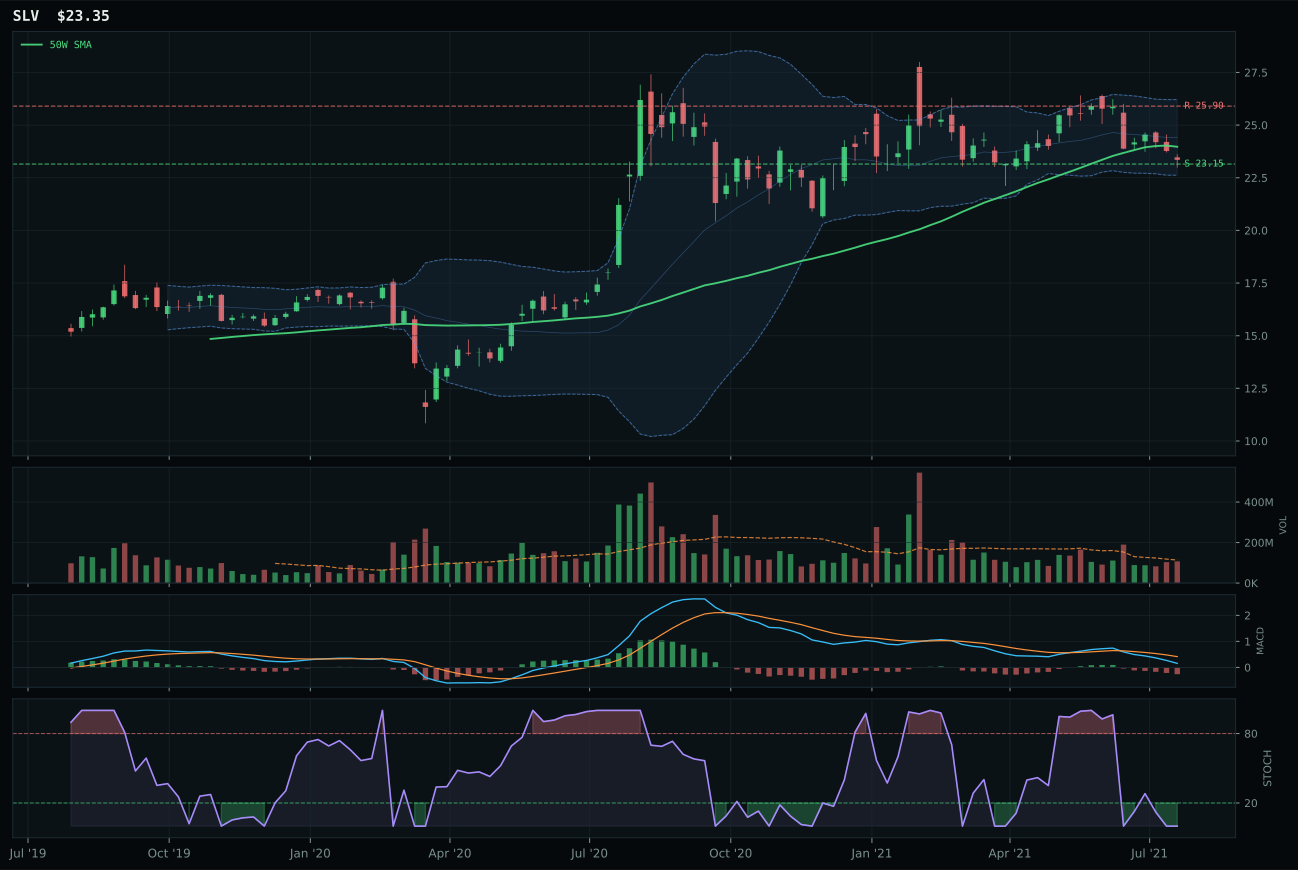
SLV has a pullback into support profile with -8.8% 13-week relative strength versus SPY.
A failed hold above support would weaken the setup.
Actionable but governed by invalidation levels.
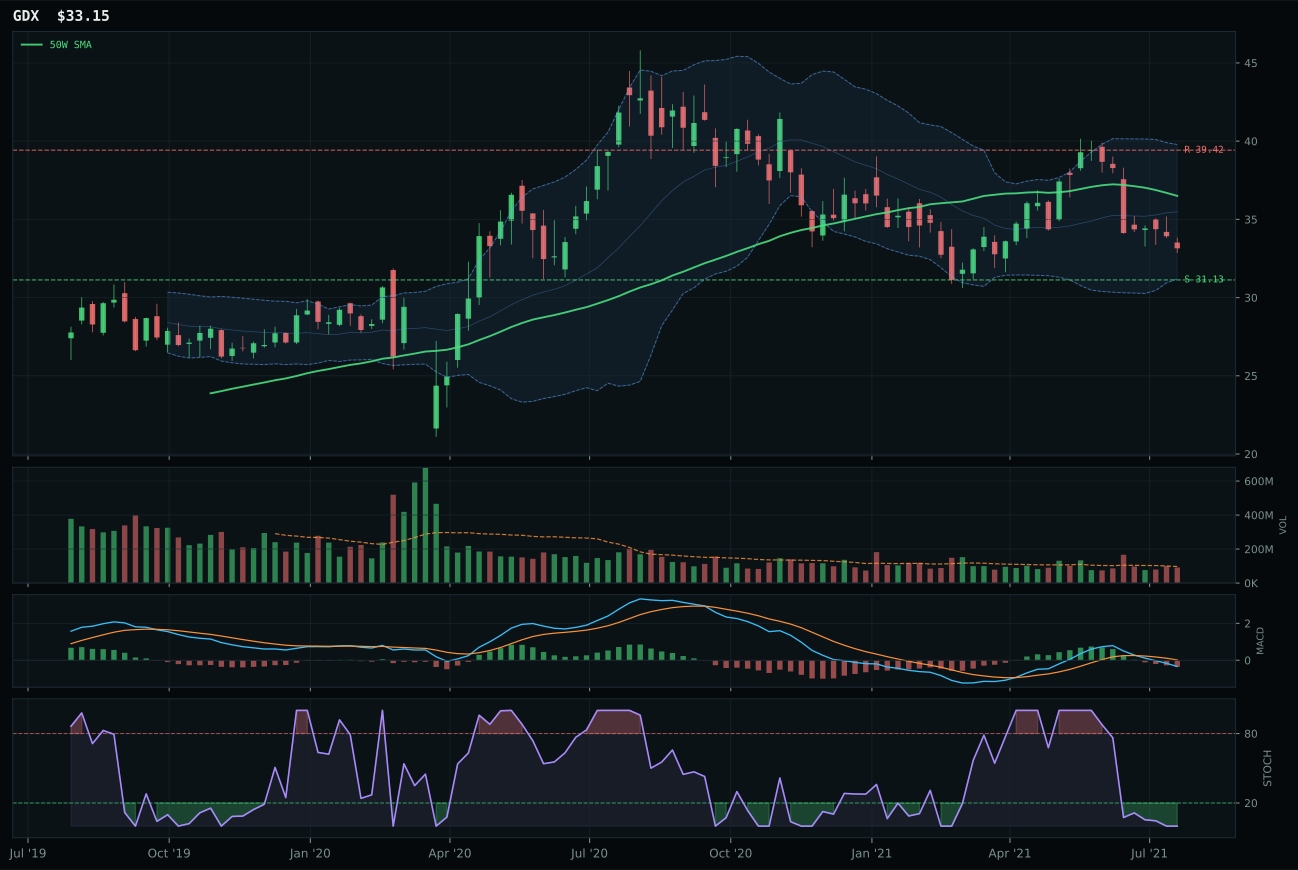
GDX has a neutral structure profile with -13.6% 13-week relative strength versus SPY.
A failed hold above support would weaken the setup.
Actionable but governed by invalidation levels.
GLD wins the precious metals category over SLV by 2.2 points, a razor-thin margin that hinges on structure cleanliness (76.6 vs 71.4) and category-relative strength (4.6% vs 0.0%), not on absolute momentum or positioning. Both ETFs show bearish-weakening MACD and oversold stochastic RSI, but GLD's compression setup near the 50-week at -2.4% (price below the 50, still above the 200) offers a reset environment, whereas SLV's pullback-into-support further down the stack looks more dire. GLD's timing score maxes at 100.0/100 because its price position in the deep retracement zone and stochastic falling/neutral condition create a value setup rather than a momentum chase. The 13-week returns are lackluster (1.3% vs -3.3%), but GLD's category-relative outperformance of 4.6% tells the true story: it is attracting defensive capital within metals. SLV's -8.8% SPY relative strength and hybrid industrial-monetary nature make it more vulnerable to growth disappointment.
Precious Metals claims the 5% tier-2 allocation with a category score of 36.9, the fourth-lowest in the portfolio, reflecting a macro environment where disinflation pressure (+6) and dollar pressure (+3) support gold's defensive appeal but liquidity expansion (-2) provides only modest tailwind. Category-level macro fit of 57.0/100 is decent, but technical evidence of 45.8/100 for GLD is weak: the trend score sits at only 50.6/100 because price is below the 50-week, and momentum confirmation is just 33.9/100. The allocation is fundamentally macro-driven, not technical: GLD holds as a monetary hedge in a Goldilocks environment that could snap toward either disinflation or credit stress. The timing score of 100.0/100 reflects GLD's compressed, oversold positioning, which works best as a base for mean-reversion or as dry powder if risk-off accelerates. This is not a conviction trade; it is a portfolio ballast position. GLD must hold support at 159.14 and show volume pickup above the 178.38 resistance to prove the setup, otherwise the allocation becomes vulnerable to reallocation toward higher-conviction industrial metals or technology.
Defense & Aerospace — ITA
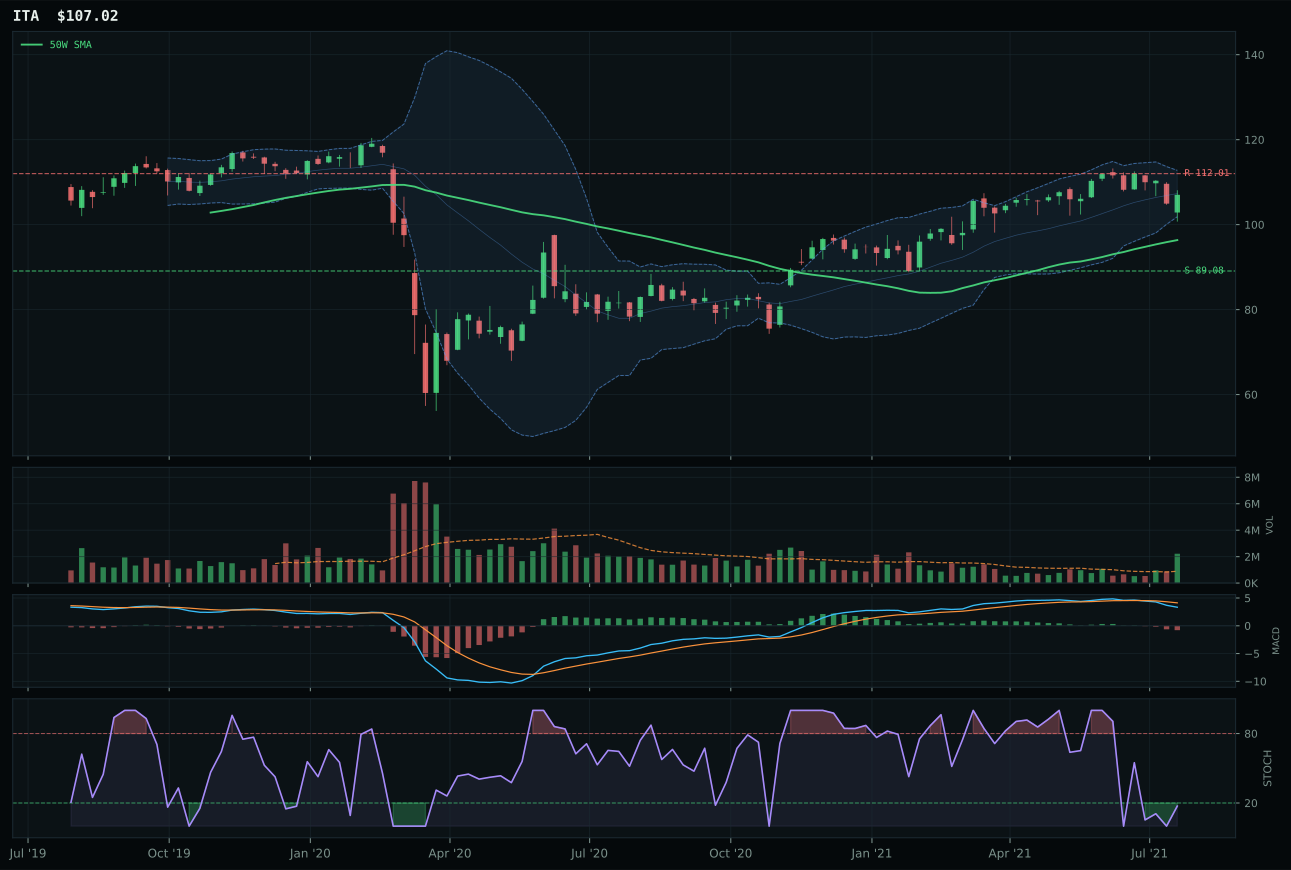
ITA has a neutral structure profile with -4.1% 13-week relative strength versus SPY.
A failed hold above support would weaken the setup.
Actionable but governed by invalidation levels.
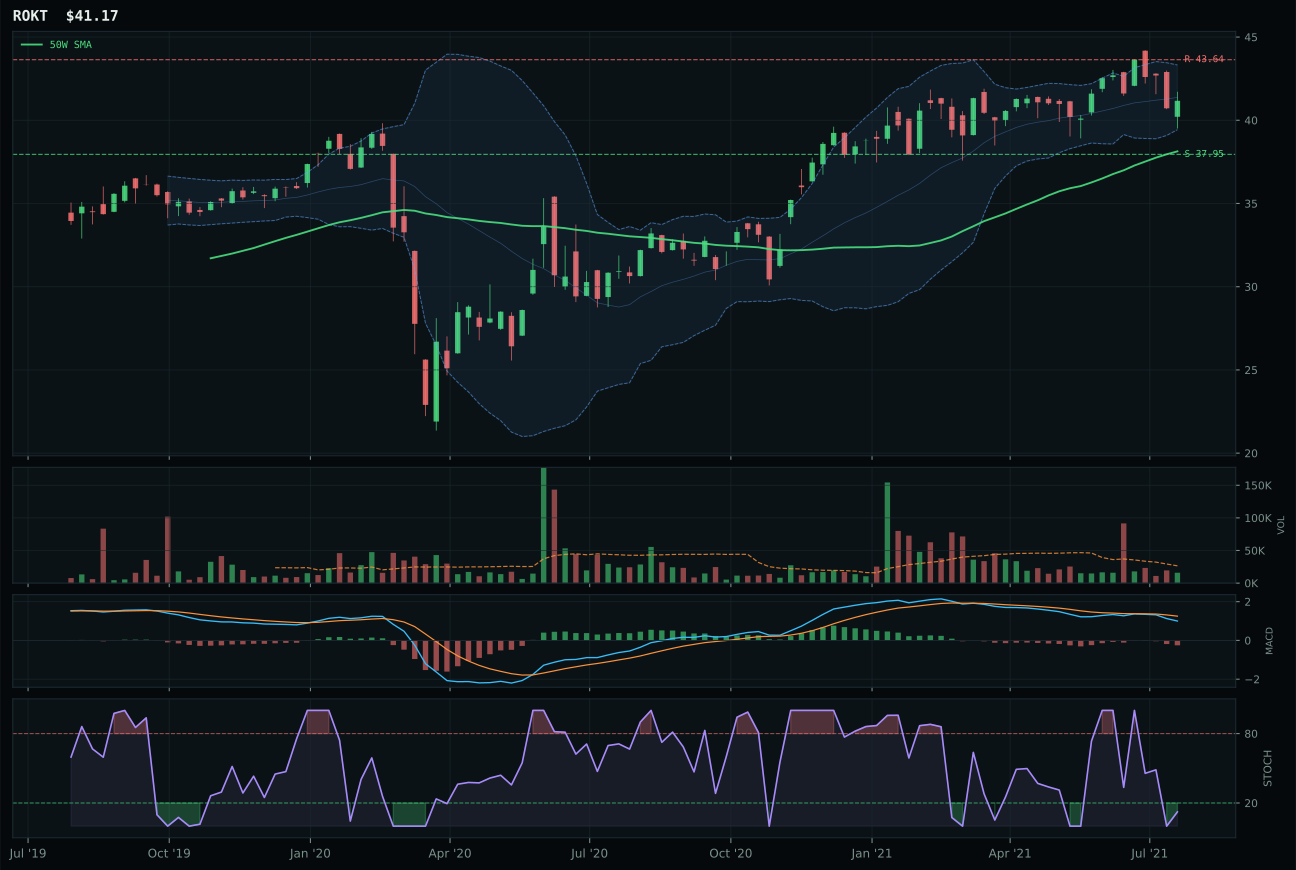
ROKT has a neutral structure profile with -5.3% 13-week relative strength versus SPY.
A failed hold above support would weaken the setup.
Tracked, but not top-2 eligible because: .
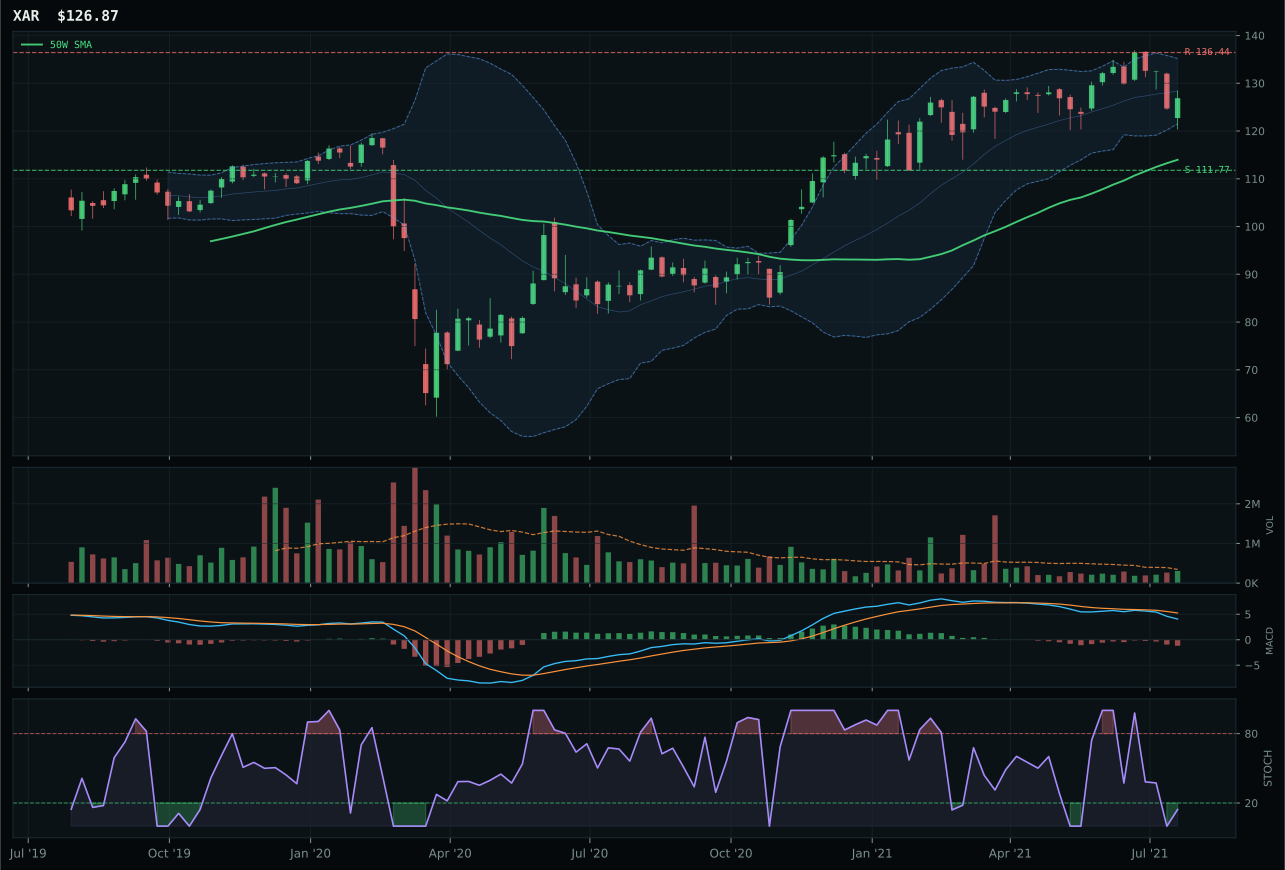
XAR has a neutral structure profile with -6.0% 13-week relative strength versus SPY.
A failed hold above support would weaken the setup.
Actionable but governed by invalidation levels.
ITA wins the defense category by a massive 41.3-point margin over ROKT because its timing score (84.0 vs 70.0), structure cleanliness (80.6 vs 70.2), and stochastic RSI turn-up condition (0.17 oversold turning up vs 0.00 completely oversold) signal early-stage accumulation rather than ongoing breakdown. ITA's defining feature is high volume confirmation at 2.48x the 20-week average paired with an oversold-turn-up stochastic in the upper retracement zone, a setup that works in defense-prime durability when the broad market bear is active (+6) and dollar pressure is present (+3). The 13-week return of 1.5% and negative SPY relative strength of -4.1% matter less than the structure: ITA sits 11.1% above its 50-week with neutral compression, and volume is actively accumulating rather than thinning. ROKT's thin participation and pure oversold reading without turn-up confirmation leave it in limbo, vulnerable to further washout.
Defense & Aerospace holds the 5% tier-2 allocation despite a category score of only 35.4, ranking between Precious Metals and Nuclear Energy in the middle tier. The category-level macro fit of 64.0/100 helps: broad market bear (+6), dollar pressure (+3), and a Transition/Mixed descriptor (+3) all support defensive positioning, though credit stress remains slightly negative (+2). ITA's 54.1 reasoned score and 50.8/100 technical evidence carry the category through, but the 3/2/1 weighted basket (46.4) still requires macro sponsorship to justify holding. The allocation reflects a portfolio hedge against equity volatility and a bet that ITA's oversold-turn-up setup will reward early buyers. However, the low category score makes clear this is not a conviction position—it is allocated because both top-2 slots are filled by higher-conviction pairs (Technology and Industrial Metals) and the risk-on regime still permits 5% insurance in the form of defense-prime exposure. ITA must show follow-through on volume and breadth to justify retention beyond this week.
Nuclear Energy — URNM
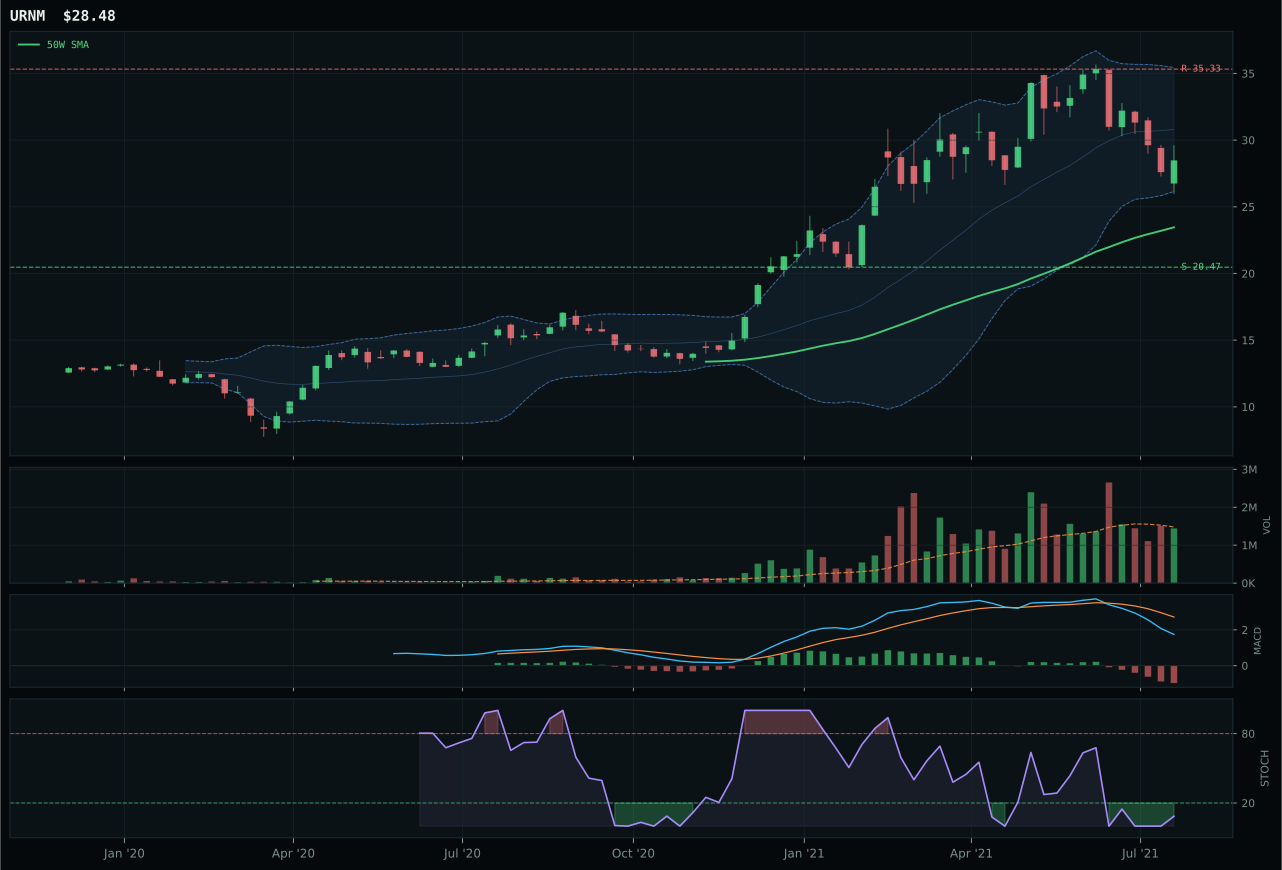
URNM has a vertical extension profile with -3.0% 13-week relative strength versus SPY.
A failed hold above support would weaken the setup.
Actionable but governed by invalidation levels.
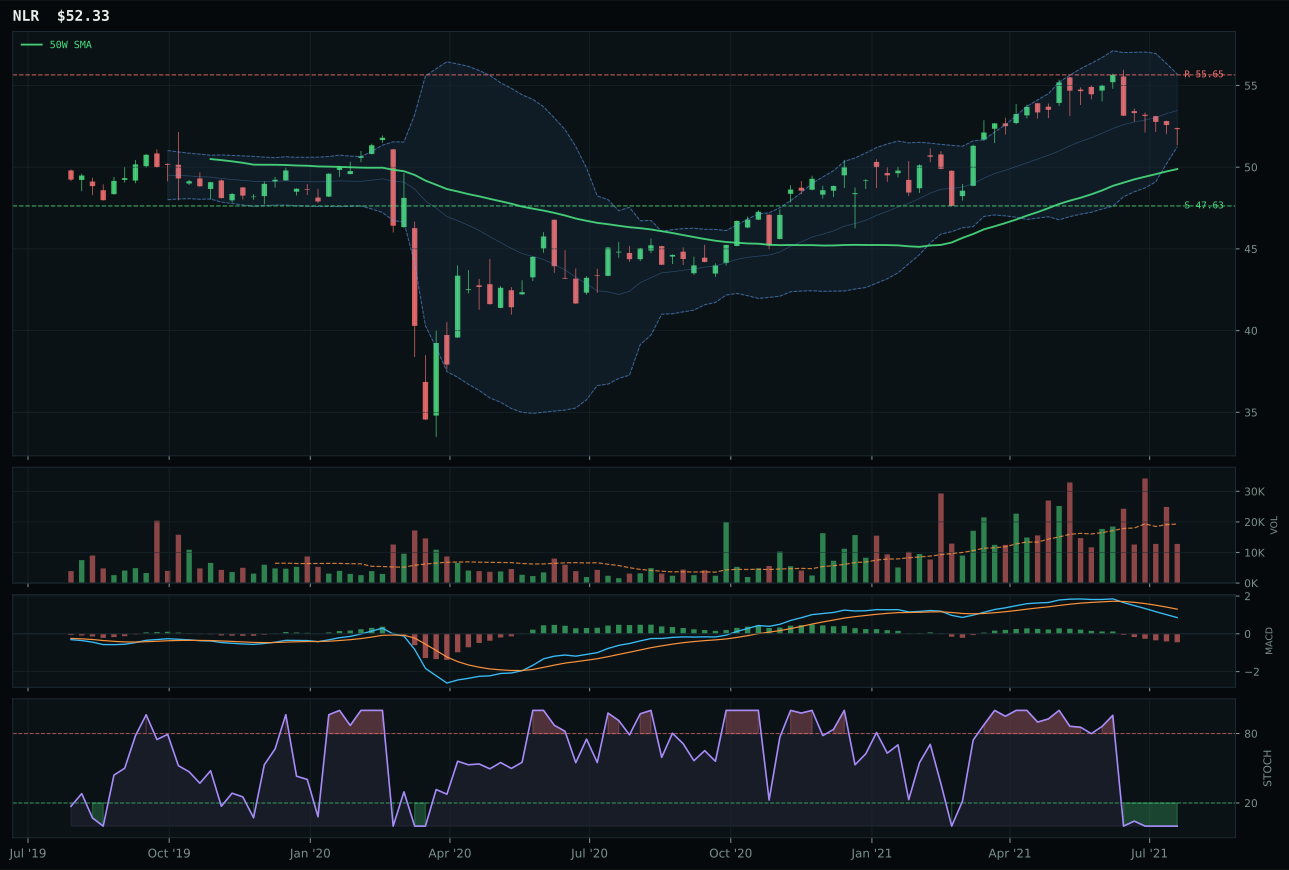
NLR has a neutral structure profile with -7.5% 13-week relative strength versus SPY.
A failed hold above support would weaken the setup.
Tracked, but not top-2 eligible because: .
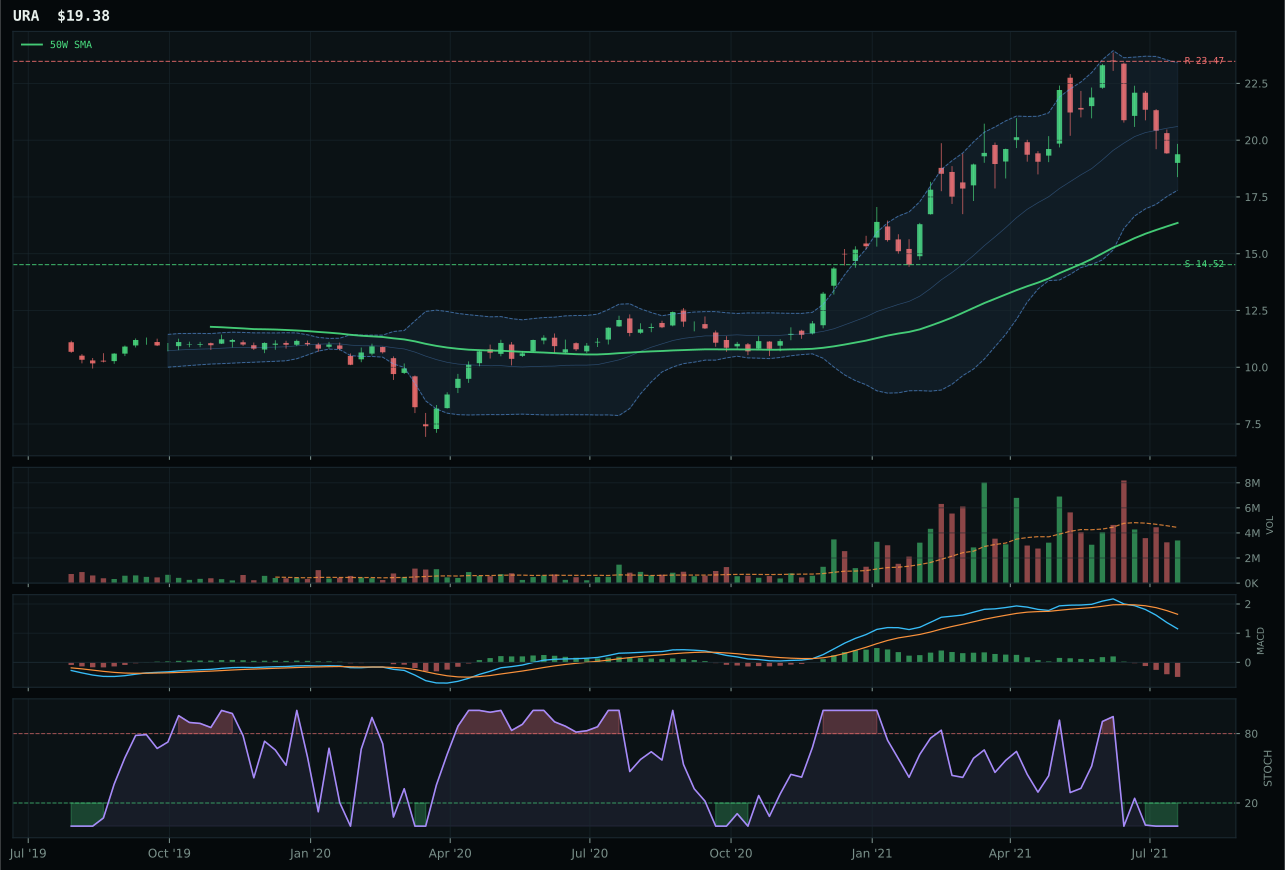
URA has a vertical extension profile with -3.8% 13-week relative strength versus SPY.
A failed hold above support would weaken the setup.
Actionable but governed by invalidation levels.
URNM wins the nuclear category by 4.6 points over NLR because its stochastic RSI condition (oversold turn up at 0.09 vs pure oversold at 0.00) and structure quality (67.9 vs 66.6) better position it for early accumulation in a broken-trend recovery setup. Both names are extended above the 50-week—URNM at 21.4%, NLR at 15.9%—but URNM's vertical extension structure with an improving stochastic turn-up signal suggests printing a bottom, whereas NLR's neutral structure with flat stochastic suggests further erosion. URNM's -11.6% 4-week return and 2.6% 13-week return create a divergence pattern (recent weakness, longer-term strength) typical of accumulation bases. Volume at 0.97x neutral and a bearish-but-improving MACD support the case. NLR's thin participation at sub-average levels and -1.9% 13-week return offer no competitive advantage; its timing score (85.0) is better, but that scores entry risk, not opportunity, when price is already 15.9% above the 50W.
Nuclear Energy holds the 5% tier-2 allocation despite a weak category score of 32.5, a position justified by real asset sponsorship (+7) and structural portfolio diversification rather than conviction in near-term technicals. The category-level macro fit of 52.0/100 is modest: real asset sponsorship provides the main support, but credit stress drains -5, leaving the macro case mixed. URNM's 19.9/100 technical evidence and 18.6/100 momentum confirmation are abysmal—the portfolio is not buying a technical setup, it is holding a thematic exposure. The 5% is a hedge on U.S. energy policy and long-cycle nuclear demand, positioned for multi-year upside rather than quarterly performance. In a Goldilocks regime, nuclear offers optionality: if real-asset sponsorship accelerates or disinflation reverses and energy demand rises, URNM has structural tailwind. URNM must hold support at 20.47 and clear resistance at 35.33 to earn upgrade to tier-1; any breakdown below 20 suggests rotating the allocation to higher-conviction commodity or infrastructure names. The category is speculative; the allocation reflects thesis optionality, not execution confidence.
Agriculture & Livestock — WEAT
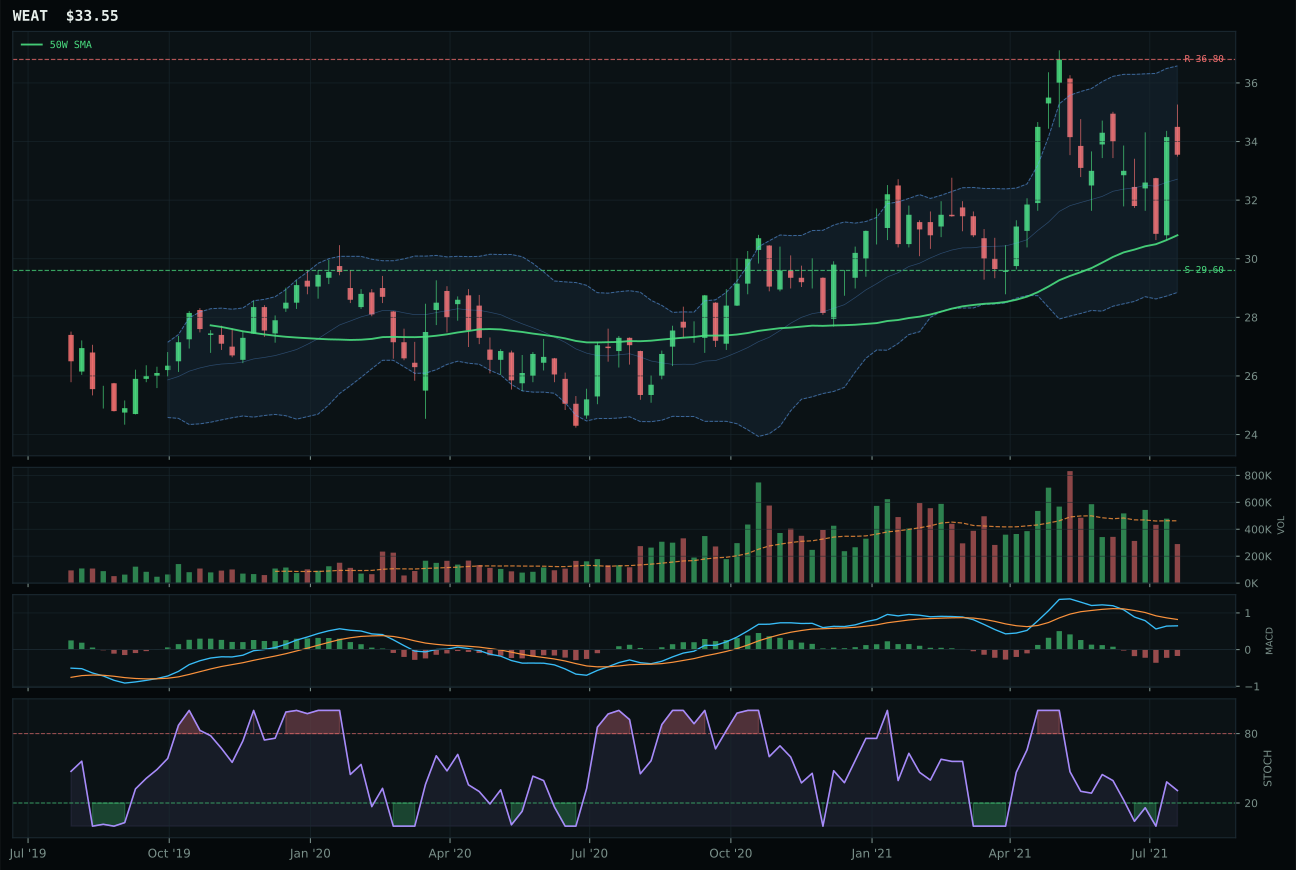
WEAT has a neutral structure profile with -8.3% 13-week relative strength versus SPY.
A failed hold above support would weaken the setup.
Actionable but governed by invalidation levels.
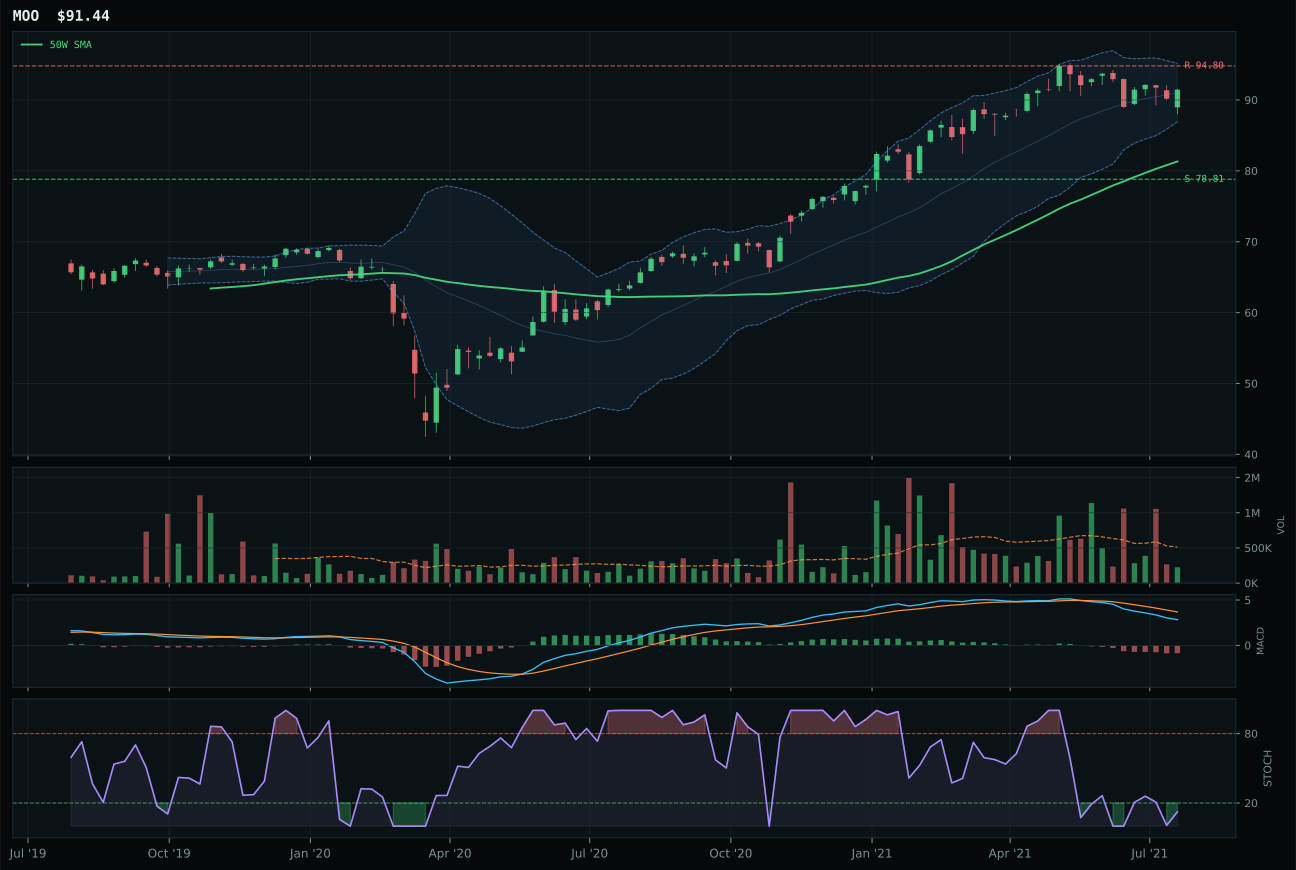
MOO has a neutral structure profile with -5.4% 13-week relative strength versus SPY.
A failed hold above support would weaken the setup.
Actionable but governed by invalidation levels.
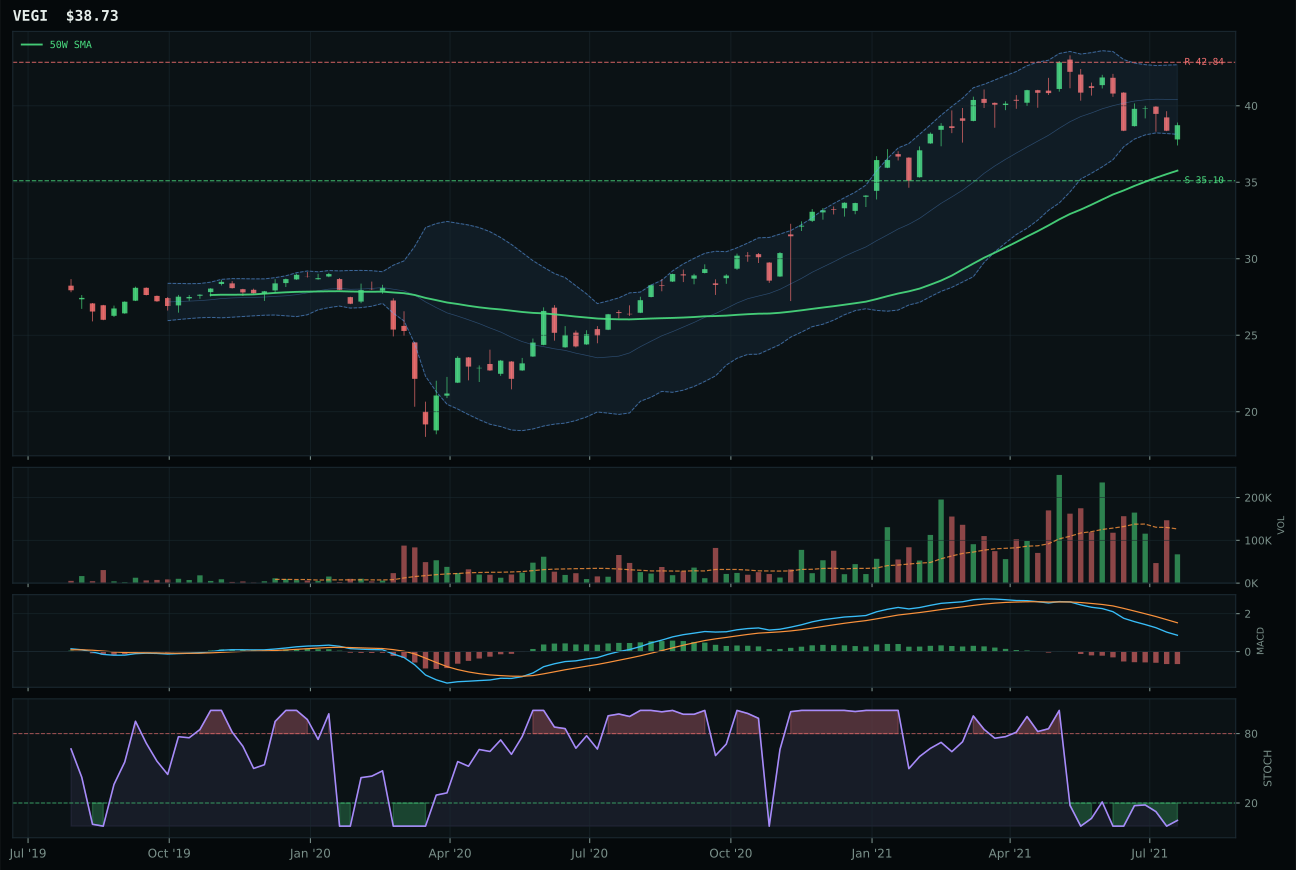
VEGI has a neutral structure profile with -10.8% 13-week relative strength versus SPY.
A failed hold above support would weaken the setup.
Tracked, but not top-2 eligible because: .
WEAT wins the agriculture category narrowly over MOO by 5.7 points because its timing score (83.0 vs 70.0) and risk-reward structure (56.9 vs 49.0) better suit a pullback-into-value setup when breadth and volume are both thin. WEAT's stochastic RSI at 0.31 rising mid-zone beats MOO's completely oversold at 0.00, a critical distinction when price sits only 8.9% above the 50-week in neutral structure. The 13-week return of -2.8% signals weakness, but WEAT's MACD shows improvement (bearish but improving) and its category-relative strength matches the median at 0.0%, making it a neutral expression of the commodity rather than a broken trade. MOO's -1.7% distance to support and oversold stochastic without turn-up cues suggest one more leg lower is possible. Both names suffer from thin volume participation (0.63x and similar), but WEAT's superior timing setup and neutral-to-improving momentum meter edge out MOO's risk-reward ceiling.
Agriculture & Livestock receives the 5% tier-2 allocation despite a final score of only 27.6, one of the lowest in the portfolio and reflecting significant macro headwinds. The category-level macro fit is 55.0/100, propped up by real asset sponsorship (+8) and commodity breadth positive (+5), but crushed by disinflation pressure (-8). This creates a structural tension: the commodities framework is intact, but falling inflation expectations undercut price support. WEAT's 52.9 reasoned score and 53.0/100 technical evidence are marginally above MOO's 43.4, but both are modest. The allocation to tier-2 is a portfolio balance decision—agriculture provides real-asset diversification and serves as a secondary inflation hedge in case disinflation reverses. However, the low score and weak technical setup make this a tactical hold, not a strategic position. WEAT must hold support at 29.60 and show volume pickup to justify renewal; any break below that level suggests removing the allocation entirely in favor of higher-conviction real assets like Industrial Metals.
Traditional Energy — XLE
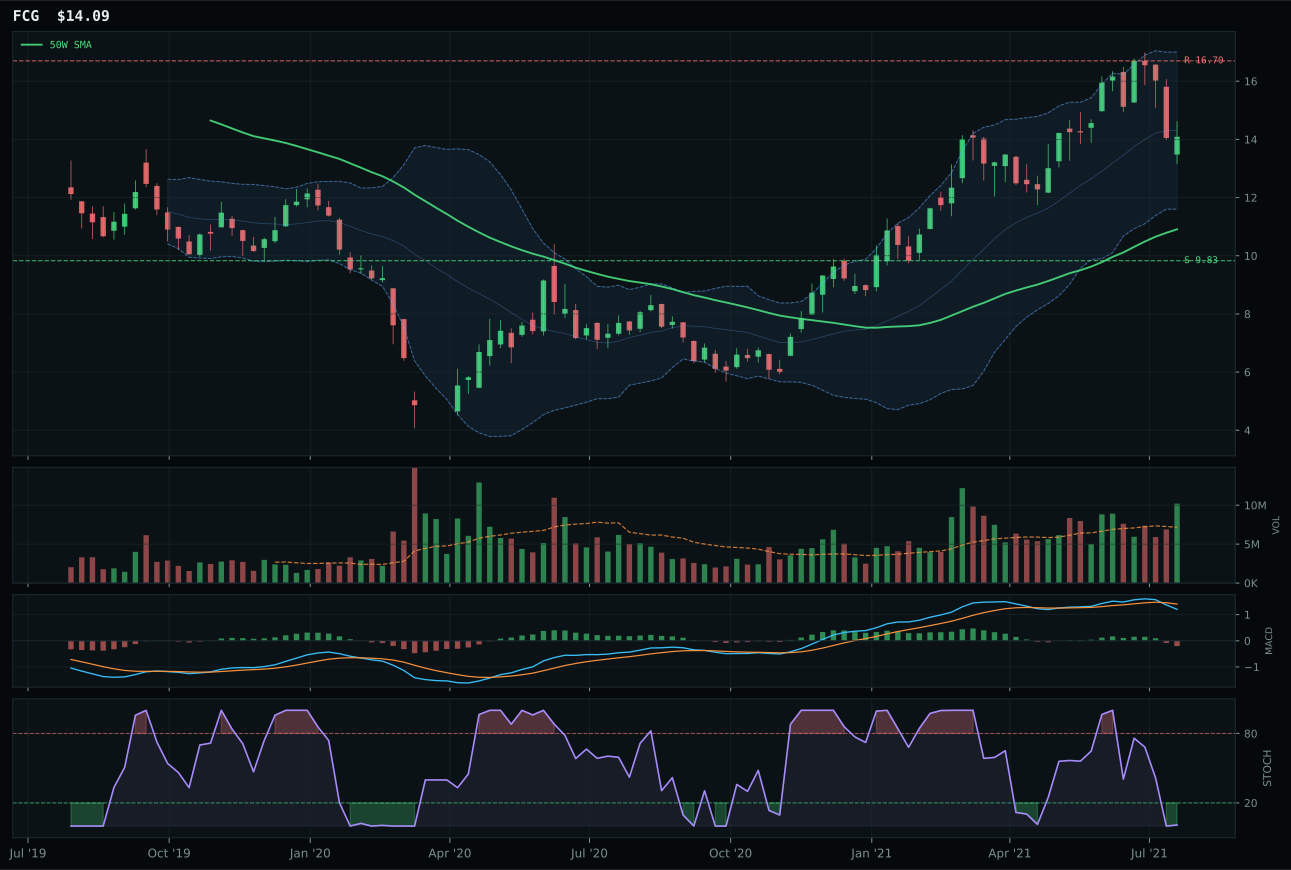
FCG has a vertical extension profile with 9.2% 13-week relative strength versus SPY.
A failed hold above support would weaken the setup.
Actionable but governed by invalidation levels.
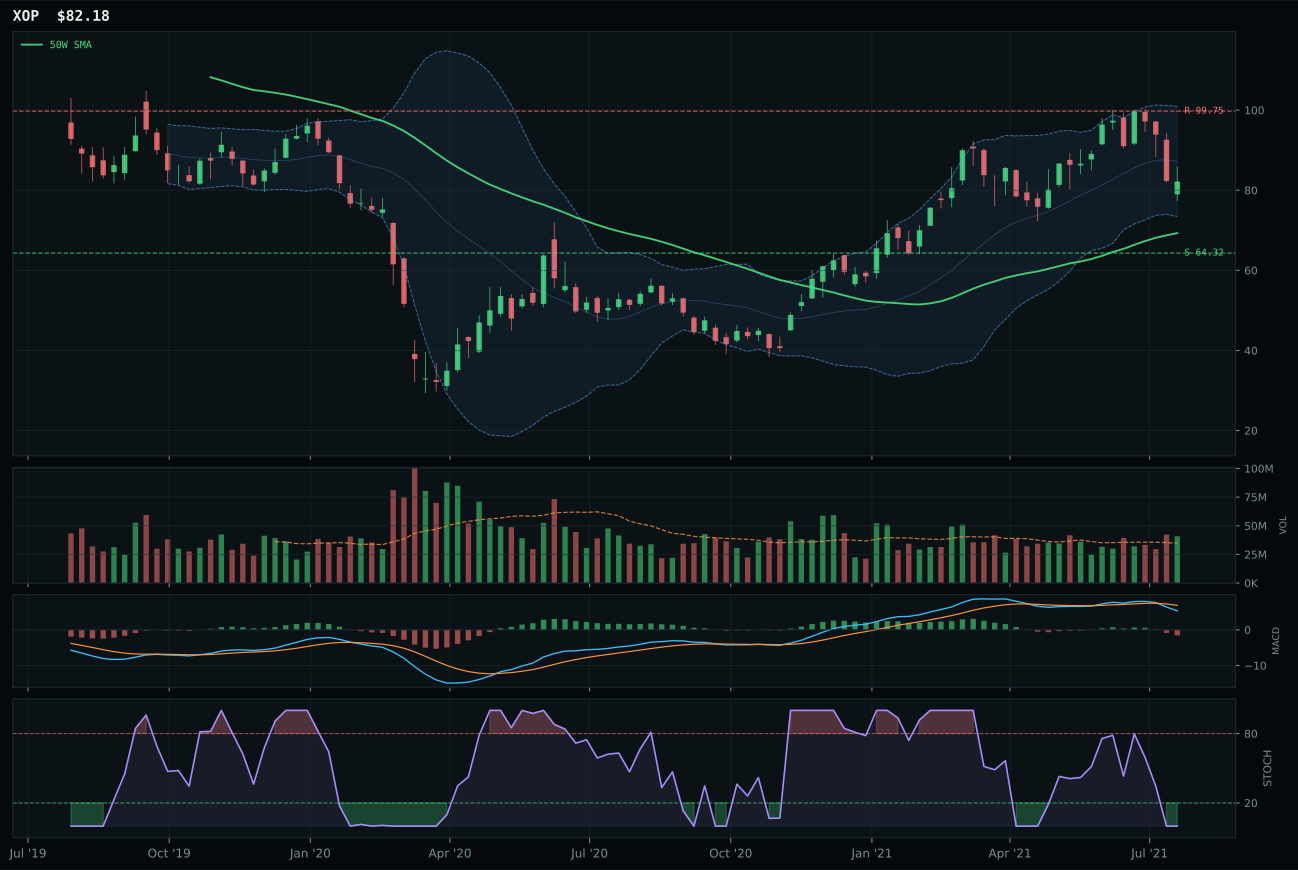
XOP has a vertical extension profile with 2.7% 13-week relative strength versus SPY.
A failed hold above support would weaken the setup.
Actionable but governed by invalidation levels.
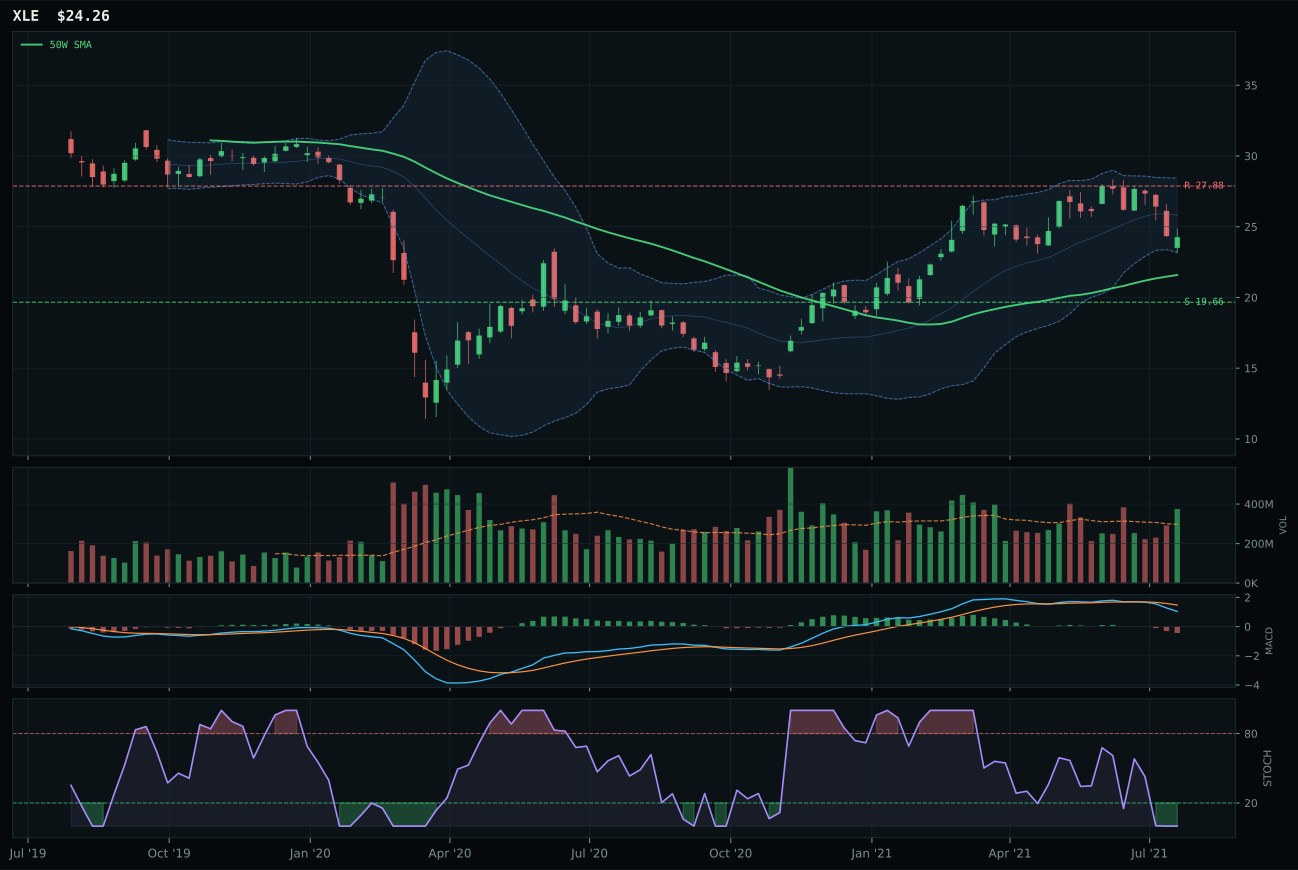
XLE has a neutral structure profile with -3.5% 13-week relative strength versus SPY.
A failed hold above support would weaken the setup.
Actionable but governed by invalidation levels.
XLE wins the traditional energy category over FCG by 7.4 points because its timing score (70.0 vs 48.0) and risk-reward (55.0 vs 36.5) prove more constructive in a near-term weak setup. Both XLE and FCG show bearish-weakening MACD and oversold stochastic RSI, but FCG is stretched 29.2% above the 50-week in vertical extension (Fib near 52W high), whereas XLE sits only 12.4% above in neutral structure. XLE's 23.4% downside to support versus FCG's 7.1% creates vastly different risk asymmetry: FCG offers 16.8% upside to resistance but at -13.0% cost to downside capture, while XLE trades at -13.0% upside with 23.4% downside room, a much more balanced near-term equation. The 13-week returns slightly favor FCG (14.7% vs 2.1%), but FCG's 9.2% SPY relative strength versus XLE's -3.5% speaks to a momentum bounce rather than conviction accumulation. XLE's neutral structure and higher volume participation (1.26x) make it the cleaner reset.
Traditional Energy receives 0% allocation this week, ranking 9th or 10th in the portfolio, despite XLE winning its internal category match. The category score of 20.3 is among the lowest, and macro conditions are actively hostile: disinflation pressure (-10), credit stress (-7), and Goldilocks providing only modest help versus the lower real-asset sponsorship (+7) explain the rout. Category-level macro fit sits at only 40.0/100, a clear indicator that energy is fighting the regime. XLE's technical evidence of 23.4/100 and momentum confirmation of 4.3/100 are abysmal—the portfolio is not just avoiding energy on macro grounds, it is also rejecting the technical setup. The broad-market bear descriptor (-8 at the AI level) suggests growth is stil intact despite pullbacks, and in that environment, cyclical energy underperforms. XLE must demonstrate sustained momentum off its 19.66 support, show volume-price sponsorship pickup, and benefit from a macro regime shift (real asset sponsorship rising, disinflation pressure reversing) to re-enter the allocation conversation. Until then, the 0% slot reflects a rational triage: with only 10 categories and two top-2 positions filled by higher-conviction names, Tier-2 (5% each) goes to Industrial Metals spin-offs and defensive overlays before energy gets a hearing.
Emerging Markets — INDA
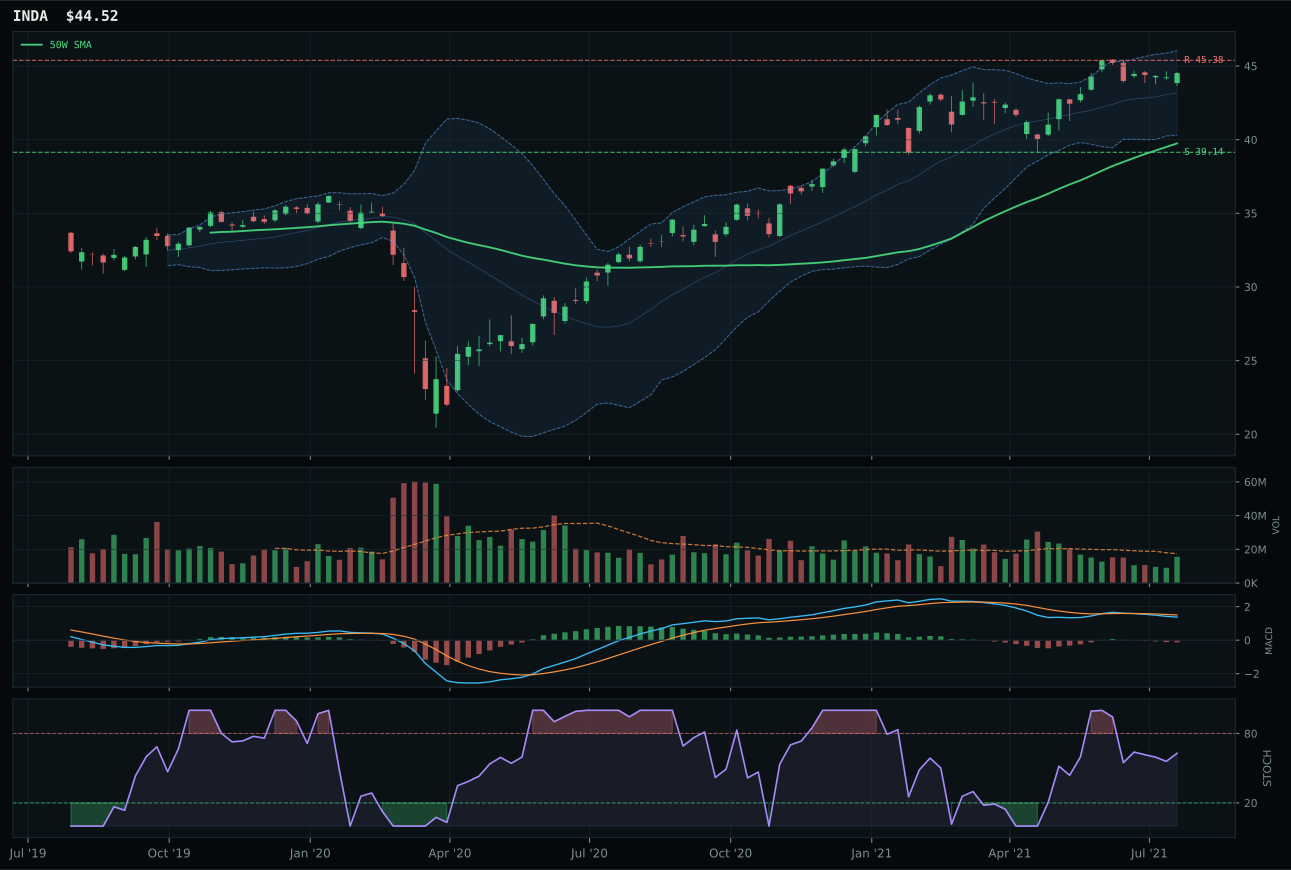
INDA has a neutral structure profile with 5.6% 13-week relative strength versus SPY.
A failed hold above support would weaken the setup.
Actionable but governed by invalidation levels.
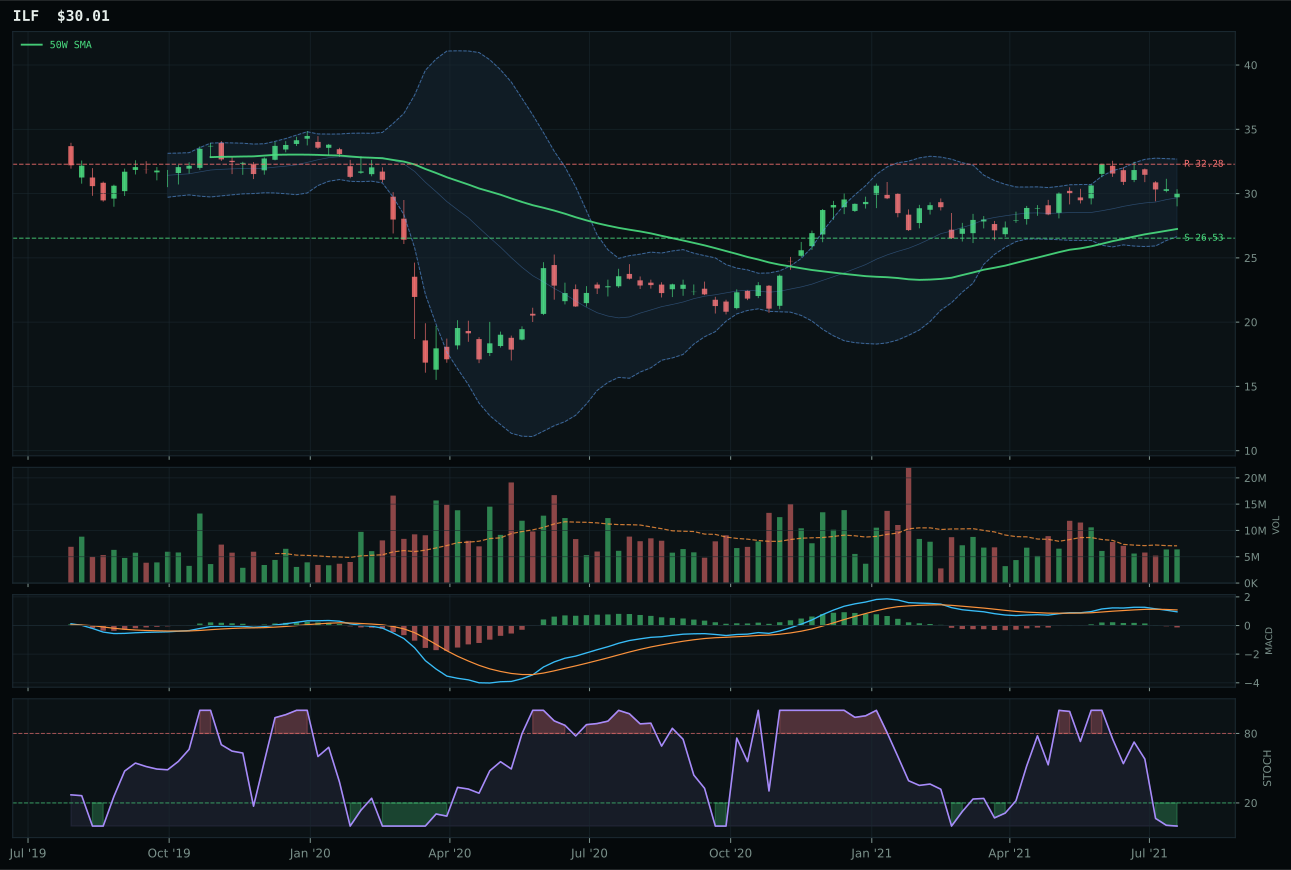
ILF has a neutral structure profile with -1.7% 13-week relative strength versus SPY.
A failed hold above support would weaken the setup.
Actionable but governed by invalidation levels.
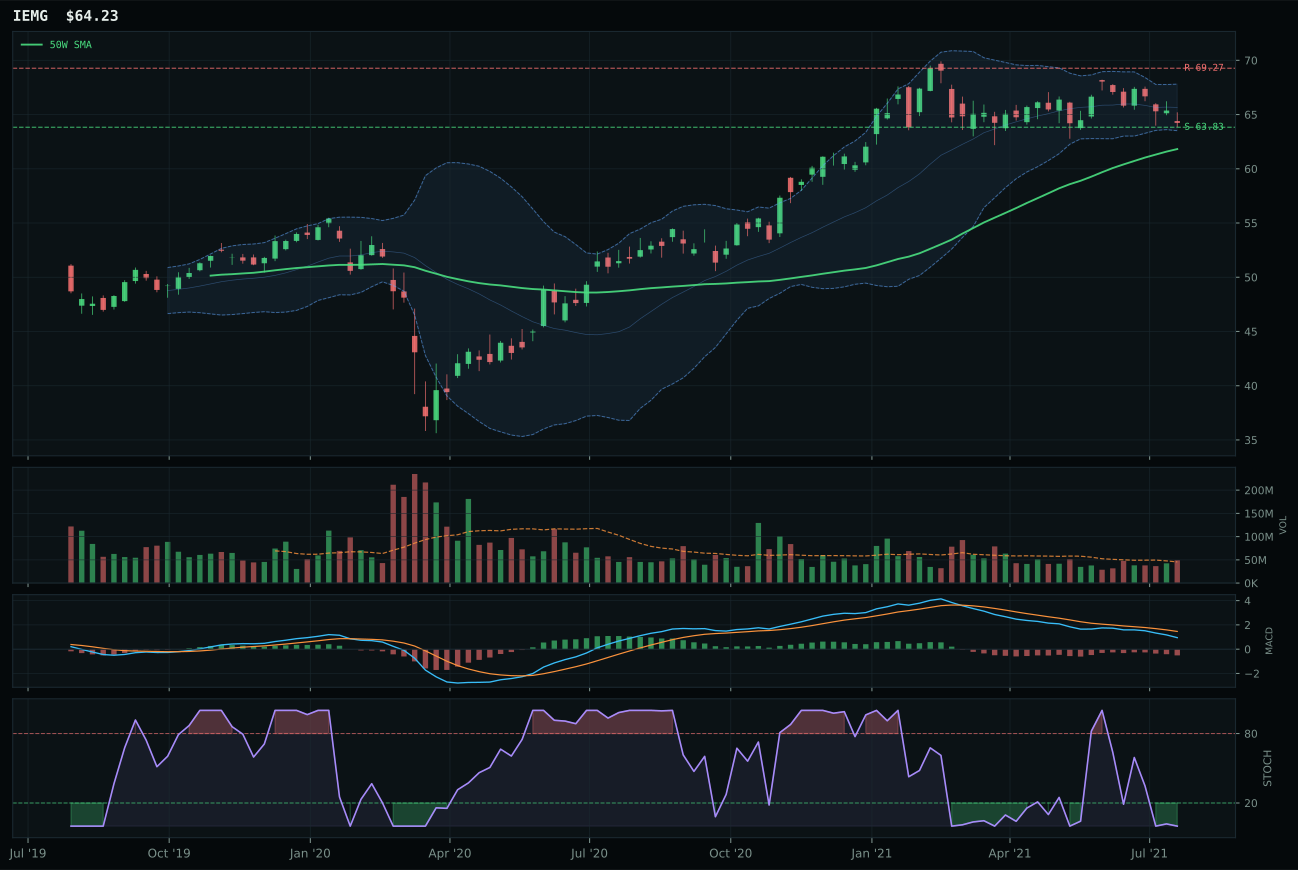
IEMG has a pullback into support profile with -8.4% 13-week relative strength versus SPY.
A failed hold above support would weaken the setup.
Actionable but governed by invalidation levels.
INDA wins the emerging markets category by 14.5 points over ILF because its structure cleanliness (73.1 vs 68.6), stochastic RSI timing (rising mid-zone at 0.63 vs oversold at 0.00), and category-relative strength (7.2% vs 0.0%) all signal early-stage momentum rather than terminal exhaustion. INDA sits 12.0% above the 50-week with neutral structure and a rising stochastic in the mid-zone, a setup where buyers are in control but price has not extended so far that distribution is underway. The 11.2% 13-week return and 5.6% SPY relative strength are the strongest in the field. ILF's -1.7% SPY relative strength and 3.9% 13-week return place it in a recovery-false-start pattern typical of value rotations that fail to persist. INDA's trend score of 90.4/100 versus ILF's 60.0/100 reflects that India quality is leading in the emerging universe right now. IEMG posts strong numbers but uses a pullback-into-support setup (Fib middle retracement) that is less constructive for new accumulation.
Emerging Markets receives 0% allocation this week, ranking 9th or 10th despite INDA showing the strongest technical evidence (59.1/100) in its category and the only rising stochastic setup. The category score of 20.2 is the second-lowest in the portfolio, crushed by macro headwinds: dollar pressure (-14), credit stress (-10), and broad market bear (-9) overwhelm the modest Goldilocks help (+8) and liquidity expansion (+8). Category-level macro fit of 33.0/100 is a red flag. The portfolio decision is straightforward: when dollar strength is active and credit stress is mounting, emerging markets—especially those sensitive to U.S. rates and dollar flows—become crowded trades fighting the regime. INDA's quality/growth exposure and 5.6% SPY relative strength suggest it would be the least damaged, but the macro friction is too high to justify allocation. INDA must wait for dollar pressure to reverse, credit stress to ease, or broad market bear to flip before earning a position. Until then, the 0% slot reflects rational risk management: INDA's technical edge cannot overcome macro headwinds, and limited portfolio bandwidth prioritizes higher-conviction names like Industrial Metals and Technology.