
2021-07-16
Informational purposes only. The content in this report, including allocations, analysis, and commentary, is provided solely for informational and educational purposes. It does not constitute financial advice, investment advice, trading advice, or any other type of advice. Past performance does not guarantee future results. Always conduct your own research and consult a qualified financial professional before making investment decisions.
Weekly Allocation
| Ticker | Category | Weight | Role |
|---|---|---|---|
| FBTC | 50% | Overlay | |
| XLK | Technology | 10% | Top-2 (10%) |
| INDA | Emerging Markets | 10% | Top-2 (10%) |
| COPX | Industrial Metals | 5% | Tier-2 (5%) |
| SMH | AI | 5% | Tier-2 (5%) |
| GLD | Precious Metals | 5% | Tier-2 (5%) |
| WEAT | Agriculture & Livestock | 5% | Tier-2 (5%) |
| XLU | Utilities & Infrastructure | 5% | Tier-2 (5%) |
| ITA | Defense & Aerospace | 5% | Tier-2 (5%) |
Trade Instructions — Monday Open
Sell the tranche from 2021-06-18 (completing its 4-week hold). Buy the new tranche. Instructions show net portfolio changes — same-asset positions cancel, weight changes show the delta.
| Action | Ticker | Instruction |
|---|---|---|
| SELL | FSOL | Sell 25% of FSOL position (reduce 50.00% → 37.50%) |
| SELL | IGV | Sell 40% of IGV position (reduce 6.25% → 3.75%) |
| SELL | FCG | Sell 25% of FCG position (reduce 10.00% → 7.50%) |
| SELL | REMX | Sell 33% of REMX position (reduce 3.75% → 2.50%) |
| SELL | XAR | Sell 33% of XAR position (reduce 3.75% → 2.50%) |
| BUY | INDA | Buy INDA — 6.25% of freed cash (adds 1.25% to portfolio) |
| BUY | COPX | Buy COPX — 6.25% of freed cash (adds 1.25% to portfolio) |
| BUY | XLK | Buy XLK — 12.50% of freed cash (adds 2.50% to portfolio) |
| BUY | ITA | Buy ITA — 6.25% of freed cash (adds 1.25% to portfolio) |
| BUY | FBTC | Buy FBTC — 62.50% of freed cash (adds 12.50% to portfolio) |
| BUY | GLD | Buy GLD — 6.25% of freed cash (adds 1.25% to portfolio) |
Current Portfolio After Trade
Combined holdings across all 4 active tranches. Each tranche is 25% of the portfolio.
| Ticker | % of Portfolio | Weight Bar |
|---|---|---|
| FSOL | 37.50% | |
| FBTC | 12.50% | |
| FCG | 7.50% | |
| INDA | 5.00% | |
| XLU | 5.00% | |
| XLK | 5.00% | |
| SLV | 3.75% | |
| IGV | 3.75% | |
| REMX | 2.50% | |
| XAR | 2.50% | |
| SMH | 2.50% | |
| ILF | 2.50% | |
| MOO | 2.50% | |
| COPX | 2.50% | |
| ITA | 2.50% | |
| GLD | 1.25% | |
| WEAT | 1.25% |
Macro Regime — Goldilocks
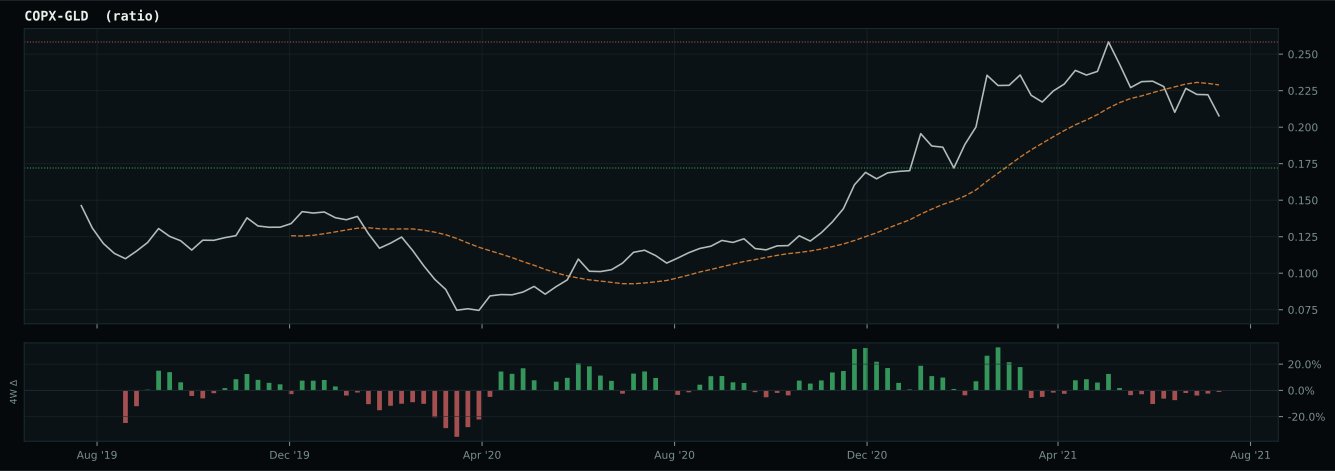
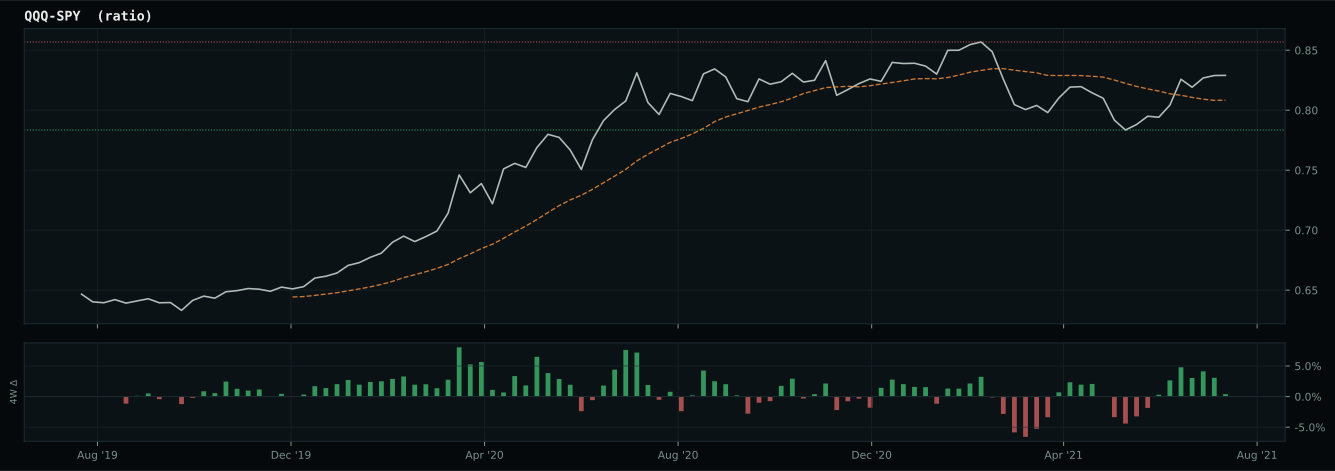
Macro Evidence Charts
Market-implied signals behind the macro regime scores. Each ratio compares two assets; the direction and slope of the ratio is what the macro engine reads.
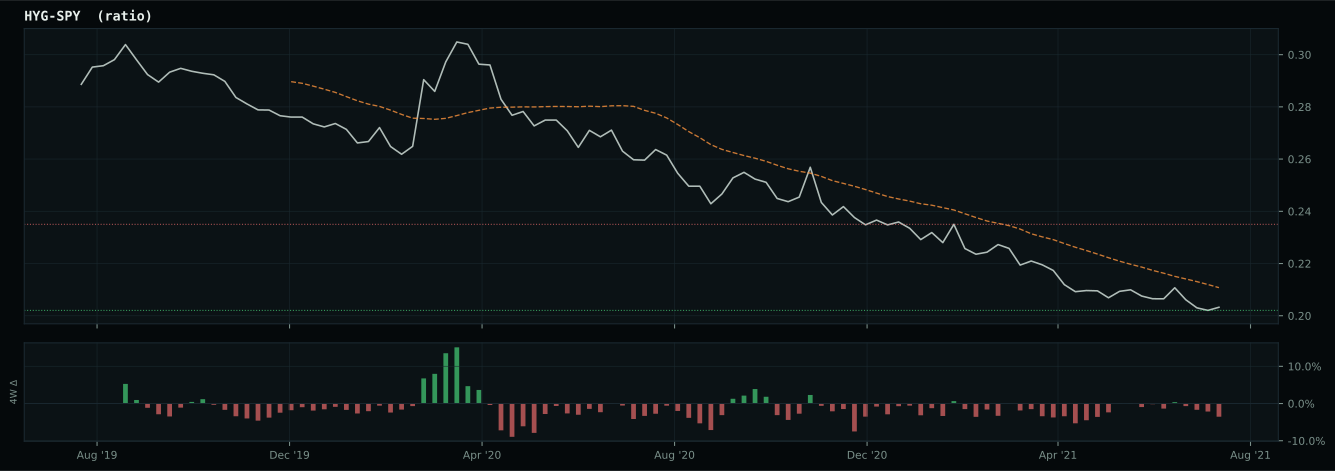
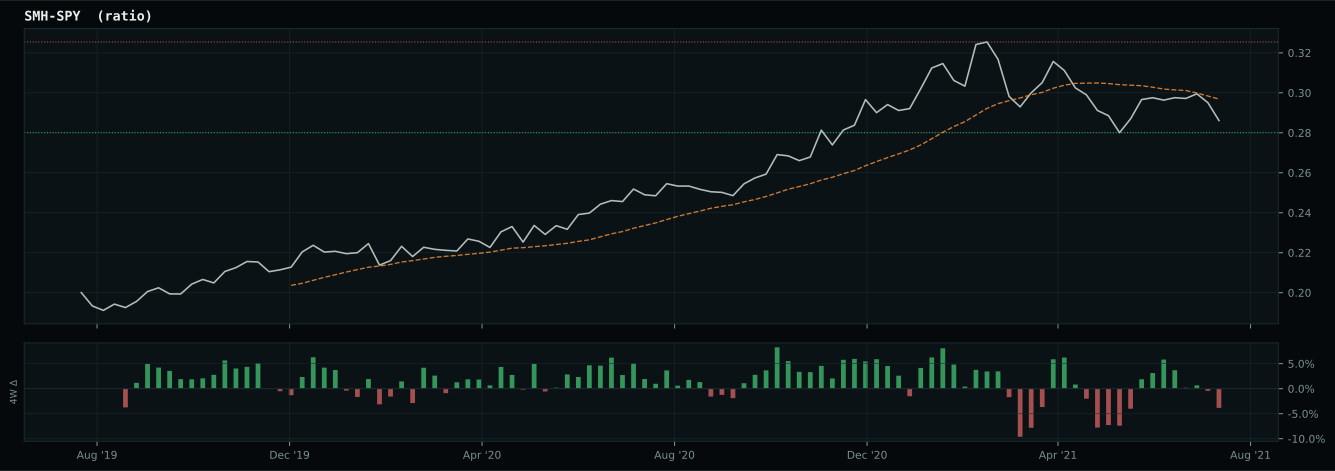
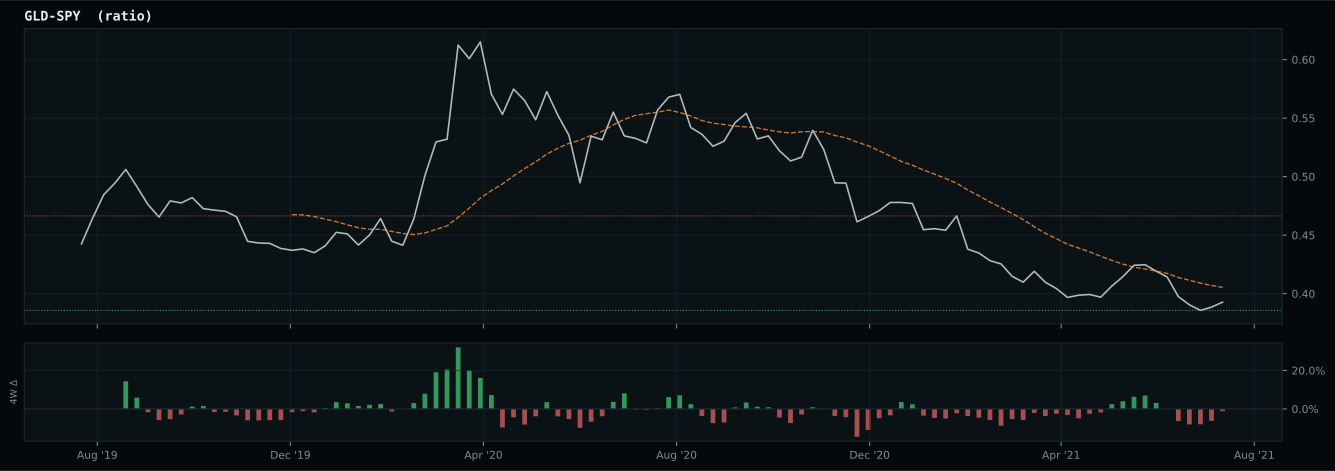
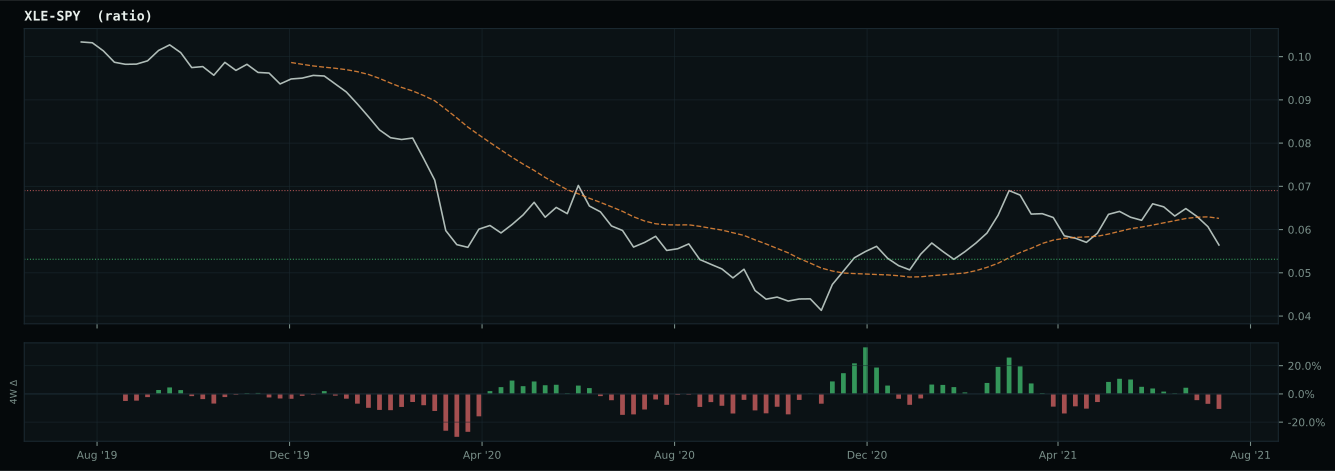
Crypto Regime — TrendBTC
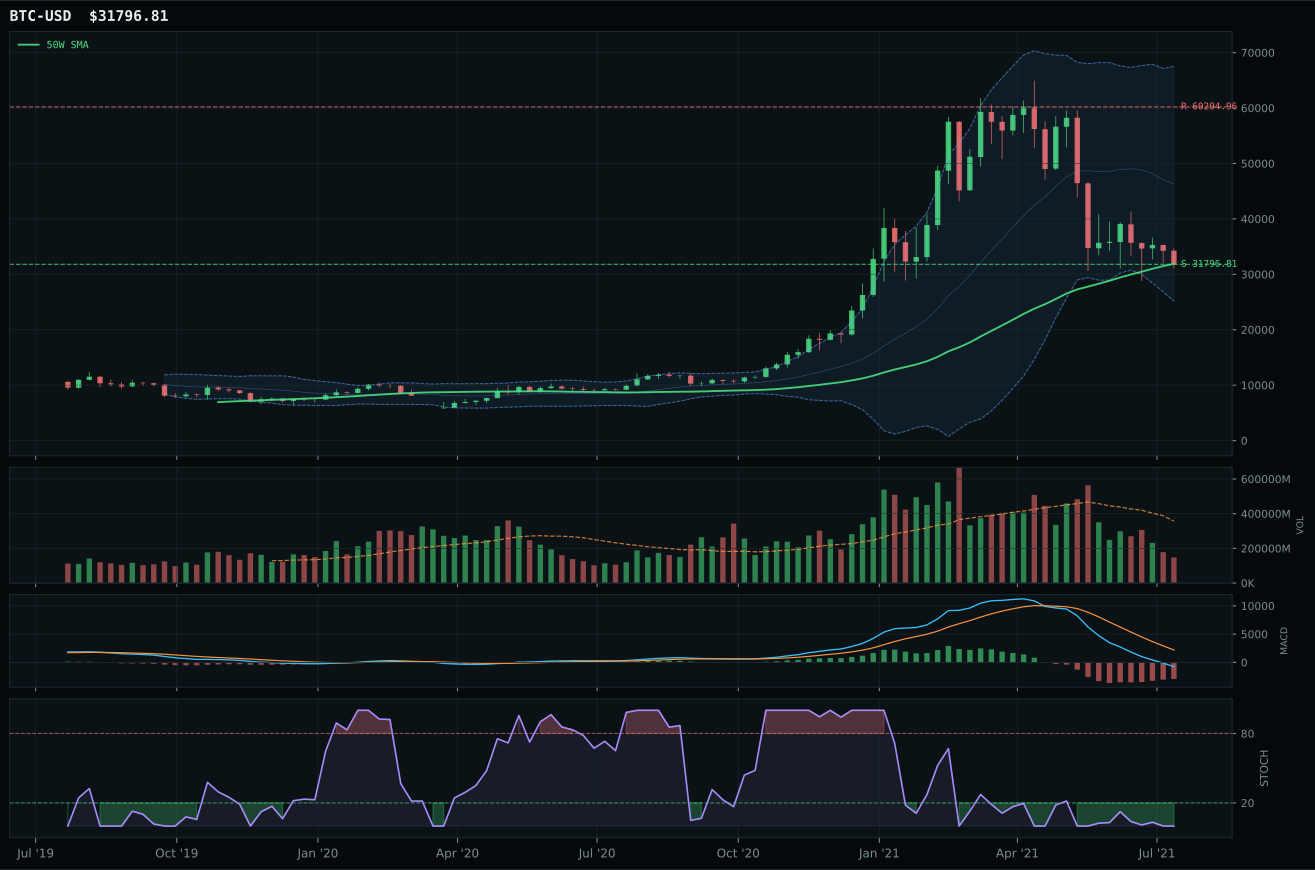
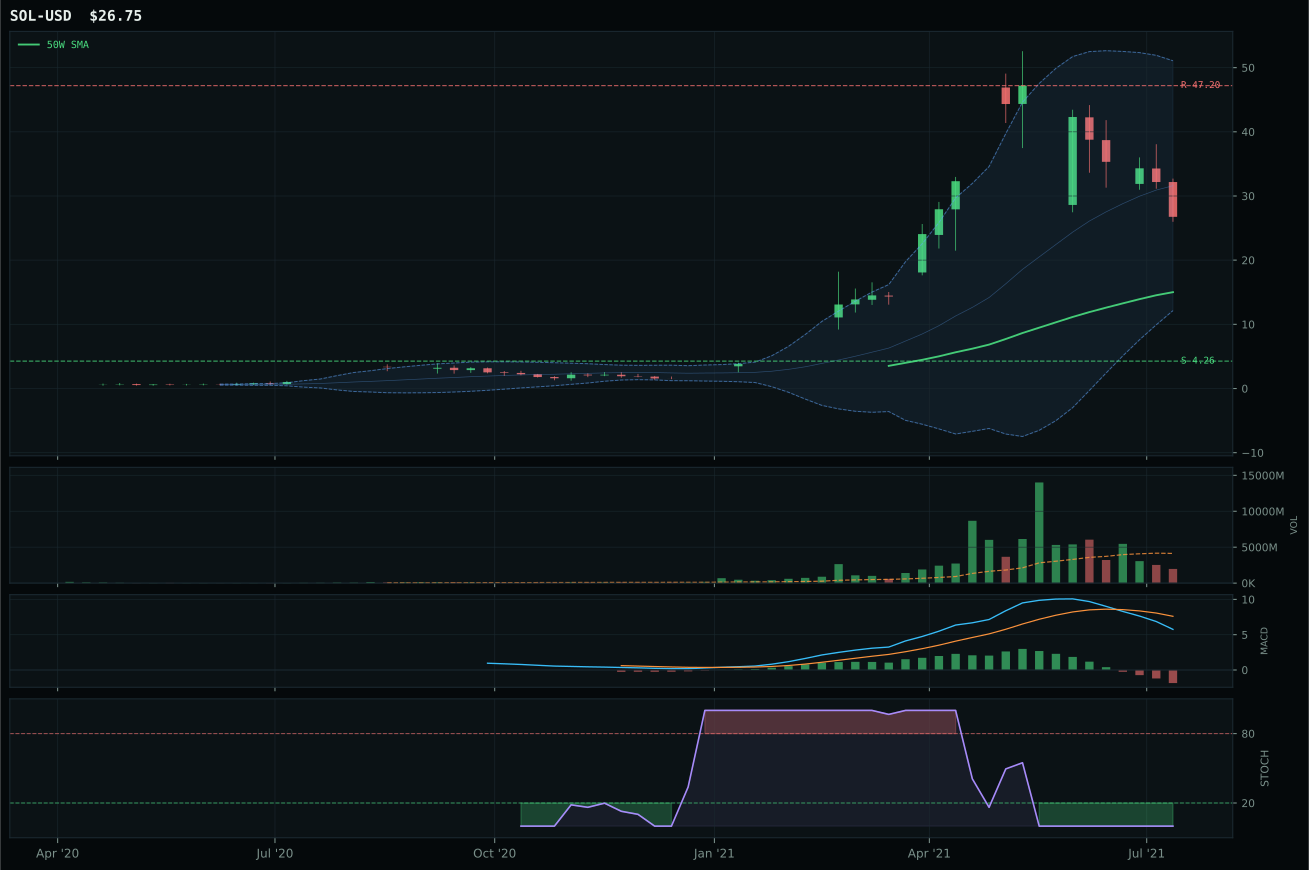
ValueBTC not armed: BTC has not made the first post-breakdown touch of the 200W buy zone after losing the 50W
TrendBTC not confirmed
one or more available conditions failed
Category Rankings
| Rank | Category | Winner | Score | Alloc | 4W Ret | Peers (4W) |
|---|---|---|---|---|---|---|
| 1 | Technology | XLK | 69.1 | 20% | +4.11% | CIBR +4.5% · IGV +5.5% |
| 2 | Emerging Markets | INDA | 51.2 | 20% | +5.68% | ILF -0.1% · IEMG -2.6% |
| 3 | Industrial Metals | COPX | 47.3 | 10% | +10.78% | REMX +15.4% · PICK +8.1% |
| 4 | AI | SMH | 42.6 | 10% | +7.48% | AIQ +3.4% · BOTZ +7.2% |
| 5 | Precious Metals | GLD | 38.7 | 10% | -1.64% | SLV -6.3% · GDX -2.0% |
| 6 | Agriculture & Livestock | WEAT | 36.7 | 10% | +8.41% | MOO +4.8% · VEGI +6.2% |
| 7 | Utilities & Infrastructure | XLU | 35.5 | 10% | +4.06% | IGF +2.4% · PAVE +10.4% |
| 8 | Defense & Aerospace | ITA | 35.1 | 10% | +4.45% | XAR -0.3% · ROKT +1.4% |
| 9 | Nuclear Energy | URA | 32.5 | 0% | -1.00% | NLR +1.2% · URNM +2.0% |
| 10 | Traditional Energy | XLE | 21.2 | 0% | +3.68% | XOP -0.2% · FCG -0.8% |
Technology — XLK
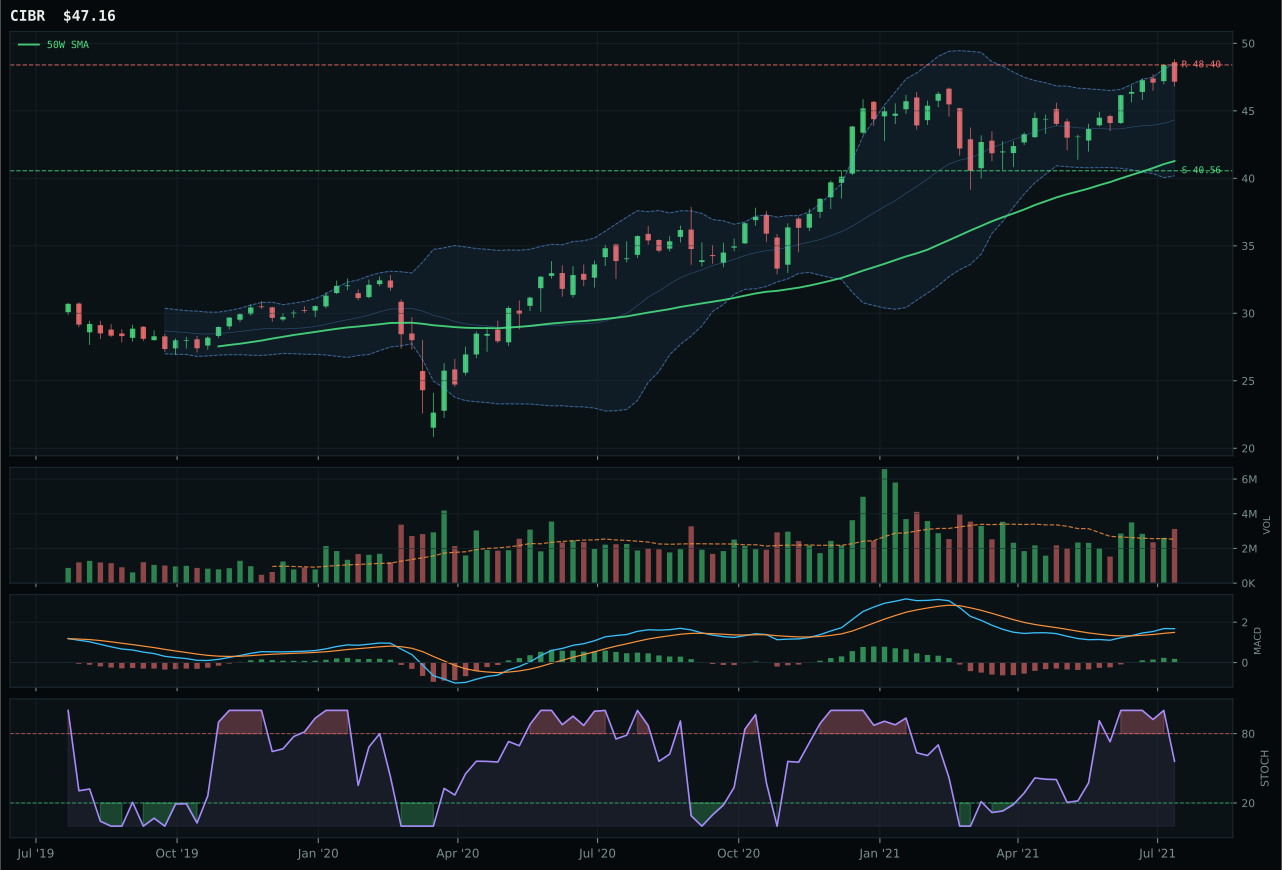
CIBR has a neutral structure profile with 2.7% 13-week relative strength versus SPY.
A failed hold above support would weaken the setup.
Actionable but governed by invalidation levels.
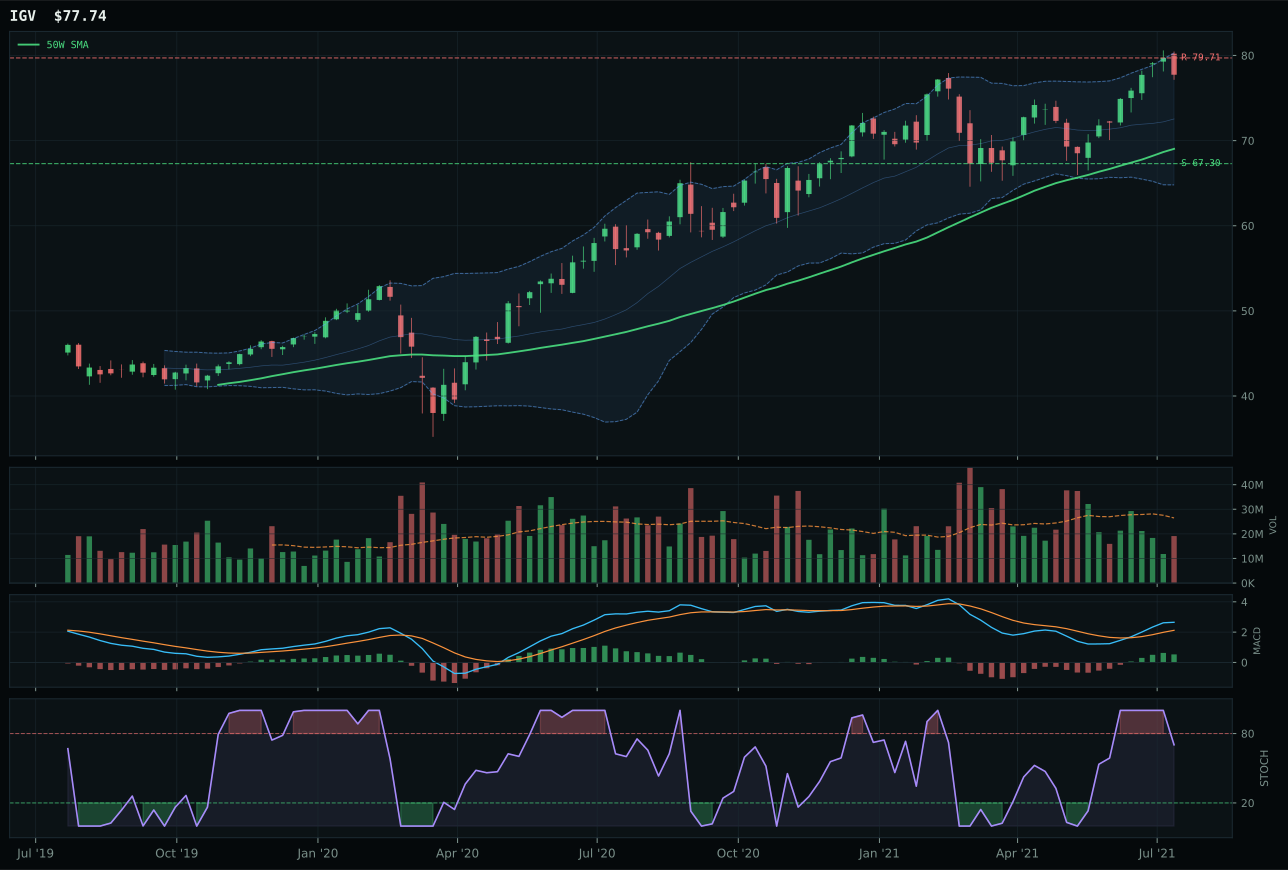
IGV has a neutral structure profile with 1.4% 13-week relative strength versus SPY.
A failed hold above support would weaken the setup.
Actionable but governed by invalidation levels.
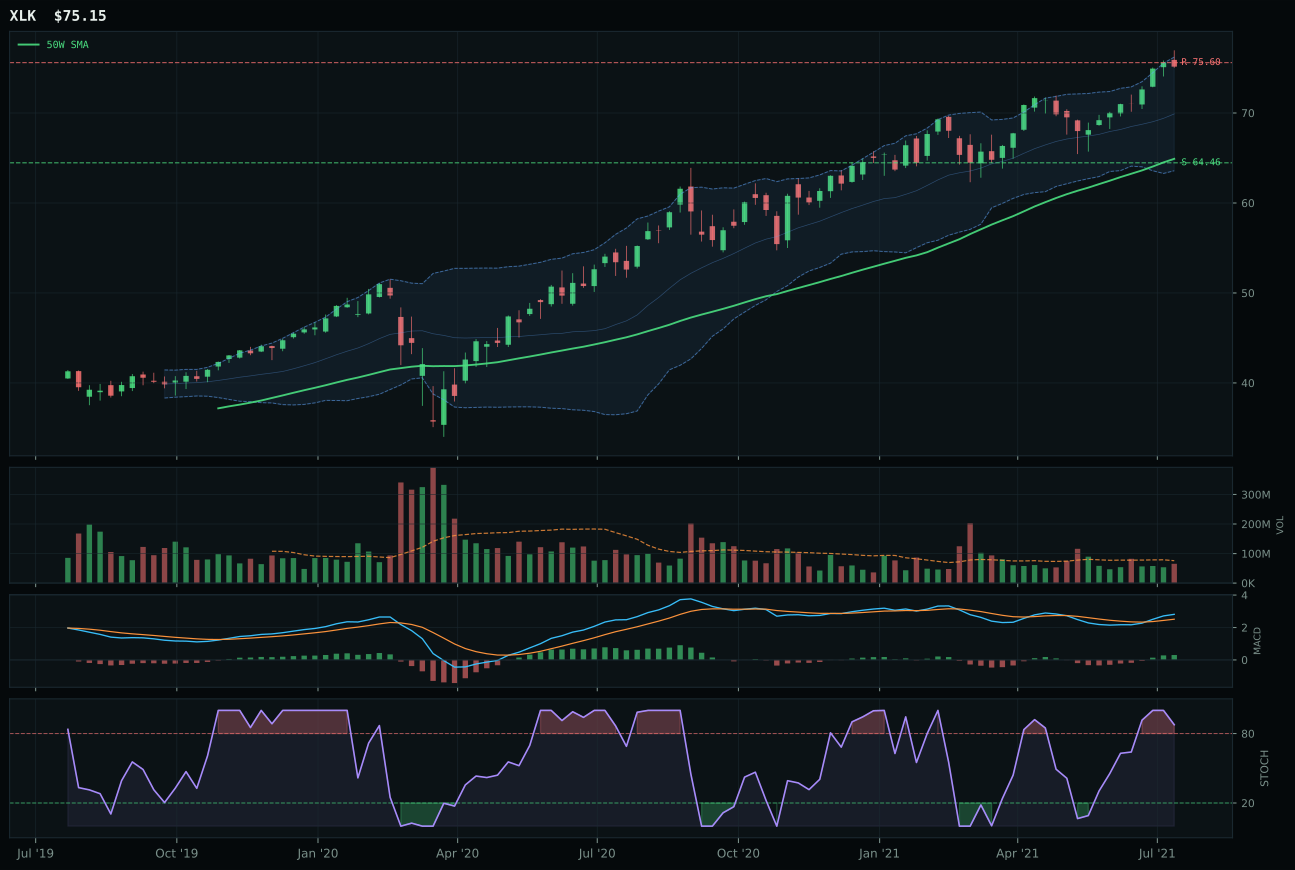
XLK has a vertical extension profile with 1.5% 13-week relative strength versus SPY.
A failed hold above support would weaken the setup.
Actionable but governed by invalidation levels.
XLK claimed the category by defending trend strength above both the 50W and 200W while maintaining a 0.6% positive slope, characteristics that anchor its perfect 100.0 trend score. The setup is vertically extended at 15.8% above the 50W—a penalty for entry risk—yet the 1.5% relative strength versus SPY and bullish, improving MACD preserve conviction despite stochastic RSI rolling over from overbought. CIBR lost not on trend (both hit 100.0) but on structure clarity: XLK's 77.8 structure score bested CIBR's 77.4, a narrow margin that reflects XLK's cleaner compression and tighter support-resistance bands at 64.46/75.60. The gap widened in timing, where XLK's 27.0 reflects the stretch penalty while CIBR's 75.0 timing score reveals the fundamental tension: cybersecurity sits in neutral structure with falling stochastic RSI, making it technically steadier but strategically less actionable when entry risk dominates the risk-reward calculus.
Technology claims top-2 status with a 10% allocation, one of only two categories earning this full share of capital in a 50% overlay environment where tier sizes halve to 10%/5%/0%. The 69.1 final score reflects a Goldilocks macro regime that carries a +9 benefit, paired with active liquidity expansion (+9) and disinflation pressure (+5) offsetting credit stress (-7). XLK's 1.5% relative strength to SPY justifies the capital commitment despite extension risk, because the macro backdrop supports technology's secular themes while valuation decompression from a year of outperformance remains incomplete. The allocation proves the system's bias toward trend-following leadership in low-volatility, expansionary conditions: when macro is stable and liquidity flows favor equities, riding proven winners with clean technicals beats chasing mean-reversion trades or hedges.
Emerging Markets — INDA
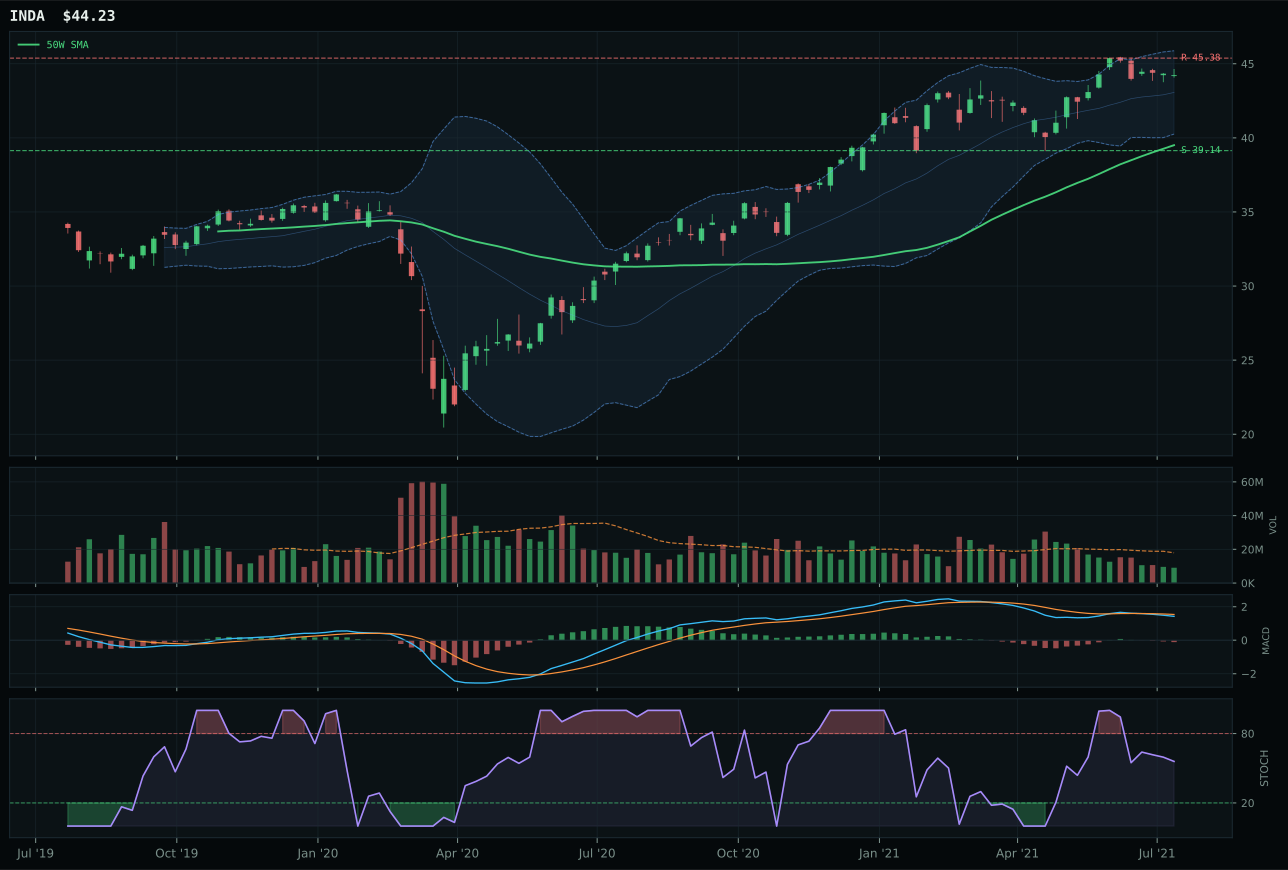
INDA has a neutral structure profile with 4.0% 13-week relative strength versus SPY.
A failed hold above support would weaken the setup.
Actionable but governed by invalidation levels.
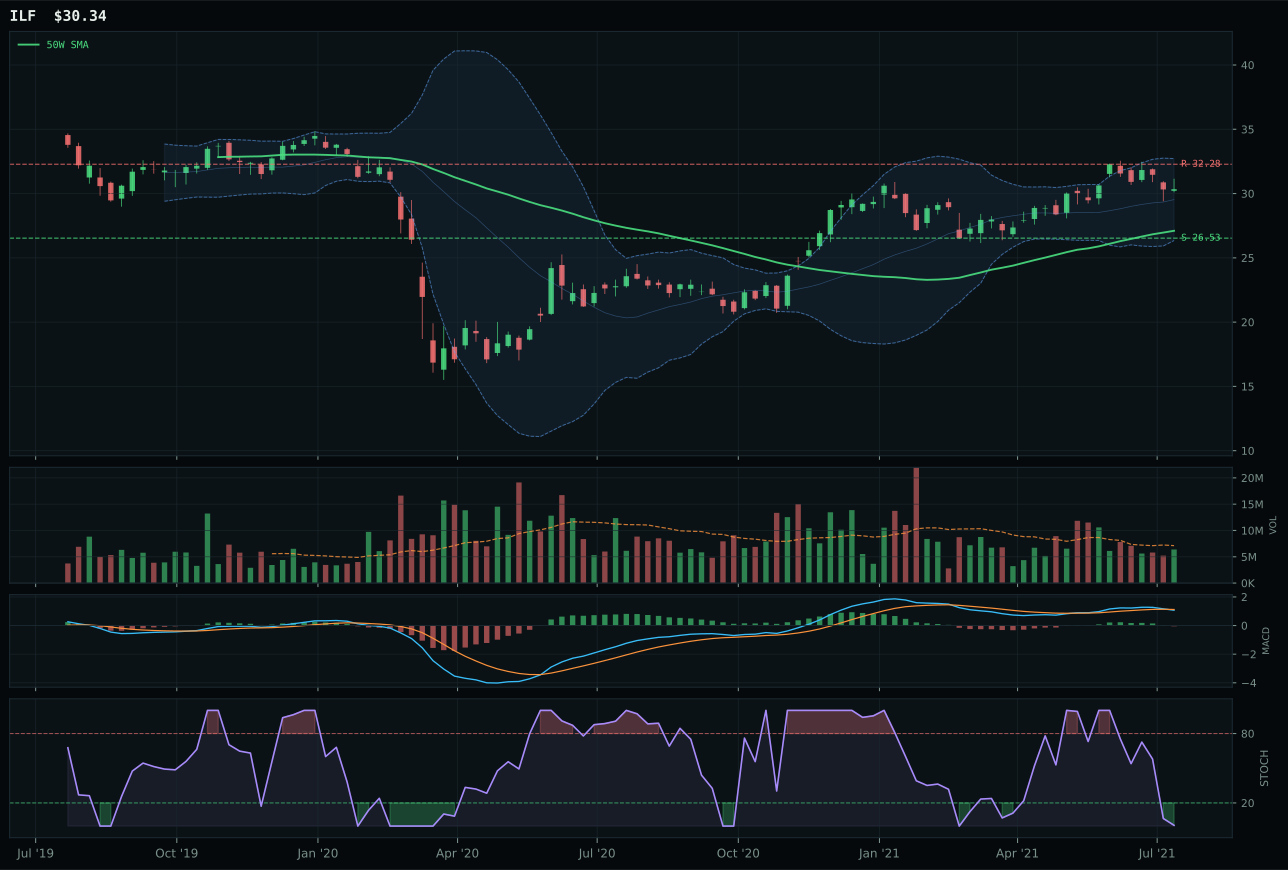
ILF has a neutral structure profile with 1.7% 13-week relative strength versus SPY.
A failed hold above support would weaken the setup.
Actionable but governed by invalidation levels.
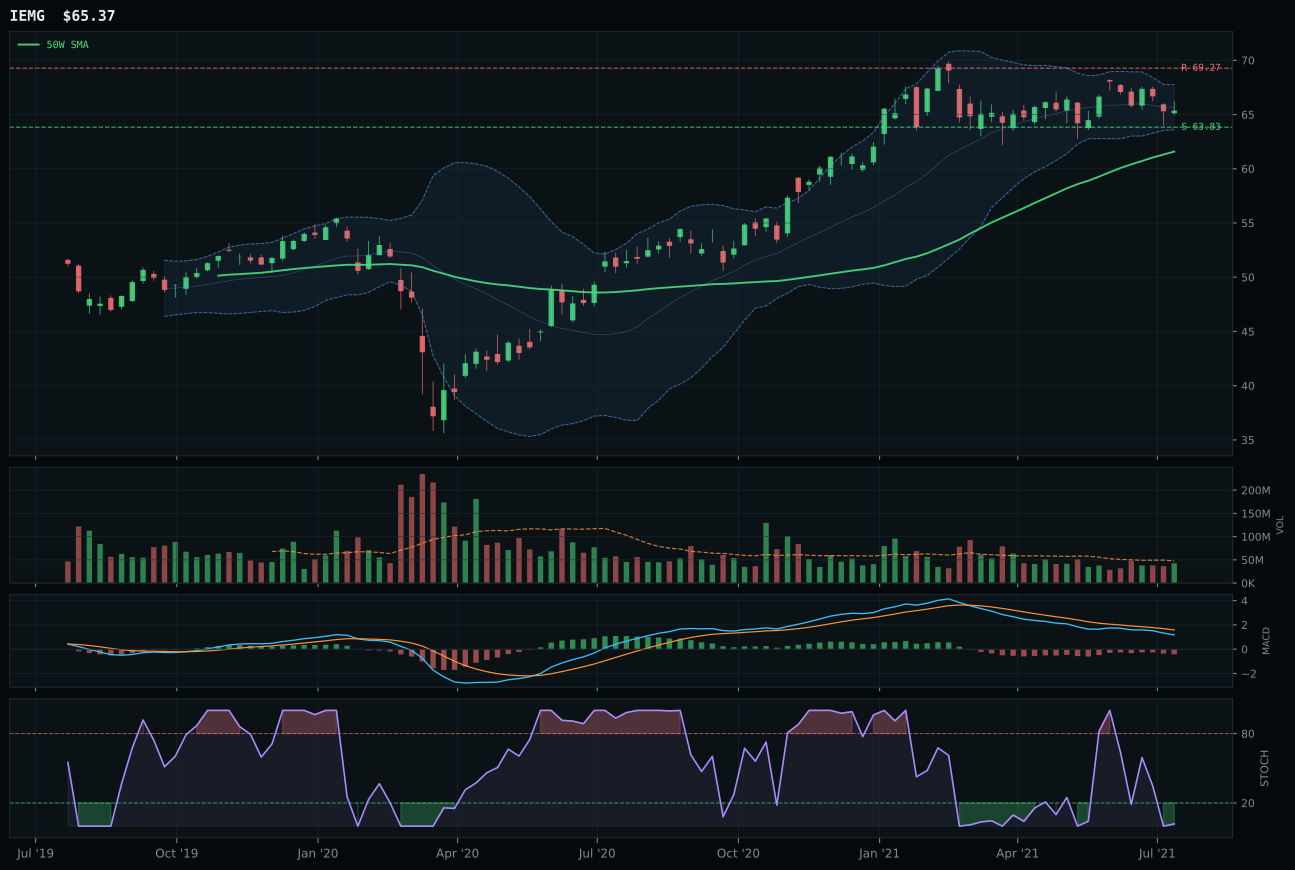
IEMG has a pullback into support profile with -3.9% 13-week relative strength versus SPY.
A failed hold above support would weaken the setup.
Actionable but governed by invalidation levels.
INDA seized top-2 status by combining the strongest trend score in the category (88.0) with +4.0% relative strength to SPY and +2.3% category-relative strength, a trifecta that distinguishes it sharply from broader EM exposure. The 7.4% 13W return and neutral structure with compression of 86.3 indicate buyers are accumulating in a non-stretched setup that attracts both momentum and value-conscious allocators. ILF's structure of 68.6 trails INDA's 71.2, and its 1.7% SPY-relative strength reveals Latin America's underperformance relative to India's growth narrative in a Goldilocks environment. INDA's thin volume participation (0.51x) mirrors its peers, yet its 88.0 trend score built on 0.6% 50W slope and Rs-to-SPY +4.0% indicates that the growth story is advancing despite light volume, a sign of fundamental accumulation rather than casual interest.
Emerging markets claims top-2 with 10% allocation, justified by a 51.2 score and macro fit of 70.0/100 anchored by active EM liquidity support (+14), Goldilocks backdrop (+8), and liquidity expansion (+8) offsetting credit stress (-10). INDA's trend score of 88.0 anchors the category's technical case, while the macro environment explicitly favors emerging market participation when developed market growth slows: current conditions feature steady global demand, falling U.S. rates, and EM currency strength. The 10% allocation reflects the system's conviction that India, as the category leader, offers cleaner growth exposure than developed-market tech with lower entry risk—INDA sits in neutral structure with 12.0% distance from the 50W versus XLK's extended 15.8% position. The top-2 ranking prioritizes macro regime alignment over pure technical extension, positioning the portfolio for a potential EM outperformance cycle if rates fall further or Chinese stimulus accelerates.
Industrial Metals — COPX
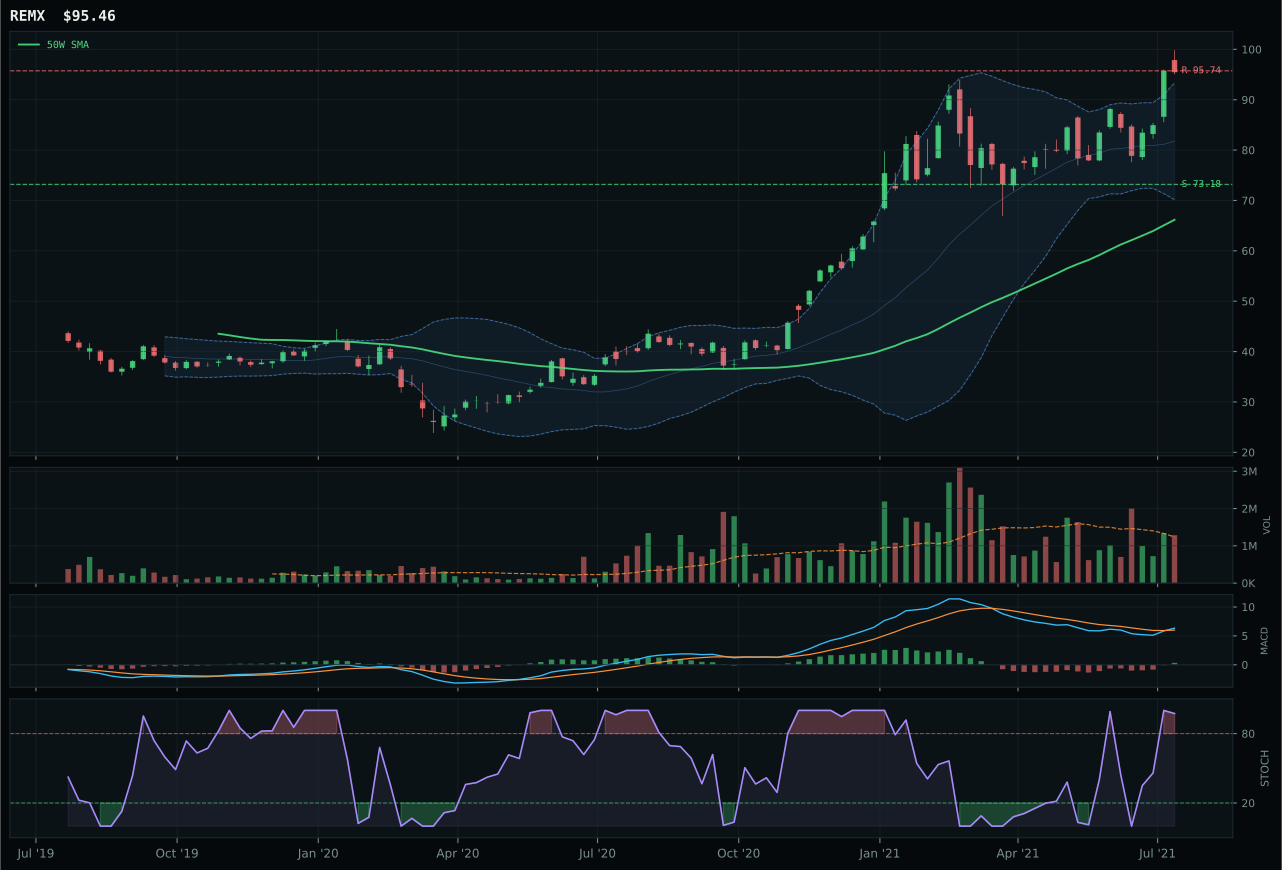
REMX has a vertical extension profile with 18.1% 13-week relative strength versus SPY.
A failed hold above support would weaken the setup.
Actionable but governed by invalidation levels.
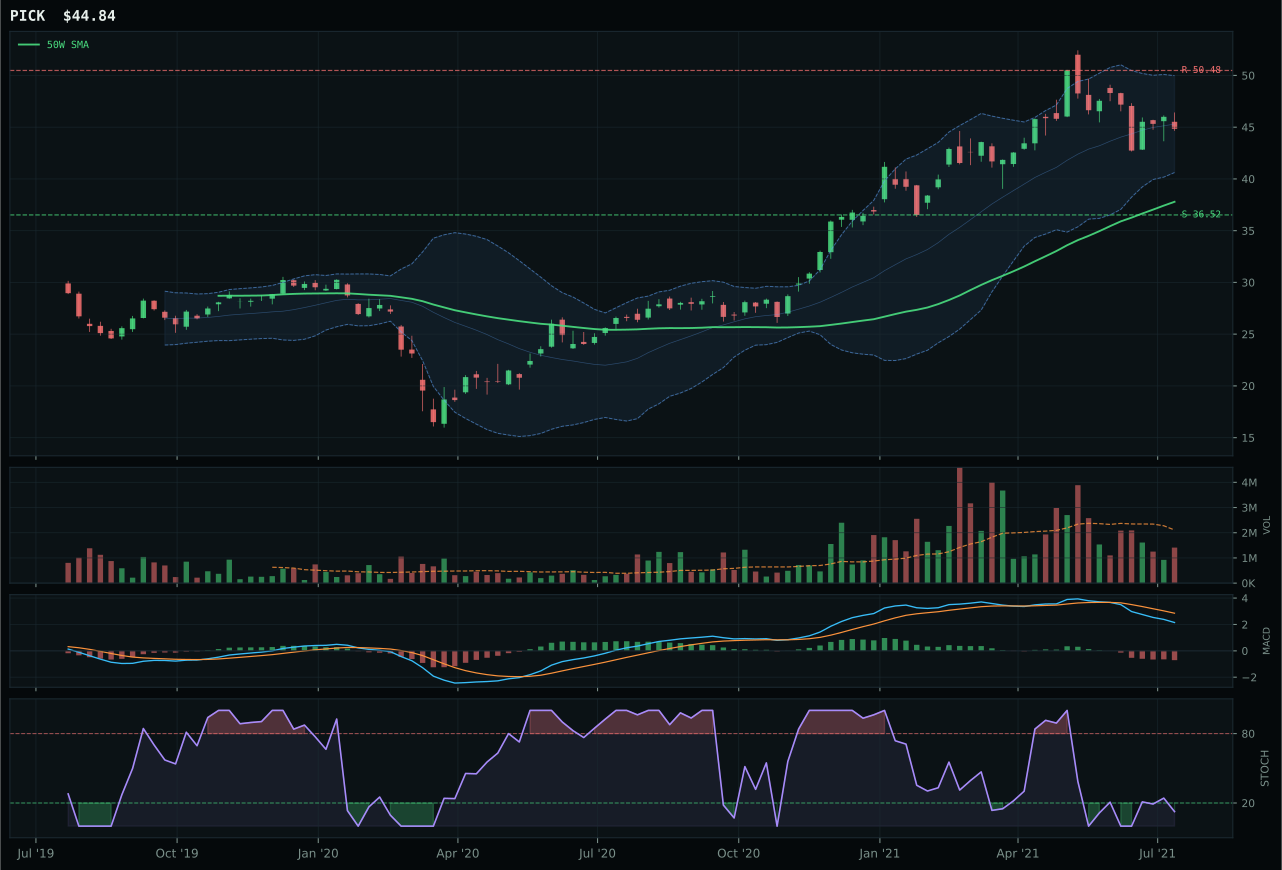
PICK has a vertical extension profile with -5.4% 13-week relative strength versus SPY.
A failed hold above support would weaken the setup.
Actionable but governed by invalidation levels.
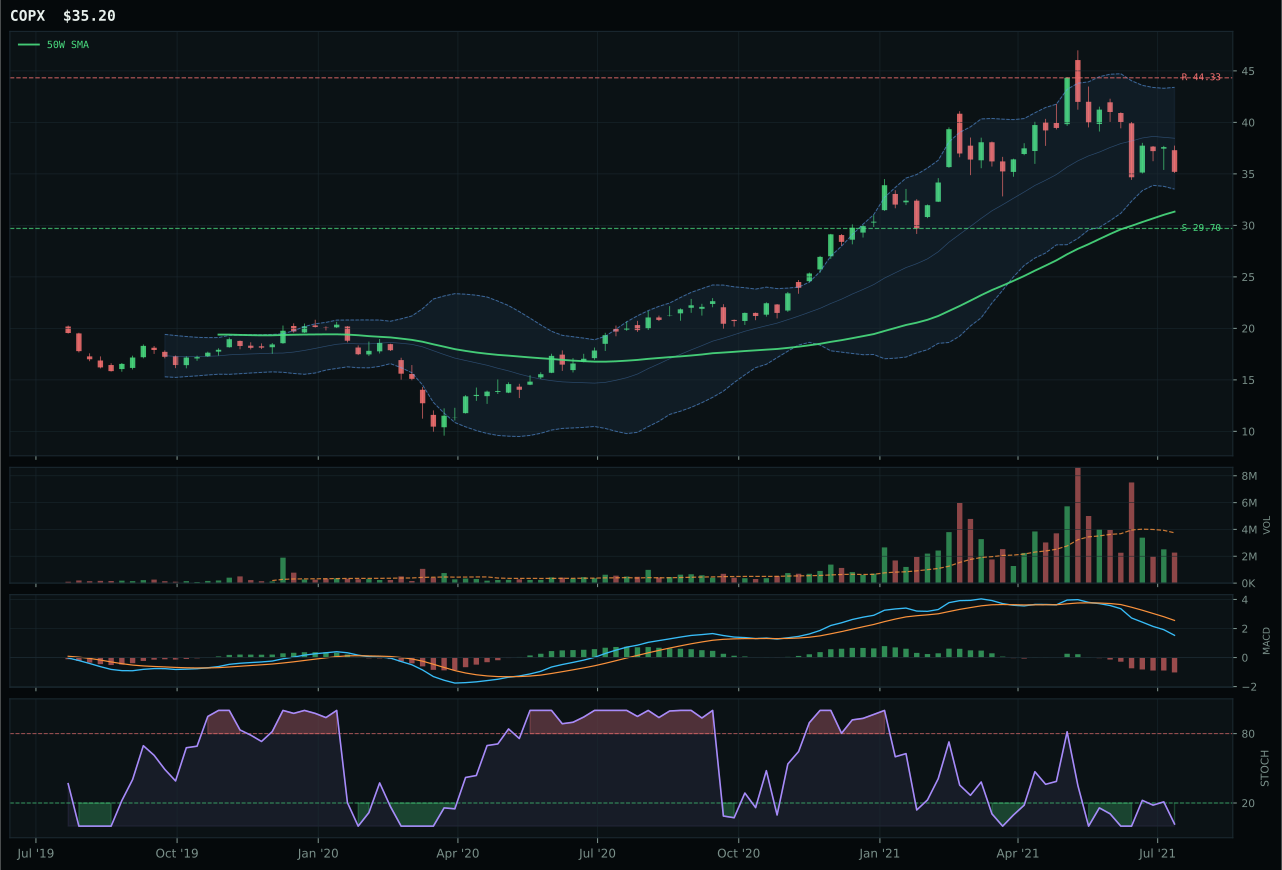
COPX has a neutral structure profile with -14.8% 13-week relative strength versus SPY.
A failed hold above support would weaken the setup.
Actionable but governed by invalidation levels.
COPX defeated REMX in a choice between a deeply oversold mean-reversion setup and an extended momentum leader, with the allocator choosing the pullback despite weakness. COPX sits just 12.3% above the 50W in neutral structure with stochastic RSI crushed at 0.02 and a -11.4% 13W return that signals capitulation; REMX races 44.3% above the 50W with overbought stochastic RSI, bullish improving MACD, and a +21.5% 13W return that screams late entry. COPX's 77.0 timing score reflects optimal retracement to the 0.382 Fib level and bearish MACD—conditions that reward accumulation near support when macro tailwinds persist. REMX's 37.0 timing score reflects vertical extension and overbought conditions; despite superior 78.3 technical evidence (trend 100.0, RS +18.1%), the risk-reward of -20.6% upside versus 18.5% downside makes it uninvestable. The message: when macro supports a trade (metals scarcity +14, commodity breadth +10), buy weakness, not strength.
Industrial metals earns 5% tier-2 with a 47.2 score because macro fit is strong at 79.0/100—metals scarcity active (+14), commodity breadth positive (+10), real asset sponsorship (+6)—yet COPX's technical evidence of only 20.6/100 (driven by zero momentum confirmation and thin volume participation) prevents tier-1 ranking. The category benefits from perhaps the strongest macro tailwind in this week's allocation—a Goldilocks backdrop explicitly favorable to scarce industrial inputs—but COPX's capitulation setup and -11.4% 13W return mean the opportunity is unfolding at an unfavorable price point. The 5% allocation reflects a macro conviction trade tempered by poor technical timing: this is a category to watch for accumulation signs, not to chase. If COPX consolidates for 2-3 weeks and volume picks up while MACD bottoms, the category could rapidly ascend to top-2 as the macro story outweighs entry risk; for now, the thin position acknowledges that buying fallen idols carries asymmetric downside if the commodity cycle extends the downturn.
AI — SMH
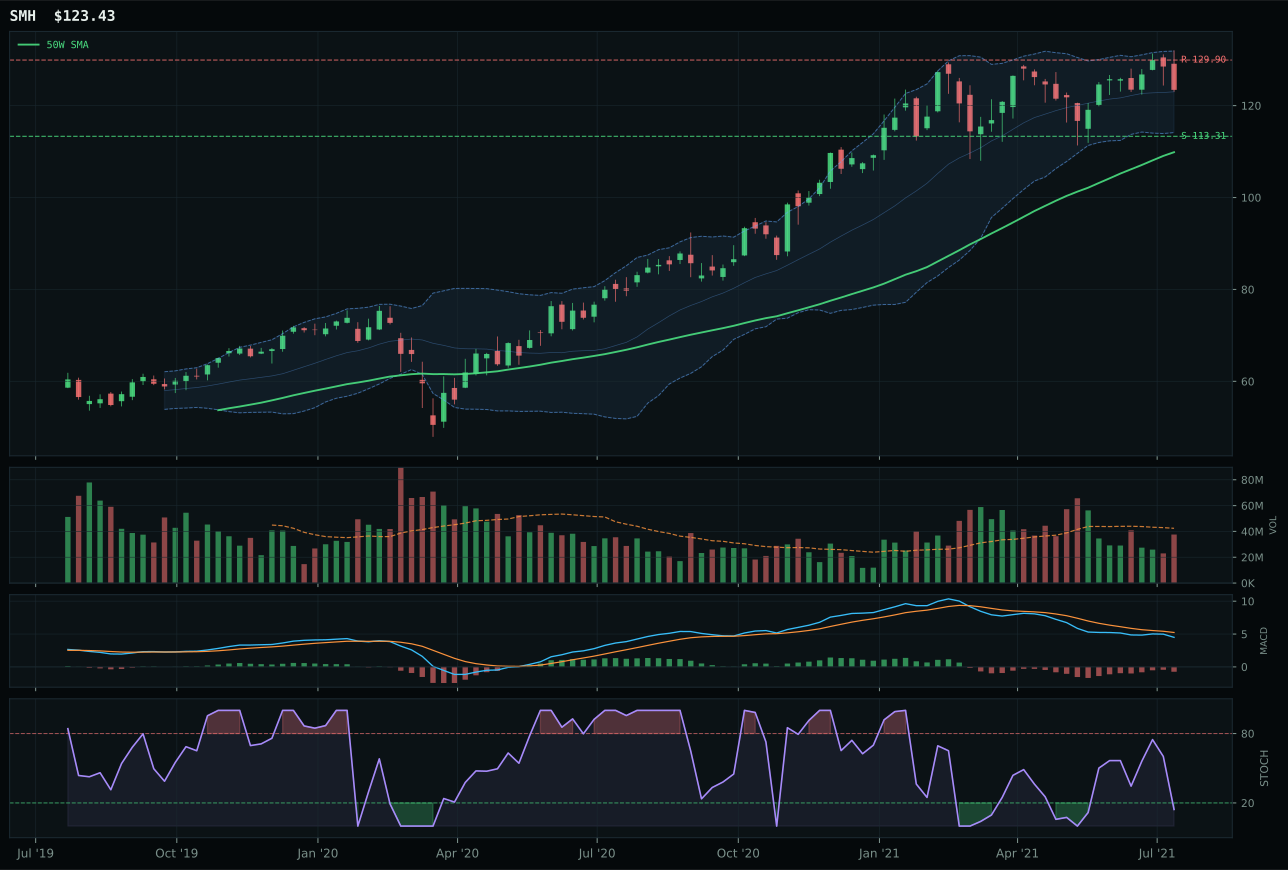
SMH has a neutral structure profile with -5.6% 13-week relative strength versus SPY.
A failed hold above support would weaken the setup.
Actionable but governed by invalidation levels.
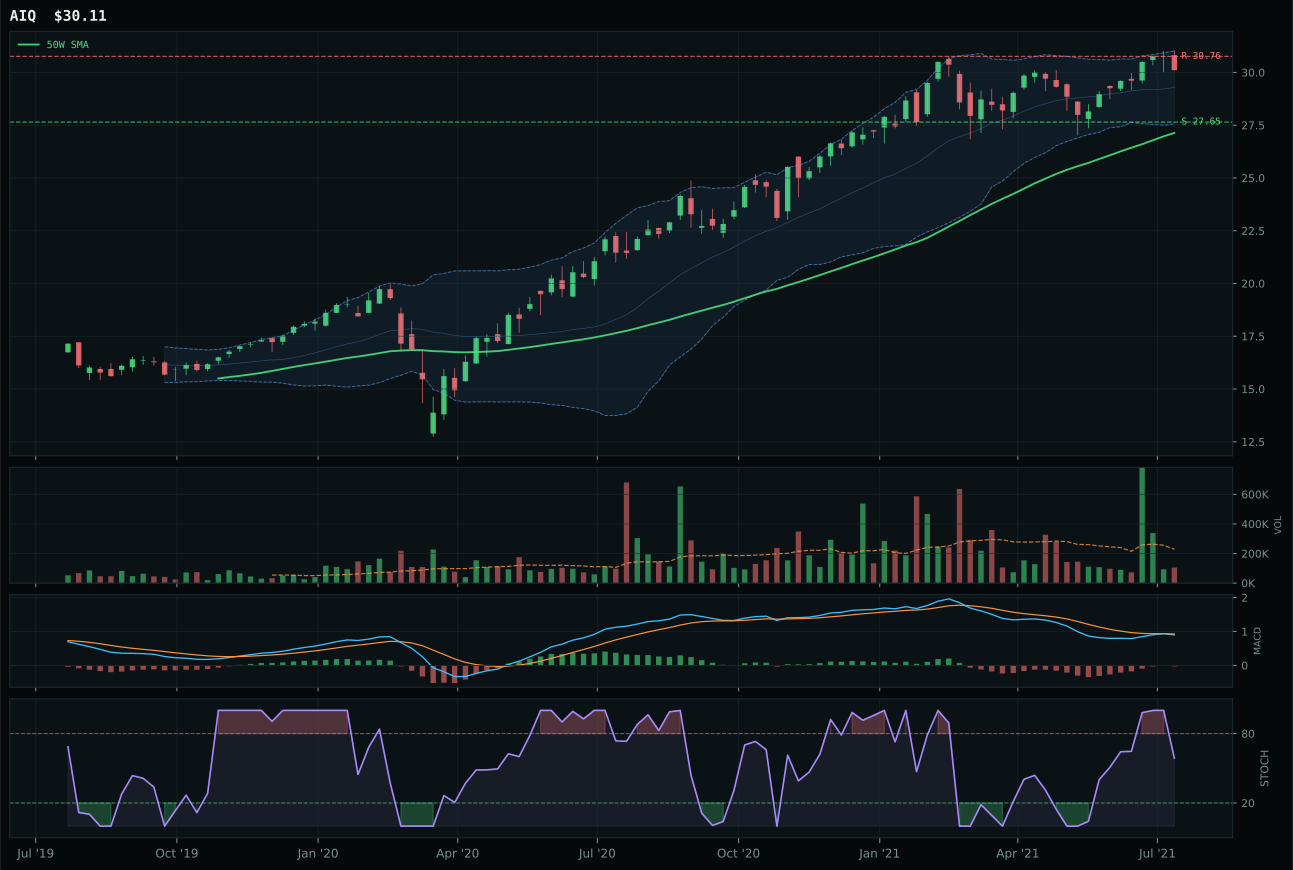
AIQ has a neutral structure profile with -3.0% 13-week relative strength versus SPY.
A failed hold above support would weaken the setup.
Tracked, but not top-2 eligible because: .
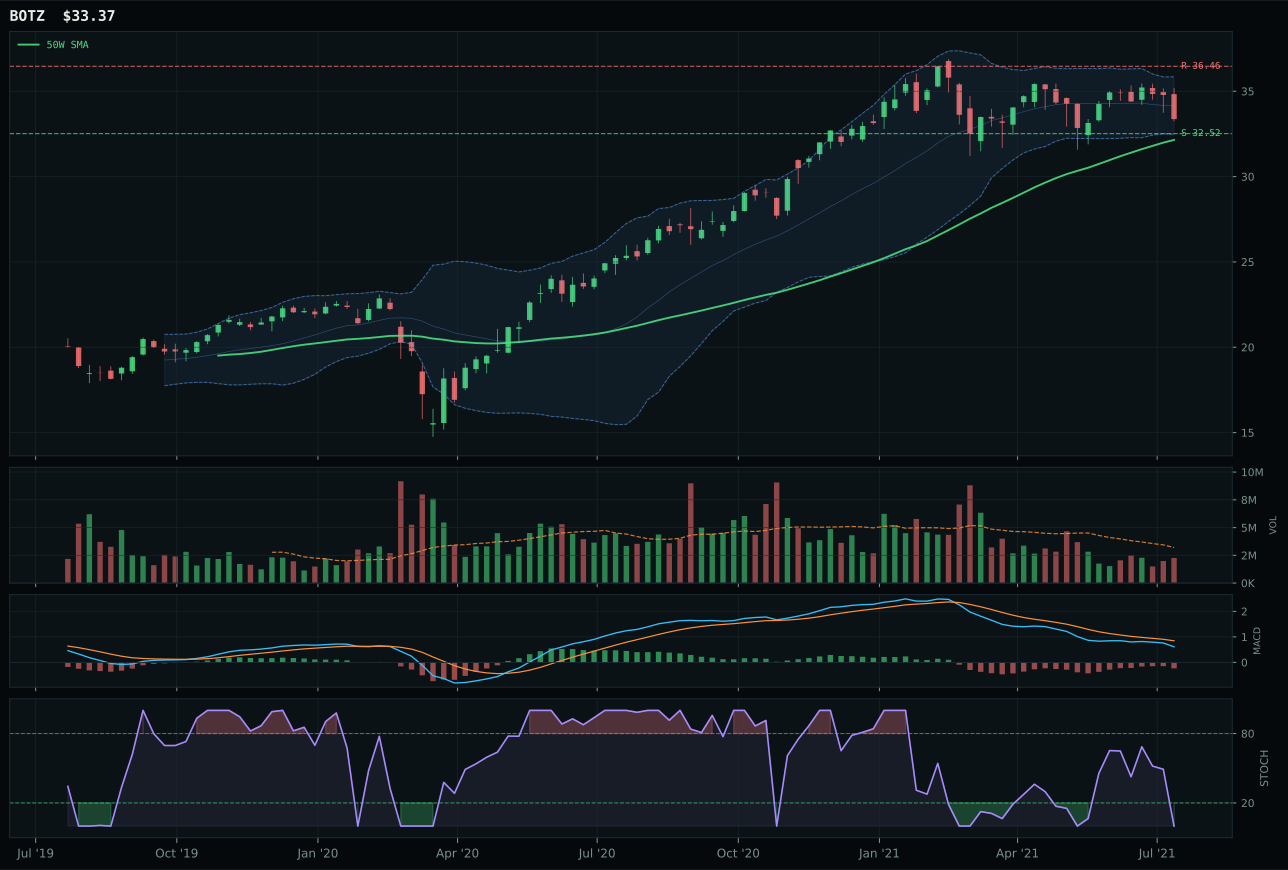
BOTZ has a pullback into support profile with -9.2% 13-week relative strength versus SPY.
A failed hold above support would weaken the setup.
Actionable but governed by invalidation levels.
SMH edged the AI category not through absolute momentum but through superior timing and risk-reward scaffolding in a pullback environment. Price sits 12.3% below the 50W in neutral structure with stochastic RSI deeply oversold at 0.14, a setup that historically rewards holding near support when breadth deteriorates but macro stays constructive. SMH's 75.0 timing score reflects this defensive recoil—the technical argument is that buyers can accumulate near 113.31 support without chasing an extended top. AIQ's 0.4% 13W return looks steadier than SMH's -2.2%, yet AIQ's timing score of only 67.0 and risk-reward of 41.3 expose it: thin volume participation, oversold stochastic RSI that fell rather than bounced, and a setup closer to capitulation than consolidation. The 26.6-point score gap shows the allocator penalizes falling stochastic RSI without volume confirmation and rewards the ETF that sits closer to support, even with negative near-term returns.
AI earns a tier-2 position at 5% allocation, ranked below the top-2 categories despite holding legitimate technical merit. The 42.6 score reflects a Goldilocks regime (+10) supporting broad risk appetite and liquidity expansion (+10) that theoretically favors compute-intensive semiconductor plays, yet credit stress (-8) drags the category below the threshold. SMH's 59.0 technical evidence score—driven by neutral structure, improving MACD, and oversold stochastic RSI—carries only enough punch to justify a defensive holding, not an overweight. The allocation signals a wait-and-see posture: if SMH consolidates and volume confirms buyers, AI could re-rank to top-2; until then, the thin 5% slot reflects conviction that the category is constructively setup but macro-constrained by credit headwinds that limit upside acceleration.
Precious Metals — GLD
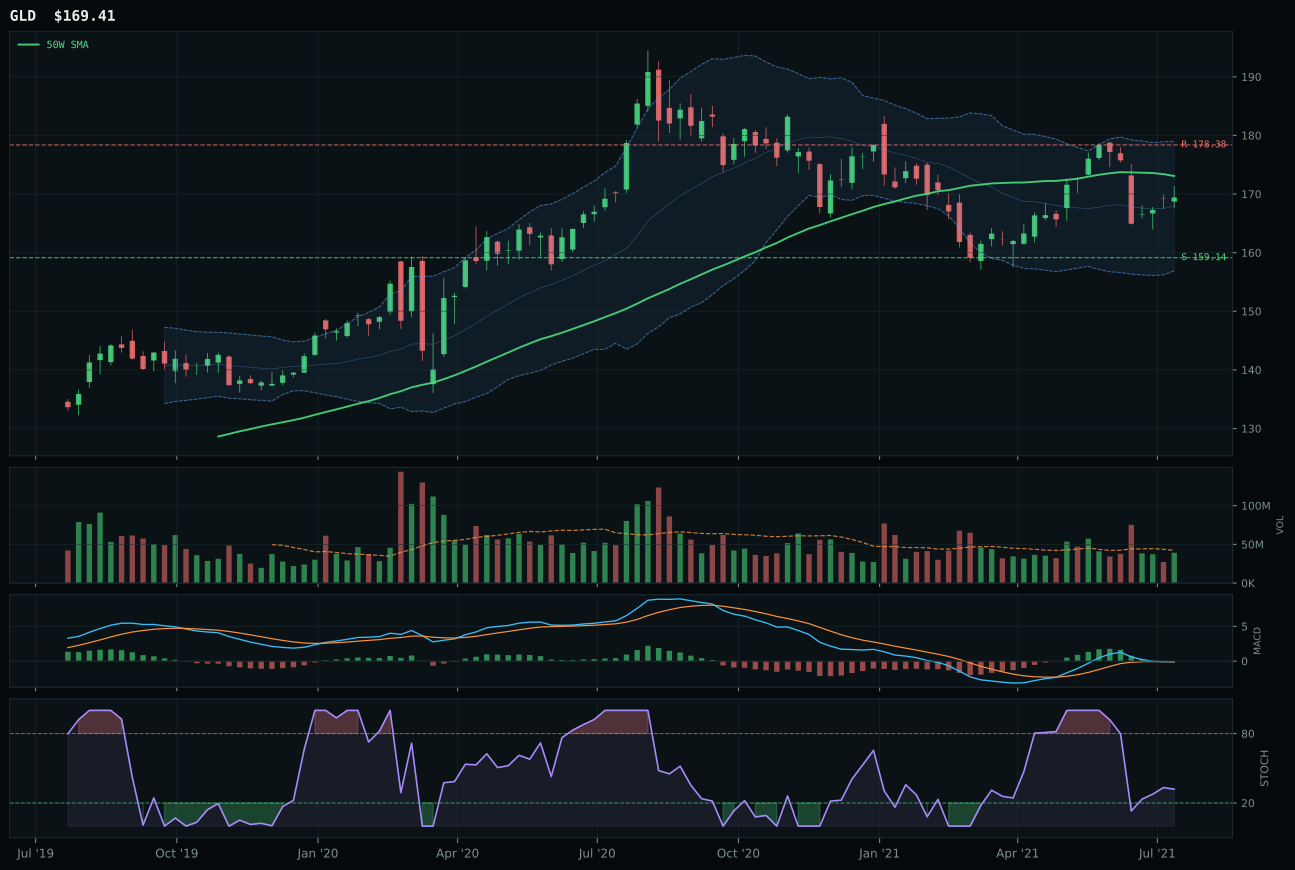
GLD has a compression near 50W profile with -1.5% 13-week relative strength versus SPY.
A failed hold above support would weaken the setup.
Actionable but governed by invalidation levels.
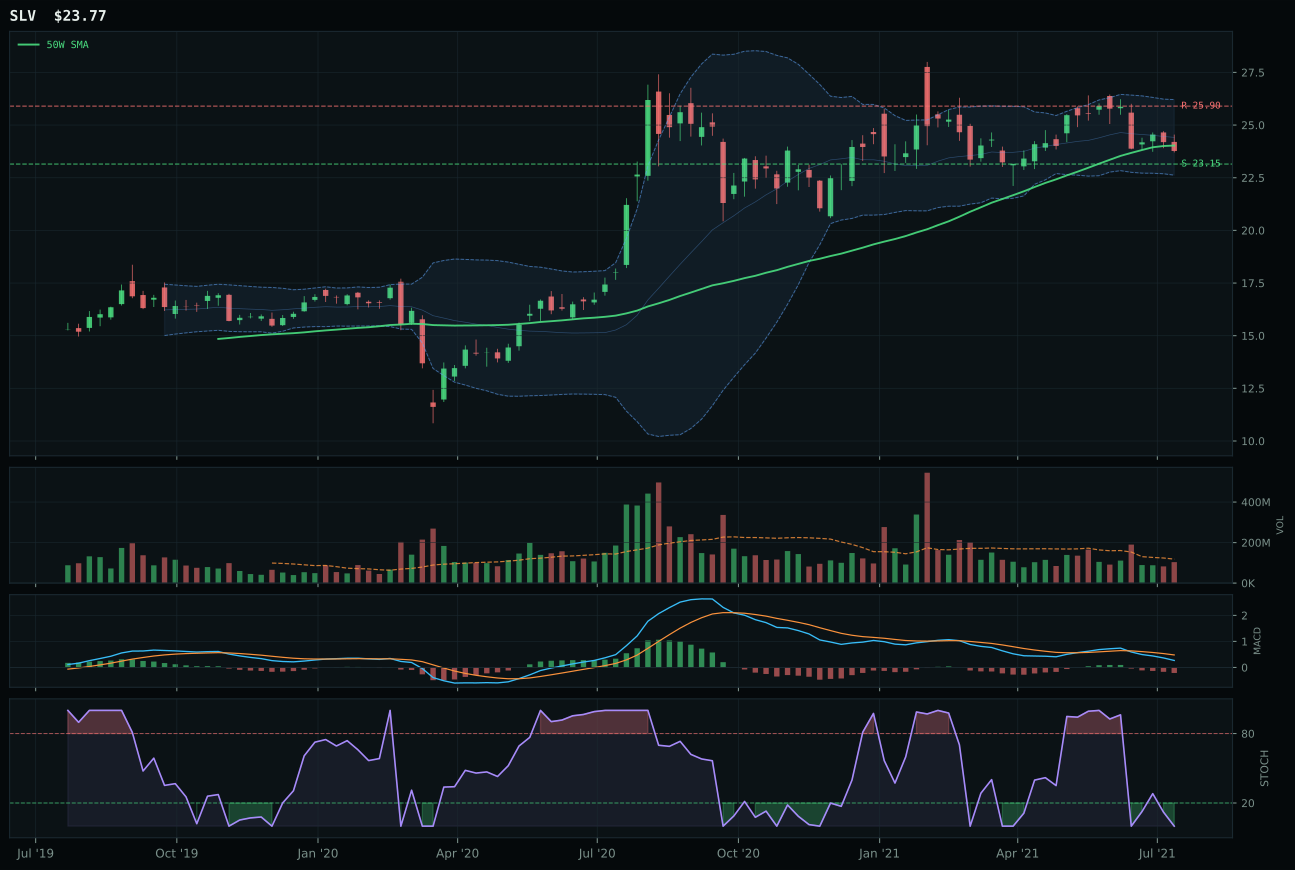
SLV has a pullback into support profile with -4.7% 13-week relative strength versus SPY.
A failed hold above support would weaken the setup.
Actionable but governed by invalidation levels.
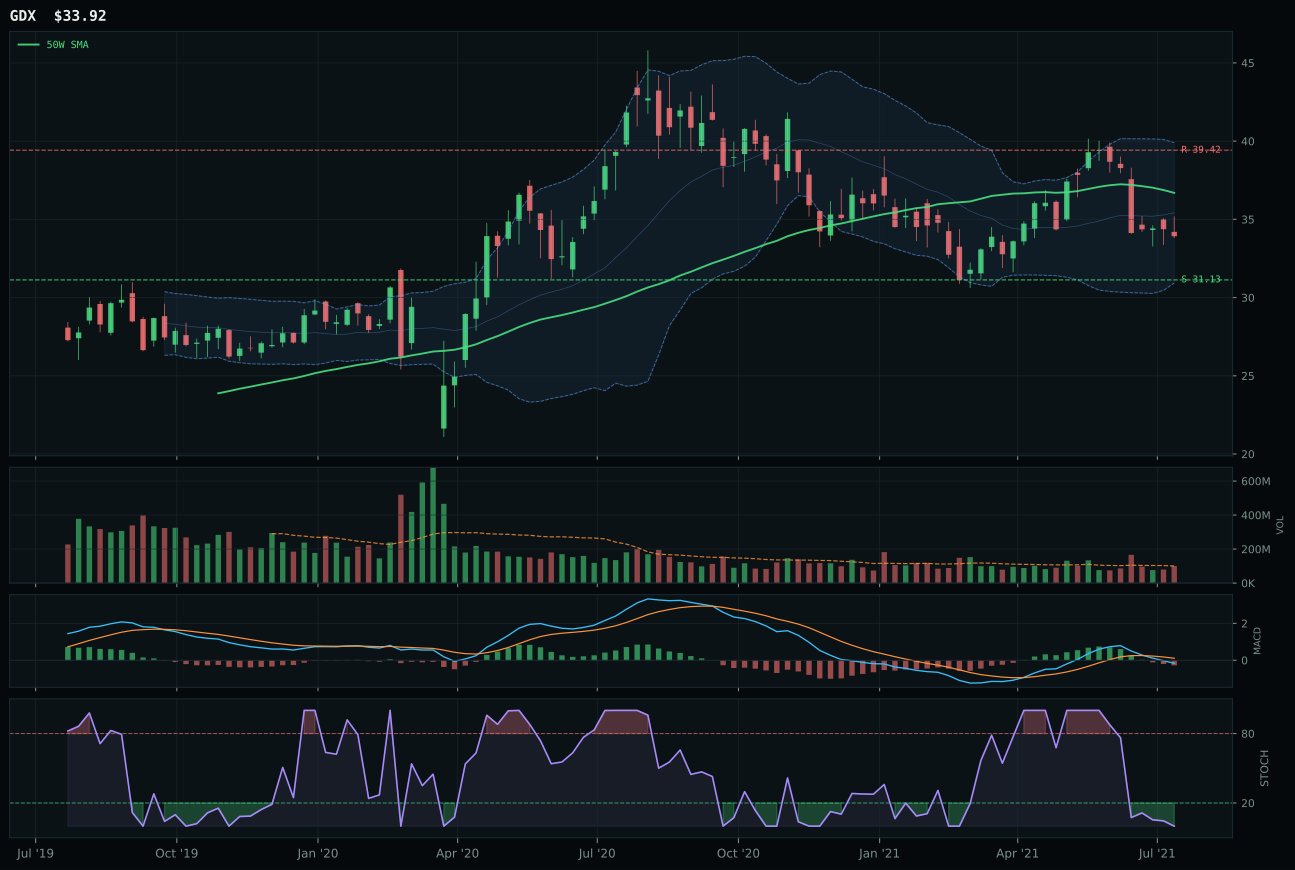
GDX has a neutral structure profile with -9.2% 13-week relative strength versus SPY.
A failed hold above support would weaken the setup.
Actionable but governed by invalidation levels.
GLD won precious metals by returning to the 50W after a small drawdown, a reset that improves entry quality relative to SLV's deeper pullback into support. GLD's compression near the 50W at just -2.1% distance generates a perfect 100.0 timing score, combining a rising stochastic RSI mid-zone (0.32) with deep Fib value zone positioning (0.618 at 171.39) that attracts value buyers when momentum wanes. SLV's oversold stochastic RSI at the lower bound and pullback-into-support setup sound defensible, yet it trails GLD in structure (71.3 vs 78.3) and category-relative strength (+0.0% vs +3.2%), exposing it to continued weak-handed liquidation if support fails. The narrow -1.1-point gap reflects GLD's subtle technical advantage: a cleaner compression with rising oscillators signals stabilization, whereas SLV's deep oversold condition could presage further downside if industrial demand disappoints.
Precious metals earns 5% tier-2 allocation on the back of a 38.7 score and GLD's solid 53.0 technical evidence, yet the category remains outside top-2 because macro fit of 58.0/100 is moderate and disinflation pressure (+8) appeals more to bonds than bullion. The active descriptor pack—disinflation driving rates lower, credit stress pressuring cyclicals—should theoretically favor gold as a monetary hedge, yet GLD's trend score of only 54.7 (price below the 50W) and -1.5% relative strength to SPY reflect gold's actual underperformance during this Goldilocks phase when risk assets still lead. The 5% slot recognizes GLD's tight setup and high timing score while capping exposure because equity-driven rallies tend to push gold sideways until real rates reset or equities roll over. For metals to re-rank to tier-1, gold must exhibit relative strength while equities hold, or real yields must fall sharply—currently, neither condition holds.
Agriculture & Livestock — WEAT
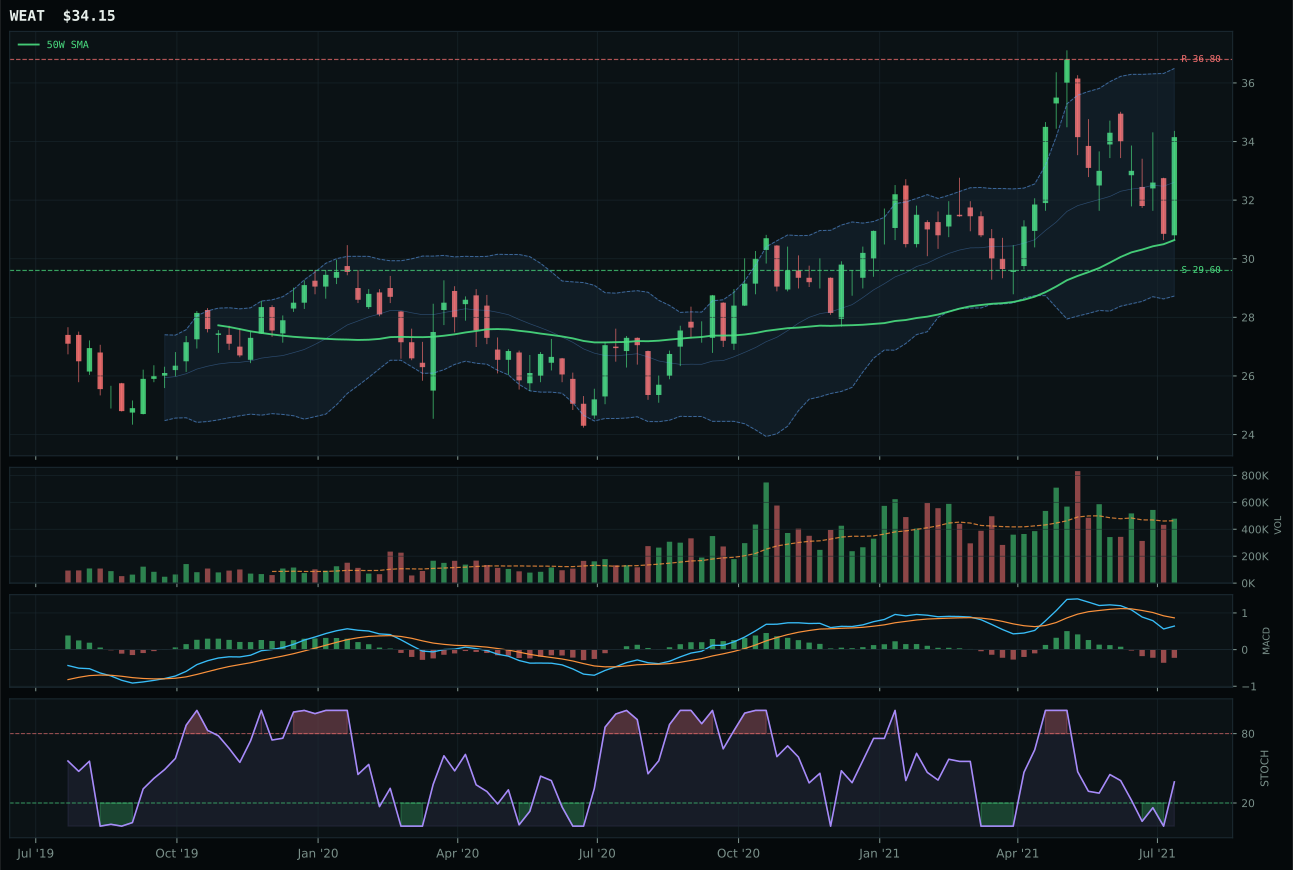
WEAT has a neutral structure profile with 3.8% 13-week relative strength versus SPY.
A failed hold above support would weaken the setup.
Actionable but governed by invalidation levels.
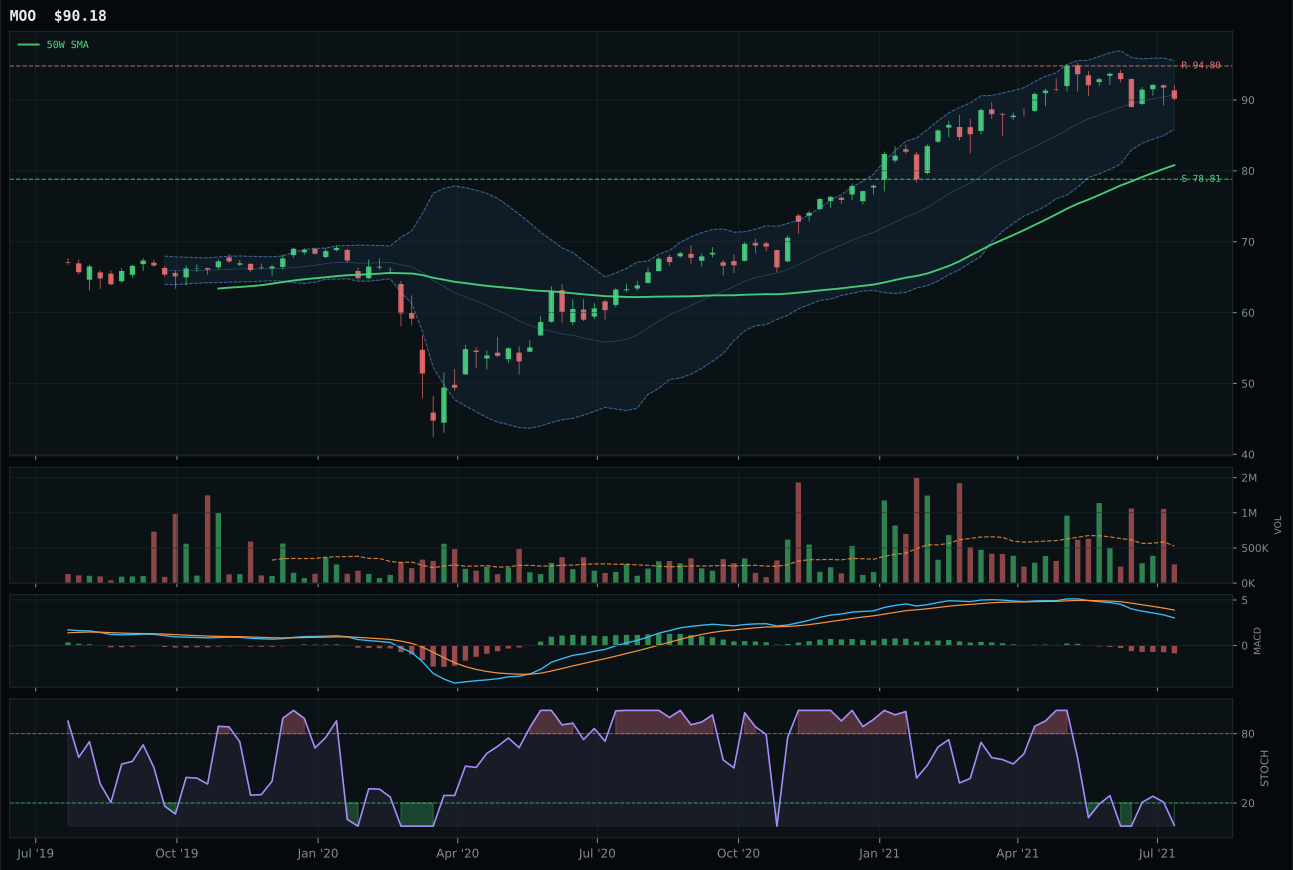
MOO has a neutral structure profile with -4.1% 13-week relative strength versus SPY.
A failed hold above support would weaken the setup.
Actionable but governed by invalidation levels.
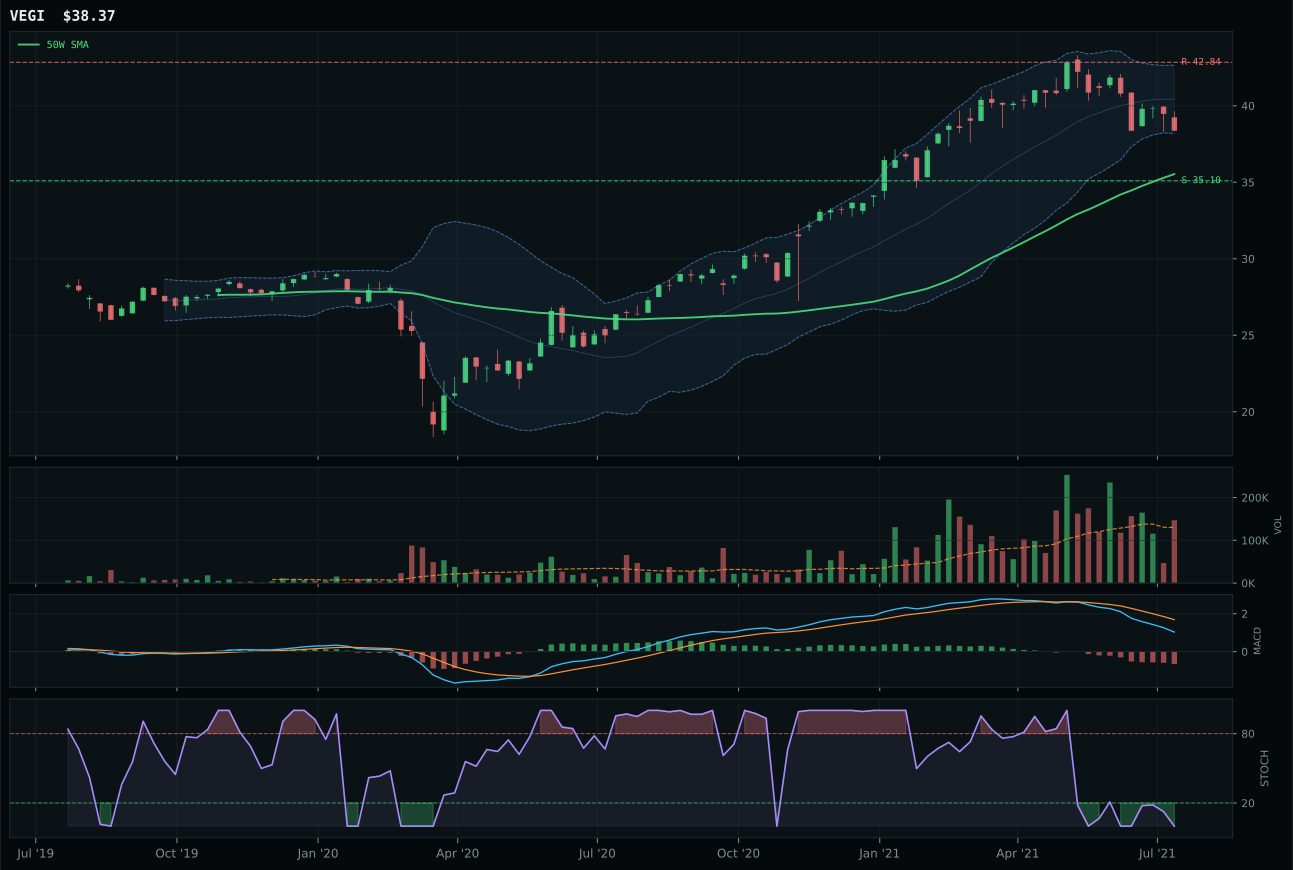
VEGI has a neutral structure profile with -9.8% 13-week relative strength versus SPY.
A failed hold above support would weaken the setup.
Tracked, but not top-2 eligible because: .
WEAT captured agriculture by combining the strongest category-relative strength at +7.9% with the most favorable stochastic RSI positioning (rising mid-zone at 0.38 versus oversold competitors) and the highest timing score of 78.0. The 7.2% 13W return and 3.8% relative strength to SPY demonstrate actual buyer sponsorship, rare in this week's field of late-cycle weakness. MOO's timing lagged at 70.0 despite similar structural positioning, undermined by oversold stochastic RSI and thin volume participation that signaled capitulation sellers rather than accumulation. WEAT's 87.8 trend score and 60.0 volume-price confirmation reflect a cleaner, more liquid setup where rising stochastic RSI suggests buyers may be re-entering after weakness, setting a better risk-reward for fresh allocations.
Agriculture holds a 5% tier-2 position with a 36.7 score, trailing the top-2 categories because technical evidence of 59.3/100 reflects neutral structure and weak momentum confirmation despite WEAT's relative strength leadership within the category. Real asset sponsorship is active (+8) and commodity breadth positive (+5), yet disinflation pressure (-8) creates a macro headwind for agricultural commodities that typically rally on reflation fears. The allocation recognizes WEAT's superior structure and momentum breadth within the category while acknowledging that agriculture overall lacks the macro tailwind to rank above technology or emerging markets. Disinflation—a macro anchor for bonds and defensive equities—penalizes real assets; if the macro regime shifts toward reflation or energy shock, agriculture could accelerate to tier-1 as commodities reset higher and WEAT's thin volume participation becomes an opportunity rather than a constraint.
Utilities & Infrastructure — XLU
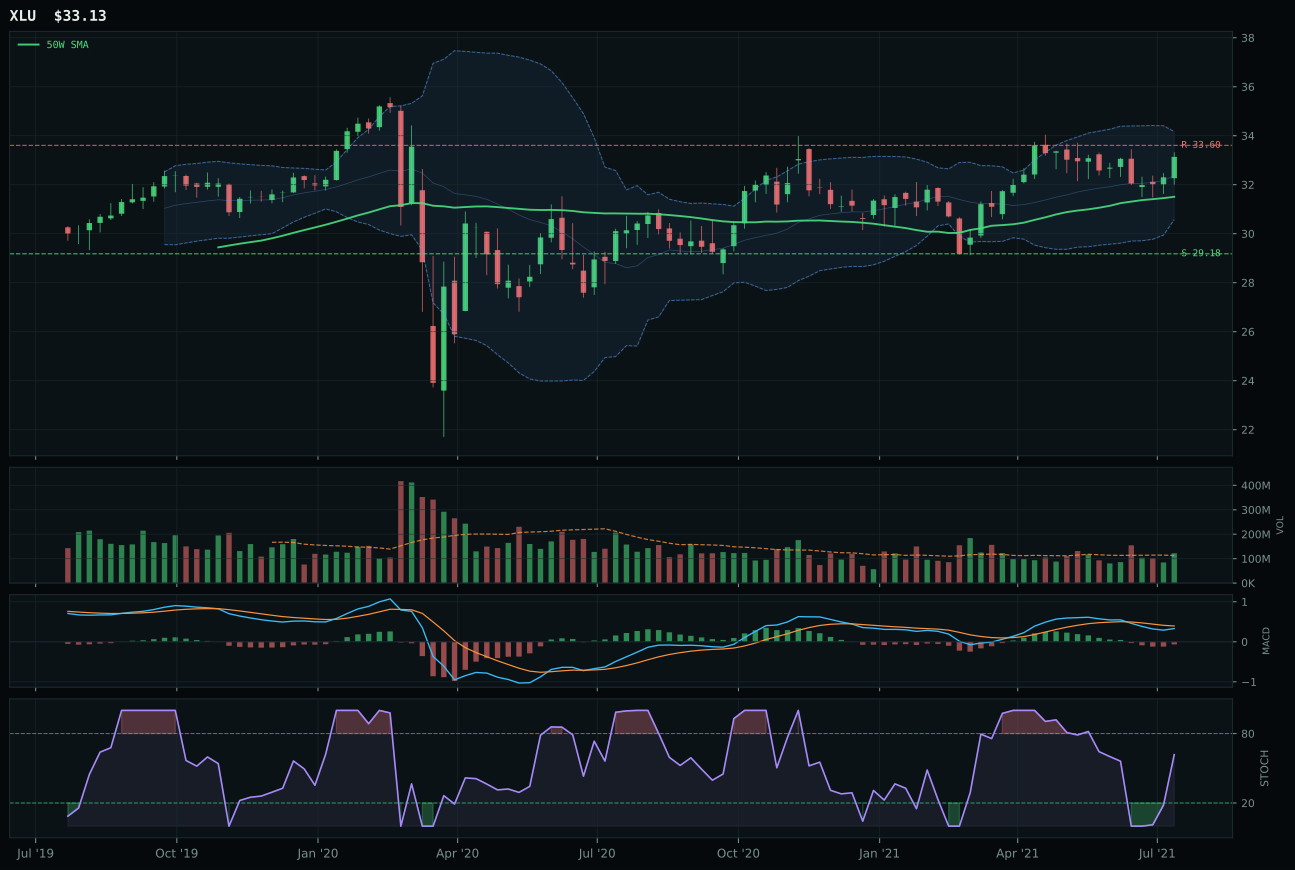
XLU has a neutral structure profile with -4.8% 13-week relative strength versus SPY.
A failed hold above support would weaken the setup.
Actionable but governed by invalidation levels.
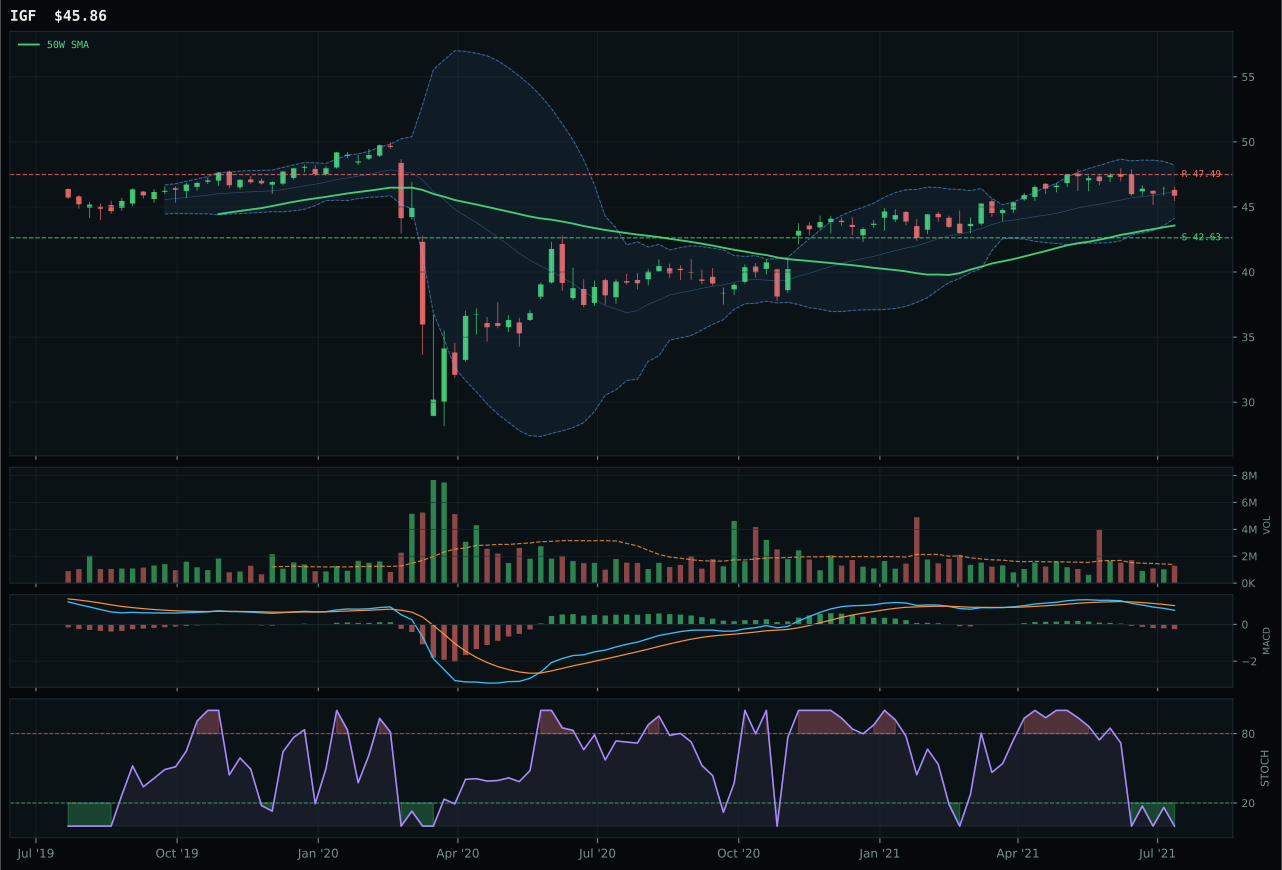
IGF has a neutral structure profile with -4.8% 13-week relative strength versus SPY.
A failed hold above support would weaken the setup.
Actionable but governed by invalidation levels.
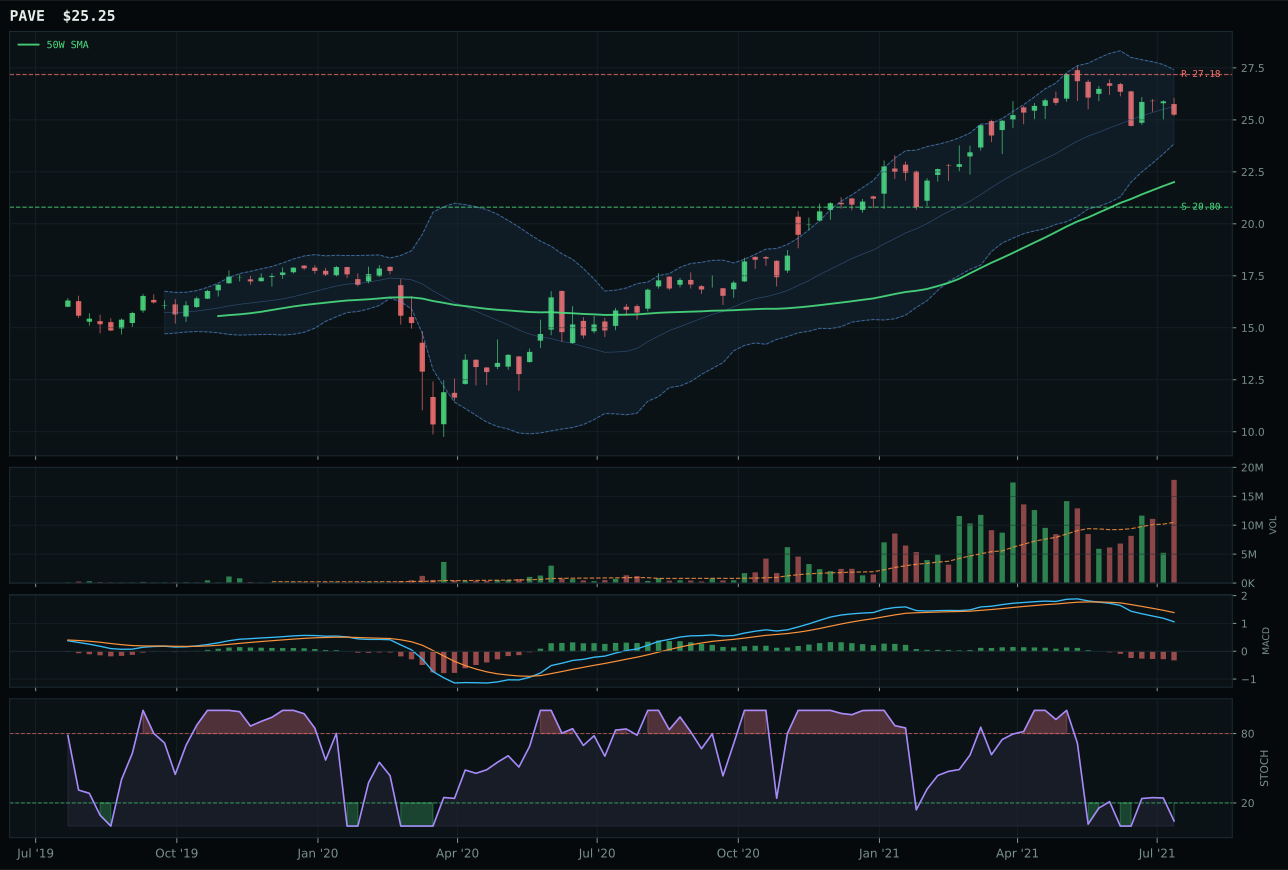
PAVE has a neutral structure profile with -5.0% 13-week relative strength versus SPY.
A failed hold above support would weaken the setup.
Actionable but governed by invalidation levels.
XLU captured utilities by superior timing and structure in a category offering minimal conviction. The 78.0 timing score reflects just 5.2% distance from the 50W paired with rising stochastic RSI at 0.62, a setup that allows buyers to accumulate near the trend line without chasing extended tops. IGF's timing score of 70.0, despite identical -1.4% 13W returns, reflects oversold stochastic RSI and larger distance to support, creating a deeper retracement that demands more patient capital. XLU's 75.2 structure score exceeds IGF's 71.1 through cleaner compression (84.8 vs unspecified) and slightly tighter support-resistance bands, improving risk-reward even in a sector where 33.2% of the basket shows trend weakness. Momentum confirmation sits at only 32.8 for the winner, indicating this is a defensive hold rather than a conviction buy, yet XLU's rising stochastic RSI and neutral volume provide the best entry point in a utility basket defined by weakness.
Utilities & Infrastructure earns 5% tier-2 allocation with a 35.5 score and technical evidence of 44.5/100, driven by XLU's superior timing and structure but constrained by weak macro fit at 56.0/100. Disinflation pressure supports the sector (+6), yet the Goldilocks regime offers superior opportunities in growth and real assets, leaving utilities in a wait-and-see posture. The 5% slot reflects the system's defensive hedging bias: when equity momentum weakens or credit stress spikes, utilities and infrastructure shift to tier-1 allocation; when risk appetite remains intact and disinflation is pricing in bonds rather than dividend plays, the sector earns only a small position. XLU's rising stochastic RSI and tight distance to the 50W suggest it can hold a position without additional buying pressure, making this a core holding that could double in allocation if economic surprise shifts from positive to flat and equity momentum rolls over.
Defense & Aerospace — ITA
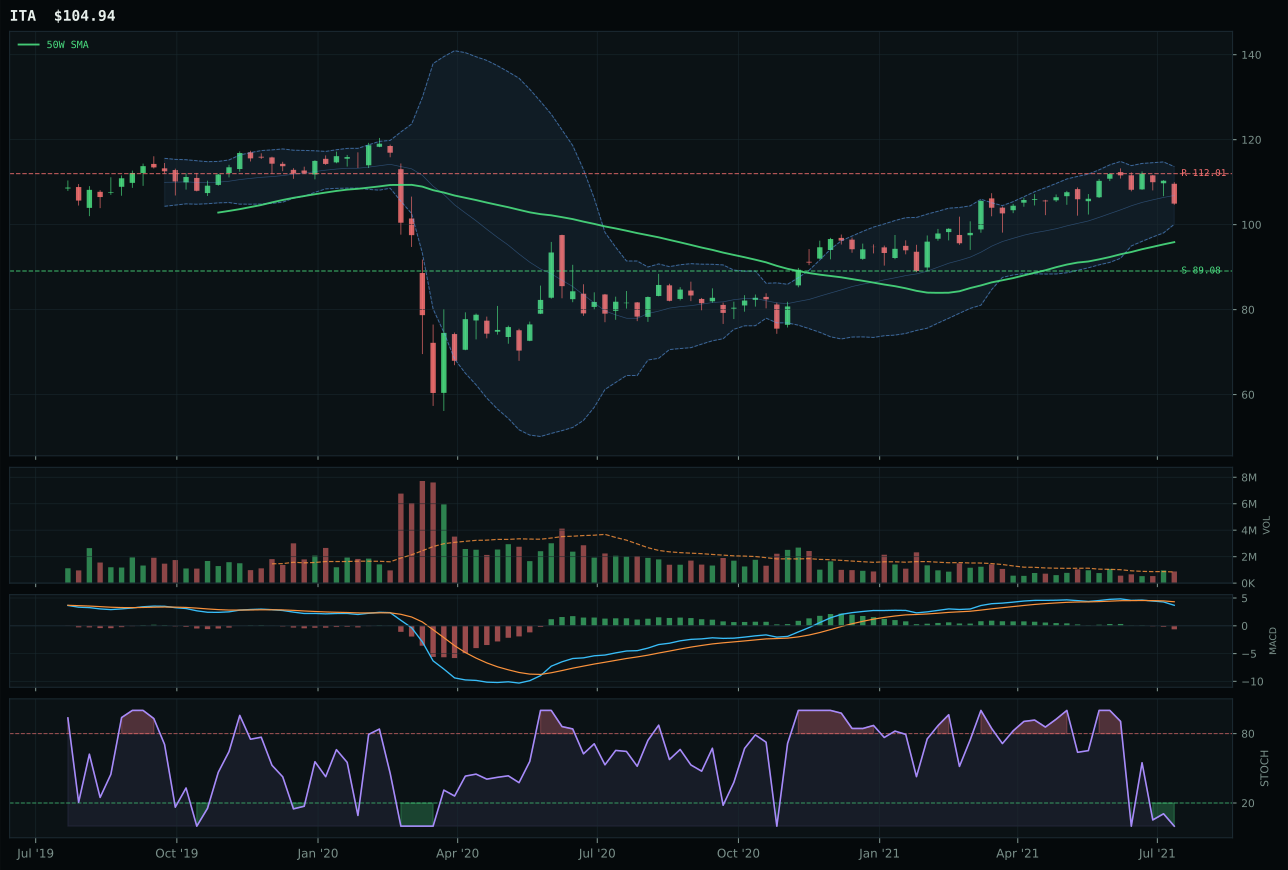
ITA has a neutral structure profile with -4.4% 13-week relative strength versus SPY.
A failed hold above support would weaken the setup.
Actionable but governed by invalidation levels.
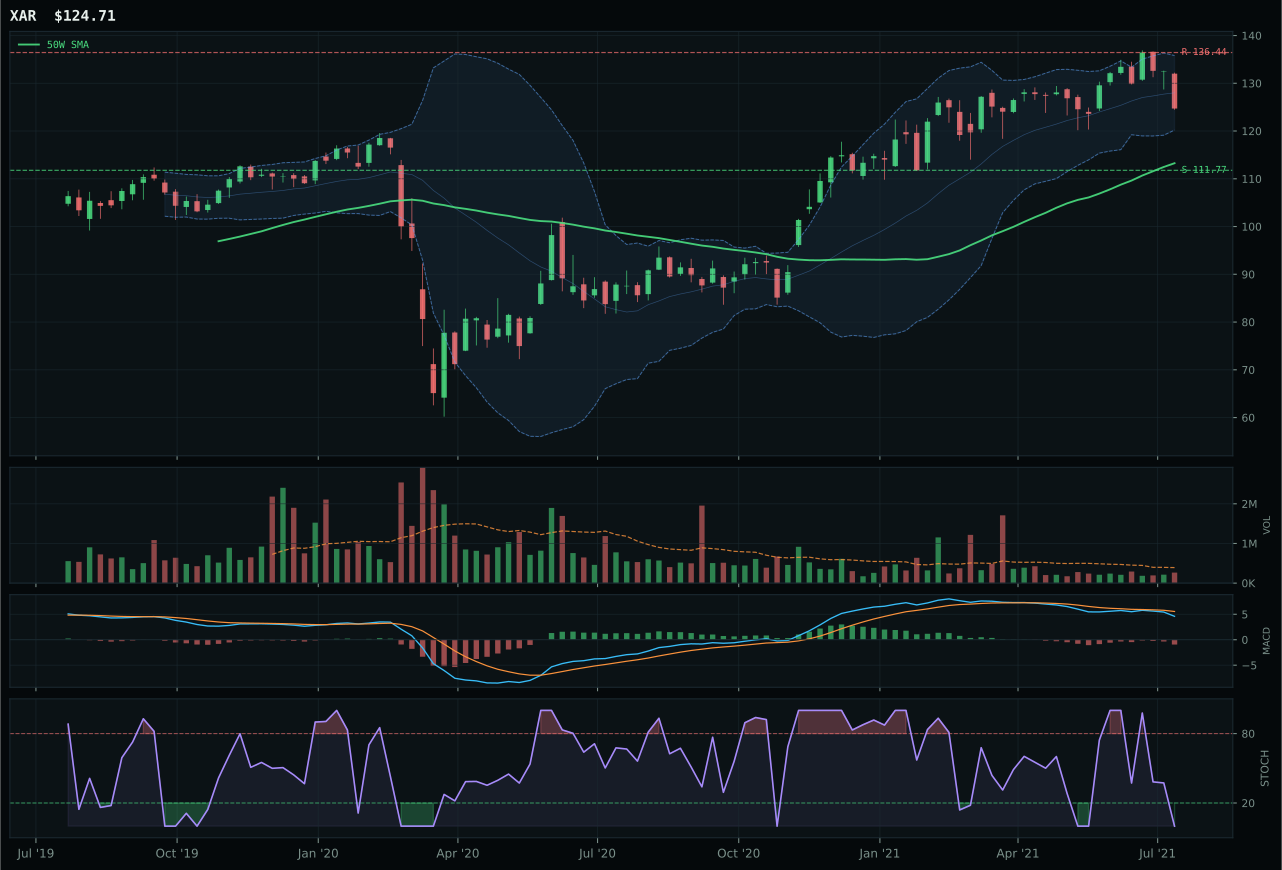
XAR has a neutral structure profile with -5.7% 13-week relative strength versus SPY.
A failed hold above support would weaken the setup.
Actionable but governed by invalidation levels.
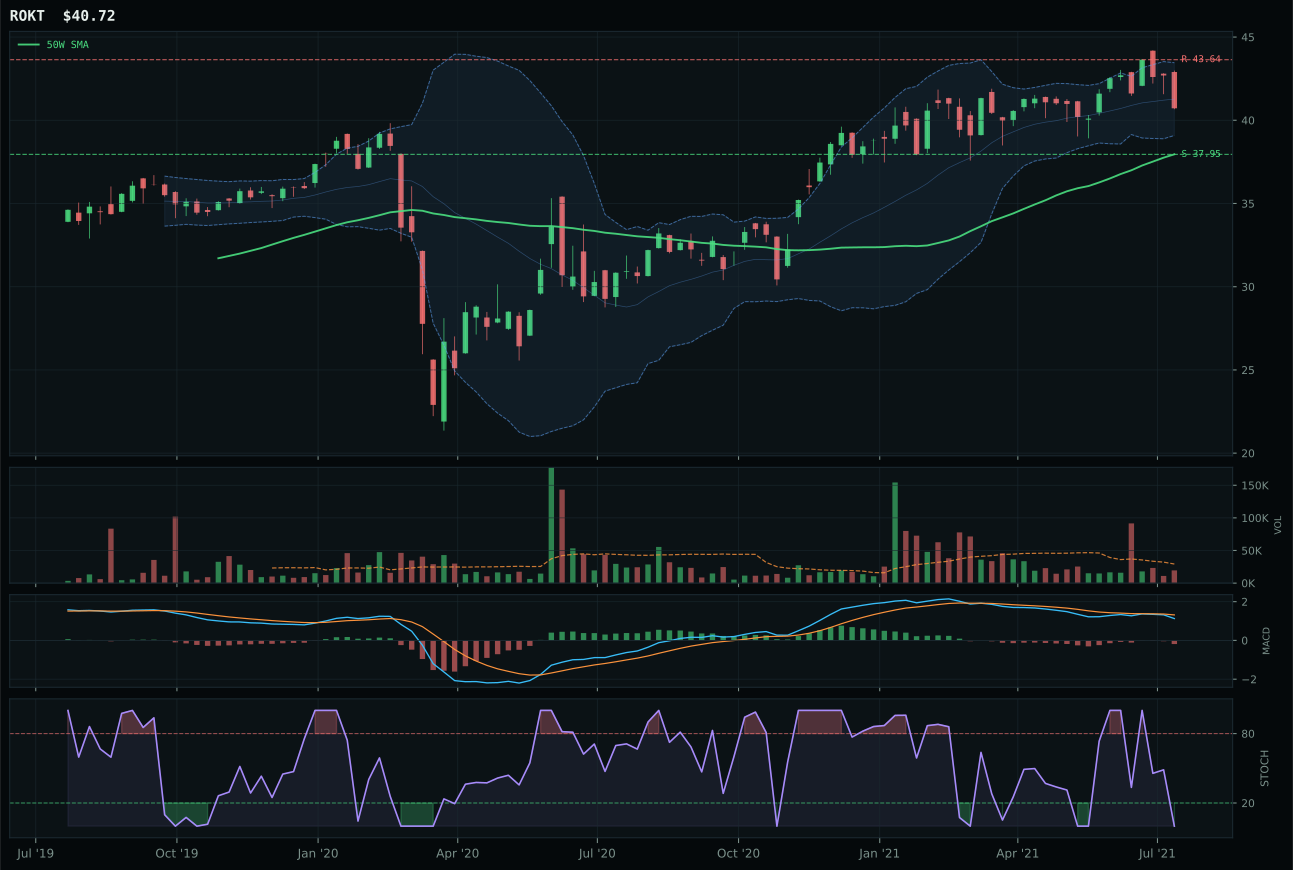
ROKT has a neutral structure profile with -4.8% 13-week relative strength versus SPY.
A failed hold above support would weaken the setup.
Tracked, but not top-2 eligible because: .
ITA won the defense category in a field offering minimal technical clarity, capturing first place by a narrow 2.8-point margin over XAR through marginally cleaner structure (74.6 vs 67.5) and neutral volume participation versus XAR's thin participation. Both ETFs carry bearish, weakening MACD and oversold stochastic RSI at 0.00, signaling capitulation rather than accumulation, yet ITA's trend score of 75.5 (benefiting from a 0.6% 50W slope) and category-relative strength of +0.4% provide fractionally better proof of leadership. The category itself scores poorly because momentum confirmation sits at 22.9 for the winner—a 4W return of -3.0% and 13W return of -1.0% mean buyers are not sponsoring this exposure. Nine-point-five percent distance from the 50W keeps timing reasonably tight, but the overall message is defensive allocation masking technical weakness.
Defense & Aerospace holds a 5% allocation as tier-2, its 35.1 score placing it well below the top-2 threshold largely because technical evidence contributes only 38.2/100 and macro fit adds just 50.0/100 with no category-specific descriptor boost. The category ranks 9th or 10th among eligible allocations because trend conditions remain intact (price above both moving averages) but momentum deterioration is severe: ITA's -1.0% 13W return and -4.4% relative strength to SPY indicate the sector has not participated in the Goldilocks rally. A neutral macro backdrop with no tailwind for defense spending, plus credit stress (-7 on the macro ladder), means this is a placeholder position, not a conviction bet. To earn a top-2 slot, defense would require either a rally in 13W momentum with volume confirmation or a macro shift toward fiscal expansion or geopolitical escalation—neither is currently signaling.
Nuclear Energy — URA
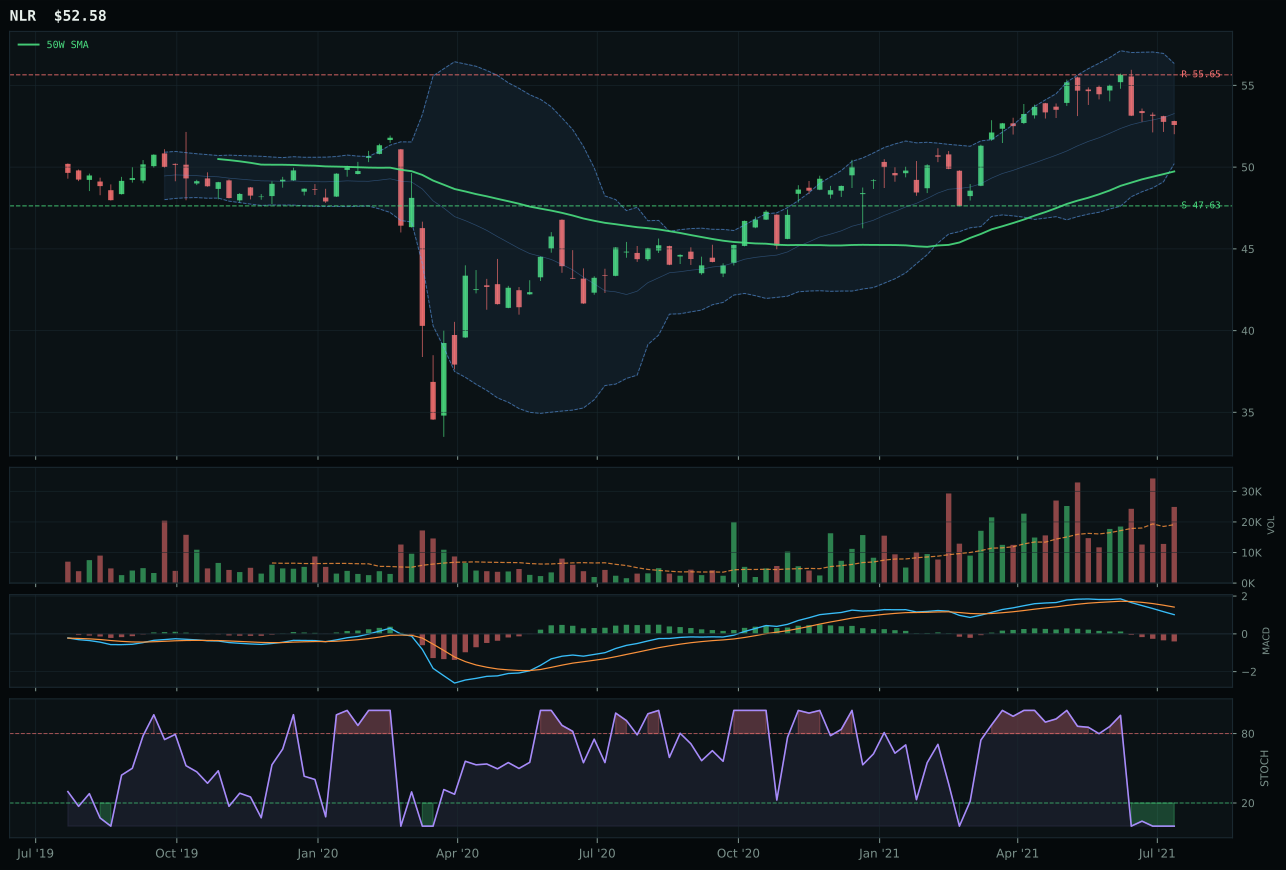
NLR has a neutral structure profile with -5.4% 13-week relative strength versus SPY.
A failed hold above support would weaken the setup.
Tracked, but not top-2 eligible because: .
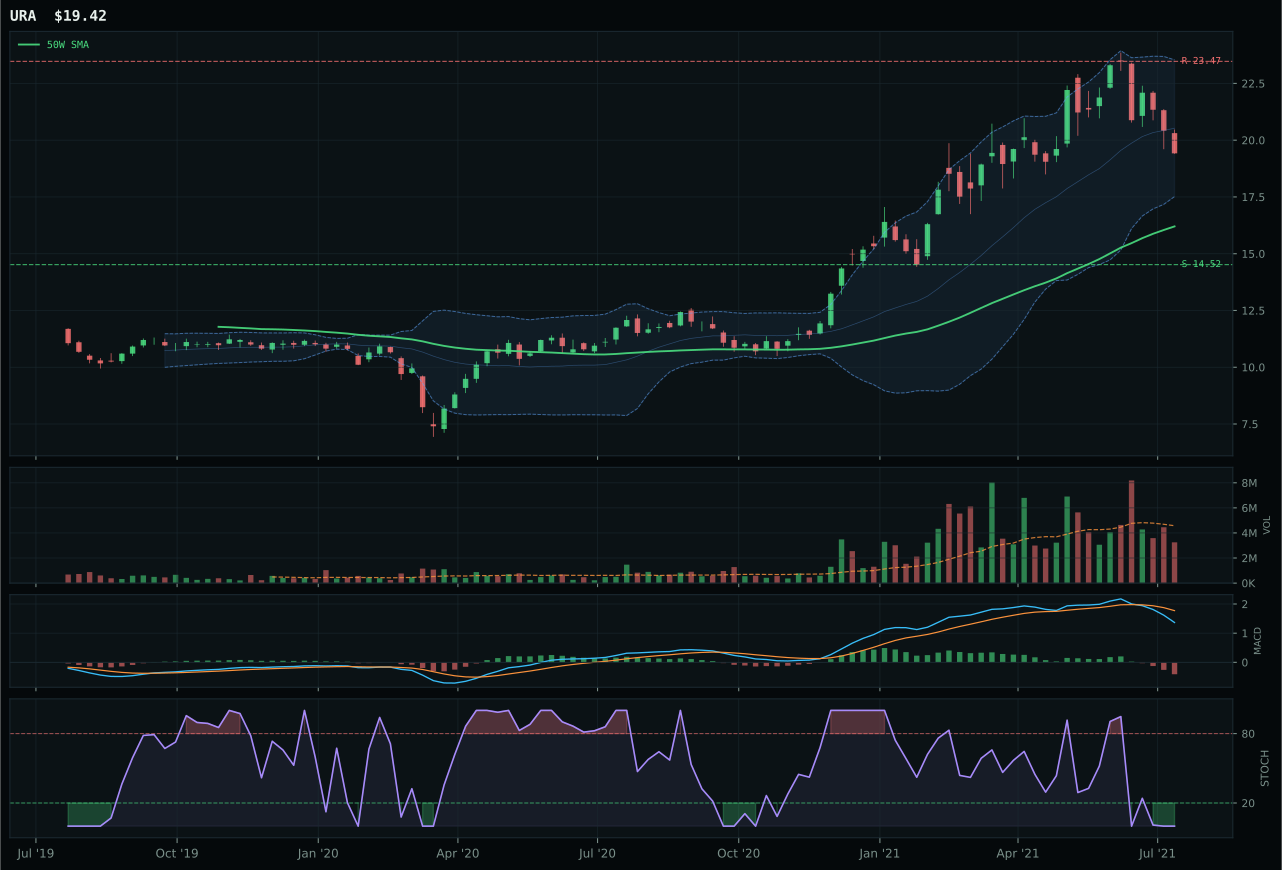
URA has a vertical extension profile with -3.1% 13-week relative strength versus SPY.
A failed hold above support would weaken the setup.
Actionable but governed by invalidation levels.
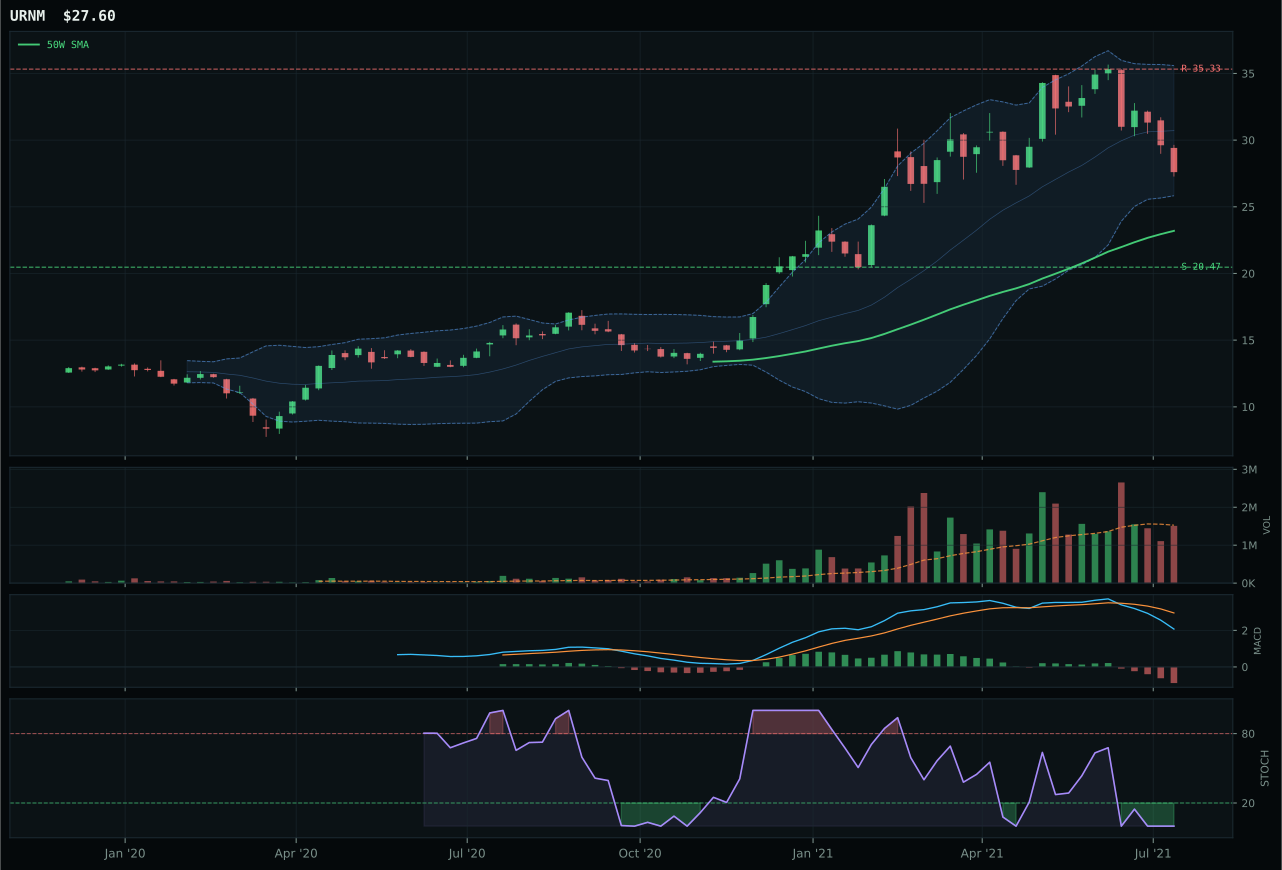
URNM has a vertical extension profile with -6.5% 13-week relative strength versus SPY.
A failed hold above support would weaken the setup.
Actionable but governed by invalidation levels.
URA won nuclear by a 2.2-point margin over NLR despite both ETFs being technically troubled, capitalizing on a +2.4% category-relative strength advantage that signals it is the path of least resistance. URA extends 19.9% above the 50W in vertical extension setup with oversold stochastic RSI at 0.00, a configuration that combines trend strength with extreme pessimism—the textbook setup for a sharp counter-bounce if credit conditions ease. Its 77.4 trend score and 0.3% 13W return show price structure remains intact while momentum has capitulated, leaving room for buyers to accumulate at rock-bottom sentiment. NLR's timing score of 70.0 beats URA's 48.0, but thin volume participation and above-average distribution pressure limit conviction. The real issue: both ETFs suffer from thin participation and weak momentum; URA simply offers a cleaner vertical extension with relative strength leadership, making it the category's best bad option.
Nuclear energy receives zero allocation as an excluded category with a 32.5 score and technical evidence of only 26.1/100, leaving it outside tier-2 eligibility. URA's vertical extension at 19.9% above the 50W and oversold stochastic RSI create a potential reversal setup, yet the category lacks macro sponsorship: nuclear earns only 50.0 macro fit with real asset support (+7) offset by credit stress (-5), generating no net tailwind in a Goldilocks regime. Without a macro descriptor specifically favoring nuclear energy (such as infrastructure spending or grid reliability mandates), and with technical evidence bottoming in momentum confirmation, the sector sits in purgatory—attractive only to contrarian rotations that have not yet fired. Energy transition remains a long-term tailwind, but this week's capital allocation targets sectors with higher technical evidence and macro alignment; URA would need a sharp 4-week advance with volume confirmation and credit stress to ease before earning a 5% position.
Traditional Energy — XLE
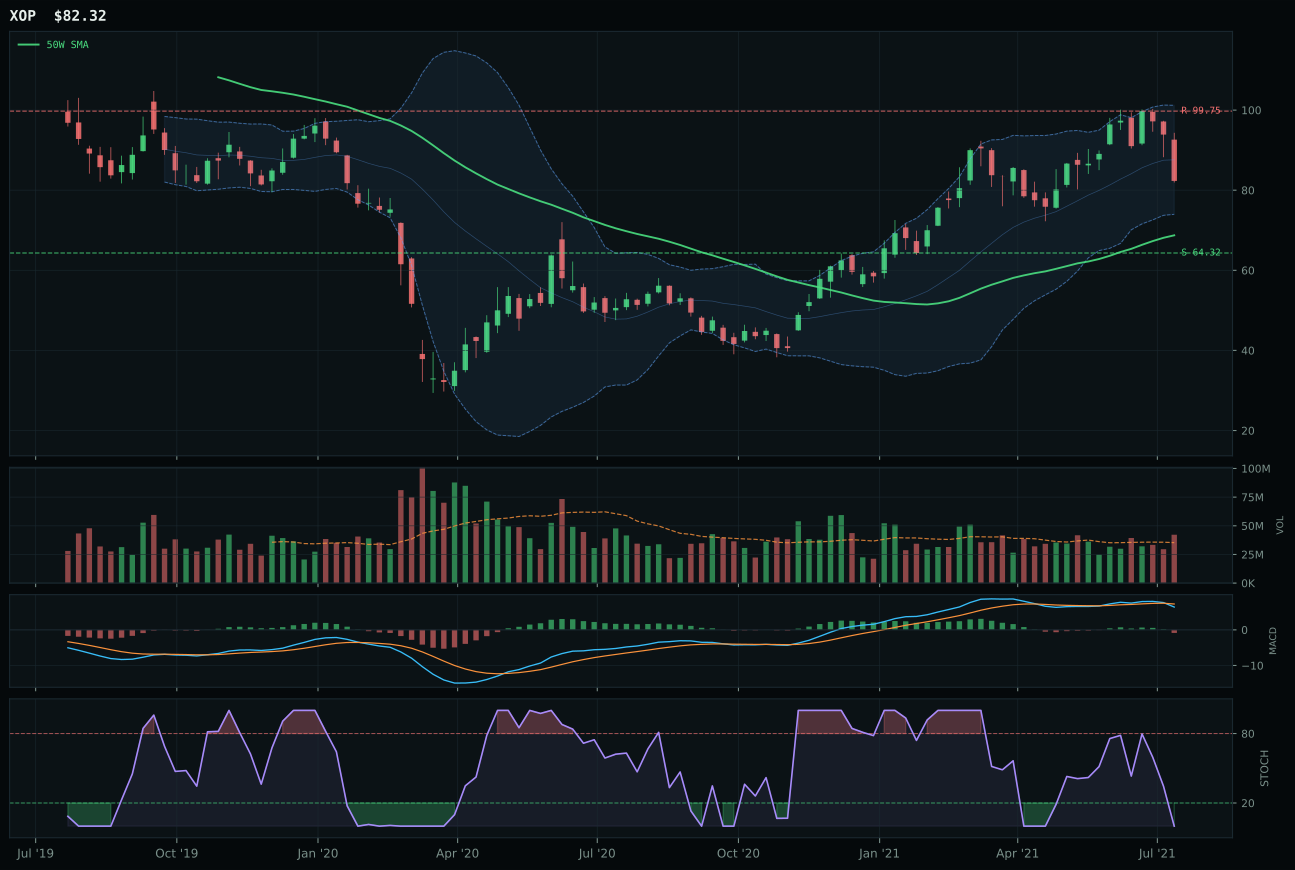
XOP has a vertical extension profile with 2.8% 13-week relative strength versus SPY.
A failed hold above support would weaken the setup.
Actionable but governed by invalidation levels.
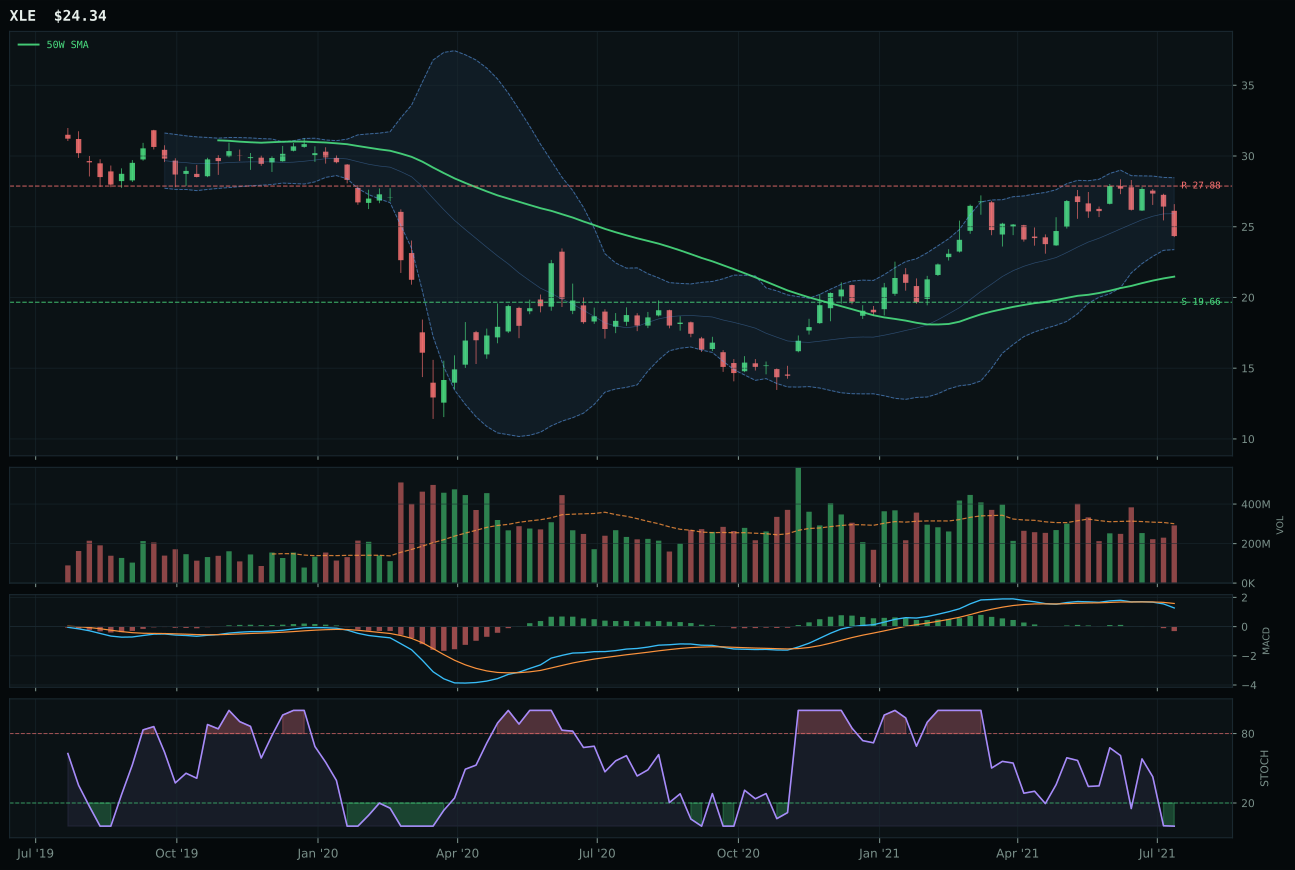
XLE has a neutral structure profile with -2.8% 13-week relative strength versus SPY.
A failed hold above support would weaken the setup.
Actionable but governed by invalidation levels.
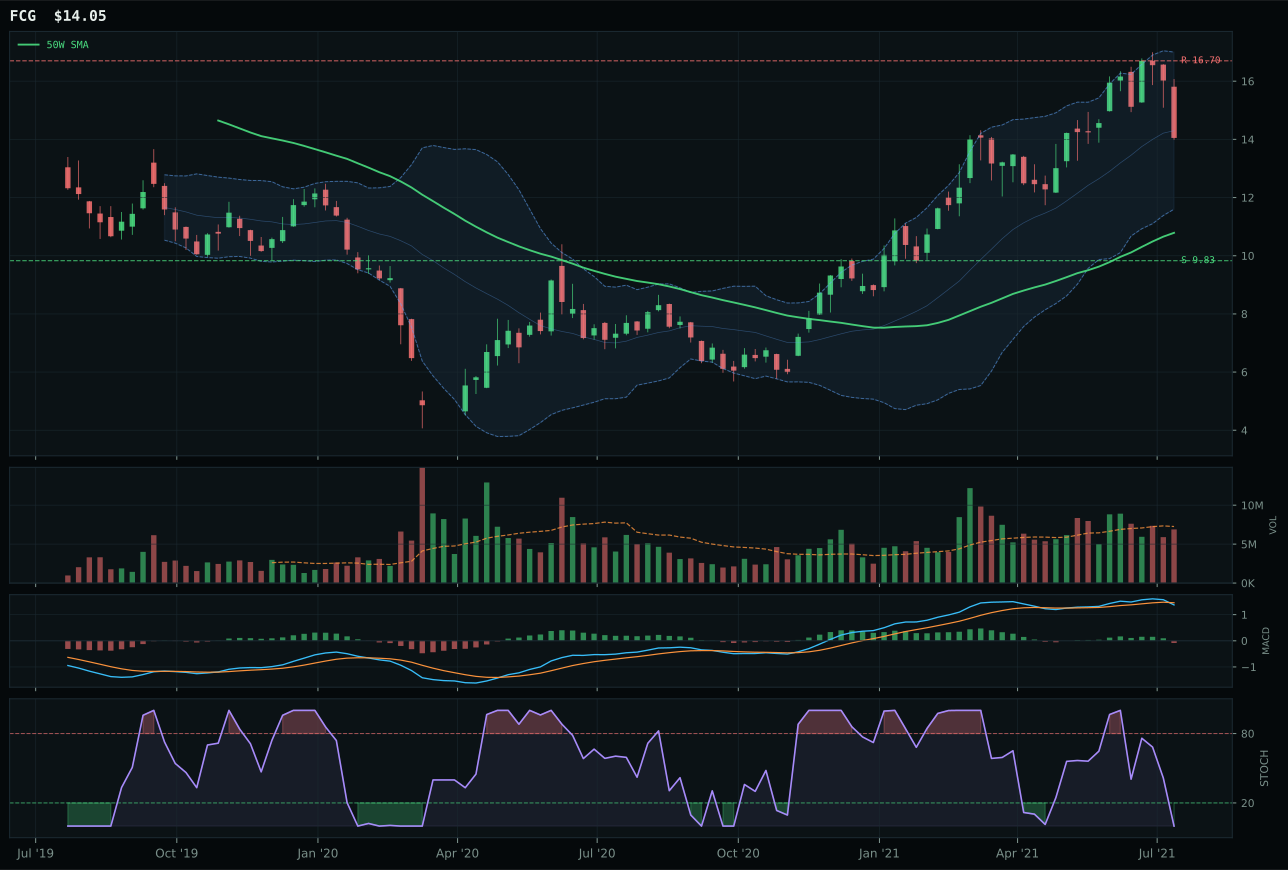
FCG has a vertical extension profile with 9.4% 13-week relative strength versus SPY.
A failed hold above support would weaken the setup.
Actionable but governed by invalidation levels.
XLE defeated the energy category entirely by not advancing its case, a verdict that earns it zero allocation. XLE's 57.8 trend score reflects price sitting above the 50W but below the 200W—a split signal that argues caution—while its -2.8% relative strength to SPY and 0.6% 13W return show the sector has been left behind as equities rally. Stochastic RSI at 0.00 signals capitulation, yet the momentum confirmation score bottoms at 10.6 because recent returns are negative and volume remains thin. XOP lost to XLE purely on technical grounds: XOP extends 19.8% above the 50W versus XLE's 13.4%, compressing risk-reward further for an already-weak sector. The deeper truth is macro: disinflation pressure (-10), credit stress (-7), and real asset sponsorship (+7) net to a 40.0 category-level macro fit that cannot support a top-tier allocation in a Goldilocks regime where stocks and bonds both offer better risk-adjusted entry points.
Traditional energy receives zero allocation, excluded this week as it ranks 9th or 10th among eligible categories with a 21.2 final score that sits below both tier-2 thresholds. The macro environment actively penalizes energy through disinflation pressure (-10) and credit stress (-7), while XLE's technical evidence of 25.6/100 reflects weak momentum confirmation (10.6), low trend conviction (split between the 50W and 200W), and a sector that has materially underperformed SPY. For energy to earn even a 5% position, the macro regime would need to shift toward reflation, real yields would need to rise sharply, or crude would need to break above 75 dollars with volume confirmation—none of these conditions exist. The zero allocation is not a judgment of energy's long-term value but a disciplined exclusion based on current macro regime and technicals: Goldilocks favors growth and disinflation trades, energy offers neither.