
2021-07-09
Informational purposes only. The content in this report, including allocations, analysis, and commentary, is provided solely for informational and educational purposes. It does not constitute financial advice, investment advice, trading advice, or any other type of advice. Past performance does not guarantee future results. Always conduct your own research and consult a qualified financial professional before making investment decisions.
Weekly Allocation
| Ticker | Category | Weight | Role |
|---|---|---|---|
| FSOL | 50% | Overlay | |
| XLK | Technology | 10% | Top-2 (10%) |
| FCG | Traditional Energy | 10% | Top-2 (10%) |
| REMX | Industrial Metals | 5% | Tier-2 (5%) |
| INDA | Emerging Markets | 5% | Tier-2 (5%) |
| SMH | AI | 5% | Tier-2 (5%) |
| XLU | Utilities & Infrastructure | 5% | Tier-2 (5%) |
| SLV | Precious Metals | 5% | Tier-2 (5%) |
| ITA | Defense & Aerospace | 5% | Tier-2 (5%) |
Trade Instructions — Monday Open
Sell the tranche from 2021-06-11 (completing its 4-week hold). Buy the new tranche. Instructions show net portfolio changes — same-asset positions cancel, weight changes show the delta.
| Action | Ticker | Instruction |
|---|---|---|
| SELL | GLD | Sell entire GLD position (2.50% of portfolio) |
| SELL | INDA | Sell 25% of INDA position (reduce 5.00% → 3.75%) |
| SELL | IGV | Sell 17% of IGV position (reduce 7.50% → 6.25%) |
| SELL | URA | Sell entire URA position (1.25% of portfolio) |
| SELL | XAR | Sell 25% of XAR position (reduce 5.00% → 3.75%) |
| BUY | FCG | Buy FCG — 33.33% of freed cash (adds 2.50% to portfolio) |
| BUY | SLV | Buy SLV — 16.67% of freed cash (adds 1.25% to portfolio) |
| BUY | XLK | Buy XLK — 33.33% of freed cash (adds 2.50% to portfolio) |
| BUY | ITA | Buy ITA — 16.67% of freed cash (adds 1.25% to portfolio) |
Current Portfolio After Trade
Combined holdings across all 4 active tranches. Each tranche is 25% of the portfolio.
| Ticker | % of Portfolio | Weight Bar |
|---|---|---|
| FSOL | 50.00% | |
| FCG | 10.00% | |
| IGV | 6.25% | |
| XLU | 5.00% | |
| INDA | 3.75% | |
| REMX | 3.75% | |
| XAR | 3.75% | |
| SLV | 3.75% | |
| SMH | 2.50% | |
| ILF | 2.50% | |
| MOO | 2.50% | |
| XLK | 2.50% | |
| WEAT | 1.25% | |
| COPX | 1.25% | |
| ITA | 1.25% |
Macro Regime — Transition / Mixed
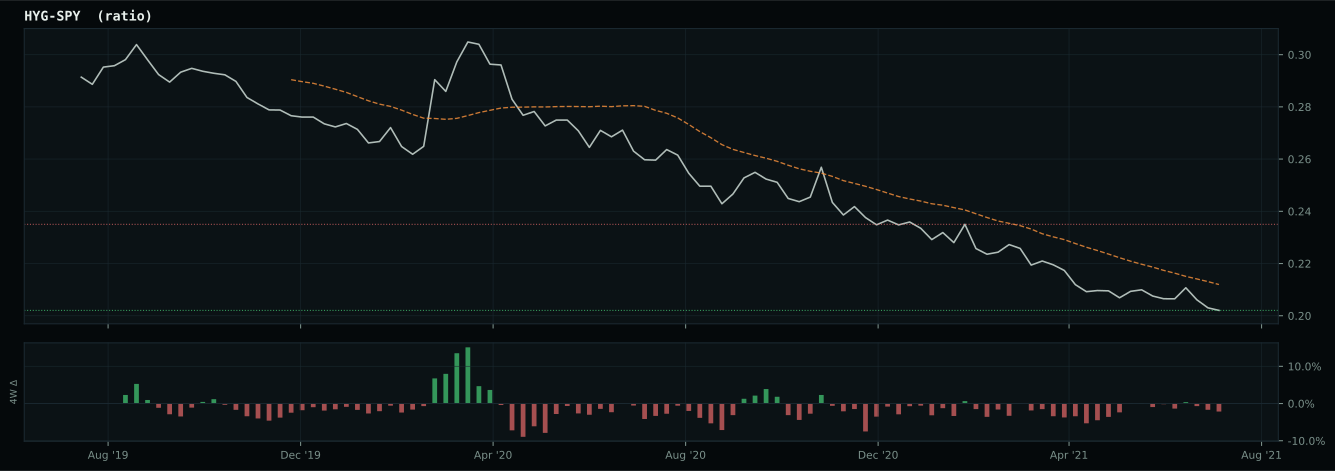
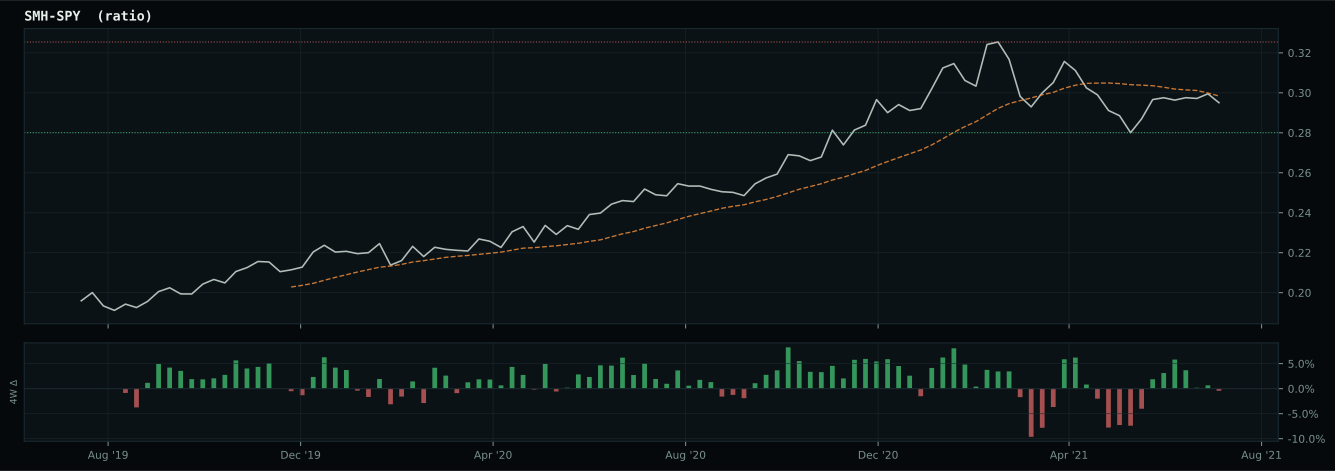
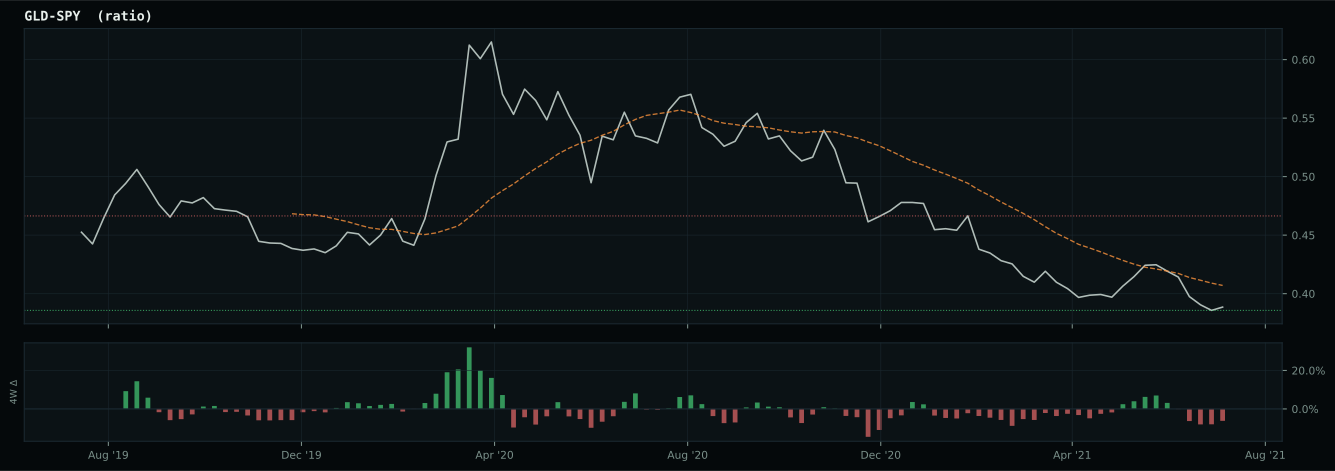
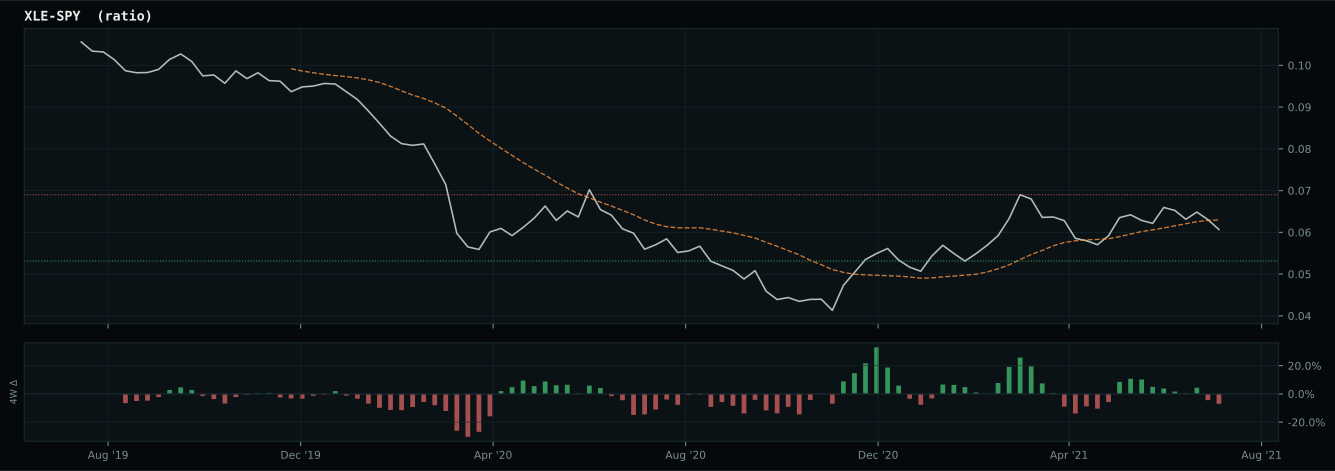
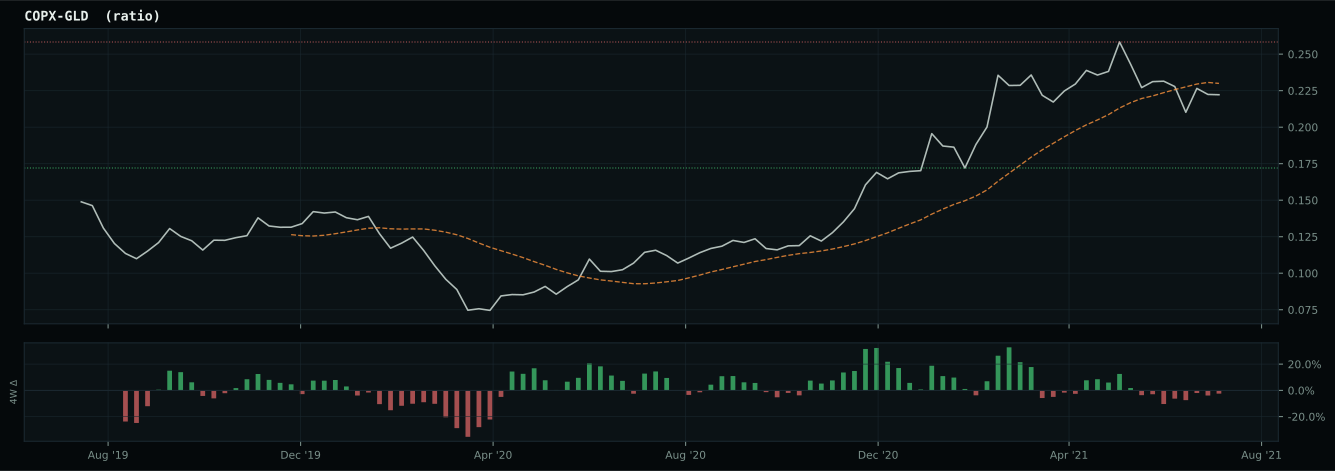
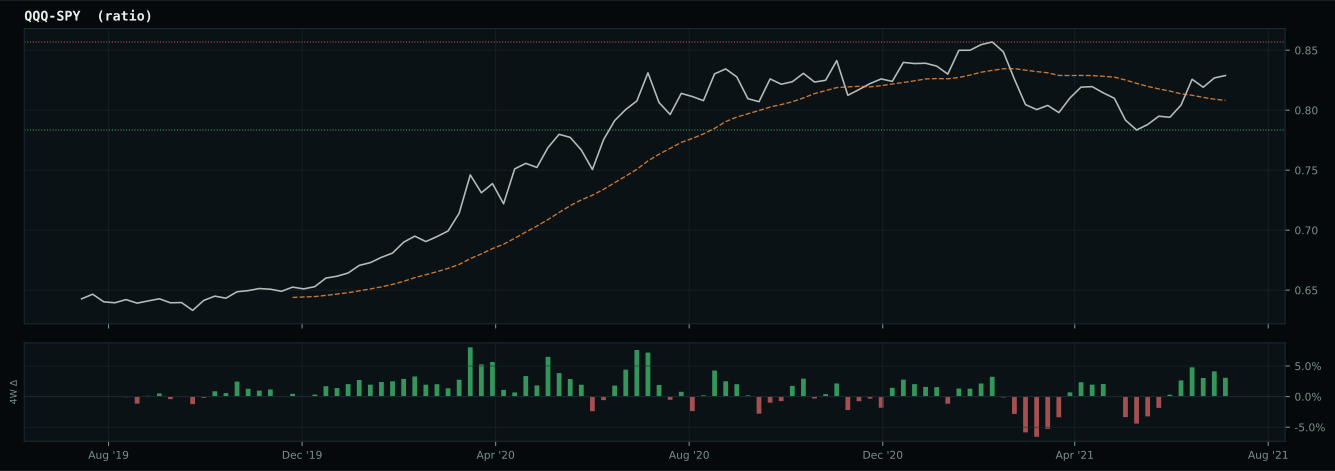
Macro Evidence Charts
Market-implied signals behind the macro regime scores. Each ratio compares two assets; the direction and slope of the ratio is what the macro engine reads.
Crypto Regime — AltSeason
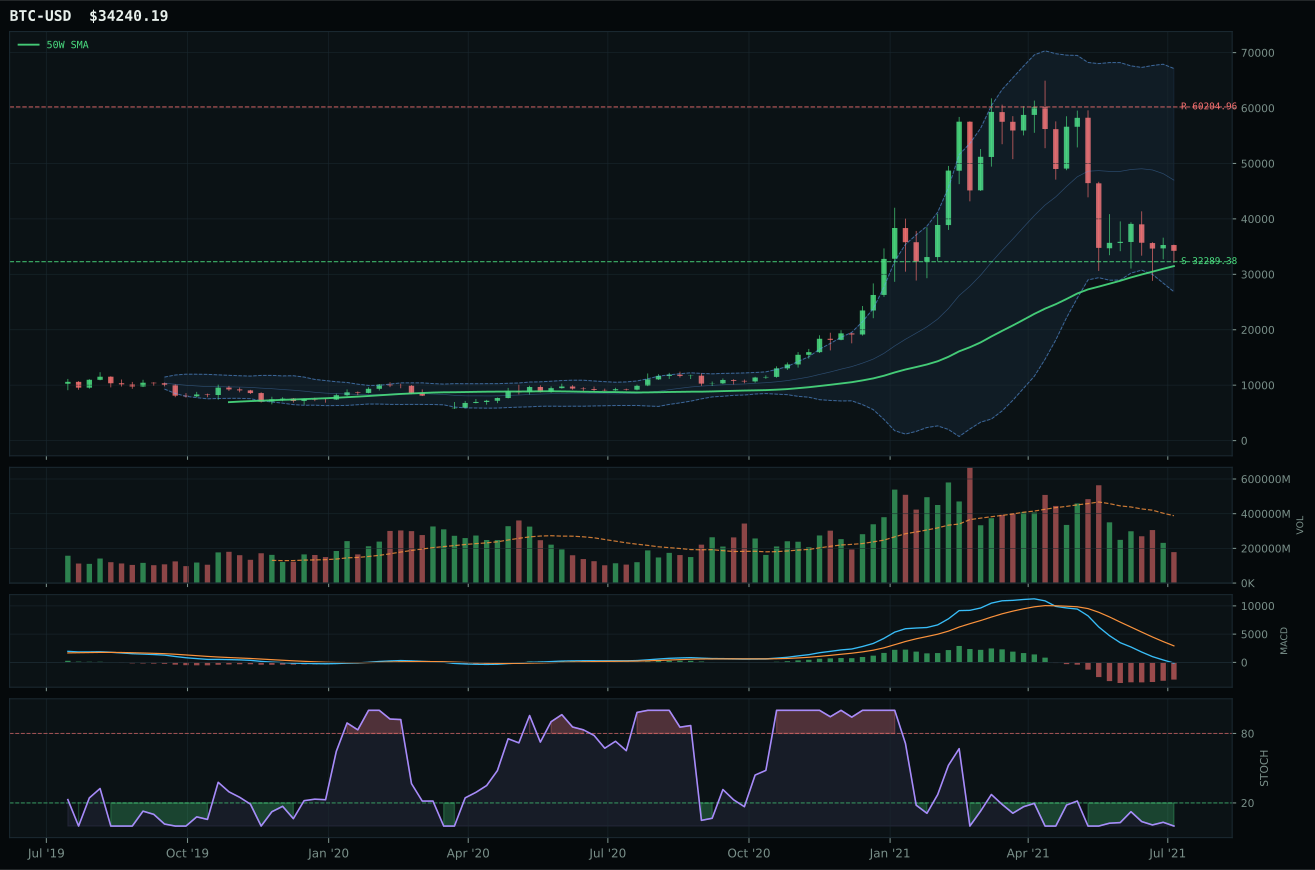
ValueBTC not armed: BTC has not made the first post-breakdown touch of the 200W buy zone after losing the 50W
TrendBTC confirmed: 2 consecutive closes above rising/flat 50W SMA
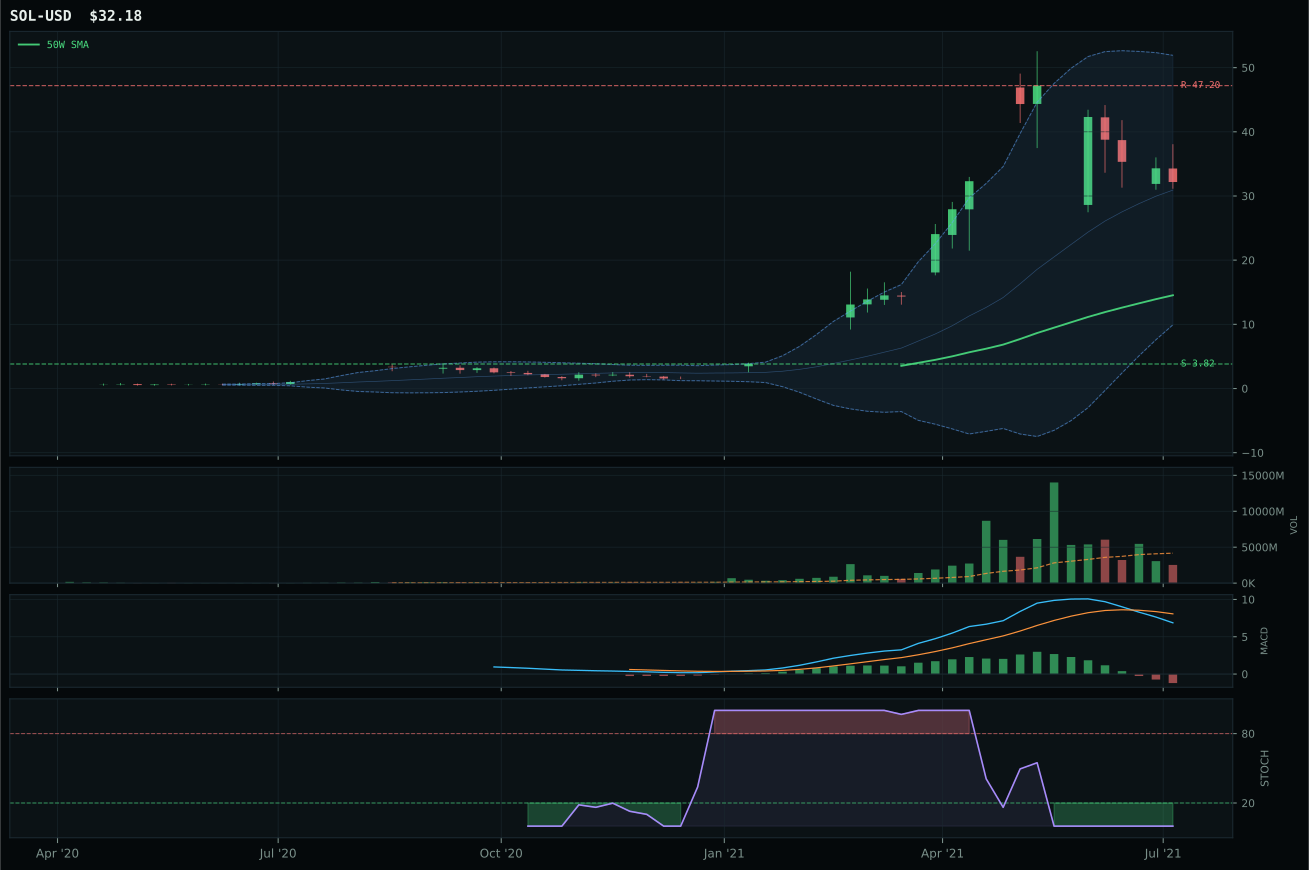
all available AltSeason conditions pass; missing optional confirmations skipped
Category Rankings
| Rank | Category | Winner | Score | Alloc | 4W Ret | Peers (4W) |
|---|---|---|---|---|---|---|
| 1 | Technology | XLK | 56.4 | 20% | +2.13% | CIBR -0.1% · IGV +2.4% |
| 2 | Traditional Energy | FCG | 55.4 | 20% | -13.73% | XOP -13.0% · XLE -6.5% |
| 3 | Industrial Metals | REMX | 51.7 | 10% | +12.40% | PICK +1.6% · COPX -0.8% |
| 4 | Emerging Markets | INDA | 49.5 | 10% | +3.37% | ILF -1.3% · IEMG -2.1% |
| 5 | AI | SMH | 46.6 | 10% | +4.21% | BOTZ -1.7% · AIQ +0.4% |
| 6 | Utilities & Infrastructure | XLU | 45.3 | 10% | +4.60% | IGF -0.6% · PAVE +3.0% |
| 7 | Precious Metals | SLV | 41.3 | 10% | -8.72% | GLD -3.4% · GDX -4.1% |
| 8 | Defense & Aerospace | ITA | 40.0 | 10% | -1.51% | ROKT -3.6% · XAR -5.2% |
| 9 | Agriculture & Livestock | MOO | 31.1 | 0% | -0.08% | VEGI -0.3% · WEAT +14.8% |
| 10 | Nuclear Energy | URA | 28.9 | 0% | -4.78% | NLR -0.9% · URNM -4.3% |
Technology — XLK
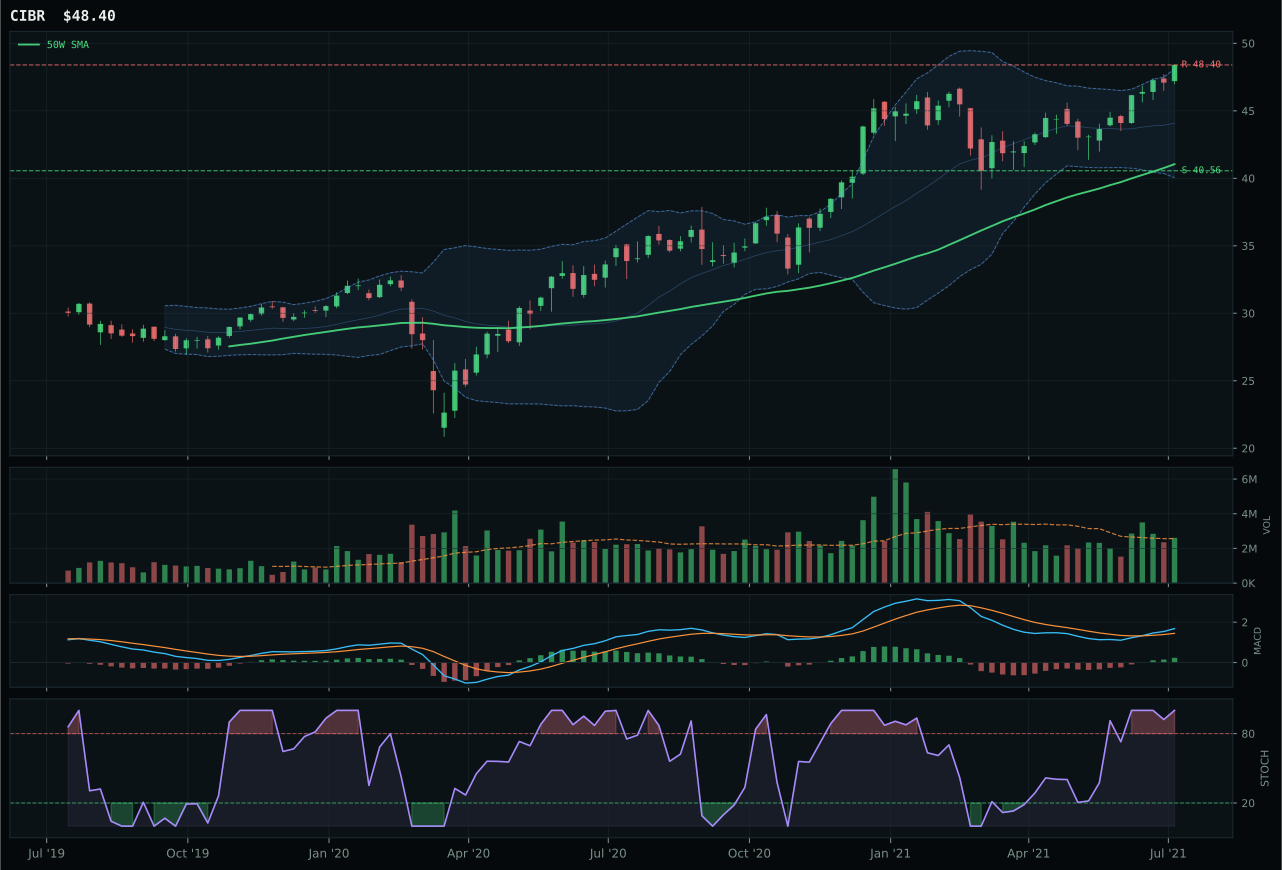
CIBR has a vertical extension profile with 6.0% 13-week relative strength versus SPY.
A failed hold above support would weaken the setup.
Actionable but governed by invalidation levels.
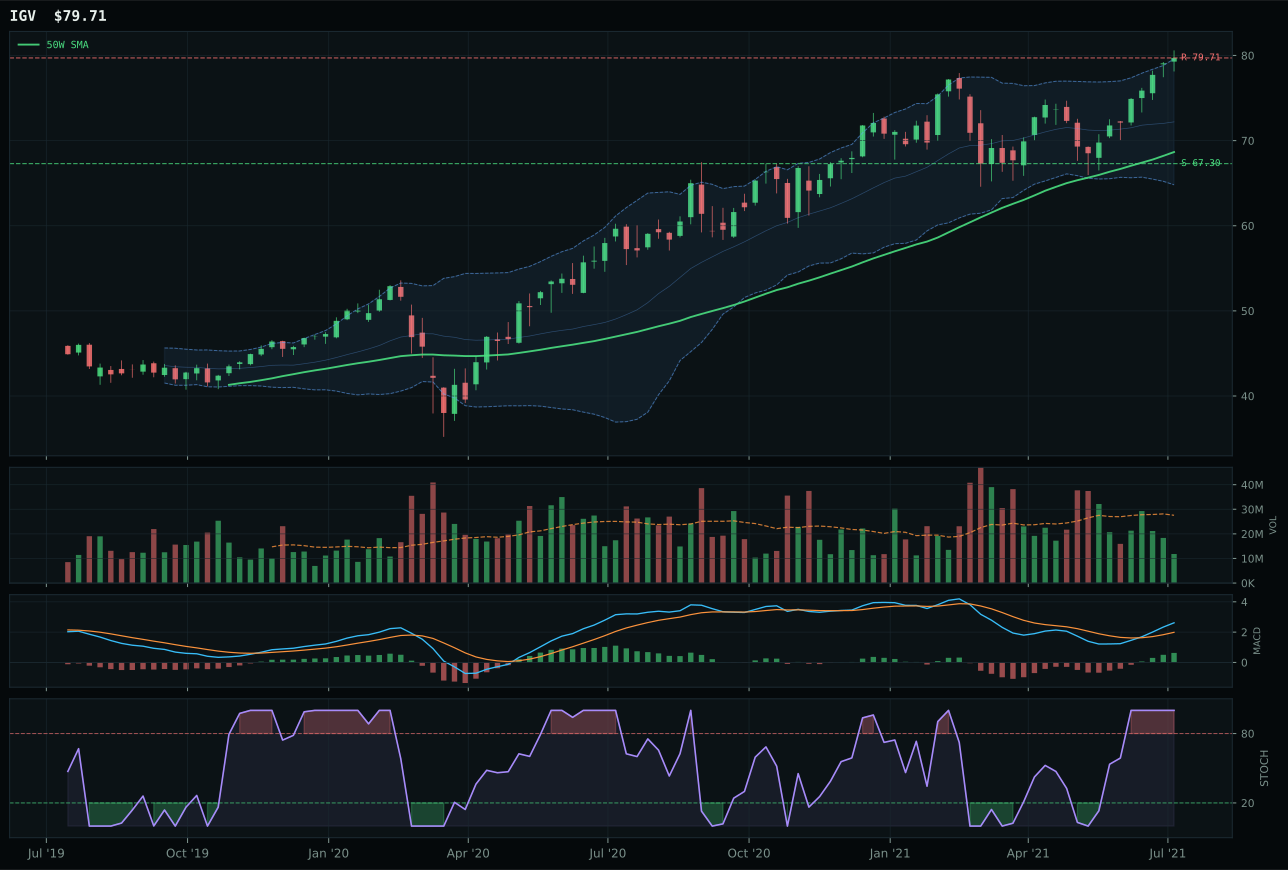
IGV has a vertical extension profile with 3.7% 13-week relative strength versus SPY.
A failed hold above support would weaken the setup.
Actionable but governed by invalidation levels.
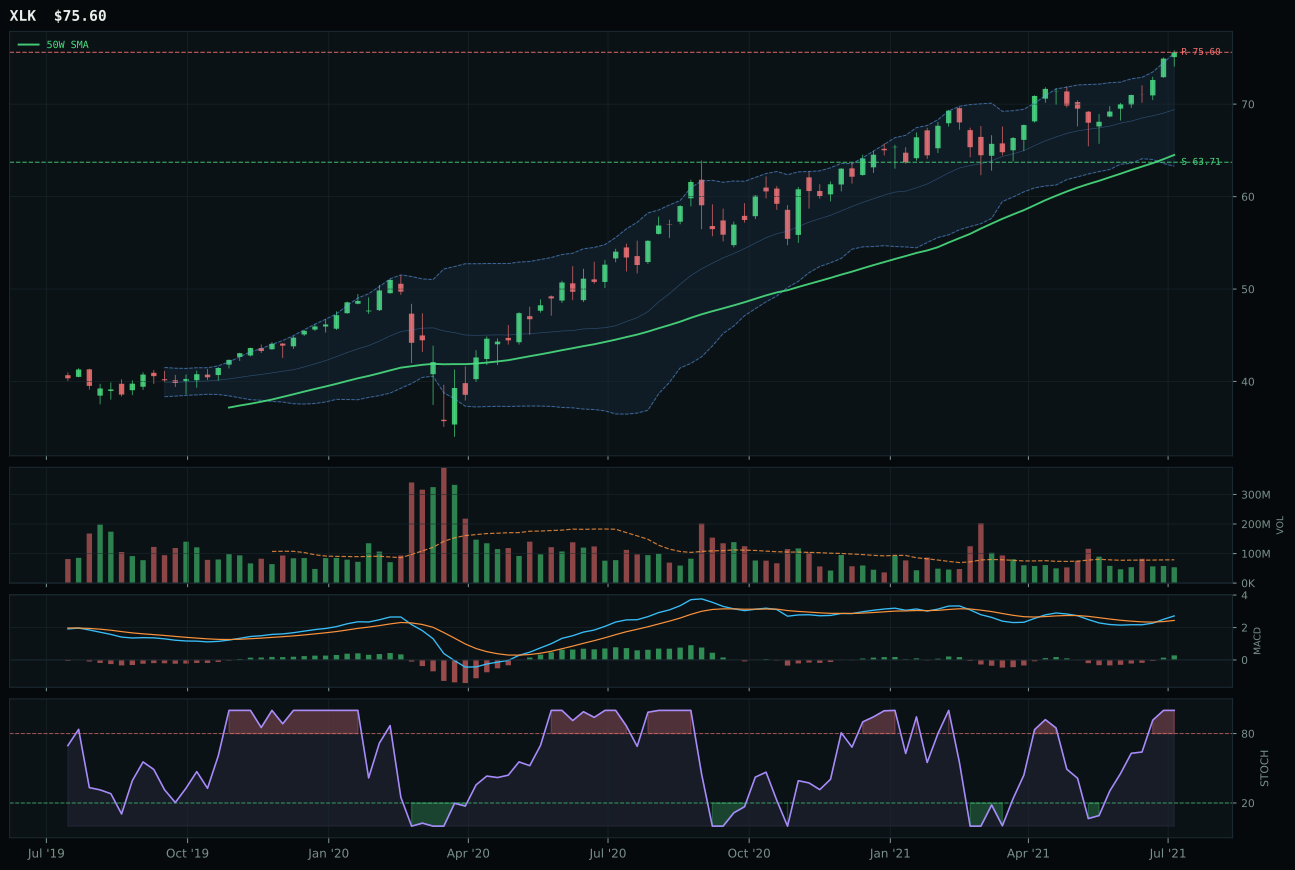
XLK has a vertical extension profile with 0.8% 13-week relative strength versus SPY.
A failed hold above support would weaken the setup.
Actionable but governed by invalidation levels.
XLK captured the Technology win by trading above both its 50-week and 200-week moving averages with a steady 0.7% slope, signaling sustained institutional accumulation in a regime of liquidity expansion. The 0.8% relative strength versus SPY masks the real story: XLK's 6.7% thirteen-week return and perfect 100.0/100 trend score reflect broad profitable technology leadership despite being 17.2% extended above its 50W—a setup that normally attracts late buyers at risk. CIBR, the runner-up, lost ground on cleaner structure (75.9 vs. 75.0) and marginally superior risk-reward positioning, but its stronger eleven-week relative strength of 6.0% versus SPY could not overcome the category's preference for XLK's breadth. MACD confirmation is bullish and improving across both names; the deciding factor was XLK's neutral volume participation at 0.68x the twenty-day average, which suggests accumulation rather than distribution, whereas CIBR's neutral volume reads as resignation from broader sponsorship.
Technology earned its position as a top-2 overweight at 10% allocation, ranking among the two highest eligible category scores at 56.4 and deserving capital during this Transition / Mixed regime. The category's technical evidence (62.0–71.8 across the basket) is sound, but the allocation reflects confidence in liquidity expansion and credit-stress dynamics rather than pure momentum: both active descriptors are present, and XLK's steady slope suggests institutional commitment will persist even as extension risk builds. What prevents Technology from claiming 20% is the uncomfortable truth in the timing scores—37.0/100 for the representative warns that entry risk is high, and at 17.2% above the 50W with stochastic RSI overbought at 1.00, new capital is arriving late to the party. The category remains eligible and valuable as a hedge to defensive rotations, but the allocator chose to pair it with Traditional Energy (also 10%) rather than concentrate further in extended names.
Traditional Energy — FCG
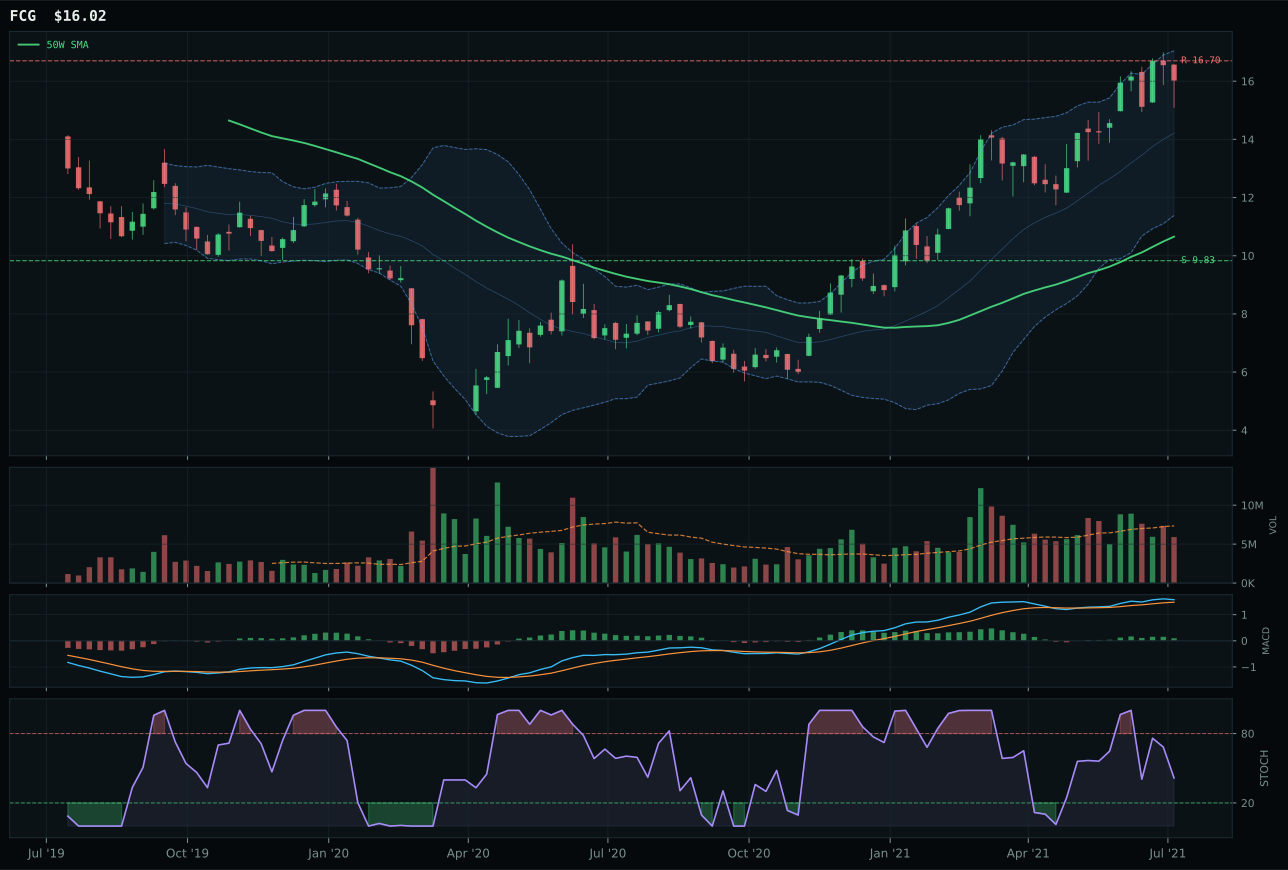
FCG has a vertical extension profile with 22.4% 13-week relative strength versus SPY.
A failed hold above support would weaken the setup.
Actionable but governed by invalidation levels.
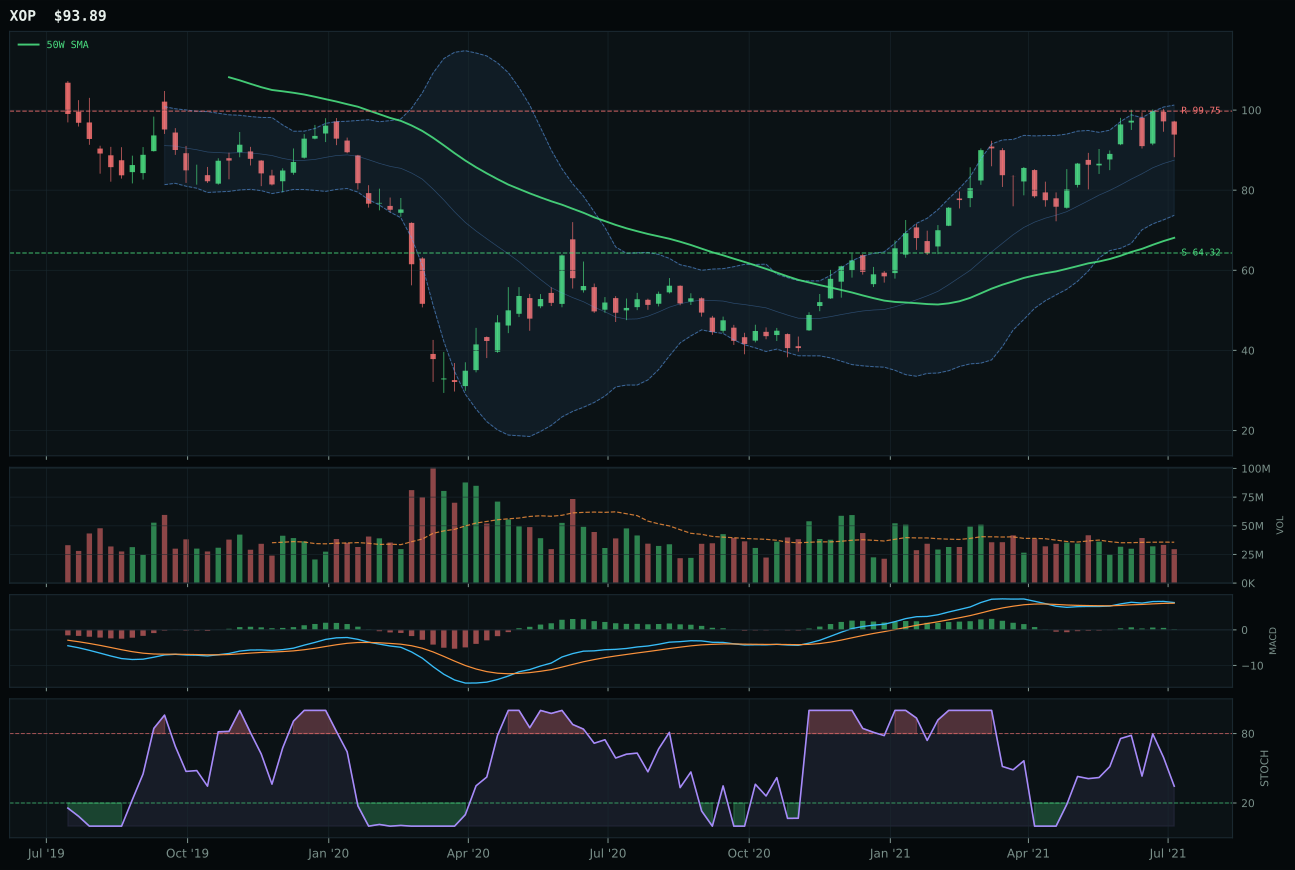
XOP has a vertical extension profile with 13.8% 13-week relative strength versus SPY.
A failed hold above support would weaken the setup.
Actionable but governed by invalidation levels.
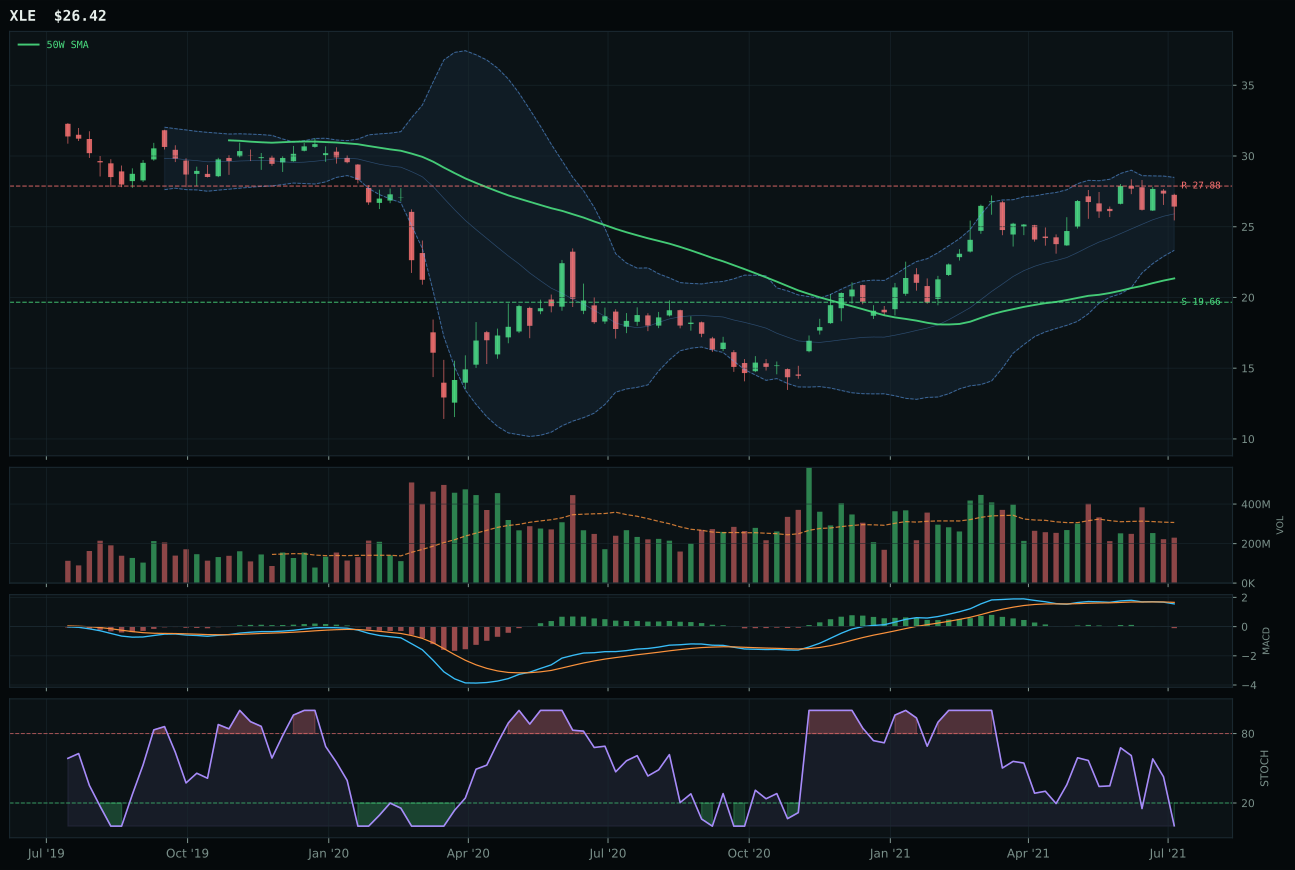
XLE has a vertical extension profile with 3.8% 13-week relative strength versus SPY.
A failed hold above support would weaken the setup.
Actionable but governed by invalidation levels.
FCG dominated Traditional Energy with explosive technical confirmation: a thirteen-week return of 28.3%, relative strength of 22.4% versus SPY, and category-relative strength of 8.6% establish it as the clear leader within its peer set. The trend score of 96.0/100 reflects a 1.6% fifty-week slope with price 50.3% above the 50W, supported by a bullish (though flattening) MACD and stochastic RSI rising through midzone at 0.41. Momentum confirmation scored a perfect 100.0/100 on the back of that thirteen-week return and volume-price confirmation at 74.6/100, signaling sustained accumulation. XOP's thirteen-week return of 19.6% trails by nine points, and its stochastic RSI fell into falling-neutral territory (versus FCG's rising midzone), reducing timing appeal despite its superior RS versus SPY (13.8% vs. 22.4% for FCG).
Traditional Energy earned its position as a top-2 overweight at 10% allocation alongside Technology, ranked as one of the two highest eligible category scores at 55.4. The category's macro fit is exceptionally strong at 66.0/100, driven by energy scarcity (+16) and real-asset sponsorship (+7), which in a Transition / Mixed regime provide exactly the structural bid that defensive rotations and inflation hedging demand. FCG's technical evidence of 70.4/100 is robust, and the thirteen-week momentum of 28.3% is the highest across all allocated categories. The entry-point risk is real—fifty percent extension above the 50W with upside to resistance nearly flat (−4.1%)—yet the portfolio chose conviction on the macro case over timing purity. What justifies the 10% alongside Technology rather than pushing one to 20% is the honest downside risk to support (63.0%), which means a break of the 9.83 level would unleash a sharp sell-off. Traditional Energy's allocation reflects high-conviction long-term positioning on energy scarcity; it is a core holding, not a trade.
Industrial Metals — REMX
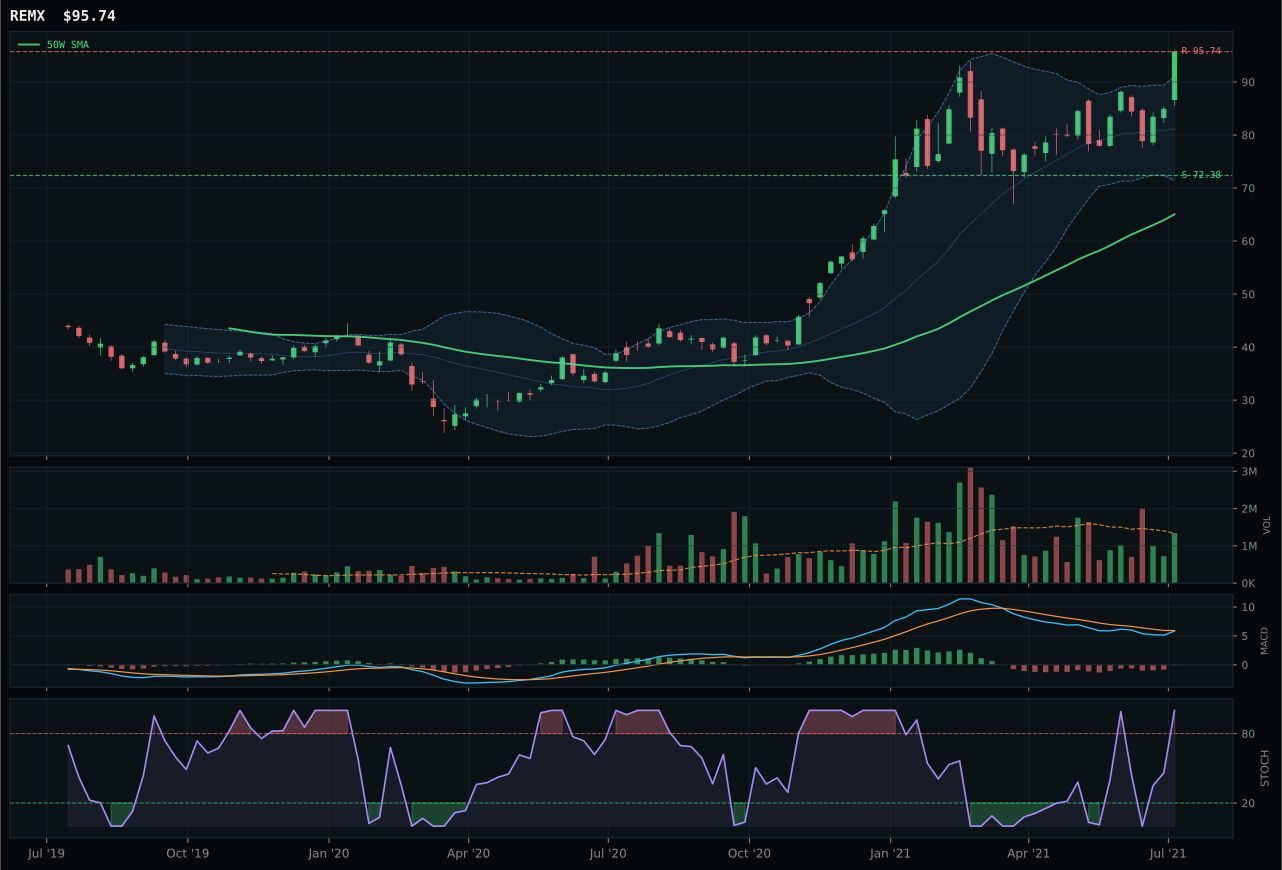
REMX has a vertical extension profile with 17.8% 13-week relative strength versus SPY.
A failed hold above support would weaken the setup.
Actionable but governed by invalidation levels.
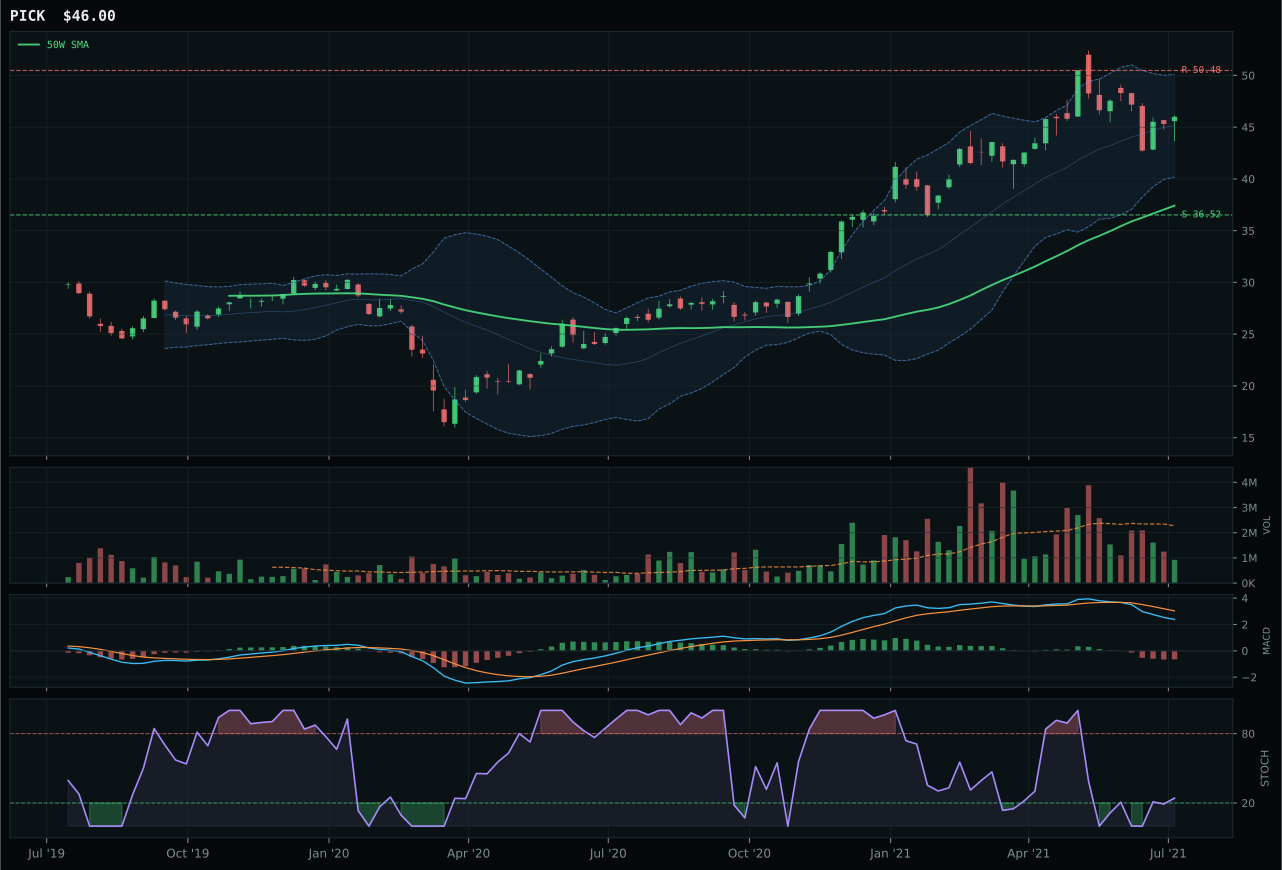
PICK has a vertical extension profile with 0.1% 13-week relative strength versus SPY.
A failed hold above support would weaken the setup.
Actionable but governed by invalidation levels.
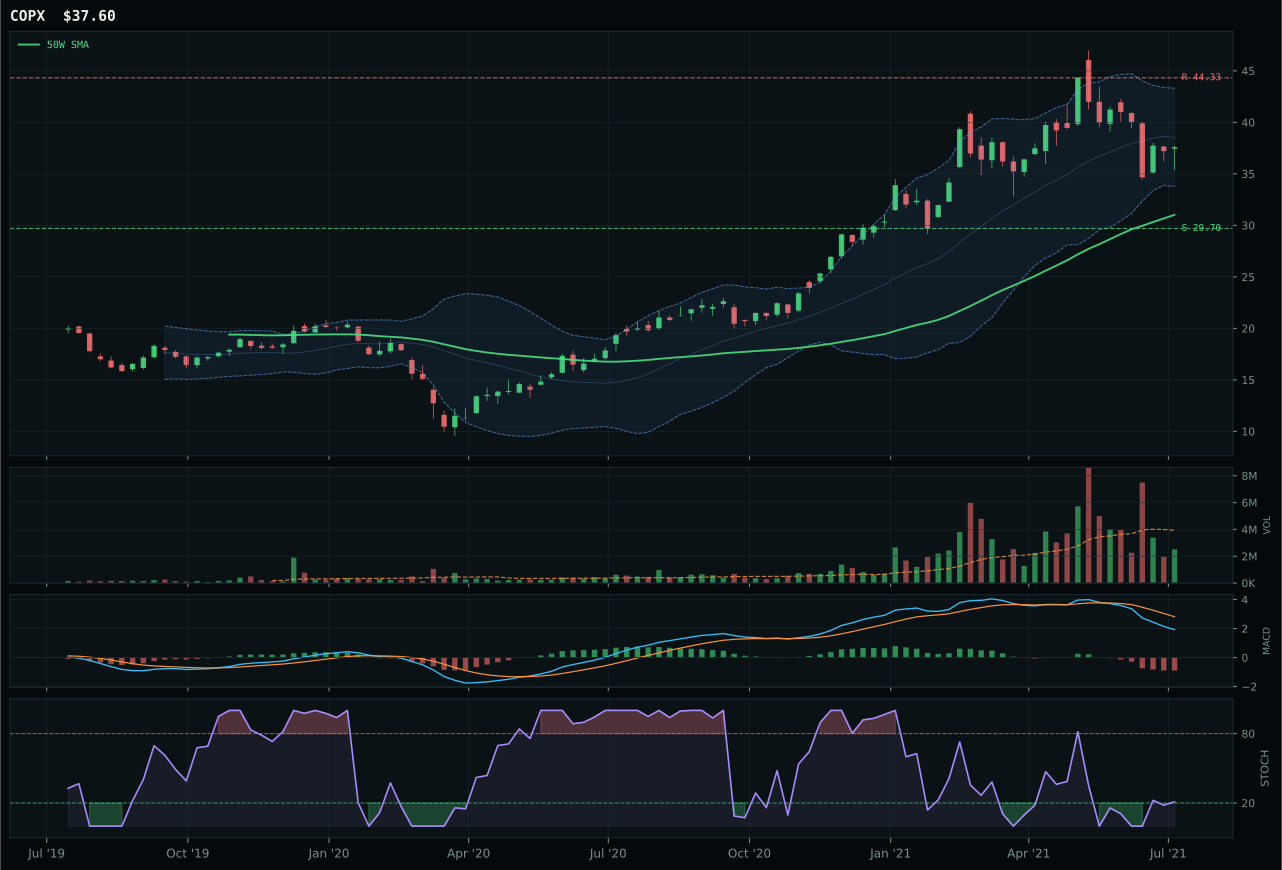
COPX has a vertical extension profile with -5.5% 13-week relative strength versus SPY.
A failed hold above support would weaken the setup.
Actionable but governed by invalidation levels.
REMX dominated Industrial Metals by delivering exactly what the category needed: a thirteen-week return of 23.6% paired with 17.8% relative strength versus SPY and a category-relative strength of the same 17.8%, meaning it did not just follow the category—it led it. The trend score maxed out at 100.0/100 on the back of a 1.7% fifty-week slope and price 47.2% above the 50W, with MACD bullish-but-improving and stochastic RSI overbought at 1.00. Volume confirmation is exceptional at 79.7/100, and persistence scores 81.1/100, signaling that this rare-earth supply-chain beta has genuine sponsorship behind it. PICK lagged by 6.4 points, undermined by inferior structure (67.8 vs. 72.3), thin volume participation versus REMX's neutral reading, and category-relative strength that failed to materialize (0.0% vs. 17.8%).
Industrial Metals earned 5% allocation as a tier-2 category, reflecting its final score of 51.7—above the Agriculture floor but below the top-2 cutoff of roughly 55 points. REMX's technical evidence of 68.0/100 is formidable, and the macro fit at 73.0/100 is the highest among all categories this week, powered by metals scarcity (+14), commodity breadth (+10), and real-asset sponsorship (+6). Despite credit stress (-7) as a headwind, this category has earned its seat at the table. The tension is timing: at 47.2% extended above the 50W with stochastic RSI overbought at 1.00, REMX is vulnerable to a sharp retracement if momentum falters. What keeps it at 5% rather than promoting it to 10% is the risk-reward tilted downward (upside 0%, downside 32.3%), meaning entry risk has materialized even as the macro case remains compelling. If REMX pulls back to consolidation and the stochastic resets to midzone, the category could earn promotion to top-2; for now, the 5% respects both the exceptional macro tailwind and the honest assessment of entry-point risk.
Emerging Markets — INDA
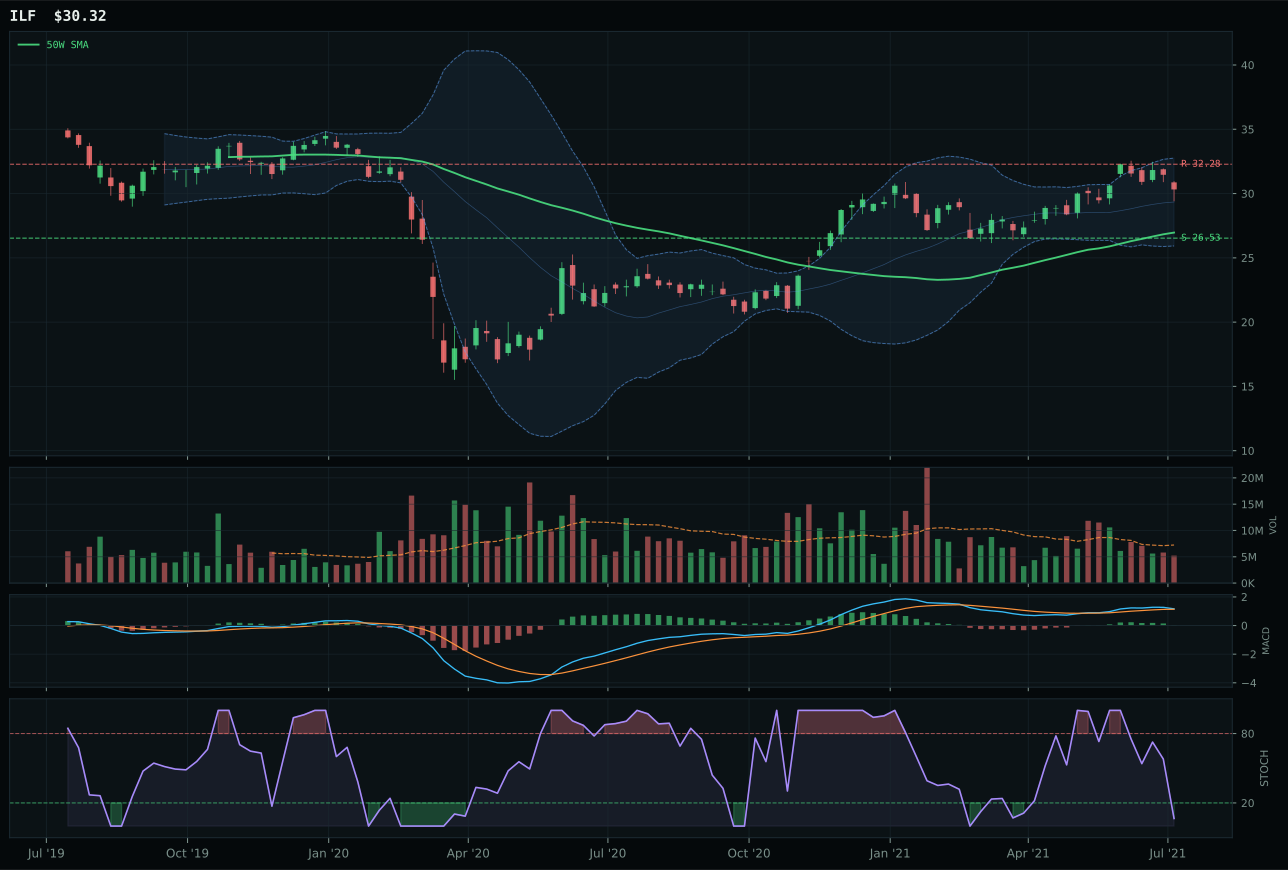
ILF has a neutral structure profile with 2.8% 13-week relative strength versus SPY.
A failed hold above support would weaken the setup.
Actionable but governed by invalidation levels.
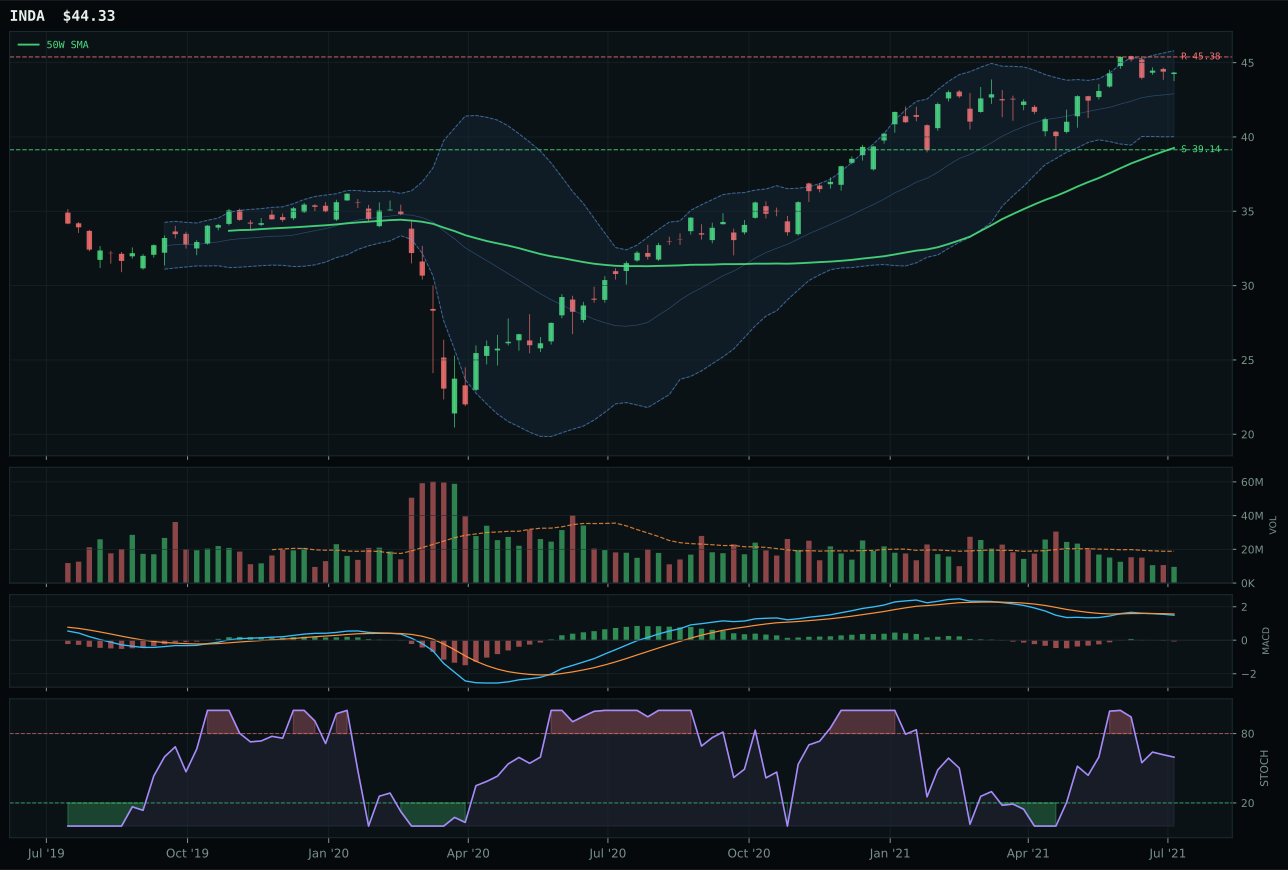
INDA has a neutral structure profile with 0.5% 13-week relative strength versus SPY.
A failed hold above support would weaken the setup.
Actionable but governed by invalidation levels.
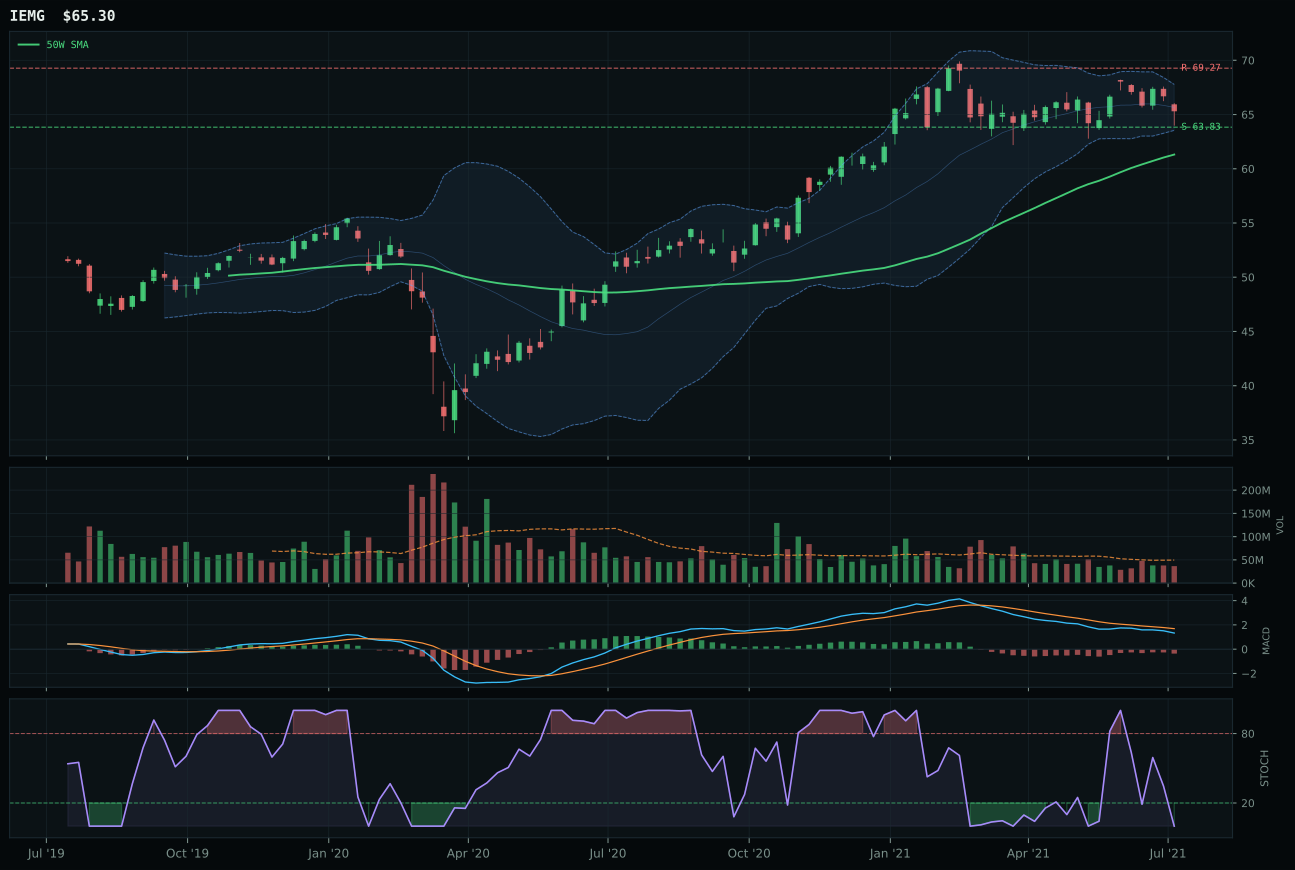
IEMG has a pullback into support profile with -5.0% 13-week relative strength versus SPY.
A failed hold above support would weaken the setup.
Actionable but governed by invalidation levels.
INDA captured Emerging Markets by combining a clean neutral structure, tight compression above the 50W at just 12.9%, and a stochastic RSI rising through midzone at 0.60—a setup that reads as coiled and early in its rebound. The thirteen-week return of 6.3% with 0.5% RS versus SPY trails what broader emerging-market indices have delivered, yet the category-relative strength of 0.0% ties it to peer median and reflects India-specific stability. Timing scored a strong 70.0/100 on the back of distance-to-50W proximity and rising stochastic, compensating for the bearish-weakening MACD and thin volume participation. ILF, the runner-up, posted stronger thirteen-week momentum (8.6%) and superior RS versus SPY (2.8%), but its oversold stochastic (vs. INDA's rising midzone) and weaker structure (66.8 vs. 71.1) lost the category decision by 4.3 points.
Emerging Markets earned 5% allocation as a tier-2 category, justified by a final score of 49.5 and macro support that proved stronger than most realized. The category-level macro fit is 62.0/100, powered by emerging-market liquidity support (+14) and liquidity expansion (+8), which in a Transition / Mixed regime favor capital flows into growth-oriented EM. INDA's technical evidence of 46.3/100 is adequate but unspectacular; the real appeal lies in the neutral structure and rising-midzone stochastic, which suggest a coil setup with room to extend if volume confirms. The thirteen-week return of 6.3% is respectable within the category but trails the broader EM basket, which is why tier-2 (5%) allocation rather than tier-1 (10%) is appropriate. What would upgrade Emerging Markets to top-2 is either ILF's commodity-linked beta gaining sustained momentum (currently suppressed by the oversold condition) or INDA's volume participation jumping from 0.51x to neutral or above. For now, the 5% respects the macro tailwind and the coil setup while acknowledging that execution risk remains elevated.
AI — SMH
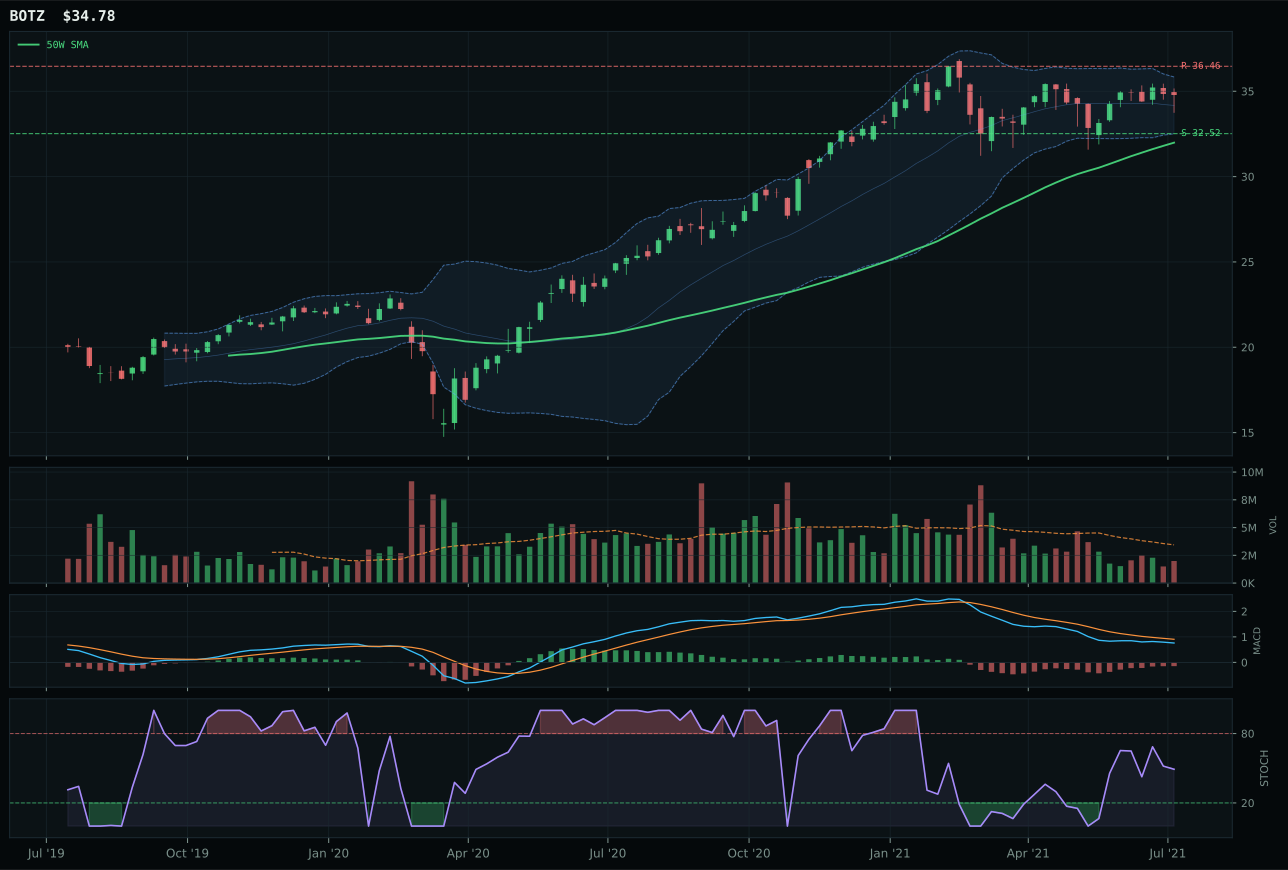
BOTZ has a neutral structure profile with -5.6% 13-week relative strength versus SPY.
A failed hold above support would weaken the setup.
Actionable but governed by invalidation levels.
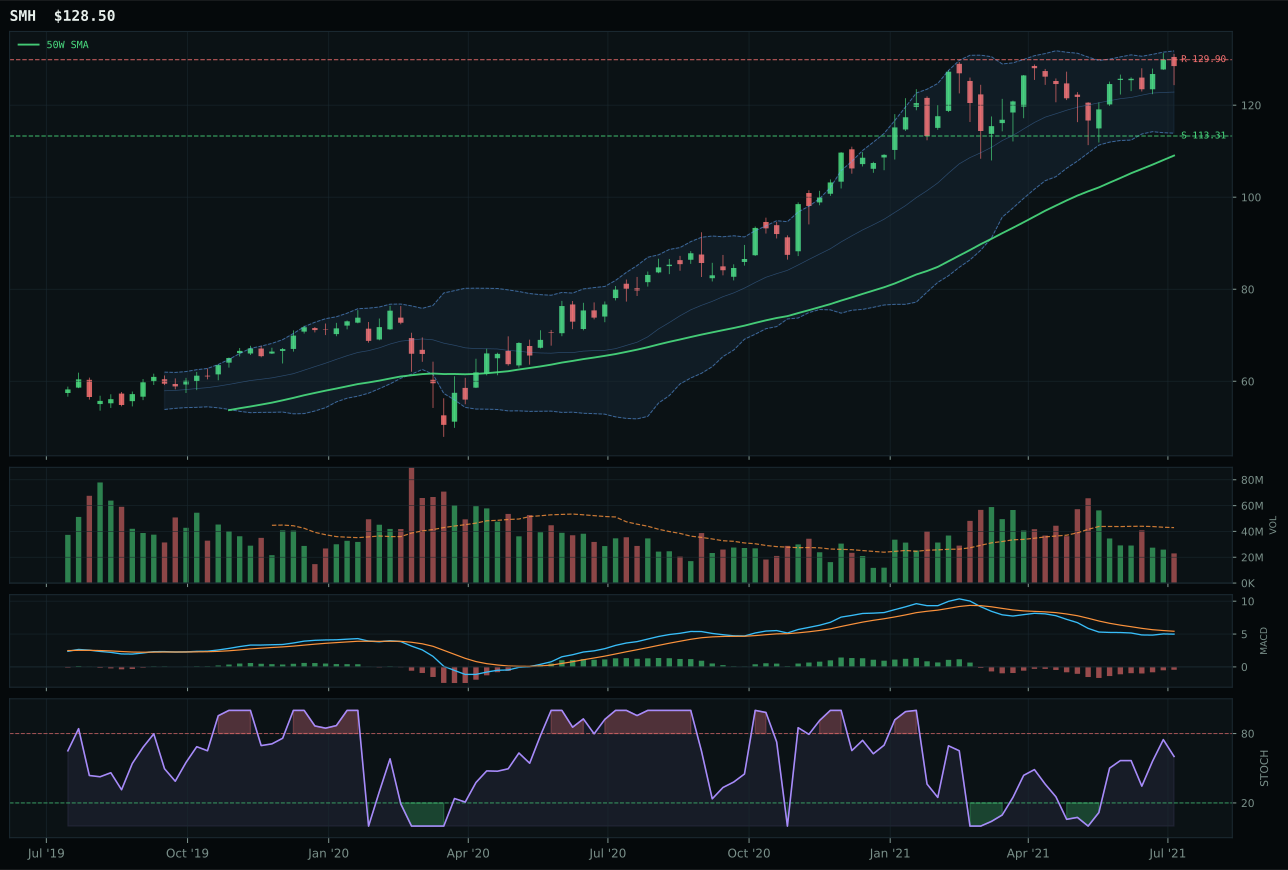
SMH has a vertical extension profile with -5.5% 13-week relative strength versus SPY.
A failed hold above support would weaken the setup.
Actionable but governed by invalidation levels.
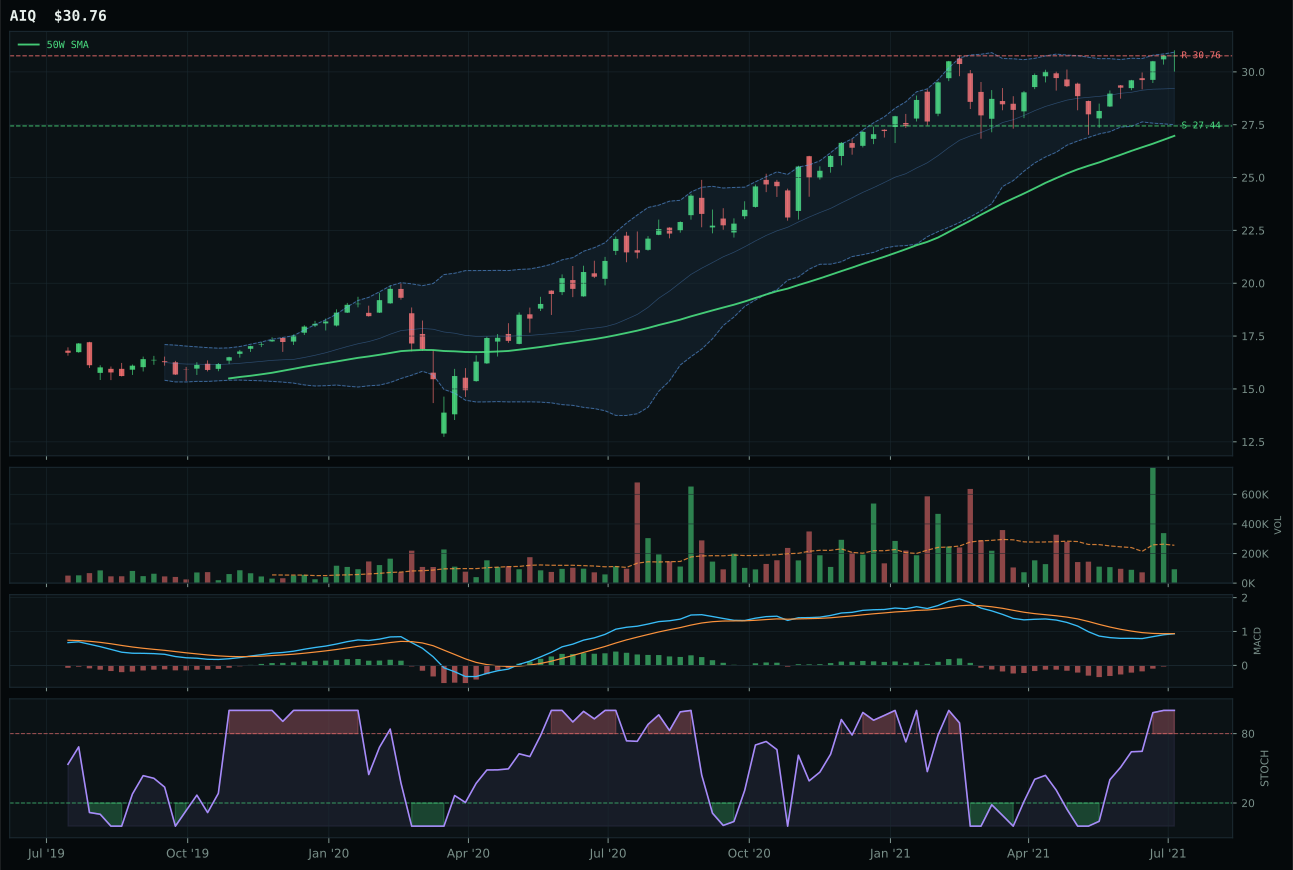
AIQ has a neutral structure profile with -2.8% 13-week relative strength versus SPY.
A failed hold above support would weaken the setup.
Tracked, but not top-2 eligible because: .
SMH won the AI category despite a bearish-but-improving MACD and a stochastic RSI that sits only midway through its recovery at 0.60—signs that momentum is fragile rather than explosive. The semiconductor and AI compute exposure traded above both moving averages with a 0.9% slope, generating a respectable 84.8/100 trend score and 0.0% category-relative strength that gave it a technical parity argument within the three-ETF basket. What separated SMH from BOTZ was structure cleanliness (71.9 vs. 65.2): SMH's compression at 78.4 is tighter, and its support at 113.31 is more defensible, offering a coiled setup that could spring if volume confirms. However, the margin of victory was slim—12.2 points over BOTZ—and that gap reflects a category in distress, not a category firing on all cylinders. The thirteen-week return of just 0.4% against SPY's broader gains explains why momentum confirmation scores only 42.0/100, a red flag that this leadership has stalled.
AI received 5% allocation as a tier-2 holding, a deliberate admission that the category ranked outside the top two and does not merit overweight conviction. The final score of 46.6 sits well below Technology's 56.4 and Traditional Energy's 55.4, and the technical evidence of 50.6/100 (SMH's burden) reveals how much this setup depends on a macro narrative rather than chart strength. Liquidity expansion favors AI (+10), but credit stress dampens the case (-8), leaving the category at 52.0/100 macro fit—neutral and uninspiring. For AI to graduate to top-2 status, either SMH's momentum confirmation would need to climb above 50.0 (currently 42.0) through a meaningful rally in thirteen-week returns, or the MACD would need to flip decisively bullish instead of hanging in a weakening state. Until then, the 5% slot honors the long-term secular thesis while guarding against the risk that this brief extension collapses into a much deeper pullback.
Utilities & Infrastructure — XLU
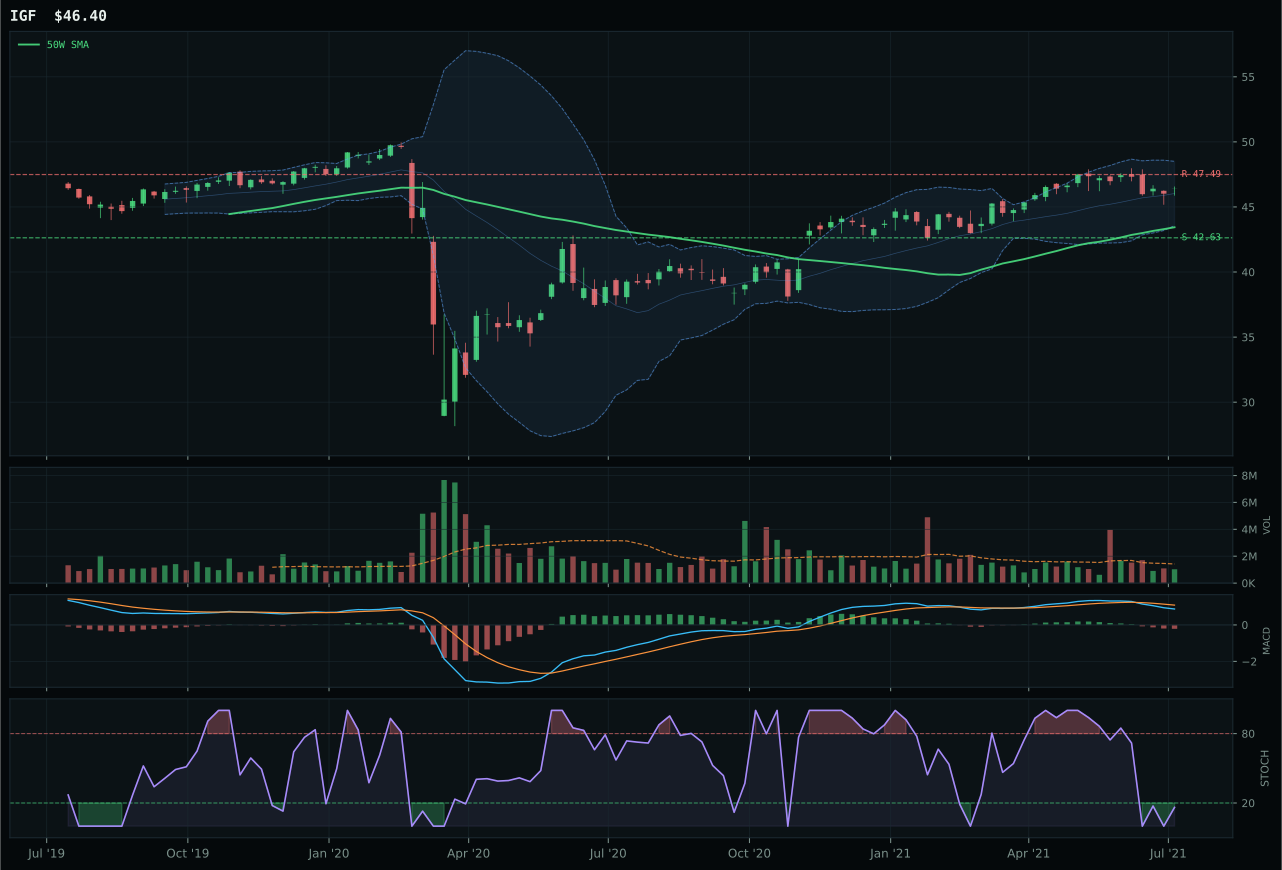
IGF has a neutral structure profile with -4.8% 13-week relative strength versus SPY.
A failed hold above support would weaken the setup.
Actionable but governed by invalidation levels.
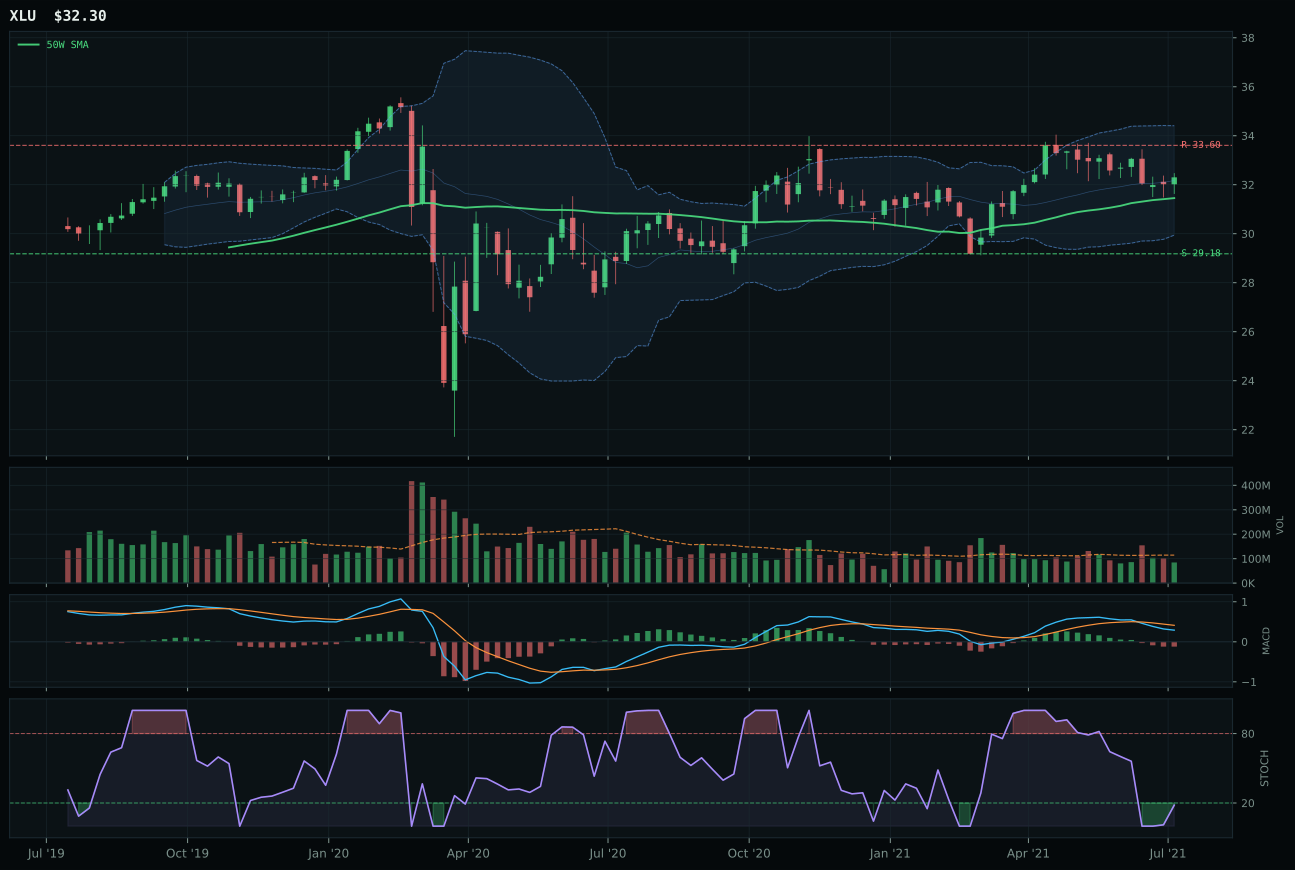
XLU has a compression near 50W profile with -6.2% 13-week relative strength versus SPY.
A failed hold above support would weaken the setup.
Actionable but governed by invalidation levels.
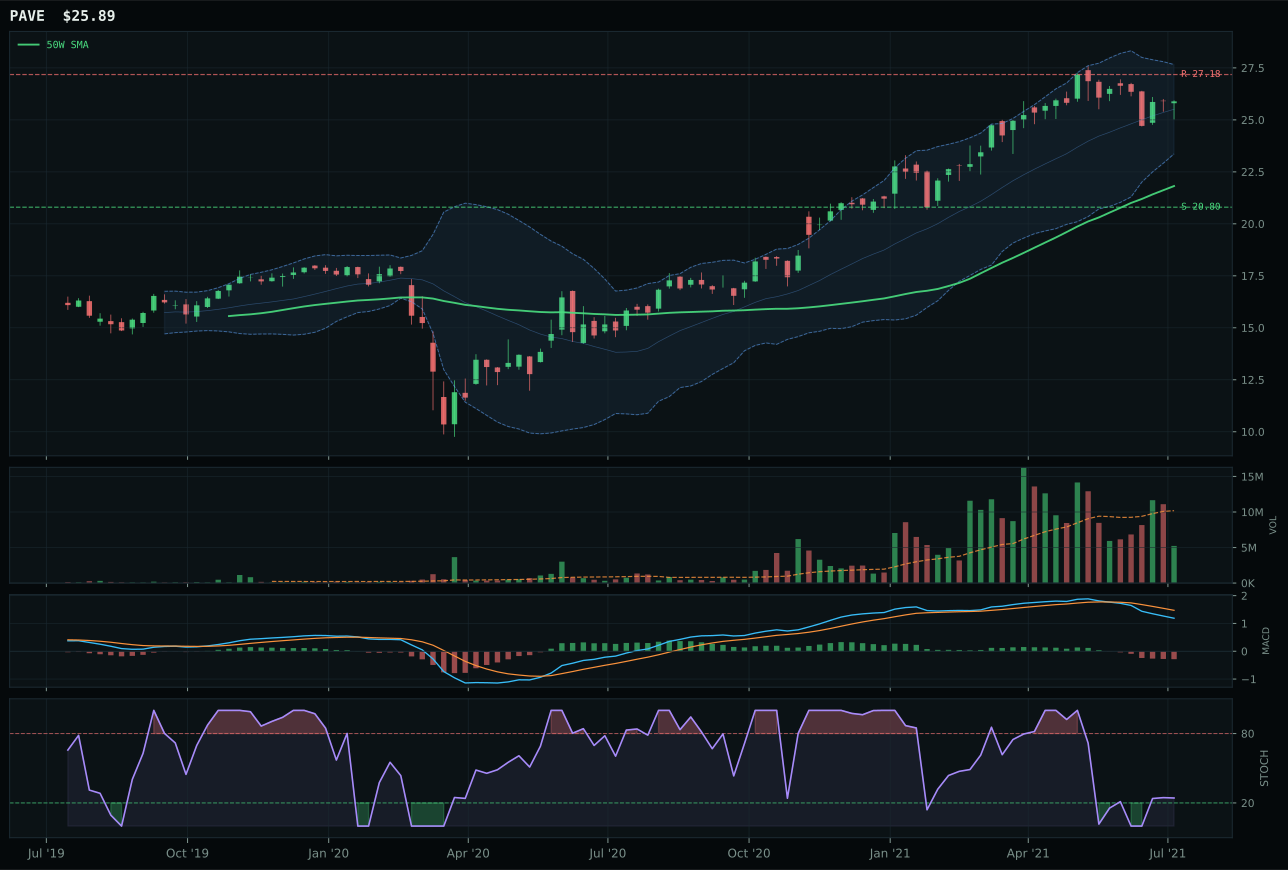
PAVE has a vertical extension profile with -3.7% 13-week relative strength versus SPY.
A failed hold above support would weaken the setup.
Actionable but governed by invalidation levels.
XLU prevailed in Utilities & Infrastructure by offering the purest mean-reversion entry point in a category defined by oversold exhaustion. The price sits just 2.7% above its 50W—essentially at value—with stochastic RSI flipped oversold and beginning to turn upward at 0.18, a timing score of 100.0/100 that no competitor matched. Structure is cleanly compressed at 78.9 compression ratio, and the seven-day slope of 0.1% shows price finding support rather than rolling over further. Volume is thin at 0.74x, which in a mean-reversion context is acceptable (no fresh distribution pressure). IGF scored higher on risk-reward (49.7 vs. 51.5 for XLU), yet its neutral structure (69.4 vs. XLU's 70.9) and timing penalty of 84.0 versus XLU's perfect 100.0 cost it the category by 6.7 points.
Utilities & Infrastructure received 5% allocation as a tier-2 category, the result of a final score of 45.3 that ranks it seventh among the ten categories and reflects pure mean-reversion opportunity rather than momentum tailwind. The technical evidence of 34.1/100 (XLU's burden) is the weakest among allocated categories, signaling that this position rests almost entirely on timing setup (perfect 100.0 score on distance-to-50W and oversold-turn-up stochastic) rather than trend strength. The macro fit of 54.0/100 is neutral; the Transition / Mixed regime offers mild support (+4), but no active descriptor strongly favors defensive utilities. The thirteen-week return of negative 0.3% confirms that this category has lagged badly, making the allocation a pure contrarian play on mean reversion and oversold relief. What would elevate Utilities to top-2 is sustained volume-price confirmation through the rebound, a bullish MACD cross, and evidence that relative strength has genuinely stabilized. Until then, the 5% slot honors the asymmetric timing mechanics while limiting exposure to a low-conviction setup.
Precious Metals — SLV
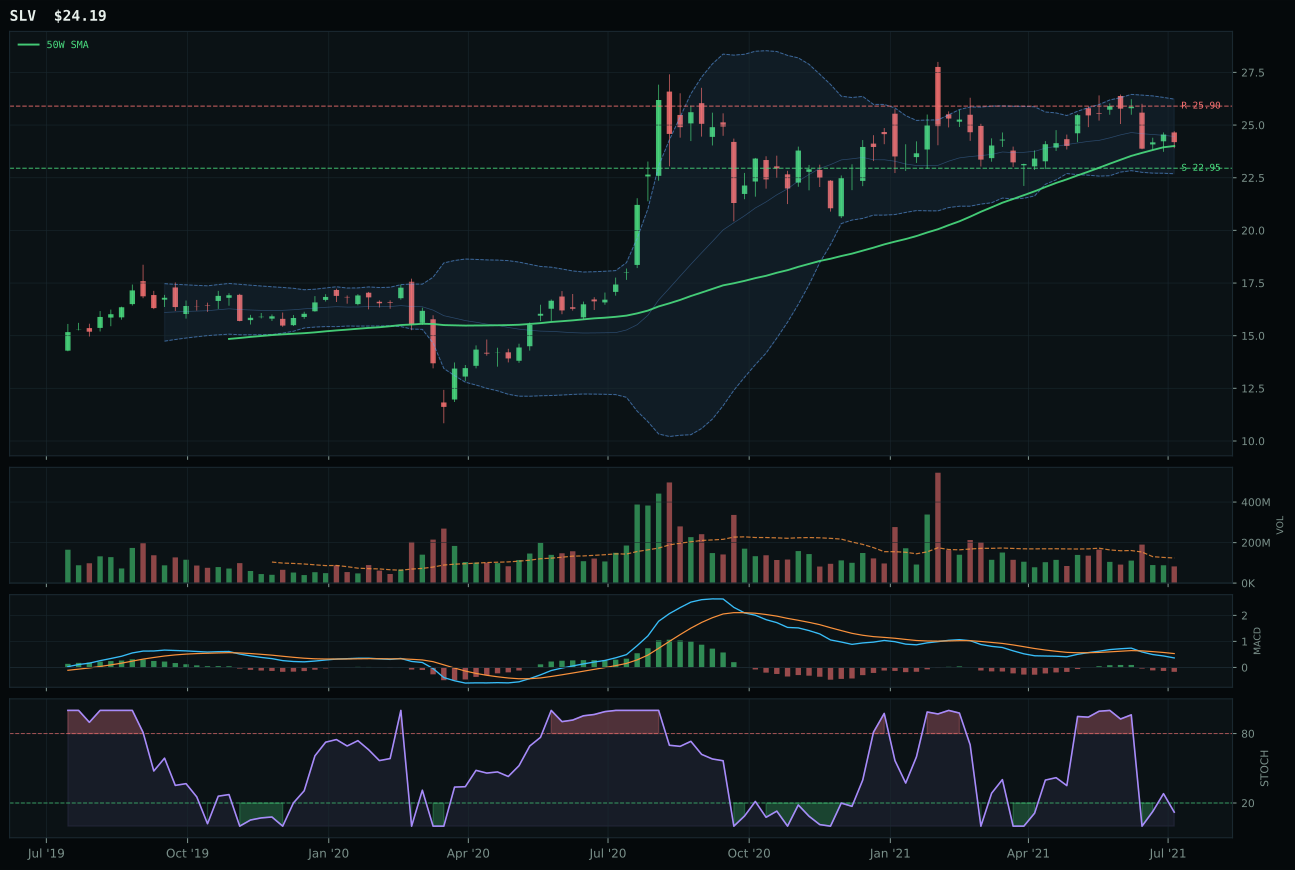
SLV has a compression near 50W profile with -2.5% 13-week relative strength versus SPY.
A failed hold above support would weaken the setup.
Actionable but governed by invalidation levels.
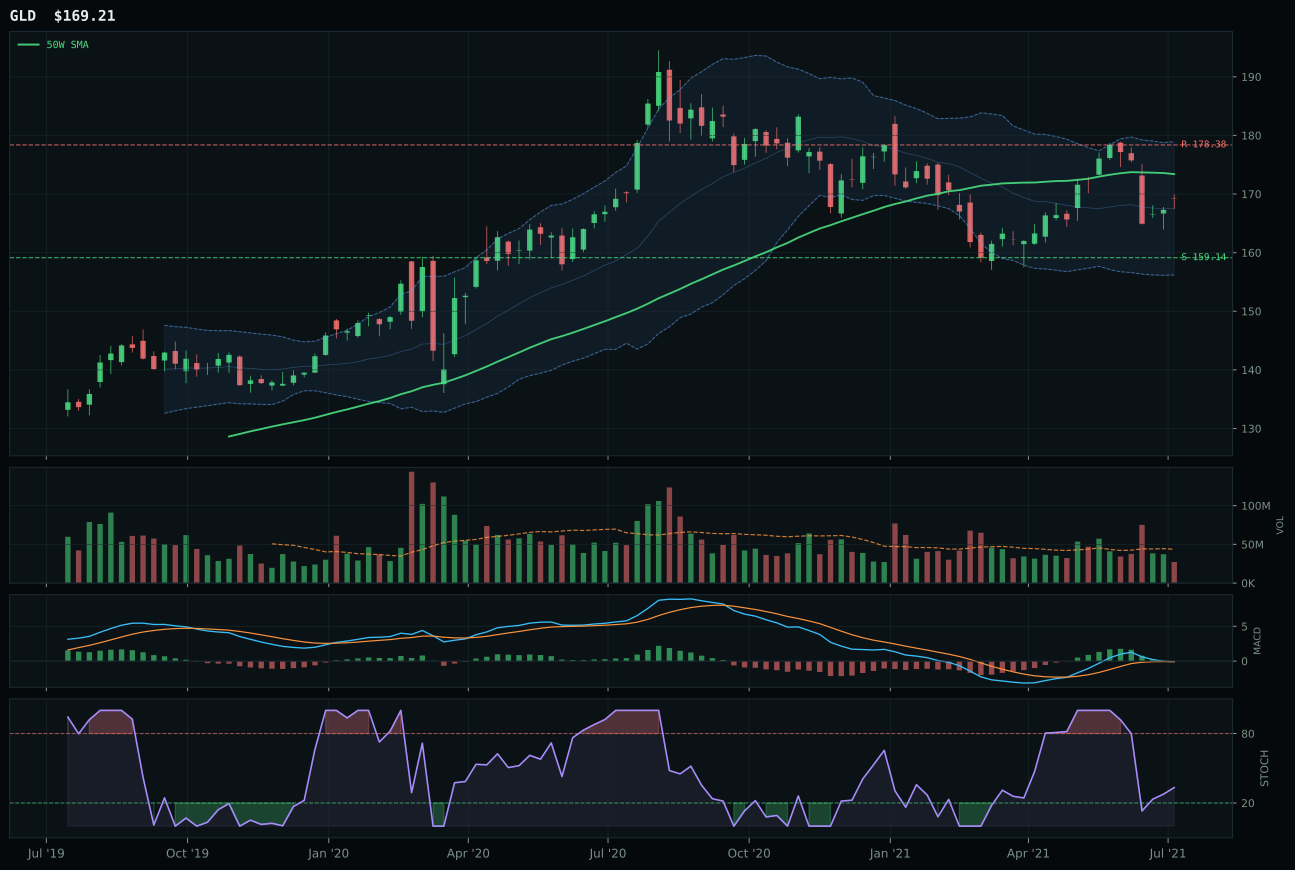
GLD has a compression near 50W profile with -2.2% 13-week relative strength versus SPY.
A failed hold above support would weaken the setup.
Actionable but governed by invalidation levels.
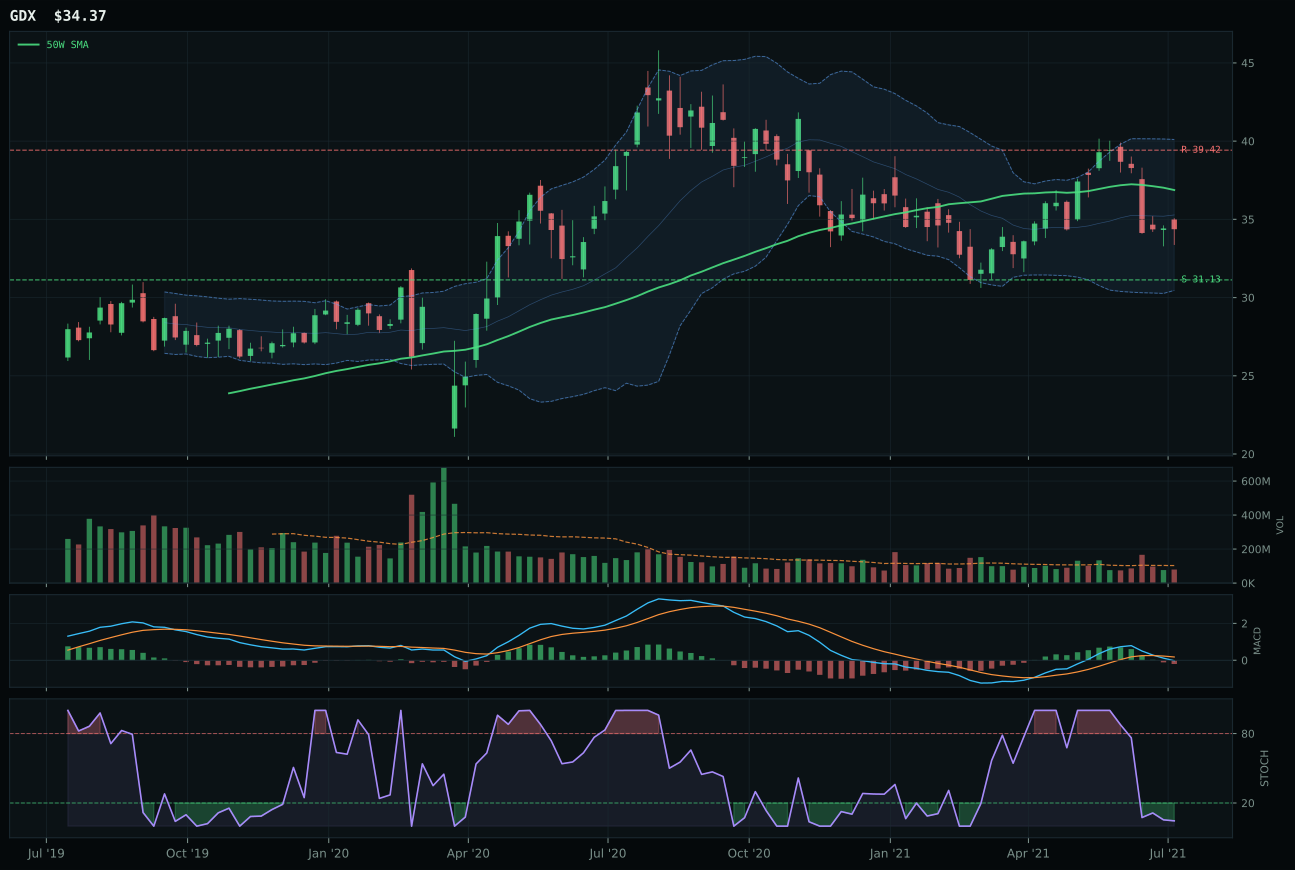
GDX has a neutral structure profile with -6.9% 13-week relative strength versus SPY.
A failed hold above support would weaken the setup.
Actionable but governed by invalidation levels.
SLV captured Precious Metals by virtue of superior timing: the thirteen-week return of 3.3% and stochastic RSI at 0.12 (oversold turn-up) provide a mean-reversion entry point that GLD, sitting in rising midzone at 0.60, does not offer. Both names compress near their 50-week moving averages—SLV is 0.8% from its 50W, GLD slightly further—and both trade with thin volume participation and a bearish-but-improving MACD backdrop. The deciding factor was stochastic position: SLV's oversold turn-up at 0.12 versus GLD's rising midzone reads as earlier in the bounce, offering better asymmetry for a mean-reversion trade. The nine-point gap (41.3 vs. 31.7) underscores how tight this category is; both names are compressed and vulnerable to a surprise break either direction.
Precious Metals received 5% allocation as a tier-2 holding, justified by superior timing mechanics (SLV's 100.0/100 score on distance-to-50W plus oversold-turn-up stochastic) despite a category-level macro fit that barely cleared 48.0/100. Liquidity expansion actually worked against this category (-2 macro points), but metals scarcity (+7) provided enough narrative support to keep it in the portfolio. The risk-reward profile is asymmetric: upside to resistance is only 6.6% downside, yet downside to support is just 5.4%—a true coil setup that could move sharply either direction on catalysts. For Precious Metals to upgrade to top-2, the category score would need to crack 50 points, which demands either a spike in volume confirmation (currently 39.2/100) through sudden ETF inflows, a bullish MACD cross, or persistence of the oversold-turn-up stochastic into a full rally. The current 5% slot respects the asymmetric timing while acknowledging that macro support is weak and relative to more momentum-driven names.
Defense & Aerospace — ITA
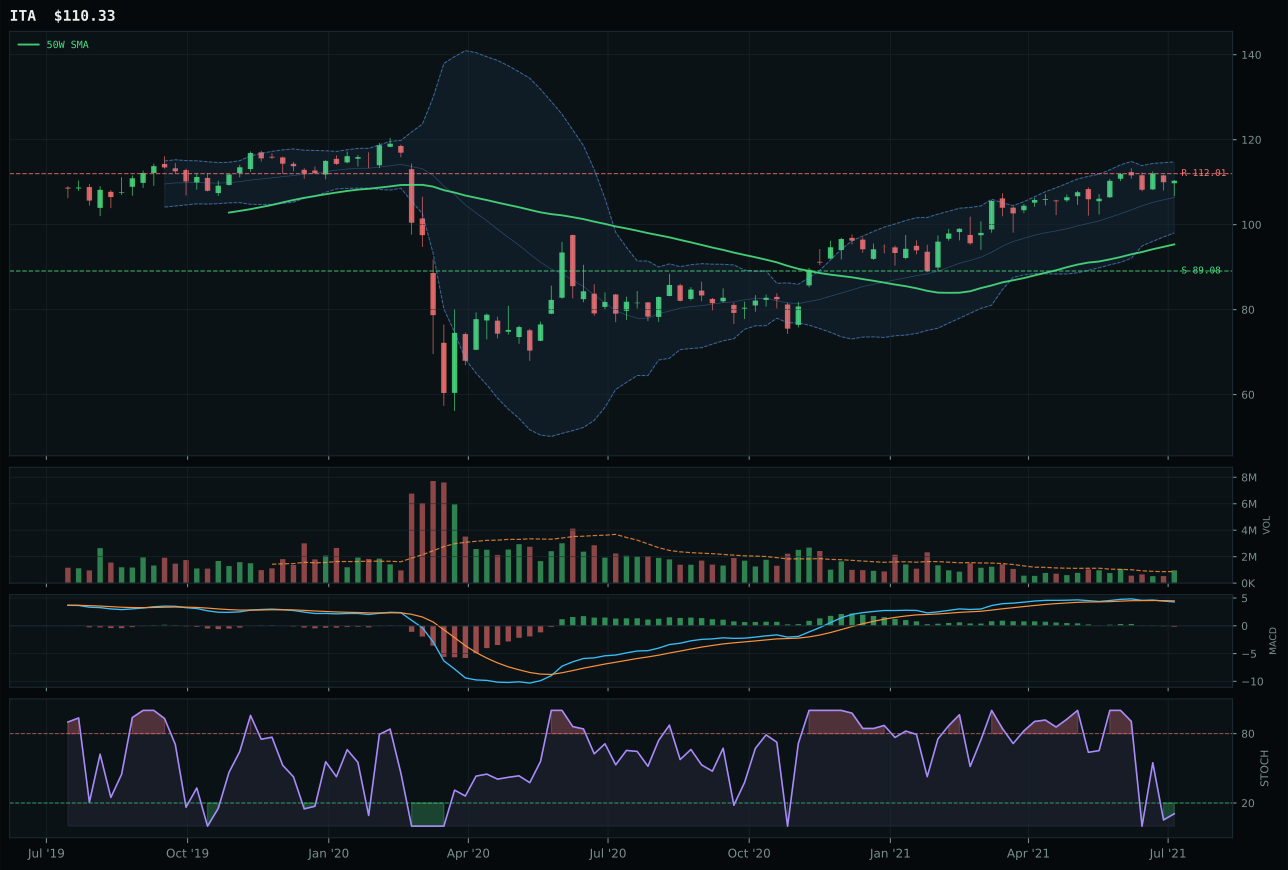
ITA has a vertical extension profile with -1.5% 13-week relative strength versus SPY.
A failed hold above support would weaken the setup.
Actionable but governed by invalidation levels.
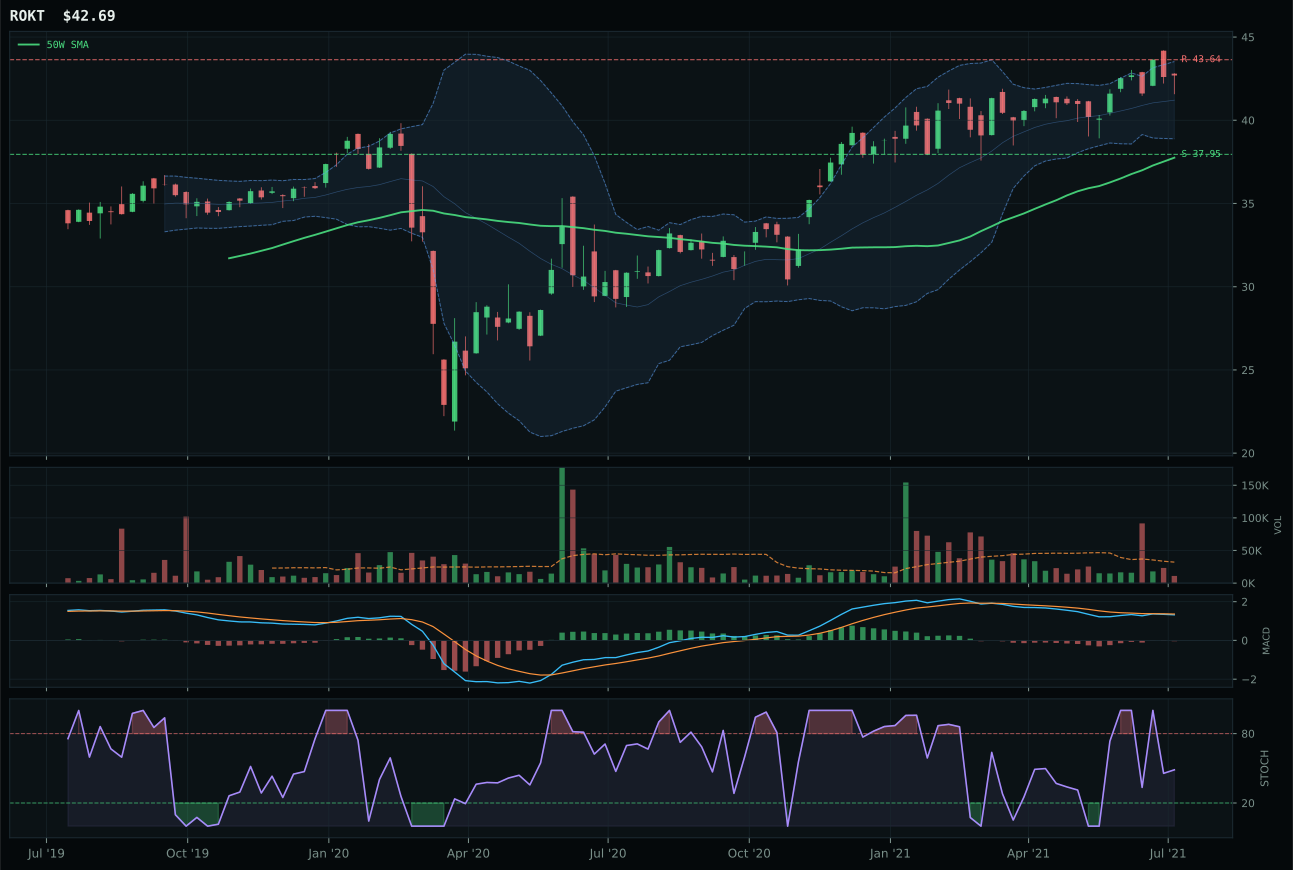
ROKT has a neutral structure profile with -2.4% 13-week relative strength versus SPY.
A failed hold above support would weaken the setup.
Tracked, but not top-2 eligible because: .
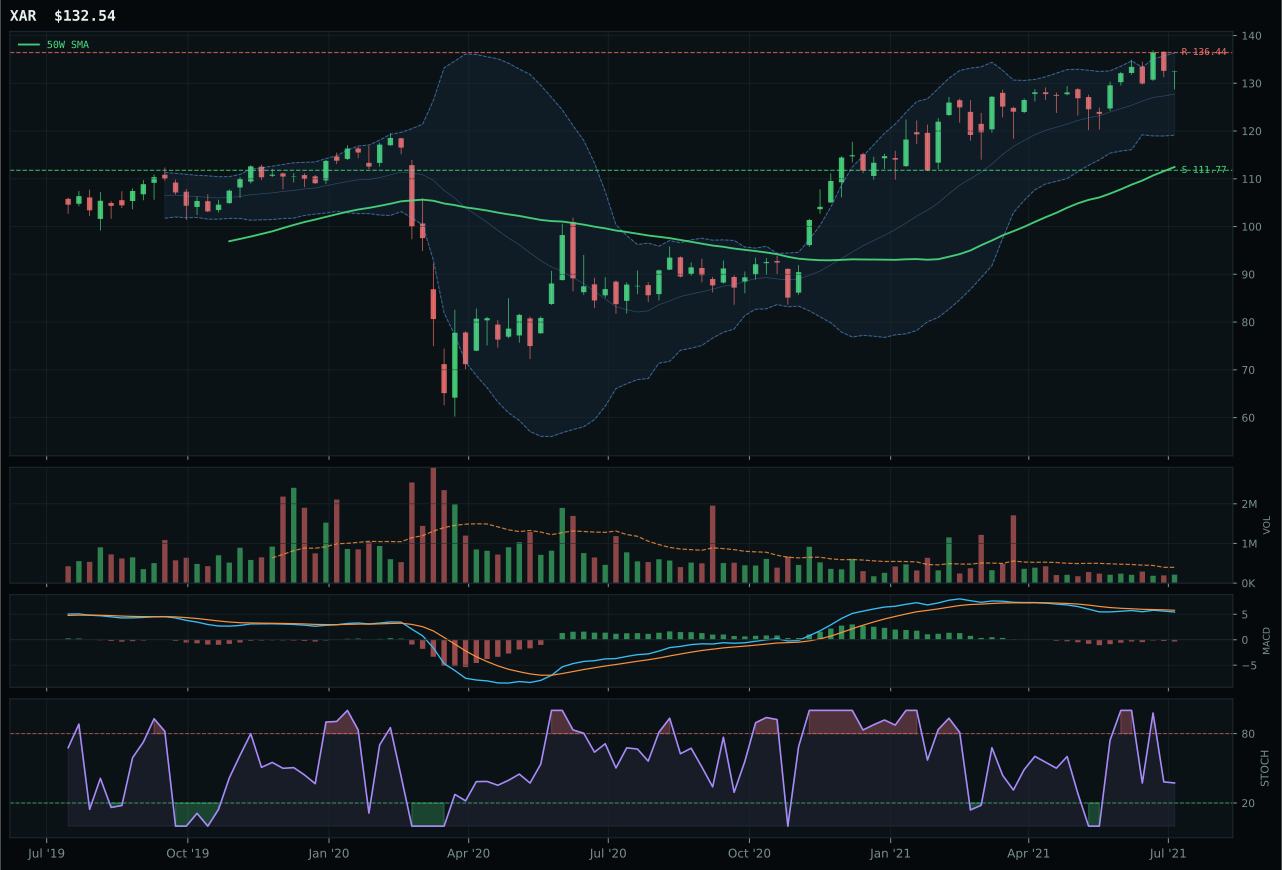
XAR has a vertical extension profile with -2.4% 13-week relative strength versus SPY.
A failed hold above support would weaken the setup.
Actionable but governed by invalidation levels.
ITA prevailed in Defense & Aerospace by marrying above-average volume participation (1.11x the twenty-day average) to a stochastic RSI that flipped oversold and began turning upward—a rare reversal signal in a market otherwise saturated with exhaustion. The chart sits 15.7% above the 50W with a modest trend score of 79.7/100, but the decisive edge lay in volume sponsorship and the stochastic turn-up at 0.11, which reads as early accumulation rather than distribution pressure. ROKT's neutral structure and rising-midzone stochastic (0.60) felt safer on paper, but the lack of volume conviction (thin participation) and the weaker category-relative strength (-0.1% vs. 0.8%) made it a follower rather than a leader. ITA's MACD is admittedly bearish and weakening—not a clean bullish picture—yet the gap of 14.5 points reflects how much technical damage ROKT had accumulated relative to its peer.
Defense & Aerospace earned 5% as a tier-2 category, holding its allocation slot despite a final score of only 40.0, the lowest among allocated categories this week. The reasoning was pragmatic: ITA's above-average volume and oversold-turn-up timing (54.0/100) suggest potential for a mean-reversion bounce, and the Transition / Mixed regime offered mild support (+3 macro points) given credit-stress ambiguity. However, the category's macro fit of 55.0/100 remains uninspiring, and the technical evidence of 41.2/100 (ITA's burden) reflects a setup where downside risk to support is 23.9%—a significant test should momentum falter. What would elevate Defense to top-2 is sustained volume-price confirmation and either a flip into bullish MACD or a sustained rally that rebuilds relative strength. Currently, the 5% represents a small hedge to any geopolitical bid; it is not a conviction position and should be the first casualty if the portfolio needs to reallocate capital into stronger setups.
Agriculture & Livestock — MOO
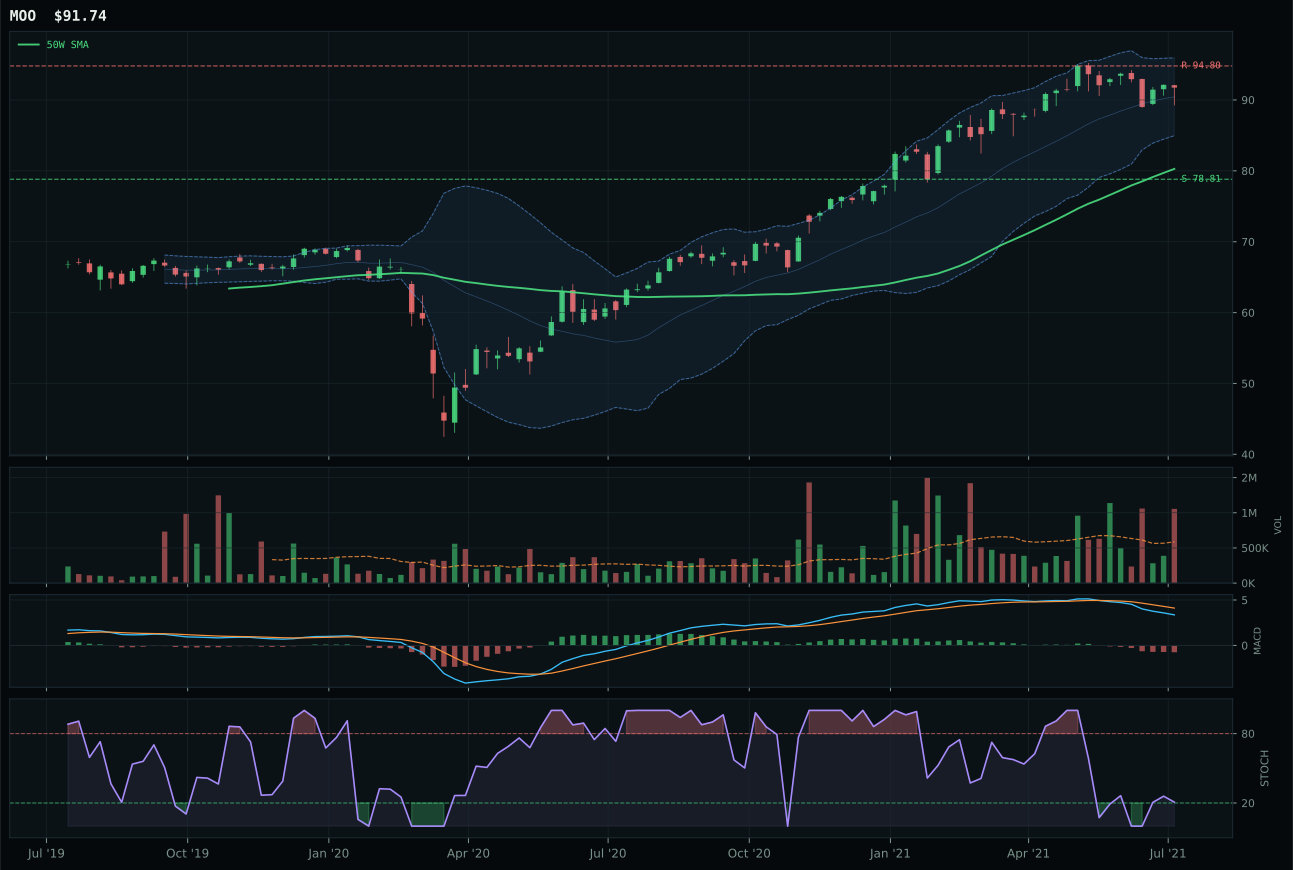
MOO has a neutral structure profile with -2.3% 13-week relative strength versus SPY.
A failed hold above support would weaken the setup.
Actionable but governed by invalidation levels.
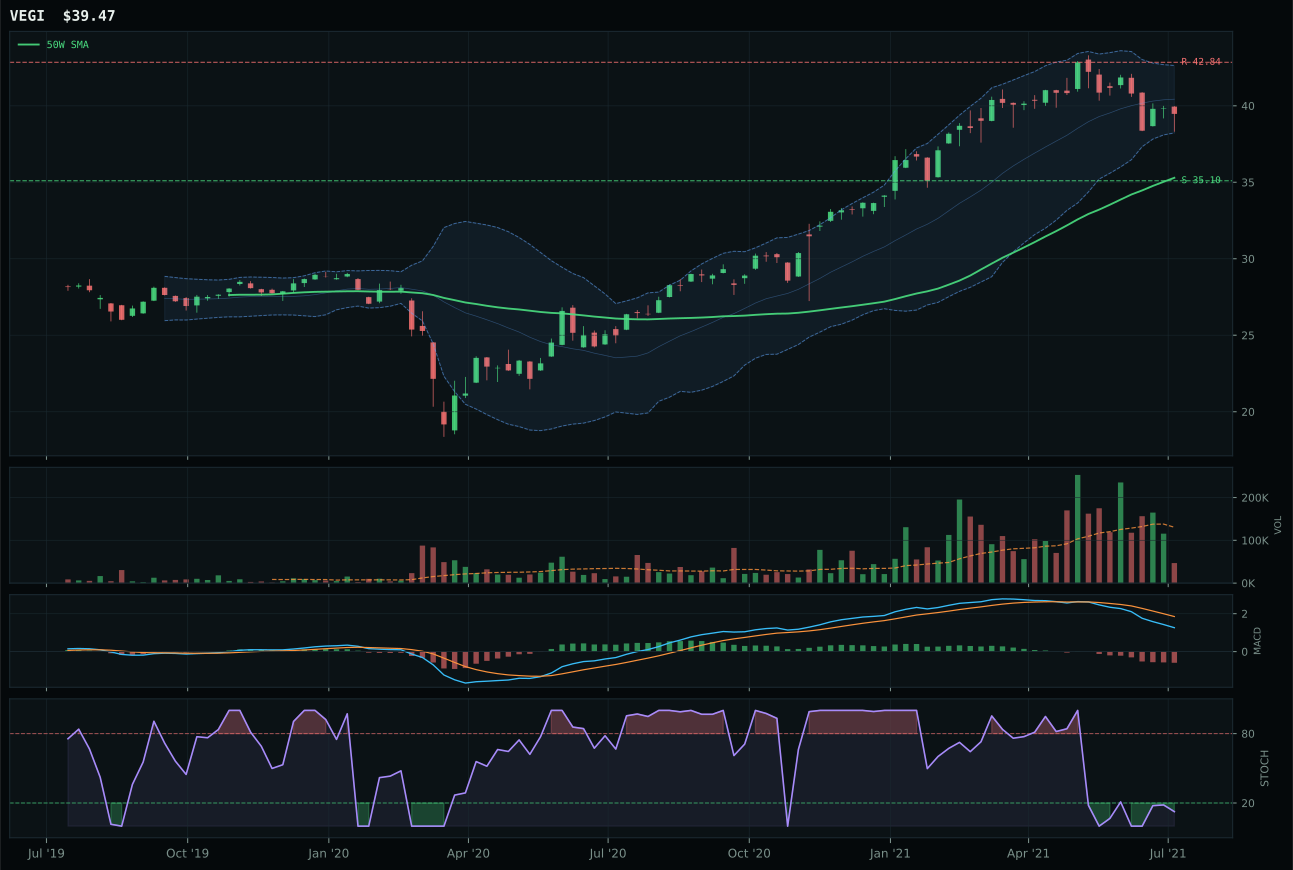
VEGI has a neutral structure profile with -8.0% 13-week relative strength versus SPY.
A failed hold above support would weaken the setup.
Tracked, but not top-2 eligible because: .
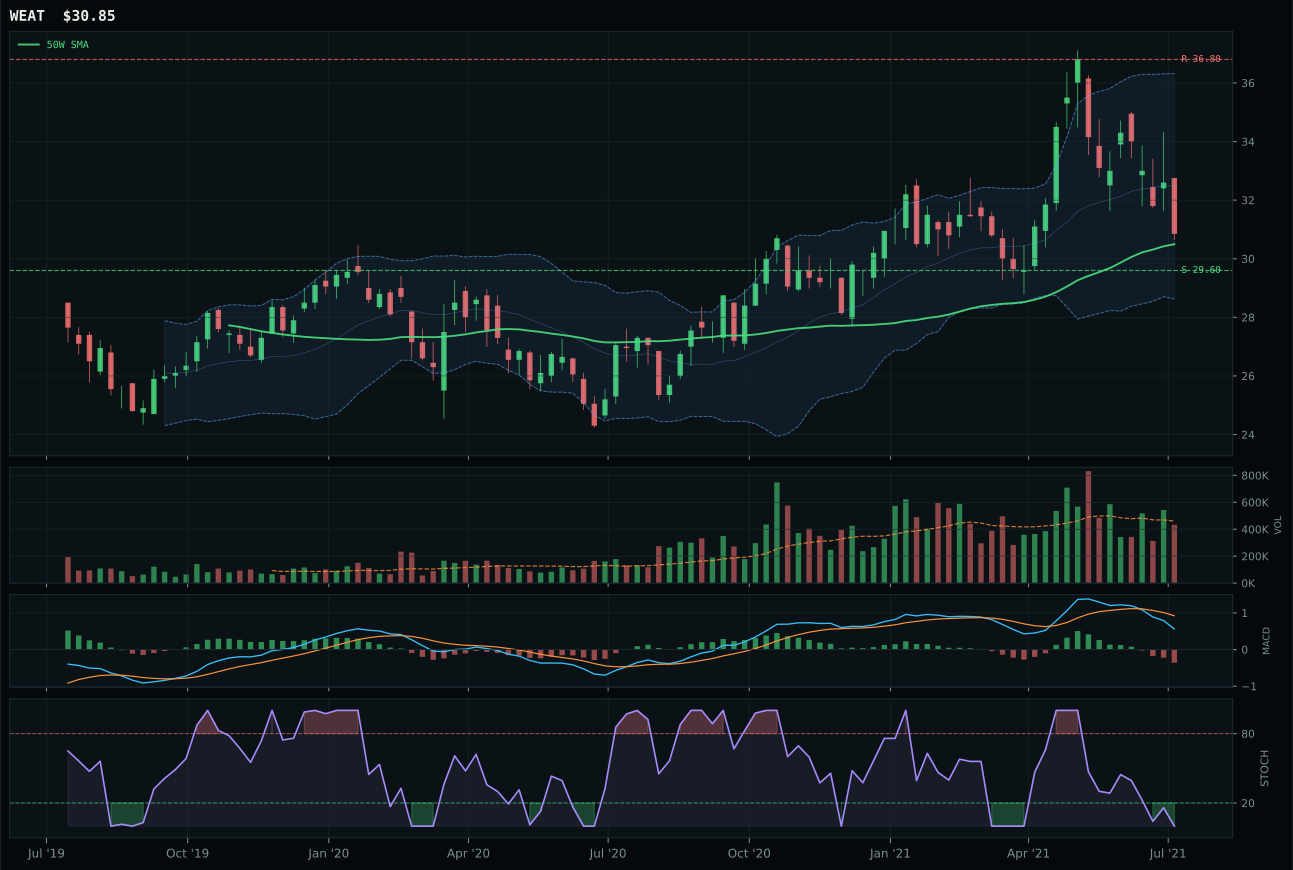
WEAT has a pullback into support profile with -6.6% 13-week relative strength versus SPY.
A failed hold above support would weaken the setup.
Actionable but governed by invalidation levels.
MOO claimed the Agriculture category win, but the phrase 'clear category decision' masks a deeper malaise: MOO beat VEGI by just 20.2 points, and both names showed severe technical deterioration. MOO's structure is neutral (not vertical extension), volume trades at 1.80x the twenty-day average—distribution pressure, not accumulation—and the MACD is bearish and weakening with a stochastic RSI stuck in the rising-midzone at 0.21. The thirteen-week return of 3.5% and category-relative strength of 4.3% are the only bright spots; everything else screams caution. VEGI's oversold stochastic and pullback setup offered a timing advantage, yet its 13W return of negative 2.1% and -8.0% RS versus SPY made it unsalvageable even before accounting for structure weakness (67.7 vs. 72.9).
Agriculture & Livestock earned 0% allocation, excluded entirely from the portfolio this week and ranking as either ninth or tenth among the ten categories. The final score of 31.1 is the lowest among all eligible names, driven by technical evidence that collapsed to 18.3/100 for the representative—a near-total technical failure despite a 55.0% macro fit score from active real-asset sponsorship and commodity-breadth tailwinds. The distribution pressure at 1.80x volume, the bearish MACD, and the momentum confirmation score of just 27.5/100 reveal that macro support is not enough to justify capital allocation when the chart is actively rolling over. For Agriculture to earn even a 5% slot, the category score would need to reach 40+ points minimum, which requires either a sharp reversal in volume participation (from distribution to accumulation), a flip in MACD to bullish, or a meaningful rally in the thirteen-week return. Until one of these conditions materializes, this category remains in the penalty box.
Nuclear Energy — URA
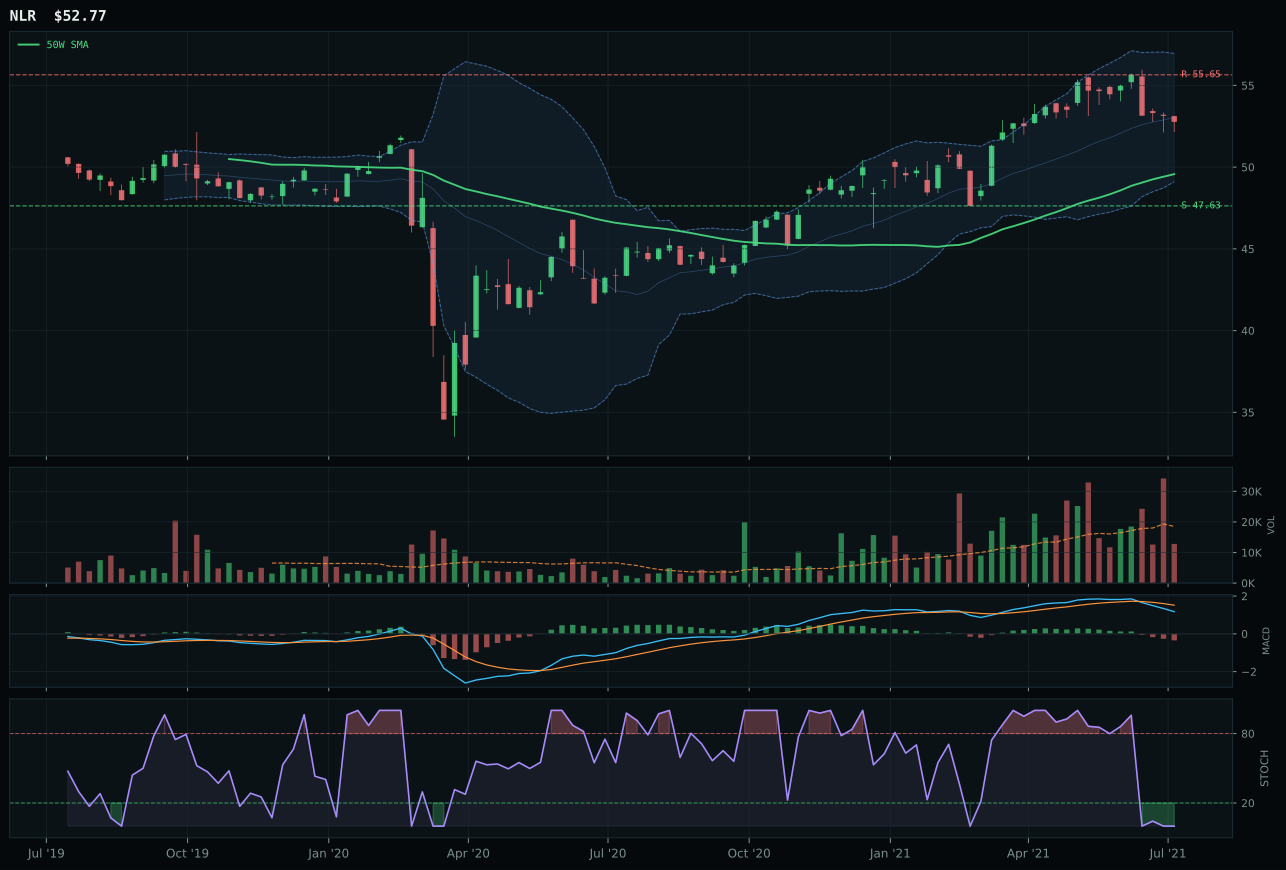
NLR has a neutral structure profile with -6.7% 13-week relative strength versus SPY.
A failed hold above support would weaken the setup.
Tracked, but not top-2 eligible because: .
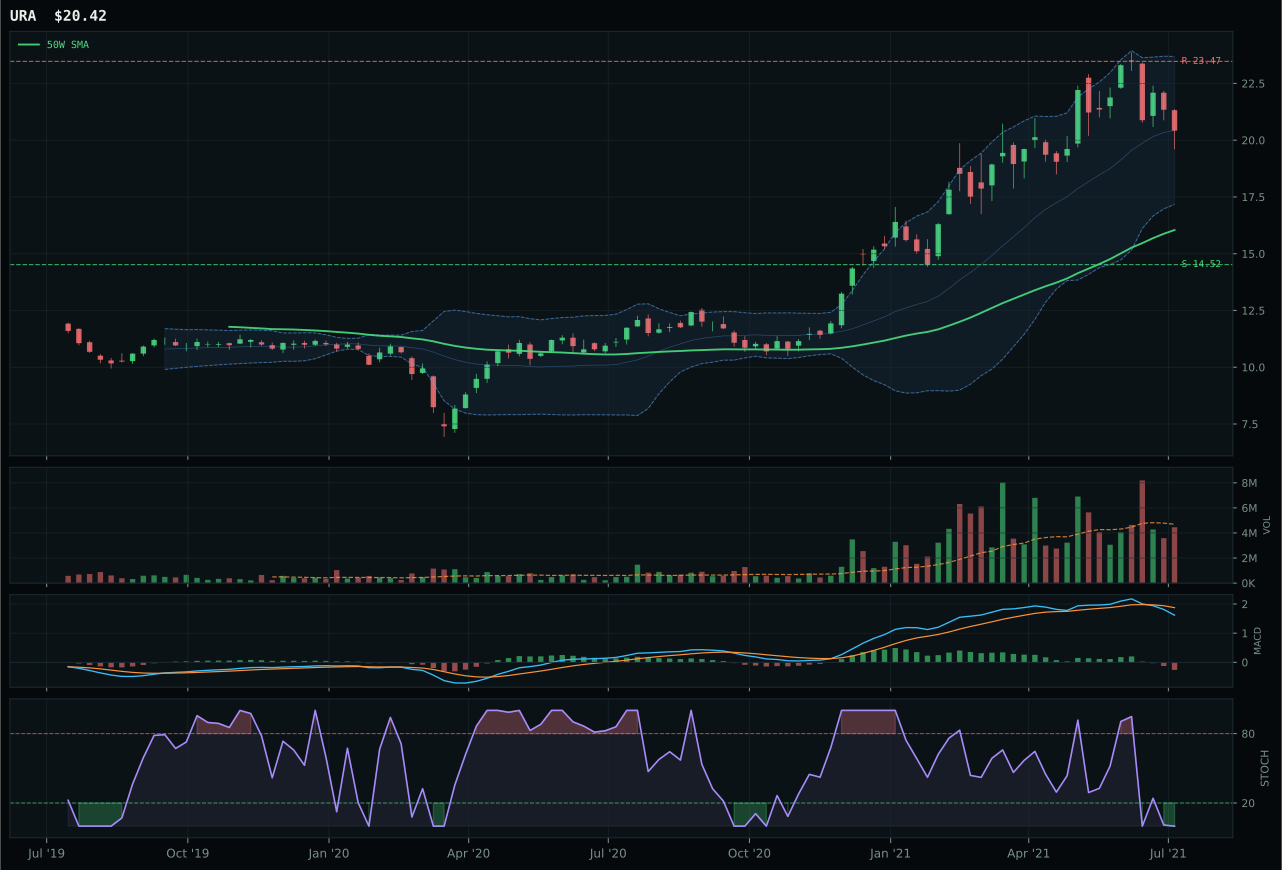
URA has a vertical extension profile with -4.4% 13-week relative strength versus SPY.
A failed hold above support would weaken the setup.
Actionable but governed by invalidation levels.
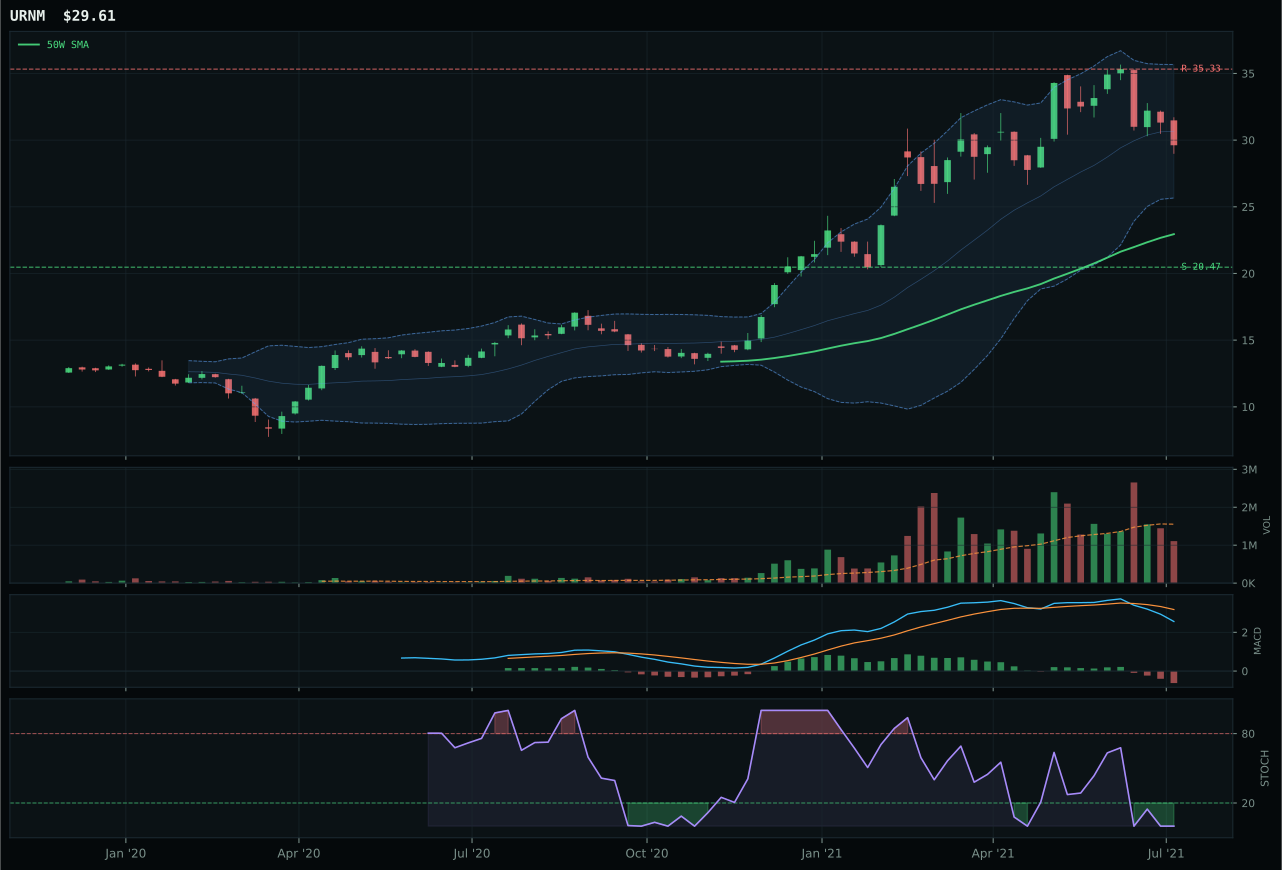
URNM has a vertical extension profile with -9.1% 13-week relative strength versus SPY.
A failed hold above support would weaken the setup.
Actionable but governed by invalidation levels.
URA won the Nuclear category despite a four-week return of negative 13.0% and a thirteen-week return that limped in at 1.4%—a stark reminder that even within a category, 'winning' does not mean winning in any absolute sense. The price sits 27.3% above the 50W with neutral volume participation and a stochastic RSI flatlined at oversold (0.00), a timing setup that could bounce but offers no conviction of an imminent reversal. URA beat NLR (runner-up) on structure cleanliness (70.0 vs. 69.1) and neutral volume versus thin participation, along with category-relative strength of 2.3% versus NLR's flat 0.0%. The margin was just 13.8 points, a near tie between two weak setups.
Nuclear Energy received 0% allocation, excluded from the portfolio entirely as either the ninth or tenth ranked category. The final score of 28.9 is the second-lowest among all categories (only Agriculture's 31.1 is lower), and the technical evidence of 18.6/100 for URA reveals near-total technical failure despite a 61.0% macro fit buoyed by energy scarcity (+9) and real-asset sponsorship (+7). The momentum confirmation score of just 9.9/100—driven by that negative 13.0% four-week return—is disqualifying; the category has suffered recent momentum degradation that macro support cannot overcome. For Nuclear to earn even a 5% slot, URA's thirteen-week return would need to accelerate well above 1.4%, the stochastic RSI would need to genuinely turn upward from oversold, and the four-week damage would need to heal. Until those conditions emerge, this category remains on the sidelines despite its long-term structural appeal in a low-carbon transition scenario.