
2021-07-02
Informational purposes only. The content in this report, including allocations, analysis, and commentary, is provided solely for informational and educational purposes. It does not constitute financial advice, investment advice, trading advice, or any other type of advice. Past performance does not guarantee future results. Always conduct your own research and consult a qualified financial professional before making investment decisions.
Weekly Allocation
| Ticker | Category | Weight | Role |
|---|---|---|---|
| FSOL | 50% | Overlay | |
| FCG | Traditional Energy | 10% | Top-2 (10%) |
| IGV | Technology | 10% | Top-2 (10%) |
| COPX | Industrial Metals | 5% | Tier-2 (5%) |
| INDA | Emerging Markets | 5% | Tier-2 (5%) |
| SLV | Precious Metals | 5% | Tier-2 (5%) |
| XLU | Utilities & Infrastructure | 5% | Tier-2 (5%) |
| XAR | Defense & Aerospace | 5% | Tier-2 (5%) |
| MOO | Agriculture & Livestock | 5% | Tier-2 (5%) |
Trade Instructions — Monday Open
Sell the tranche from 2021-06-04 (completing its 4-week hold). Buy the new tranche. Instructions show net portfolio changes — same-asset positions cancel, weight changes show the delta.
| Action | Ticker | Instruction |
|---|---|---|
| SELL | FBTC | Sell entire FBTC position (12.50% of portfolio) |
| SELL | GLD | Sell 50% of GLD position (reduce 5.00% → 2.50%) |
| SELL | ILF | Sell 33% of ILF position (reduce 3.75% → 2.50%) |
| SELL | URA | Sell 50% of URA position (reduce 2.50% → 1.25%) |
| SELL | SMH | Sell 33% of SMH position (reduce 3.75% → 2.50%) |
| SELL | ITA | Sell entire ITA position (1.25% of portfolio) |
| BUY | FSOL | Buy FSOL — 62.50% of freed cash (adds 12.50% to portfolio) |
| BUY | INDA | Buy INDA — 6.25% of freed cash (adds 1.25% to portfolio) |
| BUY | XAR | Buy XAR — 6.25% of freed cash (adds 1.25% to portfolio) |
| BUY | FCG | Buy FCG — 12.50% of freed cash (adds 2.50% to portfolio) |
| BUY | SLV | Buy SLV — 6.25% of freed cash (adds 1.25% to portfolio) |
| BUY | MOO | Buy MOO — 6.25% of freed cash (adds 1.25% to portfolio) |
Current Portfolio After Trade
Combined holdings across all 4 active tranches. Each tranche is 25% of the portfolio.
| Ticker | % of Portfolio | Weight Bar |
|---|---|---|
| FSOL | 50.00% | |
| FCG | 7.50% | |
| IGV | 7.50% | |
| XLU | 5.00% | |
| INDA | 5.00% | |
| XAR | 5.00% | |
| REMX | 3.75% | |
| ILF | 2.50% | |
| SMH | 2.50% | |
| GLD | 2.50% | |
| SLV | 2.50% | |
| MOO | 2.50% | |
| URA | 1.25% | |
| WEAT | 1.25% | |
| COPX | 1.25% |
Macro Regime — Transition / Mixed
Macro Evidence Charts
Market-implied signals behind the macro regime scores. Each ratio compares two assets; the direction and slope of the ratio is what the macro engine reads.
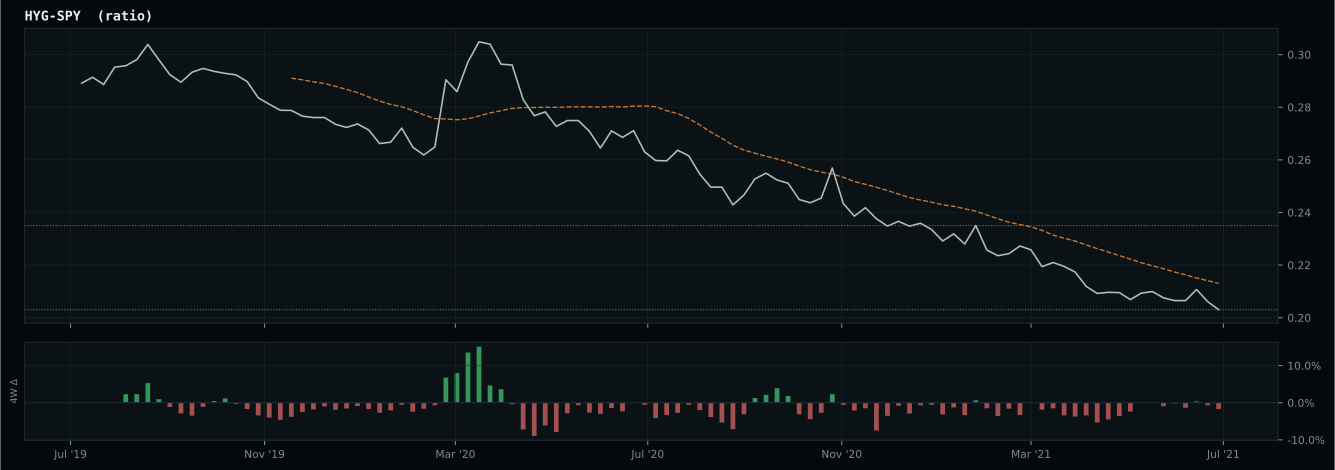
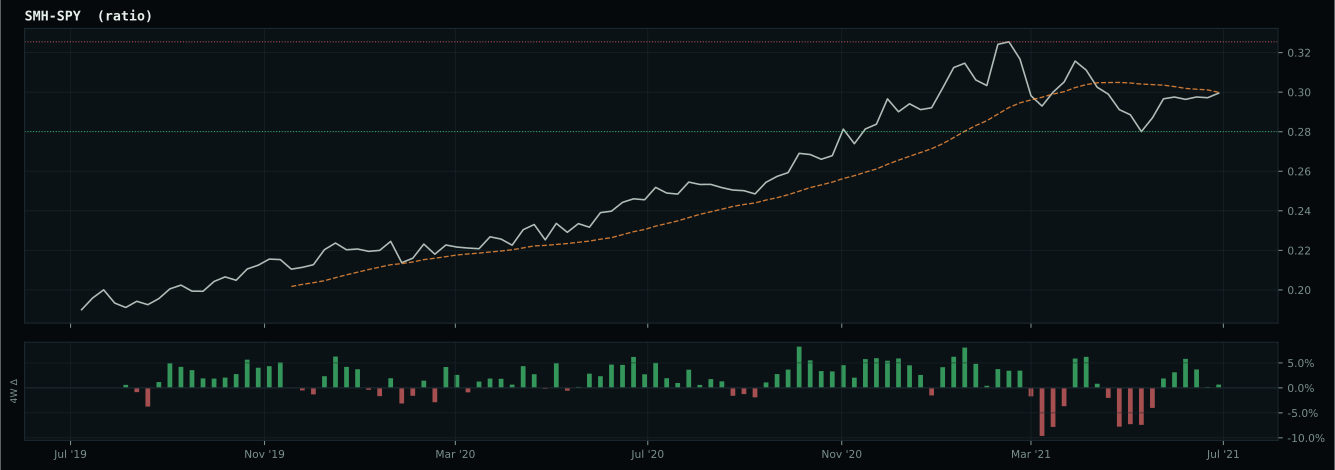
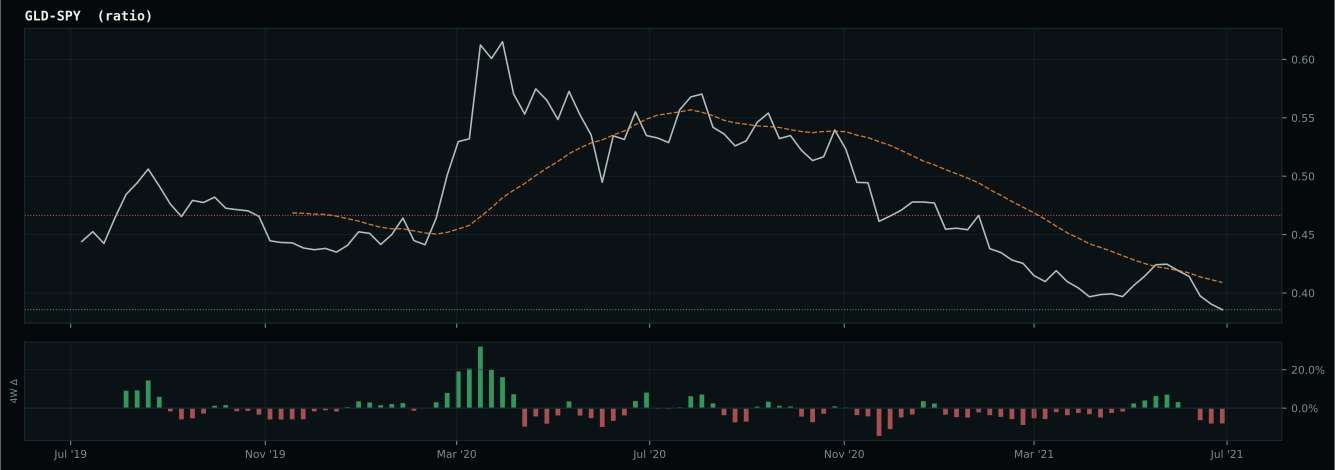
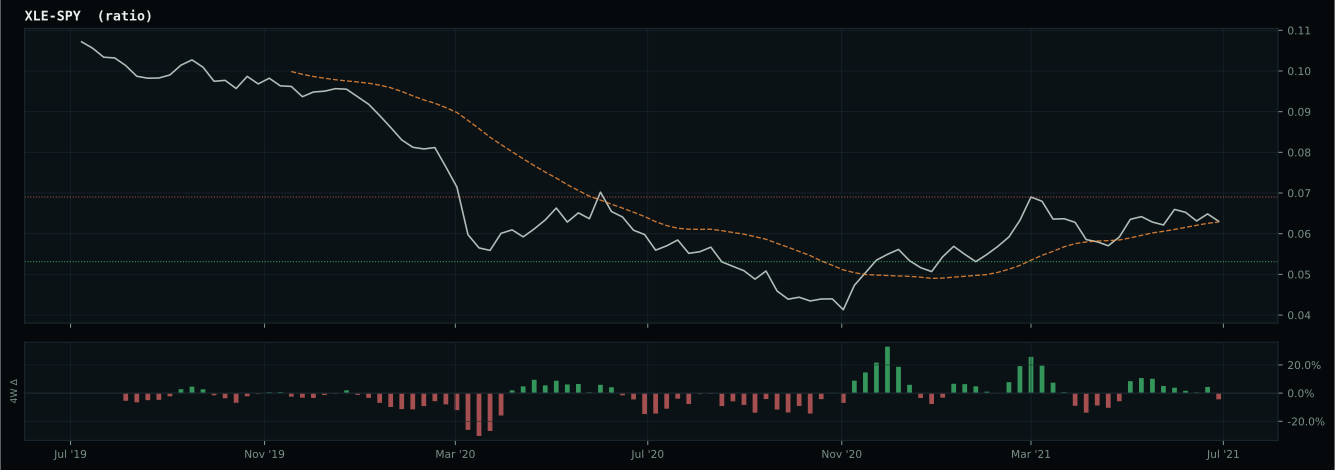
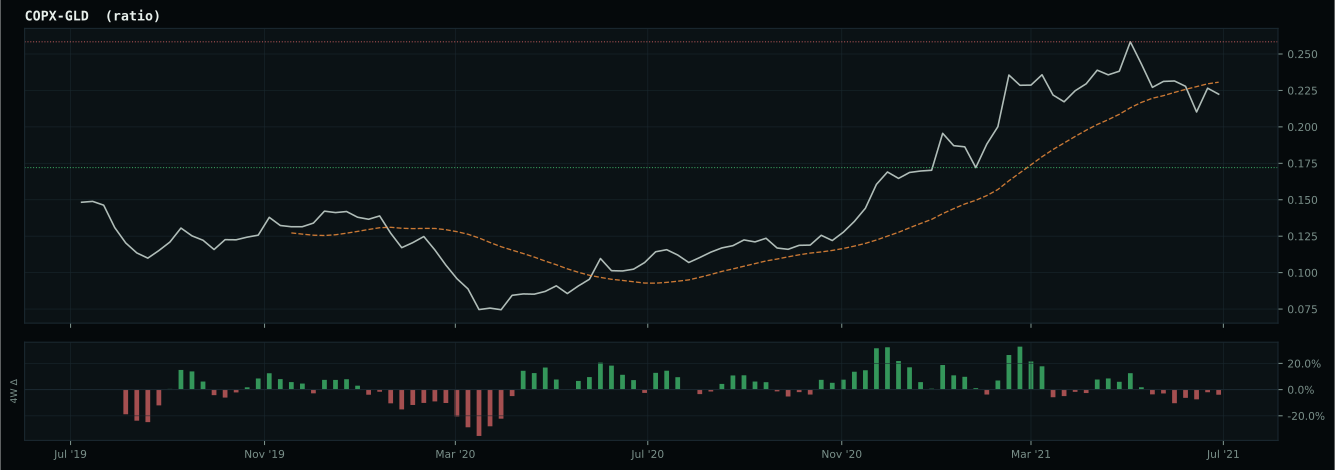
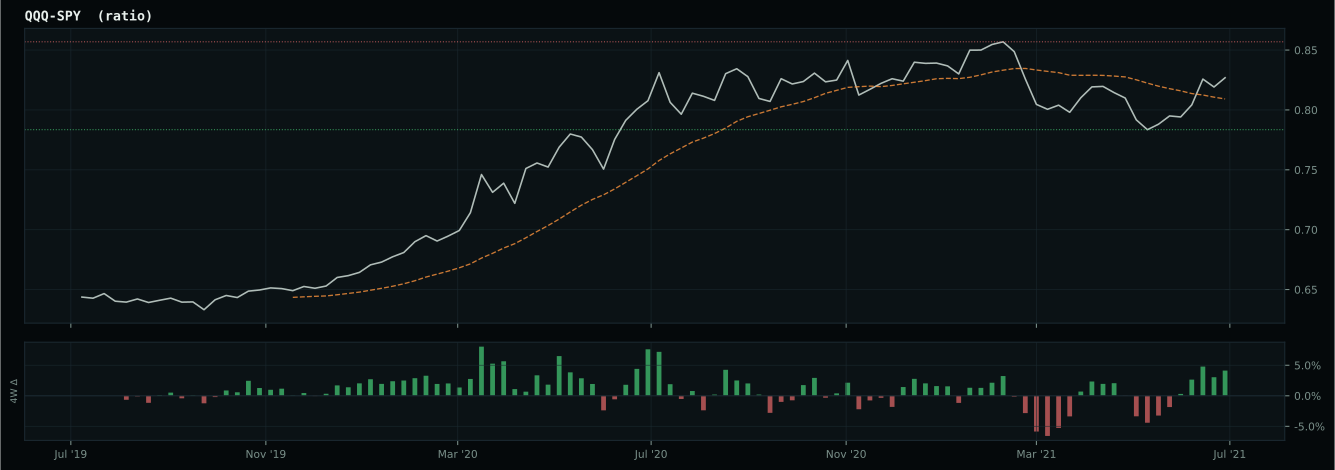
Crypto Regime — AltSeason
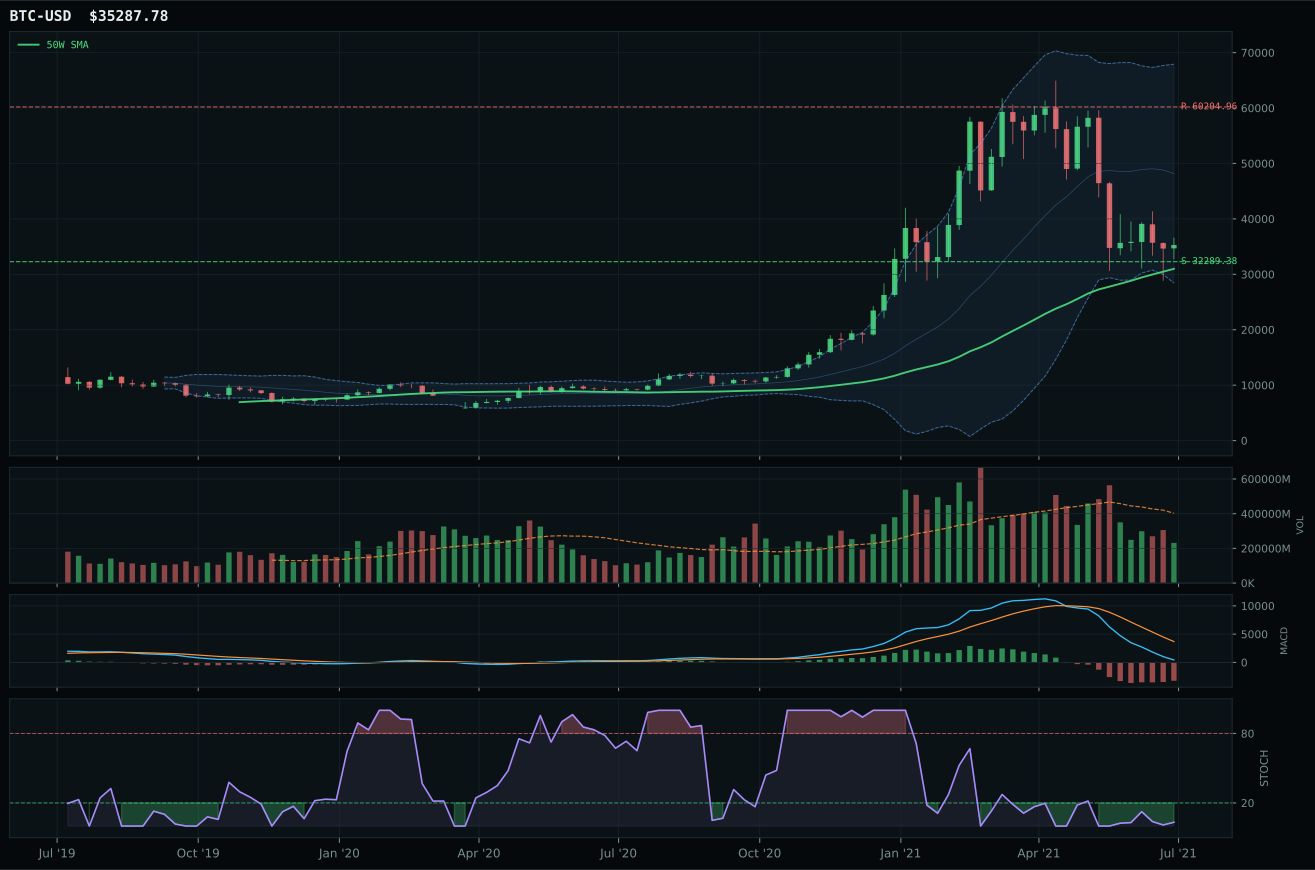
ValueBTC not armed: BTC has not made the first post-breakdown touch of the 200W buy zone after losing the 50W
TrendBTC confirmed: 2 consecutive closes above rising/flat 50W SMA
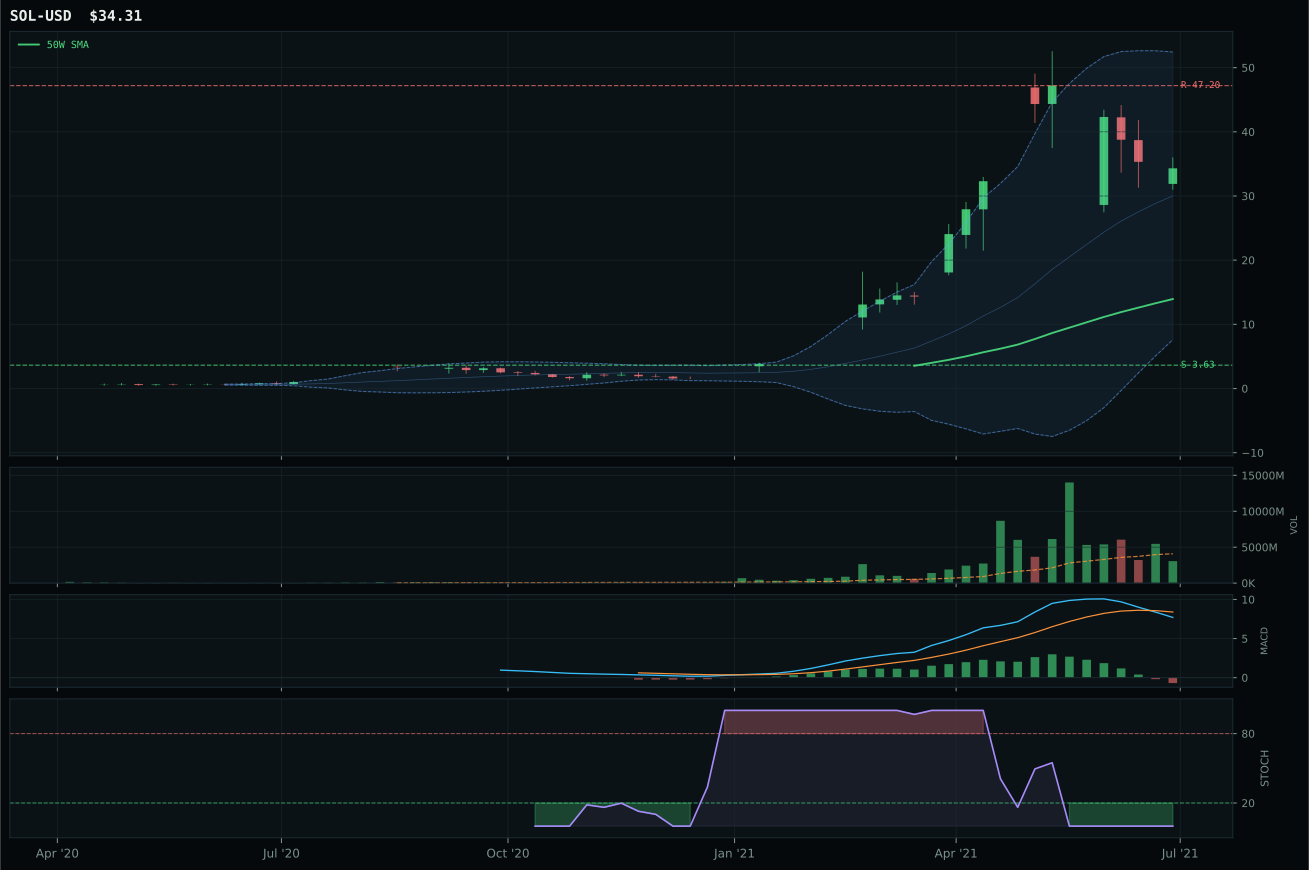
all available AltSeason conditions pass; missing optional confirmations skipped
Category Rankings
| Rank | Category | Winner | Score | Alloc | 4W Ret | Peers (4W) |
|---|---|---|---|---|---|---|
| 1 | Traditional Energy | FCG | 60.5 | 20% | -14.67% | XOP -14.7% · XLE -9.3% |
| 2 | Technology | IGV | 51.0 | 20% | +2.59% | CIBR +4.3% · XLK +2.6% |
| 3 | Industrial Metals | COPX | 47.4 | 10% | +3.26% | PICK +5.1% · REMX +26.5% |
| 4 | Emerging Markets | INDA | 47.0 | 10% | +1.63% | ILF -1.6% · IEMG -3.4% |
| 5 | Precious Metals | SLV | 46.1 | 10% | -4.79% | GLD +0.0% · GDX -0.3% |
| 6 | Utilities & Infrastructure | XLU | 44.8 | 10% | +3.30% | PAVE +3.3% · IGF -1.0% |
| 7 | Defense & Aerospace | XAR | 44.2 | 10% | -3.38% | ROKT -2.9% · ITA -1.3% |
| 8 | Agriculture & Livestock | MOO | 41.1 | 10% | +0.29% | WEAT +7.3% · VEGI -1.5% |
| 9 | Nuclear Energy | URA | 33.0 | 0% | -5.21% | NLR -1.7% · URNM -4.7% |
| 10 | AI | SMH | 32.4 | 0% | +1.70% | BOTZ -1.9% · AIQ -0.4% |
Traditional Energy — FCG
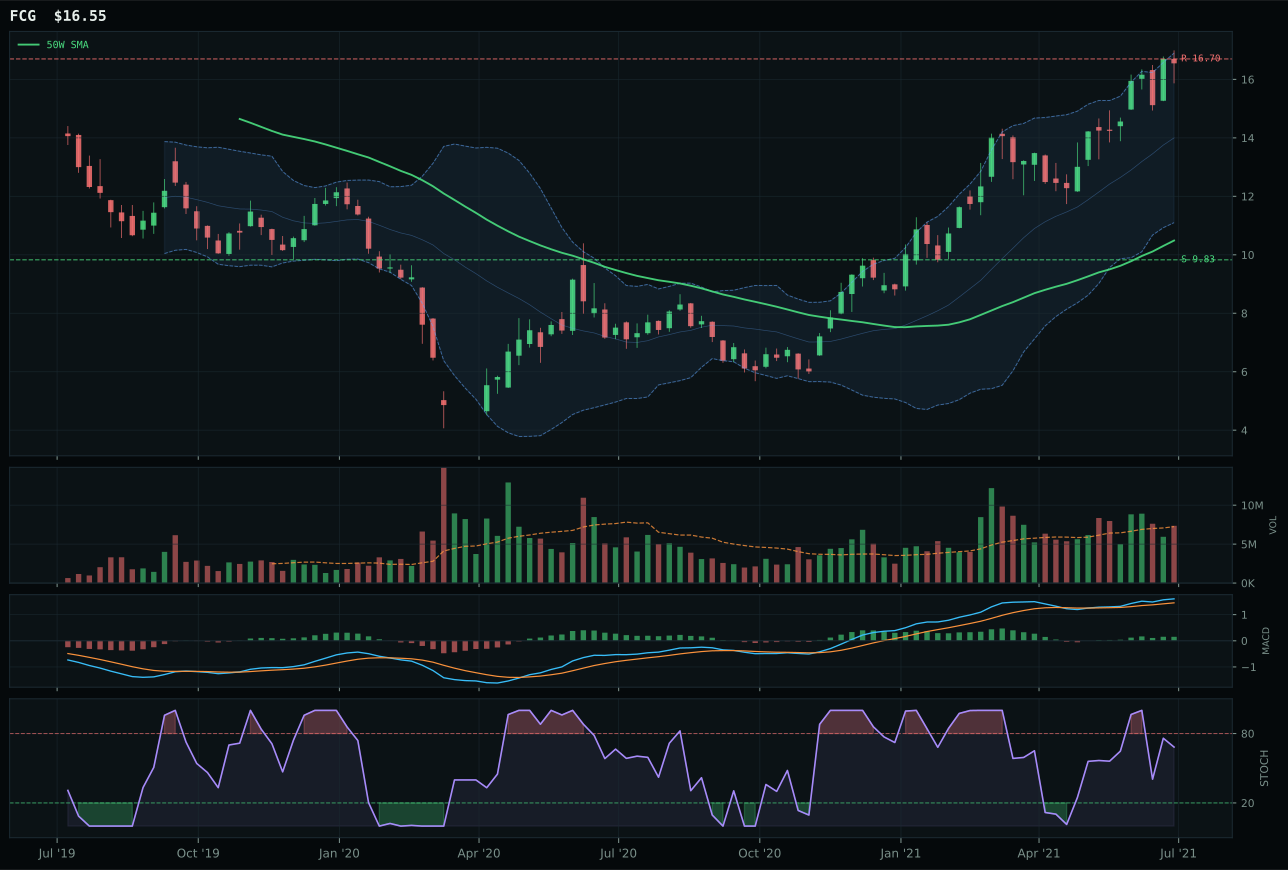
FCG has a vertical extension profile with 14.5% 13-week relative strength versus SPY.
A failed hold above support would weaken the setup.
Actionable but governed by invalidation levels.
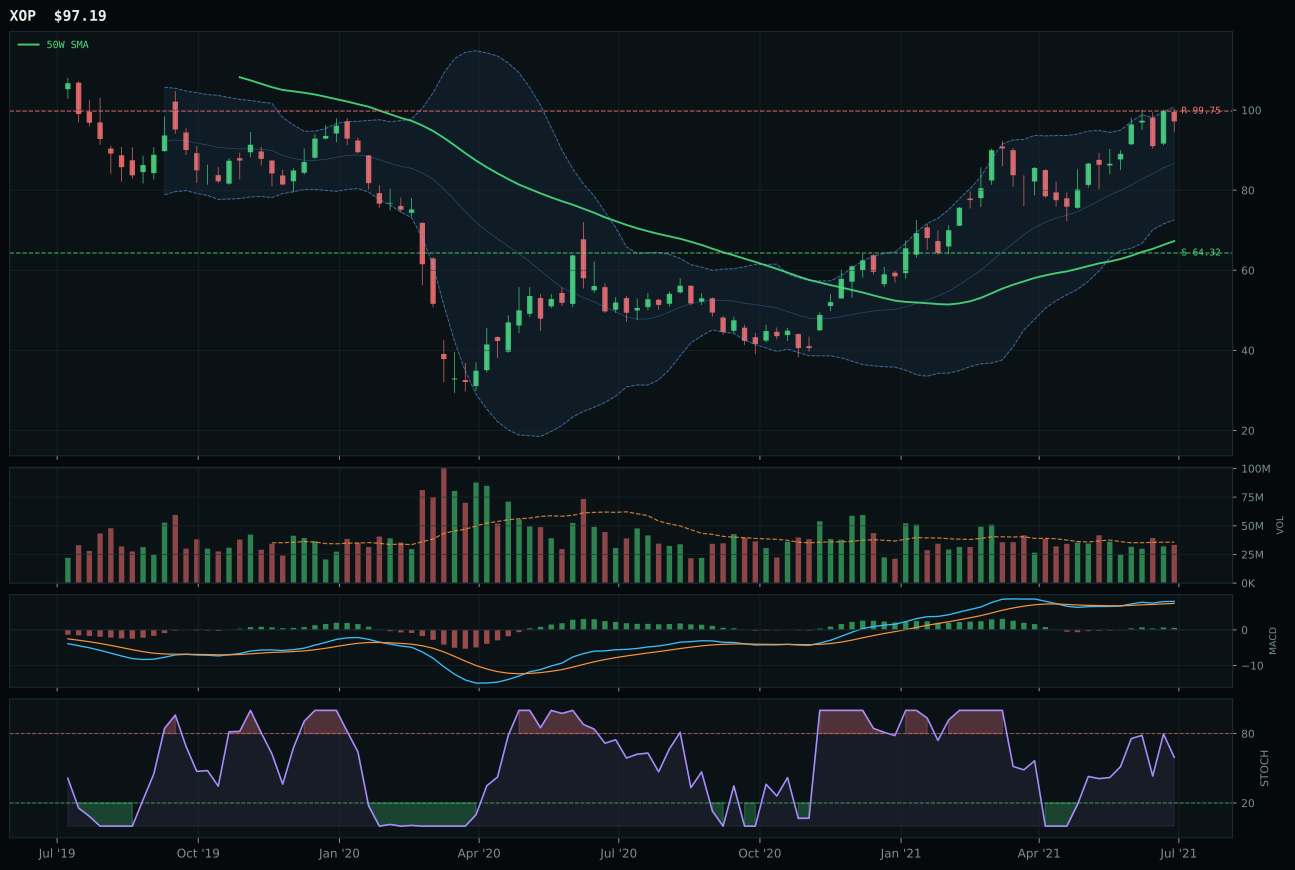
XOP has a vertical extension profile with 5.3% 13-week relative strength versus SPY.
A failed hold above support would weaken the setup.
Actionable but governed by invalidation levels.
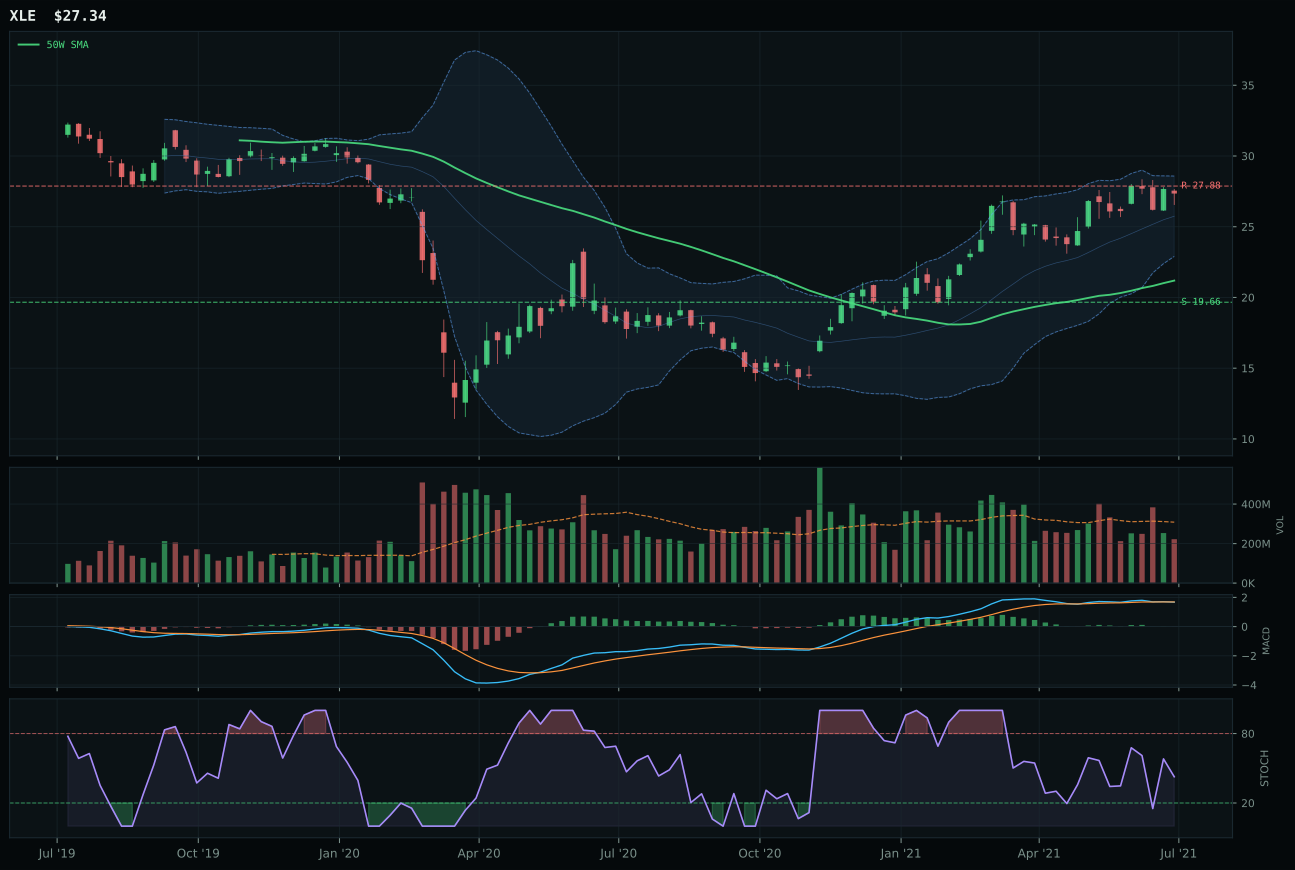
XLE has a vertical extension profile with 0.4% 13-week relative strength versus SPY.
A failed hold above support would weaken the setup.
Actionable but governed by invalidation levels.
FCG dominates Traditional Energy with perfect trend (100/100) and perfect momentum confirmation (100/100), backed by 14.5% relative strength versus SPY and 9.2% category-relative strength—metrics that confirm genuine institutional buying and not mere sentiment. The 57.8% extension above the 50-week moving average is extreme, yet the 13-week return of 22.8% and 26-week return of 87.6% justify the premium by delivering absolute returns that dwarf entry risk. Volume is neutral at 1.01x the 20-week average, neither confirming accumulation nor showing distribution, but the MACD is bullish and improving, and stochastic RSI at 0.68 falling/neutral suggests the move still has room before rolling over. XOP, the runner-up, has a respectable 88/100 trend score and 13-week return of 13.6%, yet lacks the category-relative sponsorship (0.0% vs 9.2%) that FCG commands, and the structure cleanliness is marginally worse (70.4 vs 70.7).
Traditional Energy earns 10% allocation as a top-2 overweight, reflecting its exceptional category score of 60.5 and macro alignment with an energy-scarcity regime (+16 macro support). FCG's technical evidence of 73.0/100 combined with perfect momentum confirmation makes this the highest-conviction allocation in the portfolio outside Technology. The position is extended at 57.8% above the 50-week moving average, but the 22.8% 13-week return and neutral volume participation signal that the move is sustainable rather than exhausted; new buyers are entering, not chasing a rollover. Risk/reward is poor (0.0% upside room to resistance, 68.4% downside to support), yet the category's macro fit of 66.0/100 justifies accepting extended entry for macro exposure to energy scarcity and real-asset sponsorship. This is a top-2 allocation because the portfolio needs commodity/energy alpha in a transition regime, and FCG is delivering both technical and macro confirmation. However, the extreme extension and poor risk/reward mean this position is vulnerable to any disruption in demand narrative or credit stress acceleration.
Technology — IGV
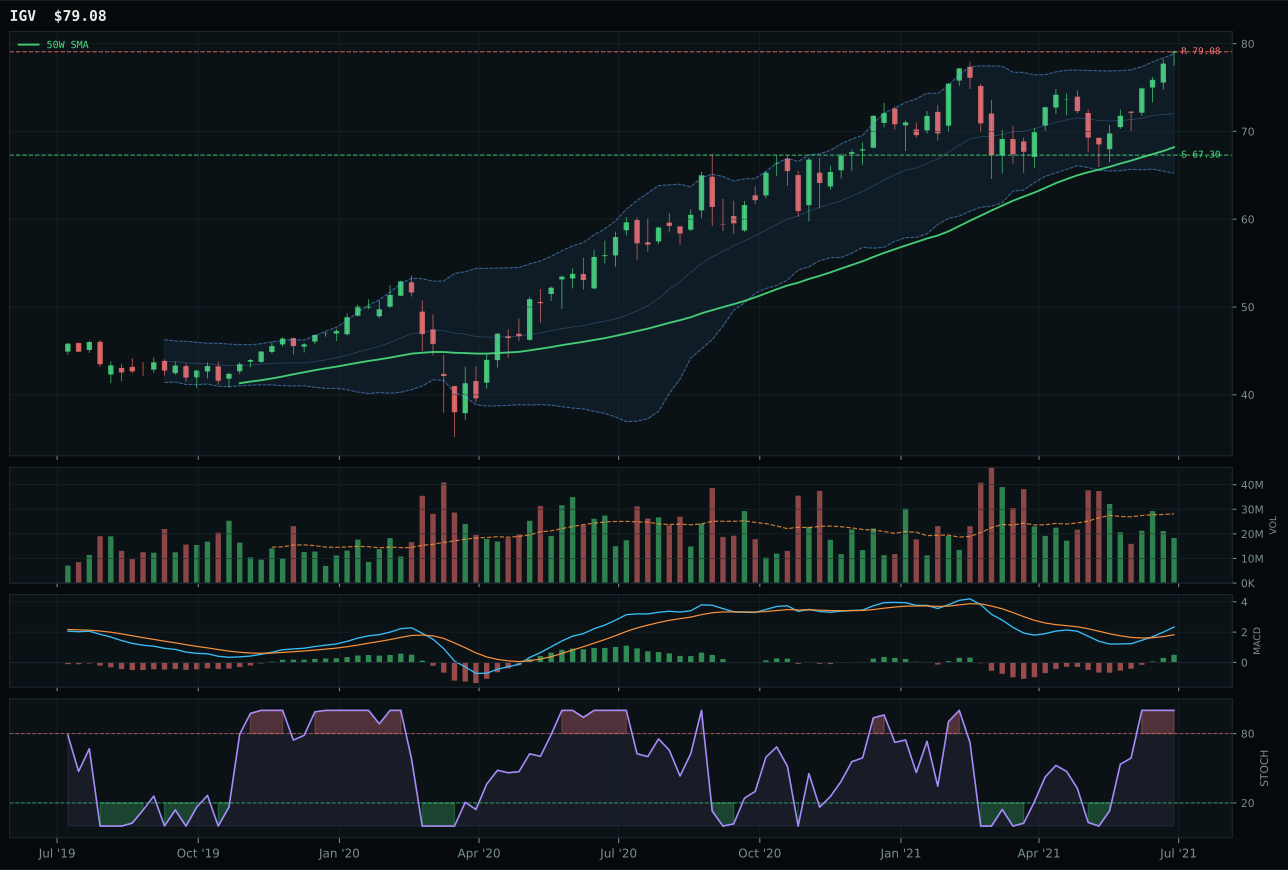
IGV has a vertical extension profile with 4.8% 13-week relative strength versus SPY.
A failed hold above support would weaken the setup.
Actionable but governed by invalidation levels.
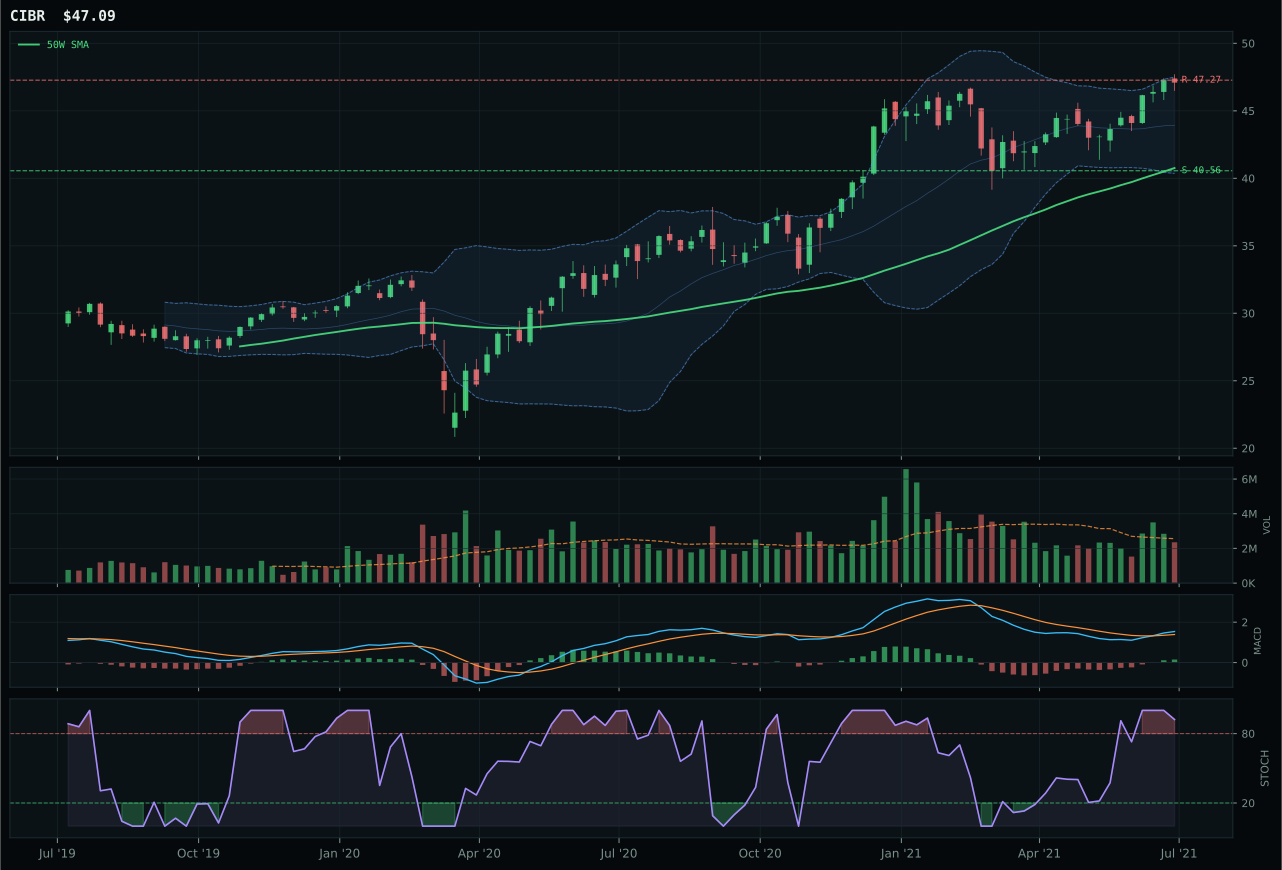
CIBR has a vertical extension profile with 2.8% 13-week relative strength versus SPY.
A failed hold above support would weaken the setup.
Actionable but governed by invalidation levels.
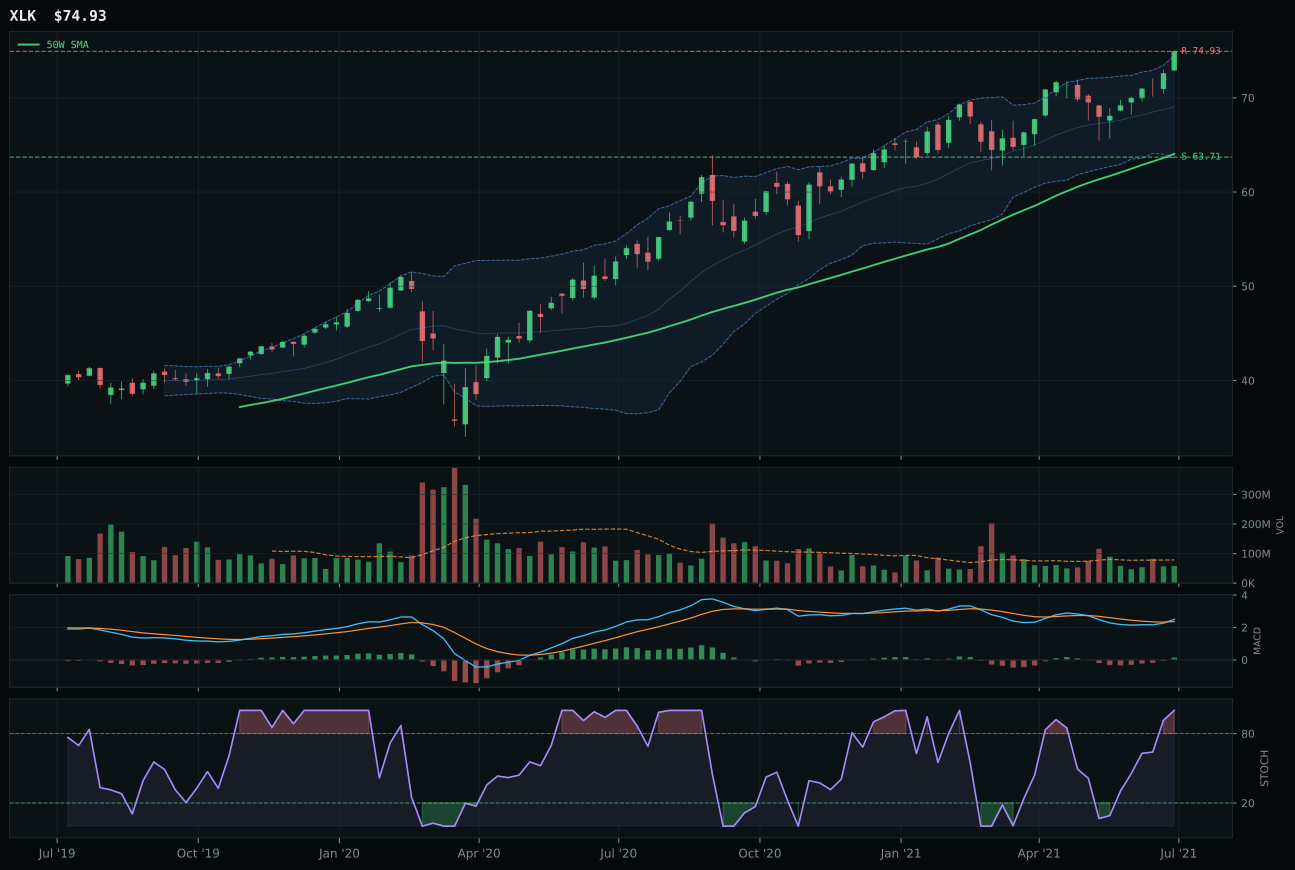
XLK has a vertical extension profile with 2.3% 13-week relative strength versus SPY.
A failed hold above support would weaken the setup.
Actionable but governed by invalidation levels.
IGV prevails in the Technology category because it commands 4.8% relative strength versus SPY and 2.0% category-relative strength, both metrics reflecting genuine sponsorship from institutional buyers rotated into enterprise software. The chart sits 15.9% above the 50-week moving average with a non-deteriorating slope, and the stochastic RSI has hit overbought territory at 1.00—a sign that momentum is extended but still intact. Volume participation at 0.65x the 20-week average is thin, so while the setup lacks accumulation breadth, it also avoids the heavy selling that would confirm a failed breakout. CIBR, the runner-up, stumbles on timing (27.0 vs 37.0) and risk/reward (37.4 vs 45.2), with stochastic RSI already rolling over from overbought rather than holding, and category-relative strength stuck at 0.0%—a critical deficit when cybersecurity is supposed to be the steadier theme.
Technology earns 10% allocation as a top-2 overweight category, ranking alongside Traditional Energy as the portfolio's highest-conviction positions. The category score of 51.0 reflects a clean technical setup in IGV with perfect trend confirmation (100/100) and 13-week returns of 13.1% that have justified the extension risk. In a Transition/Mixed macro regime where credit stress is active, growth software's ability to deliver productivity gains—regardless of interest-rate uncertainty—provides asymmetric value. However, the extended 15.9% premium above the 50-week moving average means new capital entering now faces poor entry timing; the risk/reward tilts downside (17.5% to support vs 0% upside room), which tempers the allocation despite category strength. Only the sponsorship and persistence of existing holders keep this position at full weight.
Industrial Metals — COPX
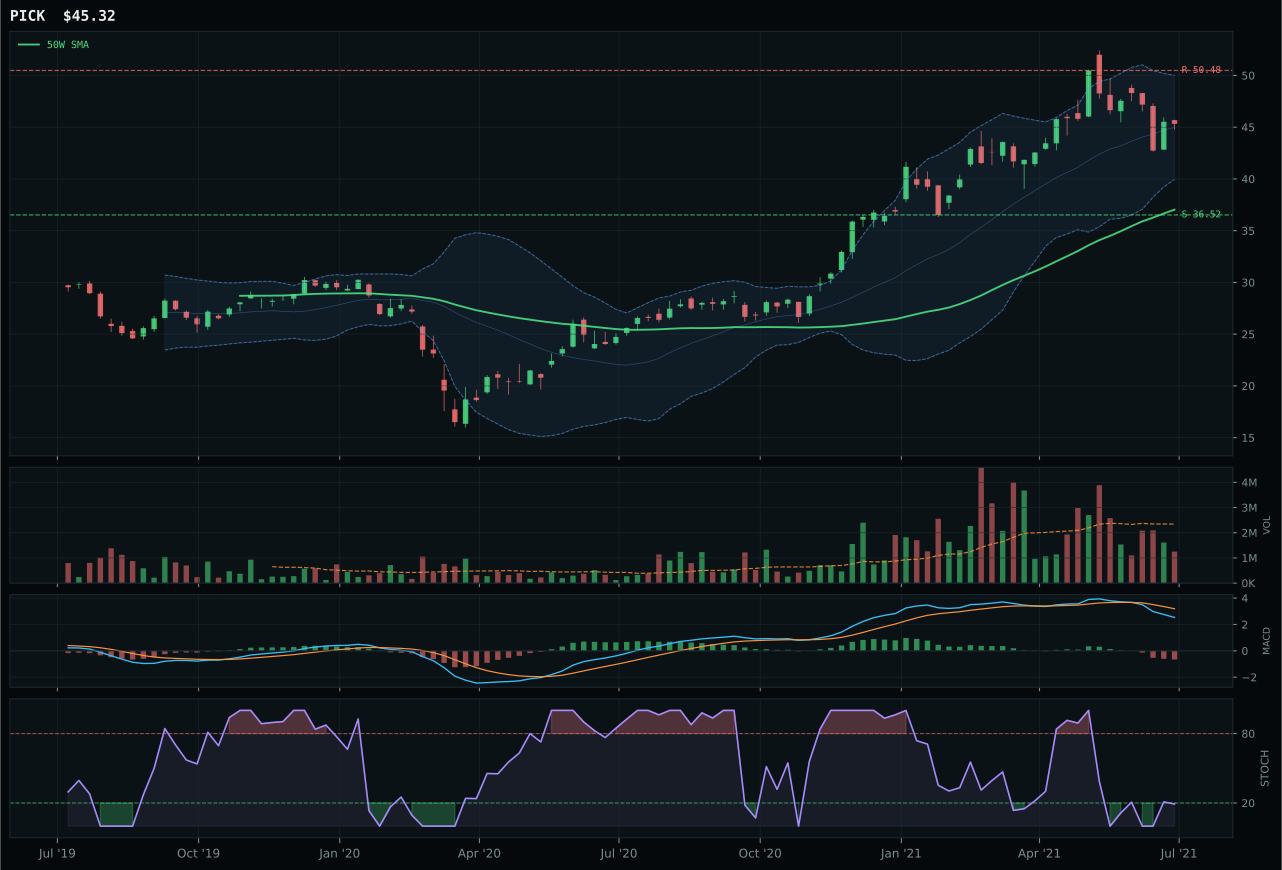
PICK has a vertical extension profile with -1.8% 13-week relative strength versus SPY.
A failed hold above support would weaken the setup.
Actionable but governed by invalidation levels.
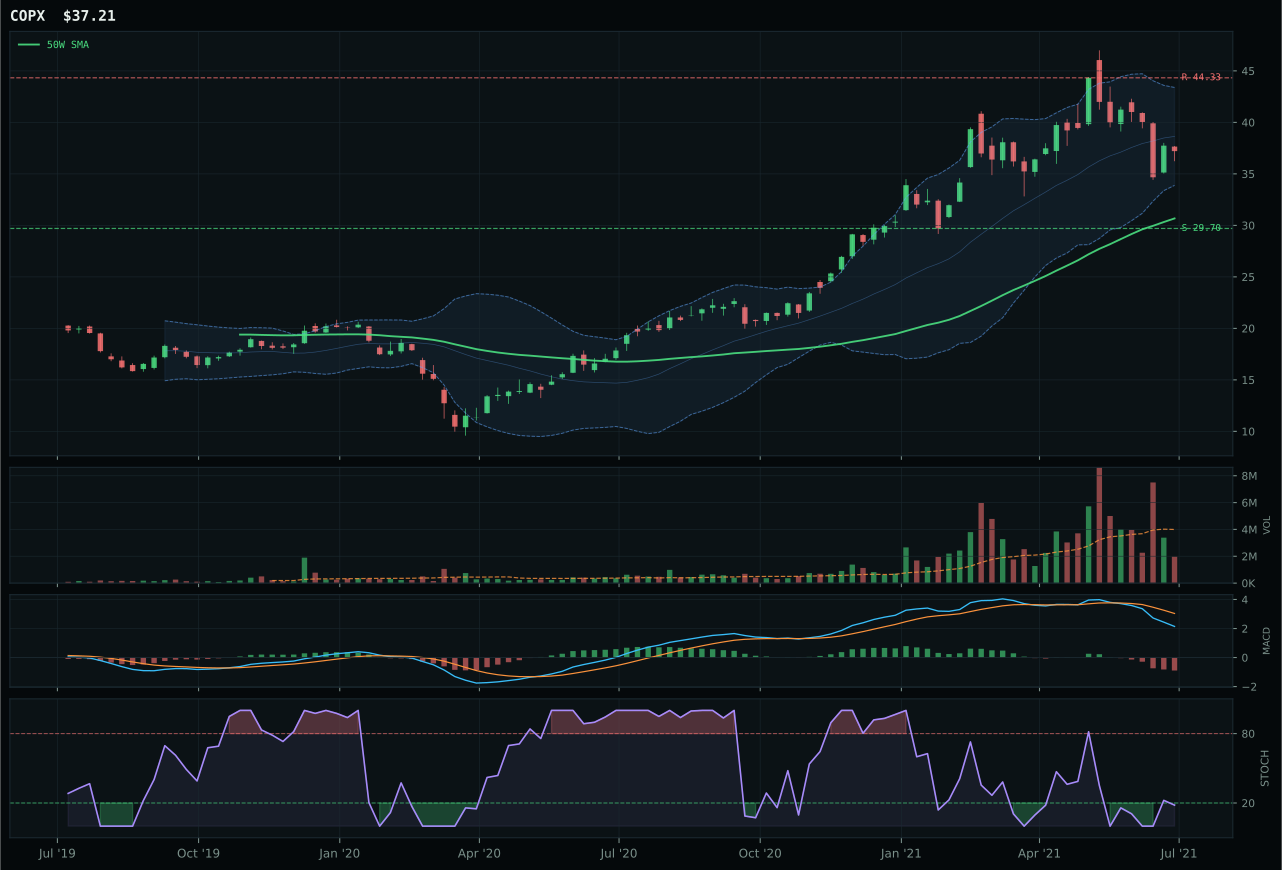
COPX has a vertical extension profile with -6.1% 13-week relative strength versus SPY.
A failed hold above support would weaken the setup.
Actionable but governed by invalidation levels.
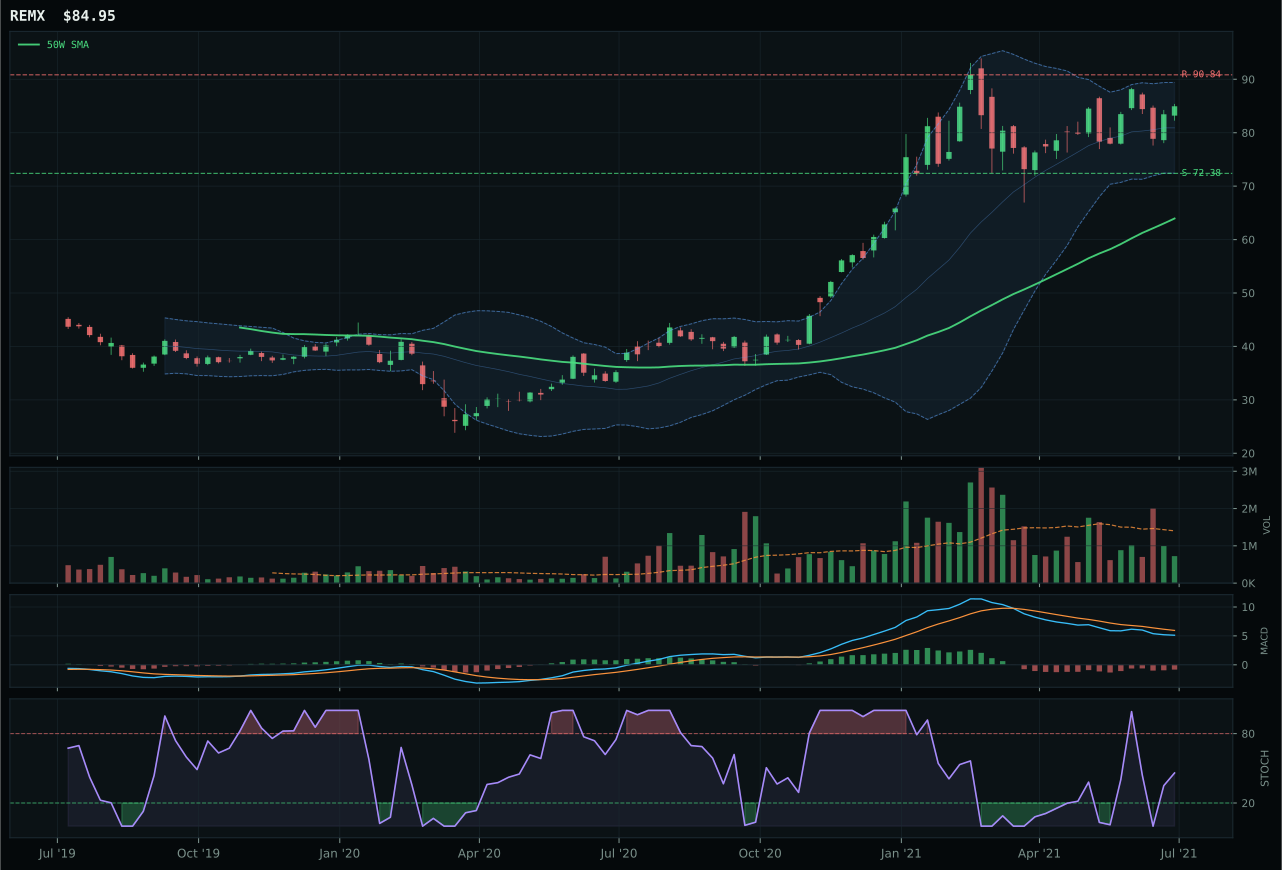
REMX has a vertical extension profile with 3.1% 13-week relative strength versus SPY.
A failed hold above support would weaken the setup.
Actionable but governed by invalidation levels.
COPX wins despite a catastrophic momentum confirmation score of 4.5/100 and four-week return of negative 9.3%, capturing the representative slot because timing is superior (62.0) and stochastic RSI is oversold-turning-up at 0.18—a technical pattern that favors mechanical mean reversion. The 21.3% extension above the 50-week moving average is severe, but the MACD is bearish/weakening and improving, not deteriorating, which preserves a faint technical hope. Relative strength versus SPY is negative 6.1%, the worst in the category, yet COPX holds category-relative strength of negative 4.3%, meaning it has not collapsed relative to PICK or REMX. The category-relative weakness versus PICK (which shows 0.0% relative strength) reflects copper's underperformance as industrial demand growth stalls; PICK's 6.5% 13-week return vastly outpaces COPX's 2.2%, yet PICK's neutral structure loses to COPX's vertical extension timing and oversold-reversal setup.
Industrial Metals receives 5% allocation as a tier-2 real-asset hedge, driven entirely by exceptional macro sponsorship. The category score of 47.4 is anchored by a macro fit of 73.0/100—the highest among tier-2 categories—where metals scarcity is active (+14) and commodity breadth is positive (+10), offsetting technical evidence of only 15.0/100. This is a bet that copper demand will revive faster than current price weakness implies; the oversold stochastic RSI and improving MACD offer a mechanical entry point, not a conviction signal. The four-week return of negative 9.3% and category-relative strength of negative 4.3% in the representative confirm that copper buyers have exited; the portfolio holds this position because scarcity narratives and real-asset sponsorship remain live in the macro frame, not because technicals are attractive. COPX's volume confirmation is only 22.6/100 and persistence is 28.4/100, the weakest in the entire portfolio, exposing this allocation as a pure directional macro bet vulnerable to any surprise in EM demand or credit conditions.
Emerging Markets — INDA
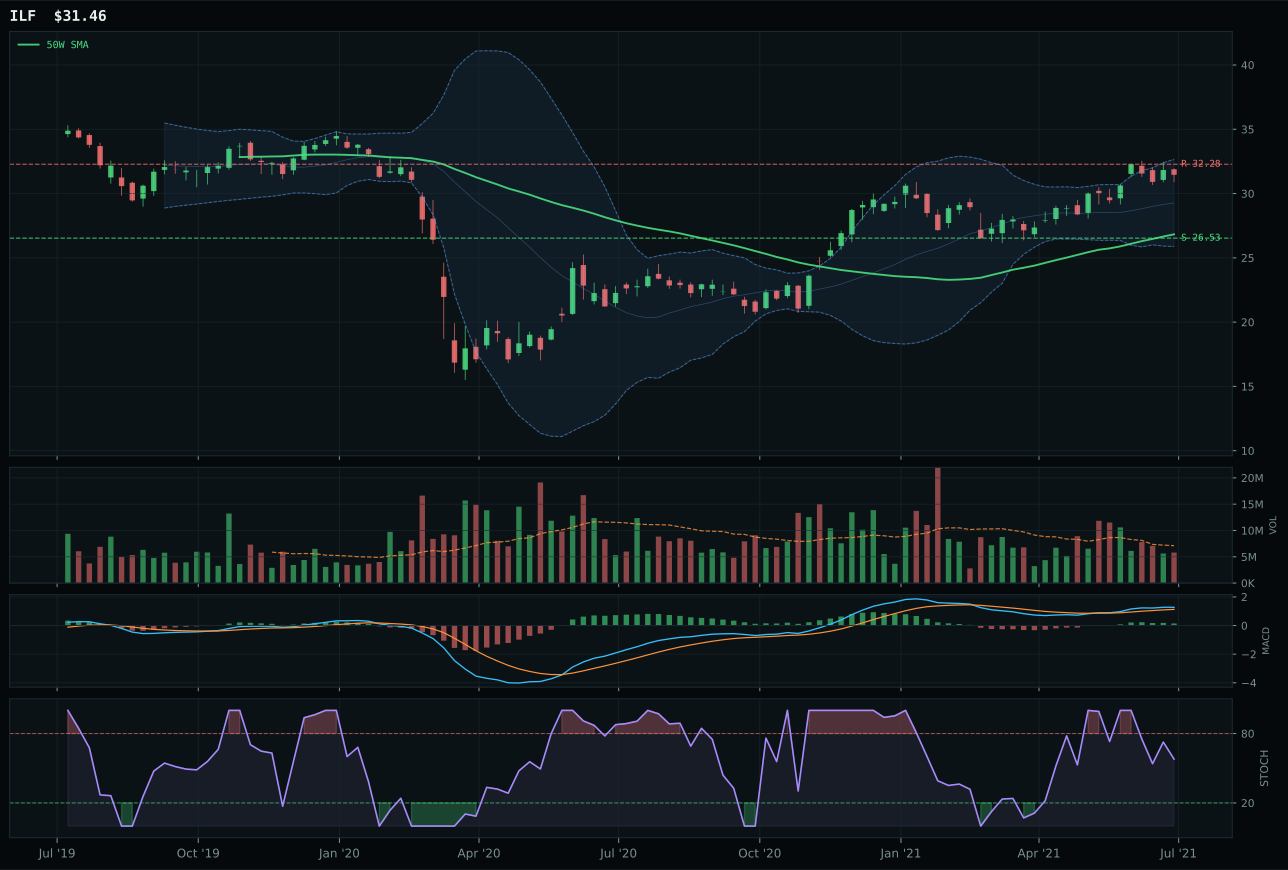
ILF has a vertical extension profile with 6.7% 13-week relative strength versus SPY.
A failed hold above support would weaken the setup.
Actionable but governed by invalidation levels.
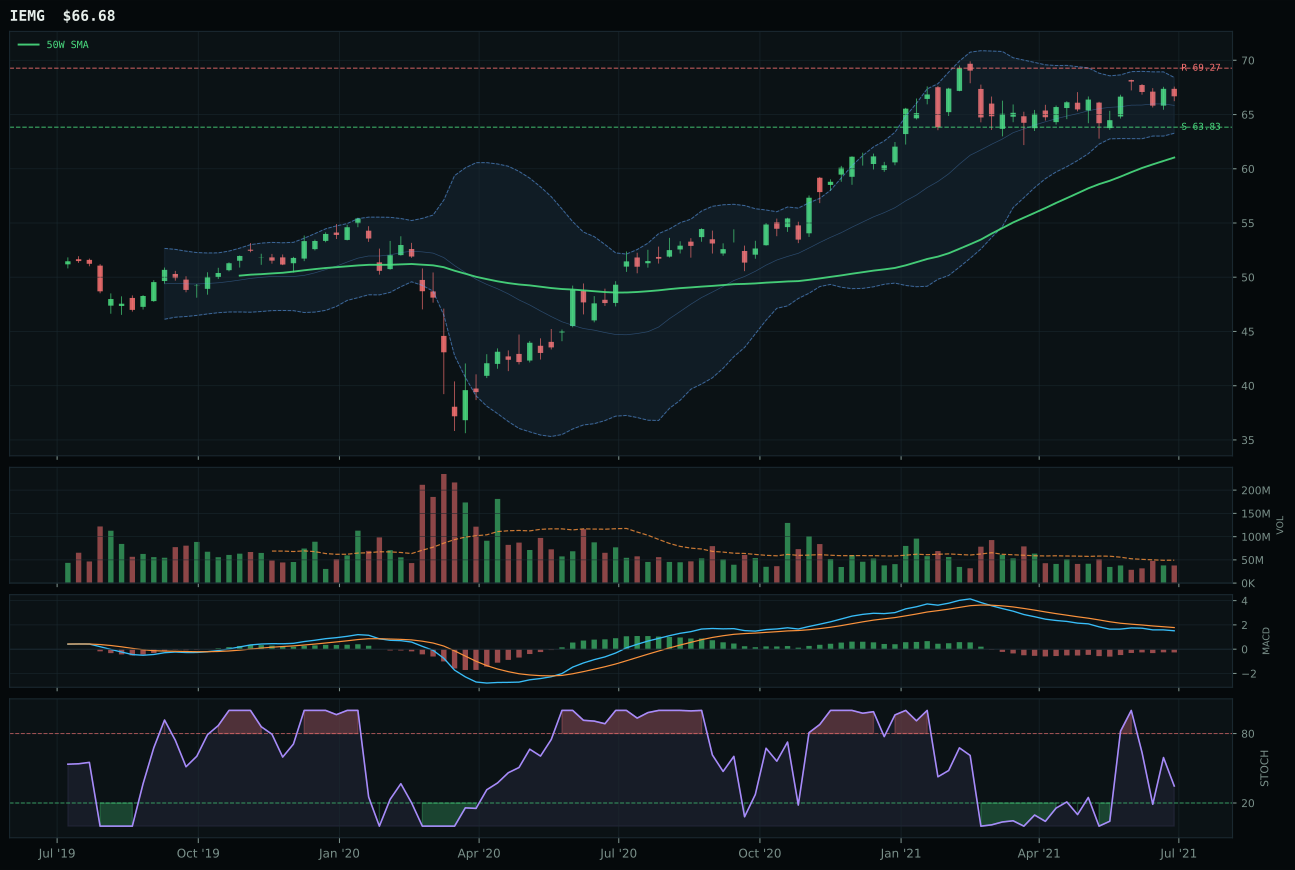
IEMG has a pullback into support profile with -5.8% 13-week relative strength versus SPY.
A failed hold above support would weaken the setup.
Actionable but governed by invalidation levels.
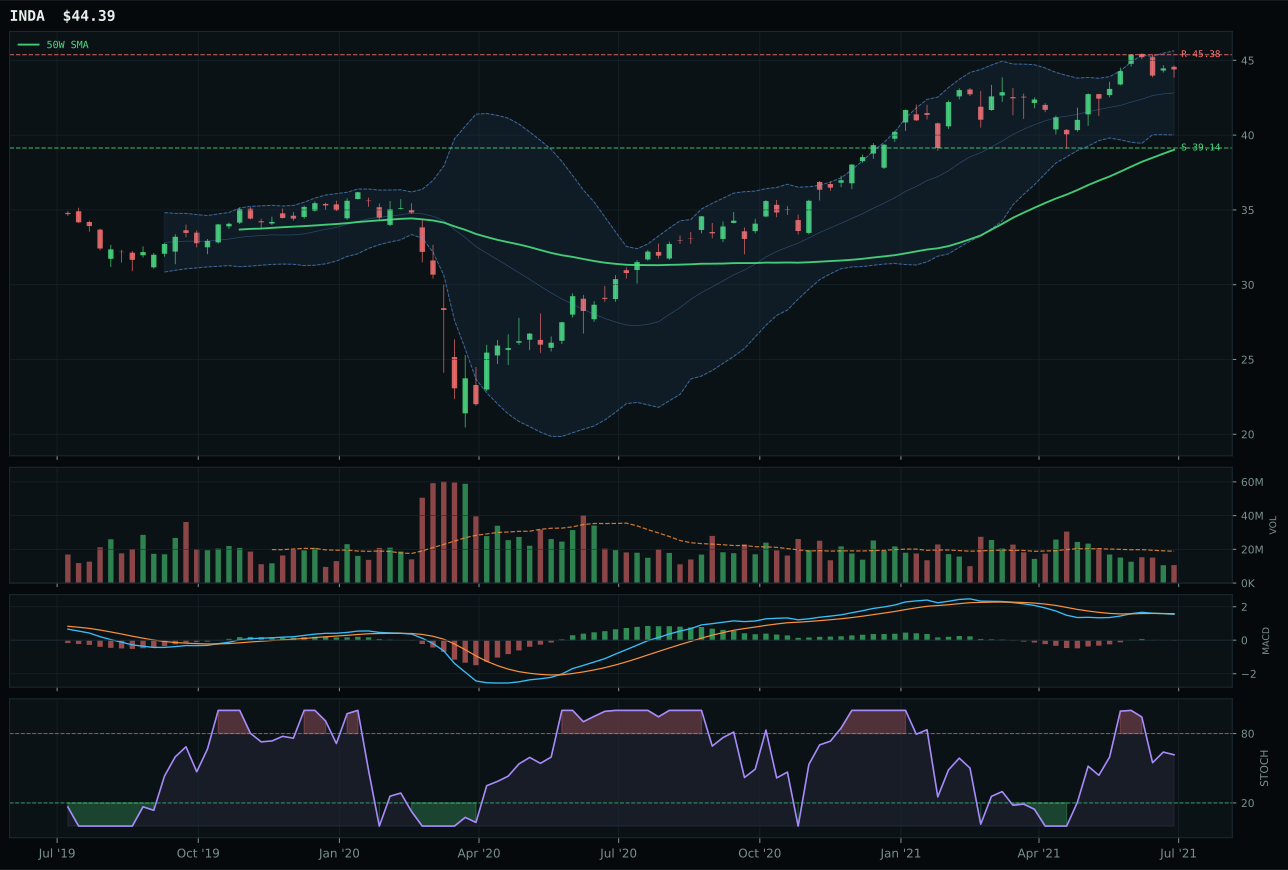
INDA has a neutral structure profile with -3.5% 13-week relative strength versus SPY.
A failed hold above support would weaken the setup.
Actionable but governed by invalidation levels.
INDA wins Emerging Markets despite carrying the weakest technical evidence (38.0/100) of any representative in the portfolio, capturing the slot because ILF's timing deteriorates faster than INDA's can fall. The 13.8% extension above the 50-week moving average is moderate, structure is neutral, and the stochastic RSI falling/neutral at 0.62 offers no momentum spark, yet INDA holds category-relative strength at 0.0% whereas ILF is fighting a 10.2% category-relative lead that comes with a 19.8% extension—making ILF the riskier entry. ILF's technical evidence is 66.6/100 and momentum confirmation is 93/100, vastly superior on paper, but its 40.0/100 timing score versus INDA's 62.0/100 reflects the extension risk premium that overrides ILF's momentum. The four-week return in INDA is negative 2.2%, momentum confirmation is 25.4/100, and volume is thin—this is a defensive choice by elimination, not conviction.
Emerging Markets receives 5% allocation as a tier-2 position justified entirely by EM liquidity support in the macro frame (+14 active descriptor) offsetting credit stress headwinds (-10). The category score of 47.0 reflects deep technical weakness (38.0/100 in the representative) masked by adequate macro fit of 54.0/100. The reasoned ETF proof order (ILF 63.7, IEMG 61.9, INDA 42.3) shows that the category's best technical name is a commodity/value play (ILF at Latin America beta) rather than the quality growth expression (INDA), yet the extended 19.8% distance of ILF from the 50-week moving average makes it too stretched for entry despite superior fundamentals. INDA's compression and neutral structure offer safer entry, though momentum confirmation at 25.4/100 confirms that EM inflows have stalled. This allocation is held because EM liquidity support remains active in the macro descriptor set, not because technicals are attractive; it functions as a hedge against dollar weakness and commodity re-acceleration. If ILF's timing corrects closer to the 50-week moving average and momentum re-engages, the portfolio will rotate into the better technical expression and trim INDA.
Precious Metals — SLV
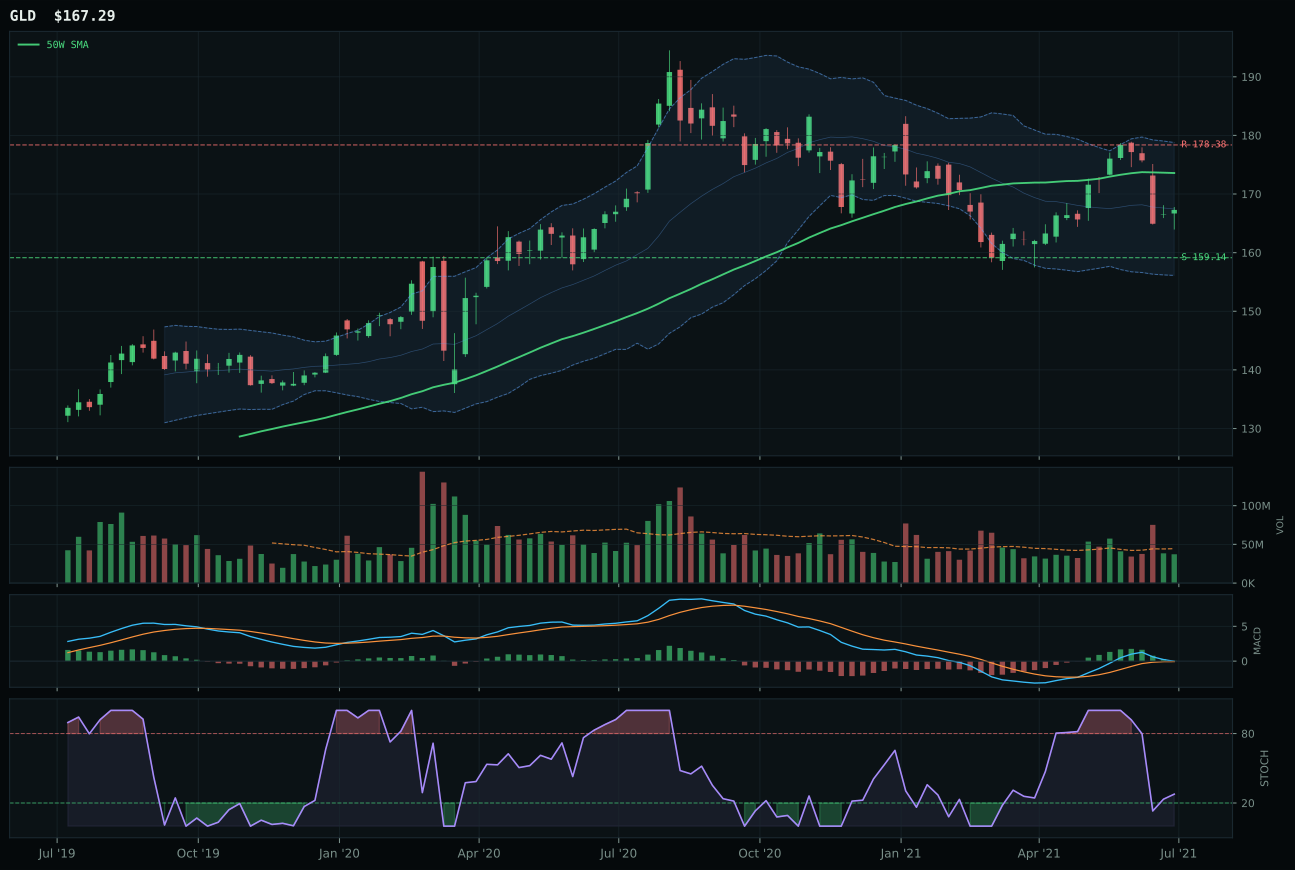
GLD has a neutral structure profile with -5.0% 13-week relative strength versus SPY.
A failed hold above support would weaken the setup.
Actionable but governed by invalidation levels.
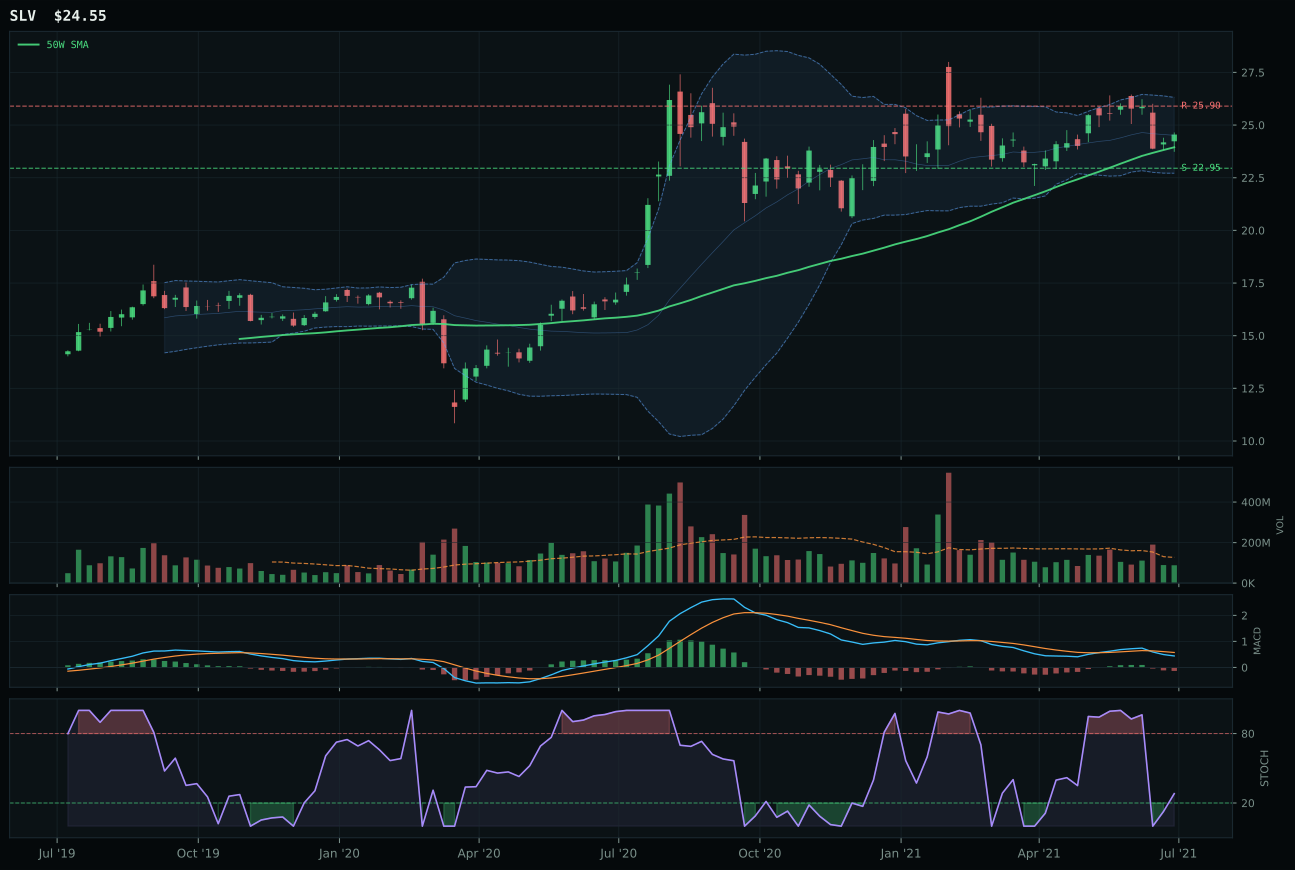
SLV has a compression near 50W profile with -2.2% 13-week relative strength versus SPY.
A failed hold above support would weaken the setup.
Actionable but governed by invalidation levels.
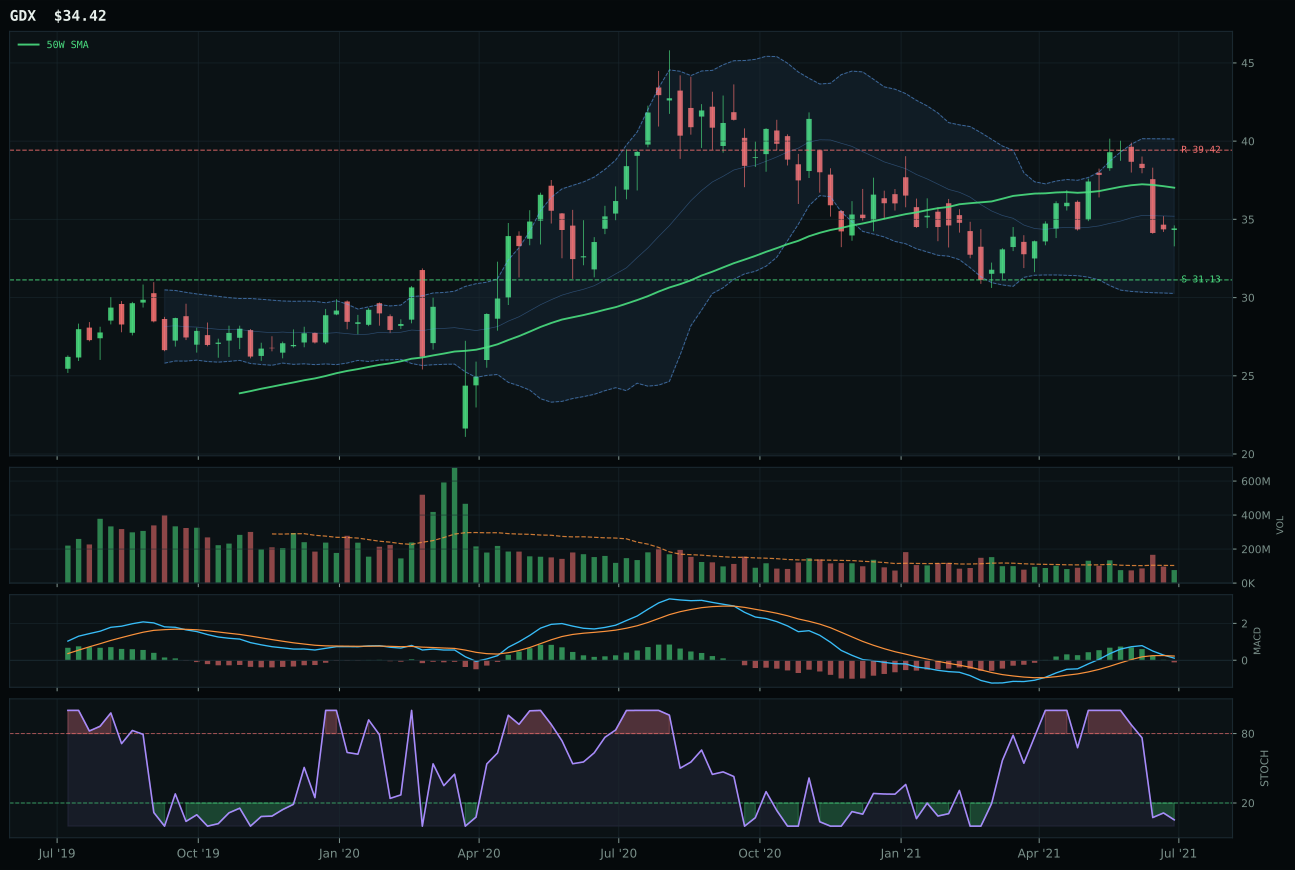
GDX has a neutral structure profile with -5.8% 13-week relative strength versus SPY.
A failed hold above support would weaken the setup.
Actionable but governed by invalidation levels.
SLV wins Precious Metals on timing rather than momentum, a critical distinction in a sector where both volume and directional conviction are breaking down. The setup is compression near the 50-week moving average at only 2.5% distance, which generates a 95.0/100 timing score—the highest in the category—because buyers who defend this level would trigger expansion upside. Stochastic RSI is falling/neutral at 0.28, MACD is bearish/weakening, and the four-week return is negative 4.8%, yet category-relative strength holds at 2.8%, meaning SLV is outperforming both GLD and GDX despite weakness. GLD, the runner-up, has a neutral structure setup and deeper retracement zone (support at 159.14), which should imply better risk/reward, but it lacks the recoil opportunity that SLV's compression setup offers. Volume is thin across the board—0.69x in SLV versus neutral in GLD—so neither ETF is attracting new capital.
Precious Metals receives 5% allocation as a tier-2 defensive holding, justified by its 46.1 category score and a macro fit of 50.0/100 where metals scarcity is active (+7). The category reasoning does not strongly favor gold or silver directionally, but the setup in SLV offers technical optionality: if buyers defend the compressed 50-week level, upside to 25.90 resistance opens a low-risk lever. The four-week return is negative 4.8%, and momentum confirmation is only 28.2/100, revealing that precious metals are being sold into strength rather than accumulated—a pattern consistent with a risk-off transition where volatility is priced but not yet realized. This allocation functions as a tail-risk hedge and inflation insurance, not a return driver. The timing advantage of compression near the 50-week moving average is precise, but if that level breaks downside (7.0% to support at 22.95), the category loses its structural argument and should be trimmed.
Utilities & Infrastructure — XLU
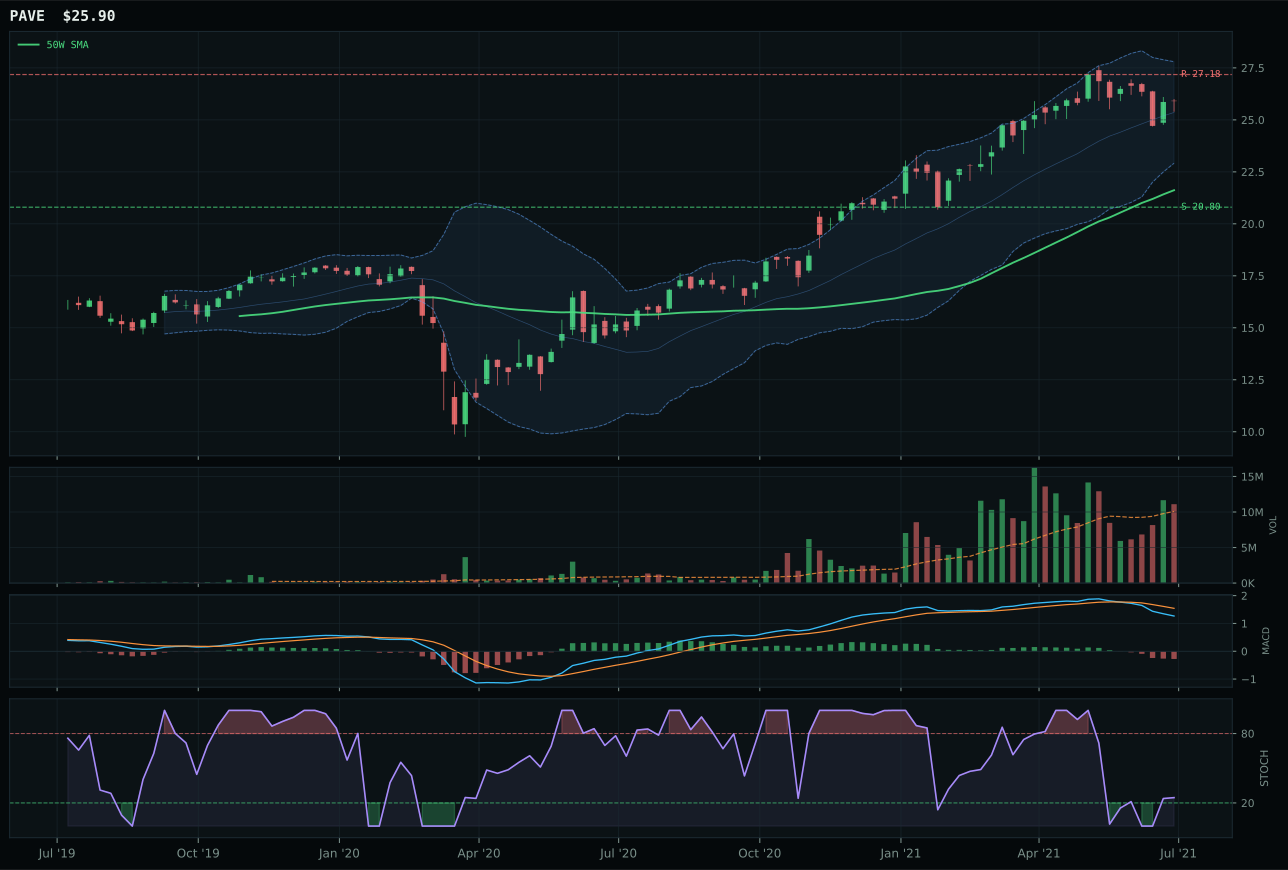
PAVE has a vertical extension profile with -5.6% 13-week relative strength versus SPY.
A failed hold above support would weaken the setup.
Actionable but governed by invalidation levels.
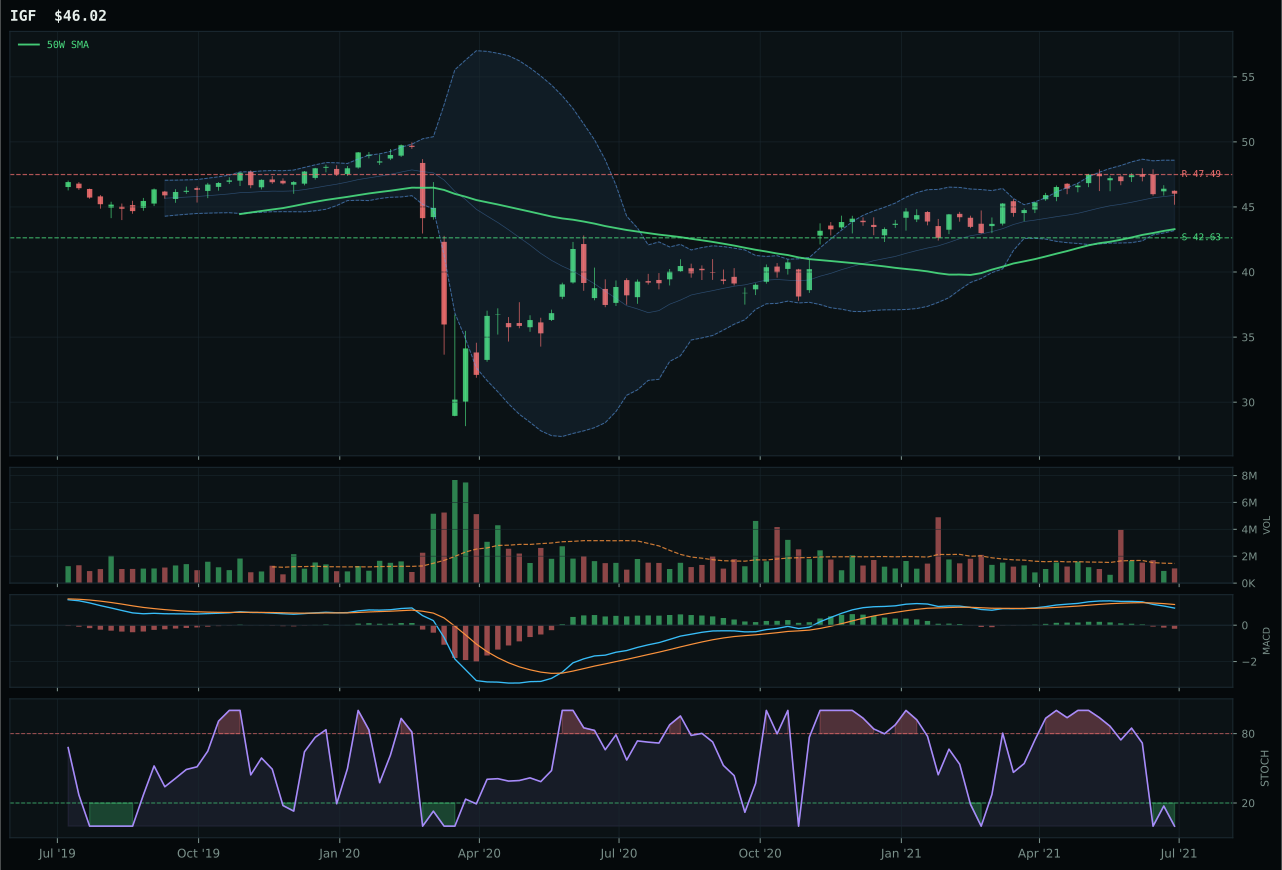
IGF has a neutral structure profile with -6.8% 13-week relative strength versus SPY.
A failed hold above support would weaken the setup.
Actionable but governed by invalidation levels.
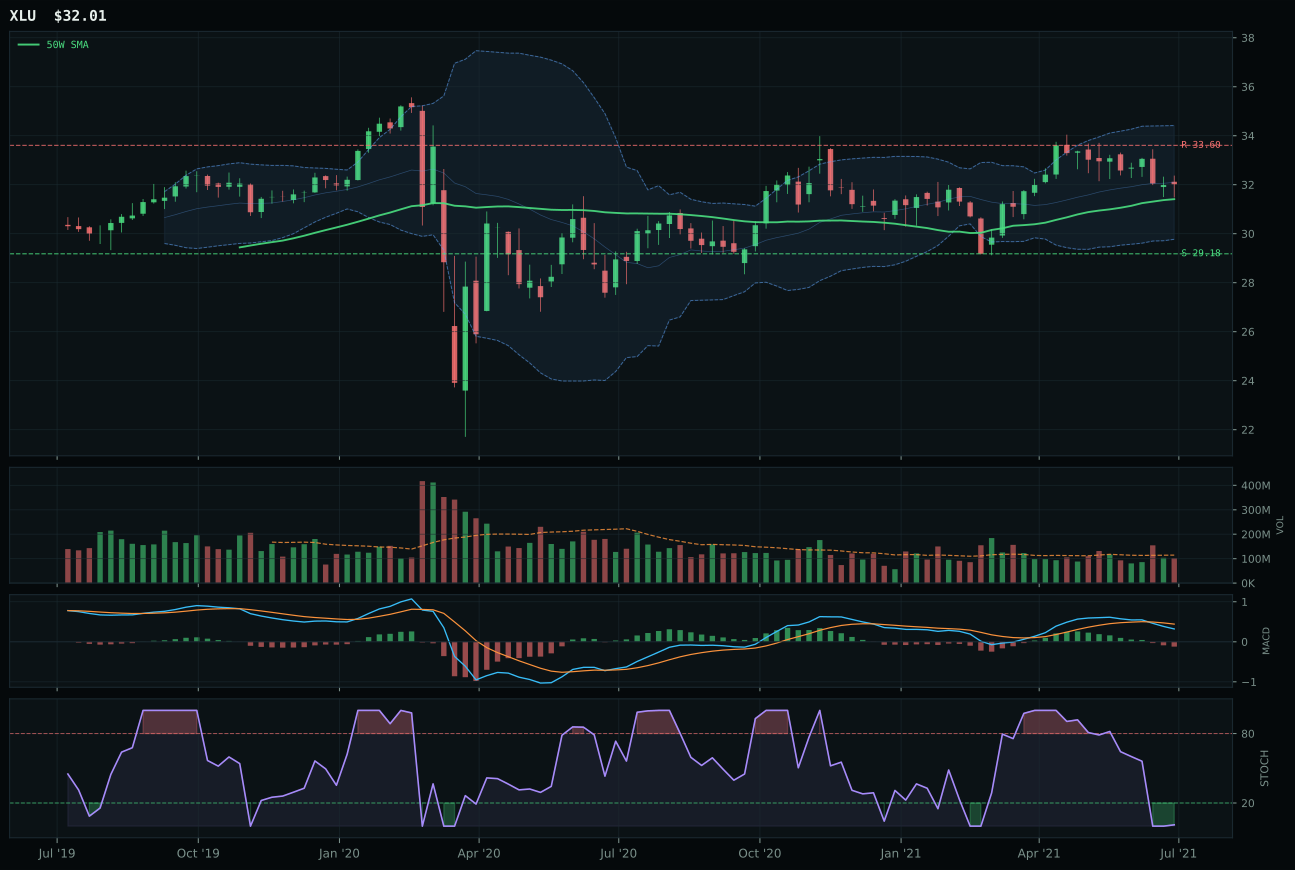
XLU has a compression near 50W profile with -8.2% 13-week relative strength versus SPY.
A failed hold above support would weaken the setup.
Actionable but governed by invalidation levels.
XLU wins Utilities & Infrastructure on timing alone, delivering a 95.0/100 timing score because price sits just 1.9% above the 50-week moving average in a compression setup that offers mechanical mean-reversion optionality. The stochastic RSI is oversold at 0.01, MACD is bearish/weakening, and the 13-week return is a flat 0.1%, confirming that utilities have stalled—yet this weakness creates the setup. Relative strength versus SPY is negative 8.2%, the worst in the category, meaning utilities are being rotated out as risk-on sentiment improves. PAVE, the runner-up, shows a 56.0/100 timing score (39 points lower) because it sits 19.8% extended from the 50-week moving average, and while its risk/reward is competitive (48.5 vs 53.8), the extended position absorbs the advantage. Volume in PAVE is above-average at 1.49x, confirming institutional selling pressure, whereas XLU's neutral participation preserves the compression setup.
Utilities receives 5% allocation as a tier-2 defensive holding, justified by a category score of 44.8 and a macro environment where Transition/Mixed regimes provide modest support (+4). The technical evidence of 33.0/100 in the representative is weak—momentum confirmation is only 16.2/100, indicating utilities are not attracting capital—yet the 95.0/100 timing score on compression near support at 29.18 creates a tactical entry opportunity for hedging purposes. Relative strength versus SPY at negative 8.2% confirms that utilities are defensive relative to equities, appropriate for a portfolio managing transition-period uncertainty. The allocation is scaled to 5% rather than a top-2 position because technical momentum is moribund; this is insurance against volatility, not a return driver. If XLU breaks below support at 29.18, this position must be exited immediately as it would signal that defensive positioning is failing. Conversely, if the 50-week moving average slopes positive and stochastic RSI rises above 0.25, XLU could be upgraded to tier-2 conviction as a true defensive refuge play.
Defense & Aerospace — XAR
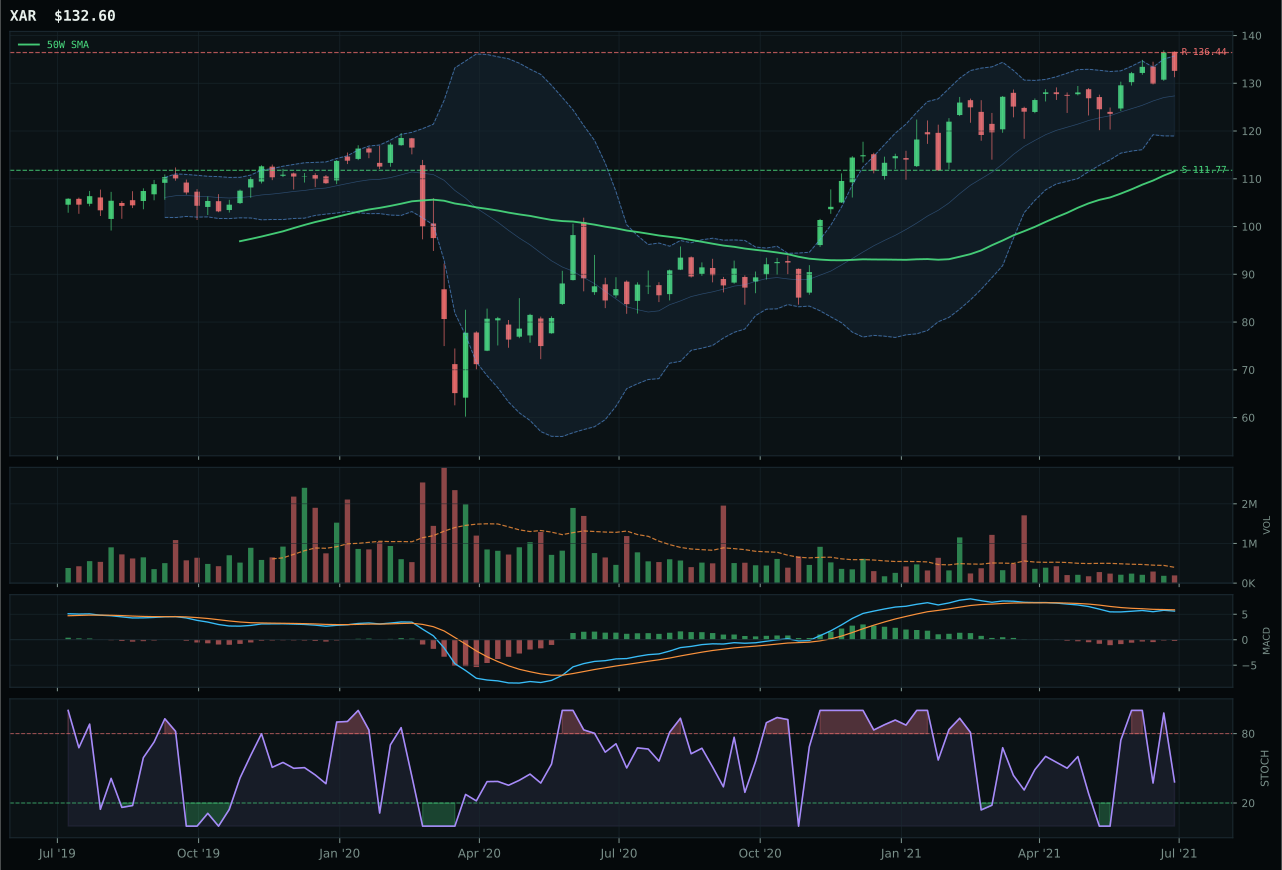
XAR has a vertical extension profile with -3.4% 13-week relative strength versus SPY.
A failed hold above support would weaken the setup.
Actionable but governed by invalidation levels.
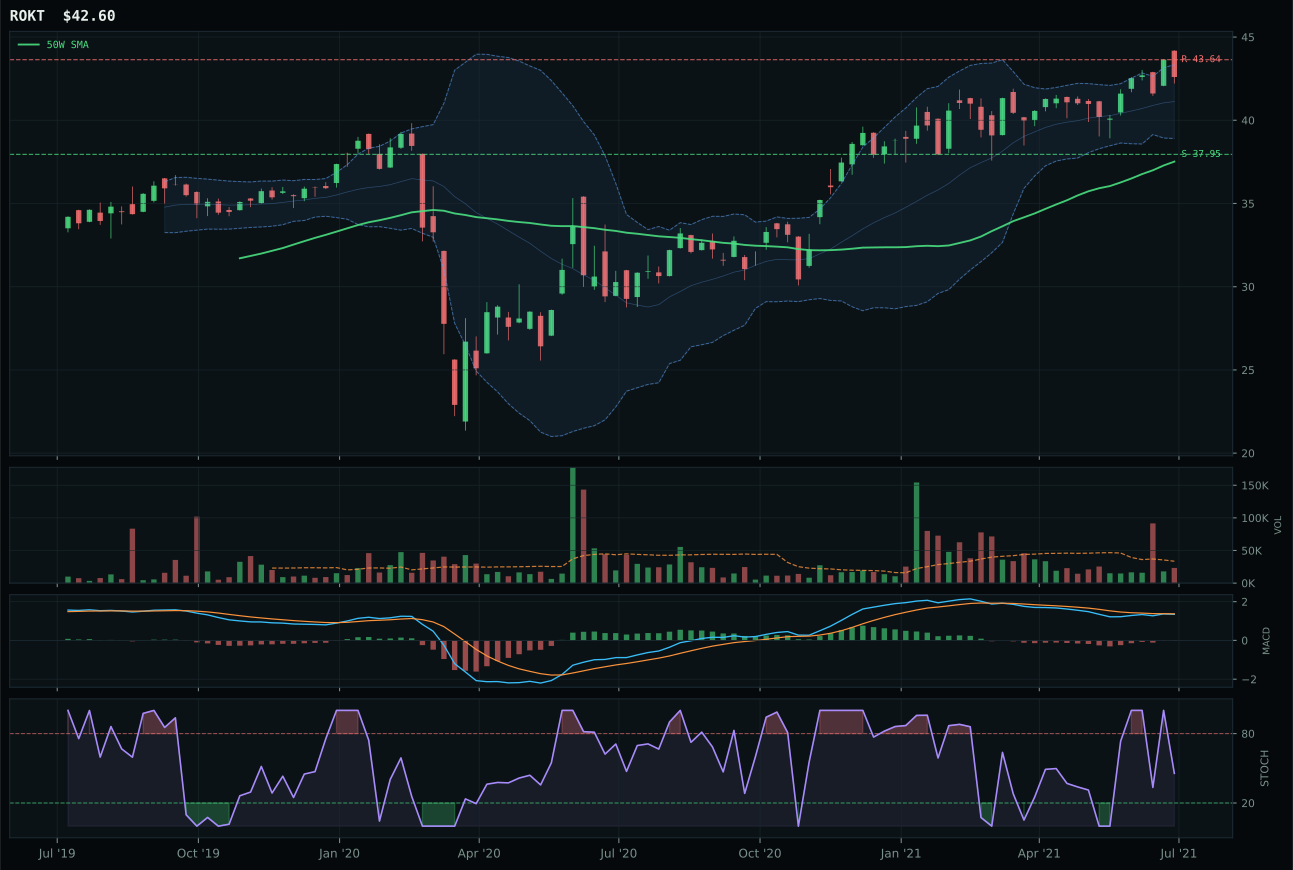
ROKT has a neutral structure profile with -3.2% 13-week relative strength versus SPY.
A failed hold above support would weaken the setup.
Tracked, but not top-2 eligible because: .
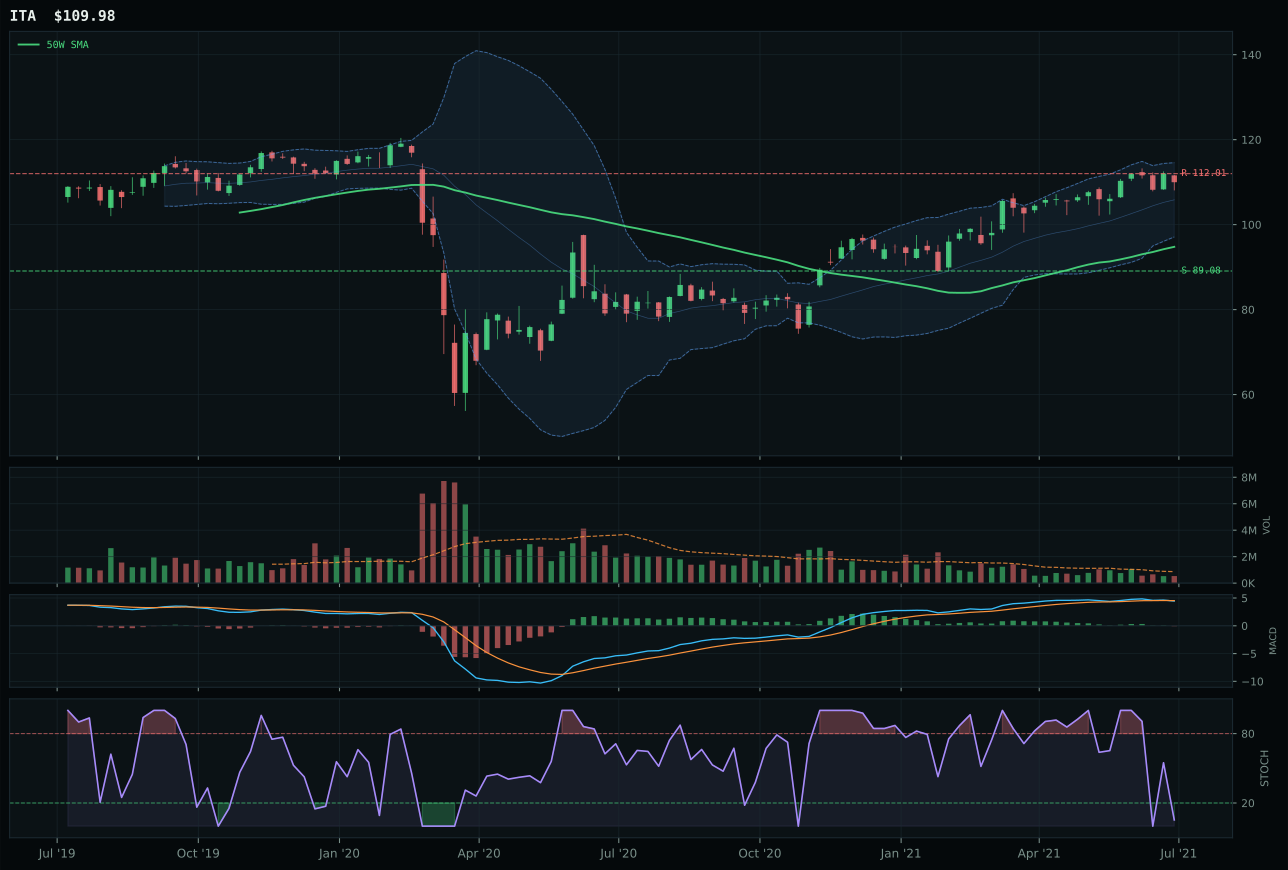
ITA has a vertical extension profile with -3.0% 13-week relative strength versus SPY.
A failed hold above support would weaken the setup.
Actionable but governed by invalidation levels.
XAR wins Defense & Aerospace by holding a 87.8/100 trend score despite being 18.8% extended from the 50-week moving average—a narrow technical advantage built on a non-deteriorating slope and price staying above both the 50-week and 200-week levels. Relative strength versus SPY is negative at -3.4%, yet category-relative strength is nearly flat at -0.2%, meaning XAR has not lost leadership to ROKT or ITA. The stochastic RSI sits at 0.38 falling/neutral, MACD is bearish but improving, and volume participation is thin at 0.49x, which creates a precarious setup where the next macro surprise could trigger sharp mean reversion. ROKT loses on risk/reward (48 vs 40) and structure cleanliness (52 vs 56), despite having 13-week returns of 5.0% that match XAR's pace, because the composition of returns lacks quality sponsors.
Defense & Aerospace receives 5% allocation as a tier-2 holding, justified by its 44.2 category score and a macro environment where Transition/Mixed regimes favor capacity buildouts and geopolitical hedges (+3 macro support). The sector's technical evidence score of 48.0/100 is weak, and momentum confirmation (45.9/100) is mediocre, but the category-level macro fit of 55.0/100 supplies structural support through energy scarcity and credit-stress considerations that favor defense contractors' pricing power. Volume participation remains thin across all three ETFs, however, signaling that money is not rushing into cyclical names; the 18.8% extension in XAR creates a vulnerability if emerging-market liquidity tightens or growth concerns resurface. This allocation is a macro call, not a technical conviction—if timing deteriorates further or breadth weakens, the position will be reduced before it generates losses.
Agriculture & Livestock — MOO
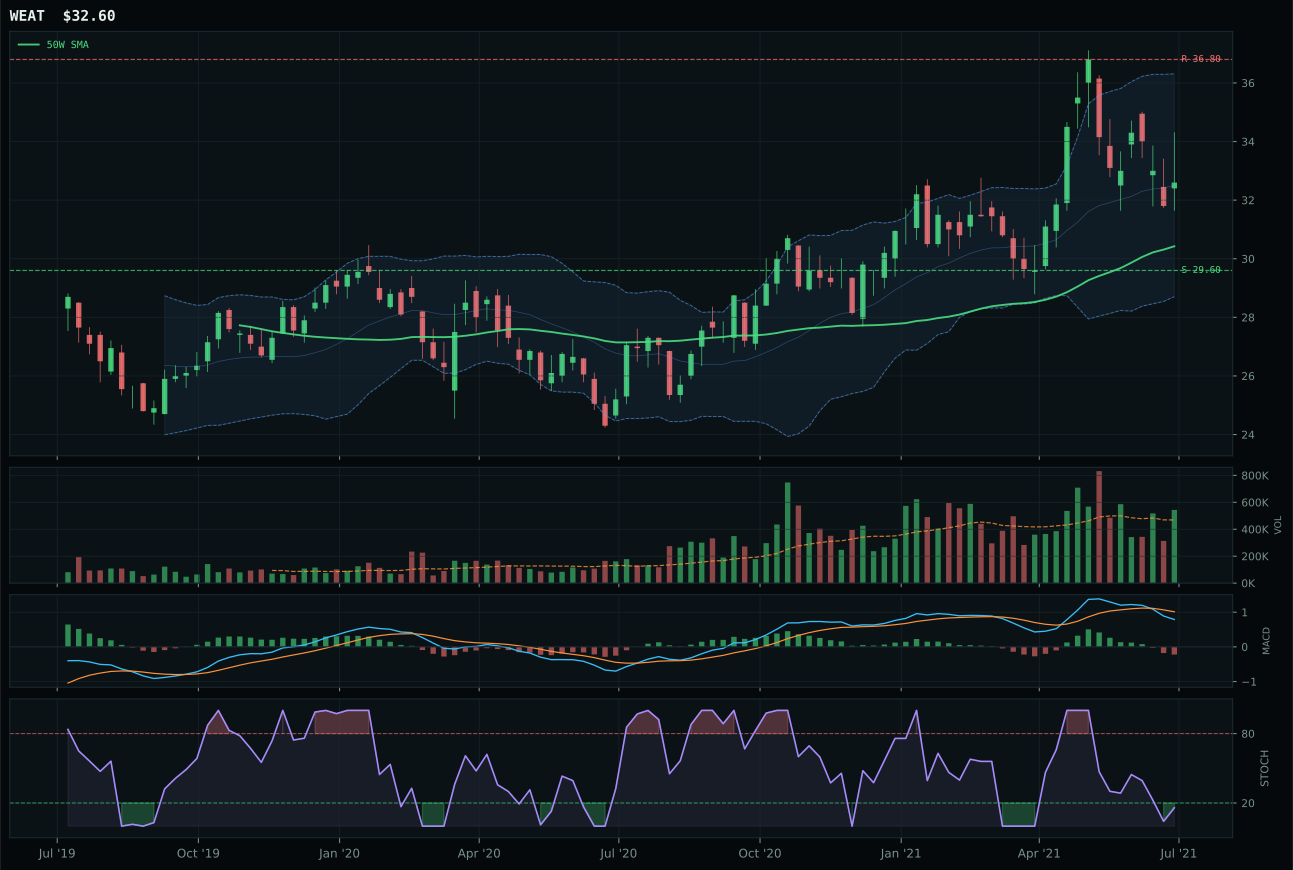
WEAT has a neutral structure profile with 1.9% 13-week relative strength versus SPY.
A failed hold above support would weaken the setup.
Actionable but governed by invalidation levels.
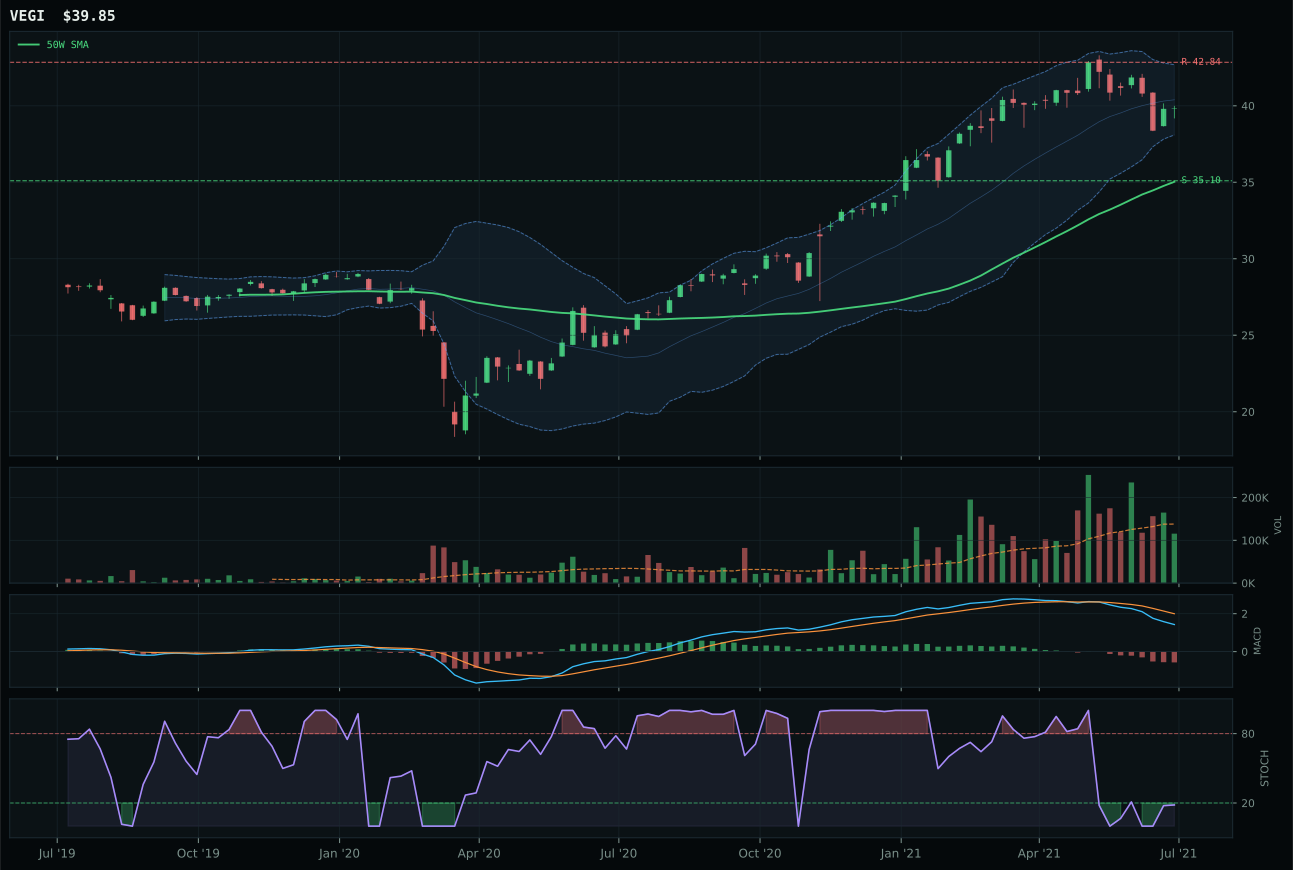
VEGI has a neutral structure profile with -9.0% 13-week relative strength versus SPY.
A failed hold above support would weaken the setup.
Tracked, but not top-2 eligible because: .
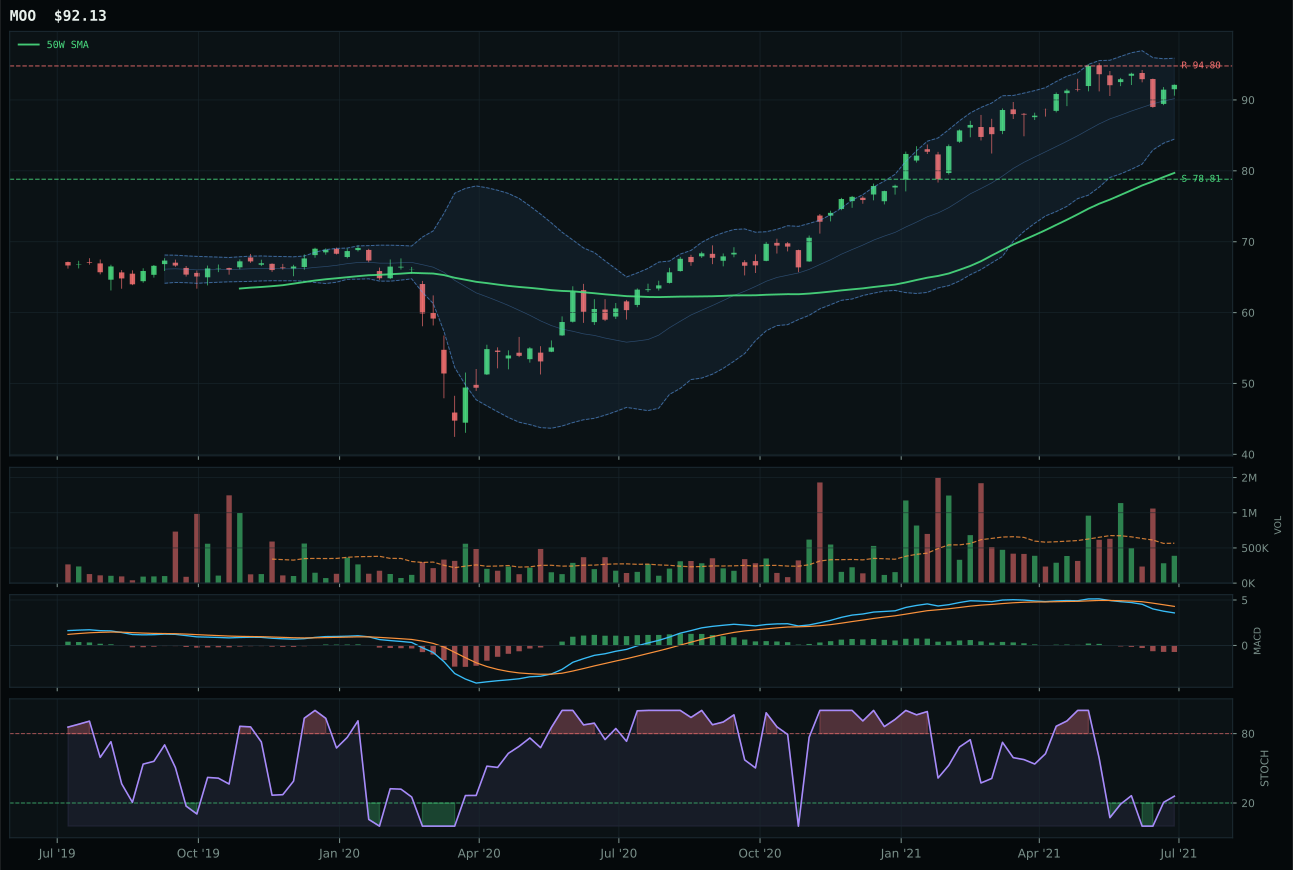
MOO has a vertical extension profile with -3.3% 13-week relative strength versus SPY.
A failed hold above support would weaken the setup.
Actionable but governed by invalidation levels.
MOO captures the representative slot despite a low technical evidence score of 32.5/100 and weaker momentum confirmation (26.8/100), prevailing over WEAT and VEGI because structure is cleanest (76.5 vs 71.6 in WEAT) and stochastic RSI timing is slightly more favorable (rising mid-zone at 0.26 vs oversold in WEAT). The MACD is bearish/weakening—consistent across all three category candidates—but MOO's vertical extension setup and rising RSI offer a better entry shape than WEAT's neutral structure and oversold condition. What damns this entire category is the 4W return of negative 1.7%, revealing that recent weakness dominates; the 13-week return of 5.0% merely reflects earlier strength that has now stalled. WEAT's 13-week return of 10.1% and above-average volume participation at 0.49x 20W make it technically superior, yet timing weakness (40.0 vs 62.0) and marginal structure advantage push the decision to MOO.
Agriculture receives 5% allocation as a tier-2 category, buoyed entirely by macro sponsorship rather than technical quality. The category score of 41.1 is pulled up by a macro fit of 63.0/100, where real asset sponsorship is active (+8) and commodity breadth is positive (+5), overriding technical evidence of only 32.5/100 in the representative. In a Transition/Mixed regime where inflation concerns and supply-chain stress remain live, agribusiness can deliver real-asset return regardless of equity-market directional bias. However, the momentum confirmation score of 26.8/100 and four-week negative returns reveal that buyers have stepped back; the portfolio is holding this position on conviction that agricultural commodities will re-accelerate, not on evidence that they have. MOO's thin participation at 0.68x suggests institutional indifference. This is a macro hedge, not a momentum trade; if credit stress accelerates or EM demand disappoints, this allocation will underperform—and the weakness is already visible in the forward-looking MACD deterioration.
Nuclear Energy — URA
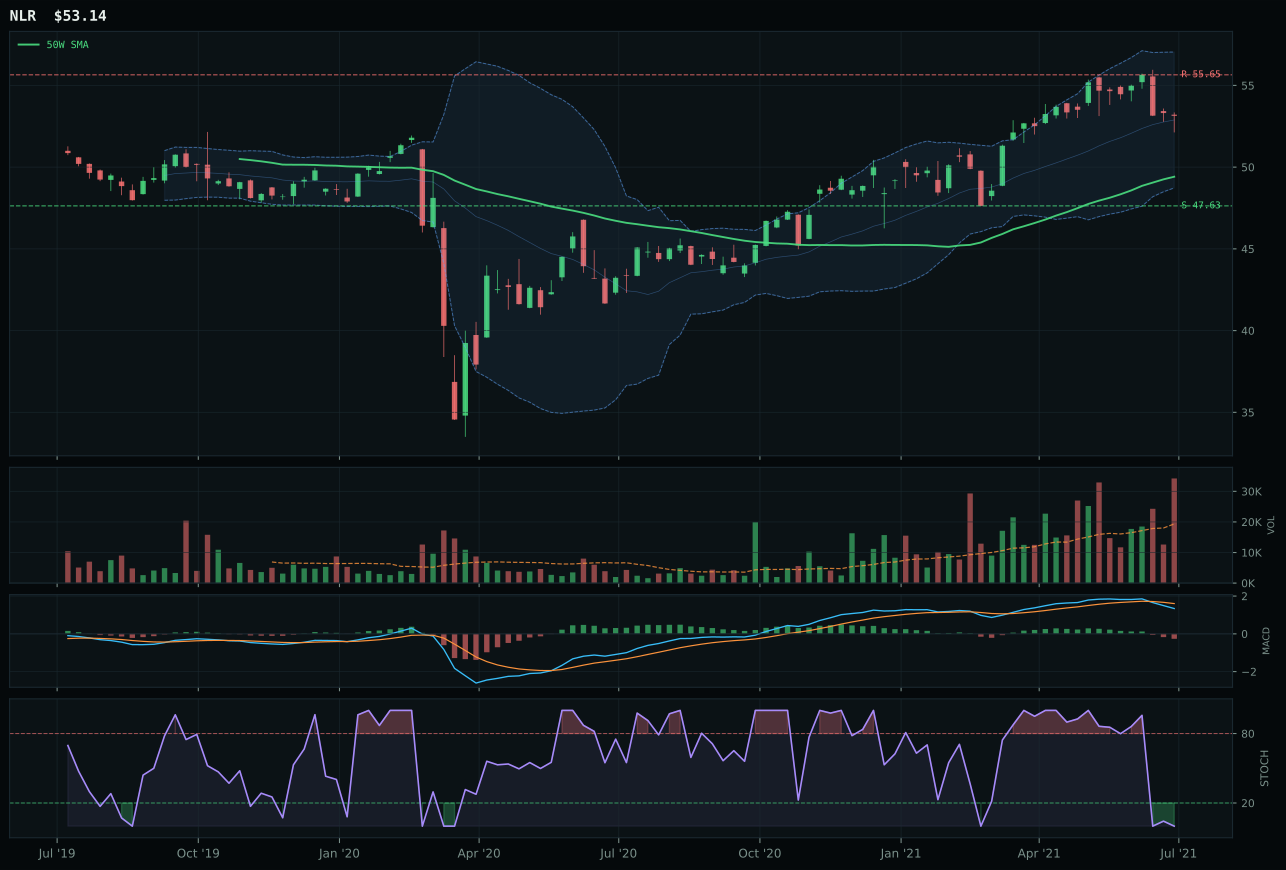
NLR has a neutral structure profile with -7.1% 13-week relative strength versus SPY.
A failed hold above support would weaken the setup.
Tracked, but not top-2 eligible because: .
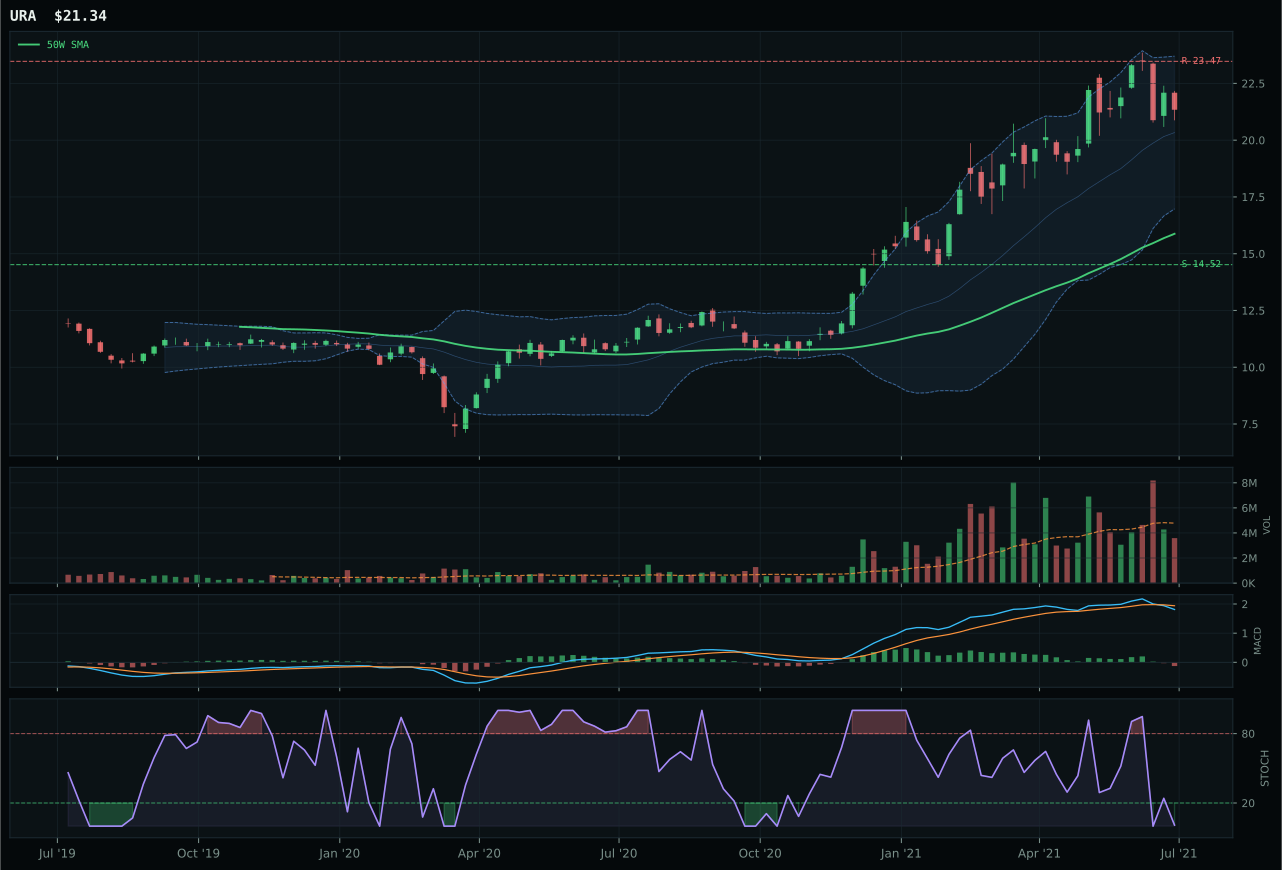
URA has a vertical extension profile with 0.6% 13-week relative strength versus SPY.
A failed hold above support would weaken the setup.
Actionable but governed by invalidation levels.
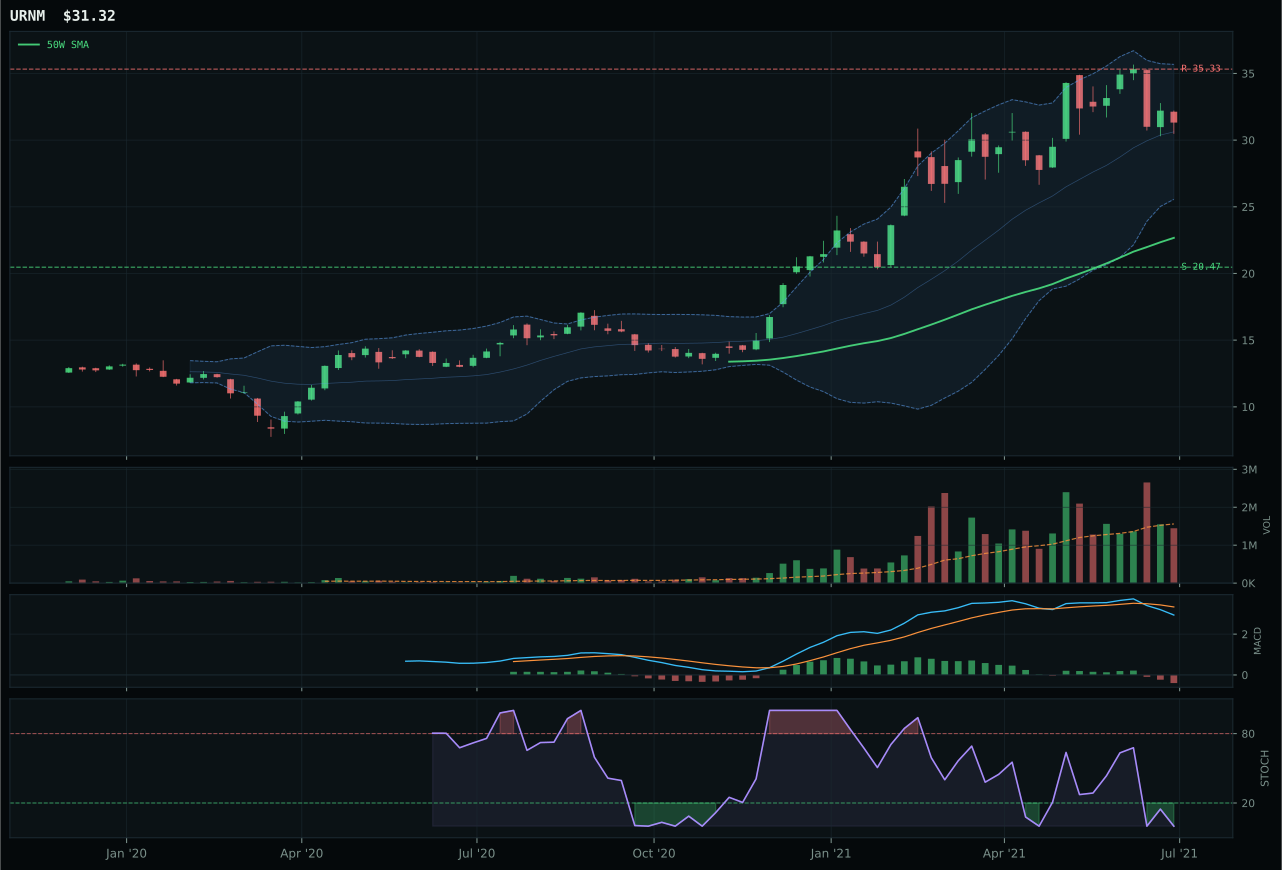
URNM has a vertical extension profile with -2.0% 13-week relative strength versus SPY.
A failed hold above support would weaken the setup.
Actionable but governed by invalidation levels.
URA wins Nuclear Energy because timing is superior to URNM and NLR despite all three showing weak technical evidence, capturing the representative slot with a 82.8/100 trend score and 48.0/100 timing based on a 34.4% extension that still rates better than URNM's structure. The stochastic RSI is oversold at 0.01, MACD is bearish/weakening, and the four-week return is negative 8.4%—collectively a weak setup—yet the 13-week return of 8.8% and category-relative strength of 2.5% confirm some residual sponsorship. NLR is completely disqualified by a technical evidence score of 0.0/100 (the only candidate in the entire portfolio with this severity), failing on all dimensions except macro. URNM's neutral structure (71.8 vs 71.8 in URA) does not overcome URA's better timing, and the category-relative strength of negative 5.1% in NLR versus 2.5% in URA seals the representative decision in URA's favor.
Nuclear Energy receives 0% allocation this week, excluded from the portfolio despite a category macro fit of 61.0/100 where energy scarcity is active (+9). The category score of 33.0 is too weak to compete with tier-2 contenders; technical evidence in the representative is only 24.9/100, and momentum confirmation across all three candidates is in the 0–29 range, indicating that uranium buyers have exited entirely. The four-week return in URA is negative 8.4%, stochastic RSI is oversold across the basket, and volume participation is thin. While macro support for nuclear energy as a carbon-free baseload hedge is real, the current technical breakdown—particularly NLR's 0.0/100 technical evidence—signals that this narrative has not converted to real capital inflows yet. For Nuclear to earn a tier-2 position (5%), URA must stabilize above support at 14.52, MACD must cross bullish, and category-relative strength must recover above 0%—none of which have occurred. This category is held in reserve pending technical confirmation of the macro thesis.
AI — SMH
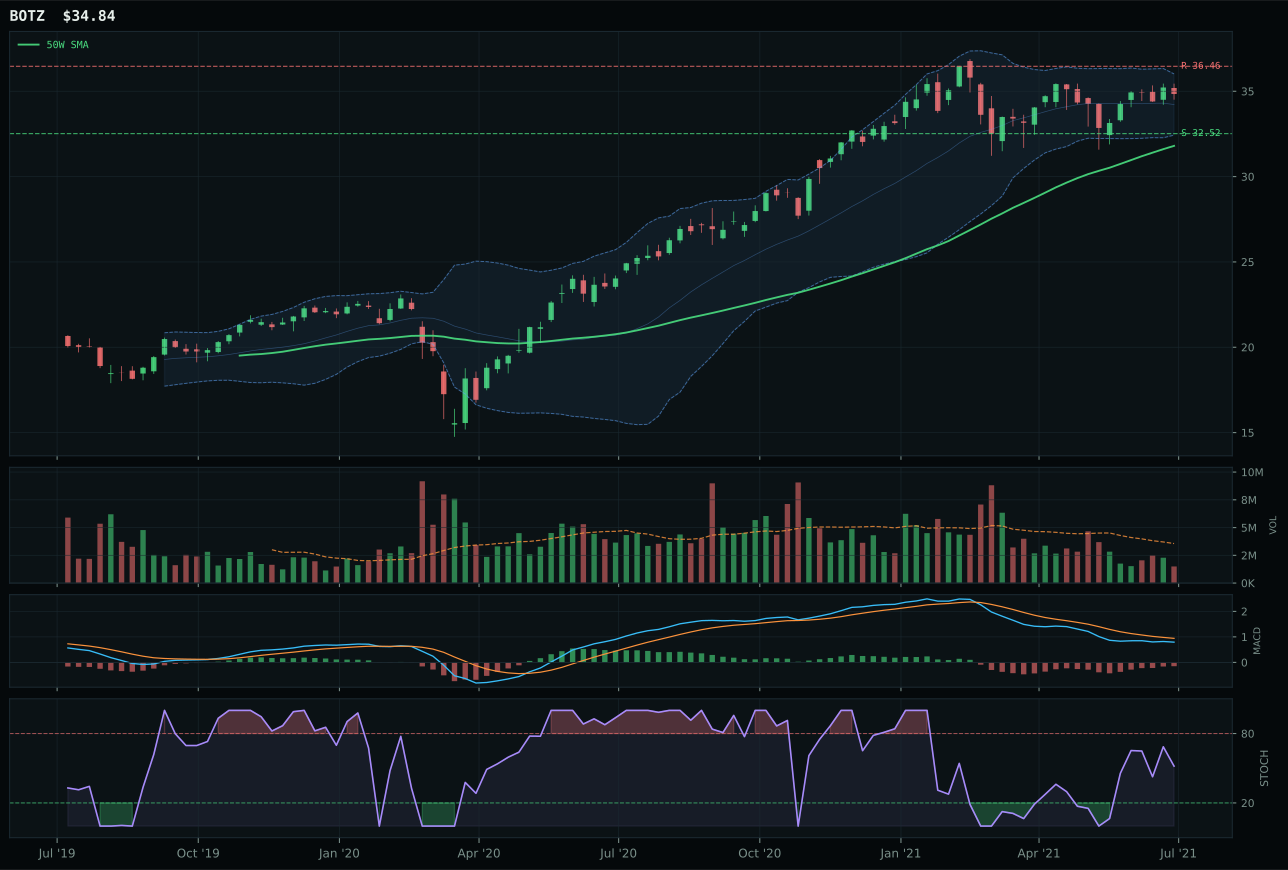
BOTZ has a neutral structure profile with -5.9% 13-week relative strength versus SPY.
A failed hold above support would weaken the setup.
Actionable but governed by invalidation levels.
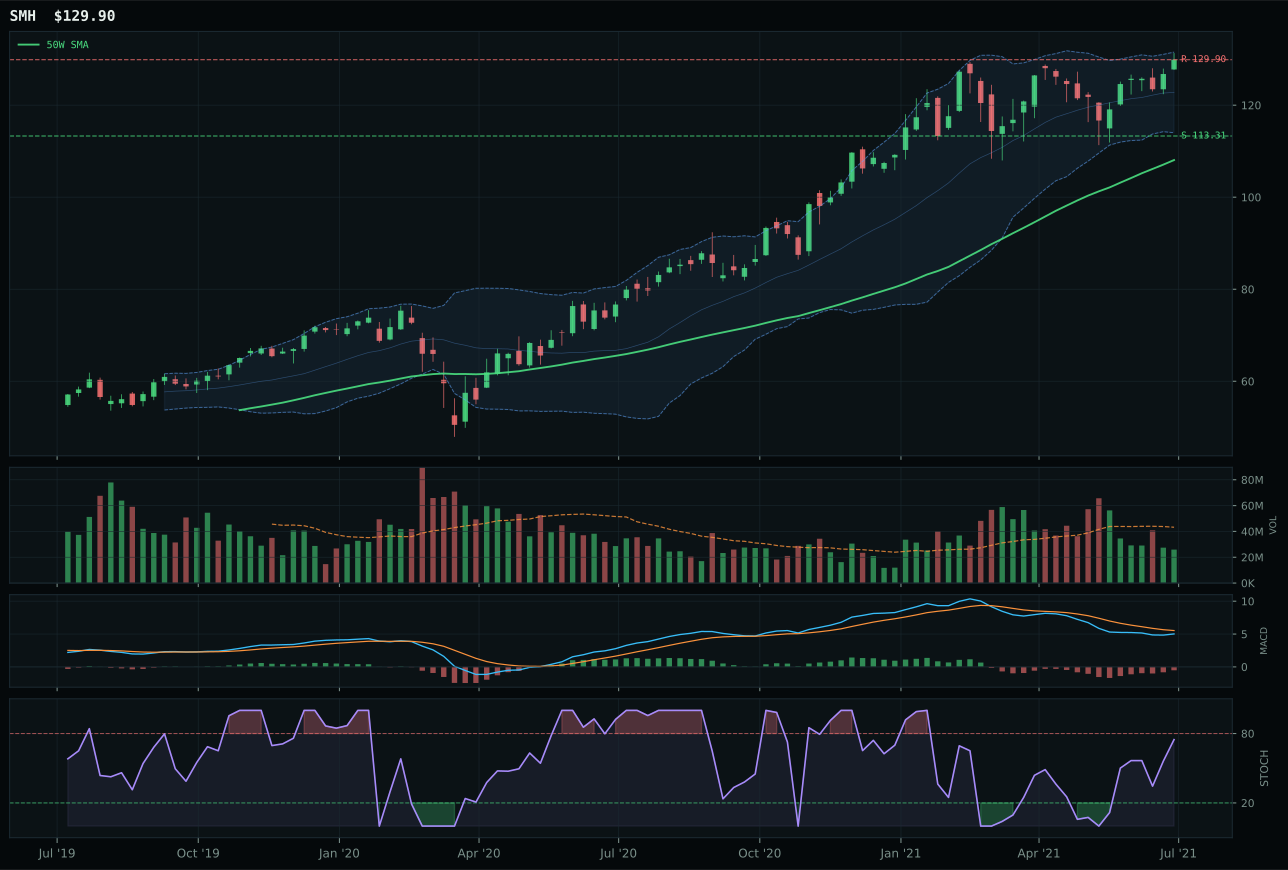
SMH has a vertical extension profile with -5.6% 13-week relative strength versus SPY.
A failed hold above support would weaken the setup.
Actionable but governed by invalidation levels.
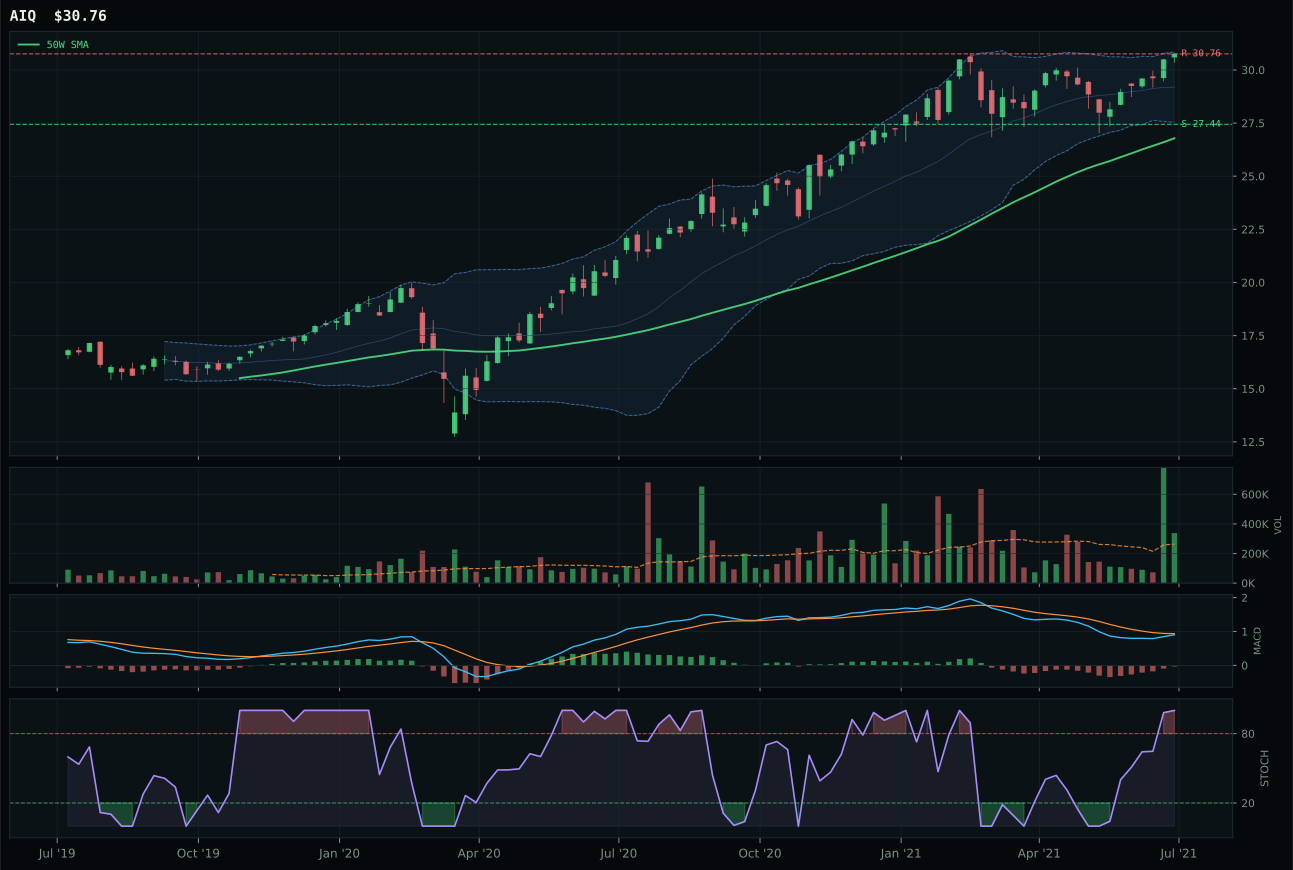
AIQ has a neutral structure profile with -2.3% 13-week relative strength versus SPY.
A failed hold above support would weaken the setup.
Tracked, but not top-2 eligible because: .
SMH wins the AI category by a narrow margin despite being structurally weakest among the three candidates, capturing the representative slot on the basis of better category-relative timing. The 20.2% extension above the 50-week moving average is punishing for entry, and the 13-week return of 2.7% combined with negative 5.6% SPY relative strength confirms that semiconductor strength has faded relative to the broad market rally. Stochastic RSI sits at 0.75 in the rising mid-zone, which offers a technical crumb of hope, but MACD is bearish and improving, not yet bullish—a distinction that matters when chips are extended. BOTZ, the runner-up, actually has a stronger composite score (67 vs 58) and better risk/reward setup (56 vs 47), but its stochastic RSI is falling and neutral, and cleanliness is worse (67.7 vs 71.8), pushing the decision narrowly to SMH despite inferior fundamentals.
AI receives 0% allocation this week, excluded entirely from the portfolio as it ranked 9th or 10th among eligible categories. The category score of 32.4 reflects severe technical deterioration masked by a still-positive macro fit of 42.0; credit stress is active and penalizing growth, while the absence of a bullish MACD or meaningful volume confirmation signals that any recent strength is bounce, not accumulation. The reasoned ETF proof order (BOTZ 53.3, SMH 48.6, AIQ 44.2) reveals an inverted basket where even the top-ranked name trails the overall category threshold for inclusion. Semiconductor buyers are stepping back, robotics momentum has rolled over, and the category cannot overcome a transition-period macro regime where growth capex is under scrutiny. For AI to earn a position again, either momentum confirmation must return through fresh volume and MACD bullish crossover, or category relative strength must stop deteriorating against SPY.