
2021-06-25
Informational purposes only. The content in this report, including allocations, analysis, and commentary, is provided solely for informational and educational purposes. It does not constitute financial advice, investment advice, trading advice, or any other type of advice. Past performance does not guarantee future results. Always conduct your own research and consult a qualified financial professional before making investment decisions.
Weekly Allocation
| Ticker | Category | Weight | Role |
|---|---|---|---|
| FSOL | 50% | Overlay | |
| FCG | Traditional Energy | 10% | Top-2 (10%) |
| ILF | Emerging Markets | 10% | Top-2 (10%) |
| IGV | Technology | 5% | Tier-2 (5%) |
| REMX | Industrial Metals | 5% | Tier-2 (5%) |
| SLV | Precious Metals | 5% | Tier-2 (5%) |
| XAR | Defense & Aerospace | 5% | Tier-2 (5%) |
| MOO | Agriculture & Livestock | 5% | Tier-2 (5%) |
| XLU | Utilities & Infrastructure | 5% | Tier-2 (5%) |
Trade Instructions — Monday Open
Sell the tranche from 2021-05-28 (completing its 4-week hold). Buy the new tranche. Instructions show net portfolio changes — same-asset positions cancel, weight changes show the delta.
| Action | Ticker | Instruction |
|---|---|---|
| SELL | FBTC | Sell 50% of FBTC position (reduce 25.00% → 12.50%) |
| SELL | GLD | Sell 33% of GLD position (reduce 7.50% → 5.00%) |
| SELL | COPX | Sell 67% of COPX position (reduce 3.75% → 1.25%) |
| SELL | URNM | Sell entire URNM position (1.25% of portfolio) |
| SELL | CIBR | Sell entire CIBR position (1.25% of portfolio) |
| BUY | ILF | Buy ILF — 6.25% of freed cash (adds 1.25% to portfolio) |
| BUY | FCG | Buy FCG — 6.25% of freed cash (adds 1.25% to portfolio) |
| BUY | IGV | Buy IGV — 6.25% of freed cash (adds 1.25% to portfolio) |
| BUY | FSOL | Buy FSOL — 62.50% of freed cash (adds 12.50% to portfolio) |
| BUY | REMX | Buy REMX — 6.25% of freed cash (adds 1.25% to portfolio) |
| BUY | XAR | Buy XAR — 6.25% of freed cash (adds 1.25% to portfolio) |
| BUY | SLV | Buy SLV — 6.25% of freed cash (adds 1.25% to portfolio) |
Current Portfolio After Trade
Combined holdings across all 4 active tranches. Each tranche is 25% of the portfolio.
| Ticker | % of Portfolio | Weight Bar |
|---|---|---|
| FSOL | 37.50% | |
| FBTC | 12.50% | |
| IGV | 7.50% | |
| GLD | 5.00% | |
| FCG | 5.00% | |
| XLU | 5.00% | |
| ILF | 3.75% | |
| SMH | 3.75% | |
| INDA | 3.75% | |
| REMX | 3.75% | |
| XAR | 3.75% | |
| URA | 2.50% | |
| COPX | 1.25% | |
| ITA | 1.25% | |
| WEAT | 1.25% | |
| SLV | 1.25% | |
| MOO | 1.25% |
Macro Regime — Transition / Mixed
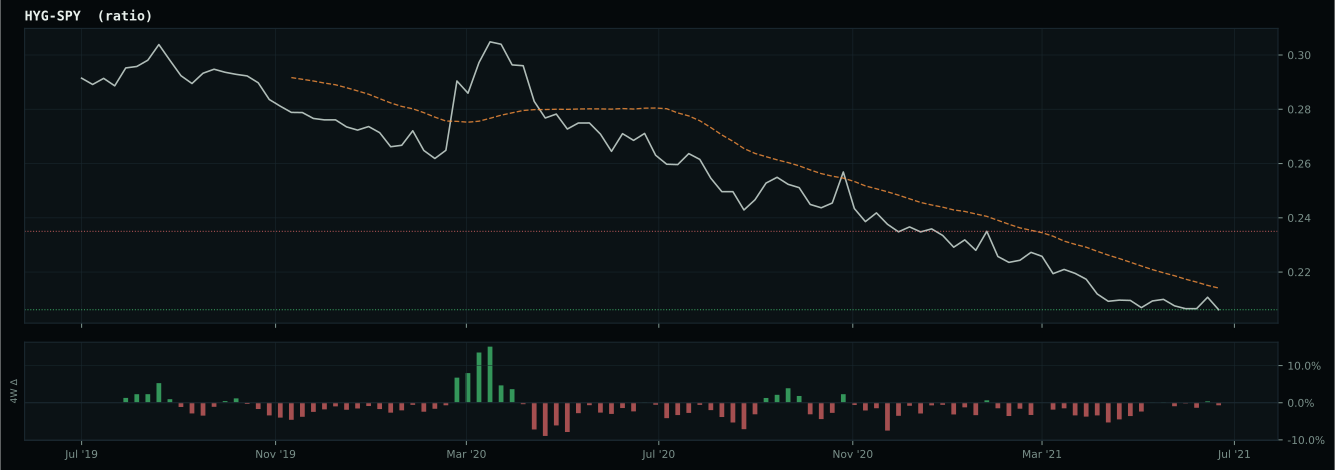
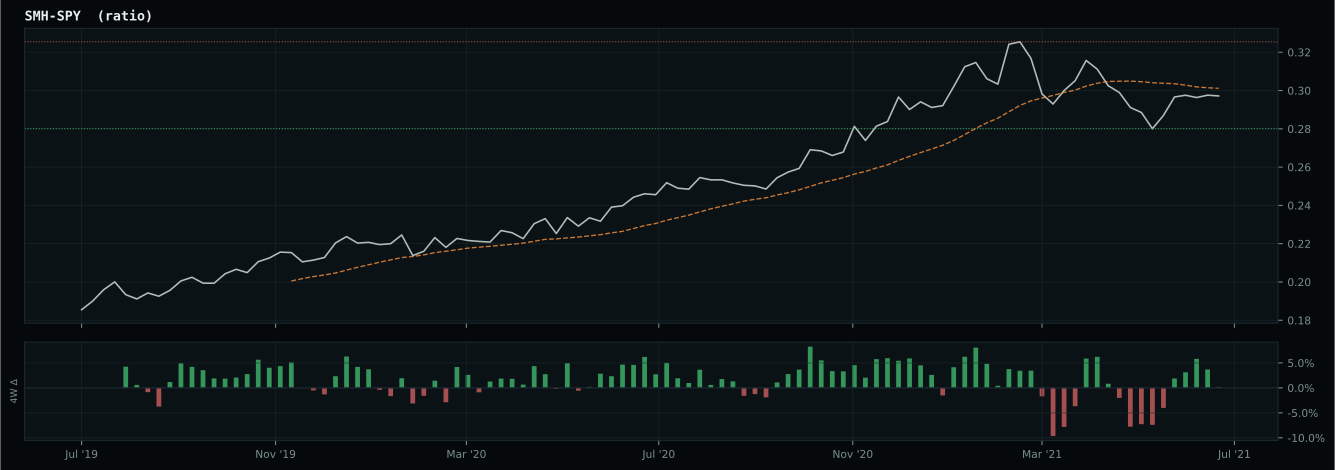
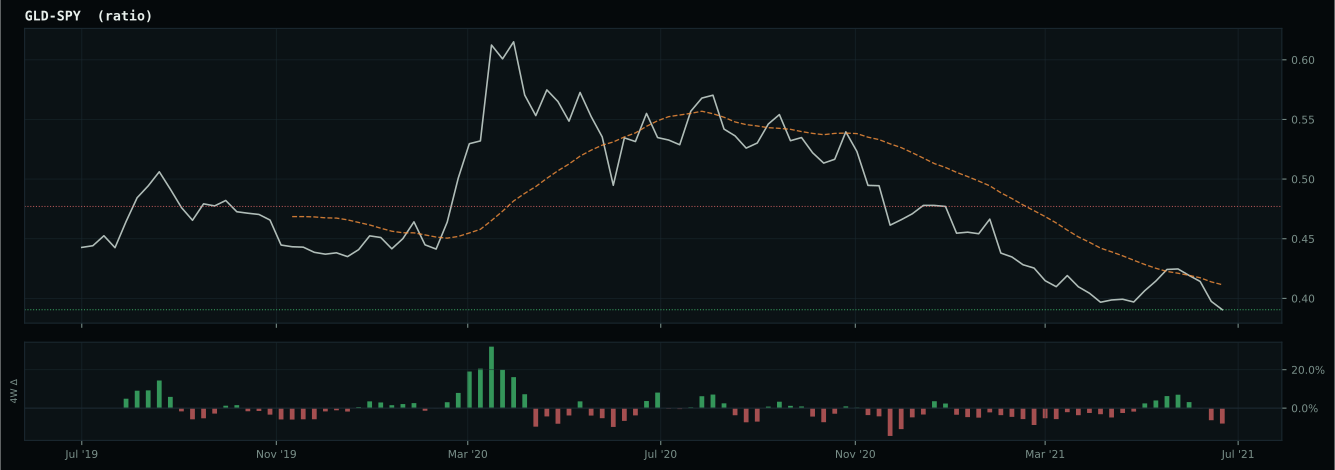
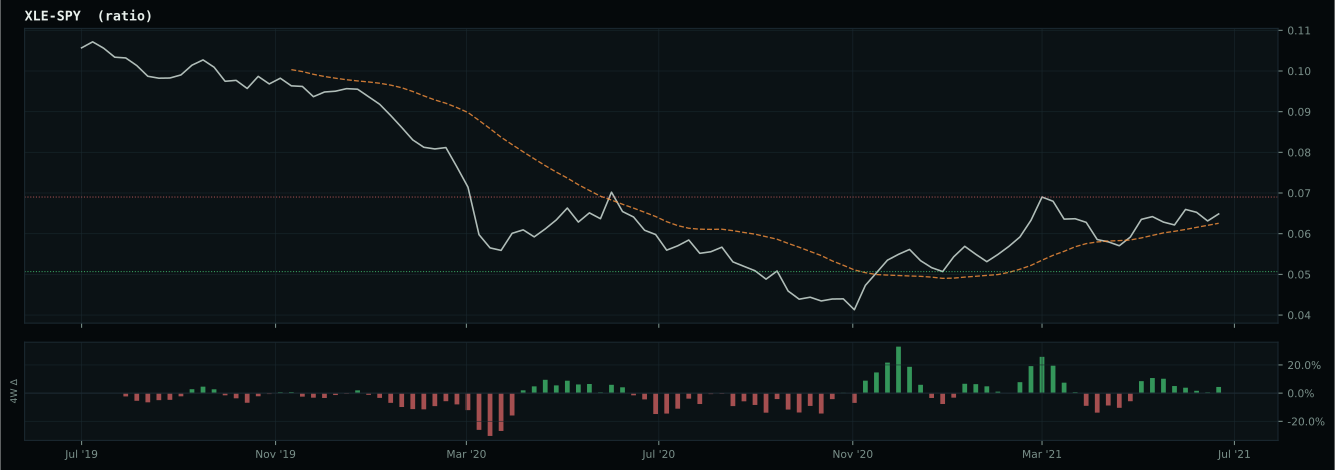
Macro Evidence Charts
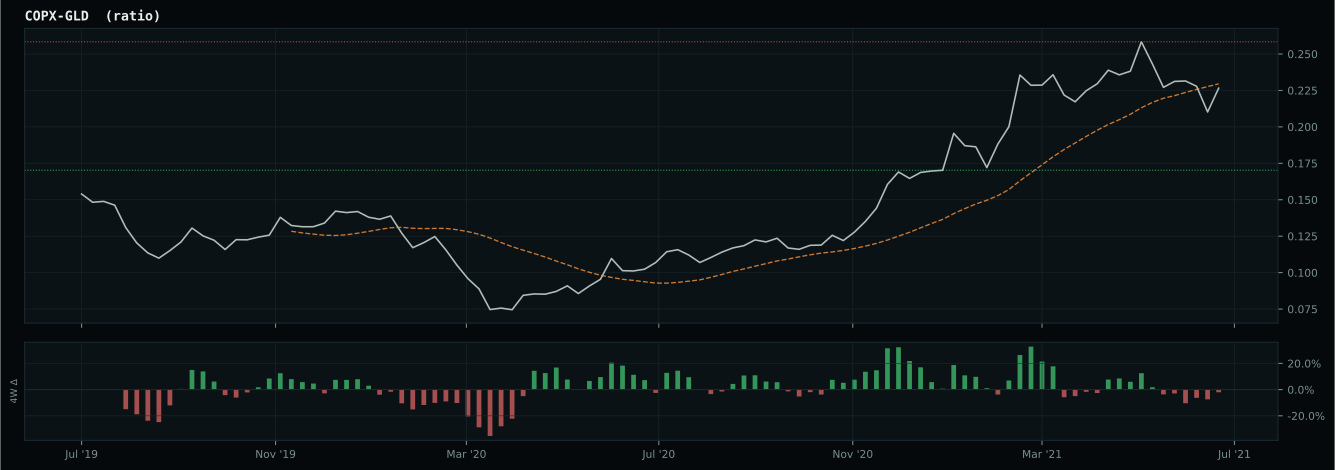
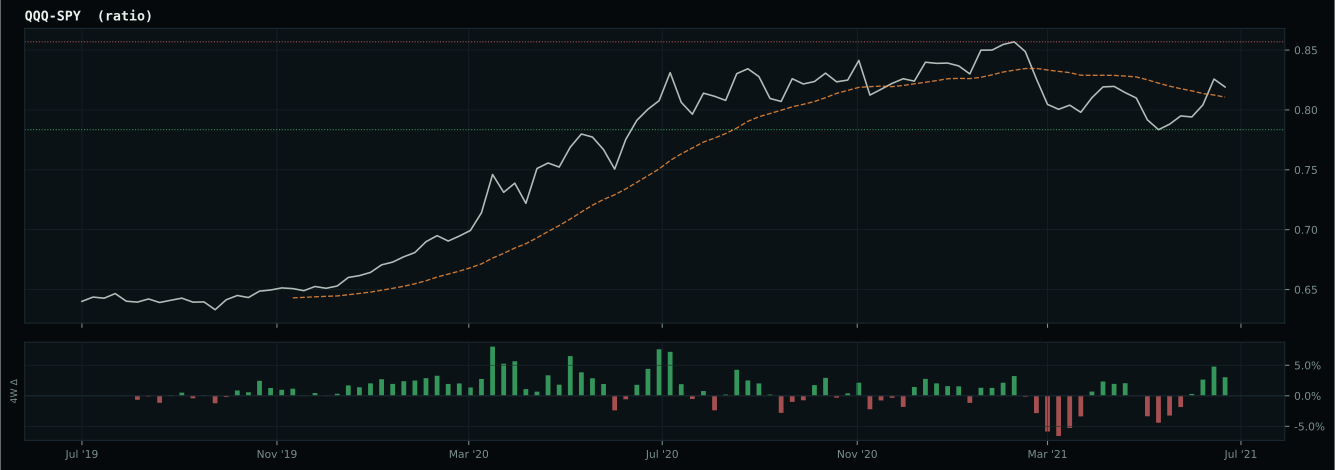
Market-implied signals behind the macro regime scores. Each ratio compares two assets; the direction and slope of the ratio is what the macro engine reads.
Crypto Regime — AltSeason
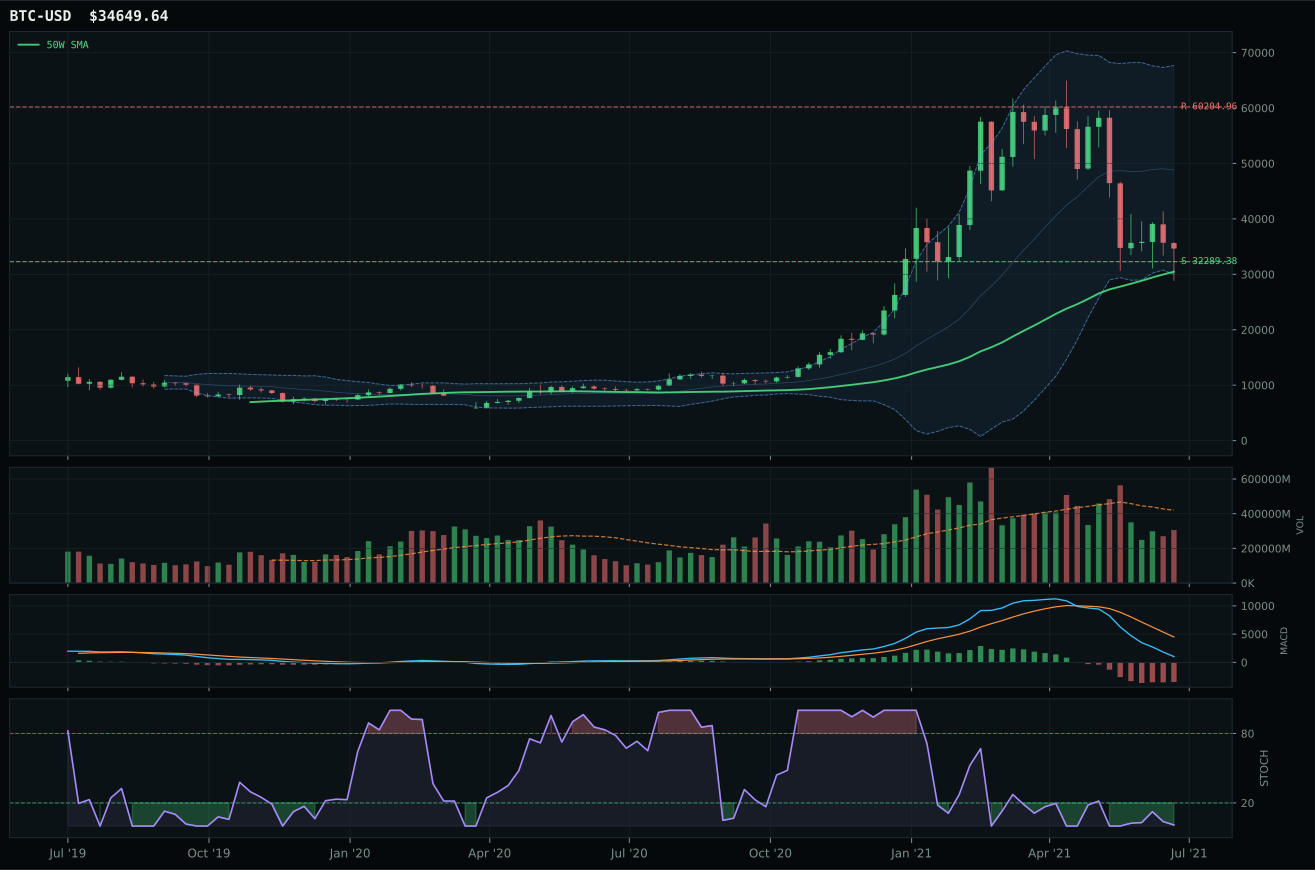
ValueBTC not armed: BTC has not made the first post-breakdown touch of the 200W buy zone after losing the 50W
TrendBTC confirmed: 2 consecutive closes above rising/flat 50W SMA
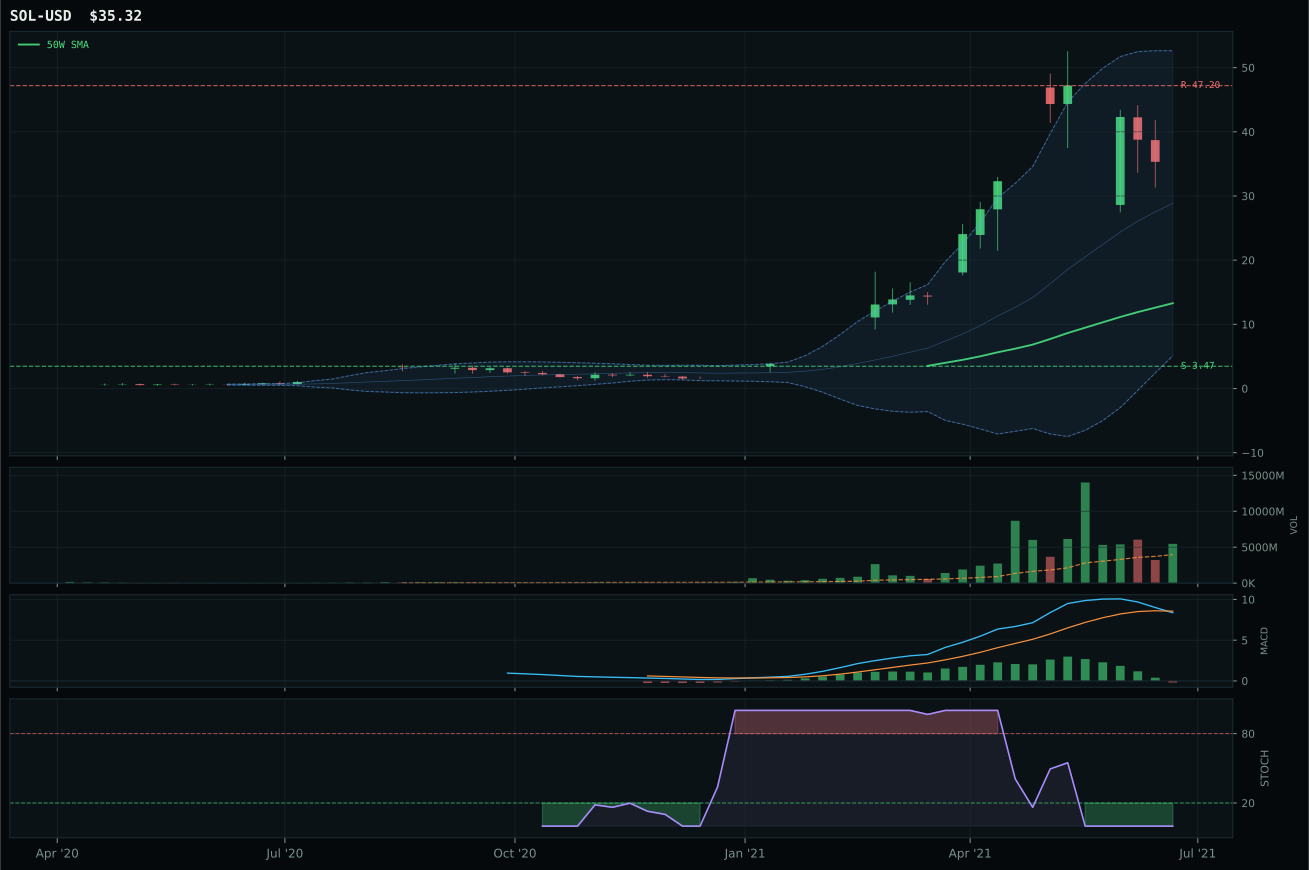
all available AltSeason conditions pass; missing optional confirmations skipped
Category Rankings
| Rank | Category | Winner | Score | Alloc | 4W Ret | Peers (4W) |
|---|---|---|---|---|---|---|
| 1 | Traditional Energy | FCG | 74.7 | 20% | -16.05% | XOP -17.6% · XLE -11.7% |
| 2 | Emerging Markets | ILF | 59.1 | 20% | -6.24% | IEMG -6.5% · INDA -0.1% |
| 3 | Technology | IGV | 55.3 | 10% | +2.85% | CIBR +4.3% · XLK +5.7% |
| 4 | Industrial Metals | REMX | 53.1 | 10% | +25.04% | PICK +0.7% · COPX -3.3% |
| 5 | Precious Metals | SLV | 49.0 | 10% | -3.63% | GLD +1.1% · GDX -3.7% |
| 6 | Defense & Aerospace | XAR | 47.0 | 10% | -7.47% | ITA -4.8% · ROKT -6.2% |
| 7 | Agriculture & Livestock | MOO | 43.8 | 10% | -0.13% | WEAT +2.9% · VEGI -2.9% |
| 8 | Utilities & Infrastructure | XLU | 43.3 | 10% | +2.09% | PAVE -0.5% · IGF -1.4% |
| 9 | Nuclear Energy | URA | 41.2 | 0% | -12.86% | NLR -1.7% · URNM -11.0% |
| 10 | AI | BOTZ | 34.4 | 0% | -4.09% | SMH +0.2% · AIQ +0.8% |
Traditional Energy — FCG
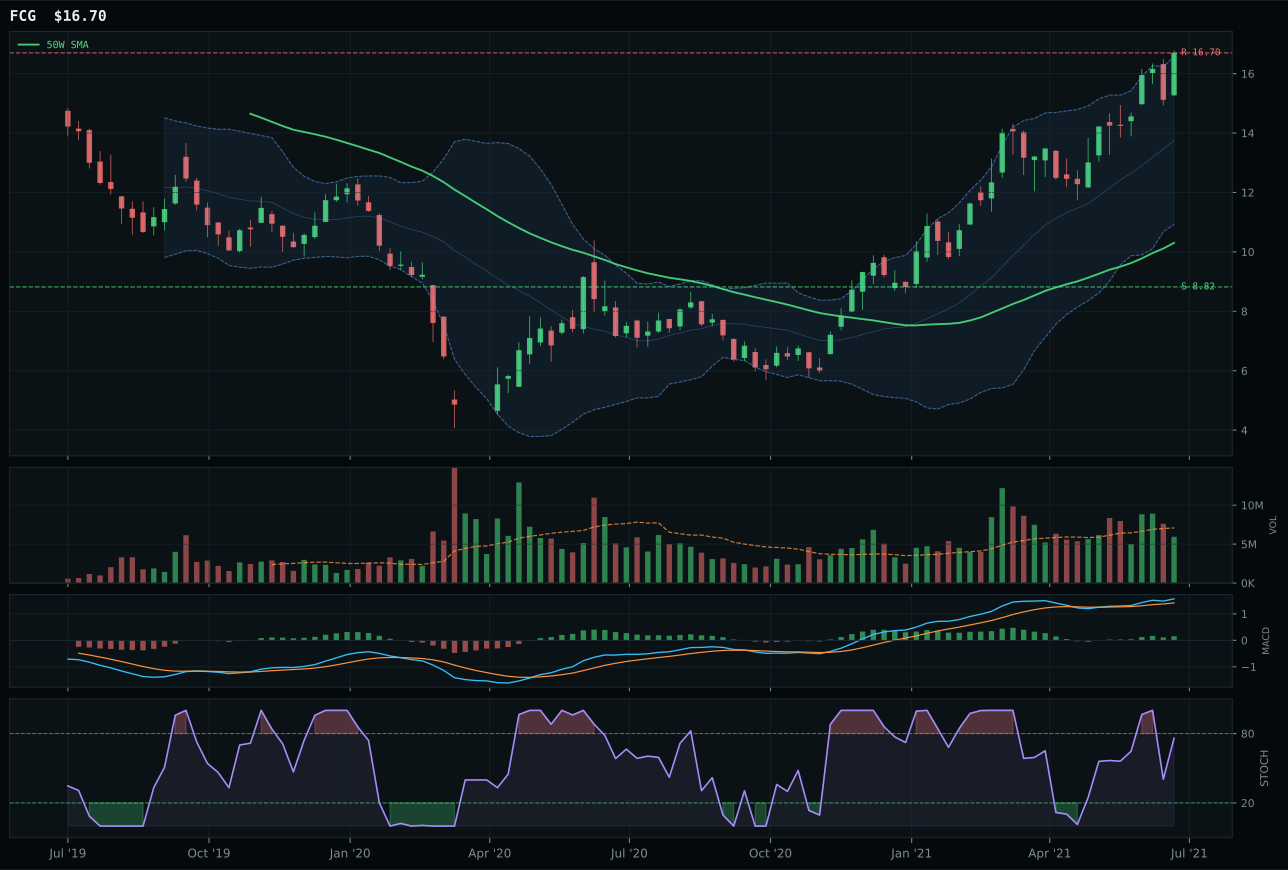
FCG has a vertical extension profile with 18.7% 13-week relative strength versus SPY.
A failed hold above support would weaken the setup.
Actionable but governed by invalidation levels.
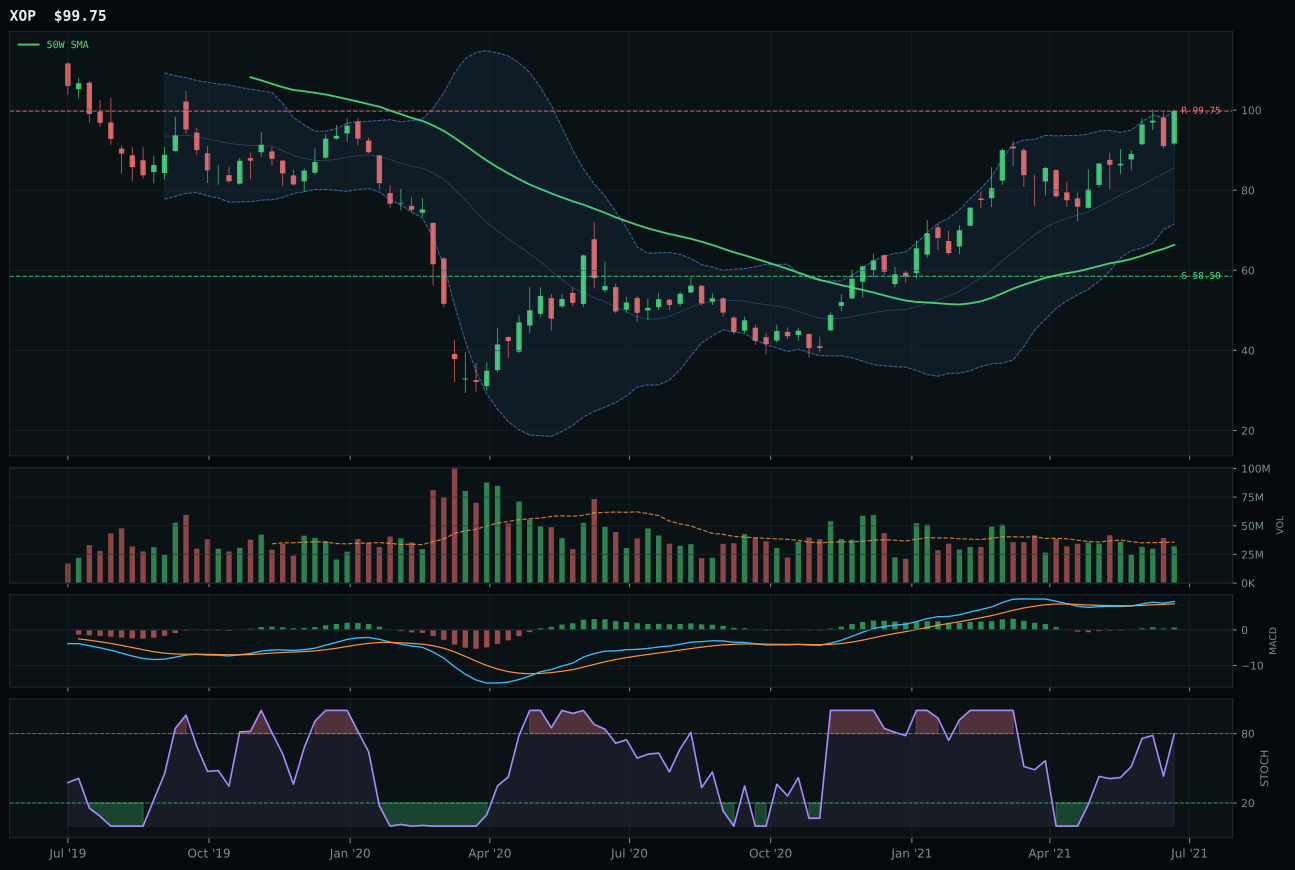
XOP has a vertical extension profile with 12.0% 13-week relative strength versus SPY.
A failed hold above support would weaken the setup.
Actionable but governed by invalidation levels.
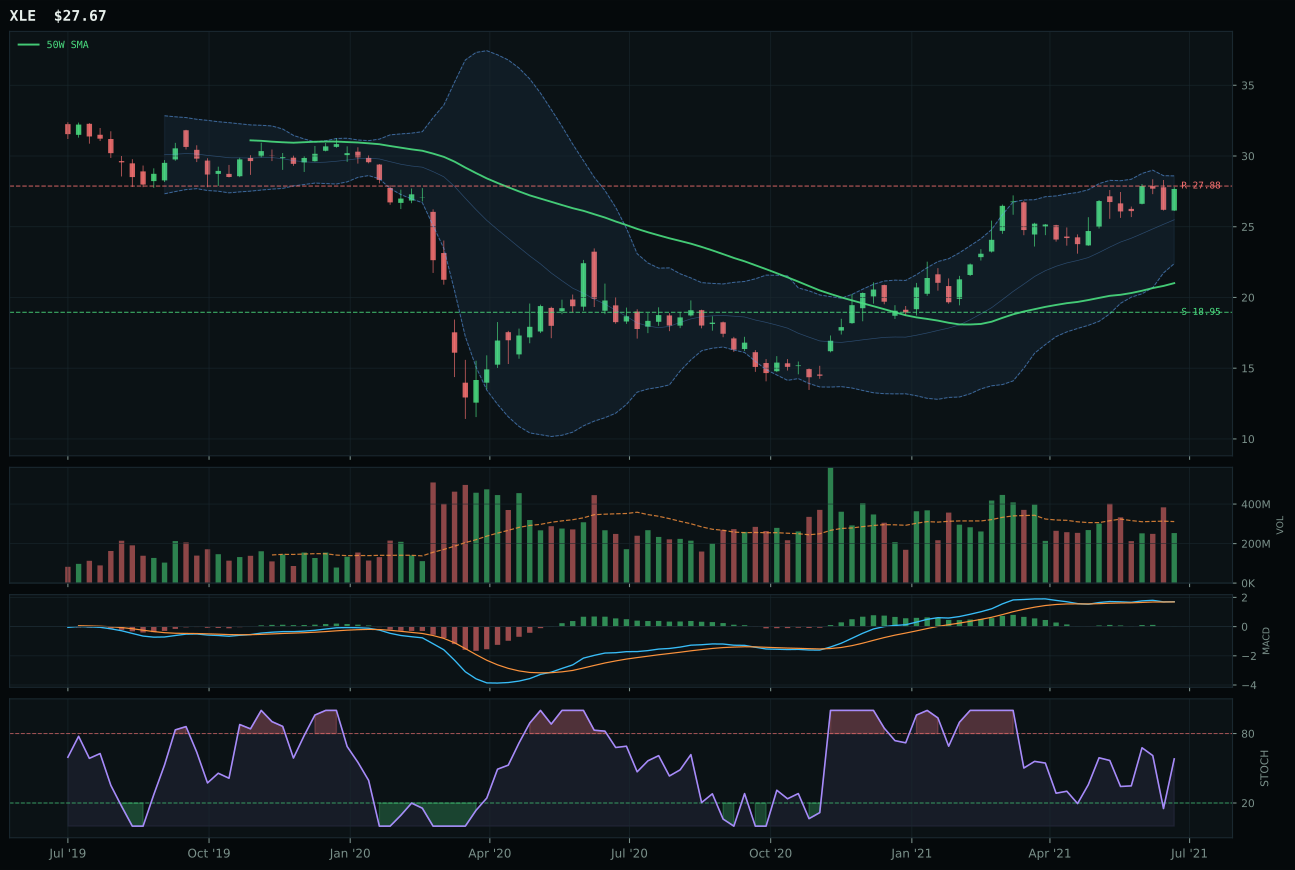
XLE has a vertical extension profile with 2.0% 13-week relative strength versus SPY.
A failed hold above support would weaken the setup.
Actionable but governed by invalidation levels.
FCG wins the category and secures top-2 allocation, capturing the category representative slot over runner-up XOP through 6.7% category-relative strength versus XOP's 0.0%, a clear margin that reflects institutional demand for energy infrastructure over broader exploration exposure. The 26.4% thirteen-week return and 18.7% relative strength versus SPY represent the strongest momentum in the portfolio, yet price is extended 62.1% above the 50W, creating a timing penalty of 45.0. MACD is bullish and improving, stochastic RSI is falling/neutral at 0.76 (not overbought), and the persistence score of 91.7% is the highest in the category, confirming the uptrend is intact and being accumulated across multiple timeframes. XOP's MACD is also bullish and improving with rising mid-zone stochastic RSI, yet its category-relative strength of 0.0% reveals that FCG is capturing the capital flow within the energy basket. Volume is neutral at 0.84x for FCG, supporting the setup without creating distribution risk. Risk/reward is poor at 38.6/100—upside to resistance is 0.0% and downside to support is 89.3%—but the volume-price confirmation of 74.3% and momentum confirmation of 100.0% justify holding through extension.
Traditional Energy is allocated 10% as a top-2 overweight, the highest conviction position in the portfolio alongside Emerging Markets. This placement reflects a 74.7 final category score that combines 73.1% technical evidence with 50.0% macro/narrative fit, weighted at 62%/38%. The macro support is powerful: the category-level macro fit reaches 85.0/100, driven by five active descriptors—energy scarcity (+16), inflation pressure (+10), supply shortage (+9), real asset sponsorship (+7), and credit stress (-7, a modest penalty). The Transition/Mixed regime is neutral to slightly positive for energy relative to growth, and the macro tailwinds are structural rather than transitory. FCG's 13W return of 26.4%, 4W return of 14.7%, and 100.0 momentum confirmation score signal that the uptrend is accelerating and being accumulated. The 10% allocation reflects conviction that energy will continue to benefit from supply constraints and inflation dynamics even as price extends. Risk management is built into the allocation through FCG's poor risk/reward (38.6/100) and extended entry (62.1% above 50W), which cap the position size at 10% rather than higher levels that might be justified by pure momentum. This is a category where macro conviction exceeds technical timing comfort, appropriate for a portfolio positioned into real-asset inflation.
Emerging Markets — ILF
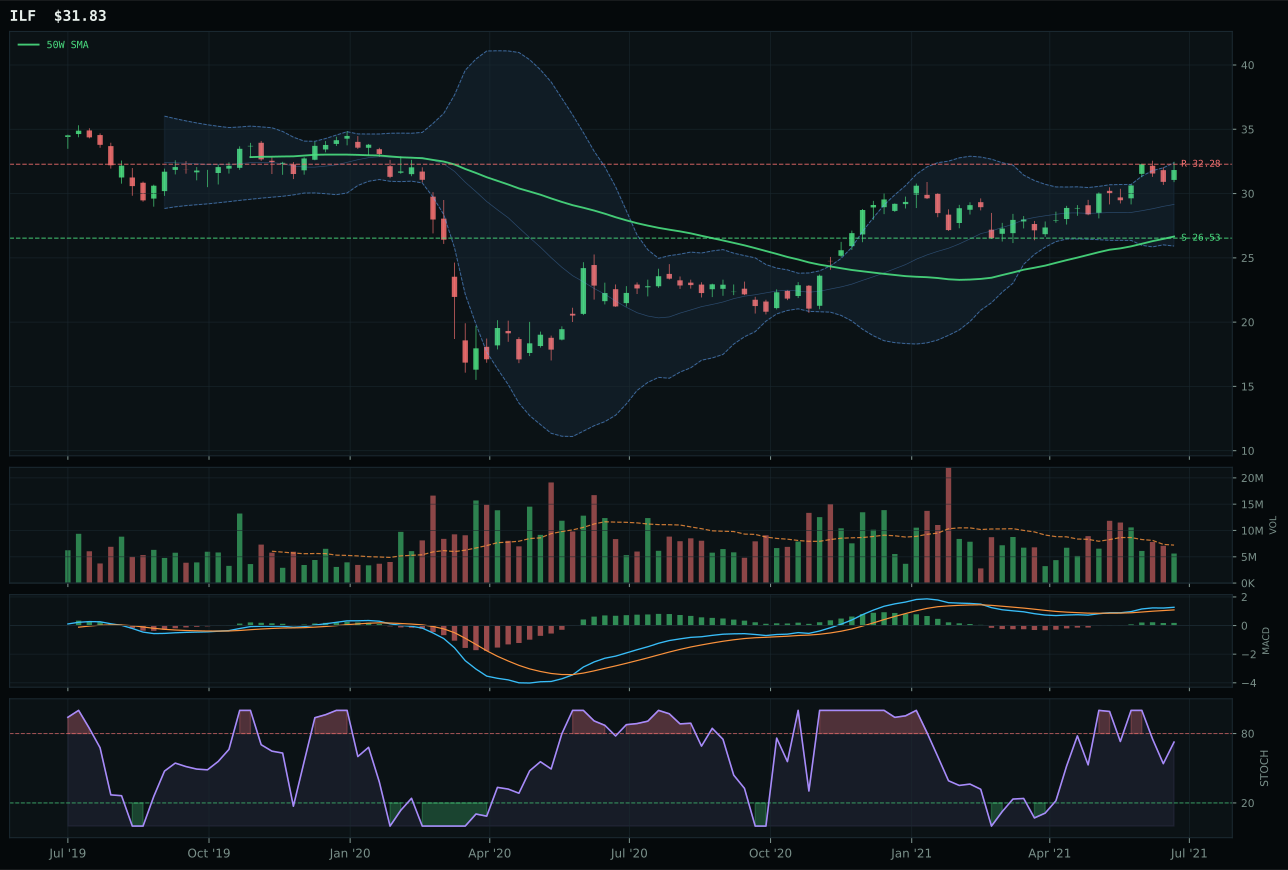
ILF has a vertical extension profile with 9.5% 13-week relative strength versus SPY.
A failed hold above support would weaken the setup.
Actionable but governed by invalidation levels.
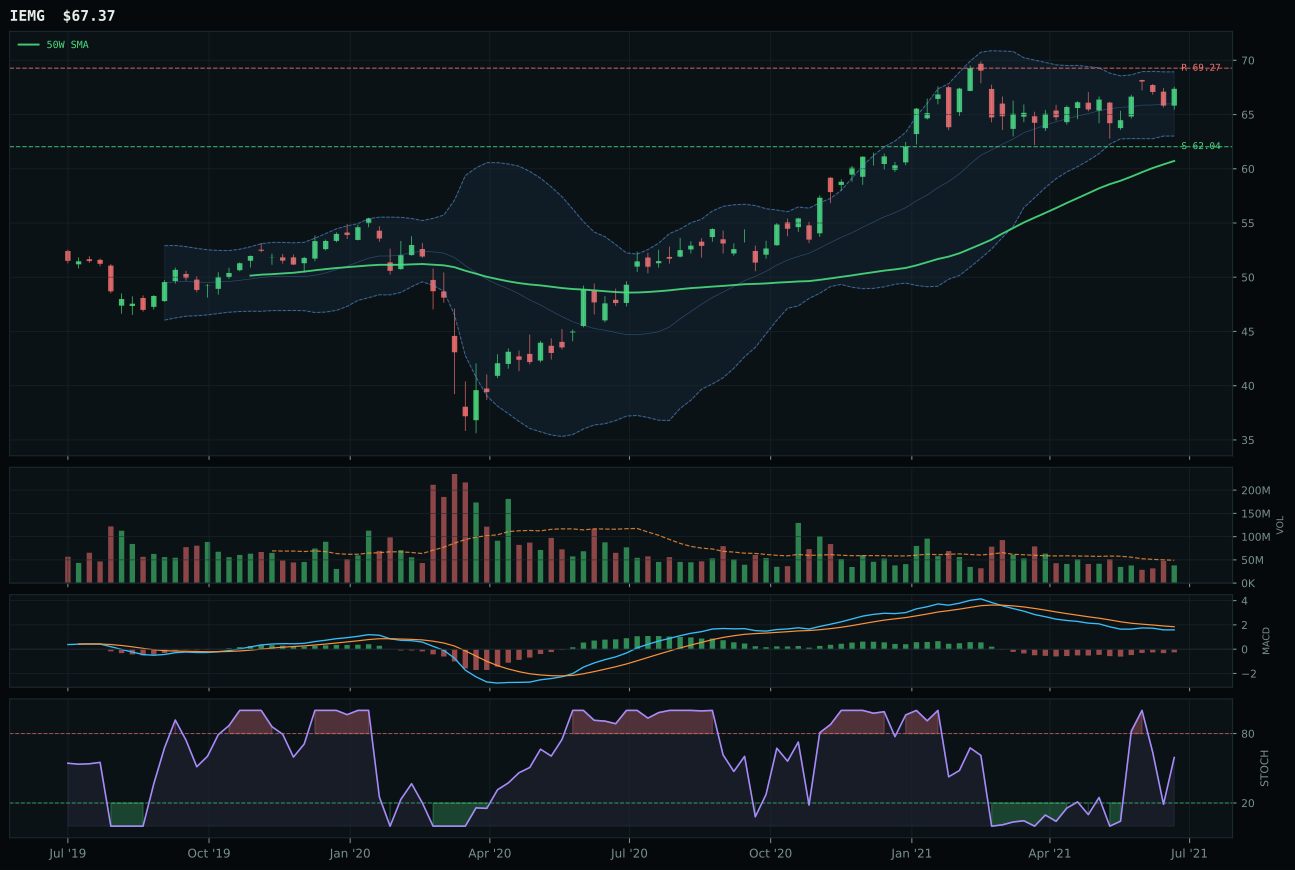
IEMG has a neutral structure profile with -2.9% 13-week relative strength versus SPY.
A failed hold above support would weaken the setup.
Actionable but governed by invalidation levels.
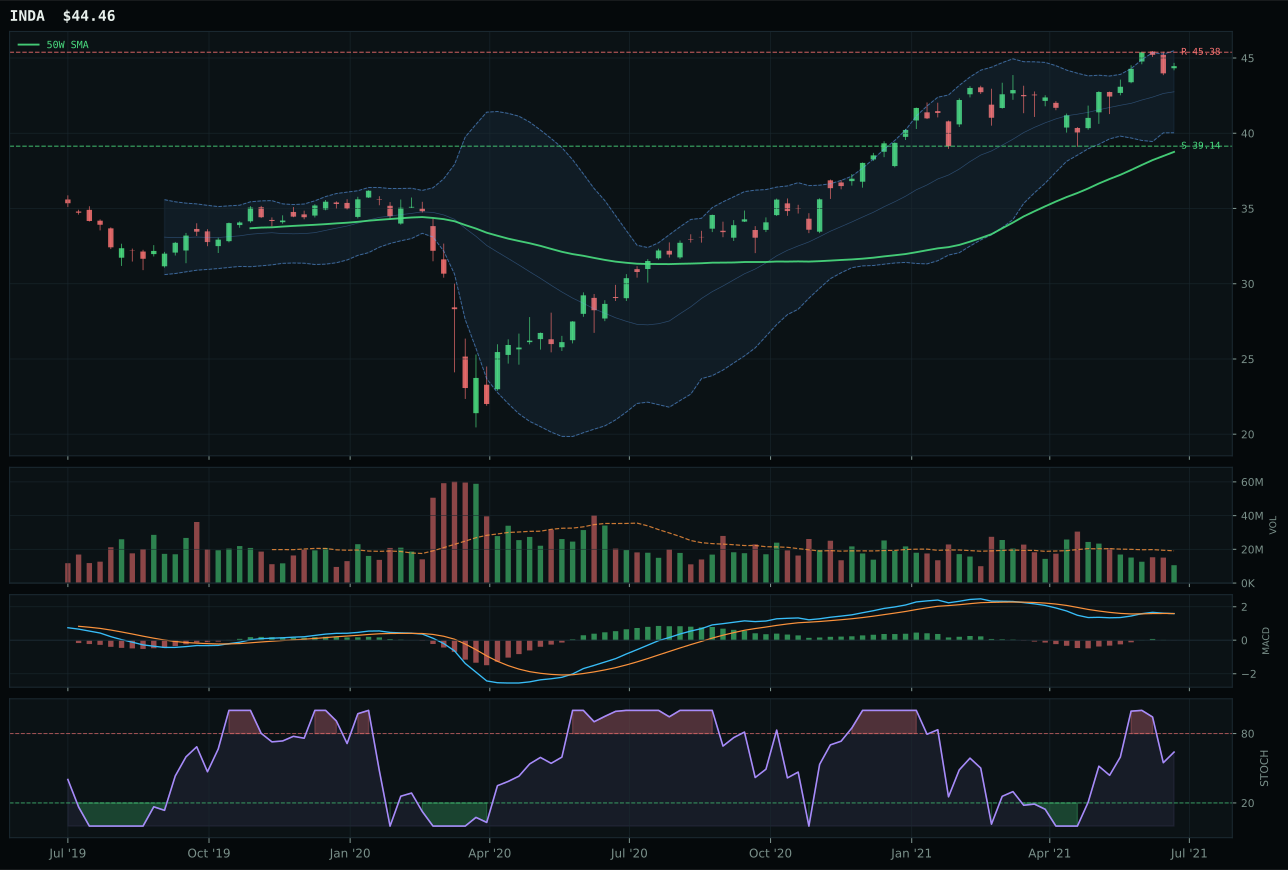
INDA has a neutral structure profile with -3.2% 13-week relative strength versus SPY.
A failed hold above support would weaken the setup.
Actionable but governed by invalidation levels.
ILF wins the category decisively and secures top-2 allocation, besting runner-up IEMG through 12.4% category-relative strength versus 0.0%, coupled with bullish and improving MACD confirmation (IEMG's MACD is bearish but improving). The thirteen-week return is 17.3%, nearly triple IEMG's 4.9%, and the 9.5% relative strength versus SPY confirms that Latin American commodity and value exposure is outpacing broad emerging-market beta. Price is extended 19.4% above the 50W, creating a timing penalty of 45.0, yet the structure is clean with 73.9% score, cleanliness 58.3%, and compression 79.0%, indicating the move is disciplined rather than parabolic. Stochastic RSI is falling/neutral at 0.73, suggesting momentum has peaked but not reversed, while MACD is bullish and improving, confirming that new buyers are stepping in. IEMG's neutral structure, bearish but improving MACD, and 0.0% category-relative strength reveal that broad EM is lagging the Latin America rotation, a critical technical divergence that explains why ILF dominates the category representative decision. Risk/reward is 38.3/100, with only -1.4% upside to resistance and 20.0% downside to support, but volume-price confirmation of 75.5% and persistence of 81.4% confirm the uptrend is being accumulated.
Emerging Markets is allocated 10% as a top-2 overweight, tied with Traditional Energy for the highest conviction positions in the portfolio. The 59.1 final category score combines 78.0% technical evidence for the representative with 54.0% macro/narrative fit, weighted at 62%/38%, creating a balanced conviction picture where technical strength is reinforced by macro support. The macro backdrop includes two powerful active descriptors—em liquidity support (+14) and credit stress (-10, a penalty that is offset by the liquidity support), creating a net-positive regime for emerging-market capital flows relative to the Transition/Mixed baseline. ILF's 17.3% thirteen-week return and 12.4% category-relative strength signal that institutional capital is rotating into Latin America's commodity and inflation-hedge profile, and the bullish/improving MACD confirmation validates that the rotation is ongoing. The 10% allocation reflects conviction that em liquidity support and commodity dynamics will drive further outperformance, with the extended entry (19.4% above 50W) offset by strong volume-price confirmation (75.5%) and persistence (81.4%). This allocation is distinct from Traditional Energy in that it rests more heavily on technical evidence (78.0% vs 73.1%) while receiving slightly less macro support (54.0% vs 85.0%), creating a tighter risk/reward but genuine outperformance conviction. ILF would justify a reduction if category-relative strength fell below 8-10%, signaling that the Latin America rotation is stalling relative to broad EM.
Technology — IGV
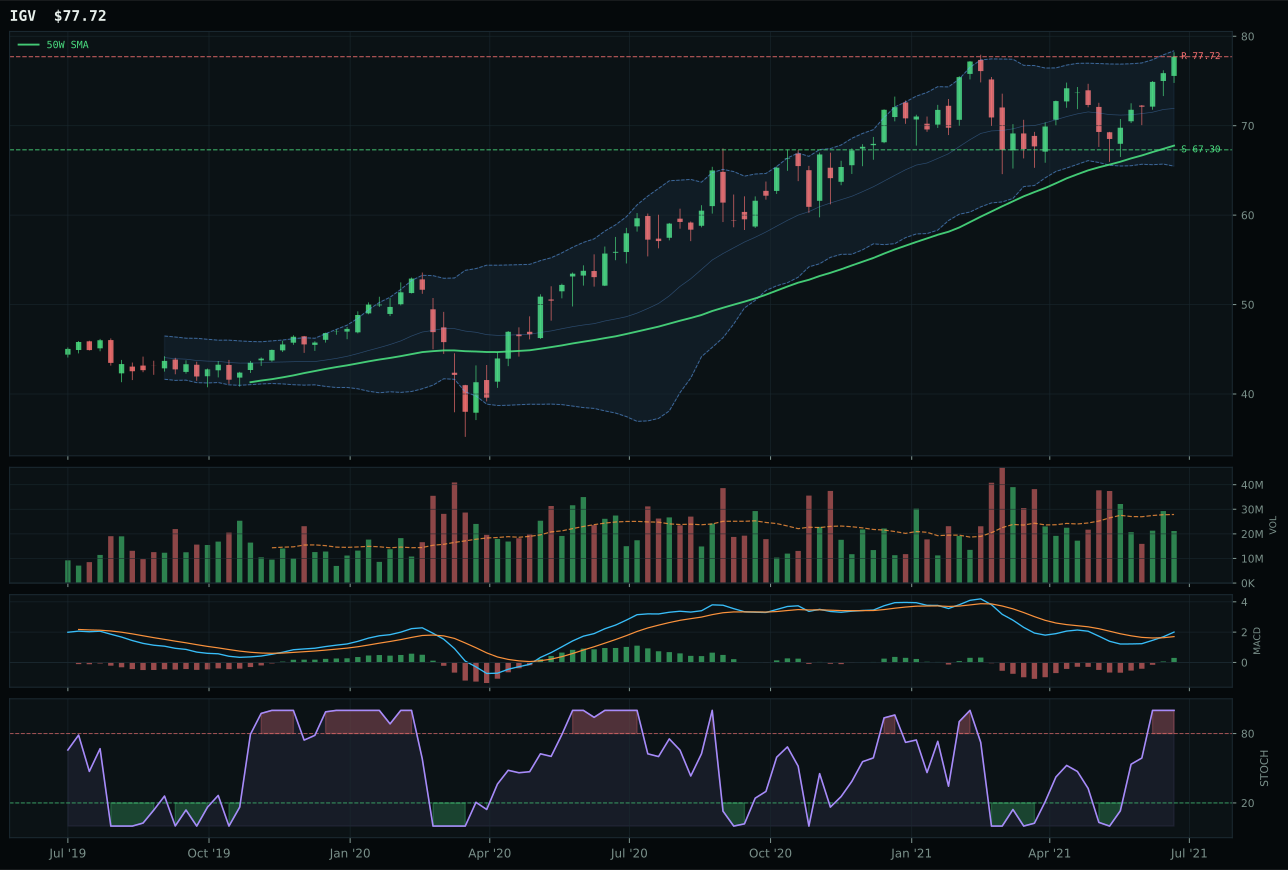
IGV has a neutral structure profile with 7.1% 13-week relative strength versus SPY.
A failed hold above support would weaken the setup.
Actionable but governed by invalidation levels.
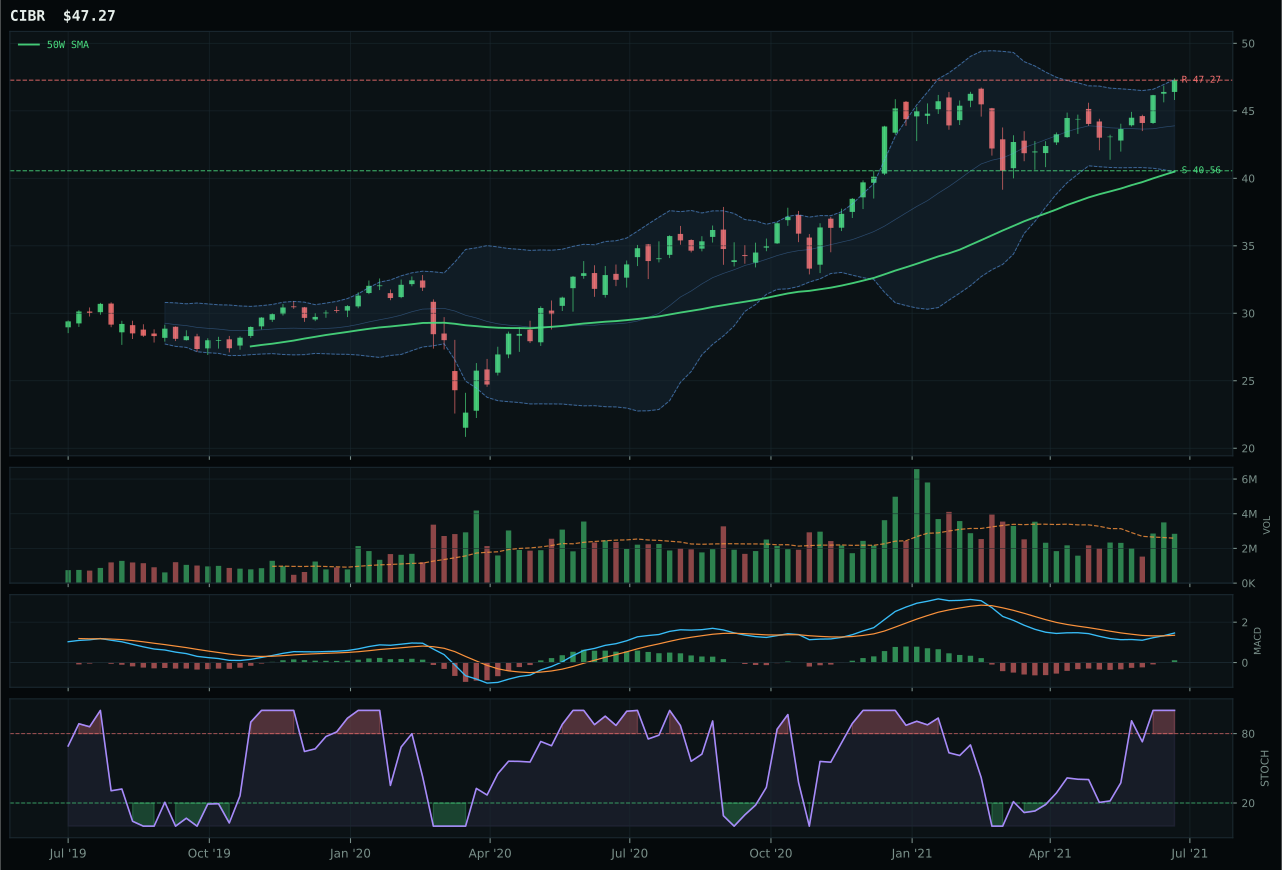
CIBR has a vertical extension profile with 4.8% 13-week relative strength versus SPY.
A failed hold above support would weaken the setup.
Actionable but governed by invalidation levels.
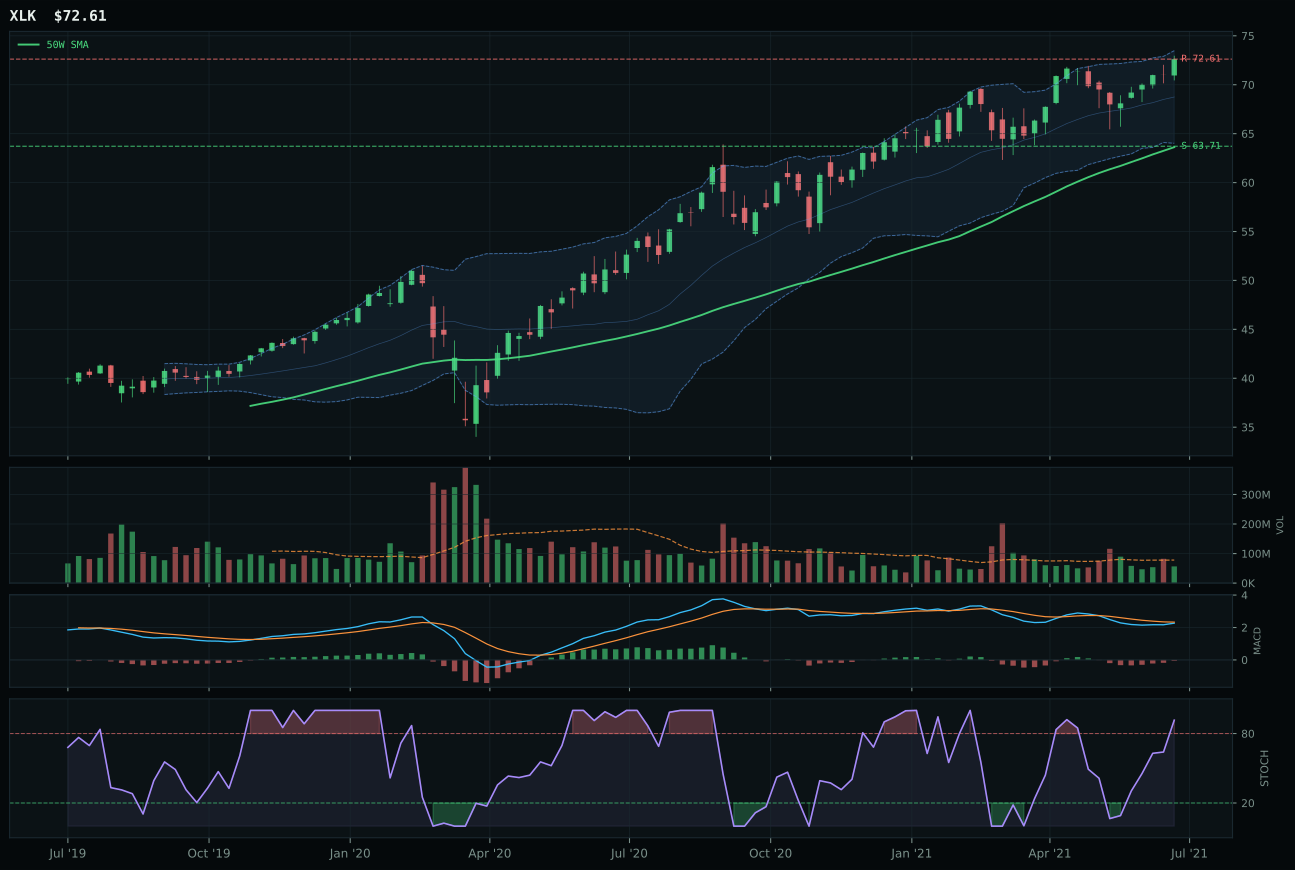
XLK has a neutral structure profile with 1.7% 13-week relative strength versus SPY.
A failed hold above support would weaken the setup.
Actionable but governed by invalidation levels.
IGV wins the category decisively, besting CIBR by 12.2 points through superior timing and category-relative strength that reflects genuine institutional accumulation. The 7.1% relative strength versus SPY, combined with a neutral chart setup and 14.8% thirteen-week return, signals that enterprise software is attracting fresh capital rather than riding stale momentum. CIBR's vertical extension setup, weaker 37.0 timing score versus IGV's 59.0, and 0.0% category-relative strength reveal a crowded entry point where cybersecurity lacks the sponsorship that software commands. Volume at 0.76x the twenty-week average is neutral—not rejecting the move—while MACD is bullish and improving and stochastic RSI sits overbought, meaning the chart has room to extend if buyers keep supporting the 50-week moving average. The risk/reward is tight at 46.3/100, a reflection of price sitting 14.7% above the 50W and 0.0% upside to resistance, but the cleanliness score of 66.7 and compression at 79.2 confirm the structure is holding.
Technology receives 5% allocation as a tier-2 position, ranked third or lower among the ten categories this week. The 55.3 final score reflects technical evidence weighted at 62% against macro/narrative fit at 38%, and that 39.0% category-level macro fit penalizes software exposure in a Transition/Mixed regime where credit stress (active, -7 points) and inflation pressure (active, -4 points) remain headwinds. IGV's own macro fit of 41.0/100 barely exceeds the category average, meaning this is a pure technical play with modest macro tailwinds. For Technology to graduate to top-2 status, the category would need either a sharper macroeconomic pivot away from credit concerns or a meaningful pickup in relative strength that breaks the modest 7.1% SPY advantage into double-digit territory. The current allocation honors the setup's cleanliness without overcommitting to a sector where timing risk (45-59 range for representatives) consistently drags down total conviction.
Industrial Metals — REMX
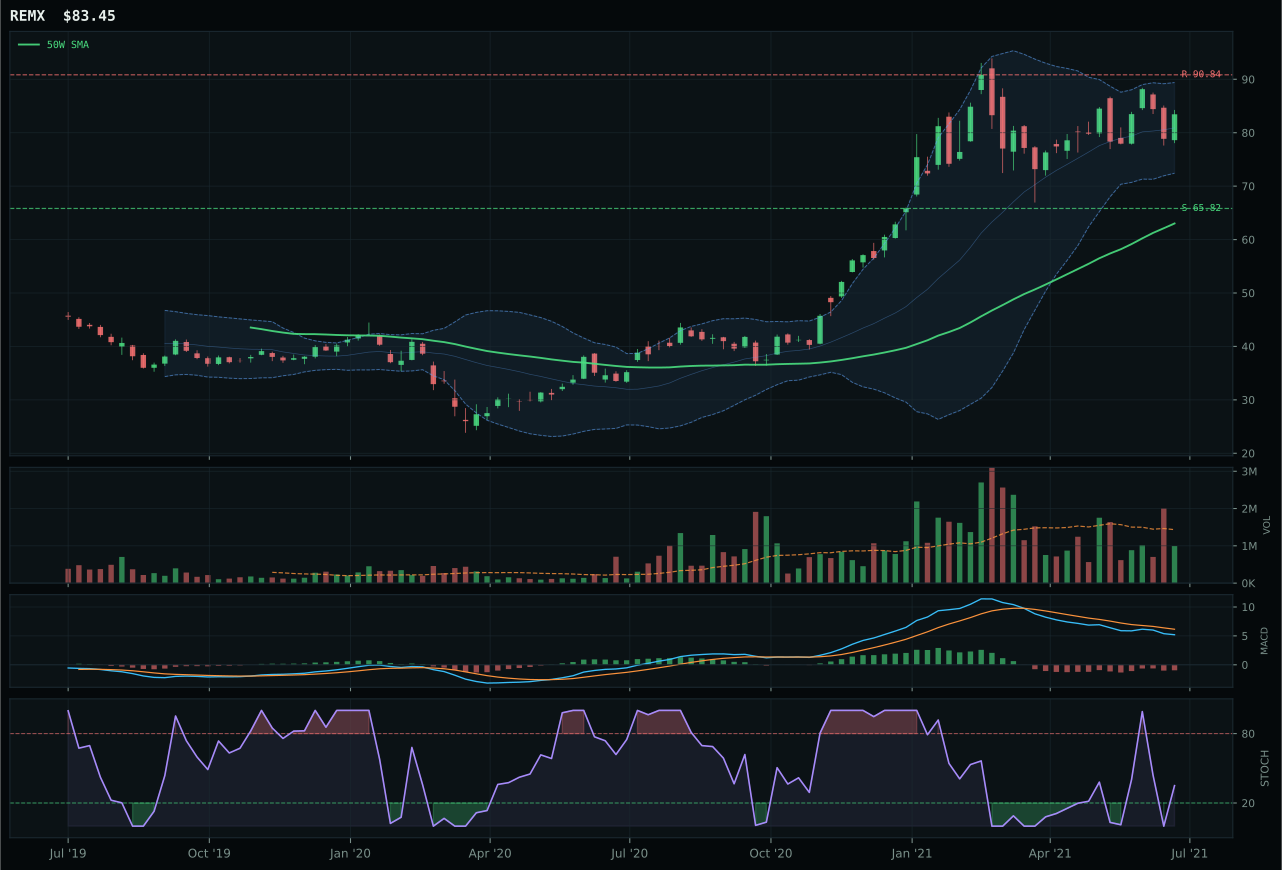
REMX has a vertical extension profile with 6.3% 13-week relative strength versus SPY.
A failed hold above support would weaken the setup.
Actionable but governed by invalidation levels.
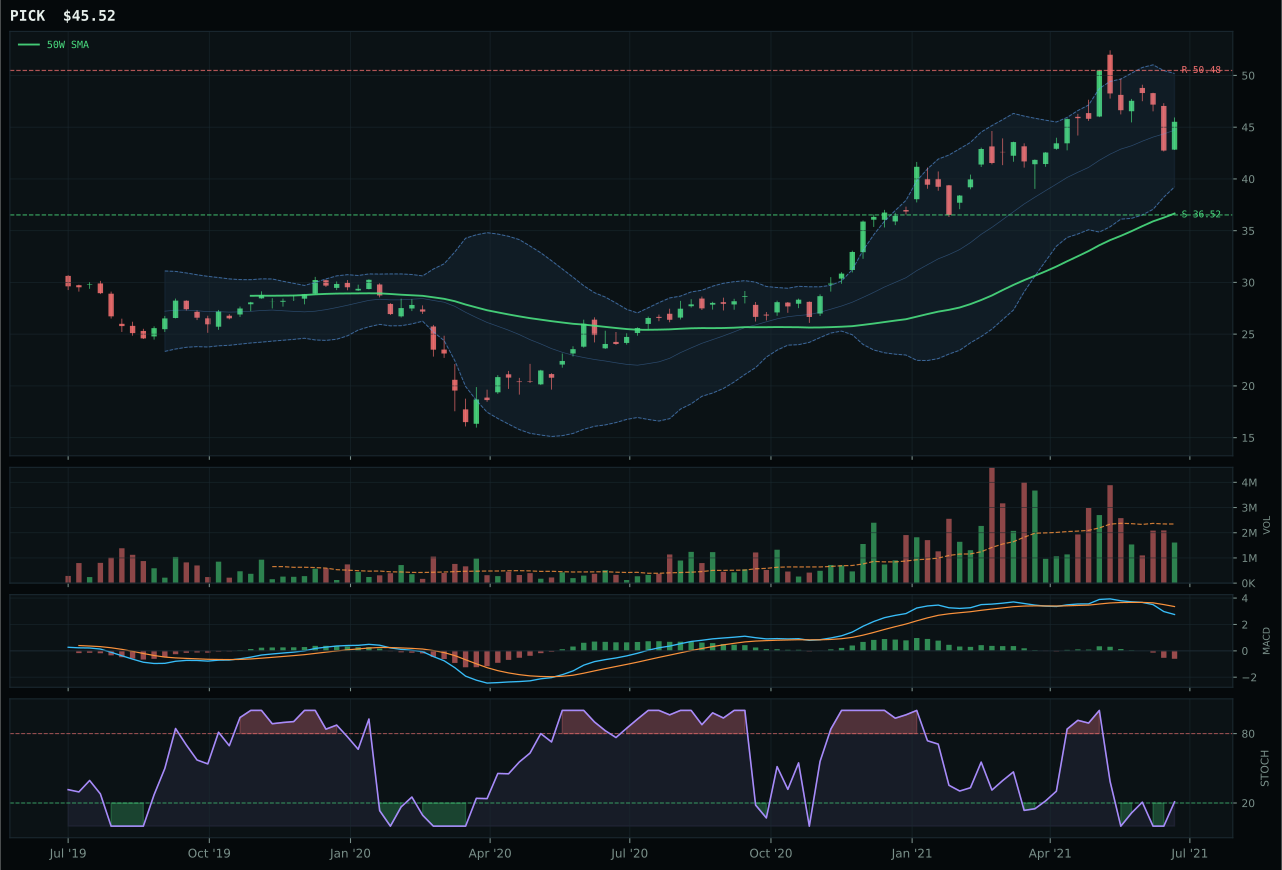
PICK has a vertical extension profile with 1.1% 13-week relative strength versus SPY.
A failed hold above support would weaken the setup.
Actionable but governed by invalidation levels.
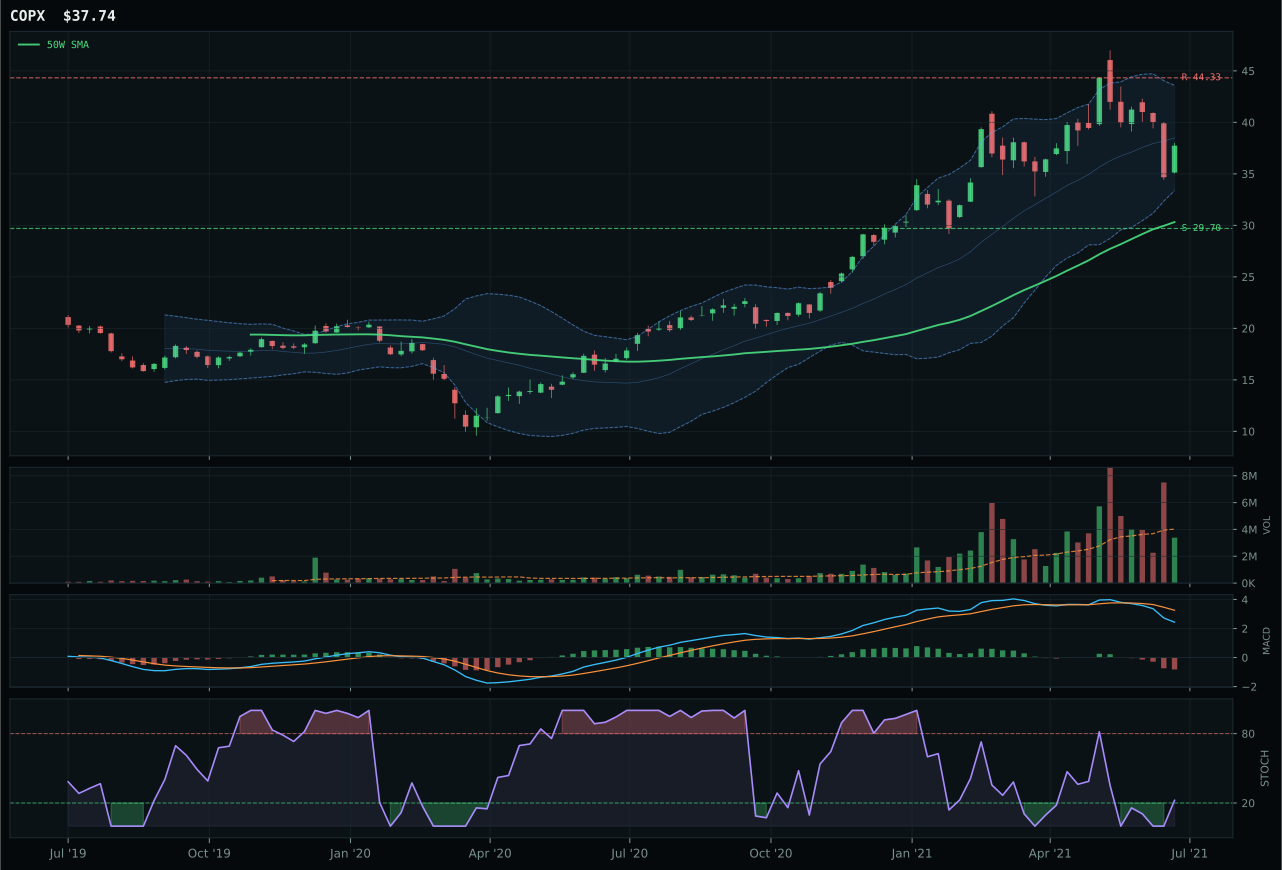
COPX has a vertical extension profile with -0.6% 13-week relative strength versus SPY.
A failed hold above support would weaken the setup.
Actionable but governed by invalidation levels.
REMX captures the category decisively over PICK, winning on the strength of 5.2% category-relative strength versus PICK's 0.0%, a 5-point margin that reflects genuine institutional rotation into rare-earth scarcity exposure. The thirteen-week return of 14.0% and 32.4% extension above the 50W create an entry-risk penalty (timing score 53.0), yet REMX's 100.0 trend score and 6.3% relative strength versus SPY confirm the rally is being sponsored by macro buyers rotating into metals scarcity. MACD is bearish but improving and stochastic RSI is falling/neutral at 0.35, meaning momentum is not yet confirmed but the improving MACD suggests buyers may be stepping in. PICK's MACD is bearish/weakening—deteriorating rather than improving—and stochastic RSI is rising mid-zone, a technical picture that fails to match REMX's sponsorship. The risk/reward for REMX is 50.5/100, with 26.8% downside to support and -8.1% upside to resistance, a setup that is extended but contains legitimate pullback potential if the 65.82 support level holds and buyers rotate in on weakness.
Industrial Metals receives 5% allocation as a tier-2 position, supported by the category's strongest macro fit at 73.0/100, driven by four active descriptors: metals scarcity (+14), commodity breadth positive (+10), real asset sponsorship (+6), and credit stress (-7, a minor penalty). This macro tailwind is significant and explains the allocation despite REMX's technical extension and thin volume (0.69x twenty-week average). The 53.1 final category score reflects technical evidence at 56.6% for the representative, below tier-1 standards, yet the macro support justifies the position. REMX's momentum confirmation of 78.1%, persistence of 65.2%, and volume-price confirmation of 64.1% are all above 60, signaling that the uptrend is holding despite extension. For this category to advance to top-2, REMX would need to either consolidate its gains and allow the 50W slope to accelerate upward (currently at 1.4%, which is healthy), or demonstrate that category-relative strength expands above 7-8%, confirming that rare-earth scarcity is becoming a portfolio-wide theme rather than a sector-specific rotation. Until that occurs, the 5% allocation is correct: it captures the real-asset and scarcity bid without overcommitting to a chart that is 32.4% extended and dependent on momentum confirmation to justify further holding.
Precious Metals — SLV
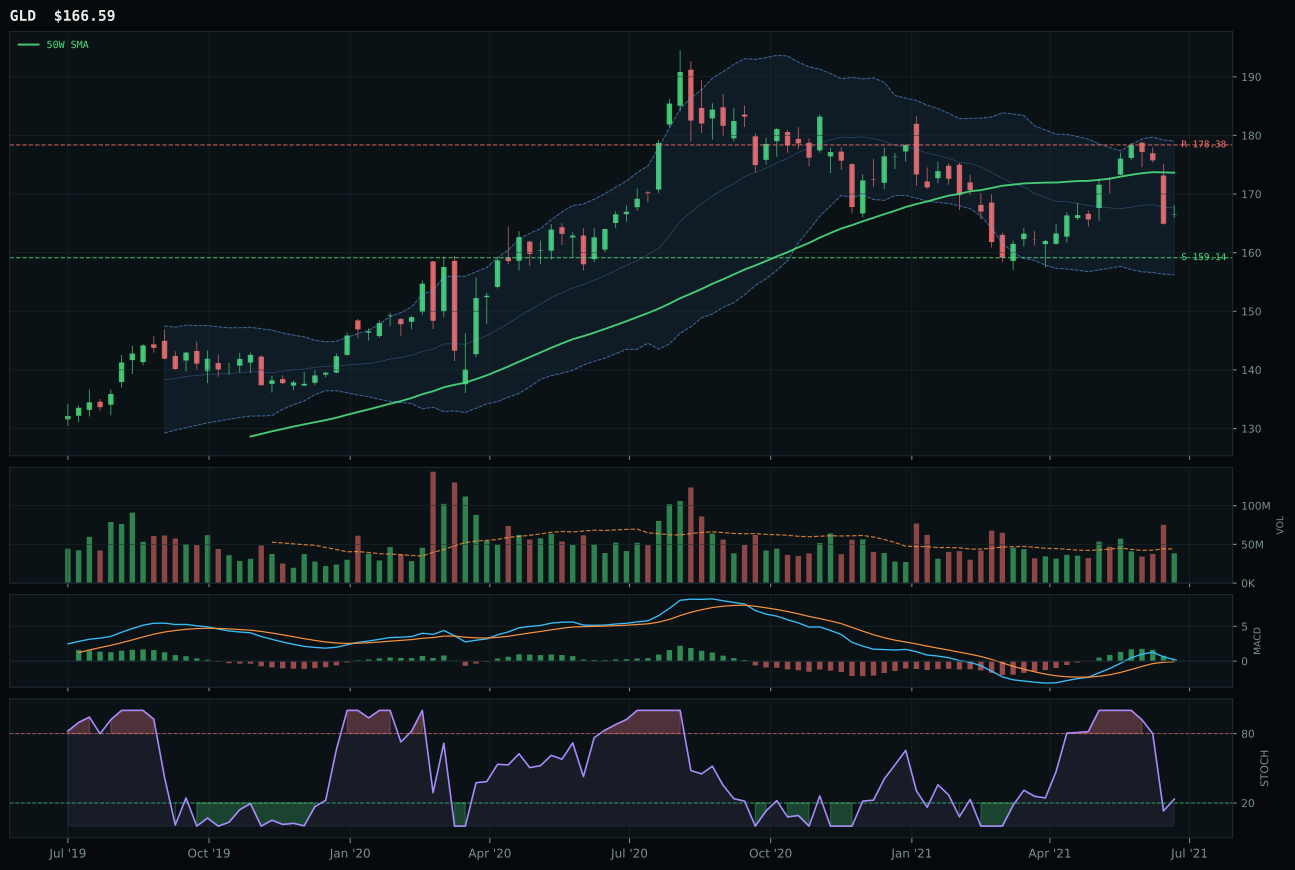
GLD has a pullback into support profile with -5.1% 13-week relative strength versus SPY.
A failed hold above support would weaken the setup.
Actionable but governed by invalidation levels.
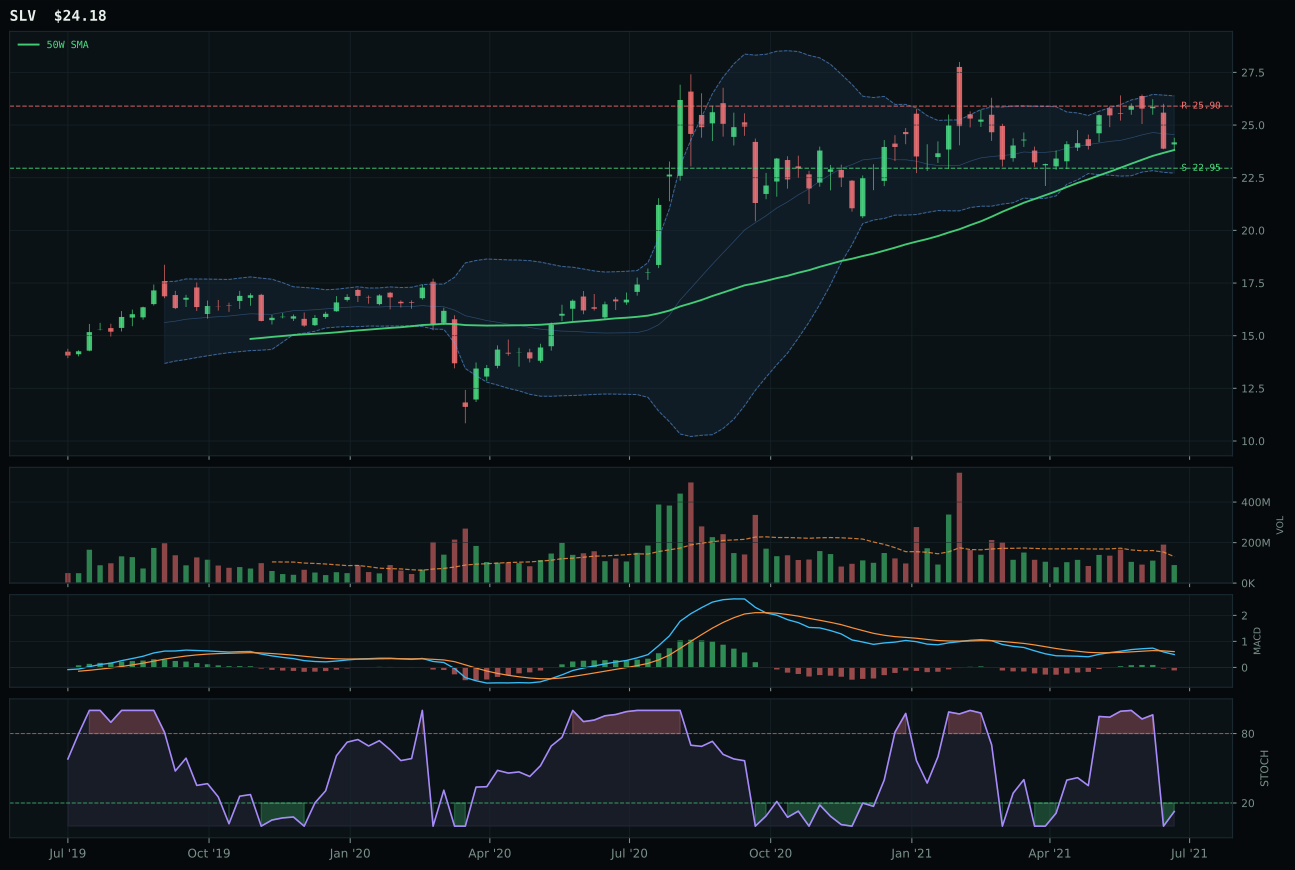
SLV has a compression near 50W profile with -3.6% 13-week relative strength versus SPY.
A failed hold above support would weaken the setup.
Actionable but governed by invalidation levels.
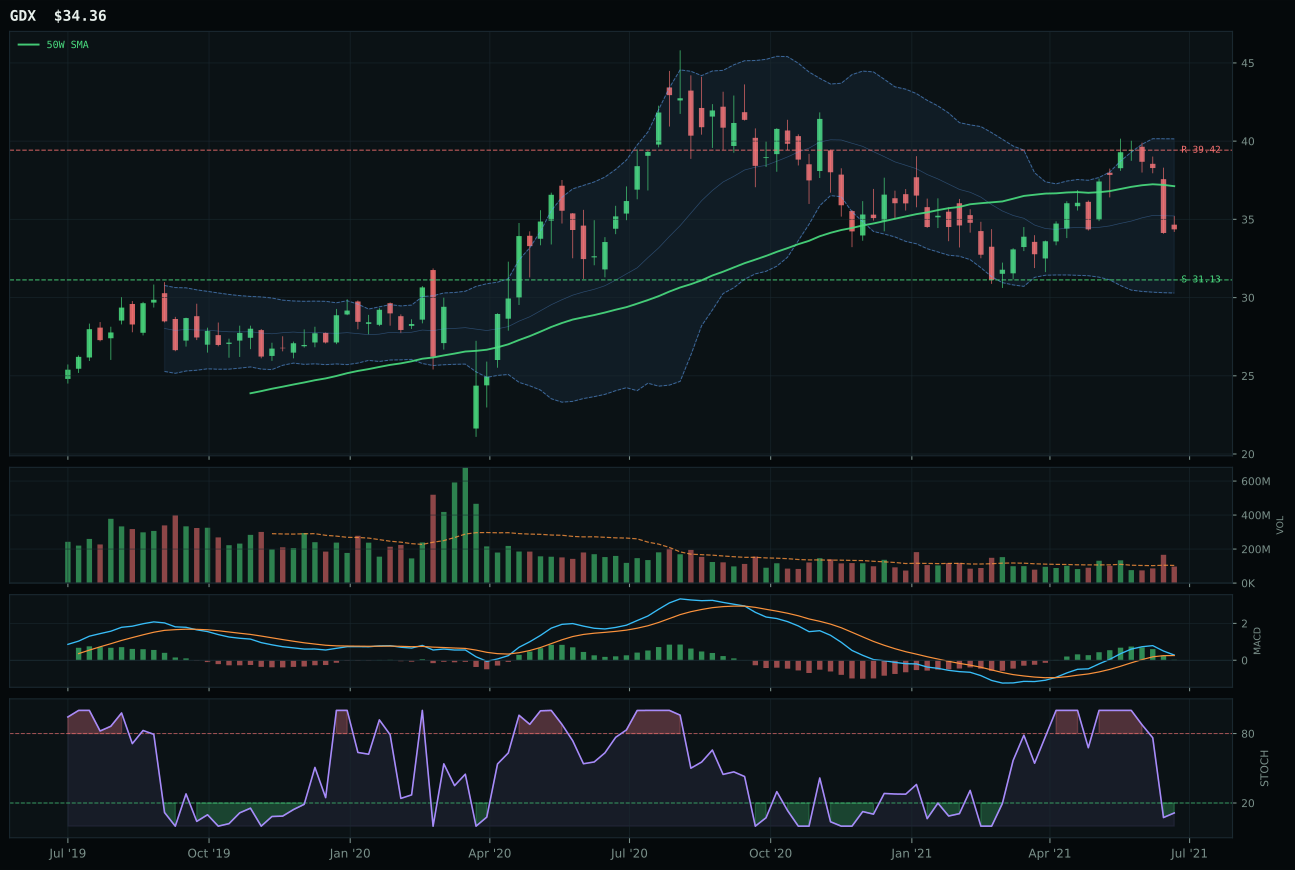
GDX has a neutral structure profile with -2.9% 13-week relative strength versus SPY.
A failed hold above support would weaken the setup.
Actionable but governed by invalidation levels.
SLV edges GLD by 0.7 points in a category where both representatives are technically weak but macro-supported, winning through superior category-relative strength (0.0% vs -1.4%) and a tighter proximity to the 50W (1.5% vs distance for GLD's deeper retracement). SLV's timing score of 95.0 is the category's strongest because price sits 1.5% above the 50W in a compression setup, MACD is bearish/weakening, and stochastic RSI is oversold at 0.13—a combination that suggests mean-reversion upside if the 50W holds. The thirteen-week return is modest at 4.1% and the four-week return is negative at -6.6%, confirming that silver is not accumulating momentum, yet the setup is constructive: the structure score is 74.3 with compression of 77.8%, and support sits at 22.95 with resistance at 25.90. GLD's bullish but flattening MACD and deeper retracement into the Fibonacci 0.382 zone suggest a different technical profile, one that is more consolidated but less poised for immediate expansion. The risk/reward for SLV is 67.3/100, the category's best, because downside to support is only 5.4% while price has room to mean-revert if buyers defend the 50W.
Precious Metals holds 5% allocation as a tier-2 position, receiving conviction support from a 50.0 macro/narrative fit that is neutral overall but contains two active tailwinds: metals scarcity (+7) and inflation pressure (+5). The 49.0 final category score sits between tier-3 and tier-2 precisely because macro fit is split: the category-level macro environment is neither strongly favorable nor unfavorable, yet the technical representatives (GLD at 54.0, SLV at 44.8 reasoned order) both rank well within their own probability spaces. This allocation is defensive and tactical rather than conviction-based. SLV's 40.2% technical evidence score is well below Technology's 84.6%, meaning this is a macro allocation into precious metals rather than a technical breakout. For Precious Metals to earn top-2 consideration, the category would need either a sharp deterioration in credit conditions (activating a flight-to-safety bid) or a breakout above 25.90 resistance in SLV with volume and MACD confirmation, confirming that the inflation narrative is sponsoring fresh accumulation. Until then, the 5% position captures the macro tailwinds without overcommitting capital to a setup where momentum confirmation is minimal and mean-reversion risk is present if the 50W fails to hold.
Defense & Aerospace — XAR
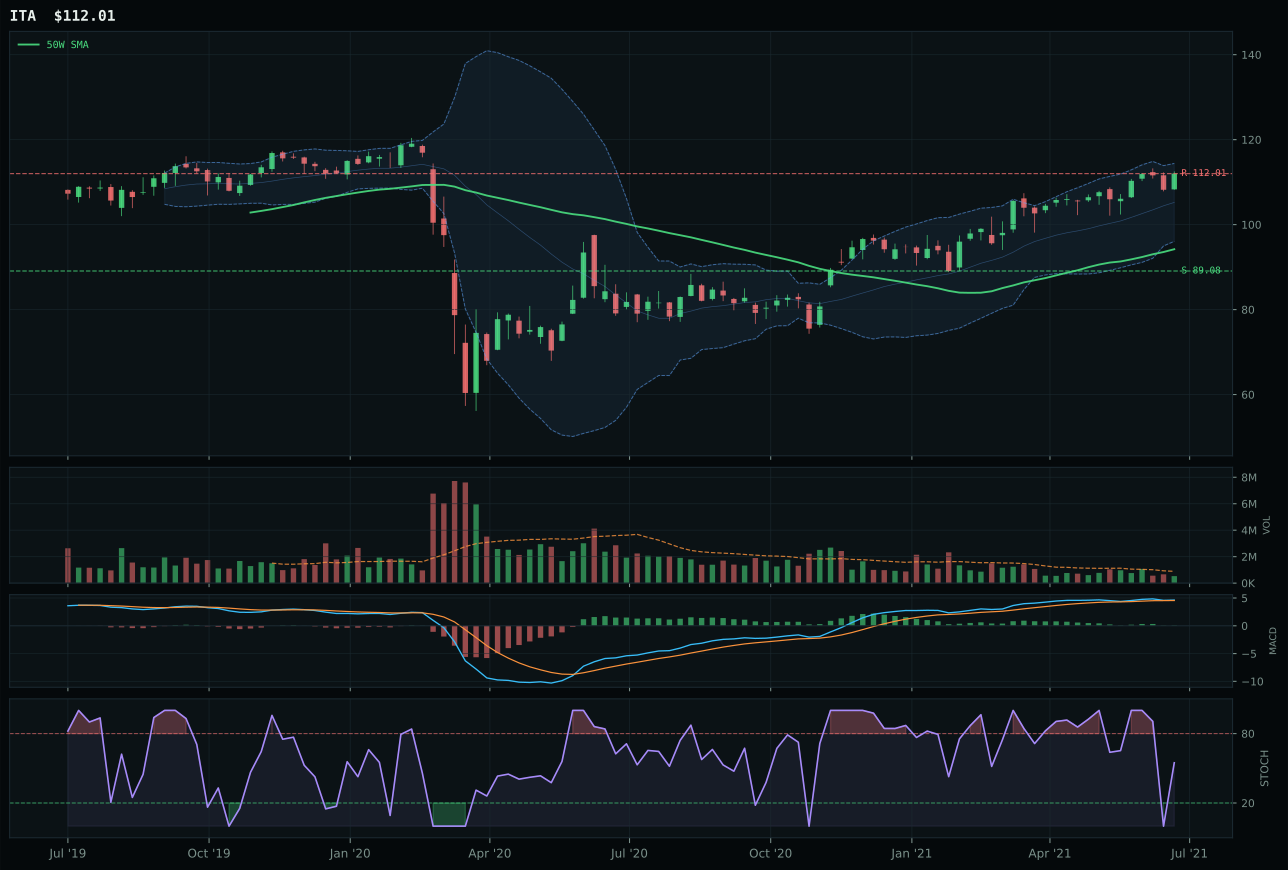
ITA has a vertical extension profile with 1.4% 13-week relative strength versus SPY.
A failed hold above support would weaken the setup.
Actionable but governed by invalidation levels.
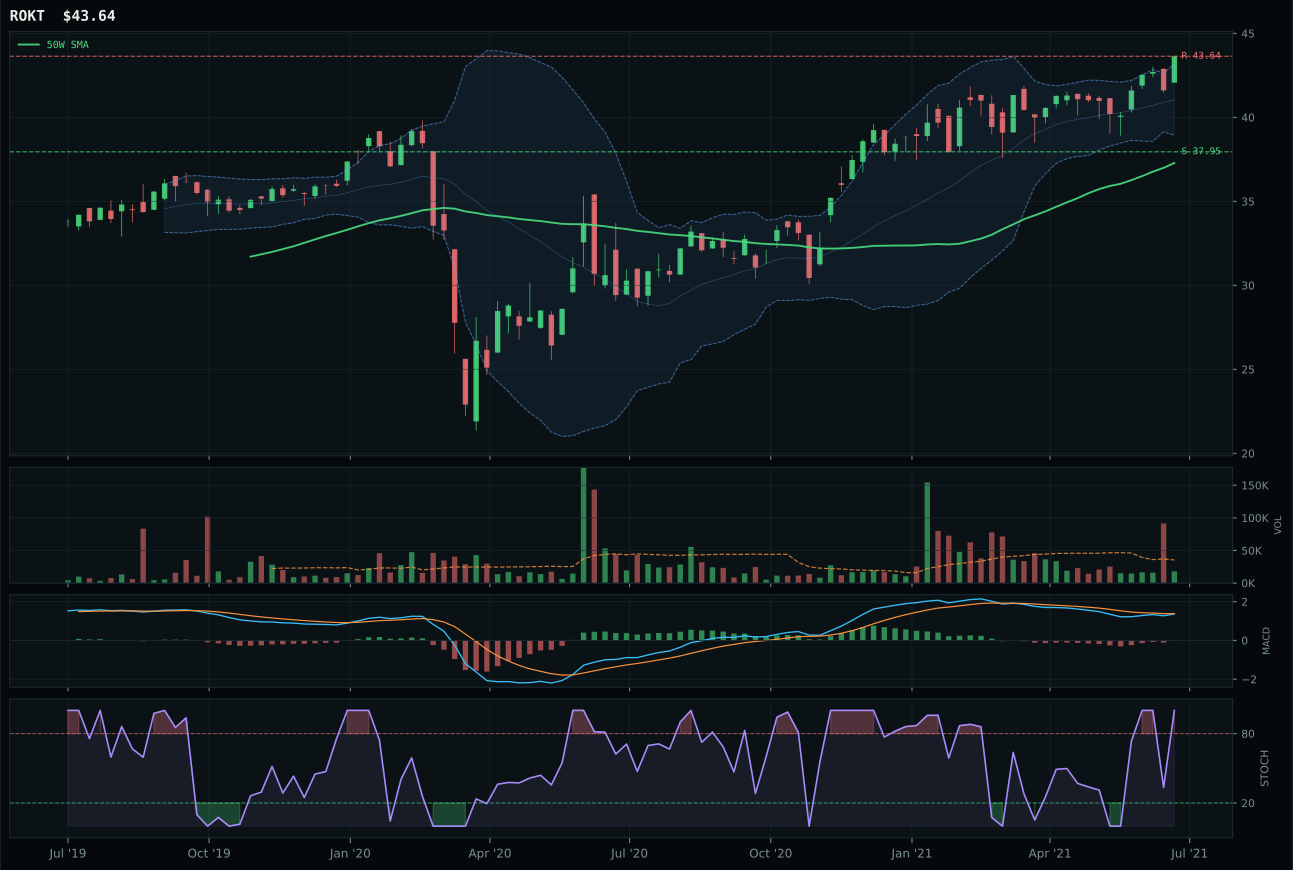
ROKT has a vertical extension profile with 1.4% 13-week relative strength versus SPY.
A failed hold above support would weaken the setup.
Tracked, but not top-2 eligible because: .
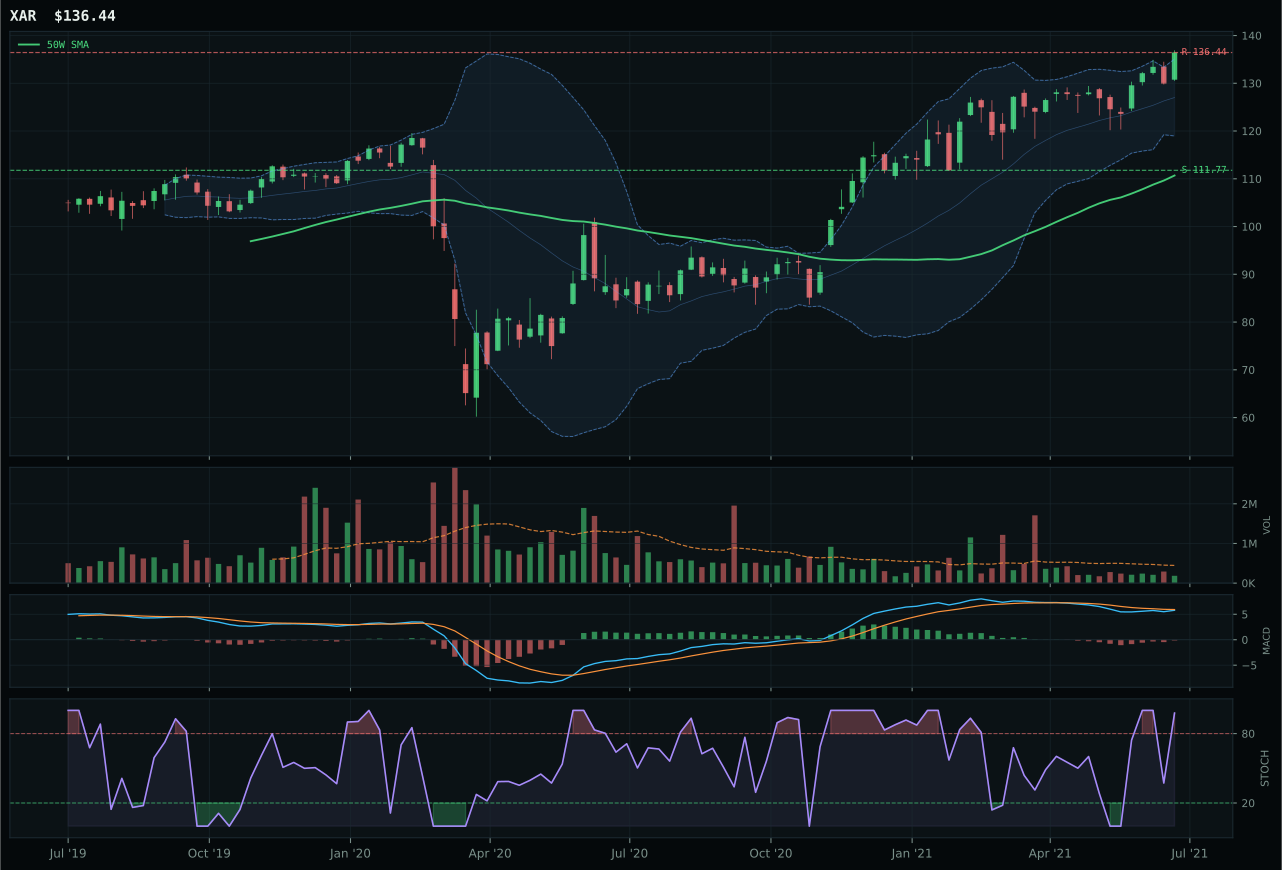
XAR has a vertical extension profile with 2.3% 13-week relative strength versus SPY.
A failed hold above support would weaken the setup.
Actionable but governed by invalidation levels.
XAR wins a close decision over ITA, capturing the category representative slot despite a lower composite technical score (59 vs 63) because category-relative strength of 0.8% exceeds ITA's -0.1%, signaling that defense contractors are finding incremental support within the peer group. The thirteen-week return of 10.0% and 23.3% extension above the 50W reflect a fully rallied sector, and the timing score of 27.0 penalizes that extension heavily—MACD is bearish but improving and stochastic RSI is overbought rolling over at 0.98, a deteriorating momentum picture. ITA's bullish but flattening MACD and falling/neutral stochastic RSI present a more intact uptrend, yet XAR's 0.8% category relative strength edges out ITA's -0.1%, confirming XAR is the marginally stronger peer. The risk/reward for XAR is 43.5/100, with 22.1% downside to support at 111.77 against minimal upside to resistance, a setup that demands conviction buyers on pullbacks rather than extension chasers.
Defense & Aerospace holds 5% allocation as a tier-2 position, ranked below the top two categories despite a 55.0 macro/narrative fit that exceeds Technology's 39.0. The 47.0 final category score comes from technical evidence weighted at 33.4% for the representative, a below-average technical picture that is partially rescued by a Transition/Mixed macro regime (+3 points) and active credit stress that favors the stability narrative of defense spending (+2 points). XAR's own macro fit of 50.0% is neutral—no category-specific descriptor strongly favors or penalizes this exposure—meaning the allocation rests on thin technical footing and macro tailwinds that could reverse. For this category to advance to top-2, XAR would need to close the gap between its extension (23.3% above 50W) and support (22.1% downside risk), ideally by trading sideways and allowing the 50W to slope upward, or by demonstrating category-relative strength above 2-3% that confirms institutional rotation into defense. Until that occurs, the 5% allocation is appropriate: it captures the macro bid without overcommitting to a chart that is extended, momentum-deteriorating, and providing minimal asymmetric risk/reward at current levels.
Agriculture & Livestock — MOO
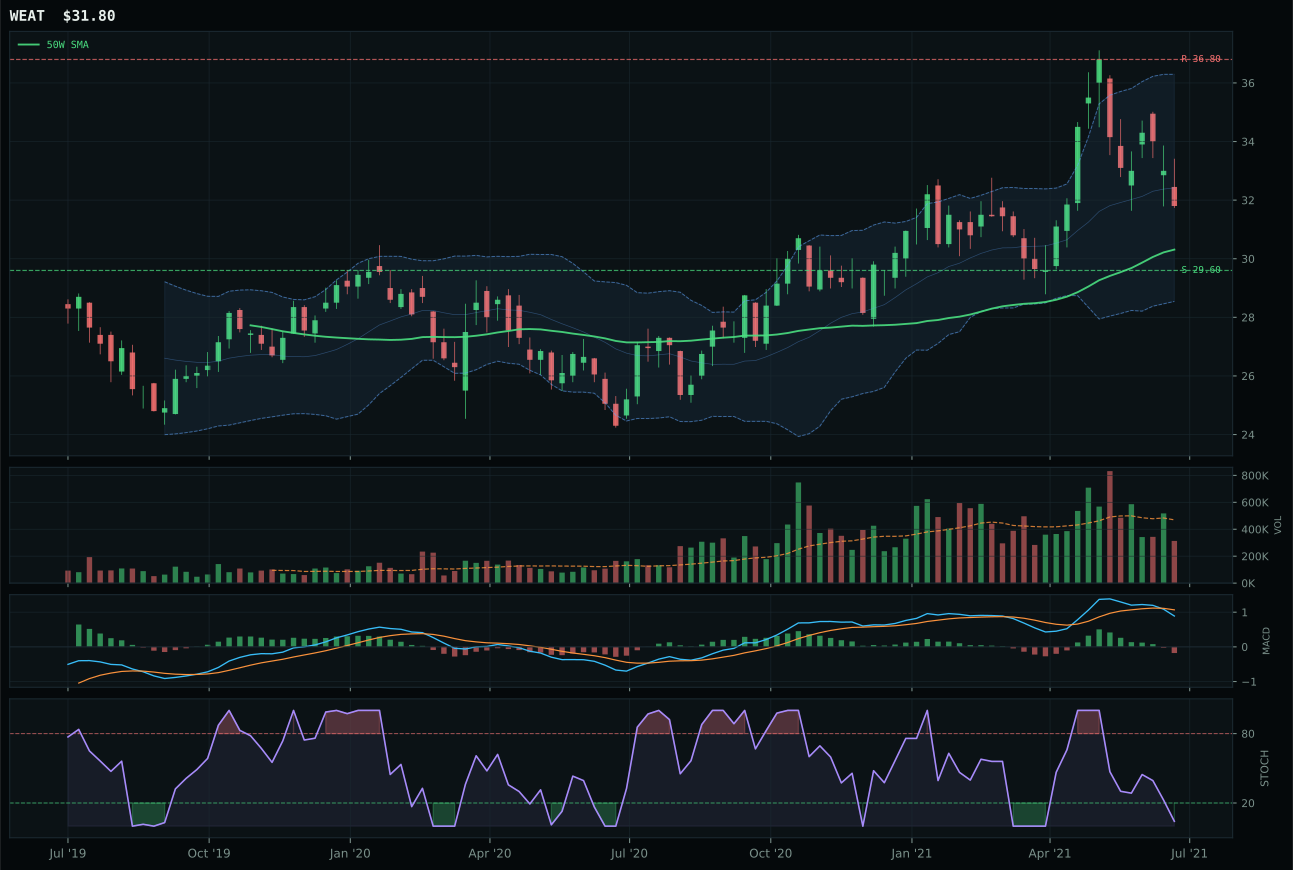
WEAT has a neutral structure profile with -0.5% 13-week relative strength versus SPY.
A failed hold above support would weaken the setup.
Actionable but governed by invalidation levels.
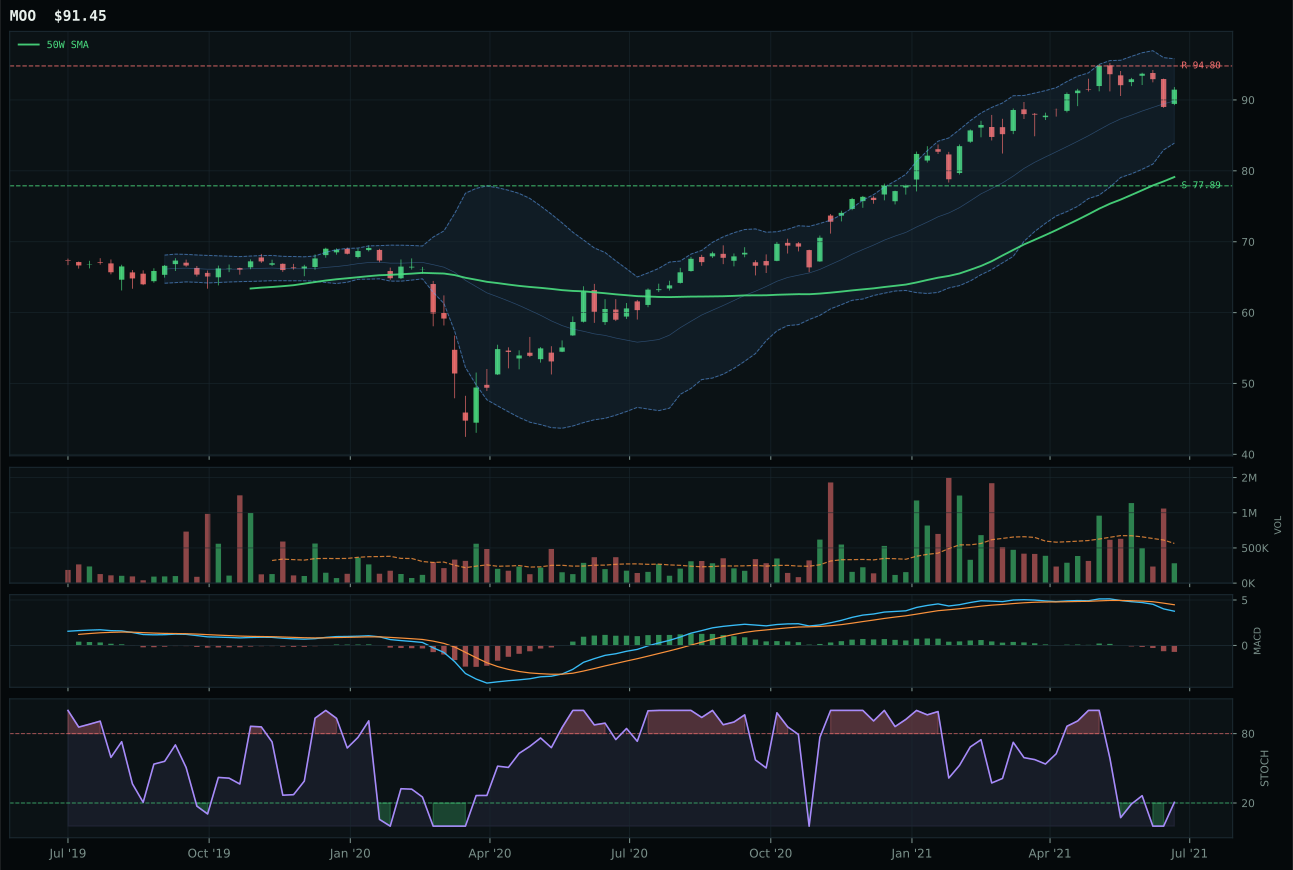
MOO has a vertical extension profile with -3.7% 13-week relative strength versus SPY.
A failed hold above support would weaken the setup.
Actionable but governed by invalidation levels.
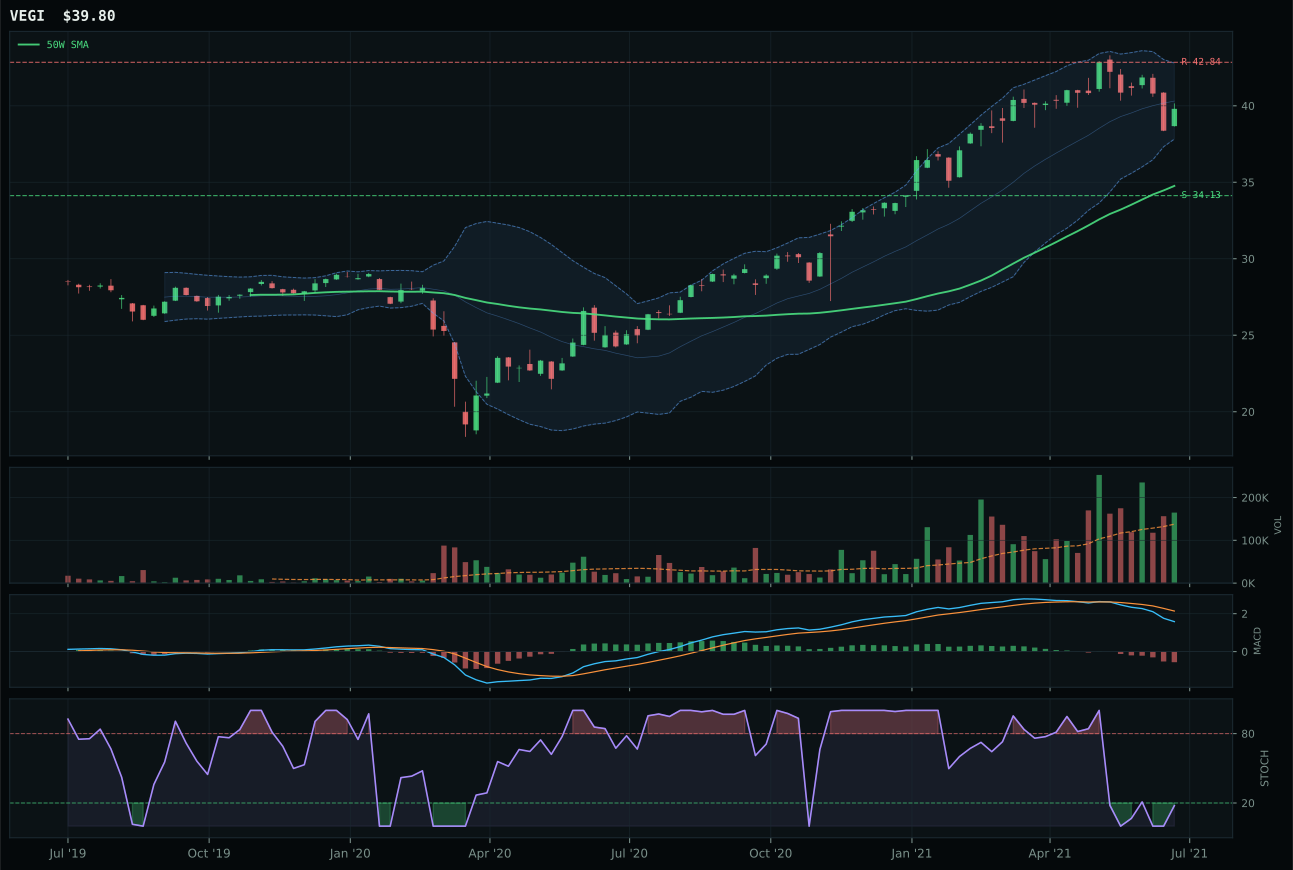
VEGI has a neutral structure profile with -8.4% 13-week relative strength versus SPY.
A failed hold above support would weaken the setup.
Tracked, but not top-2 eligible because: .
MOO wins the category despite being a significantly weaker technical setup than runner-up WEAT, whose structure score of 67.2 lags MOO's 76.3—the decision turns entirely on macro sponsorship of real assets. MOO's thirteen-week return is sluggish at 4.0%, category-relative strength is flat at 0.0%, and the four-week return is negative at -1.6%, yet the MACD is bearish/weakening and stochastic RSI is falling/neutral, a deteriorating momentum picture that persists across all three category members. WEAT carries a 70.0 macro/narrative fit (higher than MOO's 70.0 as a category-level average) but MOO's 76.3% structure and 48.6% risk/reward edge out WEAT's cleaner 67.2% structure when combined with institutional volume-price confirmation of 31.6% and persistence of 46.4%—both weak, but MOO's category-relative strength of 0.0% matches WEAT's despite inferior technical mechanics, indicating the market is choosing MOO's equity exposure over wheat futures. Risk/reward shows -3.5% upside to resistance and 17.4% downside to support, a setup that makes sense only if supply-shortage narratives hold and real-asset inflation persists.
Agriculture & Livestock receives 5% allocation as a tier-2 position, supported almost entirely by macro tailwinds rather than technical conviction. The 43.8 final score masks a category-level macro fit of 86.0/100—the highest among all tier-2 candidates—driven by four active descriptors: supply shortage (+13), inflation pressure (+10), real asset sponsorship (+8), and commodity breadth positive (+5). This macro support is powerful and explains the allocation despite technical evidence that is fractured: MOO's timing at 48.0%, momentum confirmation at 25.4%, and volume-price confirmation at 31.6% are all weak signals that warrant caution. The portfolio is saying, in effect: we believe the supply-shortage and inflation narratives enough to hold 5%, but we are not convinced the technical setup warrants more. For this category to advance to top-2, the representative would need to demonstrate category-relative strength above 2-3% (confirming that capital is flowing into agriculture over other real assets) and timing/momentum scores above 60, which would indicate that buyers are defending the setup rather than rolling over. Until that occurs, watch the structure: if MOO breaks below the 77.89 support level, the macro narrative loses its technical foothold and the allocation becomes indefensible.
Utilities & Infrastructure — XLU
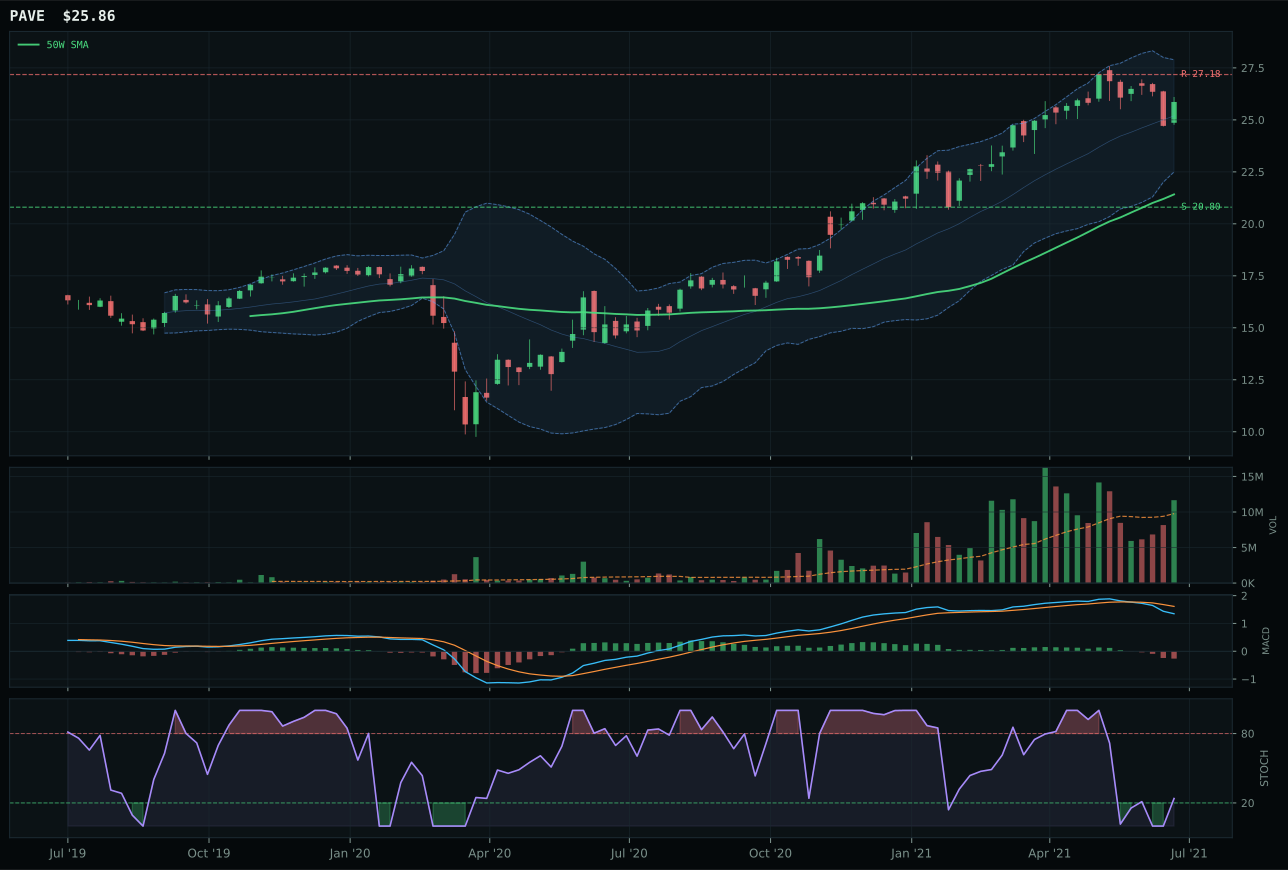
PAVE has a vertical extension profile with -4.1% 13-week relative strength versus SPY.
A failed hold above support would weaken the setup.
Actionable but governed by invalidation levels.
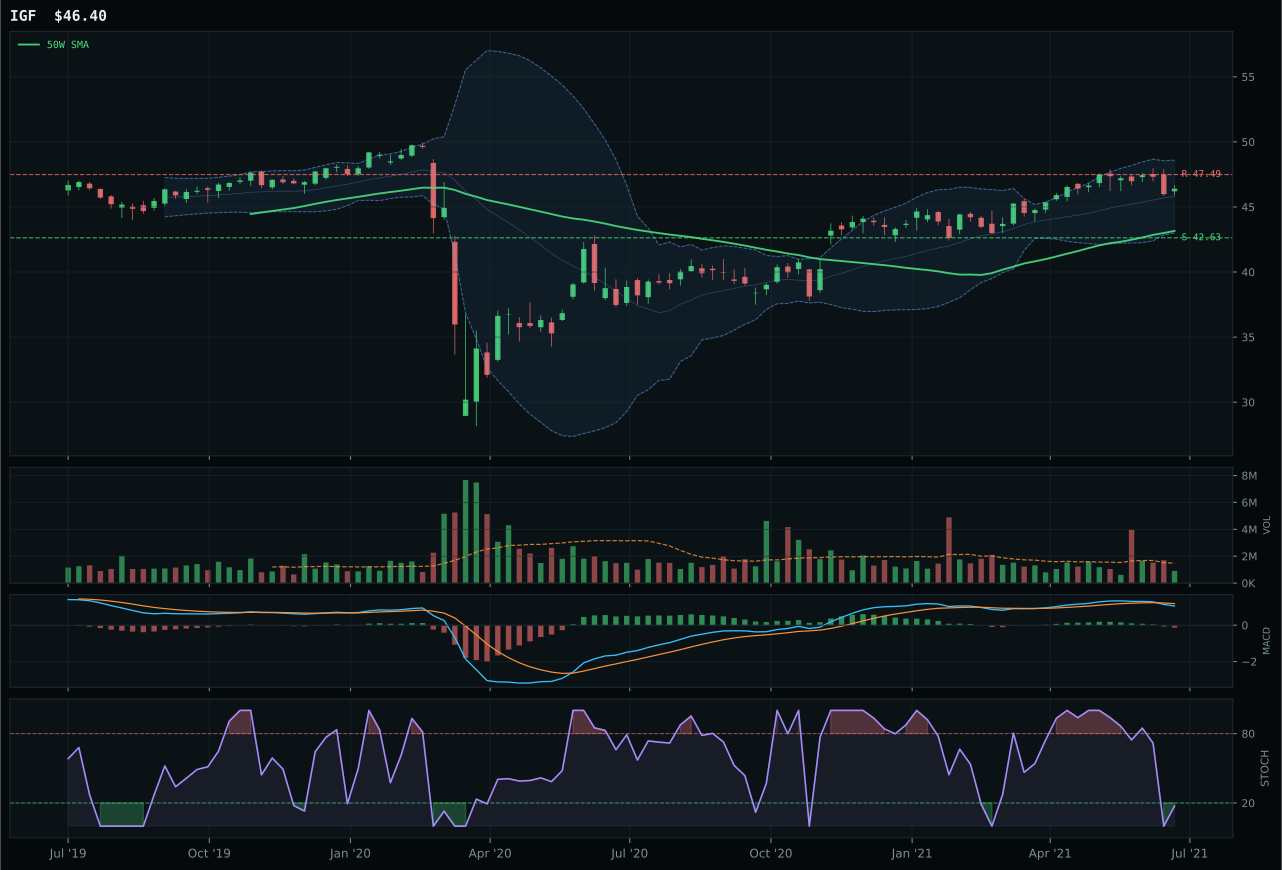
IGF has a neutral structure profile with -4.1% 13-week relative strength versus SPY.
A failed hold above support would weaken the setup.
Actionable but governed by invalidation levels.
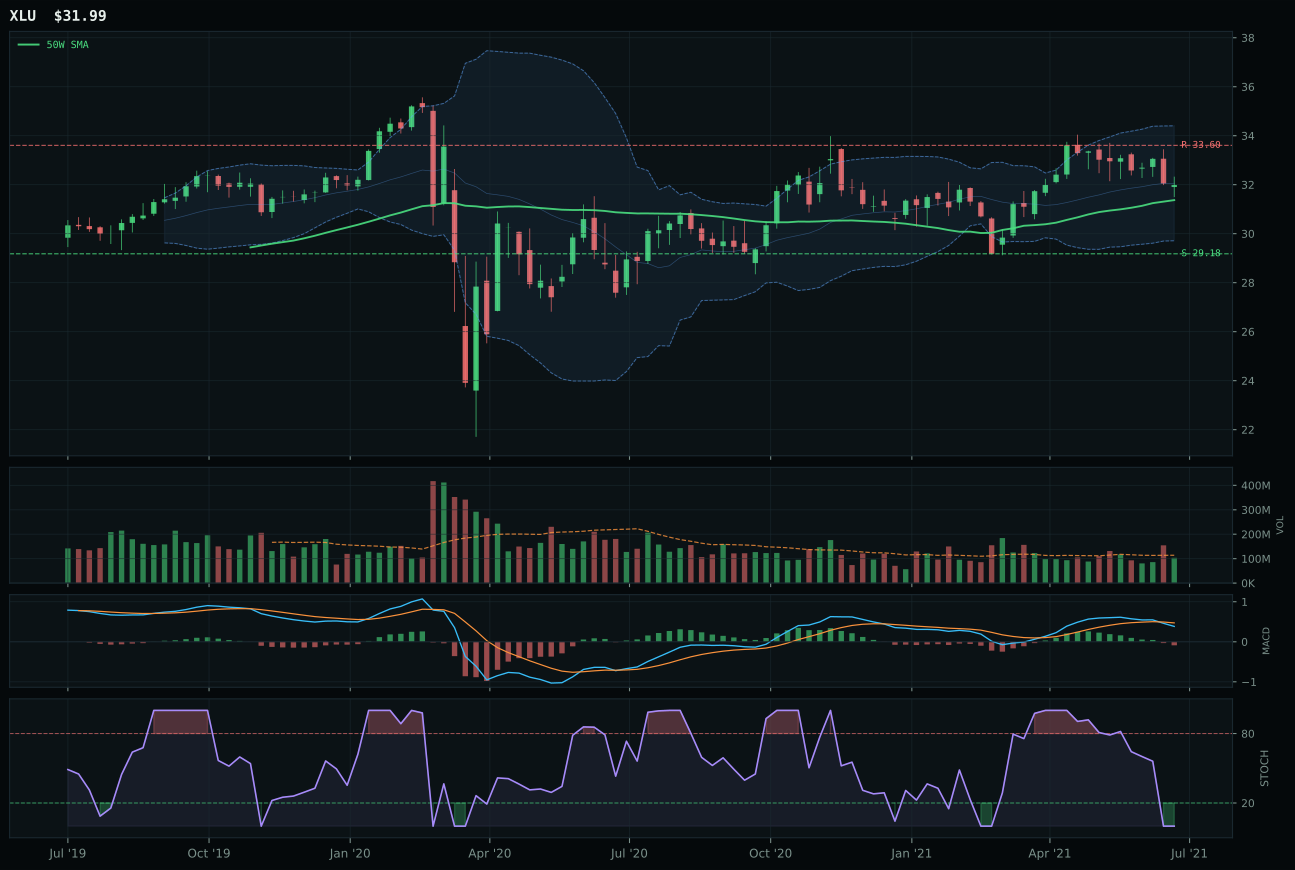
XLU has a compression near 50W profile with -6.9% 13-week relative strength versus SPY.
A failed hold above support would weaken the setup.
Actionable but governed by invalidation levels.
XLU wins the category decisively over PAVE, capturing the representative slot through a 95.0 timing score that reflects price compression just 2.0% above the 50W in an oversold stochastic RSI environment (0.00). PAVE is extended 20.8% above its 50W with timing score of 56.0, a 39-point deficit that is deterministic in a weak technical category. XLU's structure score of 72.6% exceeds PAVE's 54% composite because compression near the 50W with 84.7% compression rating signals potential for expansion if buyers return, a far different setup than PAVE's vertical extension with rising mid-zone stochastic RSI (suggesting momentum has already turned). The risk/reward for XLU is 54.0/100, with only -4.8% upside to resistance but 9.6% downside to support, tighter than PAVE's metrics and reflecting the compressed entry. Volume is neutral at 0.91x for XLU, confirming neither conviction nor rejection. The critical technical difference is that XLU's oversold stochastic RSI at 0.00 and MACD bearish/weakening create a mean-reversion setup, whereas PAVE's rising stochastic mid-zone and similar MACD confirm that momentum has already rolled over.
Utilities & Infrastructure receives 5% allocation as a tier-2 position despite a 48.0% macro/narrative fit that includes active inflation pressure (-6), the only sector in the portfolio where inflation is explicitly penalizing the category. The 43.3 final category score reflects technical evidence at 33.4%, the weakest among tier-2 and tier-3 candidates, indicating that this allocation is entirely tactical and contingent on specific chart setups. XLU's 95.0 timing score—driven by compression near the 50W and oversold stochastic RSI—is the sole conviction driver, suggesting that a mean-reversion trade could develop if buyers defend the 29.18 support level and stochastic RSI rises from oversold territory. The Transition/Mixed macro regime contributes +4 points of support, but that benefit is modest. For Utilities & Infrastructure to advance to top-2 consideration, XLU would need to break above 33.60 resistance with volume and MACD confirmation, proving that the sector can lead despite inflation headwinds. Alternatively, a material deterioration in growth expectations or credit conditions would shift the portfolio's risk-off posture and create genuine demand for yield and defensive characteristics. Until then, the 5% allocation is appropriate: it captures the mean-reversion timing setup without overcommitting to a category where weak technical evidence and macro headwinds limit conviction.
Nuclear Energy — URA
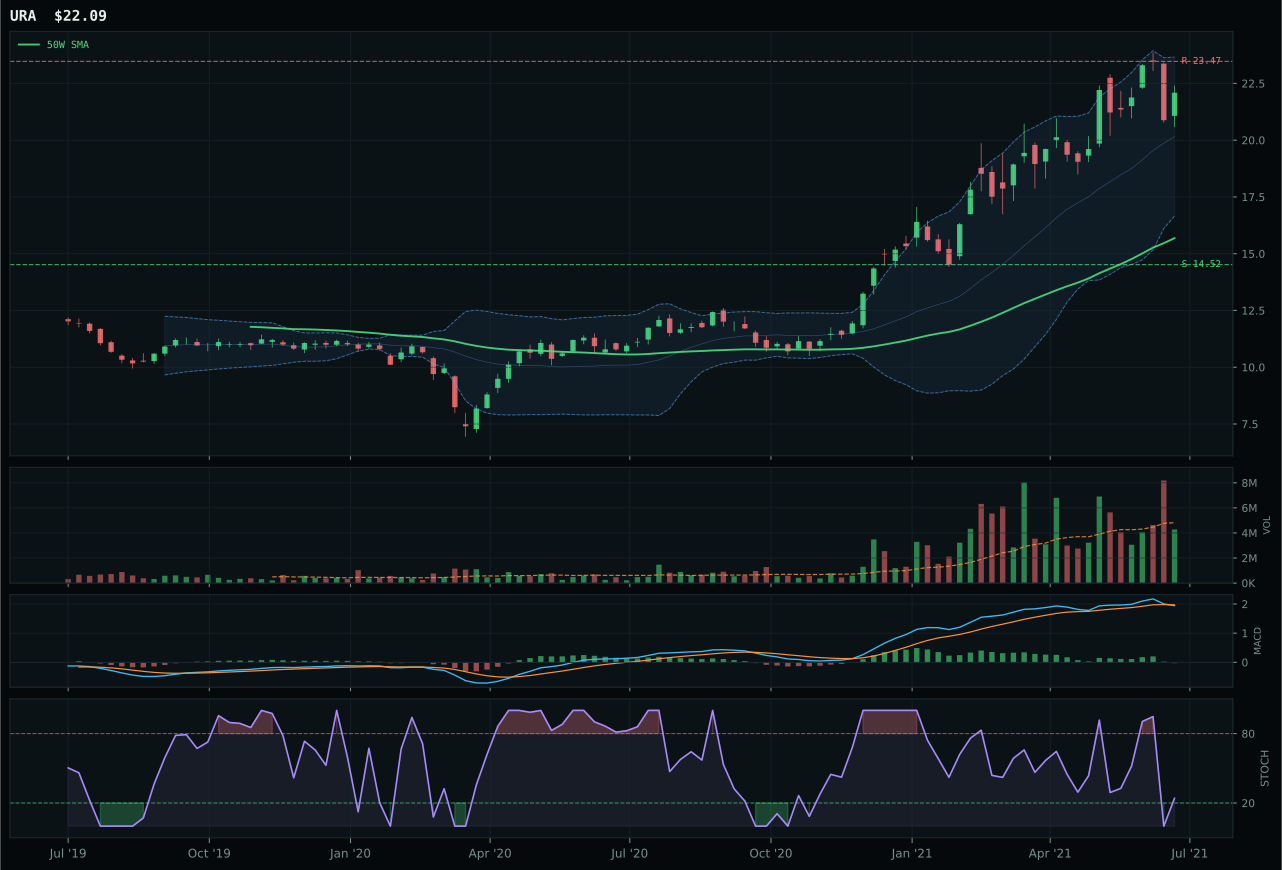
URA has a vertical extension profile with 8.8% 13-week relative strength versus SPY.
A failed hold above support would weaken the setup.
Actionable but governed by invalidation levels.
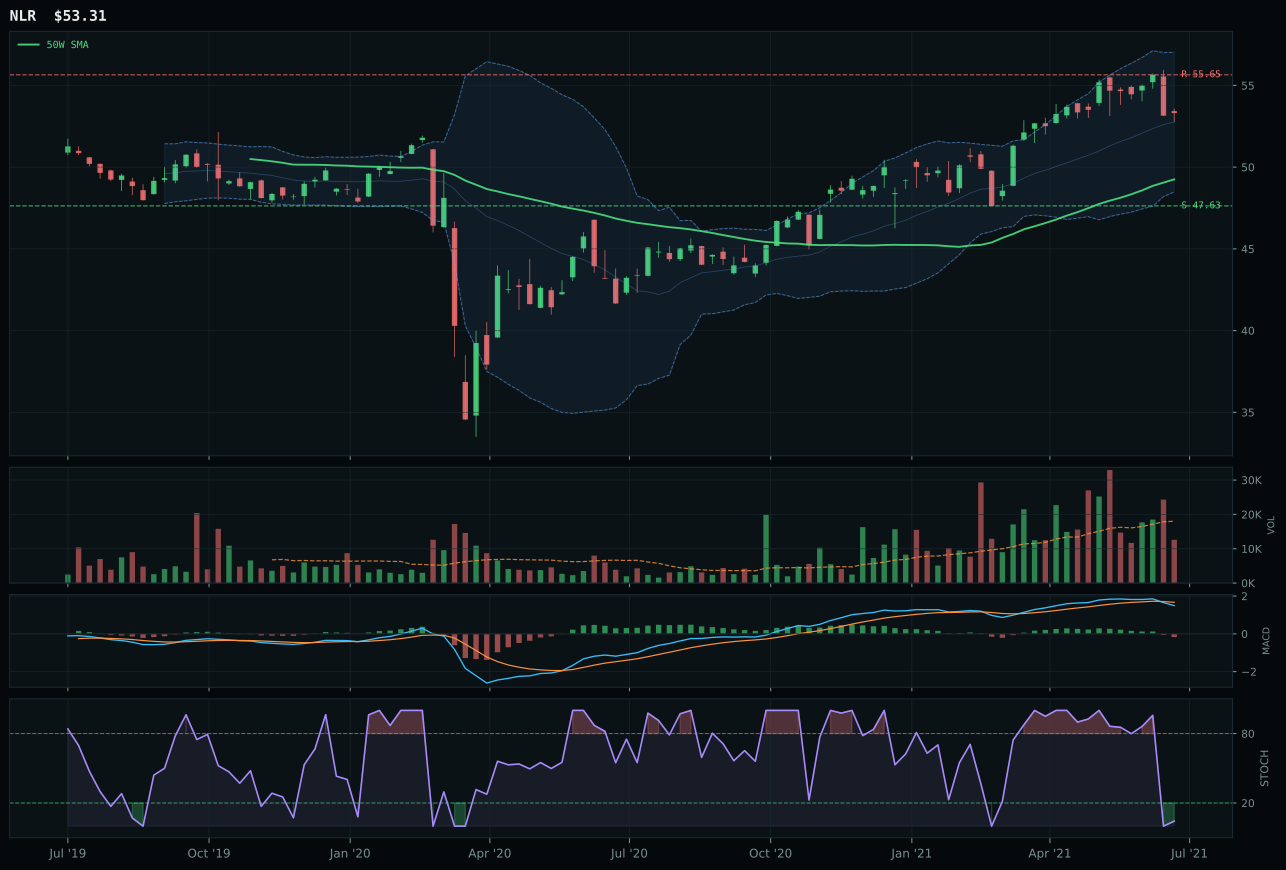
NLR has a neutral structure profile with -6.5% 13-week relative strength versus SPY.
A failed hold above support would weaken the setup.
Tracked, but not top-2 eligible because: .
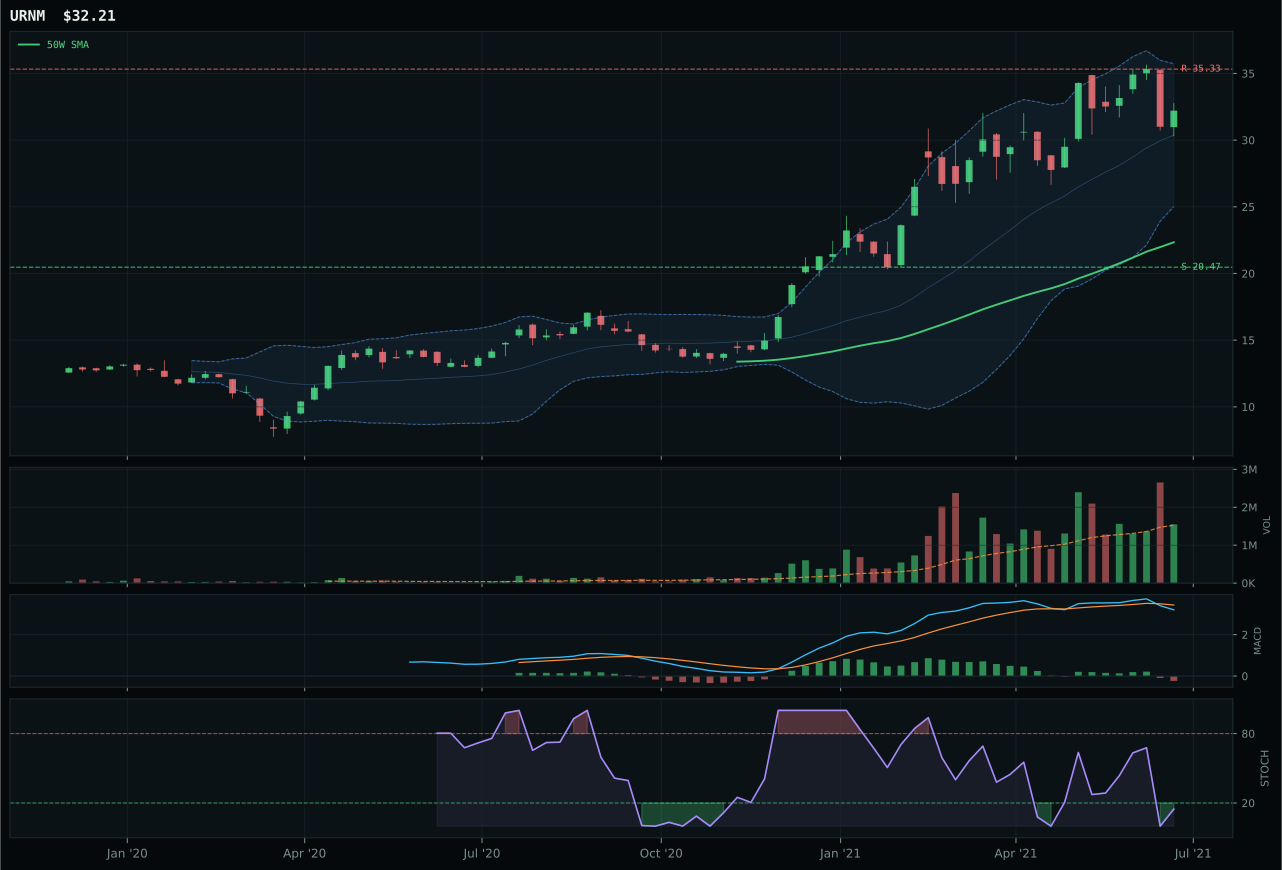
URNM has a vertical extension profile with 4.3% 13-week relative strength versus SPY.
A failed hold above support would weaken the setup.
Actionable but governed by invalidation levels.
AI — BOTZ
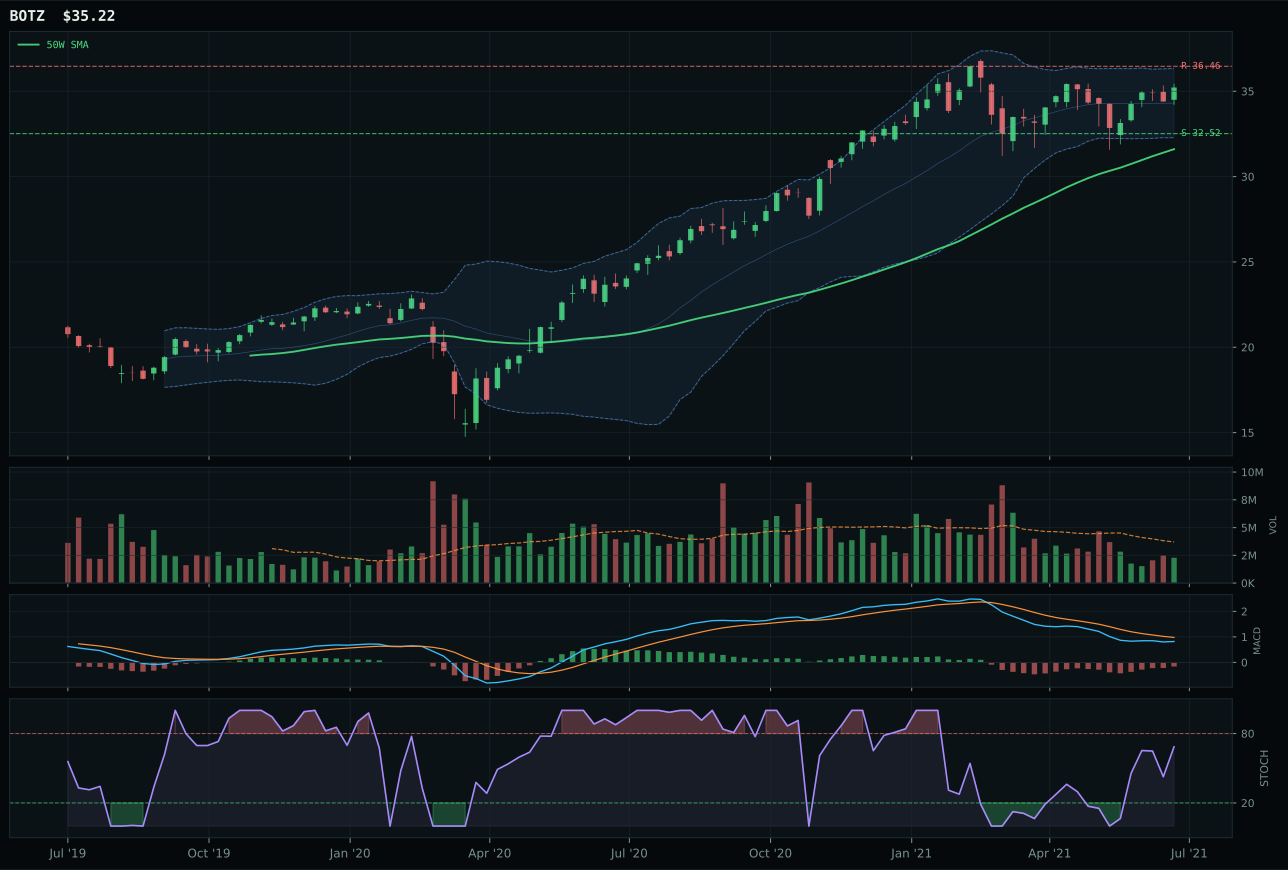
BOTZ has a neutral structure profile with -1.5% 13-week relative strength versus SPY.
A failed hold above support would weaken the setup.
Actionable but governed by invalidation levels.
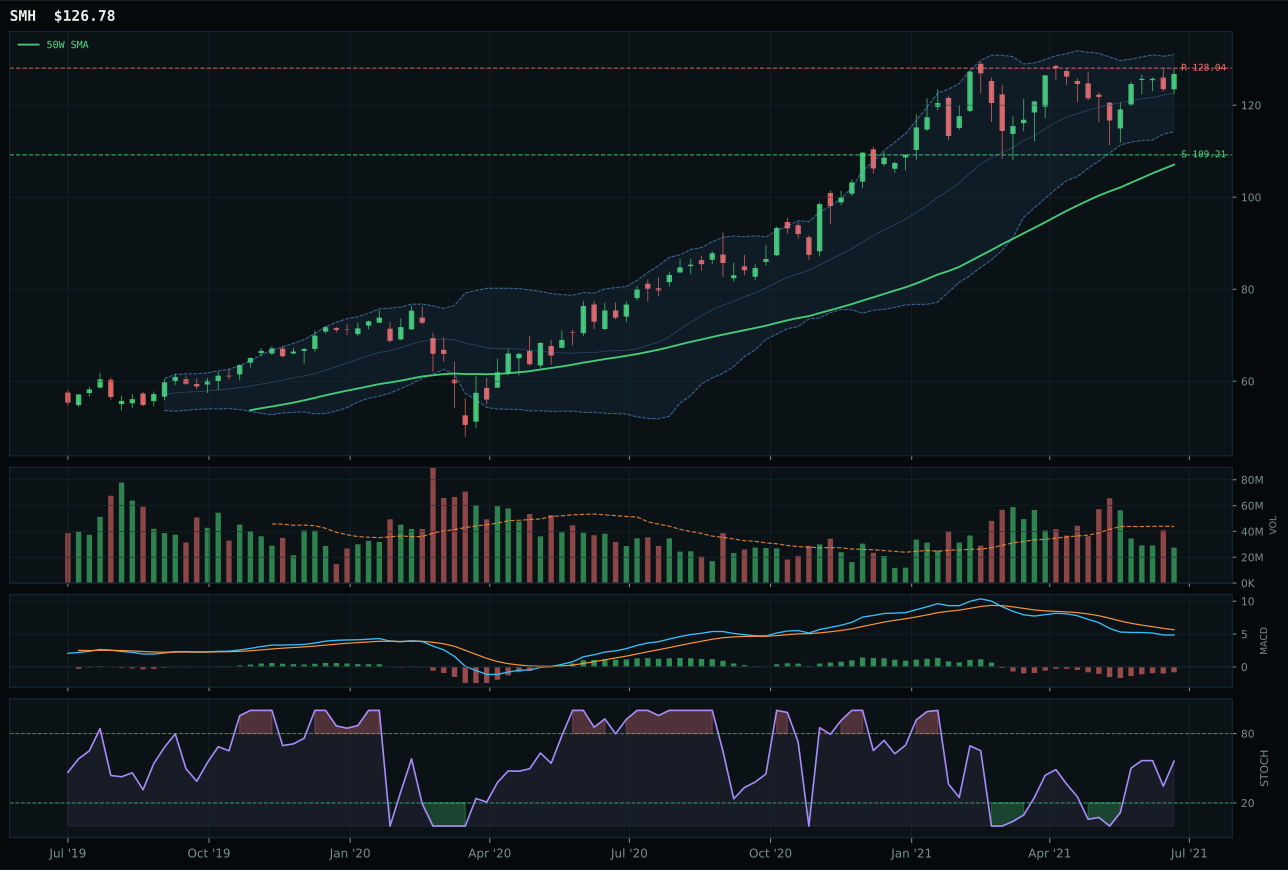
SMH has a vertical extension profile with -2.8% 13-week relative strength versus SPY.
A failed hold above support would weaken the setup.
Actionable but governed by invalidation levels.
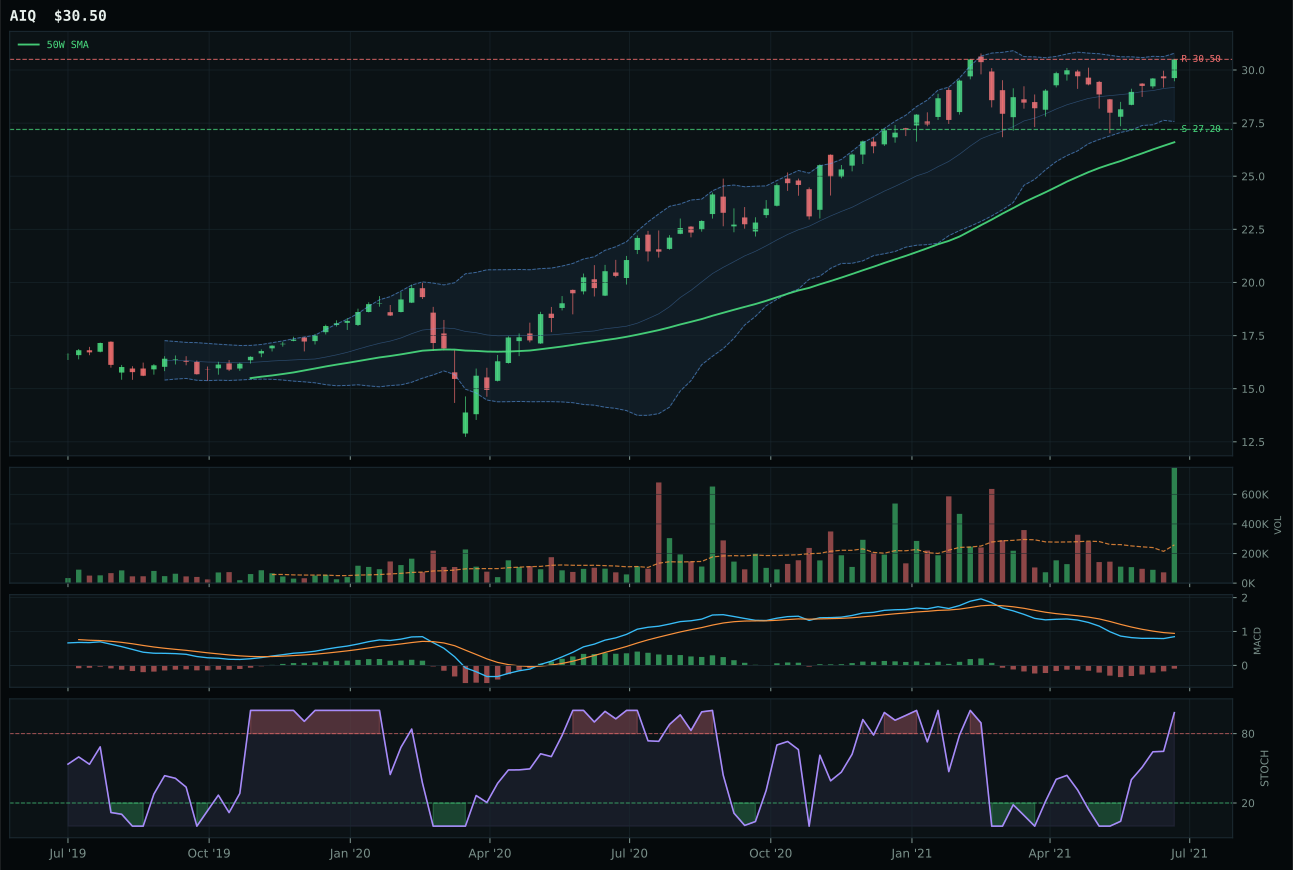
AIQ has a neutral structure profile with 0.4% 13-week relative strength versus SPY.
A failed hold above support would weaken the setup.
Tracked, but not top-2 eligible because: .
BOTZ edges SMH despite both carrying headwinds, capturing the category win through superior timing (83.0 vs 45.0) and category-relative strength (0.0% vs -1.3%) in a setup that is fundamentally struggling under macro pressure. The thirteen-week return of 6.2% is sluggish, and the -1.5% relative strength versus SPY confirms that robotics is underperforming the market in a credit-stress regime. However, BOTZ's distance to the 50W at 11.4% versus SMH's 18.4% extension, combined with a rising mid-zone stochastic RSI (0.69) versus SMH's falling/neutral condition, positions BOTZ as the less stretched entry if the category finds a bid. The neutral volume at 0.62x confirms thin participation across both names, but BOTZ's 70.0% structure score and cleanliness of 50.0 remain competitive. Risk/reward is unfavorable at 52.4/100—upside to resistance is -3.4% with 8.3% downside to support—a setup that penalizes any new entry.
AI is excluded entirely from the portfolio this week, receiving 0% allocation and ranking ninth or tenth among the ten categories. The final score of 34.4 reflects a basket (BOTZ, SMH, AIQ) that tested weak against leadership, volume-price sponsorship, persistence, timing, and risk/reward across a macro backdrop of active credit stress (-8 points) that is directly hostile to cyclical growth narratives. Technical evidence at 68.2% for the category representative cannot overcome 42.0% macro/narrative fit, and that disparity reveals the core problem: these names are rallying into extension (BOTZ is 11.4% above the 50W, SMH 18.4%, price action is reaching Fibonacci 0.236 zones) while lacking the relative strength versus SPY needed to justify capital allocation in a mixed regime. AI would re-enter the allocation if BOTZ or SMH achieved category-relative strength above 3-4%, thereby demonstrating that institutions are rotating capital into semiconductors and robotics despite credit concerns, or if the macro regime shifted decisively away from the active credit-stress descriptor that is currently penalizing growth-adjacent exposures by eight percentage points.