
2021-06-18
Informational purposes only. The content in this report, including allocations, analysis, and commentary, is provided solely for informational and educational purposes. It does not constitute financial advice, investment advice, trading advice, or any other type of advice. Past performance does not guarantee future results. Always conduct your own research and consult a qualified financial professional before making investment decisions.
Weekly Allocation
| Ticker | Category | Weight | Role |
|---|---|---|---|
| FSOL | 50% | Overlay | |
| IGV | Technology | 10% | Top-2 (10%) |
| FCG | Traditional Energy | 10% | Top-2 (10%) |
| INDA | Emerging Markets | 5% | Tier-2 (5%) |
| REMX | Industrial Metals | 5% | Tier-2 (5%) |
| SMH | AI | 5% | Tier-2 (5%) |
| XLU | Utilities & Infrastructure | 5% | Tier-2 (5%) |
| XAR | Defense & Aerospace | 5% | Tier-2 (5%) |
| WEAT | Agriculture & Livestock | 5% | Tier-2 (5%) |
Trade Instructions — Monday Open
Sell the tranche from 2021-05-21 (completing its 4-week hold). Buy the new tranche. Instructions show net portfolio changes — same-asset positions cancel, weight changes show the delta.
| Action | Ticker | Instruction |
|---|---|---|
| SELL | FBTC | Sell 33% of FBTC position (reduce 37.50% → 25.00%) |
| SELL | GLD | Sell 25% of GLD position (reduce 10.00% → 7.50%) |
| SELL | COPX | Sell 25% of COPX position (reduce 5.00% → 3.75%) |
| SELL | URNM | Sell 50% of URNM position (reduce 2.50% → 1.25%) |
| SELL | IGF | Sell entire IGF position (1.25% of portfolio) |
| SELL | MOO | Sell 50% of MOO position (reduce 2.50% → 1.25%) |
| SELL | ILF | Sell 33% of ILF position (reduce 3.75% → 2.50%) |
| SELL | ITA | Sell 50% of ITA position (reduce 2.50% → 1.25%) |
| BUY | XLU | Buy XLU — 5.56% of freed cash (adds 1.25% to portfolio) |
| BUY | IGV | Buy IGV — 11.11% of freed cash (adds 2.50% to portfolio) |
| BUY | SMH | Buy SMH — 5.56% of freed cash (adds 1.25% to portfolio) |
| BUY | FSOL | Buy FSOL — 55.56% of freed cash (adds 12.50% to portfolio) |
| BUY | INDA | Buy INDA — 5.56% of freed cash (adds 1.25% to portfolio) |
| BUY | REMX | Buy REMX — 5.56% of freed cash (adds 1.25% to portfolio) |
| BUY | XAR | Buy XAR — 5.56% of freed cash (adds 1.25% to portfolio) |
| BUY | WEAT | Buy WEAT — 5.56% of freed cash (adds 1.25% to portfolio) |
Current Portfolio After Trade
Combined holdings across all 4 active tranches. Each tranche is 25% of the portfolio.
| Ticker | % of Portfolio | Weight Bar |
|---|---|---|
| FBTC | 25.00% | |
| FSOL | 25.00% | |
| GLD | 7.50% | |
| IGV | 6.25% | |
| XLU | 5.00% | |
| FCG | 3.75% | |
| COPX | 3.75% | |
| SMH | 3.75% | |
| INDA | 3.75% | |
| ILF | 2.50% | |
| URA | 2.50% | |
| REMX | 2.50% | |
| XAR | 2.50% | |
| URNM | 1.25% | |
| MOO | 1.25% | |
| ITA | 1.25% | |
| CIBR | 1.25% | |
| WEAT | 1.25% |
Macro Regime — Goldilocks
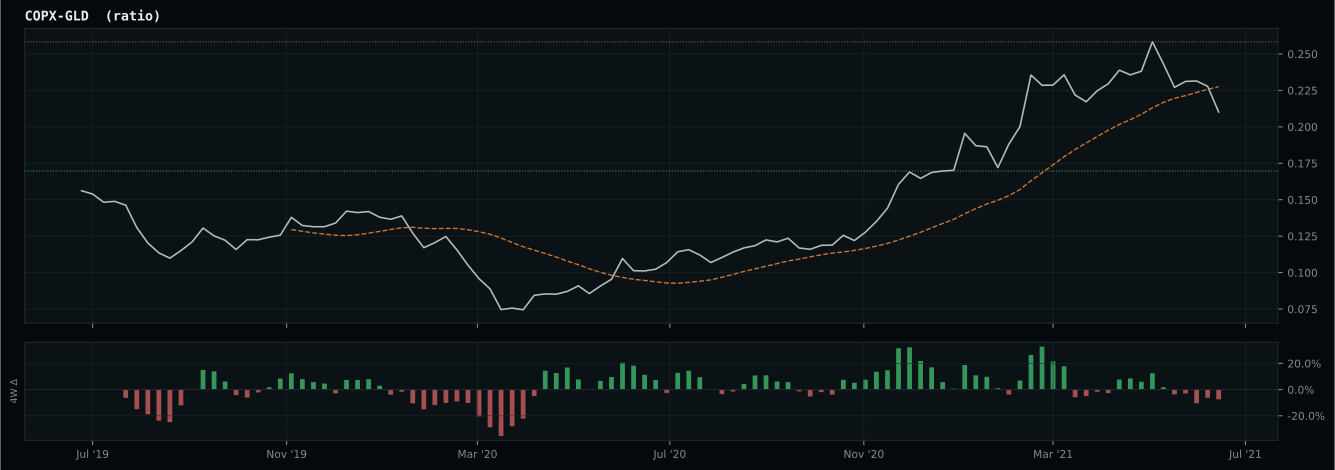
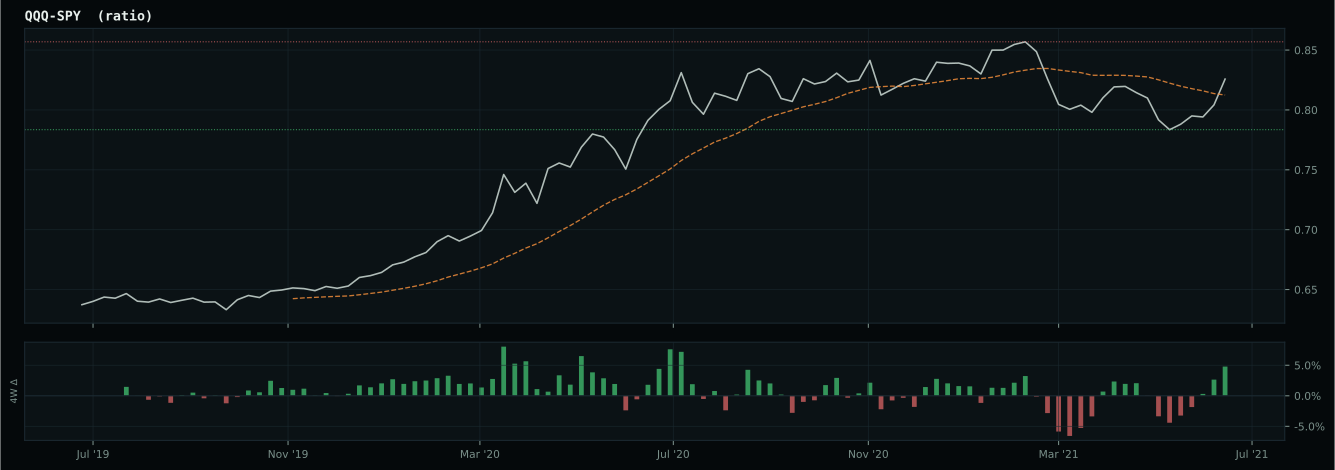
Macro Evidence Charts
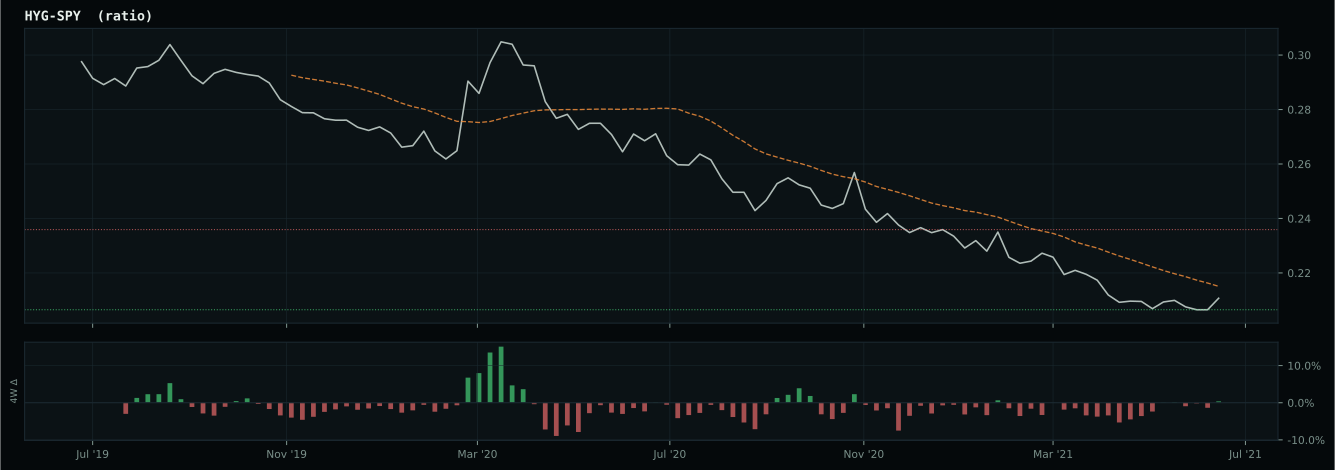
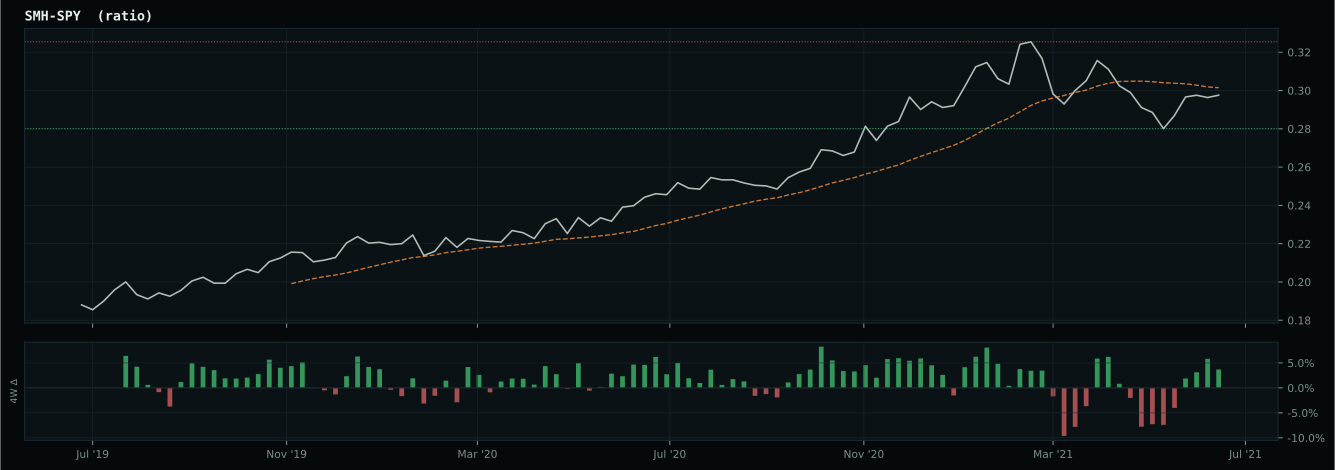
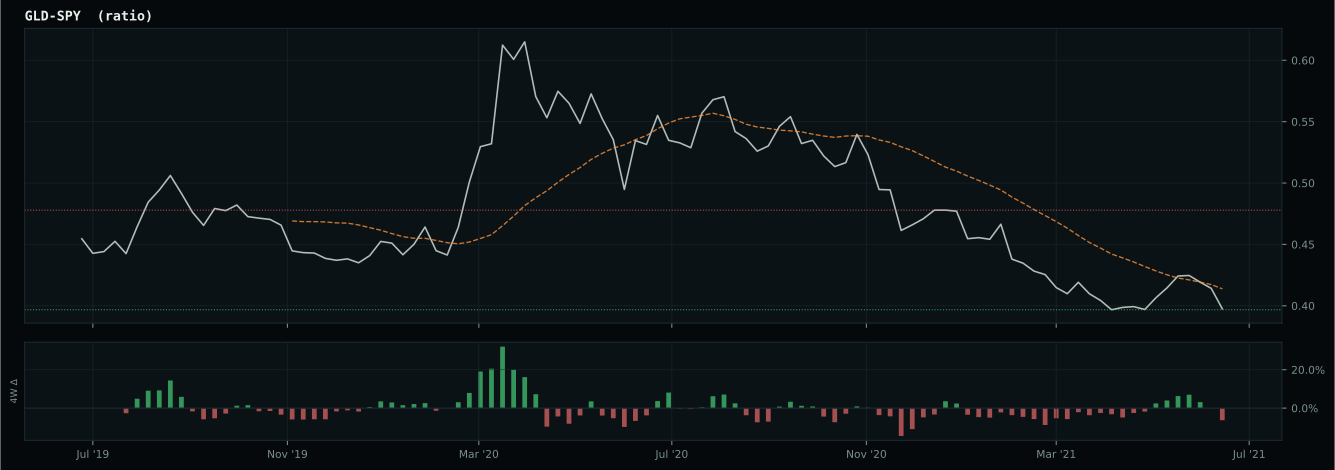
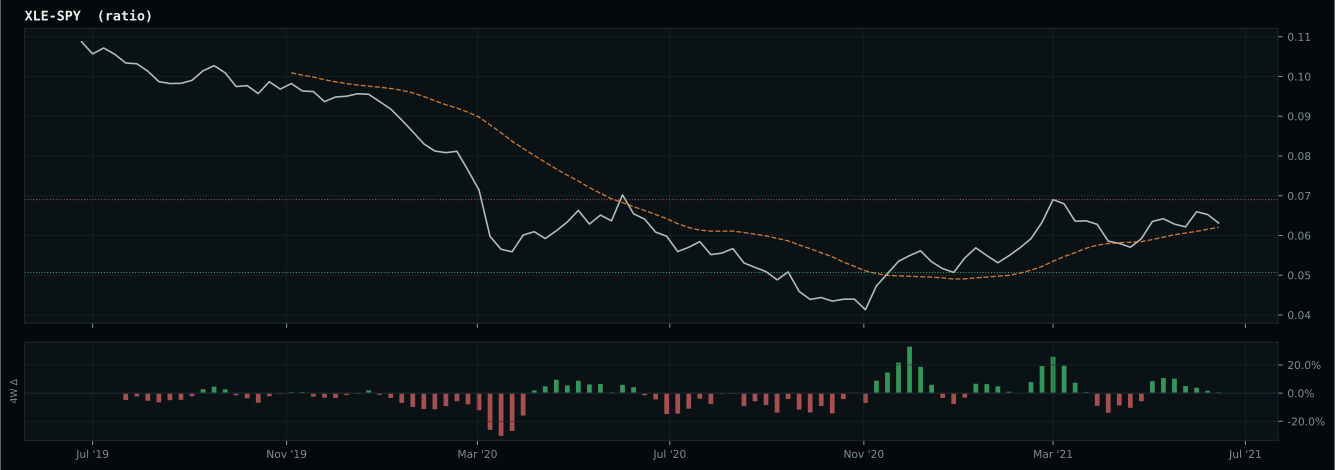
Market-implied signals behind the macro regime scores. Each ratio compares two assets; the direction and slope of the ratio is what the macro engine reads.
Crypto Regime — AltSeason
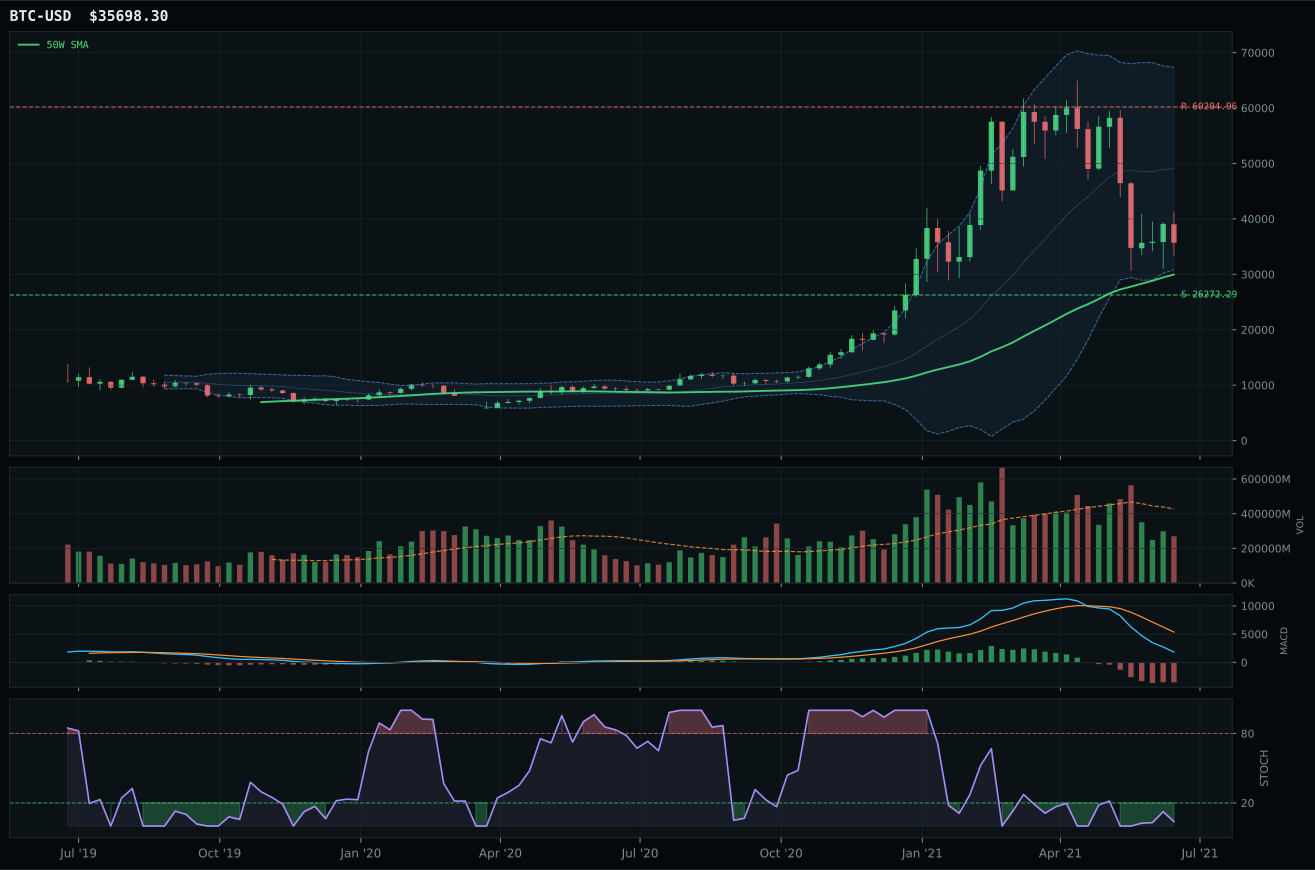
ValueBTC not armed: BTC has not made the first post-breakdown touch of the 200W buy zone after losing the 50W
TrendBTC confirmed: 2 consecutive closes above rising/flat 50W SMA
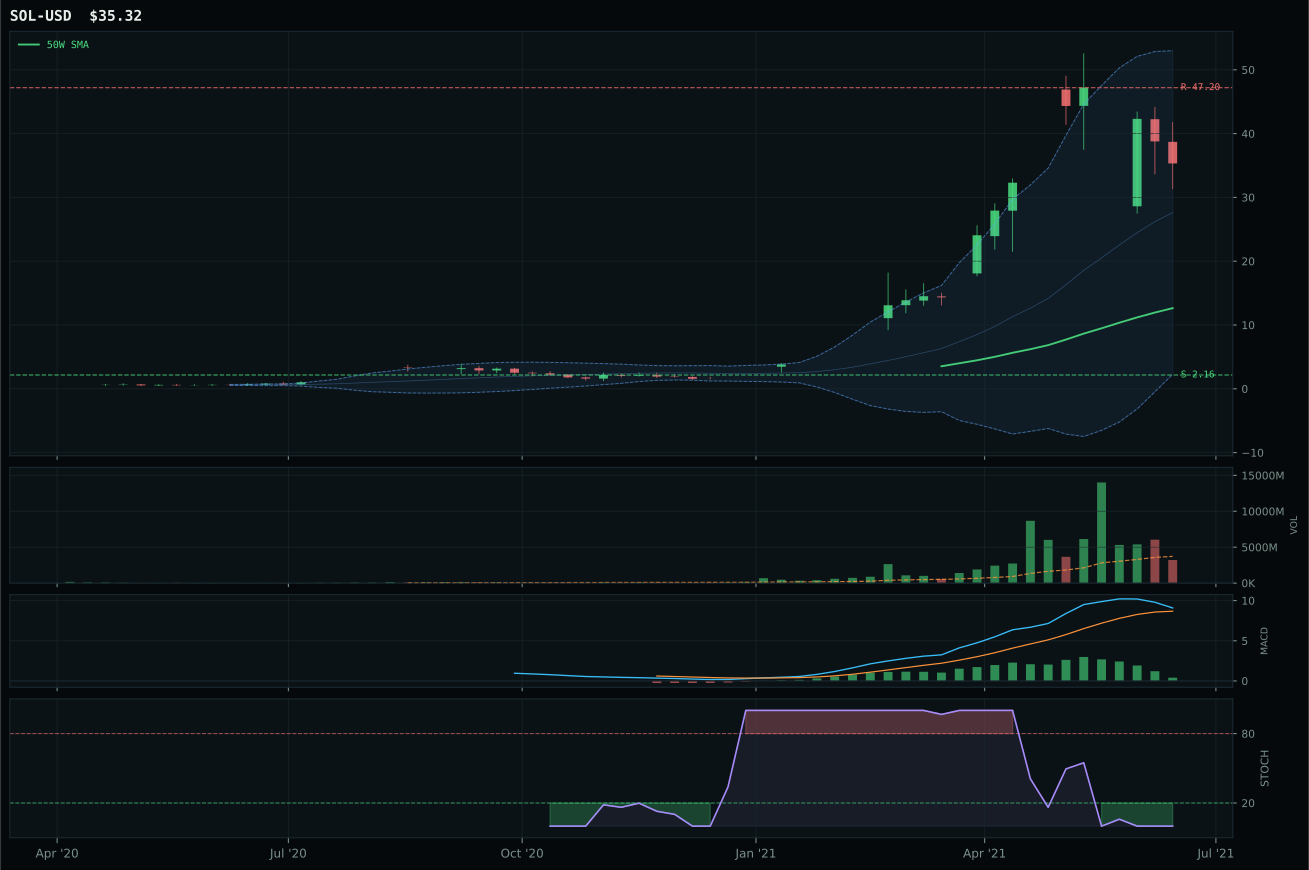
all available AltSeason conditions pass; missing optional confirmations skipped
Category Rankings
| Rank | Category | Winner | Score | Alloc | 4W Ret | Peers (4W) |
|---|---|---|---|---|---|---|
| 1 | Technology | IGV | 71.2 | 20% | +1.95% | CIBR +0.5% · XLK +4.7% |
| 2 | Traditional Energy | FCG | 67.6 | 20% | -11.72% | XOP -13.8% · XLE -10.1% |
| 3 | Emerging Markets | INDA | 66.9 | 10% | -1.08% | ILF -4.3% · IEMG -2.2% |
| 4 | Industrial Metals | REMX | 48.5 | 10% | +19.58% | PICK +1.9% · COPX -2.8% |
| 5 | AI | SMH | 47.7 | 10% | -1.51% | BOTZ -5.4% · AIQ +0.3% |
| 6 | Utilities & Infrastructure | XLU | 39.8 | 10% | +3.43% | IGF -2.3% · PAVE -0.4% |
| 7 | Defense & Aerospace | XAR | 38.8 | 10% | -6.14% | ITA -5.0% · ROKT -4.4% |
| 8 | Agriculture & Livestock | WEAT | 37.4 | 10% | +6.32% | MOO -0.5% · VEGI -2.2% |
| 9 | Precious Metals | SLV | 33.0 | 0% | -2.53% | GLD +1.8% · GDX -3.3% |
| 10 | Nuclear Energy | URA | 31.3 | 0% | -9.82% | NLR -1.9% · URNM -13.7% |
Technology — IGV
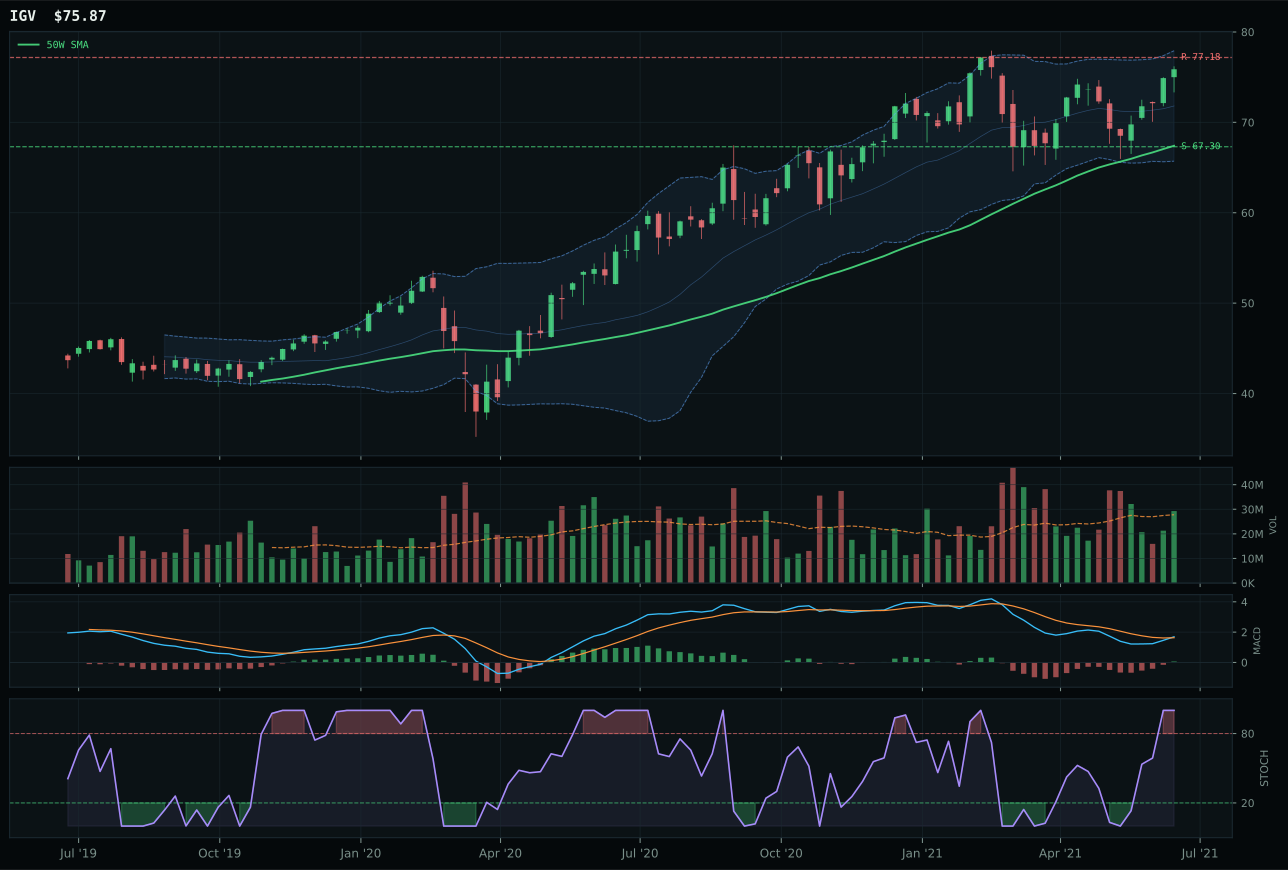
IGV has a neutral structure profile with 6.0% 13-week relative strength versus SPY.
A failed hold above support would weaken the setup.
Actionable but governed by invalidation levels.
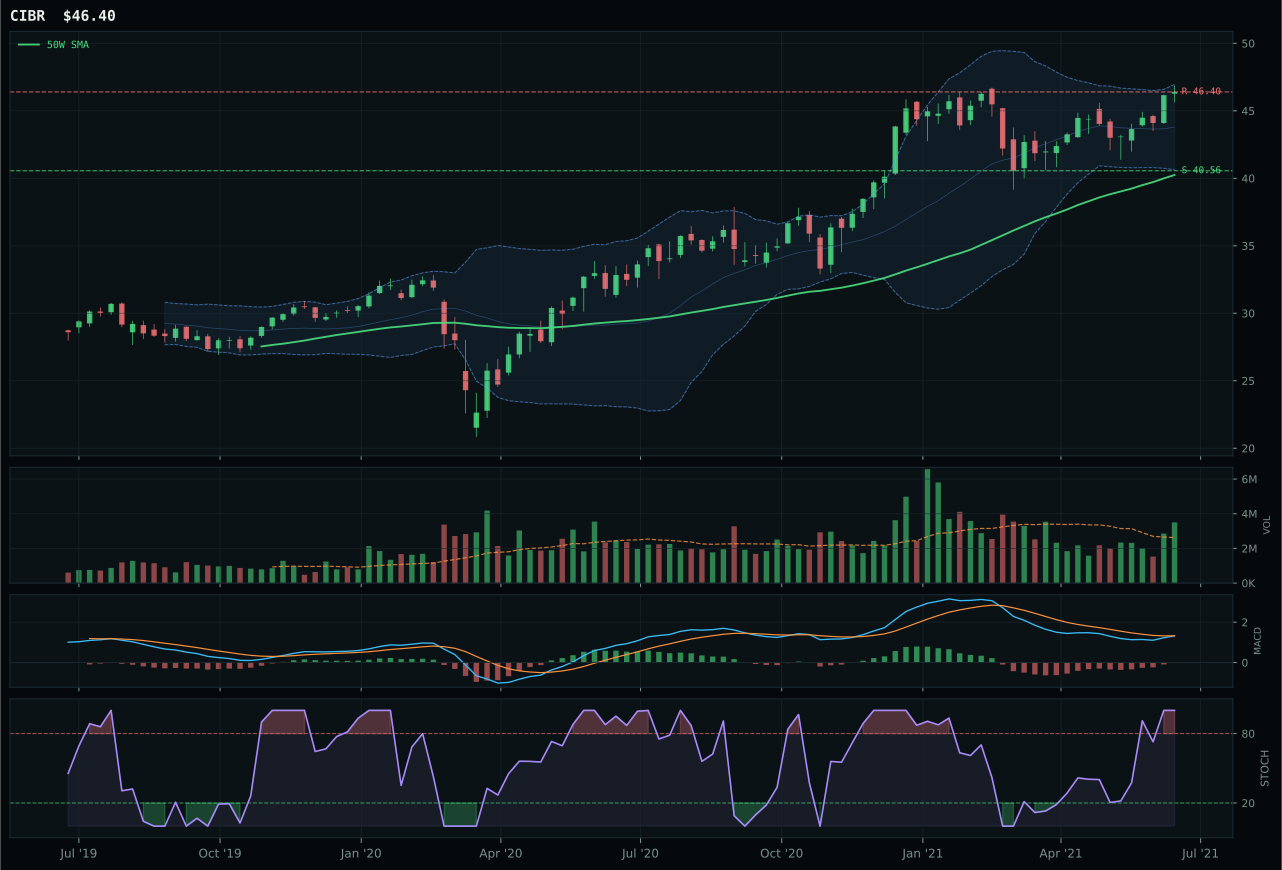
CIBR has a vertical extension profile with 4.3% 13-week relative strength versus SPY.
A failed hold above support would weaken the setup.
Actionable but governed by invalidation levels.
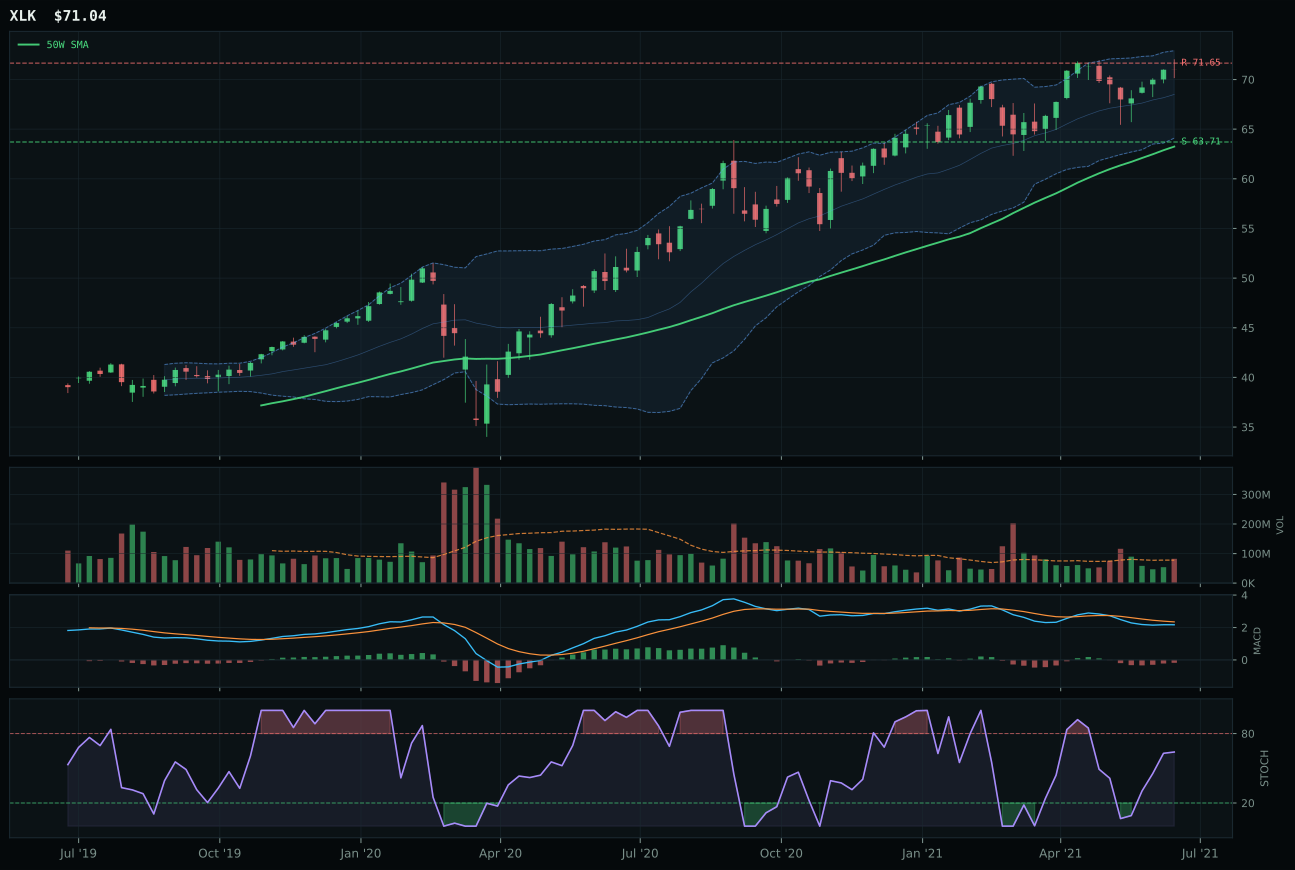
XLK has a neutral structure profile with 3.1% 13-week relative strength versus SPY.
A failed hold above support would weaken the setup.
Actionable but governed by invalidation levels.
IGV wins the category because it commands superior relative strength within its own three-ETF basket—a 1.7% advantage over the category median versus CIBR's flat 0.0%—while maintaining a clean neutral structure that rewards new entry without requiring extended consolidation. Its 6.0% outperformance versus SPY translates into active institutional accumulation on neutral volume, meaning buyers are defending each dip rather than chasing momentum into distribution. CIBR's 10.8% thirteen-week return looks respectable until you compare it side-by-side: IGV's 12.6% thirteen-week return combines with superior timing (59.0 vs 37.0) to signal that enterprise software is leading cybersecurity, not trailing it. The technical separation is clean—IGV sits 12.6% above its fifty-week moving average with a bullish MACD structure improving in real time, while CIBR's vertical extension at higher distance has already compressed momentum confirmation to 94 from IGV's perfect 100. This is a category decision made by breadth, not just price action.
Technology claims the top-2 overweight slot at 10% with a final score of 71.2 because it ranks among the two highest eligible category scores in this week's portfolio construction. The Goldilocks macro regime provides a natural tailwind for duration-sensitive growth, and liquidity expansion scoring at plus-nine creates favorable conditions for software and digital infrastructure rollups. IGV's combination of perfect trend confirmation (100.0) and perfect momentum confirmation (100.0) against a macro backdrop that actively supports expansion is precisely the risk-adjusted setup that justifies doubling down at the category level. The tension is real: risk-reward is weak at 39.4 because price sits near Fibonacci 0.236 and offers only 1.7% to resistance versus 12.7% downside to support. Yet in a Goldilocks environment with credit stress offsetting some momentum excess, that asymmetry is acceptable because the quality of accumulation (neutral volume on clean structure) suggests this is not a short-term pop but a structural repricing higher. The allocation recognizes that Technology, despite its extension, has earned its seat at the table through superior peer leadership and macro sponsorship.
Traditional Energy — FCG
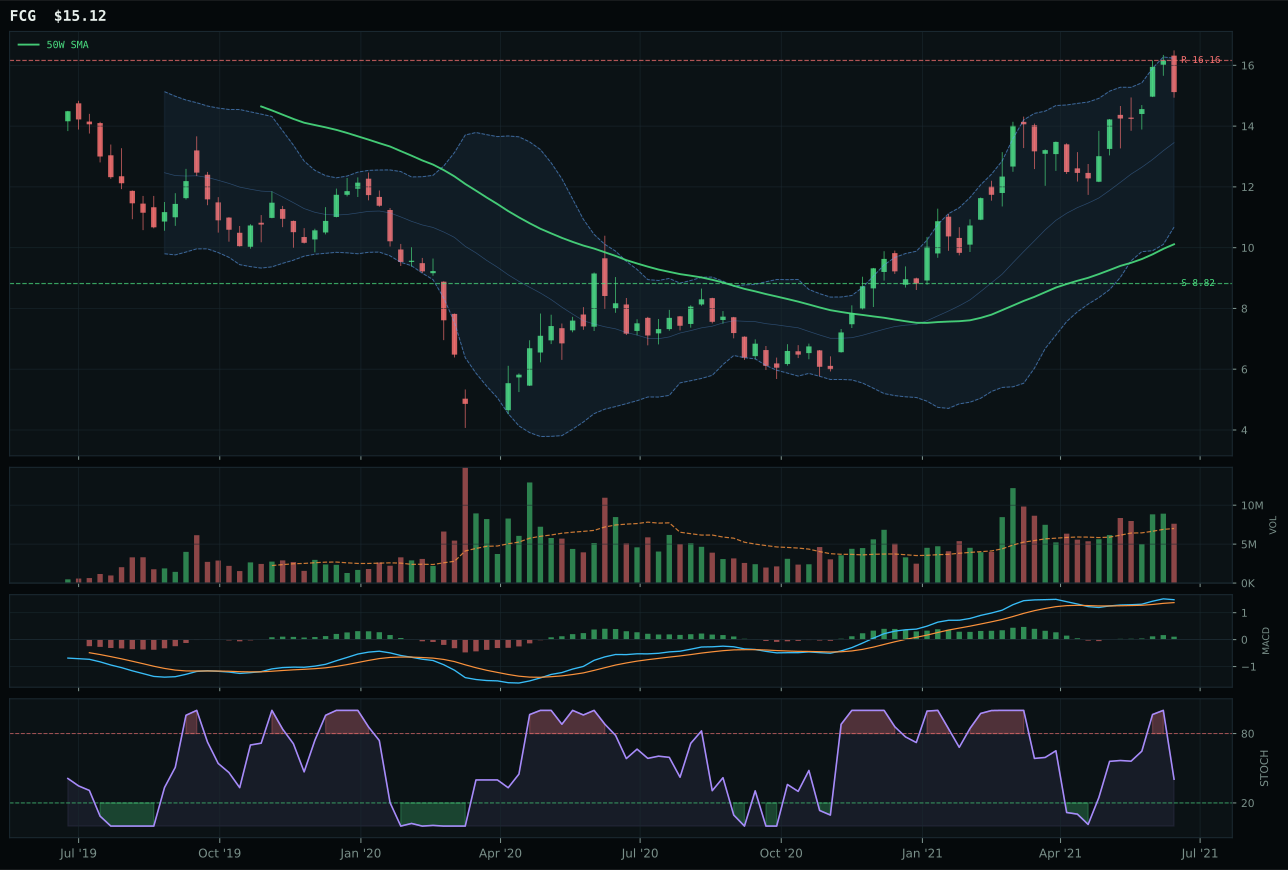
FCG has a vertical extension profile with 8.3% 13-week relative strength versus SPY.
A failed hold above support would weaken the setup.
Actionable but governed by invalidation levels.
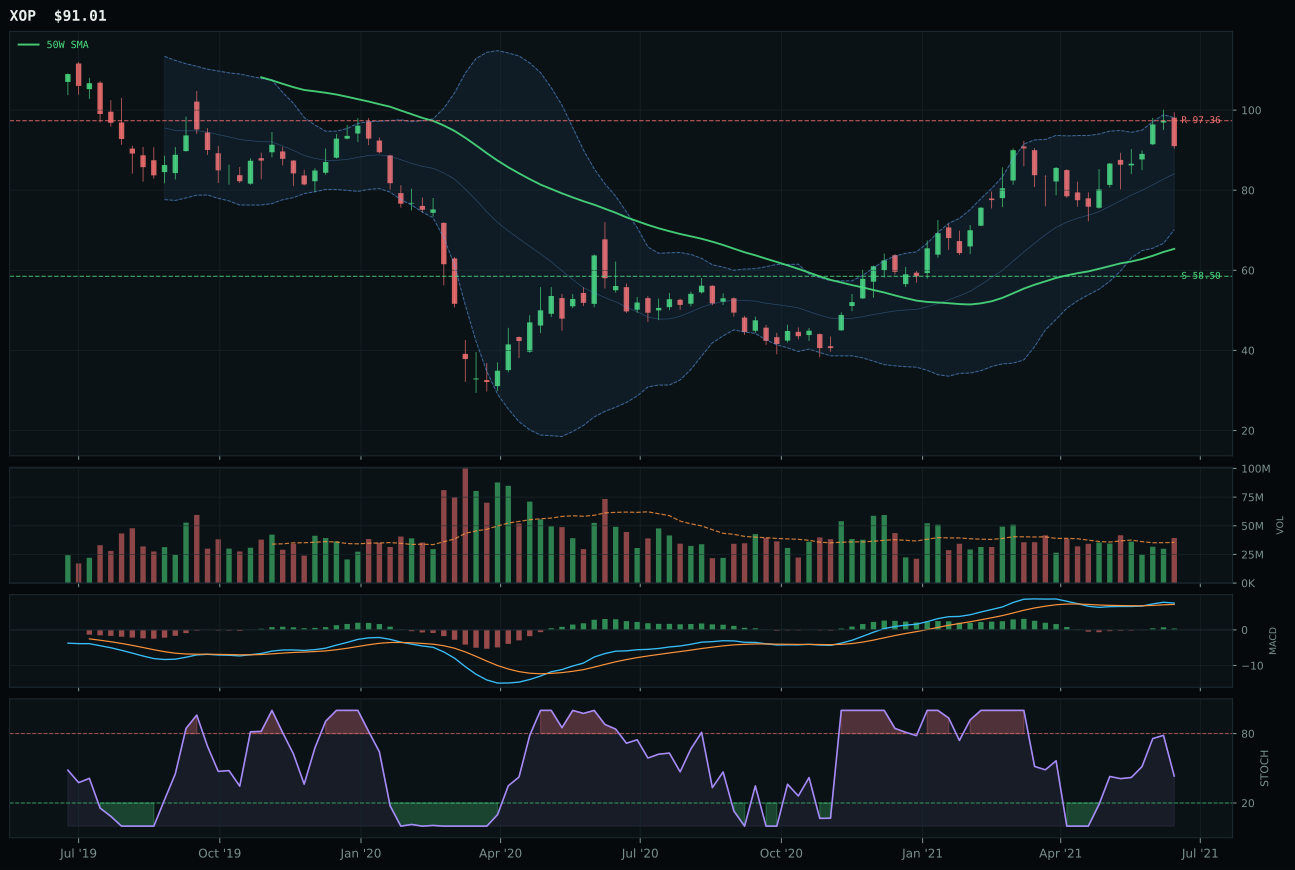
XOP has a vertical extension profile with 2.1% 13-week relative strength versus SPY.
A failed hold above support would weaken the setup.
Actionable but governed by invalidation levels.
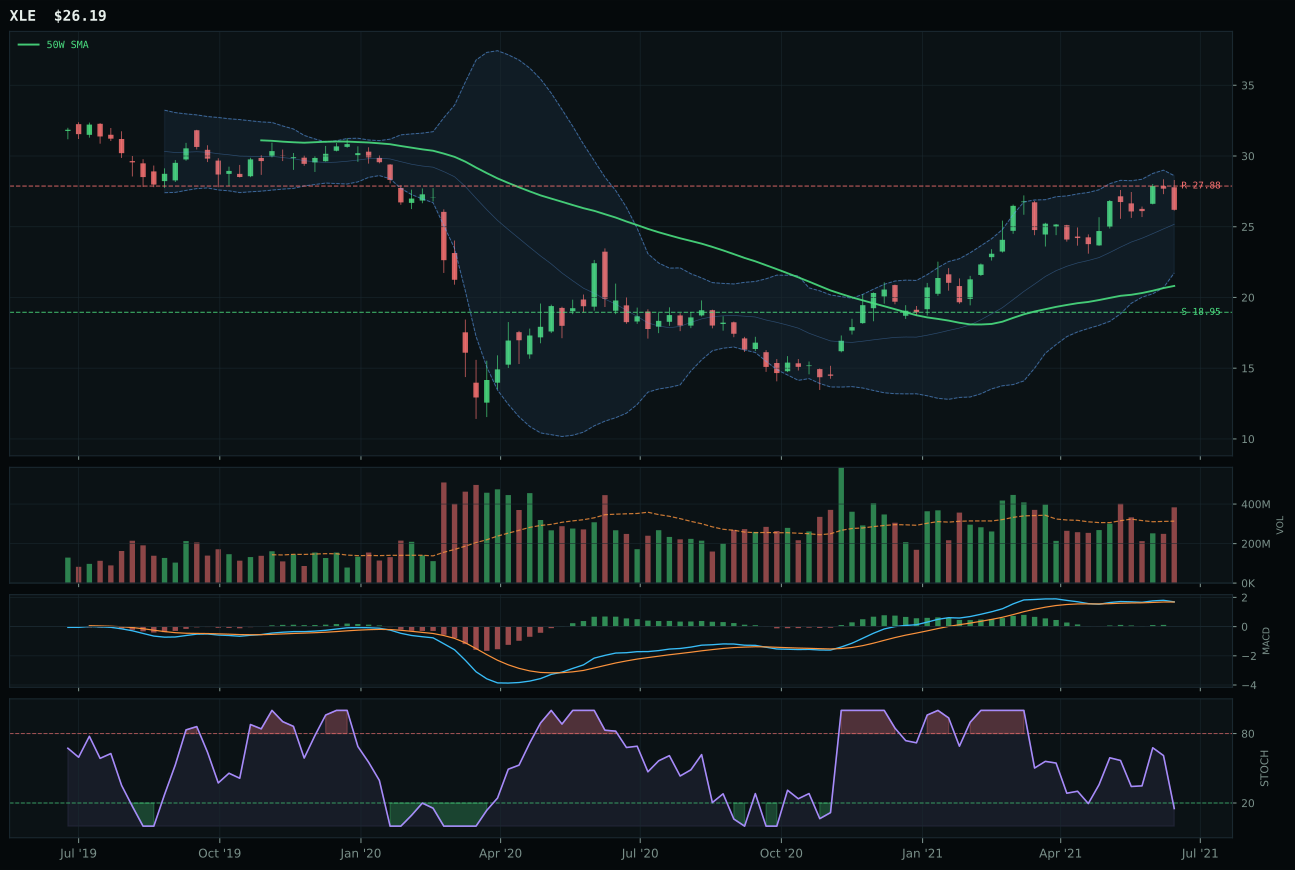
XLE has a vertical extension profile with -0.8% 13-week relative strength versus SPY.
A failed hold above support would weaken the setup.
Actionable but governed by invalidation levels.
FCG wins decisively because it delivers perfect trend confirmation (100.0) and perfect momentum confirmation (100.0), combining a thirteen point eight percent thirteen-week return with eight point three percent RS versus SPY to prove that natural gas futures are leading the energy complex with genuine institutional demand, not just technical relief. XOP's eight point seven percent thirteen-week return lags, its RS versus SPY is only 2.1%, and its category-relative strength is flat at 0.0%, meaning exploration betas are lagging the energy narrative despite the bullish MACD structure. FCG's sixty point two percent four-week return is explosive and supported by above-average category-relative strength of 6.1%, whereas XOP's relative strength collapse to zero reveals that the market is choosing natural gas infrastructure over exploration upside. Both charts sit in upper retracement zones and are extended, yet FCG's forty-nine point five percent distance from the fifty-week average is defended by a fourteen point eight percent thirteen-week return that proves new buyers keep arriving. The category decision is driven by relative strength and momentum confirmation superiority, not just price extension.
Traditional Energy ranks among the top-2 overweights at 10% allocation with a final score of 67.6, earning its seat because energy scarcity is actively positive at plus-sixteen and real asset sponsorship adds plus-seven, creating a macro environment where commodity inflation narratives drive portfolio allocation. FCG's technical evidence of 70.1 is respectable despite extension because volume confirmation at 72.2 and persistence at 78.7 prove that the chart is being accumulated into strength, not distributed. The Goldilocks environment explicitly favors real assets, and credit stress at negative-seven is offset by the dominant energy scarcity signal, meaning the macro regime has shifted decisively toward cyclical and commodity-linked exposures. The allocation acknowledges that FCG's risk-reward is weak (negative 6.4% upside haircut) because price sits overextended, yet the macro backdrop is so favorable that the portfolio allocates top-2 capital. The tension between technical extension and macro sponsorship is balanced: FCG is overextended on a twelve-month basis, but the energy scarcity narrative is structural, and Goldilocks conditions support real asset rotation. For this allocation to become uncomfortable, energy scarcity would need to reverse (supply additions), credit stress would need to worsen into a deflationary signal, or price action would need to establish a distribution top with volume-price rejection.
Emerging Markets — INDA
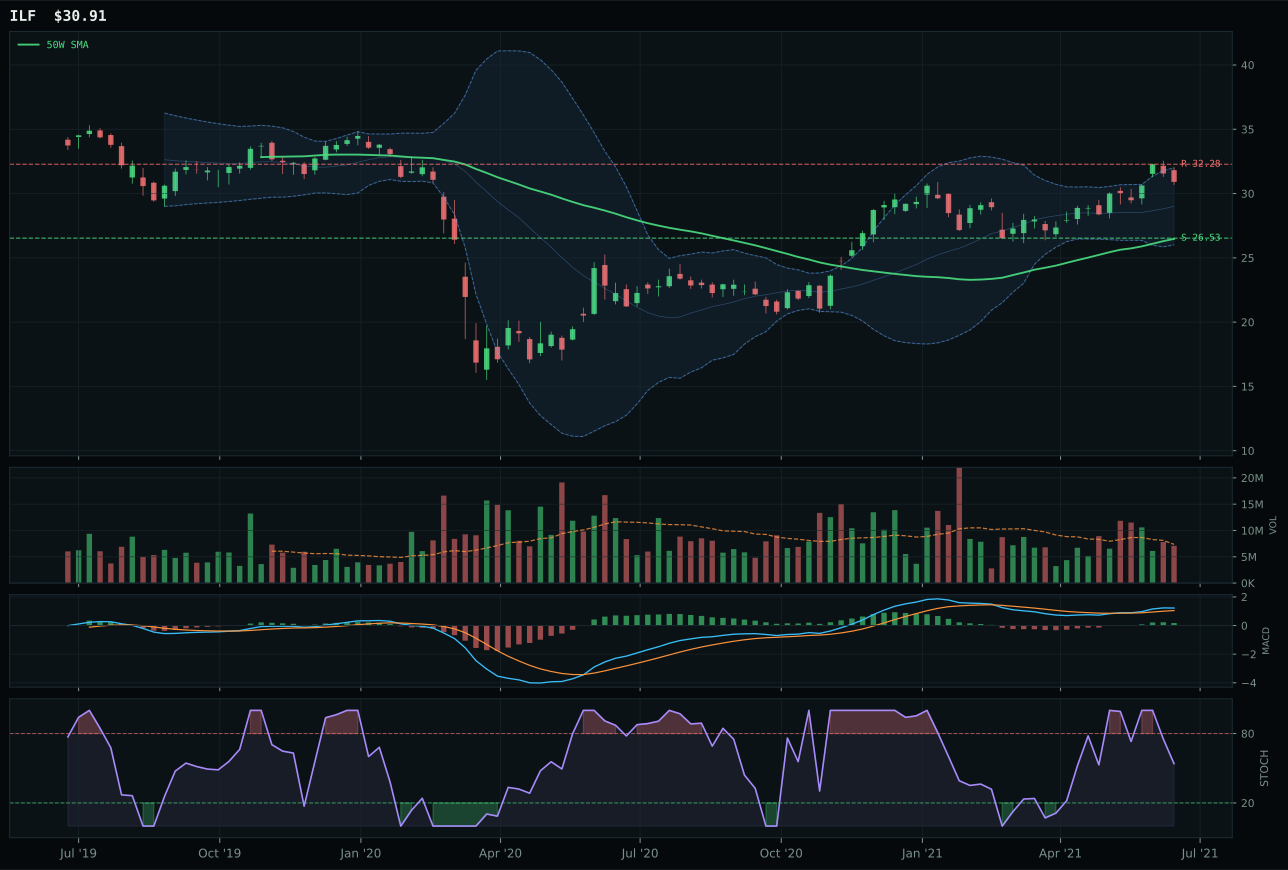
ILF has a vertical extension profile with 3.9% 13-week relative strength versus SPY.
A failed hold above support would weaken the setup.
Actionable but governed by invalidation levels.
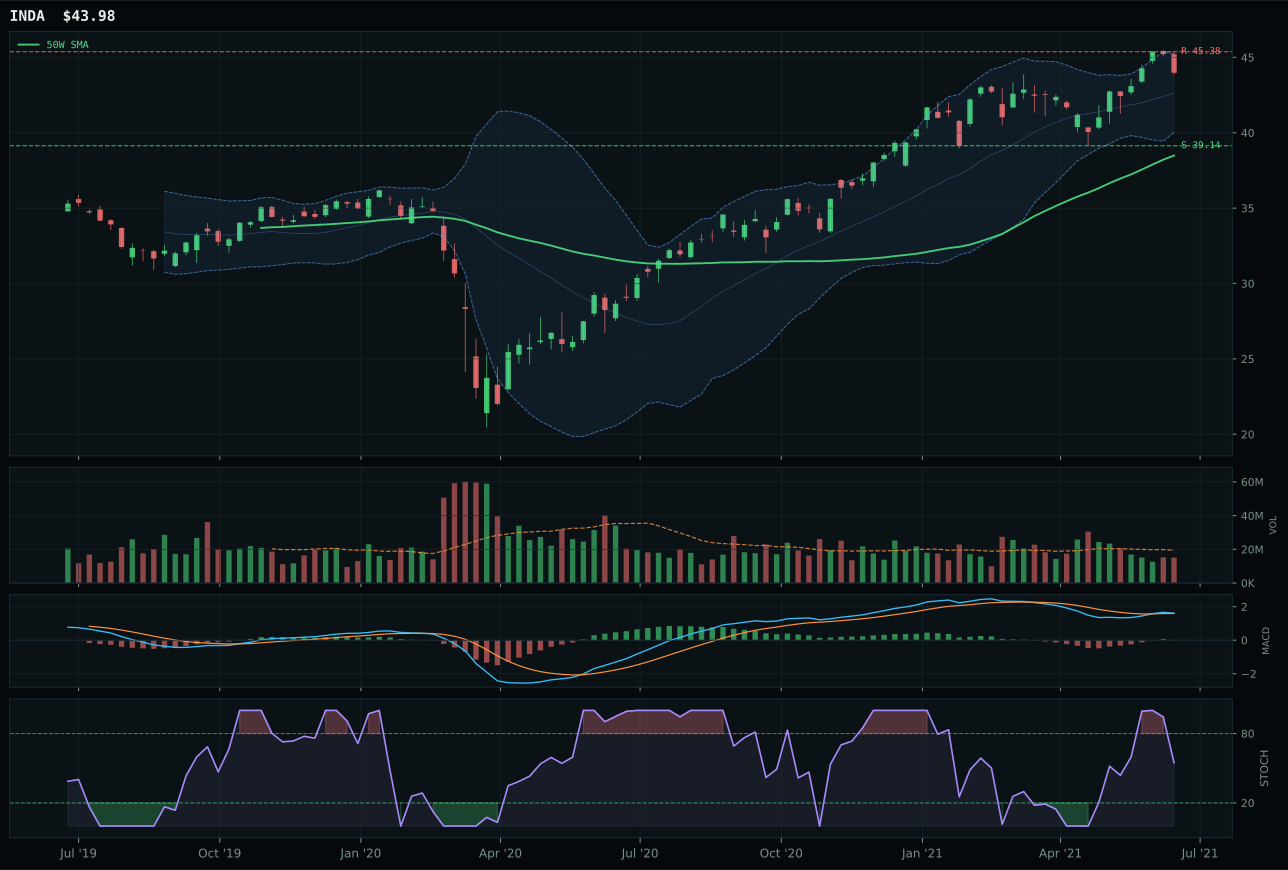
INDA has a neutral structure profile with -3.0% 13-week relative strength versus SPY.
A failed hold above support would weaken the setup.
Actionable but governed by invalidation levels.
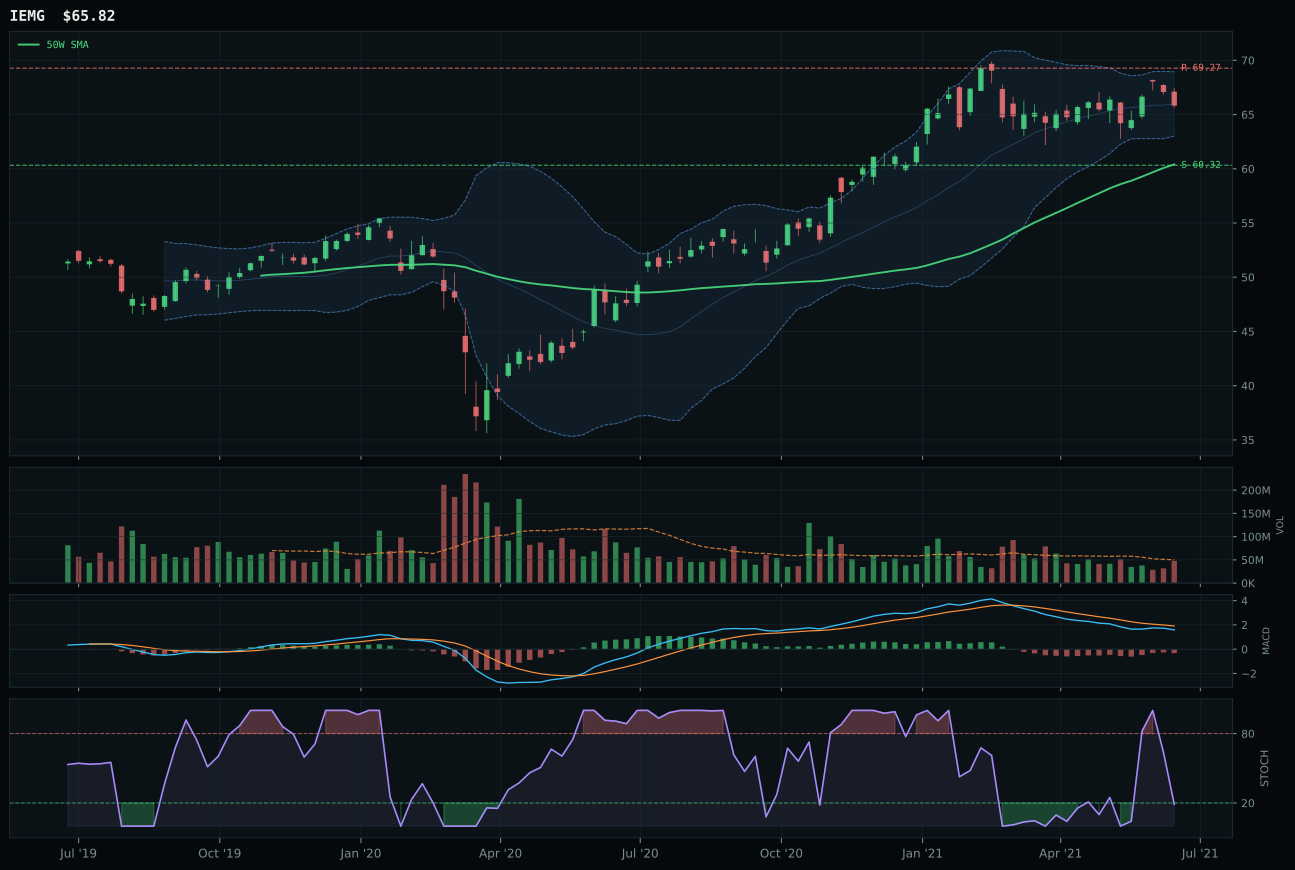
IEMG has a neutral structure profile with -5.5% 13-week relative strength versus SPY.
A failed hold above support would weaken the setup.
Actionable but governed by invalidation levels.
INDA wins because its sixty-seven point zero timing score reflects a fourteen point three percent distance from the fifty-week average that is extended but manageable, while ILF's fifty-three point zero timing score is penalized for a twenty-six point five percent distance that makes new entry risky despite stronger absolute thirteen-week returns. INDA's zero point zero percent category-relative strength ties ILF's 6.9%, yet INDA's neutral structure (70.0) is superior to ILF's vertical extension (66.0), and that setup quality matters when both charts have stochastic RSI falling-neutral and MACD bullish-improving. ILF's sixty-one point zero macro fit is stronger because commodity breadth positive (8.0), metals scarcity (5.0), and real asset sponsorship (6.0) all favor Latin America's commodity beta, yet INDA's seventy point zero category macro fit benefits from em liquidity support at plus-fourteen, which directly addresses India's position in the emerging market rotation. The category decision is driven by technical microstructure: INDA offers cleaner entry geometry despite weaker macro tailwinds.
Emerging Markets lands at tier-2 with a 5% allocation and a final score of 66.9, supported by category macro fit of 70.0 because em liquidity support is active at plus-fourteen and Goldilocks adds plus-eight. INDA's technical evidence of 72.5 is solid, combining trend at 95.6 with reasonable timing and risk-reward that positions India as the highest-conviction emerging market setup this week. The category's strength comes from its macro profile: liquidity expansion at plus-eight and em liquidity support at plus-fourteen create favorable conditions for capital rotation into Asia-focused exposures, while credit stress at negative-ten suggests that Latin America's commodity leverage may be constrained. INDA's three point six percent thirteen-week return is modest, yet its bullish-improving MACD and falling-neutral stochastic RSI suggest the chart is in the early phase of a new impulse, not near peak extension. The allocation respects that ILF's ten point five percent thirteen-week return is attractive, but the macro environment is favoring India's quality-growth narrative over Latin America's commodity beta this cycle. For Emerging Markets to move to tier-1, INDA's RS versus SPY (currently negative 3.0%) would need to flip positive, proving that the Indian rotation is actually leading the market rather than just catching up.
Industrial Metals — REMX
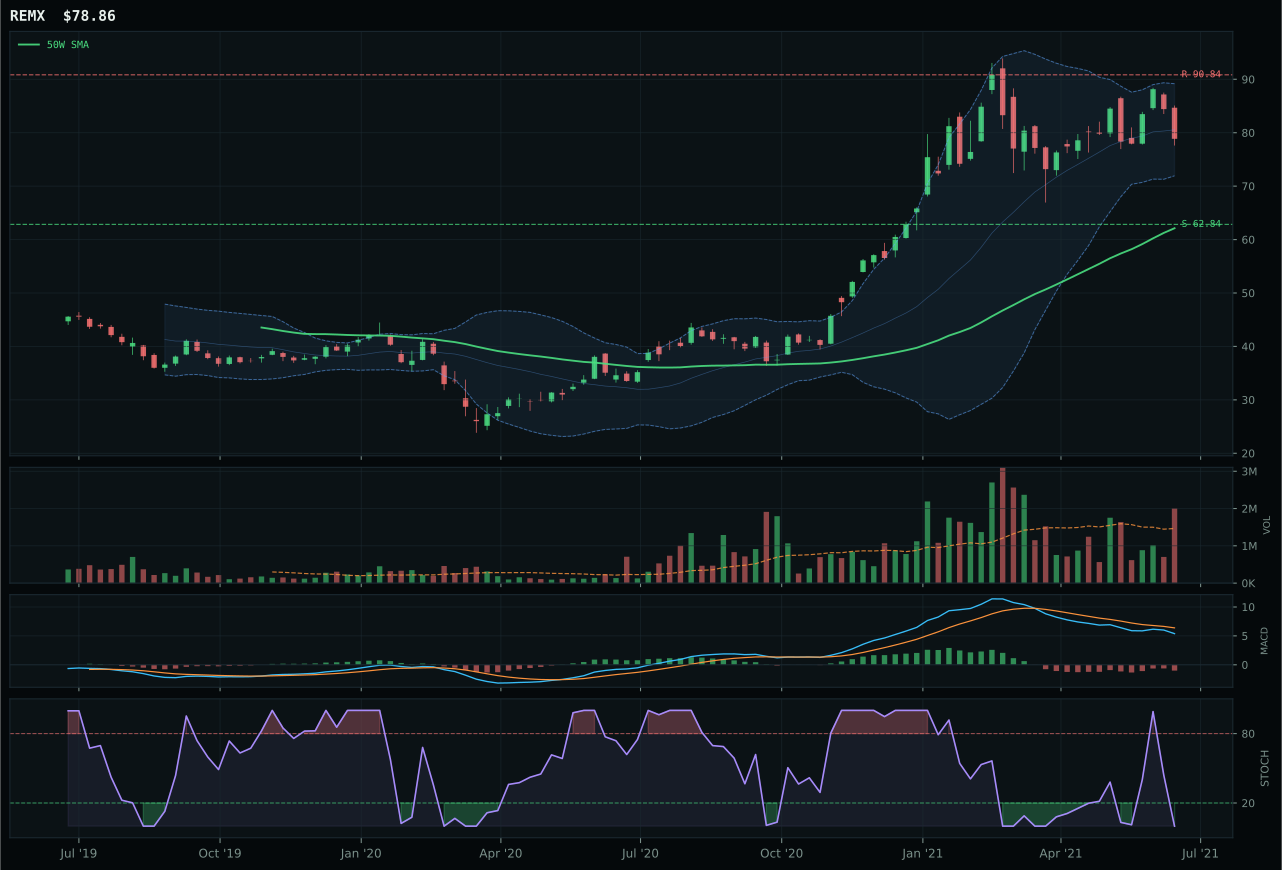
REMX has a vertical extension profile with -4.3% 13-week relative strength versus SPY.
A failed hold above support would weaken the setup.
Actionable but governed by invalidation levels.
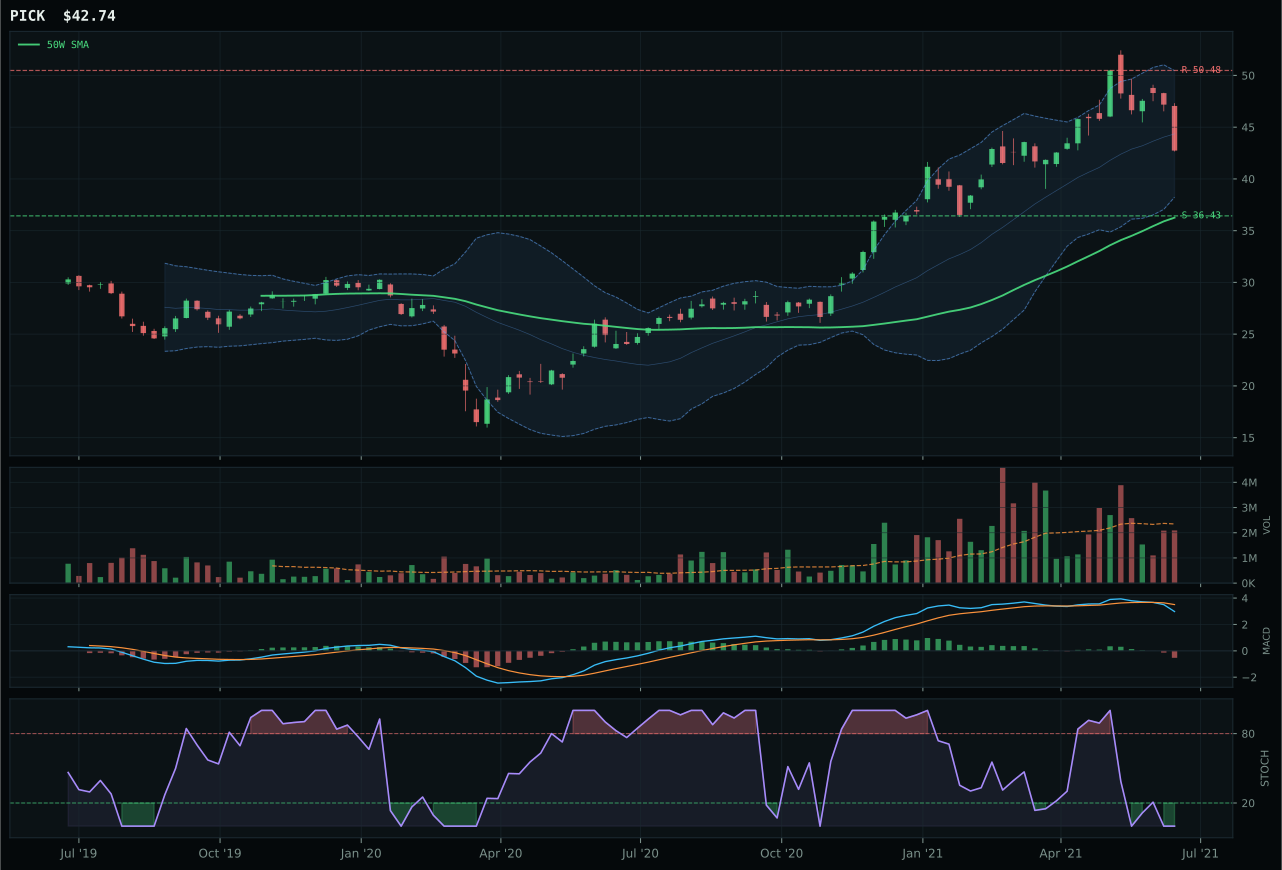
PICK has a vertical extension profile with -4.0% 13-week relative strength versus SPY.
A failed hold above support would weaken the setup.
Actionable but governed by invalidation levels.
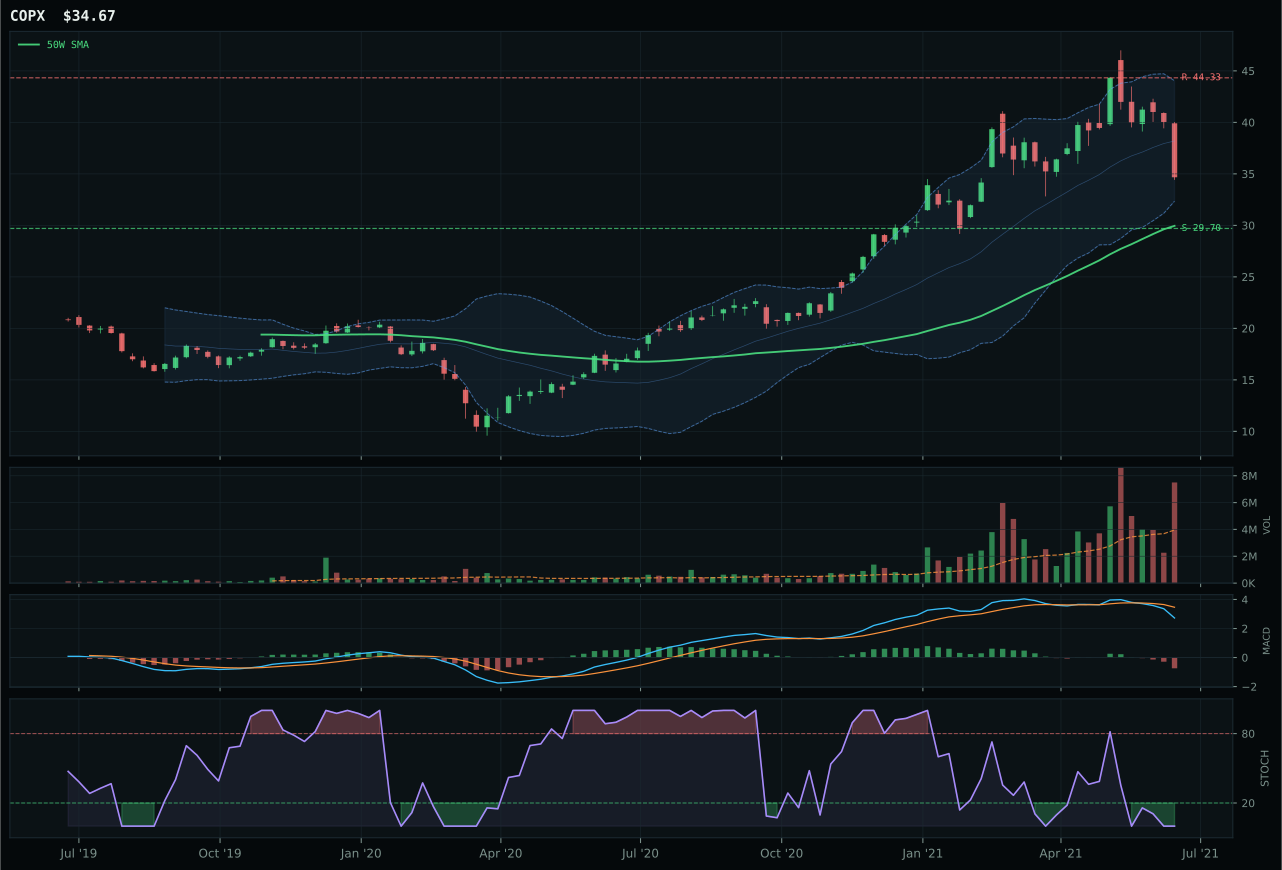
COPX has a vertical extension profile with -10.8% 13-week relative strength versus SPY.
A failed hold above support would weaken the setup.
Actionable but governed by invalidation levels.
REMX wins a close call over PICK because its above-average participation at 1.37x the twenty-week average provides the only volume-based evidence that any institutional buyer cares about rare earth scarcity, whereas PICK's neutral volume and PICK's bearish-weakening MACD structure suggest miners are struggling to attract fresh capital. Both charts sit extended and oversold, but REMX's timing score of 53.0 edges PICK's 48.0 because the stochastic RSI has fully collapsed (0.00) and the Fibonacci zone is cleaner near 0.236. REMX's fifty-two point eight momentum confirmation is mediocre, yet its bearish-but-improving MACD tells a different story than PICK's bearish-weakening print: one suggests reversal risk while the other suggests reversal is already priced in. The category-relative strength is identical at zero point zero percent, confirming this is a peer-leadership dead heat that breaks on technical microstructure, not relative value. REMX's sixty-one point two upside-downside ratio (13.2% upside haircut, 25.5% downside cushion) at least provides asymmetry in the event of reversal.
Industrial Metals earns a 5% tier-2 allocation with a final score of 48.5, buoyed by the strongest category-level macro fit in the portfolio at 79.0 because metals scarcity is active at plus-fourteen, commodity breadth positive is active at plus-ten, real asset sponsorship is active at plus-six, and Goldilocks adds plus-six. That macro profile is exceptional and is the reason this category avoids zero allocation despite moderate technical evidence of 49.3 from the representative. REMX's technical setup is extended and oversold with weak momentum confirmation, yet the macro environment is actively sponsoring the trade: a Goldilocks regime combined with scarcity signals tells allocators that the fundamental shortage narrative is intact even if price has overextended near-term. The tension is explicit: technical evidence says consolidation and repair are coming, yet macro sponsorship says the structural trade remains intact and dips should be bought. The allocation respects the macro superiority while appropriately capping the position at tier-2 because the entry risk (26.9% from the fifty-week average) is real. For REMX to move to tier-1, technical evidence would need to improve through a consolidation phase that allows MACD to reset, stochastic RSI to rise from extremes, and volume confirmation to shift from above-average participation (distribution risk) to neutral accumulation.
AI — SMH
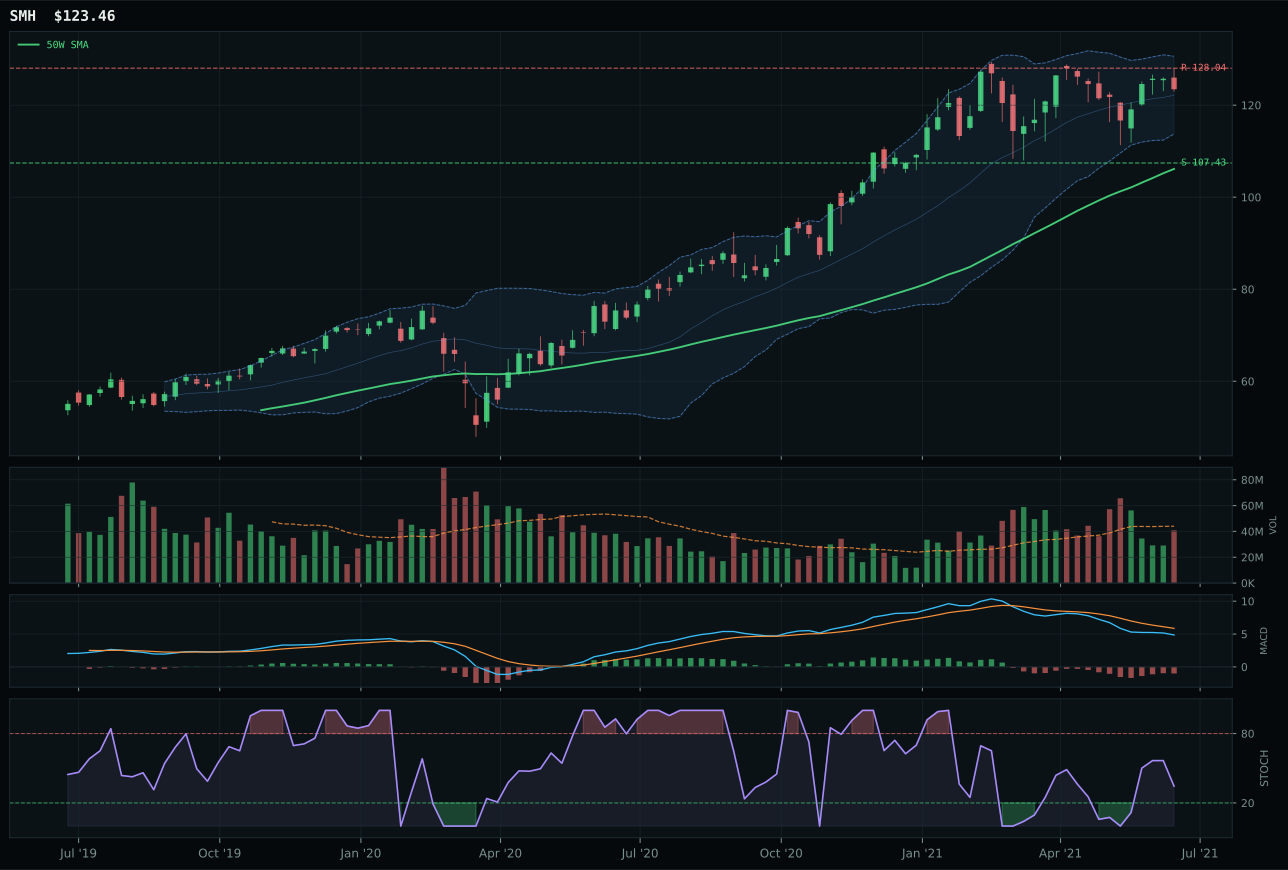
SMH has a vertical extension profile with -0.9% 13-week relative strength versus SPY.
A failed hold above support would weaken the setup.
Actionable but governed by invalidation levels.
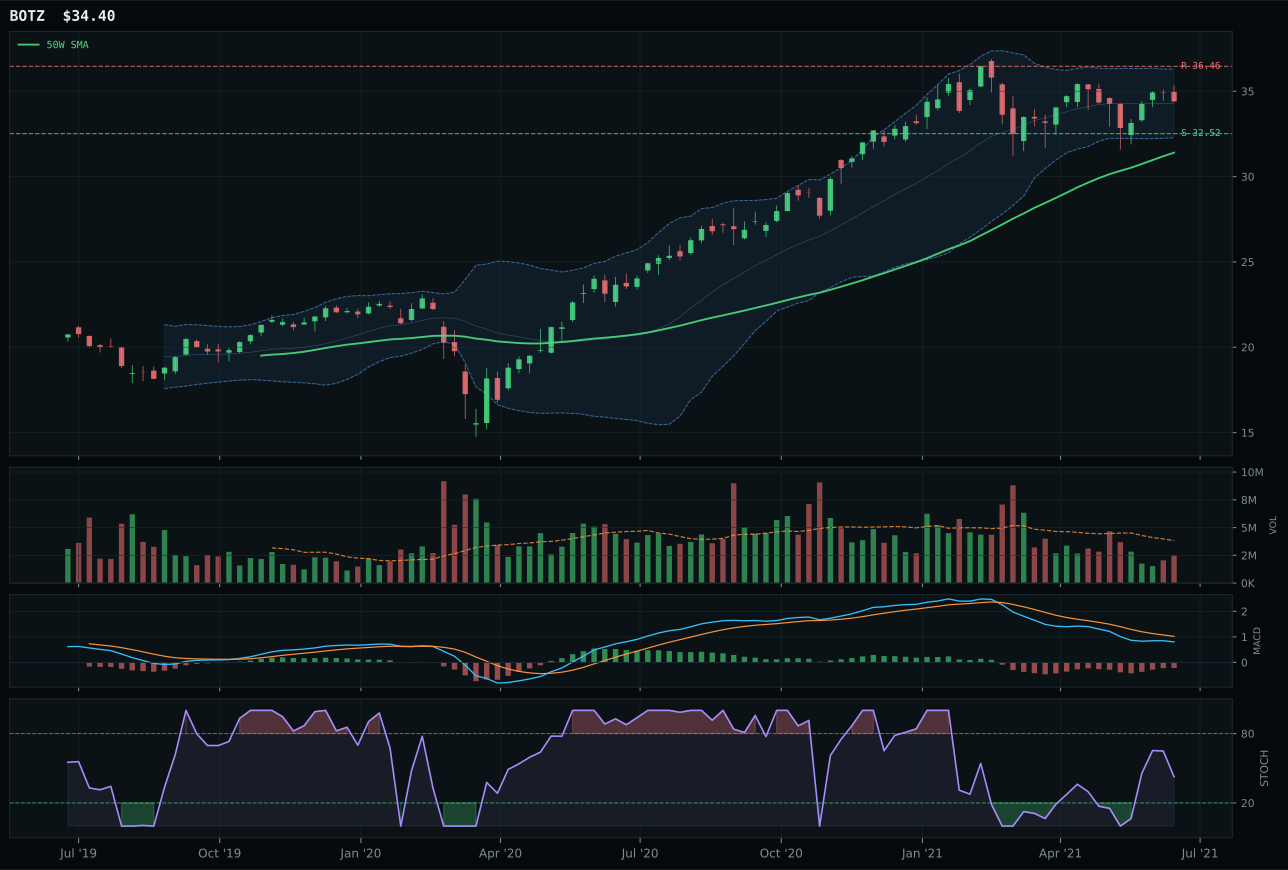
BOTZ has a neutral structure profile with -3.5% 13-week relative strength versus SPY.
A failed hold above support would weaken the setup.
Actionable but governed by invalidation levels.
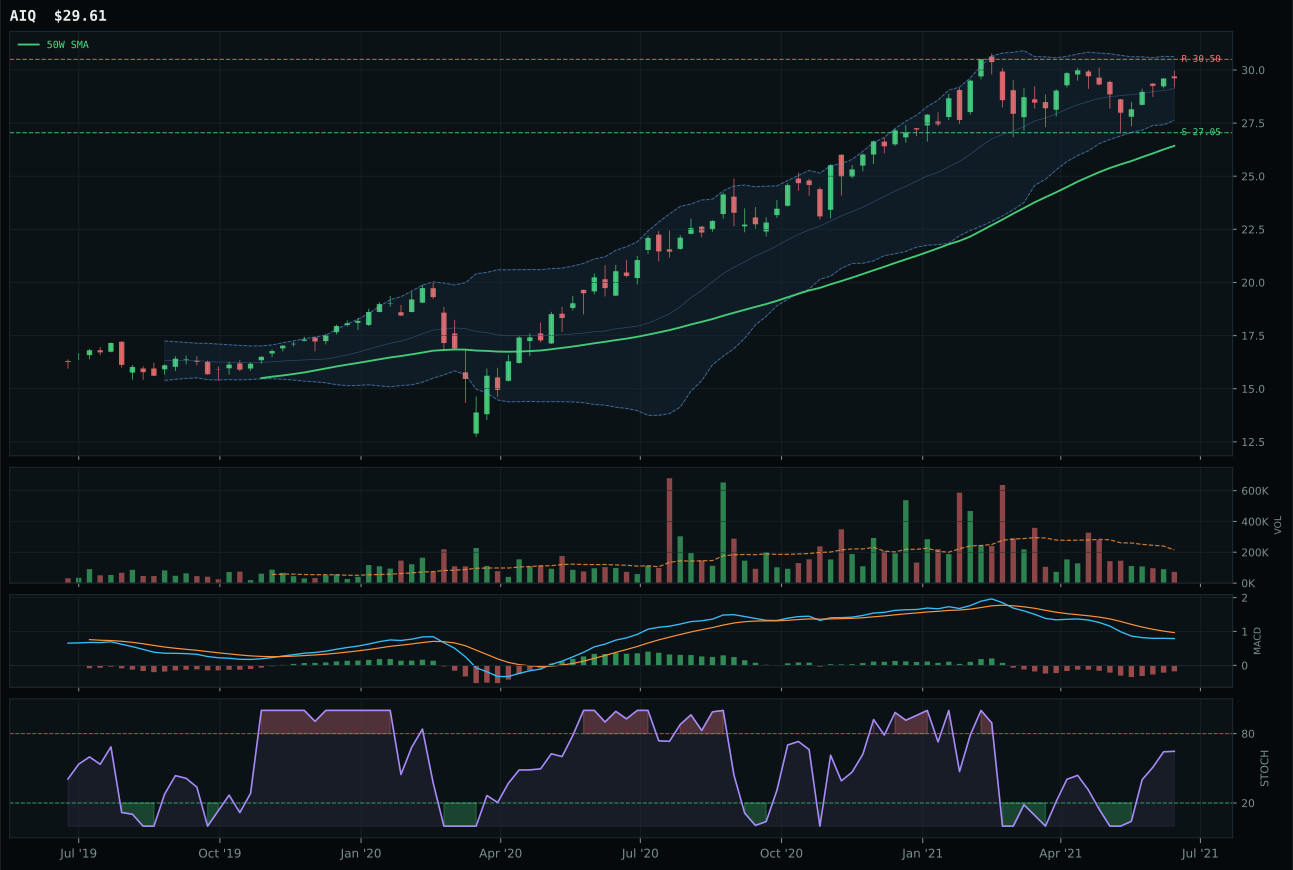
AIQ has a neutral structure profile with -2.5% 13-week relative strength versus SPY.
A failed hold above support would weaken the setup.
Tracked, but not top-2 eligible because: .
SMH wins because it holds category-relative strength of 1.6% while BOTZ stumbles to negative 1.0%, a 2.6-point swing that reveals which compute-driven narrative is actually accumulating fresh capital. Both charts display the same bearish-but-improving MACD and identical oversold stochastic RSI conditions, but SMH's neutral volume participation (0.93x) is superior to BOTZ's thin participation, signaling that the move is not leaning on desperate breakout buying. The structure score gap (73.0 vs 69.9) reflects SMH's cleaner extension—sixteen point three percent above the fifty-week line is extended but honest, whereas BOTZ's neutral structure setup cannot fully justify its depth penetration without confirmation. BOTZ's superior timing score (75.0 vs 53.0) is a mirage: when a chart sits oversold and near support, good timing just means better entry geometry, not better momentum. SMH's five point seven percent thirteen-week return is deliberately penalized for distance to the moving average, yet its category leadership inside the AI basket is unambiguous.
AI lands at tier-2 with a 5% allocation despite a final score of 47.7, which reflects category rank above the zero-percent line but below the top-2 overweights. The Goldilocks macro regime adds ten points and liquidity expansion adds another ten, yet credit stress deducts eight, leaving category macro fit at 62.0—respectable but not compelling. SMH's technical evidence at 55.8 is genuinely weak because the chart is extended into unfavorable risk-reward (negative 3.6% upside to resistance) with thin momentum confirmation across the four-week and thirteen-week returns. This category earned its allocation slot because it avoids zero and because the macro environment has not yet turned hostile to semiconductor and robotics cyclicality, but the portfolio is right to size it at half the weight of top-tier categories. For AI to move into the top-2 tier, category-relative strength would need to accelerate, volume confirmation would need to shift from neutral to above-average sponsorship, and the MACD would need to shift from bearish-improving to full bullish confirmation. Those conditions are not present this week.
Utilities & Infrastructure — XLU
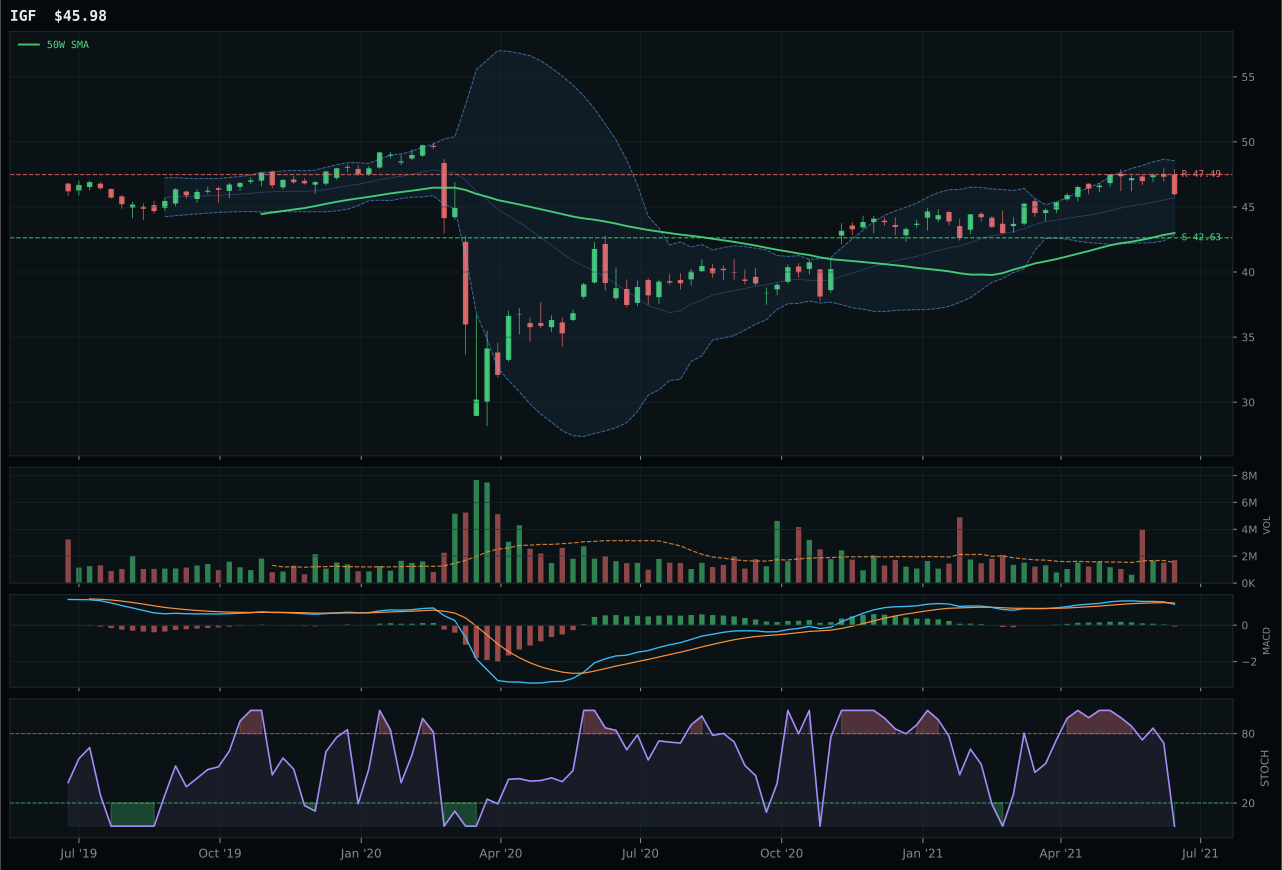
IGF has a neutral structure profile with -3.3% 13-week relative strength versus SPY.
A failed hold above support would weaken the setup.
Actionable but governed by invalidation levels.
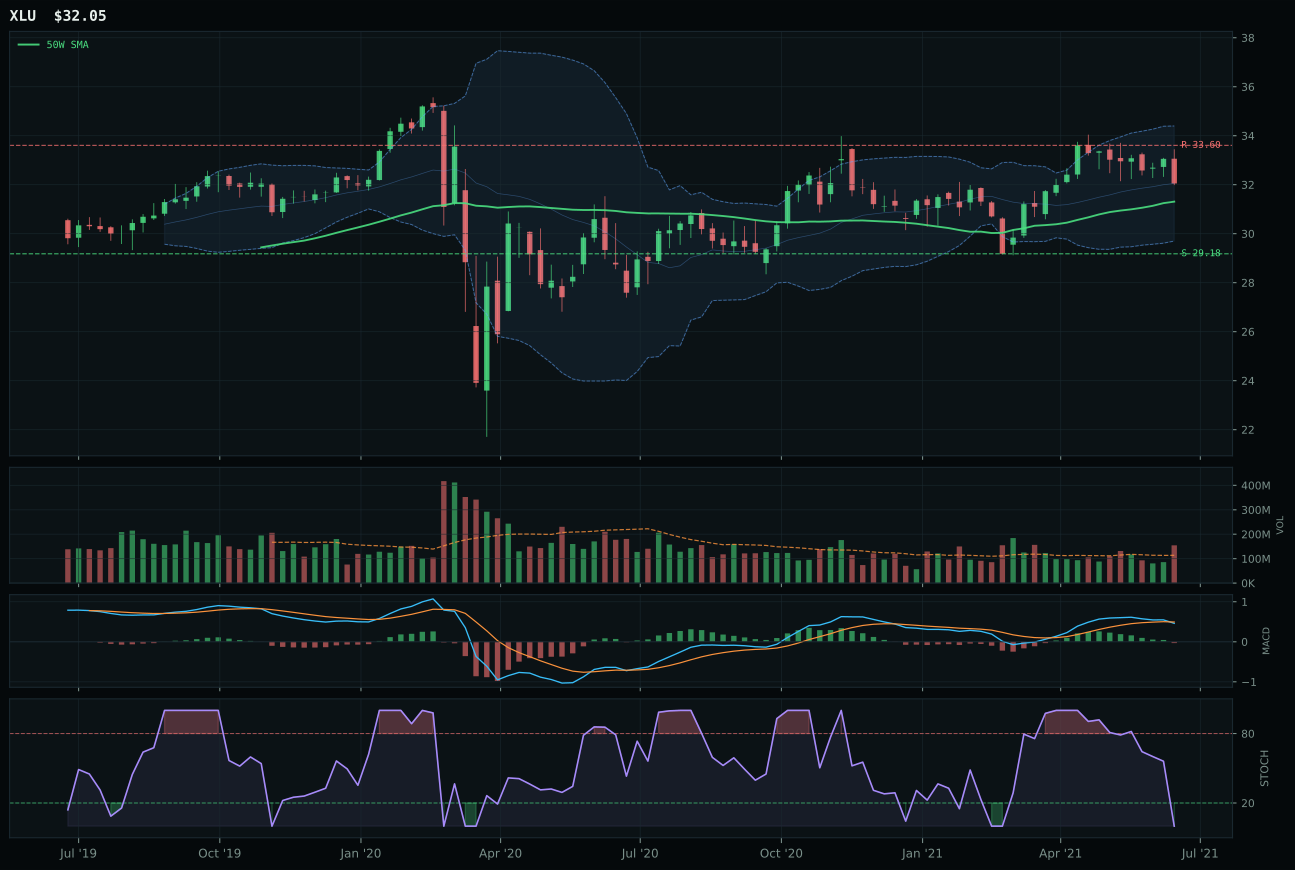
XLU has a compression near 50W profile with -3.5% 13-week relative strength versus SPY.
A failed hold above support would weaken the setup.
Actionable but governed by invalidation levels.
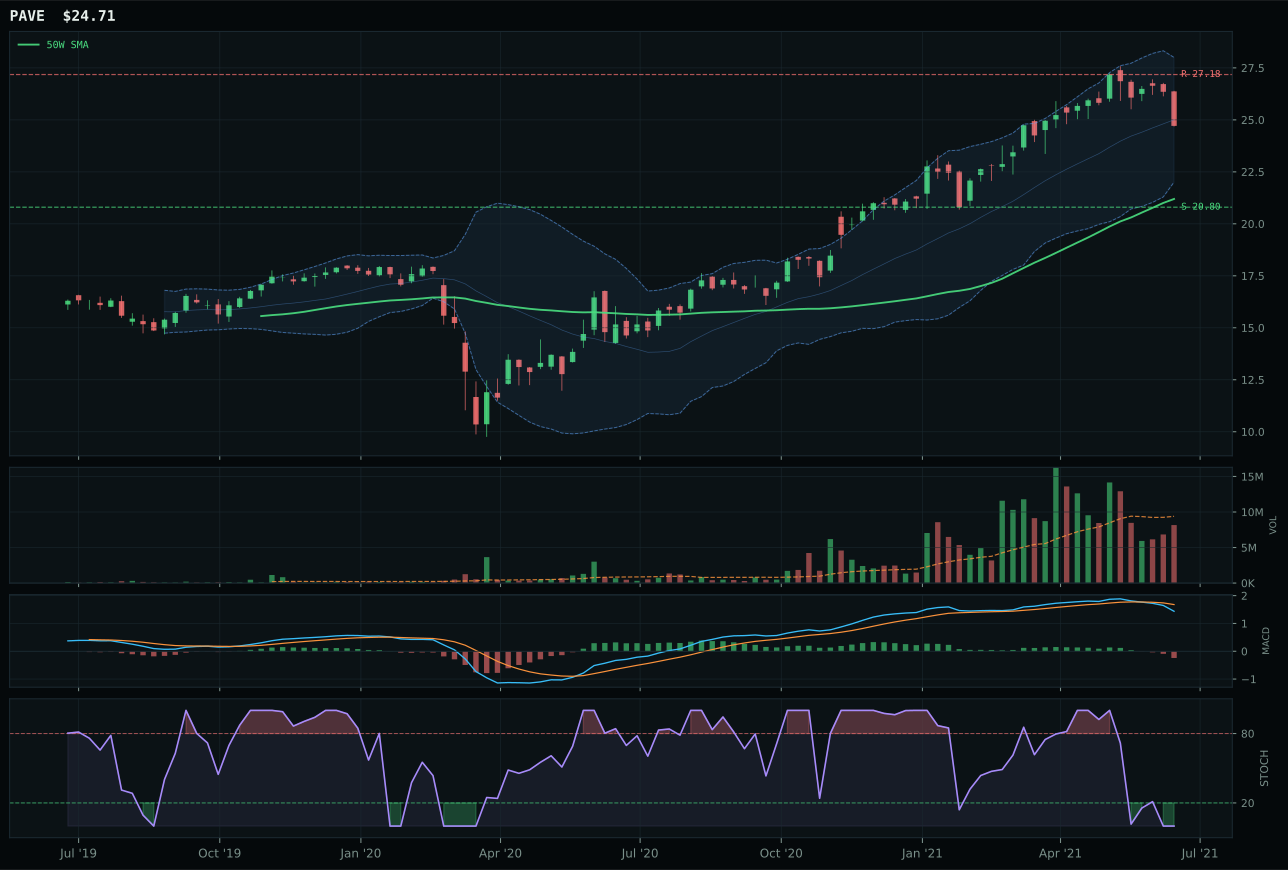
PAVE has a vertical extension profile with -4.6% 13-week relative strength versus SPY.
A failed hold above support would weaken the setup.
Actionable but governed by invalidation levels.
XLU wins because its ninety-five point zero timing score reflects a chart compressing near the fifty-week average (2.4% distance) with perfect oversold stochastic RSI (0.00) and bearish-weakening MACD—a setup that creates defined risk and expansion potential if buyers defend the current level. IGF's timing score of seventy point zero penalizes a chart that is not quite as cleanly positioned at support, and while both display similar weak momentum confirmation, XLU's compression-near-average structure (77.8) is superior to IGF's neutral structure (76.3) because compression implies the next directional move will be sponsored by accumulated demand, not false breakouts. Both charts are under pressure from weak momentum (4W returns near negative 3%), yet XLU's acceptance of the fifty-week average as support is technically superior to IGF's drift higher into distribution. The category decision is driven by entry geometry: when both utilities and infrastructure are weak, the setup with the clearest support band wins.
Utilities & Infrastructure receives 5% tier-2 allocation with a final score of 39.8, significantly below Technology and Energy but above zero because the category avoids active macro headwinds. Category macro fit is 54.0, aided modestly by plus-four from transition-mixed conditions, yet no active descriptor strongly favors regulated utility or infrastructure exposure. XLU's technical evidence of 41.8 reflects weakness across the board: momentum confirmation is poor at 31.2, structure cleanliness is mediocre, and volume-price confirmation at 38.1 suggests institutions are not accumulating defensive rotation. The allocation acknowledges that Goldilocks conditions do not require defensive hedges, and therefore utilities rank below offensive growth and commodity-linked exposures. The portfolio sizes Utilities & Infrastructure at tier-2 because the category avoids active negatives and because XLU's compression-near-average setup provides reasonable risk-reward for defensive rotation if macro conditions deteriorate. To move to tier-1, XLU would need to establish a pattern of higher lows with improving MACD confirmation and volume-based accumulation that proves portfolio managers are rotating into safety. Those signals are absent in a Goldilocks environment.
Defense & Aerospace — XAR
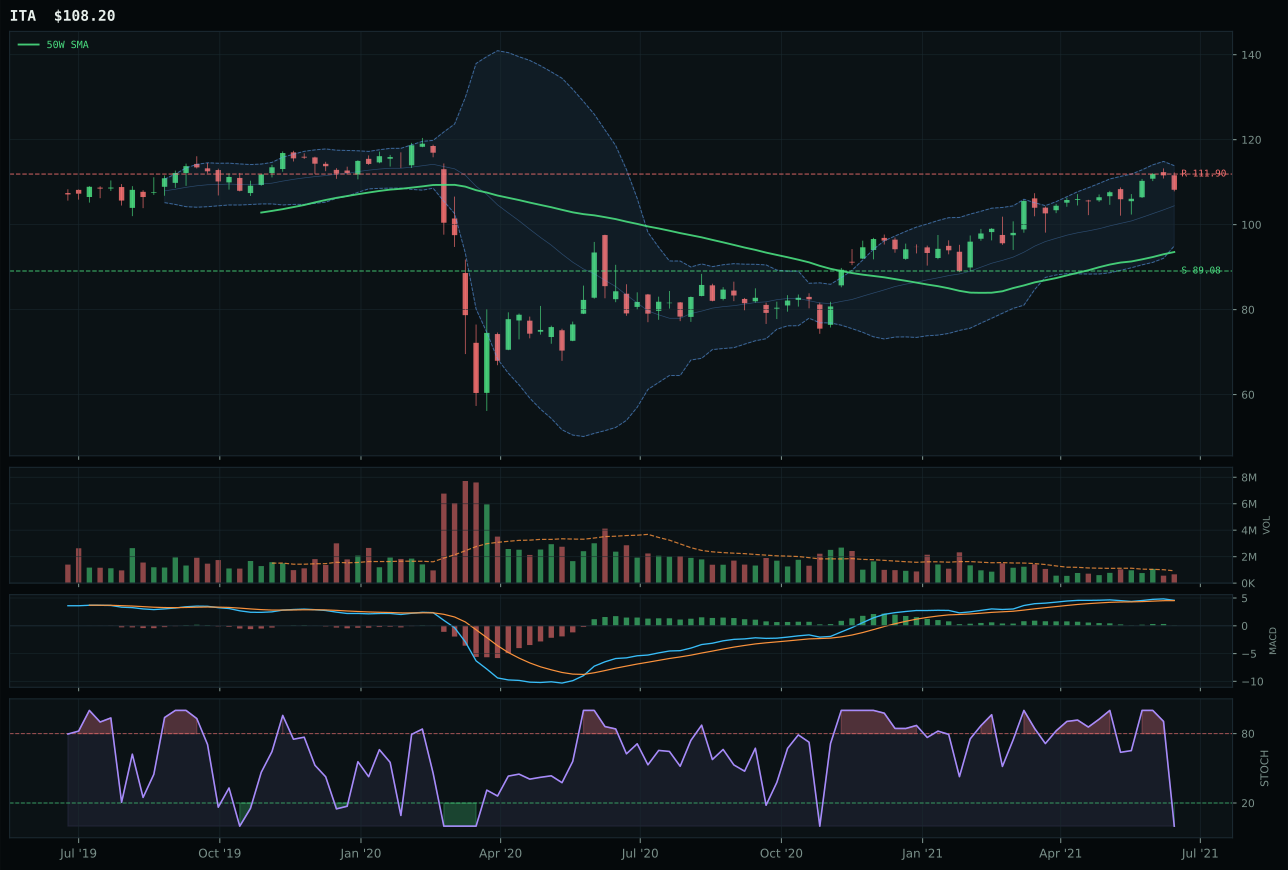
ITA has a vertical extension profile with -2.5% 13-week relative strength versus SPY.
A failed hold above support would weaken the setup.
Actionable but governed by invalidation levels.
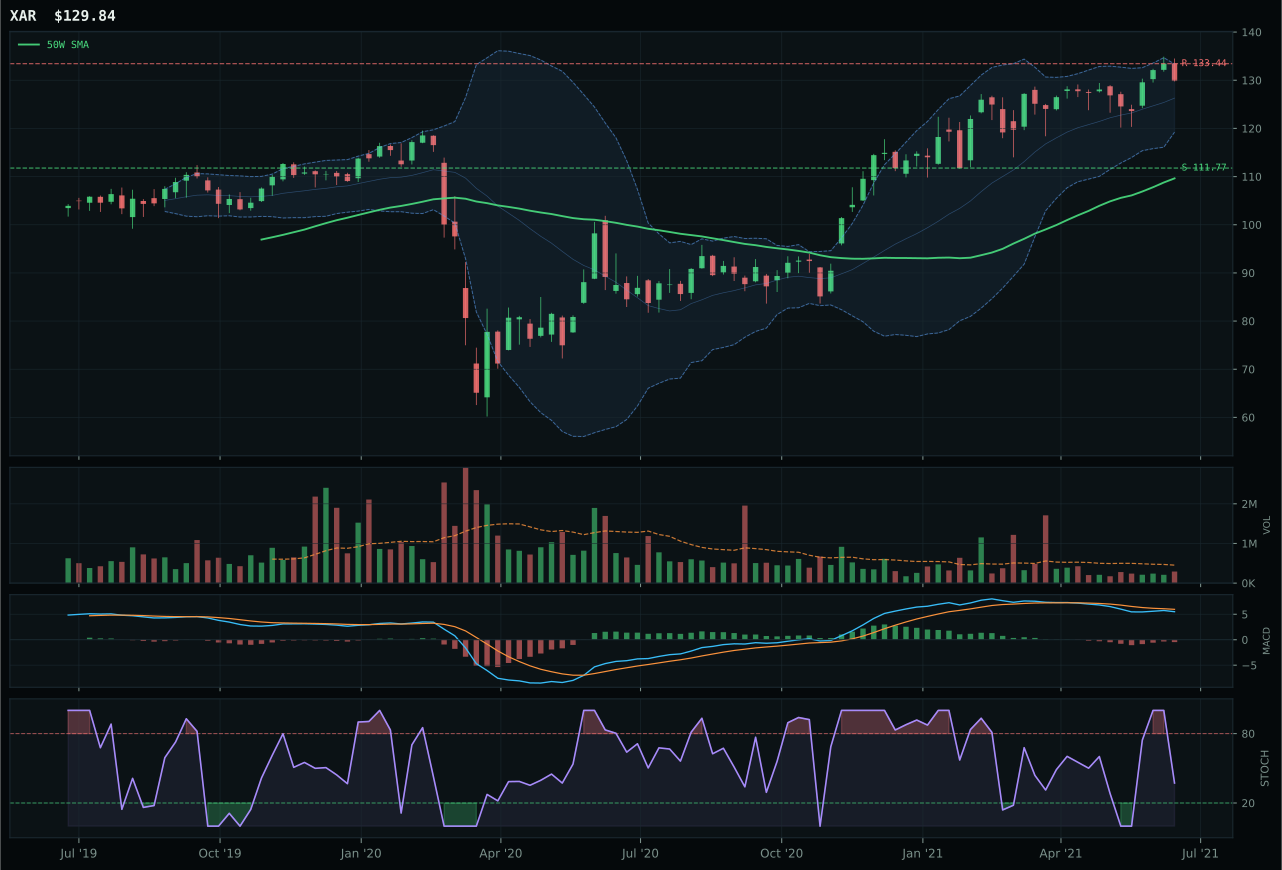
XAR has a vertical extension profile with -2.8% 13-week relative strength versus SPY.
A failed hold above support would weaken the setup.
Actionable but governed by invalidation levels.
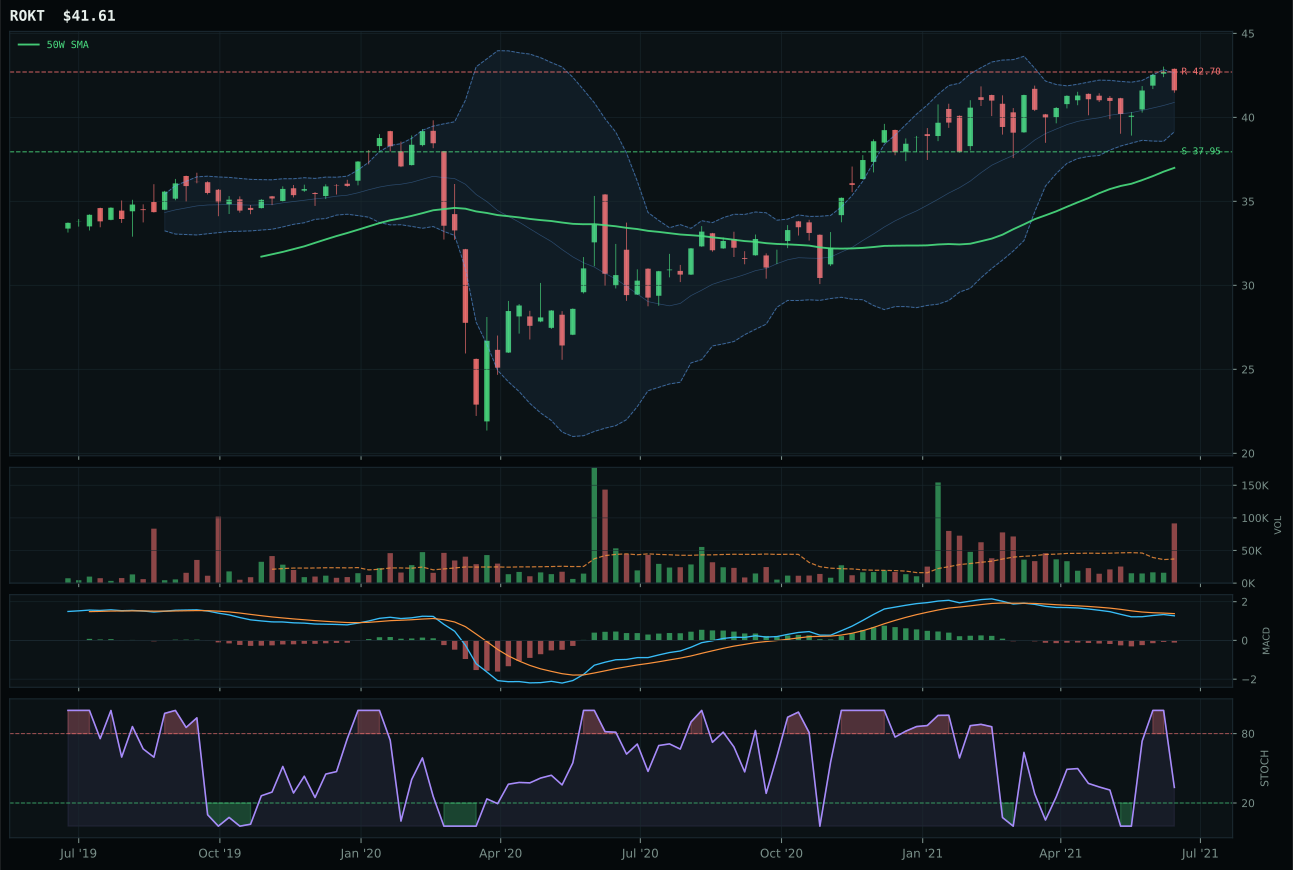
ROKT has a neutral structure profile with -3.7% 13-week relative strength versus SPY.
A failed hold above support would weaken the setup.
Tracked, but not top-2 eligible because: .
XAR wins a narrow decision because its blended technical profile—trend at 88.9, structure at 70.5, and timing at 45.0—produces a slightly tighter composite than ITA despite an inferior MACD posture. ITA's bullish-but-flattening MACD is technically crisper than XAR's bearish-but-improving print, yet XAR compensates by delivering zero category-relative strength drift while ITA's category-relative strength shows a positive 0.3% bias that suggests it is leading rather than following its peer group. The risk-reward dynamics are nearly identical (XAR at 40.0, ITA at 48.0), but both are constrained by thin volume participation and vertical extension setups that have left both charts extended eighteen percent and higher above their fifty-week averages. Neither ETF is particularly attractive on a stand-alone basis; the decision between them is a choice of the lesser asymmetry. XAR's thin participation aligns with the compressed moves and muted breadth across the entire category, where macro fit is neutral because no category-specific descriptor profile exists.
Defense & Aerospace receives 5% allocation as a tier-2 category with a final score of 38.8, placing it well below Technology and Traditional Energy but above the excluded categories. The category-level macro fit is 55.0, aided by a plus-three transition-mixed component and a plus-two credit stress tailwind, yet the absence of category-specific descriptor support leaves the macro case unfocused. XAR's technical evidence of 42.1 reflects genuine weakness in momentum confirmation (54.8), structure cleanliness (50.0), and volume-price sponsorship (50.5), indicating that defense strength is not being accumulated aggressively. The allocation acknowledges that Goldilocks conditions do not harm defense, and energy scarcity combined with geopolitical uncertainty provides some structural support, but the technical evidence simply does not justify higher weighting. For this category to move into tier-1 territory, XAR or ITA would need to demonstrate accelerating momentum confirmation, cleaner structure integrity, and volume-based accumulation that proves institutions are rotating into durability. Those signals are absent.
Agriculture & Livestock — WEAT
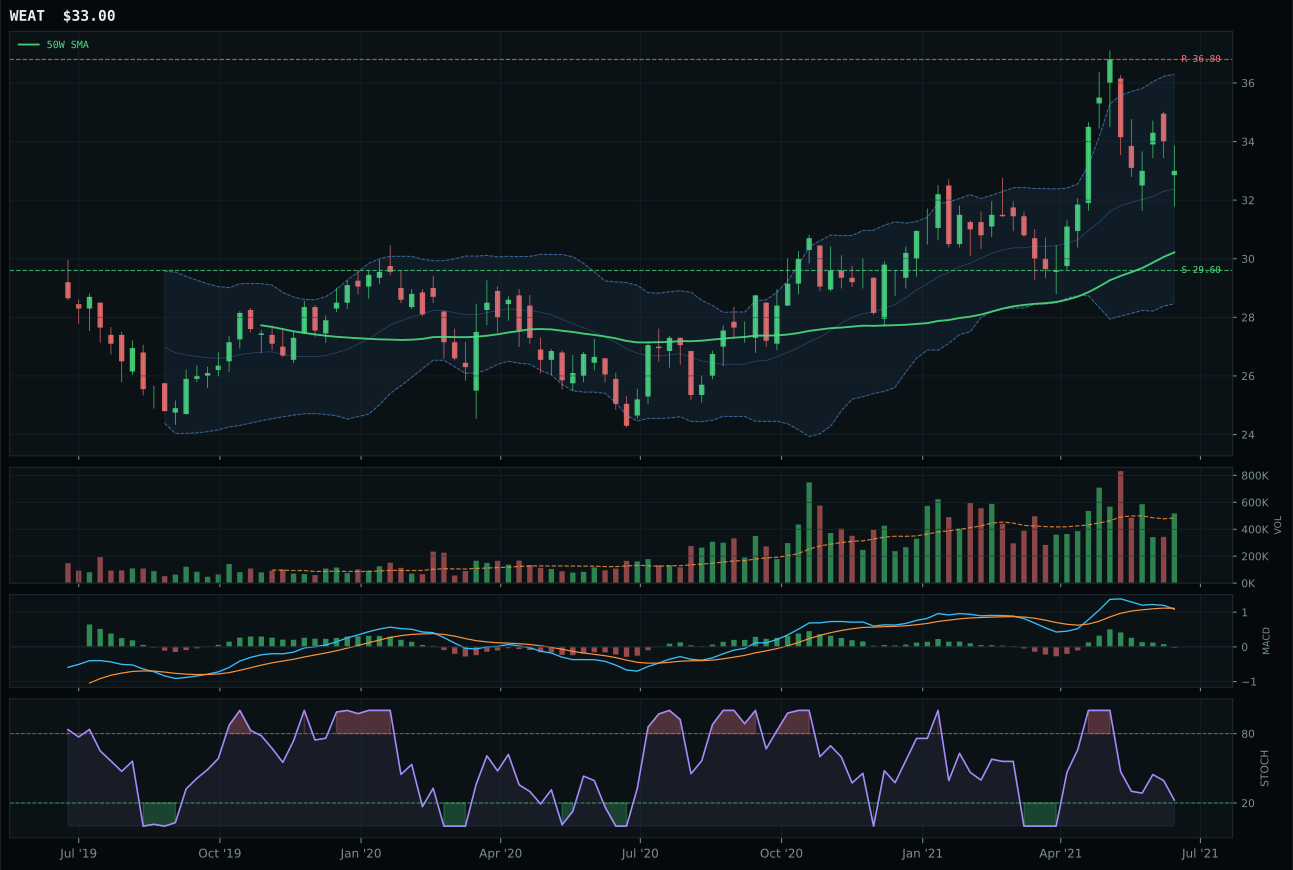
WEAT has a neutral structure profile with 3.5% 13-week relative strength versus SPY.
A failed hold above support would weaken the setup.
Actionable but governed by invalidation levels.
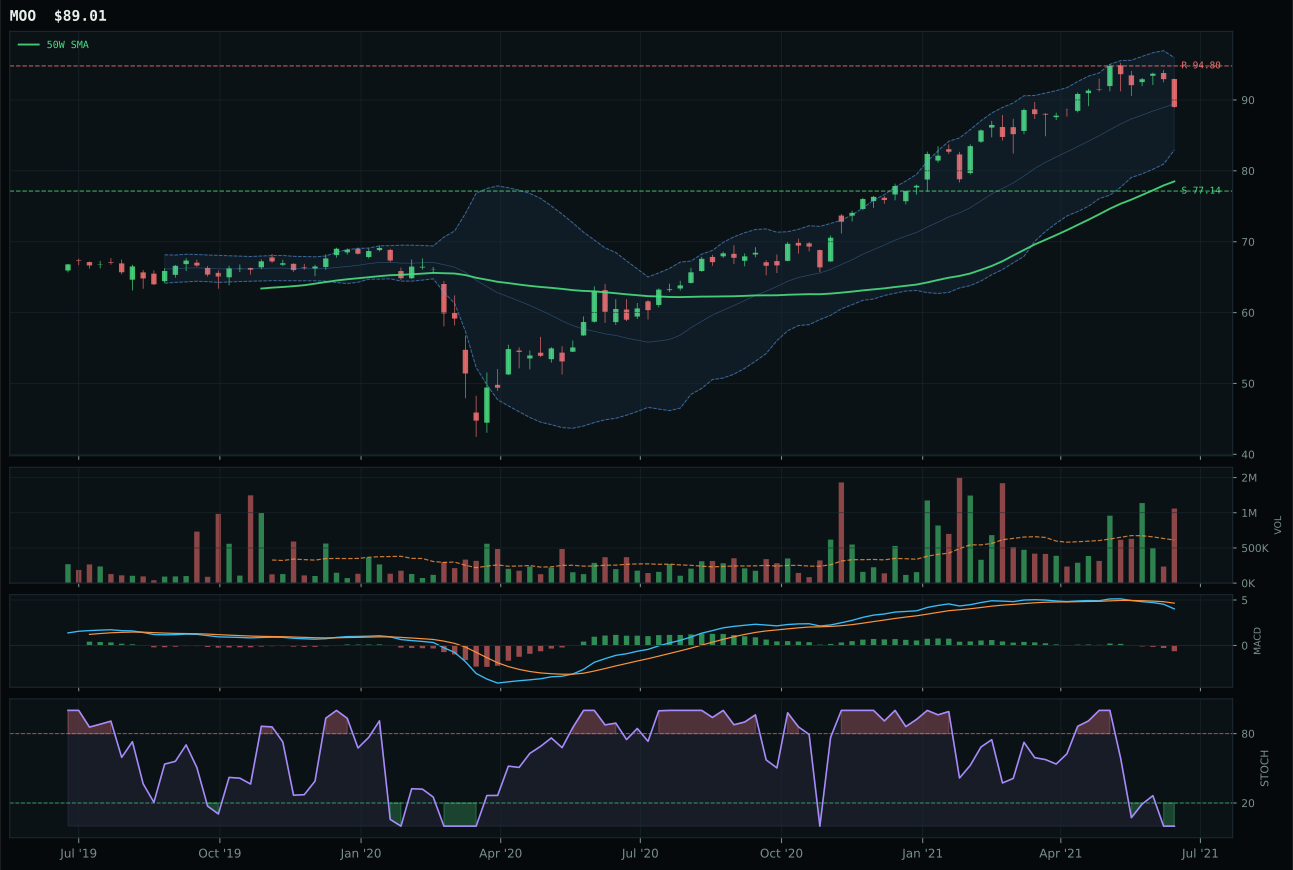
MOO has a neutral structure profile with -5.4% 13-week relative strength versus SPY.
A failed hold above support would weaken the setup.
Actionable but governed by invalidation levels.
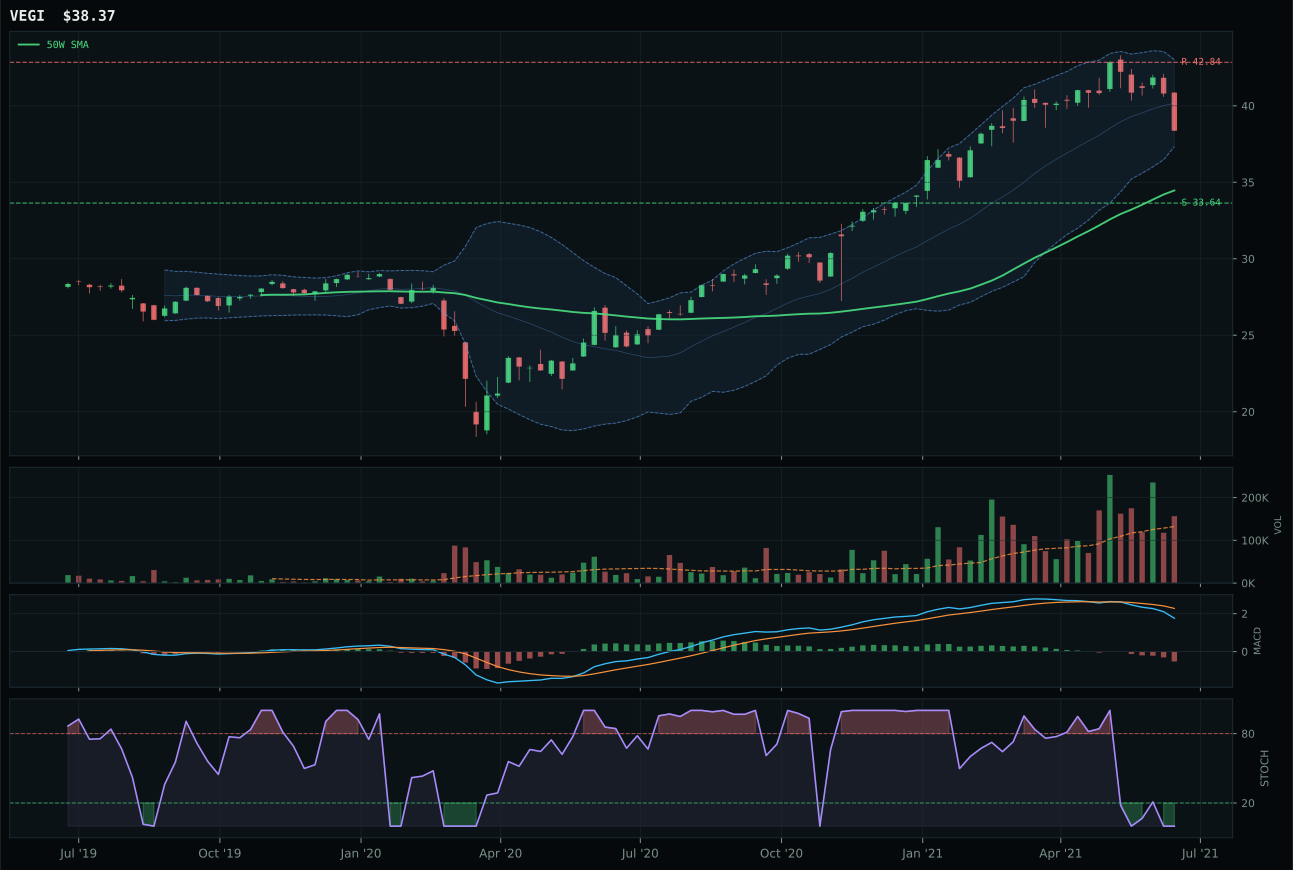
VEGI has a neutral structure profile with -11.1% 13-week relative strength versus SPY.
A failed hold above support would weaken the setup.
Tracked, but not top-2 eligible because: .
WEAT wins because its eight point nine percent category-relative strength crushes MOO's flat zero point zero percent, and that gap reflects a genuine rotation from agribusiness equity to wheat-specific exposure. Both charts sit in upper retracement zones with neutral-to-weak momentum, but WEAT's thirteen-week return of ten point zero percent is supported by genuine risk-reward architecture: a sixty-one point two upside-downside ratio provides cushion against reversal, whereas MOO's forty-four point one ratio is tight and indefensible given its oversold stochastic RSI and distribution-pressure volume. MOO's technical evidence crumbles to just seven point five, a disaster that reflects negative five point four percent RS versus SPY and a complete momentum collapse (4W and 13W returns near zero). WEAT's neutral structure and compression near the fifty-week average allow it to benefit from both the timing signal (MACD weak but not collapsing) and the category tailwind (commodity breadth positive and real asset sponsorship active). This is a clear category decision driven by quality of setup, not just price performance.
Agriculture & Livestock merits a 5% tier-2 allocation with a final score of 37.4, supported by robust category-level macro fit at 63.0 because commodity breadth is actively positive at plus-five and real asset sponsorship is active at plus-eight. That macro backdrop is the primary reason this category avoids the zero-percent exclusion tier: WEAT's technical evidence of 53.4 is moderate, but the category reasoning layer rewards the macro alignment heavily. Goldilocks conditions do not damage agricultural exposure, and the active descriptors suggest that commodity supply constraints (metals scarcity, energy scarcity) are creating a favorable environment for food-production inputs. The category's weakness is genuine: risk-reward is reasonable but not exceptional, momentum confirmation is mediocre, and the MACD structure is bearish-weakening rather than bullish. WEAT would need to demonstrate positive RS versus SPY (currently negative 5.4 for MOO suggests sector headwinds) and cleaner volume confirmation to justify tier-1 status. For now, the allocation recognizes category macro support while appropriately penalizing weak technical breadth.
Precious Metals — SLV
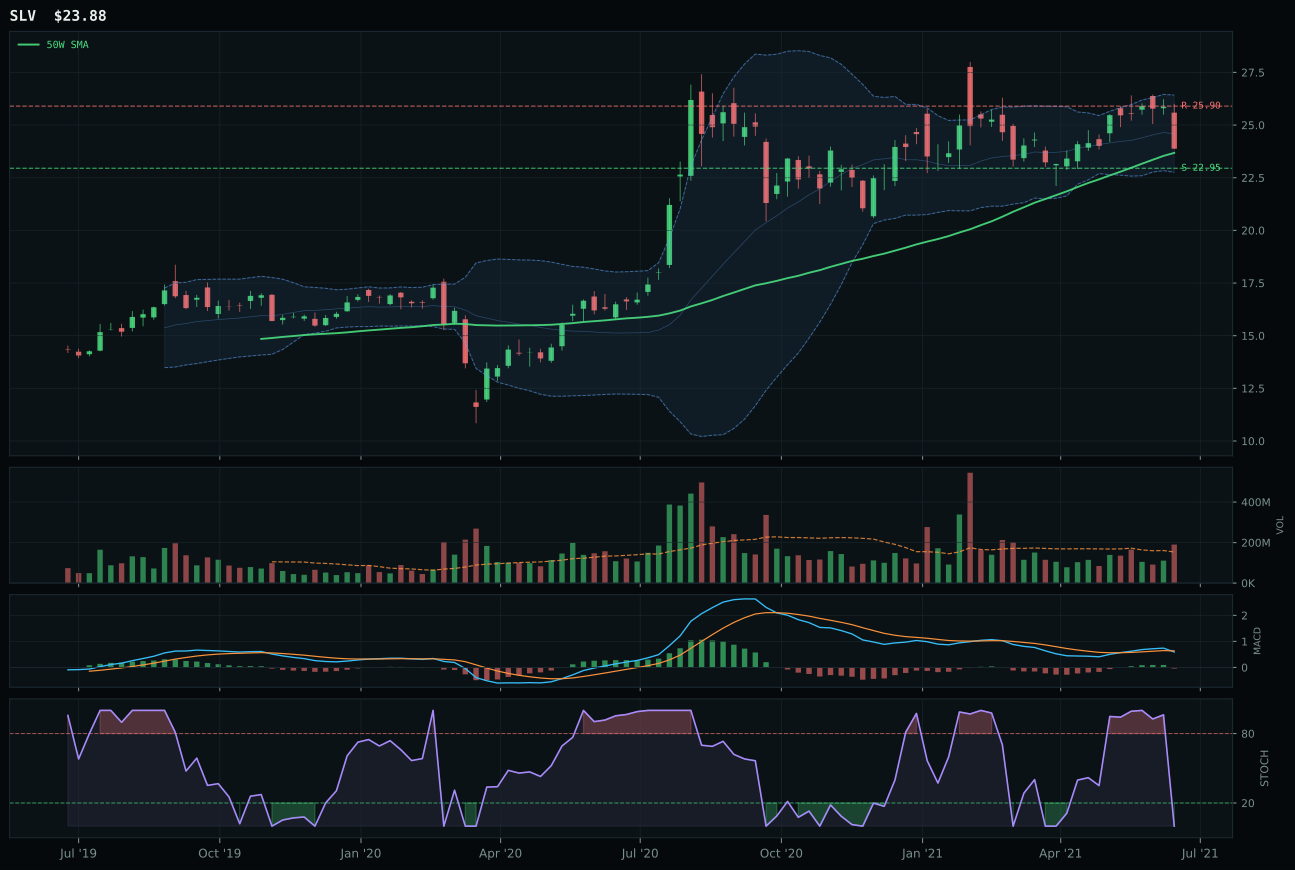
SLV has a pullback into support profile with -8.3% 13-week relative strength versus SPY.
A failed hold above support would weaken the setup.
Actionable but governed by invalidation levels.
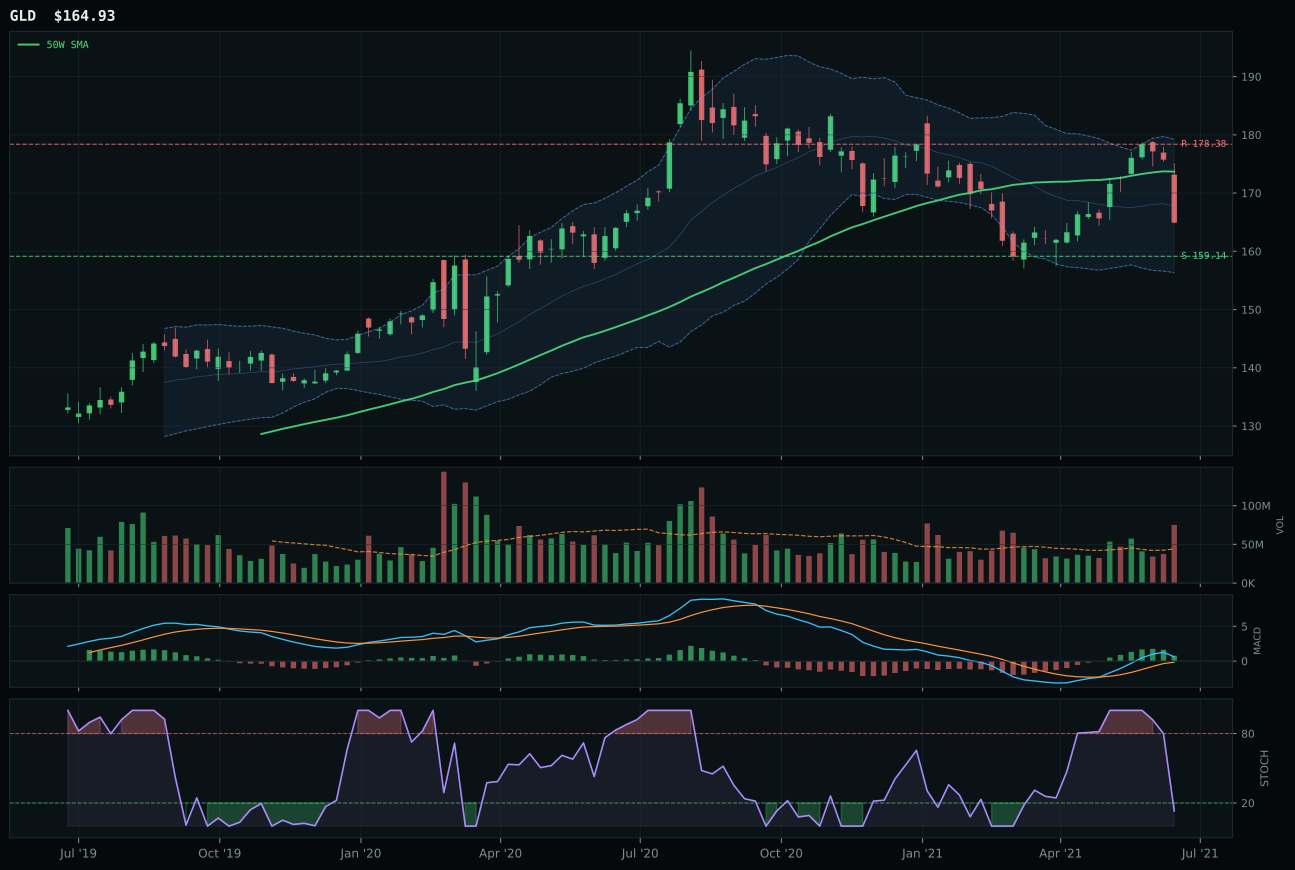
GLD has a pullback into support profile with -5.5% 13-week relative strength versus SPY.
A failed hold above support would weaken the setup.
Actionable but governed by invalidation levels.
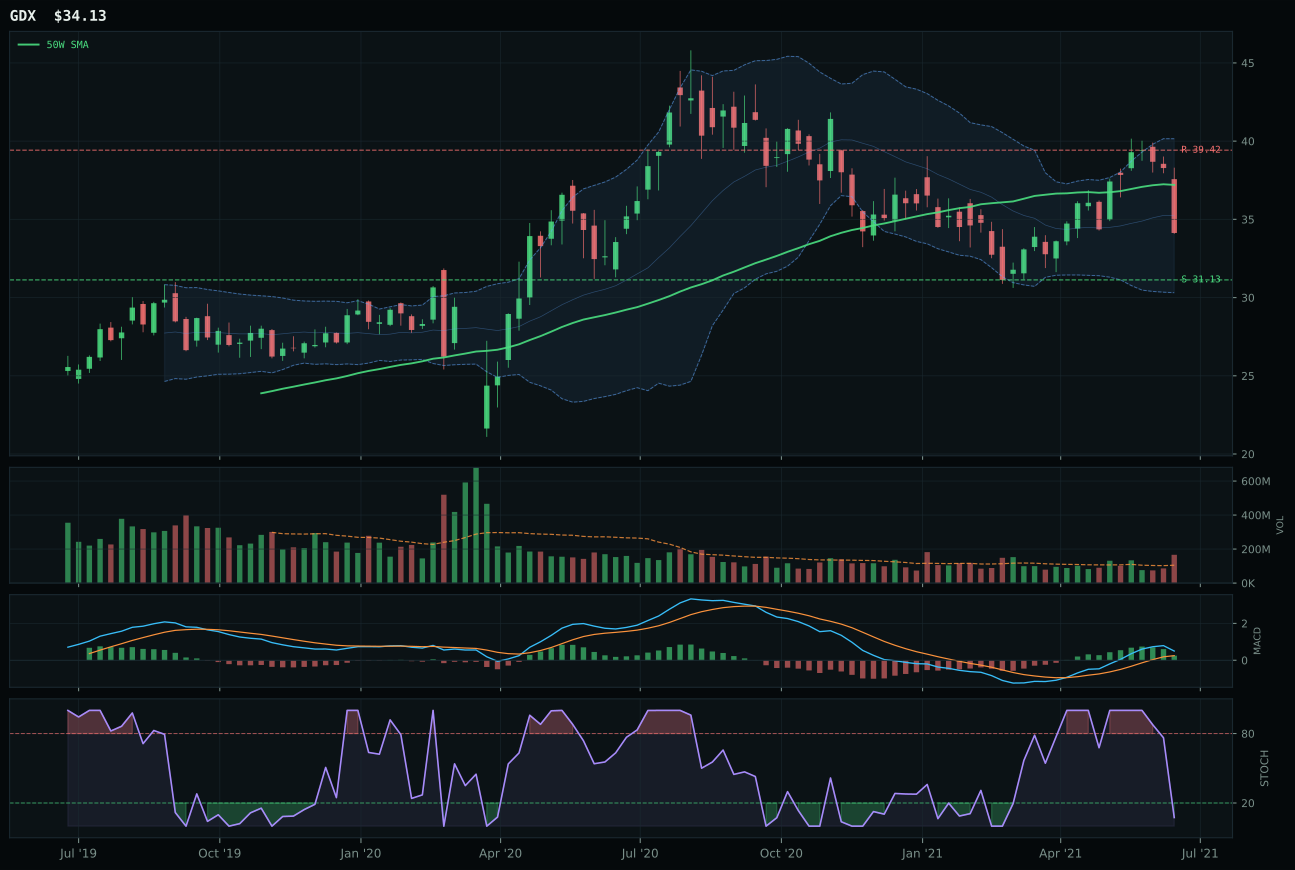
GDX has a neutral structure profile with -5.8% 13-week relative strength versus SPY.
A failed hold above support would weaken the setup.
Actionable but governed by invalidation levels.
SLV wins the category decisively because its ninety-five point zero timing score reflects a chart that is kissing support (zero point eight percent from the fifty-week average) with perfect oversold stochastic RSI confirmation (0.00), creating a defined invalidation zone at 22.95 that appeals to discipline-oriented allocators. GLD's timing score of eighty point zero cannot match that geometric clarity, and when both charts sit in upper retracement zones with bearish momentum structures, the chart with the tighter support band wins on a risk management basis. SLV's above-average participation at 1.24x the twenty-week average is the only volume signal that suggests any institutional interest in picking this bottom, whereas GLD's distribution pressure indicates that holders are exiting into weak hands. The category-relative strength separation is meaningful: SLV at negative 2.5% versus GLD at positive 0.3% means GLD is performing better than its peers, yet SLV's overall structure is so much cleaner that it compensates for lagging relative strength. This is a category where the best-positioned setup wins even when peer performance suggests others are leading.
Precious Metals receives zero percent allocation this week, ranked 9th or 10th in the portfolio construction, because its final score of 33.0 falls below the tier-2 threshold and the category offers no macro sponsorship to justify an allocation in a Goldilocks environment. SLV's technical evidence is genuinely weak at 31.7: momentum confirmation is catastrophic at 8.9, persistence is low at 32.8, and volume-price confirmation is poor at 28.4, all reflecting the reality that metals are not accumulating but rather sitting pinned between macro indifference and technical repair. Metals scarcity is active at plus-seven, yet that descriptor alone cannot overcome the bearish-weakening MACD and the fact that both category contenders (SLV and GLD) are underwater on thirteen-week returns. The category's macro fit of 48.0 is dragged down by liquidity expansion at negative-two, meaning that expansion periods tend to favor risk-on assets over safe haven metals. To earn an allocation, Precious Metals would need either gold to break above its sixty-day resistance with volume confirmation or silver to establish a pattern of higher lows with stabilizing MACD—neither condition exists. The portfolio correctly excludes metals despite the minor timing signal SLV provides.
Nuclear Energy — URA
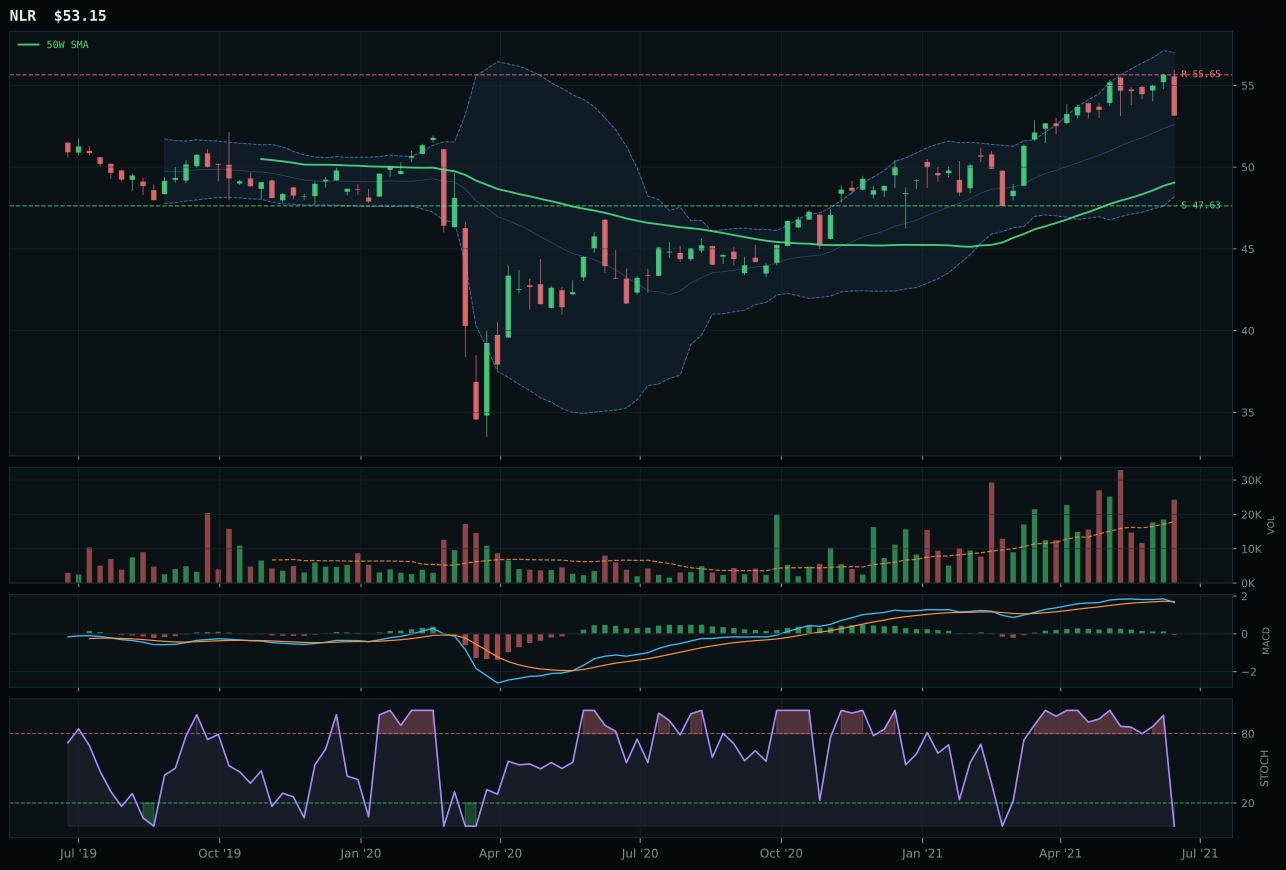
NLR has a neutral structure profile with -4.6% 13-week relative strength versus SPY.
A failed hold above support would weaken the setup.
Tracked, but not top-2 eligible because: .
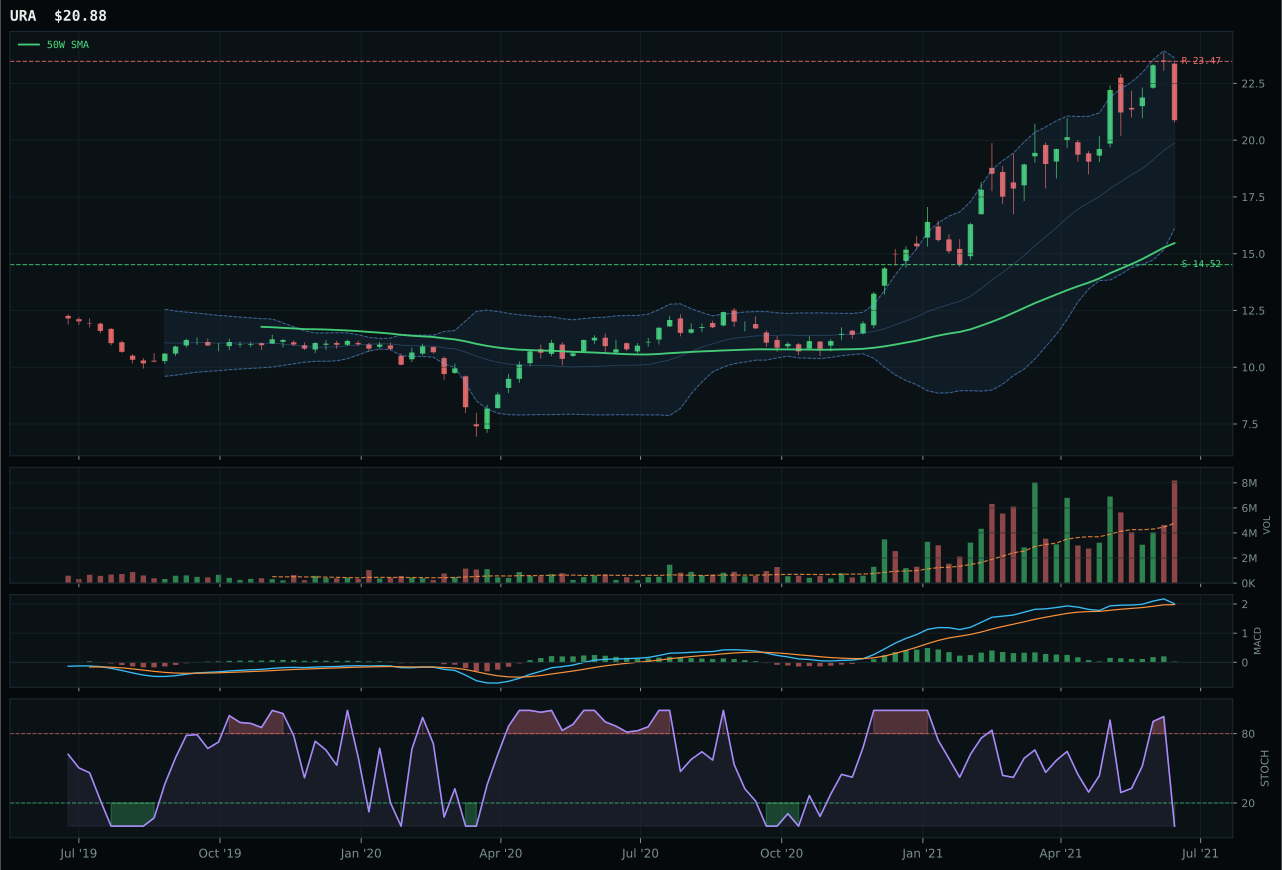
URA has a vertical extension profile with 0.9% 13-week relative strength versus SPY.
A failed hold above support would weaken the setup.
Actionable but governed by invalidation levels.
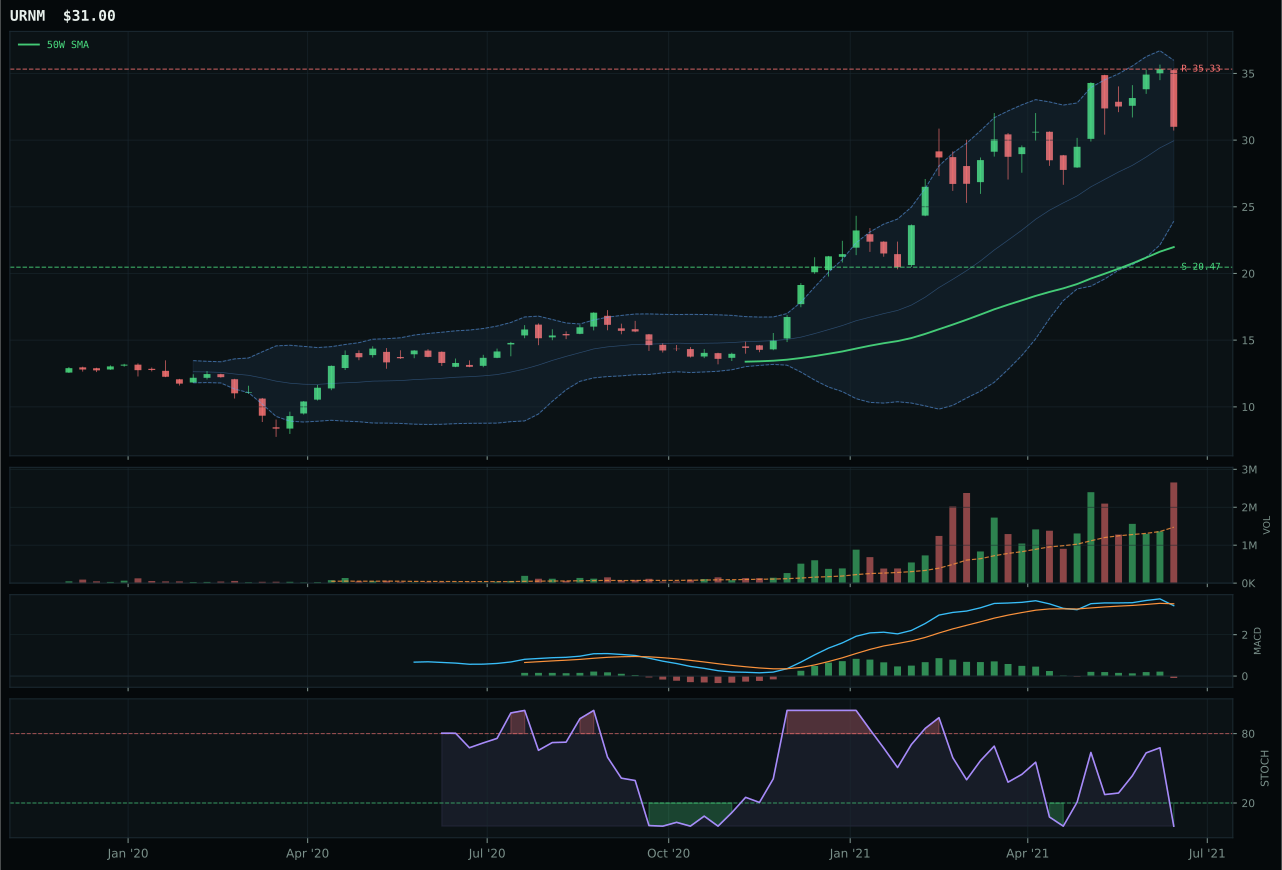
URNM has a vertical extension profile with -3.4% 13-week relative strength versus SPY.
A failed hold above support would weaken the setup.
Actionable but governed by invalidation levels.
URA wins because its ninety-seven point three trend score reflects a chart above both the fifty-week and two-hundred-week moving averages with a positive 1.3% fifty-week slope and zero point nine percent RS versus SPY—a setup that proves nuclear is not contrarian but rather aligned with the broader market structure. NLR's trend score of seventy-five lags significantly, and its bearish-weakening MACD at the inflection point signals momentum failure where URA maintains bullish-but-flattening structure suggesting continuation risk rather than reversal risk. URA's category-relative strength of 4.3% crushes NLR's negative 1.2%, revealing that uranium demand is outpacing nuclear utility stability narratives. Both charts sit extended and oversold, yet URA's seven point four percent thirteen-week return combined with the positive RS profile creates a momentum narrative that is superior to NLR's two point zero percent thirteen-week return and deteriorating relative strength. The category decision hinges on momentum confirmation (URA 55.6 vs NLR 27.0): when both charts are extended and oversold, the one with improving momentum confirmations wins.
Nuclear Energy receives zero percent allocation this week, ranked outside the tier-2 threshold with a final score of 31.3, because technical evidence of 22.9 from the representative is genuinely weak despite URA's strong trend setup. Energy scarcity is active at plus-nine and real asset sponsorship is active at plus-seven at the category level, yet the category macro fit of 61.0 is insufficient to overcome the technical deficit because both URA and NLR display distribution-pressure volume and oversold stochastic RSI conditions that suggest the recent move has exhausted near-term demand. URA's thirty-five percent distance from the fifty-week average is extended for nuclear, and while the chart has shown resilience, volume-price confirmation at 42.1 and persistence at 50.3 indicate the move is not being accumulated but rather held by late buyers. The category's exclusion reflects a judgment that despite macro sponsorship for energy scarcity, the technical setup in nuclear is tiring and offers poor entry timing. For Nuclear Energy to earn an allocation, URA or NLR would need to consolidate and allow MACD to stabilize at overbought levels, stochastic RSI to reset from extremes, and volume to shift from distribution pressure to genuine accumulation. Those technical repairs are not in place.