
2021-06-11
Informational purposes only. The content in this report, including allocations, analysis, and commentary, is provided solely for informational and educational purposes. It does not constitute financial advice, investment advice, trading advice, or any other type of advice. Past performance does not guarantee future results. Always conduct your own research and consult a qualified financial professional before making investment decisions.
Weekly Allocation
| Ticker | Category | Weight | Role |
|---|---|---|---|
| FSOL | 50% | Overlay | |
| GLD | Precious Metals | 10% | Top-2 (10%) |
| INDA | Emerging Markets | 10% | Top-2 (10%) |
| IGV | Technology | 5% | Tier-2 (5%) |
| URA | Nuclear Energy | 5% | Tier-2 (5%) |
| REMX | Industrial Metals | 5% | Tier-2 (5%) |
| XLU | Utilities & Infrastructure | 5% | Tier-2 (5%) |
| SMH | AI | 5% | Tier-2 (5%) |
| XAR | Defense & Aerospace | 5% | Tier-2 (5%) |
Trade Instructions — Monday Open
Sell the tranche from 2021-05-14 (completing its 4-week hold). Buy the new tranche. Instructions show net portfolio changes — same-asset positions cancel, weight changes show the delta.
| Action | Ticker | Instruction |
|---|---|---|
| SELL | FBTC | Sell 25% of FBTC position (reduce 50.00% → 37.50%) |
| SELL | XLE | Sell entire XLE position (2.50% of portfolio) |
| SELL | PAVE | Sell entire PAVE position (2.50% of portfolio) |
| SELL | WEAT | Sell entire WEAT position (1.25% of portfolio) |
| SELL | COPX | Sell 20% of COPX position (reduce 6.25% → 5.00%) |
| SELL | URNM | Sell 33% of URNM position (reduce 3.75% → 2.50%) |
| SELL | ILF | Sell 25% of ILF position (reduce 5.00% → 3.75%) |
| SELL | ITA | Sell 33% of ITA position (reduce 3.75% → 2.50%) |
| BUY | GLD | Buy GLD — 5.26% of freed cash (adds 1.25% to portfolio) |
| BUY | XLU | Buy XLU — 5.26% of freed cash (adds 1.25% to portfolio) |
| BUY | IGV | Buy IGV — 5.26% of freed cash (adds 1.25% to portfolio) |
| BUY | URA | Buy URA — 5.26% of freed cash (adds 1.25% to portfolio) |
| BUY | SMH | Buy SMH — 5.26% of freed cash (adds 1.25% to portfolio) |
| BUY | FSOL | Buy FSOL — 52.63% of freed cash (adds 12.50% to portfolio) |
| BUY | INDA | Buy INDA — 10.53% of freed cash (adds 2.50% to portfolio) |
| BUY | REMX | Buy REMX — 5.26% of freed cash (adds 1.25% to portfolio) |
| BUY | XAR | Buy XAR — 5.26% of freed cash (adds 1.25% to portfolio) |
Current Portfolio After Trade
Combined holdings across all 4 active tranches. Each tranche is 25% of the portfolio.
| Ticker | % of Portfolio | Weight Bar |
|---|---|---|
| FBTC | 37.50% | |
| FSOL | 12.50% | |
| GLD | 10.00% | |
| COPX | 5.00% | |
| ILF | 3.75% | |
| FCG | 3.75% | |
| XLU | 3.75% | |
| IGV | 3.75% | |
| URNM | 2.50% | |
| ITA | 2.50% | |
| MOO | 2.50% | |
| URA | 2.50% | |
| SMH | 2.50% | |
| INDA | 2.50% | |
| IGF | 1.25% | |
| CIBR | 1.25% | |
| REMX | 1.25% | |
| XAR | 1.25% |
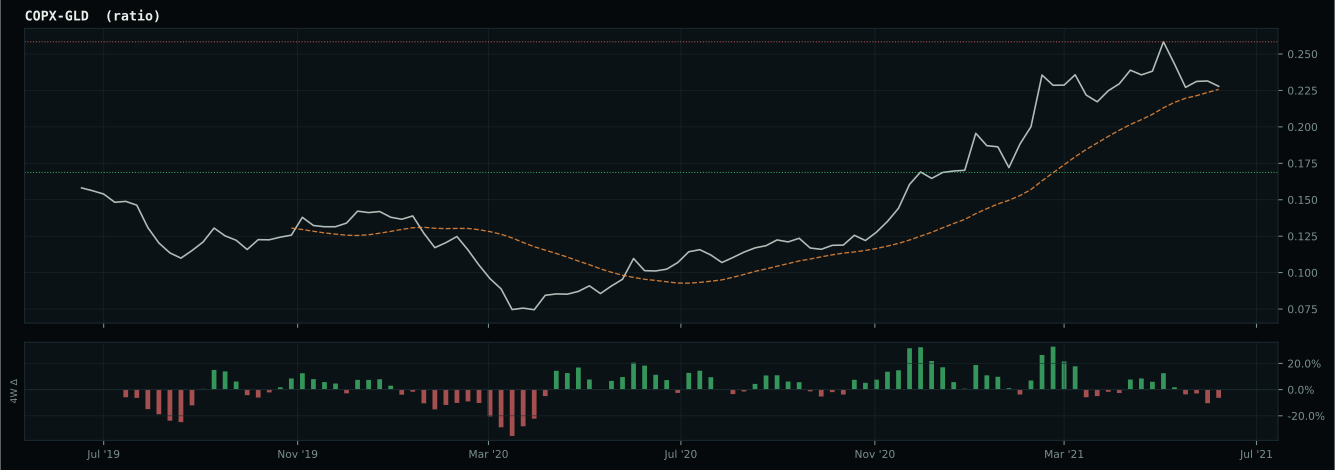
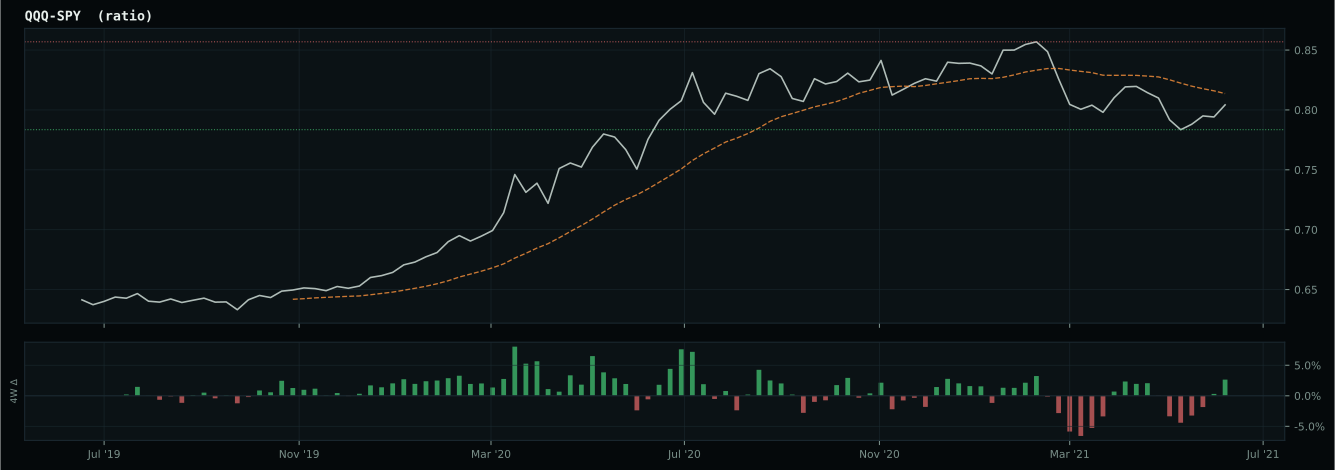
Macro Regime — Goldilocks
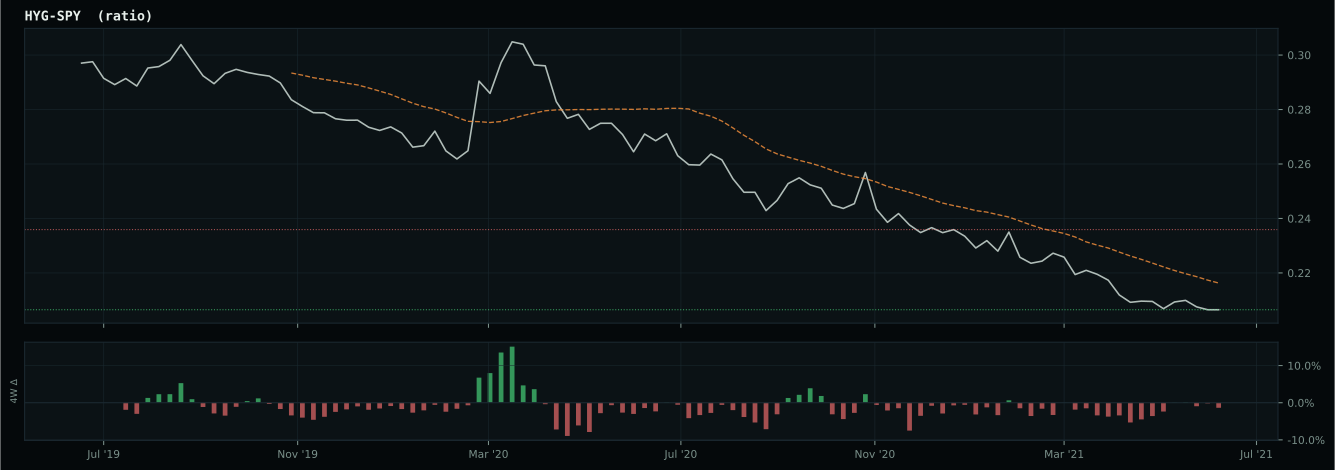
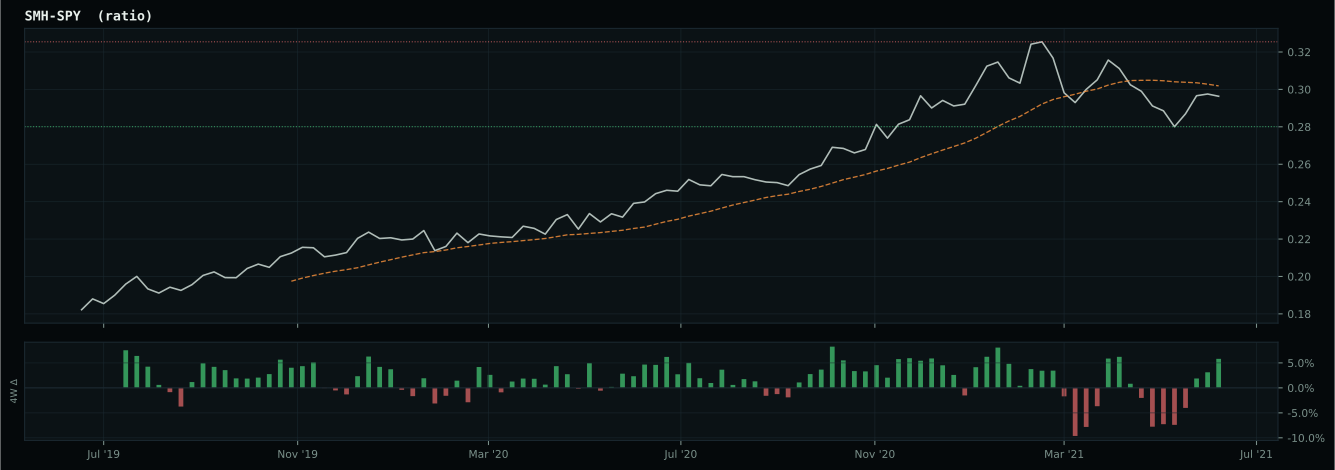
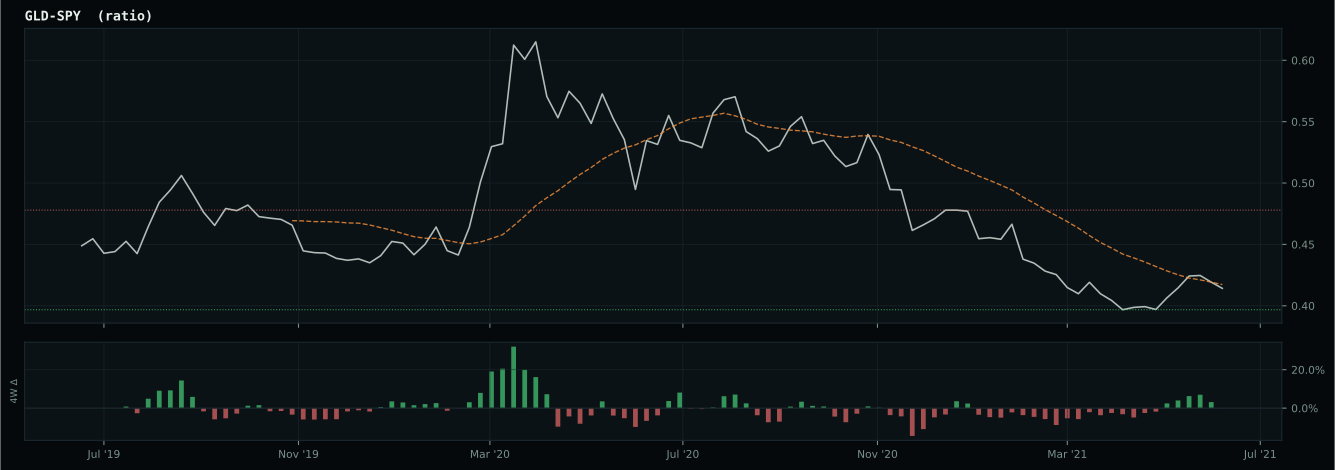
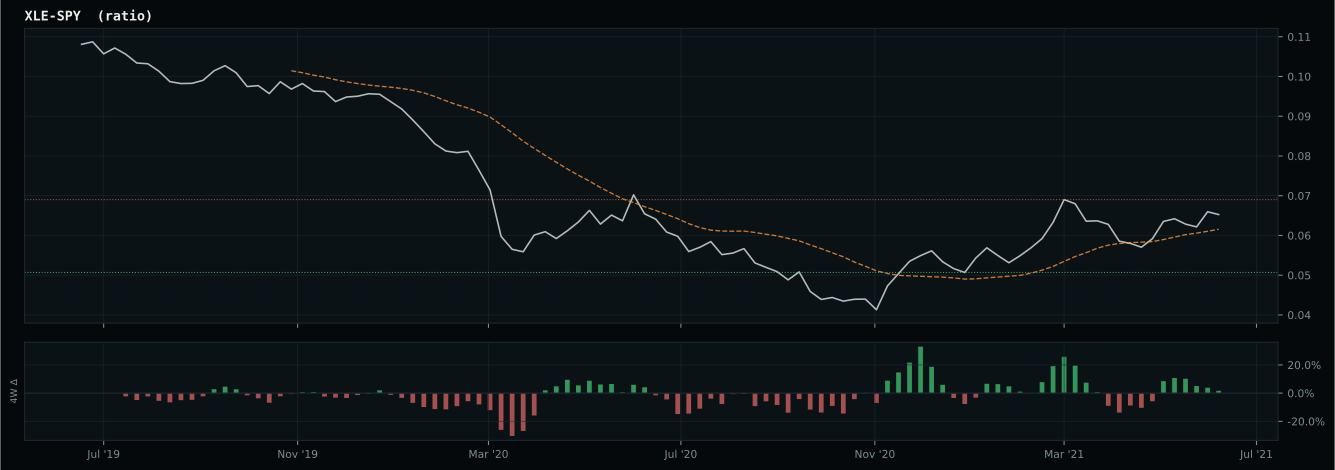
Macro Evidence Charts
Market-implied signals behind the macro regime scores. Each ratio compares two assets; the direction and slope of the ratio is what the macro engine reads.
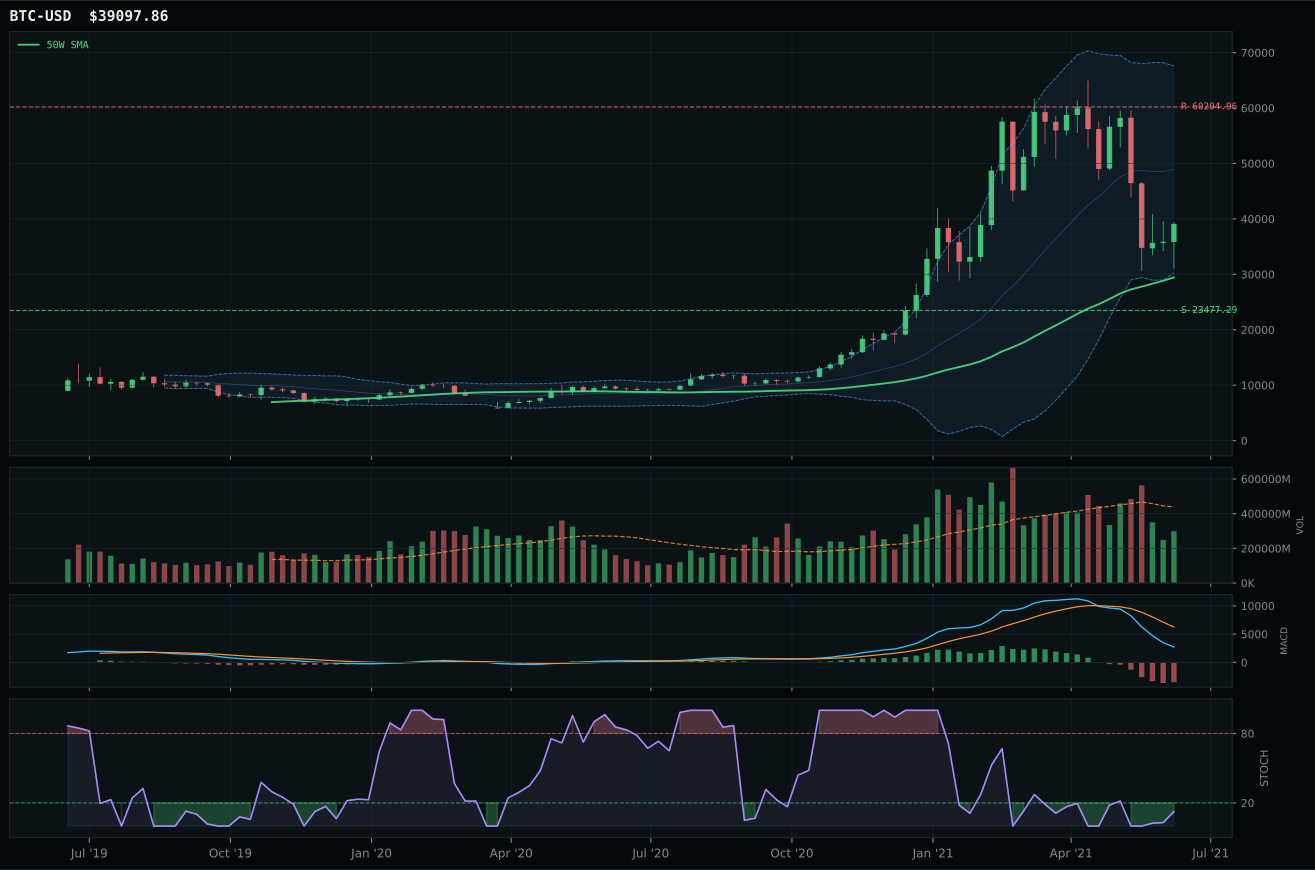
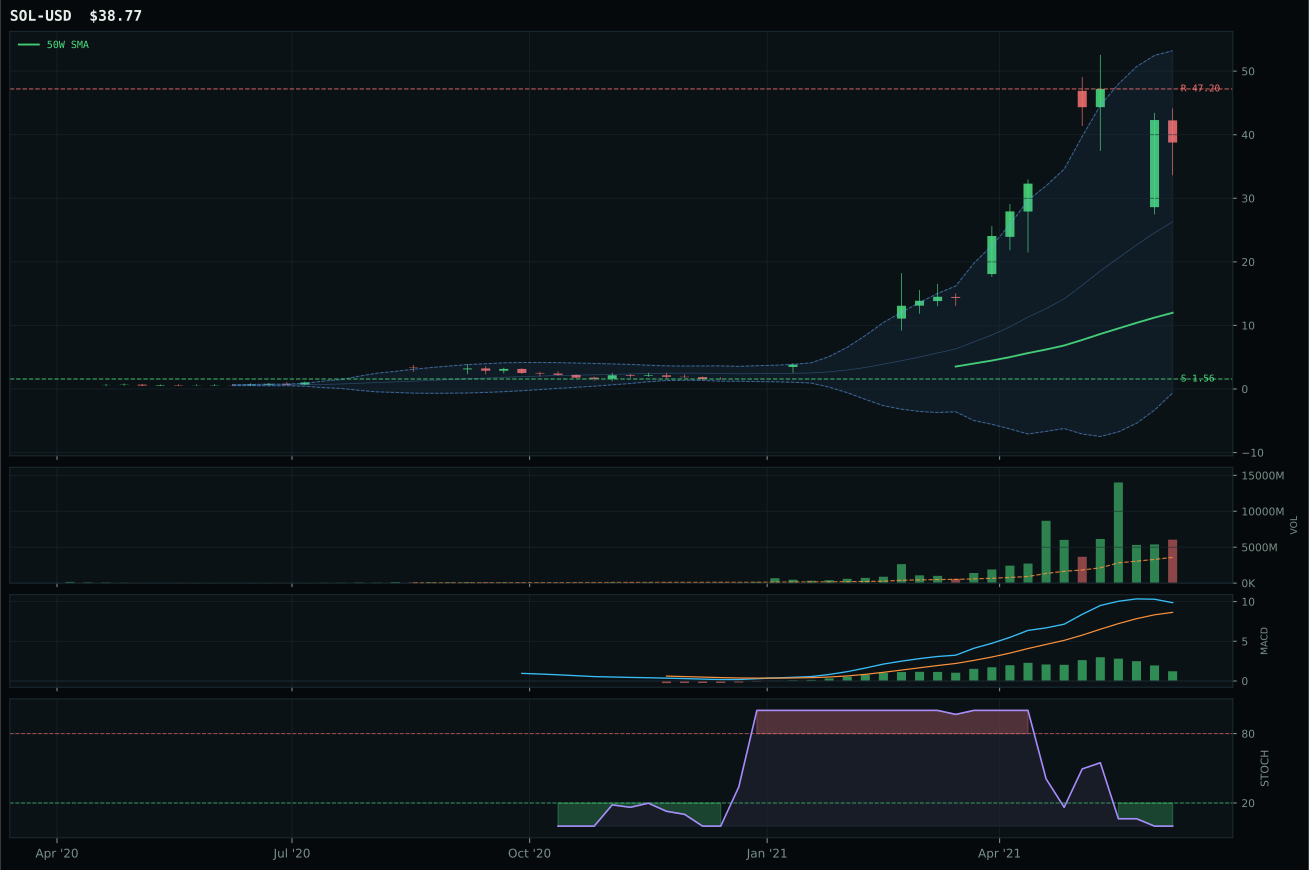
Crypto Regime — AltSeason
ValueBTC not armed: BTC has not made the first post-breakdown touch of the 200W buy zone after losing the 50W
TrendBTC confirmed: 2 consecutive closes above rising/flat 50W SMA
all available AltSeason conditions pass; missing optional confirmations skipped
Category Rankings
| Rank | Category | Winner | Score | Alloc | 4W Ret | Peers (4W) |
|---|---|---|---|---|---|---|
| 1 | Precious Metals | GLD | 64.4 | 20% | -2.58% | GDX -9.0% · SLV -5.4% |
| 2 | Emerging Markets | INDA | 61.9 | 20% | -2.30% | ILF -5.1% · IEMG -3.0% |
| 3 | Technology | IGV | 55.7 | 10% | +6.95% | CIBR +5.0% · XLK +6.8% |
| 4 | Nuclear Energy | URA | 54.9 | 10% | -13.09% | URNM -16.6% · NLR -4.9% |
| 5 | Industrial Metals | REMX | 52.1 | 10% | +15.58% | PICK -3.3% · COPX -6.5% |
| 6 | Utilities & Infrastructure | XLU | 49.9 | 10% | -2.40% | IGF -2.5% · PAVE -2.3% |
| 7 | AI | SMH | 47.6 | 10% | +2.46% | BOTZ -0.4% · AIQ +3.8% |
| 8 | Defense & Aerospace | XAR | 39.6 | 10% | -1.11% | ITA -1.8% · ROKT +0.0% |
| 9 | Traditional Energy | FCG | 33.6 | 0% | -3.12% | XOP -5.6% · XLE -6.0% |
| 10 | Agriculture & Livestock | MOO | 30.8 | 0% | -1.71% | WEAT -6.2% · VEGI -4.0% |
Precious Metals — GLD
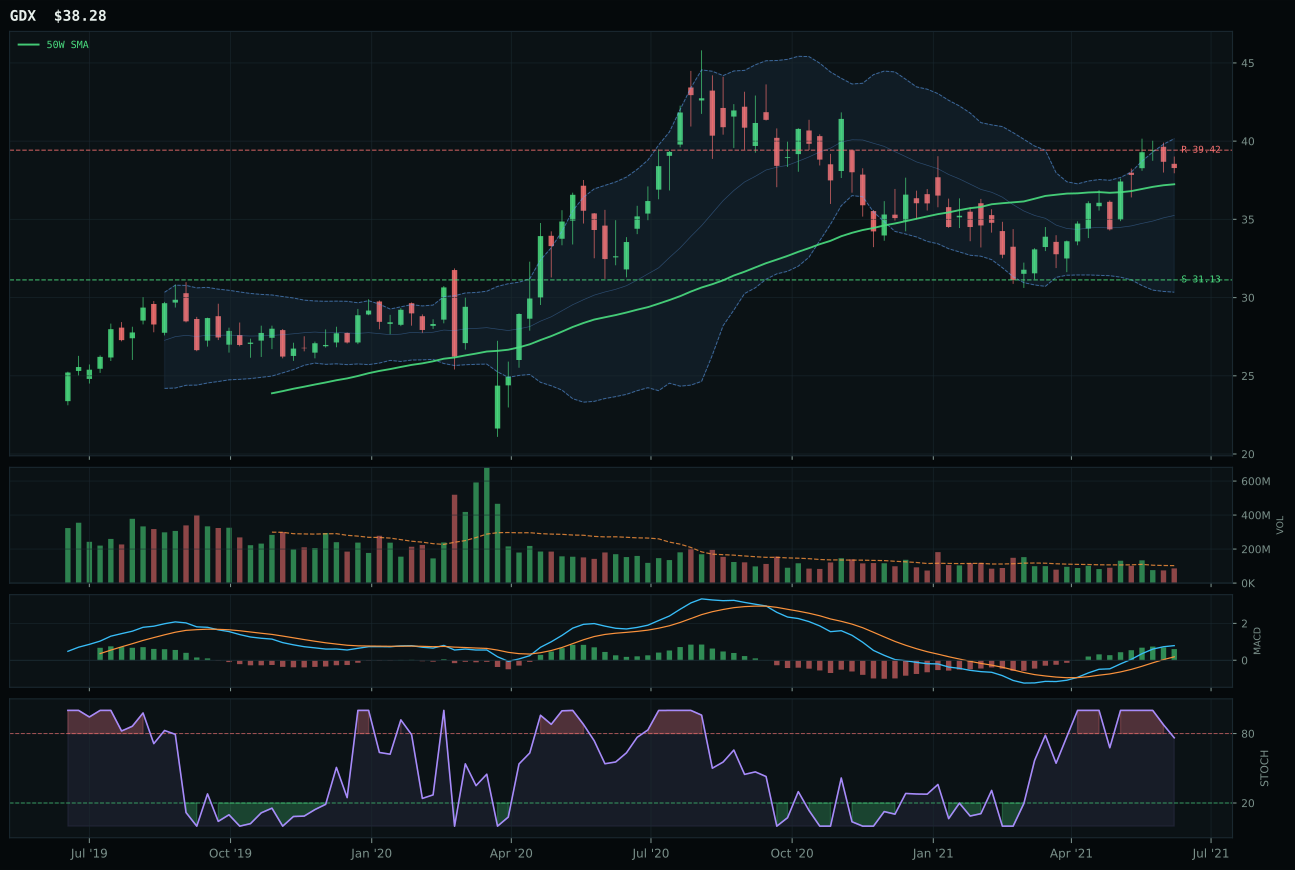
GDX has a compression near 50W profile with 8.0% 13-week relative strength versus SPY.
A failed hold above support would weaken the setup.
Actionable but governed by invalidation levels.
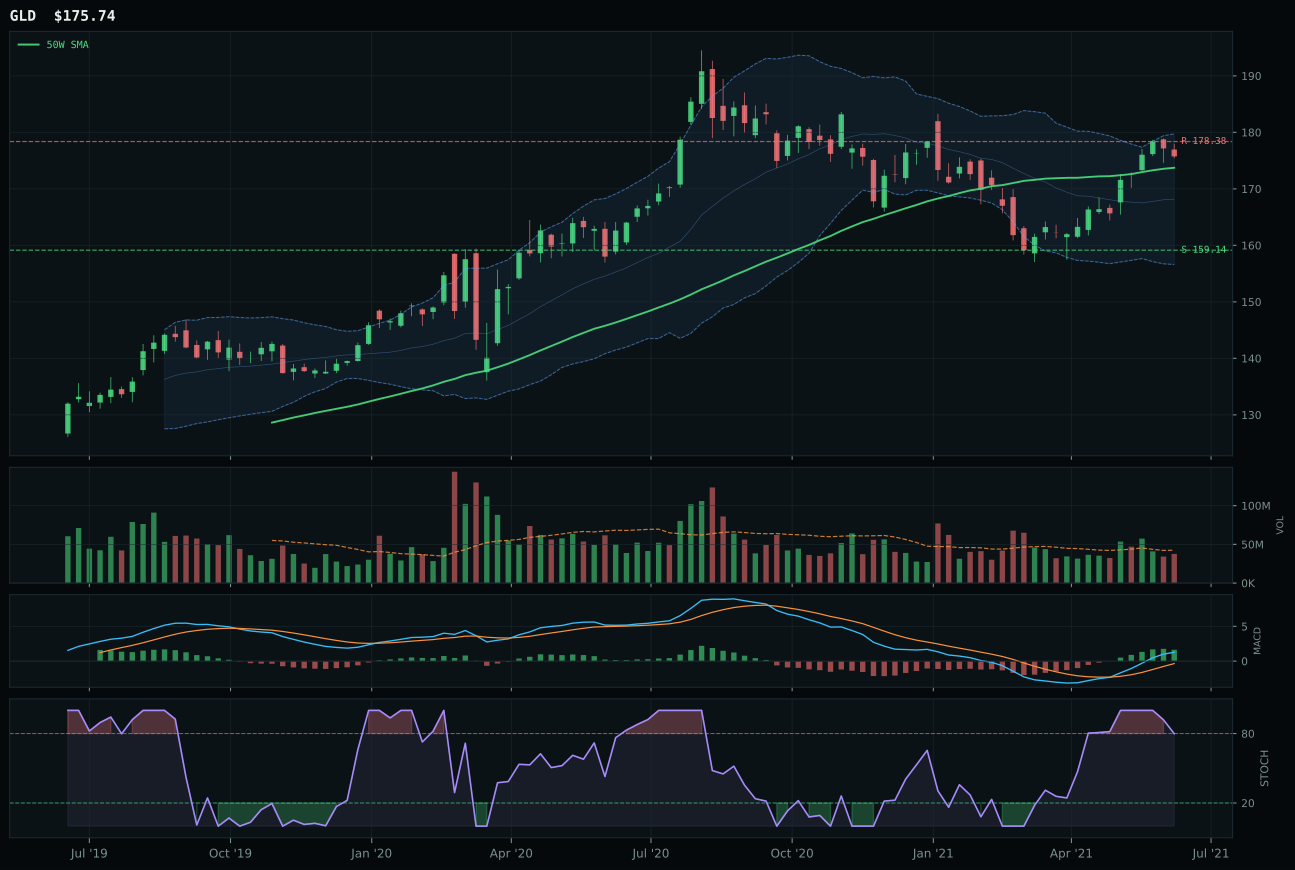
GLD has a compression near 50W profile with 1.1% 13-week relative strength versus SPY.
A failed hold above support would weaken the setup.
Actionable but governed by invalidation levels.
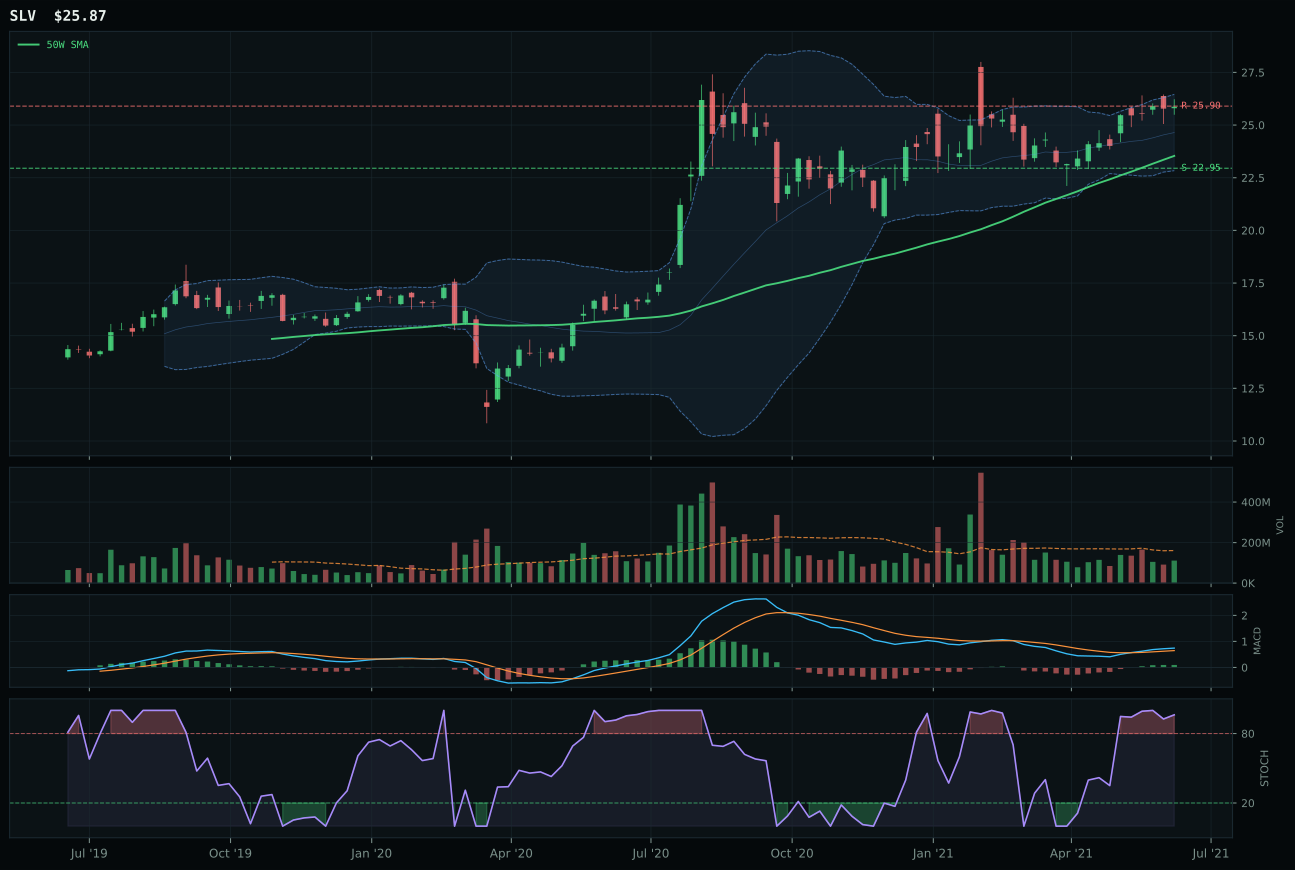
SLV has a neutral structure profile with -0.0% 13-week relative strength versus SPY.
A failed hold above support would weaken the setup.
Actionable but governed by invalidation levels.
GLD wins precious metals with a composite score of 89 and a flawless execution on trend and timing—both scoring perfect 100s. Price sits only 1.2% above the 50W in a compression structure with 89.4/100 structural integrity, offering the rare setup where trend power and entry safety coexist. The 8.8% 13-week return and 1.1% SPY outperformance prove the rally is substantive, while MACD bullish improvement and stochastic RSI at 0.80 (falling/neutral, not extended) confirm buyers are defending, not capitulating. GDX's superior technical score of 95 and 15.7% 13-week return are seductive, yet the 43.0/100 macro fit and -7 credit stress penalty reveal the leverage bet is being sold into gold strength—GDX's 8.0% SPY outperformance suggests it's chasing the trade rather than leading the cycle. GLD's 55.5/100 risk/reward and near-perfect positioning make it the clear choice for core allocation.
Precious Metals earns 10% as a top-2 overweight because its 64.4 category score ranks among the two highest eligible categories this week, driven by GLD's execution and macro tailwinds. Disinflation pressure is active (+6), and the Goldilocks regime permits capital reallocation toward real assets without macro stress. The 80.8/100 technical evidence base is world-class—perfect trend, perfect timing, clean structure—making this one of the cleanest entries in the entire portfolio. At current levels, GLD offers positive carry (yield from holding), gold scarcity protection, and compression-to-expansion potential if the 50W support holds and buyers push price higher. The allocation acknowledges that precious metals are neither overvalued nor extended; they are fairly priced with asymmetric downside protection in a regime where credit stress and deflation fears remain dormant but credible.
Emerging Markets — INDA
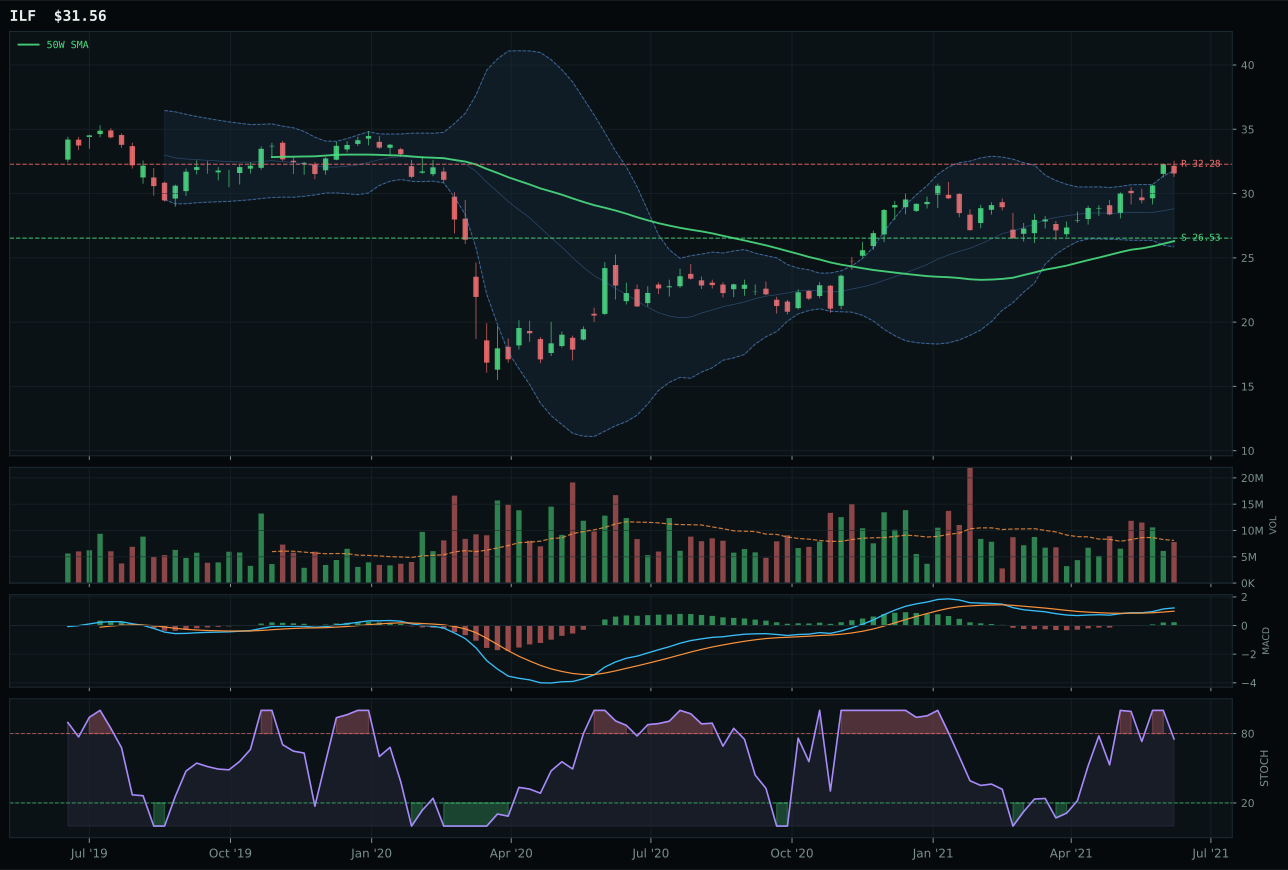
ILF has a vertical extension profile with 5.2% 13-week relative strength versus SPY.
A failed hold above support would weaken the setup.
Actionable but governed by invalidation levels.
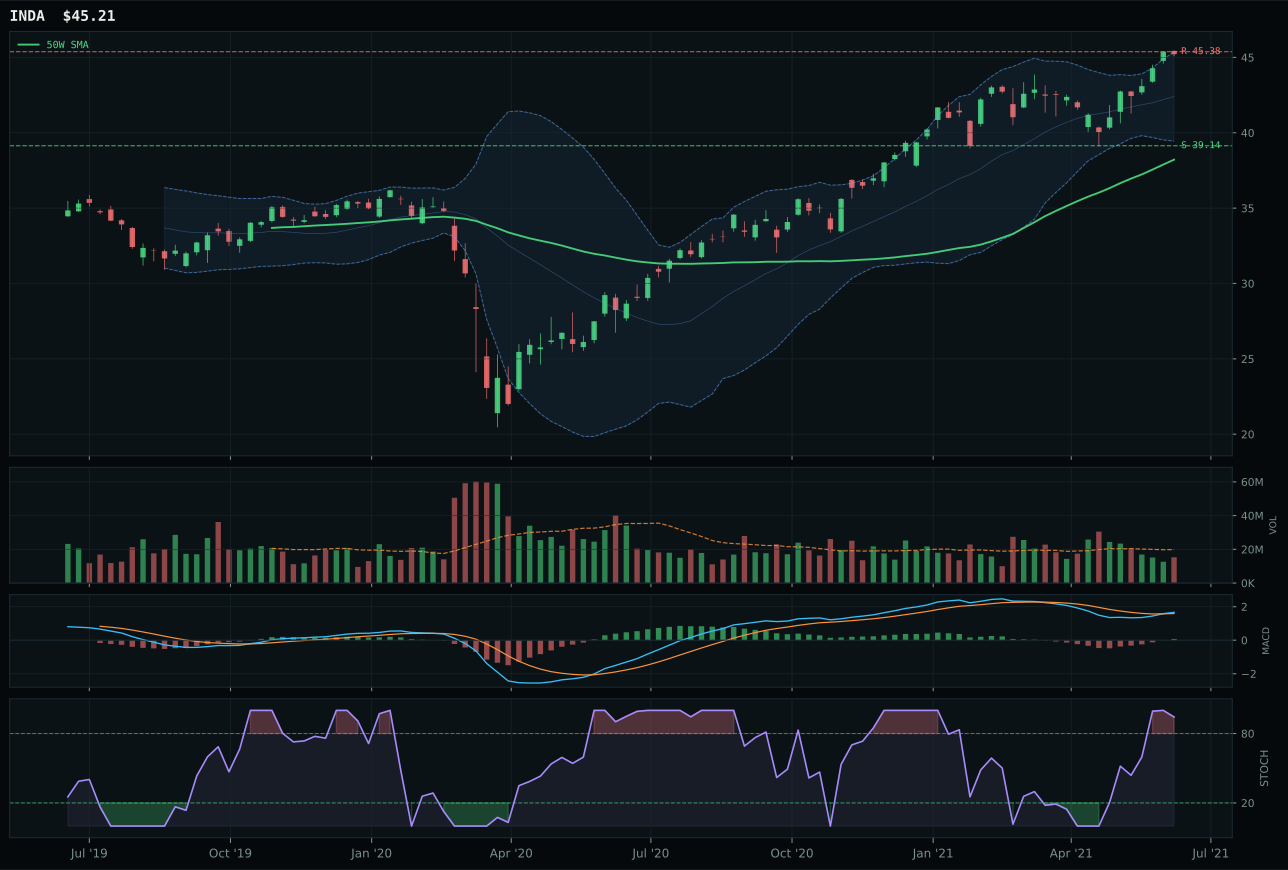
INDA has a vertical extension profile with -2.2% 13-week relative strength versus SPY.
A failed hold above support would weaken the setup.
Actionable but governed by invalidation levels.
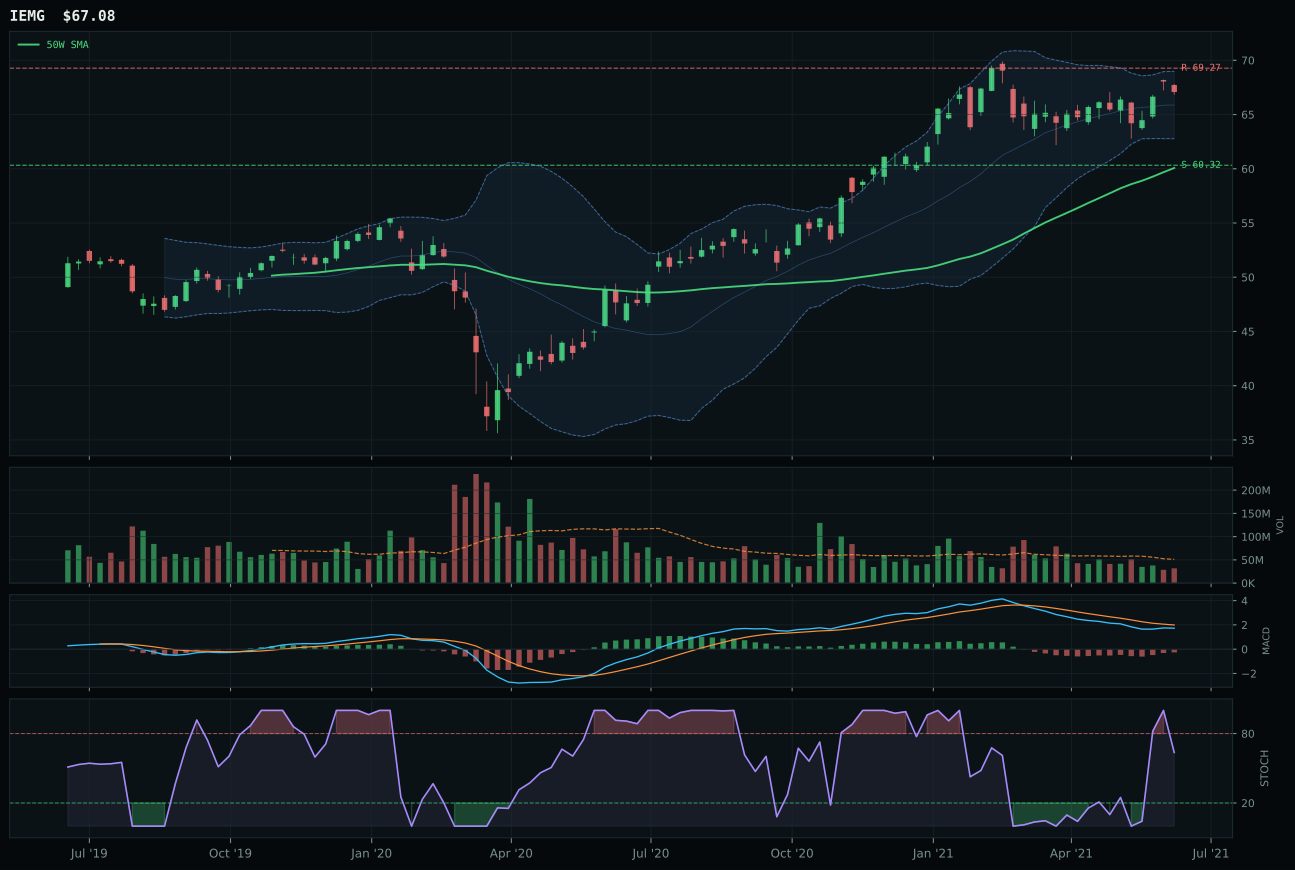
IEMG has a neutral structure profile with -4.6% 13-week relative strength versus SPY.
A failed hold above support would weaken the setup.
Actionable but governed by invalidation levels.
INDA wins emerging markets with a composite score of 62 and nearly flawless trend execution (96.7/100), defeating ILF's 69/100 composite despite ILF's superior momentum (100 vs 75) and stronger relative strength (5.2% vs -2.2%). The decision hinges on timing and risk/reward: INDA's 37.4/100 risk/reward (tiny 0.4% upside to resistance, 15.5% downside cushion) offers better entry safety than ILF's 39/100, while INDA's 37.0/100 timing reflects a more defensive entry with overbought momentum that suggests capital needs to consolidate before extending higher. INDA's neutral volume (0.77x 20W) and 5.5% 13-week return validate that India quality-growth is attracting persistent accumulation, not chase buying. ILF's 12.9% 13-week return and 5.2% SPY outperformance are seductive, yet Latin America's commodity beta and value exposure make it more cyclical and macro-sensitive when credit stress is active—INDA's quality tilt offers greater resilience.
Emerging Markets earns 10% as a top-2 overweight because its 61.9 category score ranks second among all categories after precious metals (64.4), meriting equal core allocation. EM liquidity support is active and powerful (+14), Goldilocks regime adds (+8), and commodity breadth is positive (+5), yet credit stress cuts into the tailwind (-10), creating a macro fit of 62.0/100 that is strong but not dominant. INDA's 63.2/100 technical evidence base reflects solid trend, structure integrity, and momentum confirmation despite the extended setup. The allocation acknowledges that emerging markets, particularly India's quality-growth profile, offer the best risk-adjusted return in a Goldilocks regime where EM liquidity is flowing and credit stress is not acute. To maintain top-2 status, INDA would need to defend the 50W support on any pullback and hold above the 39.14 lower support band, confirming that EM accumulation is structural rather than momentum-driven.
Technology — IGV
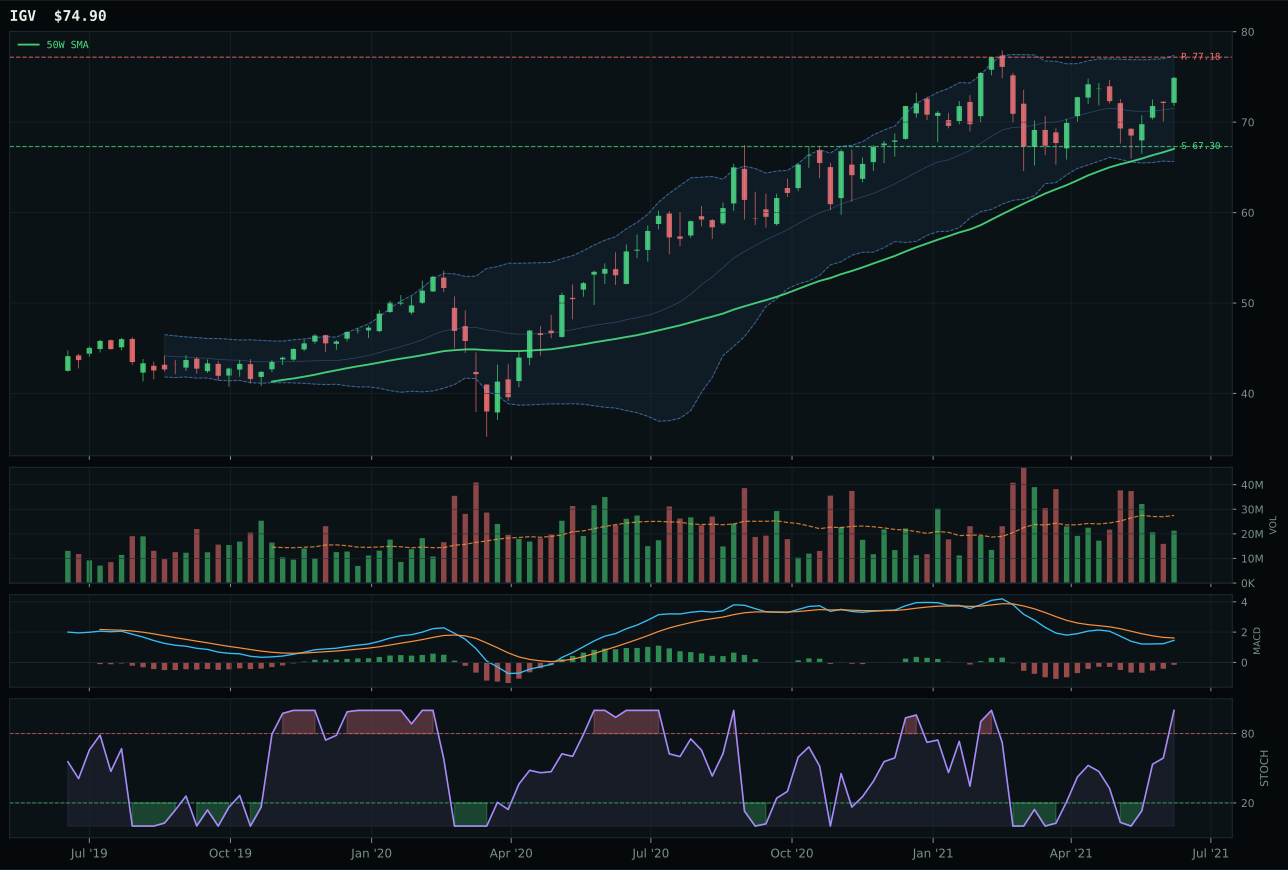
IGV has a neutral structure profile with 0.7% 13-week relative strength versus SPY.
A failed hold above support would weaken the setup.
Actionable but governed by invalidation levels.
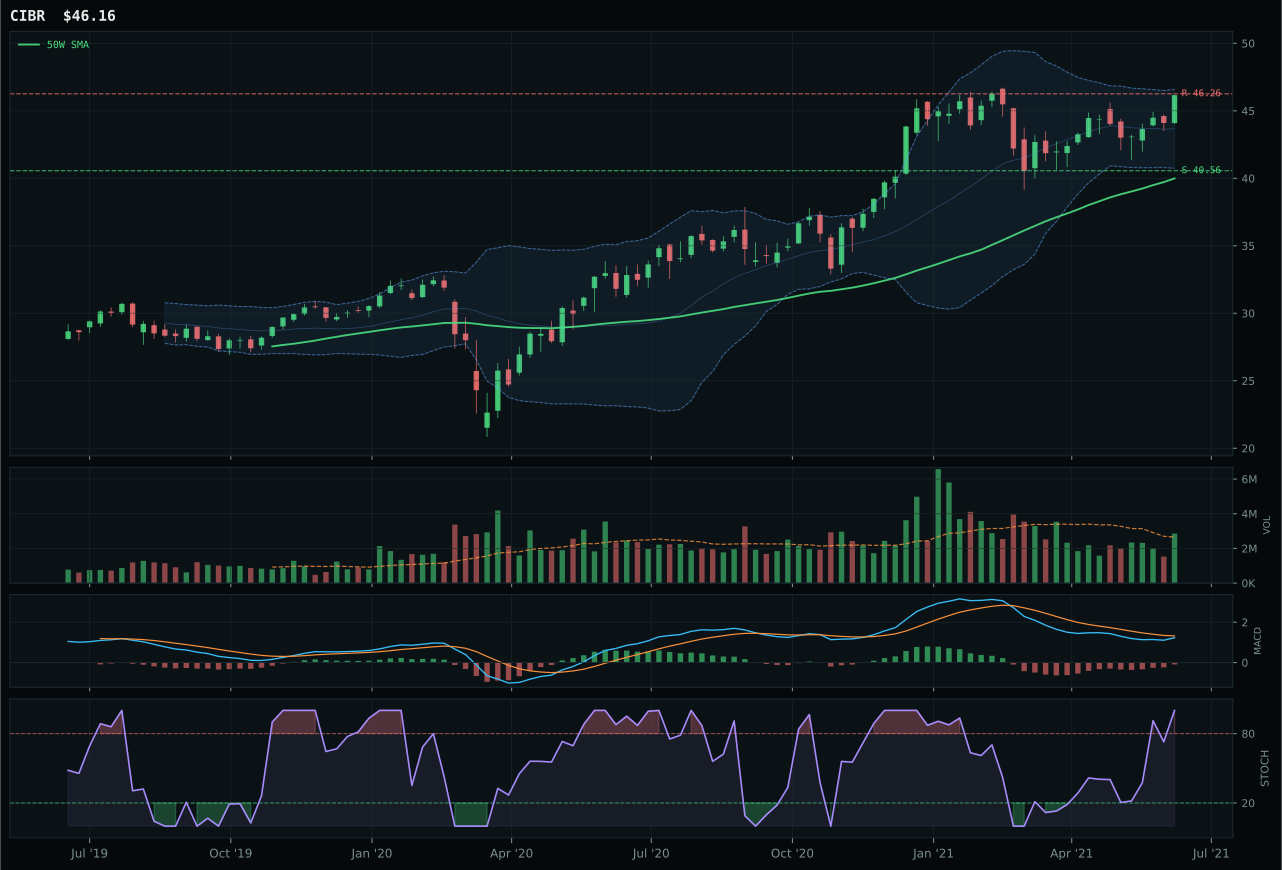
CIBR has a vertical extension profile with 0.5% 13-week relative strength versus SPY.
A failed hold above support would weaken the setup.
Actionable but governed by invalidation levels.
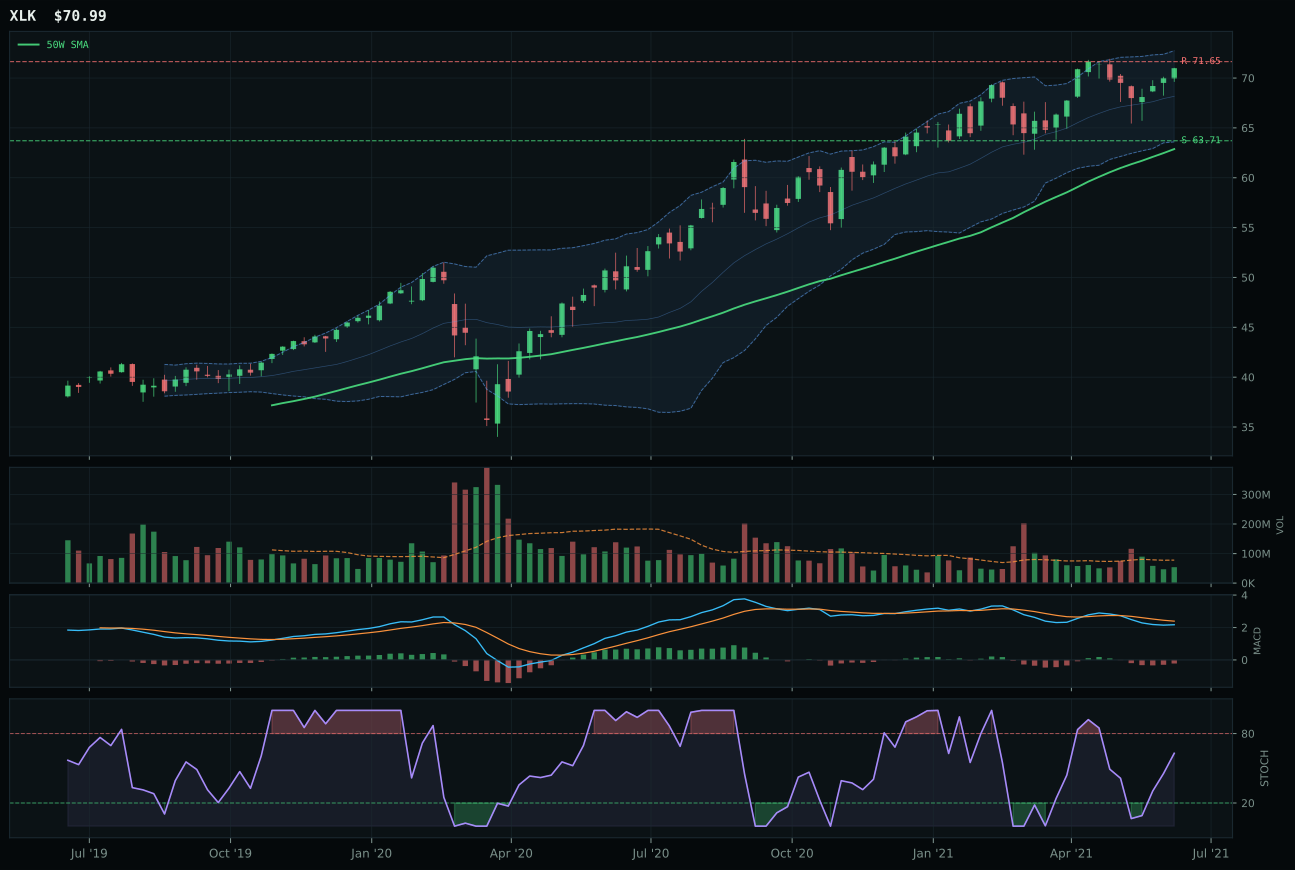
XLK has a neutral structure profile with 0.4% 13-week relative strength versus SPY.
A failed hold above support would weaken the setup.
Actionable but governed by invalidation levels.
IGV wins the technology category decisively, with a composite score of 76 versus CIBR's 62, because it owns the timing edge where it counts most. Price sits just 11.7% above the 50-week moving average in a neutral chart structure—close enough to the intermediate support at 67.30 to offer a genuine two-way risk, yet high enough to confirm that accumulation is real. The 0.2% relative strength advantage over category peers and 0.7% outperformance versus SPY validate that enterprise software is attracting fresh capital, not chasing exhaustion. CIBR's vertical extension setup and weaker 0.0% category-relative strength expose the timing cost of buying cybersecurity near its 52-week high—the MACD improvement cannot justify the 30-point risk/reward deficit (37.3 vs 49.7) when entry risk is this asymmetric.
Technology earns 5% allocation as a tier-2 holding, not a top-2 core position, because its 55.7 category score ranks it outside the two highest performers this week. The Goldilocks macro regime provides modest support (+9), and disinflation pressure actively favors duration-sensitive growth (+5), yet credit stress cuts the other way (-7), keeping macro fit at only 57.0/100. The 62% technical weighting reflects confidence in IGV's trend and structure, but the 38% macro discount acknowledges that technology is neither the scarcest asset nor the most cyclical play in a balanced environment. To move into top-2 status, technology would need either a deterioration in credit conditions that pushes allocators toward defensive growth, or a timing reset lower that allows entry at the 50W support where risk/reward flips decisively in the bullish direction.
Nuclear Energy — URA
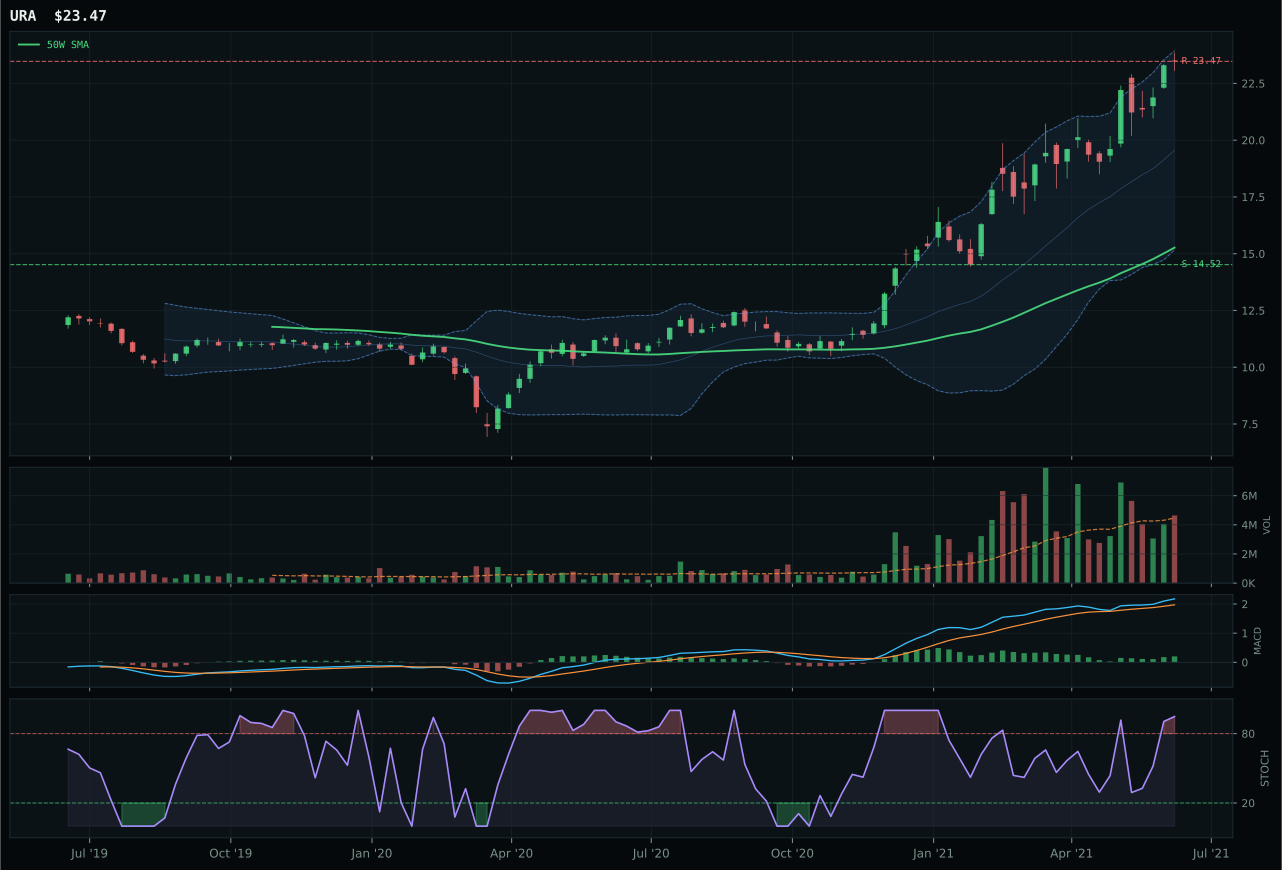
URA has a vertical extension profile with 16.3% 13-week relative strength versus SPY.
A failed hold above support would weaken the setup.
Actionable but governed by invalidation levels.
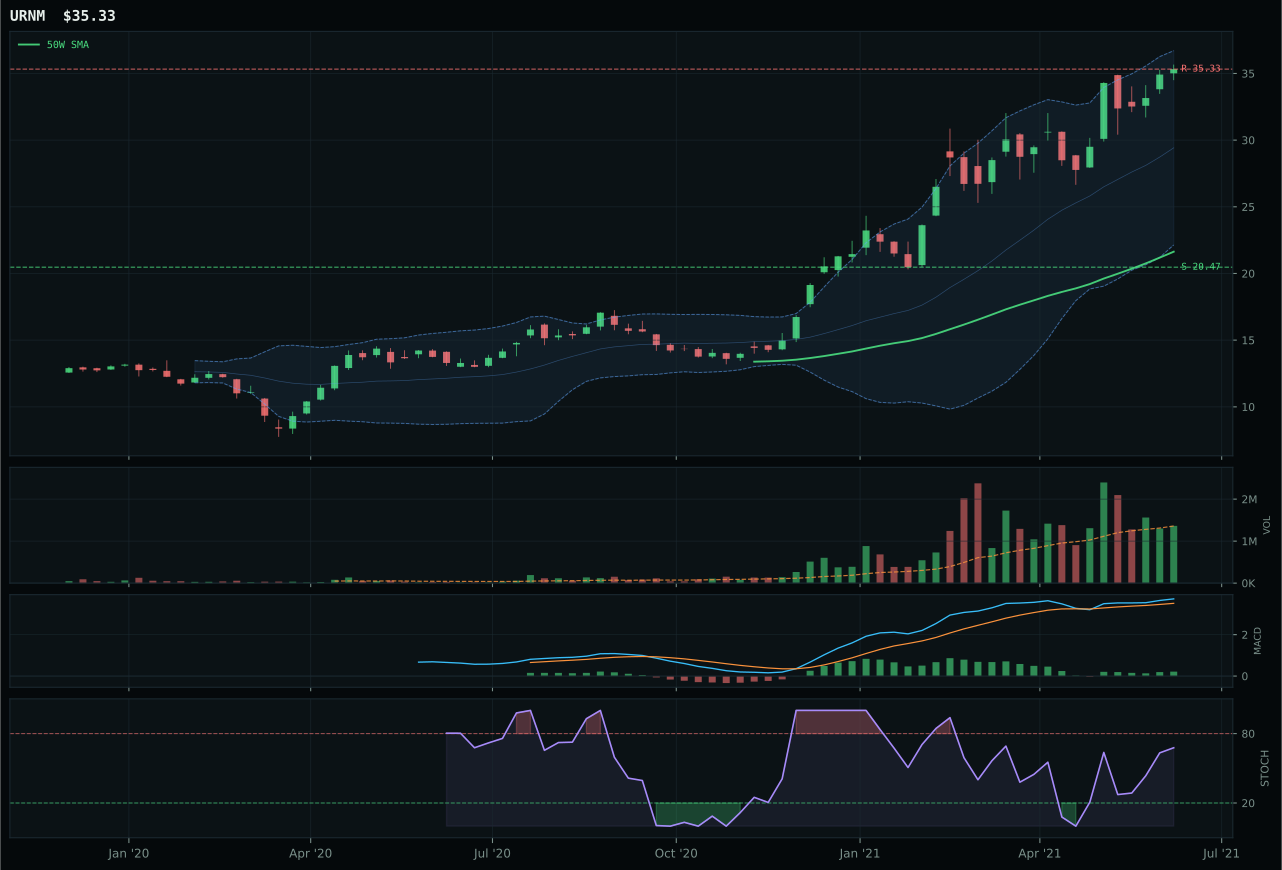
URNM has a vertical extension profile with 16.3% 13-week relative strength versus SPY.
A failed hold above support would weaken the setup.
Actionable but governed by invalidation levels.
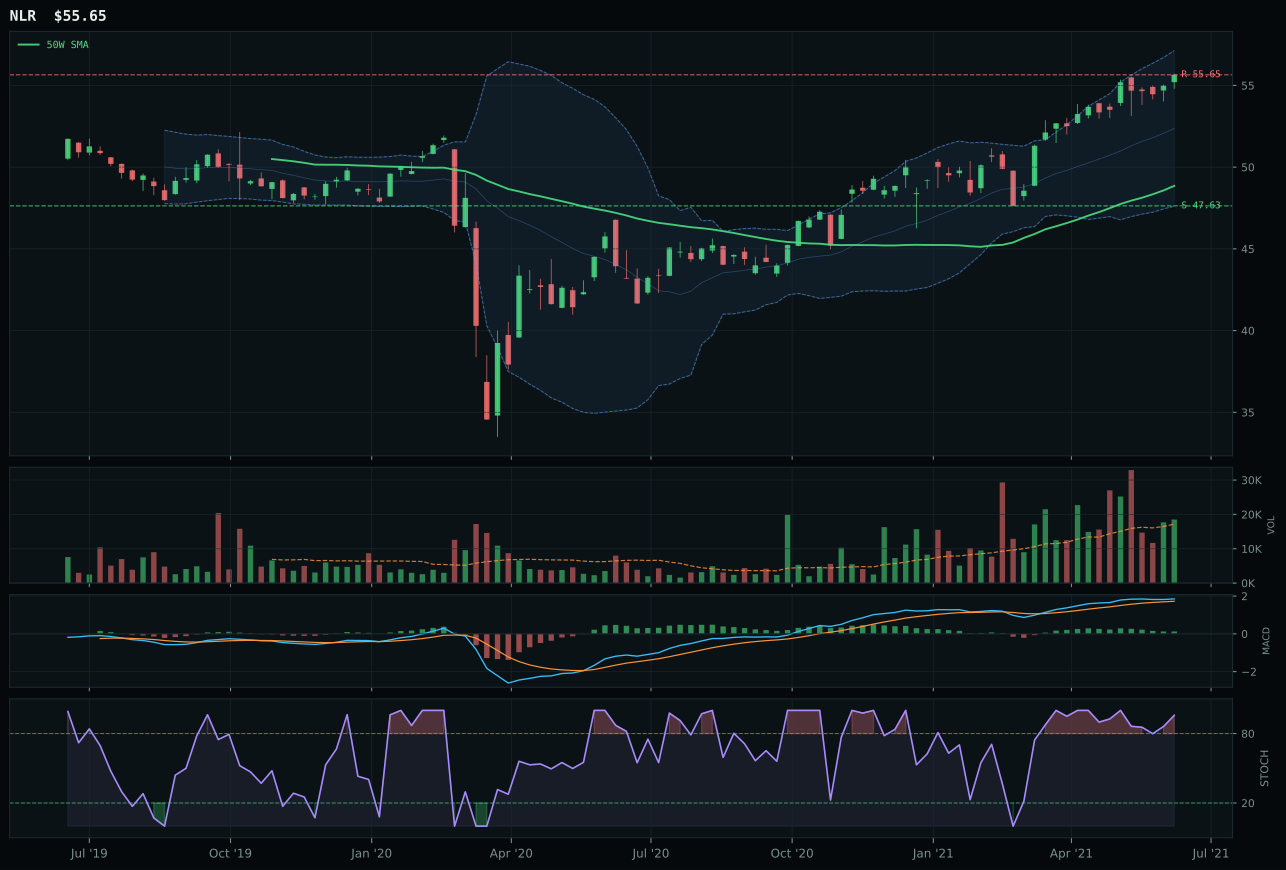
NLR has a neutral structure profile with 0.8% 13-week relative strength versus SPY.
A failed hold above support would weaken the setup.
Tracked, but not top-2 eligible because: .
URA wins the nuclear category by the slimmest margin over URNM (composite 64 vs 56), both driven by flawless trend execution (URA's 100/100, URNM's 80/100) and matching 100/100 momentum confirmation. Both setups are extended 53–63% above their 50W moving averages and both face overbought stochastic conditions, yet URA's cleaner structure (73.9 vs 72.6) and slightly superior timing (37.0 vs 53.0, where 53.0 reflects URNM's less stretched position) determine the selection. URA's 24.0% 13-week return proves uranium is attracting cross-market capital, and the 16.3% SPY outperformance is exceptional. URNM's rising mid-zone stochastic RSI (vs URA's overbought 0.95) is technically superior, yet that advantage cannot overcome the structural edge that favors the broader uranium exposure when capital flows are this strong. Risk/reward is nearly identical (39.3 vs 39.0), confirming this is a setup-quality decision, not a fundamental one.
Nuclear Energy earns 5% allocation in tier-2 because its 54.9 category score ranks third after precious metals (64.4) and emerging markets (61.9), just outside the top-2 overweight tier. Real asset sponsorship is active (+7) and metals scarcity applies to uranium (+6 implicit in the broader scarcity regime), providing modest macro tailwind, yet credit stress is live (-5) and macro fit stands at only 52.0/100. The critical problem is setup risk: URA is 53.7% extended above the 50W with overbought momentum at stochastic 0.95, leaving minimal margin for error if capital rotates. The 39.3/100 risk/reward reflects upside nearly exhausted (0.0% to resistance) and downside severe (61.6% to support), creating an asymmetry that disqualifies nuclear from core allocation. To claim a higher tier, nuclear would need a 20–25% pullback that resets the stochastic and MACD into rising mid-zone territory, combined with a confirmed supply shortage announcement or energy-scarcity macro shift that would justify paying for uranium exposure at secondary entry levels.
Industrial Metals — REMX
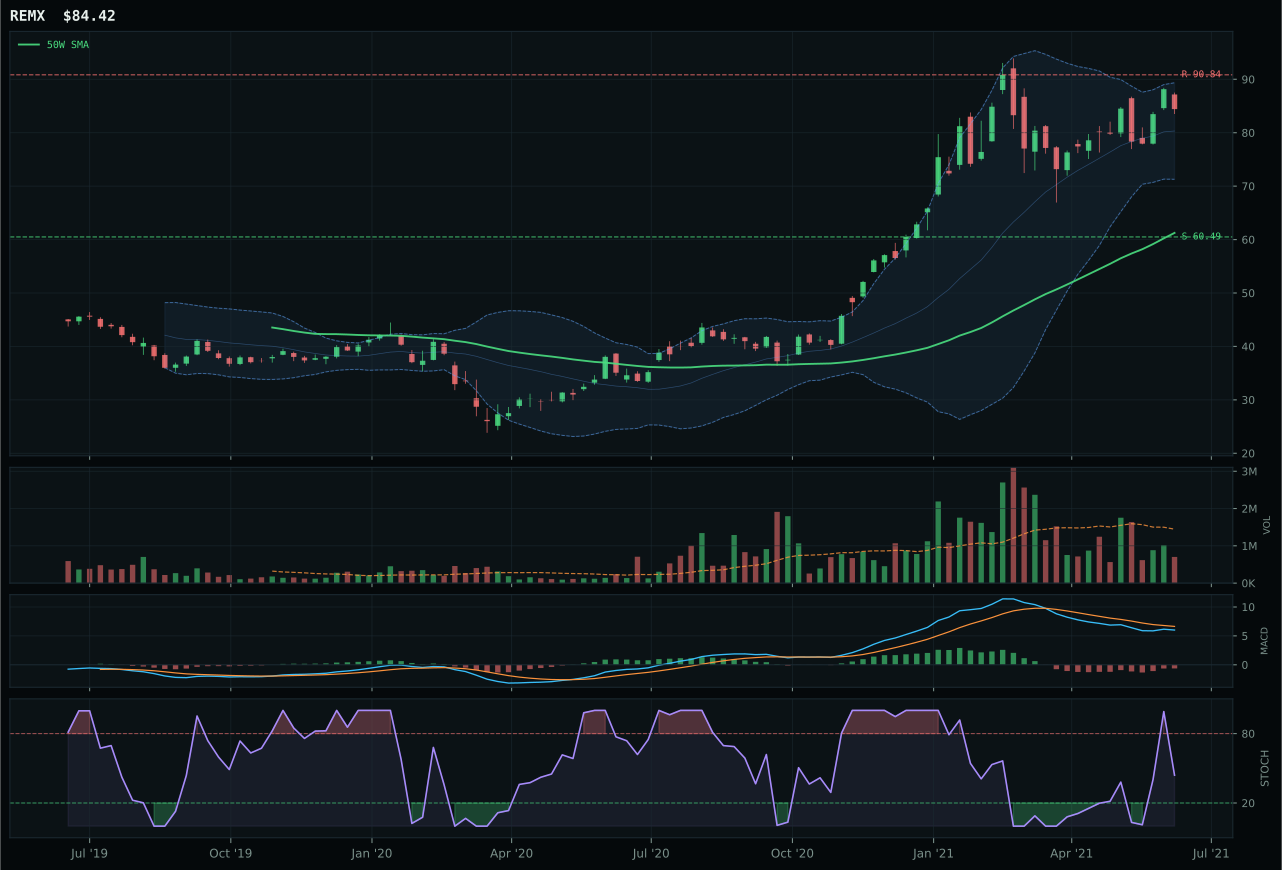
REMX has a vertical extension profile with -2.7% 13-week relative strength versus SPY.
A failed hold above support would weaken the setup.
Actionable but governed by invalidation levels.
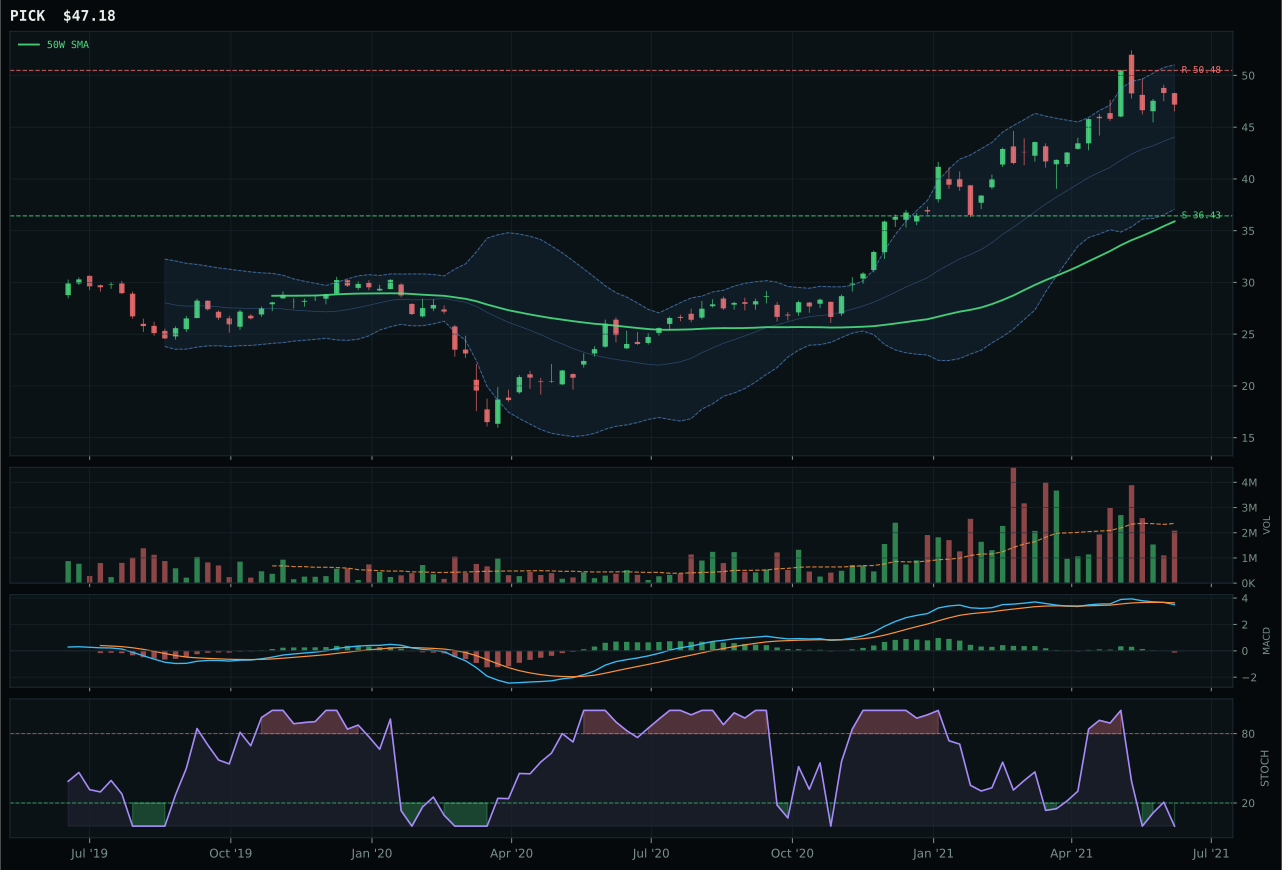
PICK has a vertical extension profile with 0.6% 13-week relative strength versus SPY.
A failed hold above support would weaken the setup.
Actionable but governed by invalidation levels.
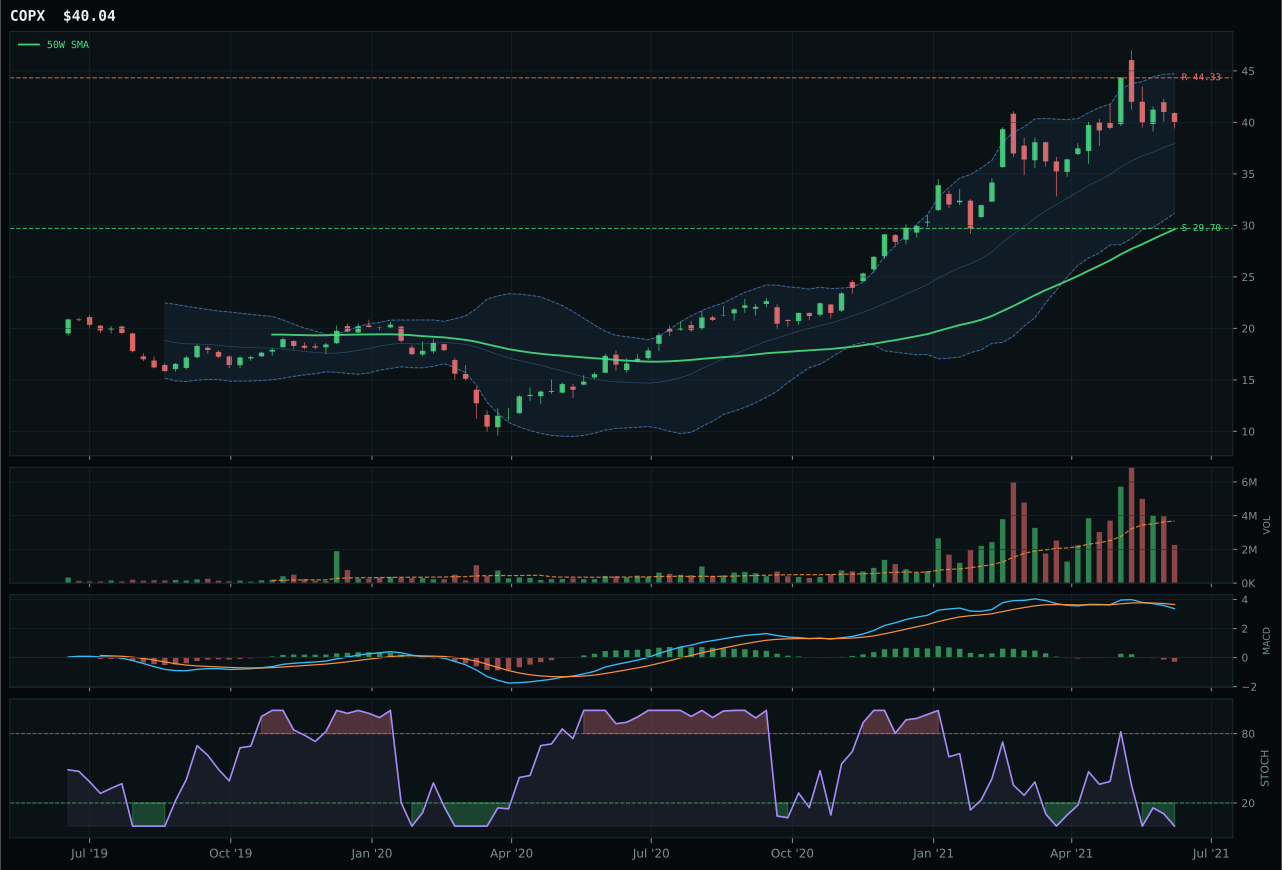
COPX has a vertical extension profile with -2.5% 13-week relative strength versus SPY.
A failed hold above support would weaken the setup.
Actionable but governed by invalidation levels.
REMX wins industrial metals as the least damaged player in a category hammered by extension and thin volume. Its 89/100 trend score is solid—price above both moving averages with 1.7% 50W slope—and the 5.0% 13-week return, combined with -0.2% category-relative strength, keeps it competitive versus PICK's oversold technical damage. The 61.0/100 timing score reflects the brutal 37.8% extension above the 50W, yet stochastic RSI at rising mid-zone (0.44) offers better entry dynamics than PICK's oversold 0.00, which signals exhaustion rather than accumulation. PICK's 8.3% 13-week return and neutral volume (vs REMX's thin 0.49x) appear superior on paper, but the macro message is clear: metals scarcity is active (+9), and REMX's rare-earth positioning aligns with supply-chain fragmentation fears, while PICK's diversified mining breadth is the underperformer when scarcity is the driver.
Industrial Metals earns 5% allocation in tier-2 despite a strong 52.1 category score because precious metals (64.4) and emerging markets (61.9) rank higher in this week's capital queue. The macro environment is exceptionally favorable: metals scarcity is active (+9), commodity breadth is positive (+10), real asset sponsorship is live (+6), and Goldilocks adds (+6), pushing category-level macro fit to 79.0/100—the highest of any category this week. Yet technical execution is weak: both REMX and PICK are 37–40% extended above their 50W moving averages with thin participation, creating a timing penalty that locks the category into a secondary tier. To earn top-2 status, industrial metals would need either a 15–20% pullback that allows fresh entry near the 50W with wide volume participation, or a macroeconomic shock (supply disruption, supply-chain crisis, EV production acceleration) that reprices scarcity risk high enough to justify extended entry.
Utilities & Infrastructure — XLU
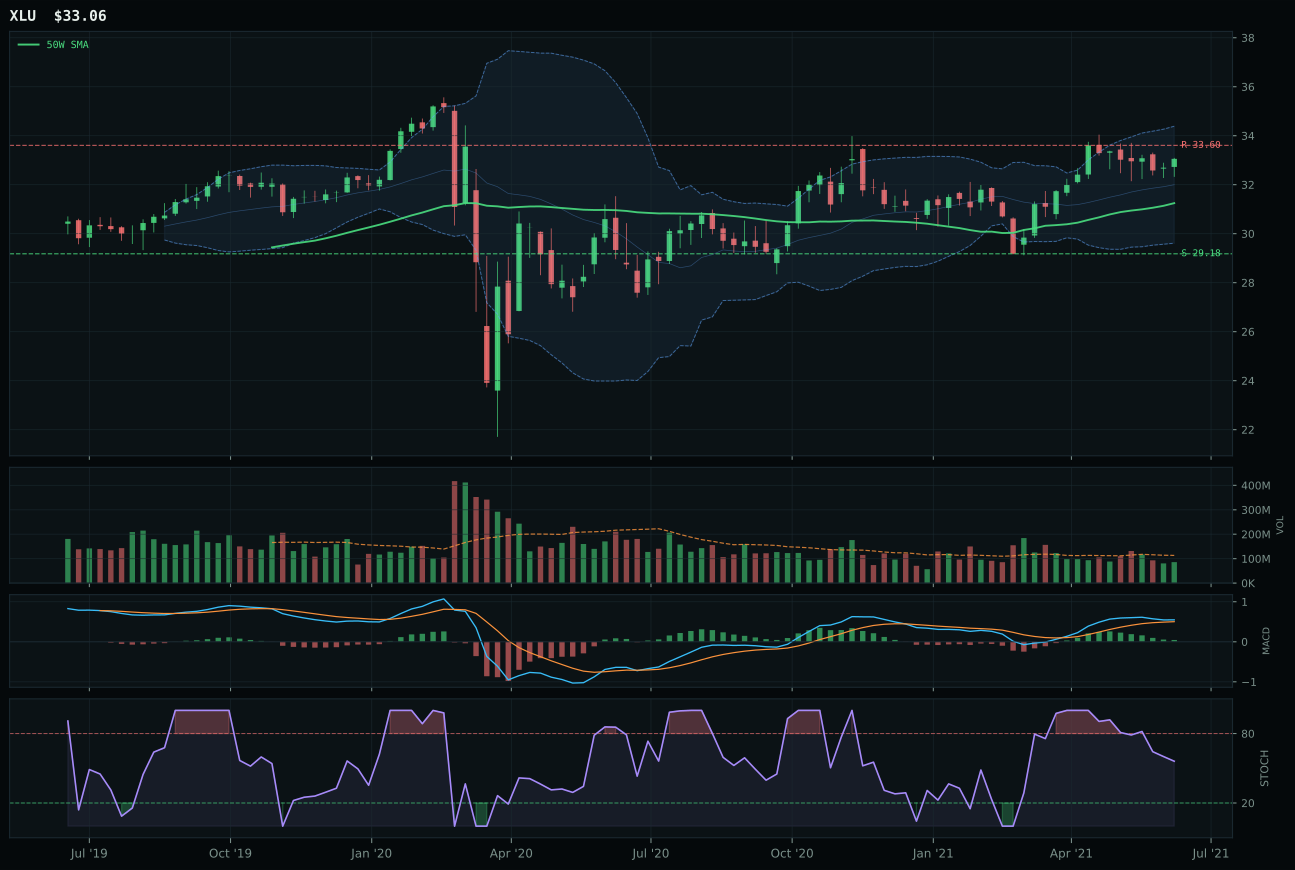
XLU has a neutral structure profile with -1.7% 13-week relative strength versus SPY.
A failed hold above support would weaken the setup.
Actionable but governed by invalidation levels.
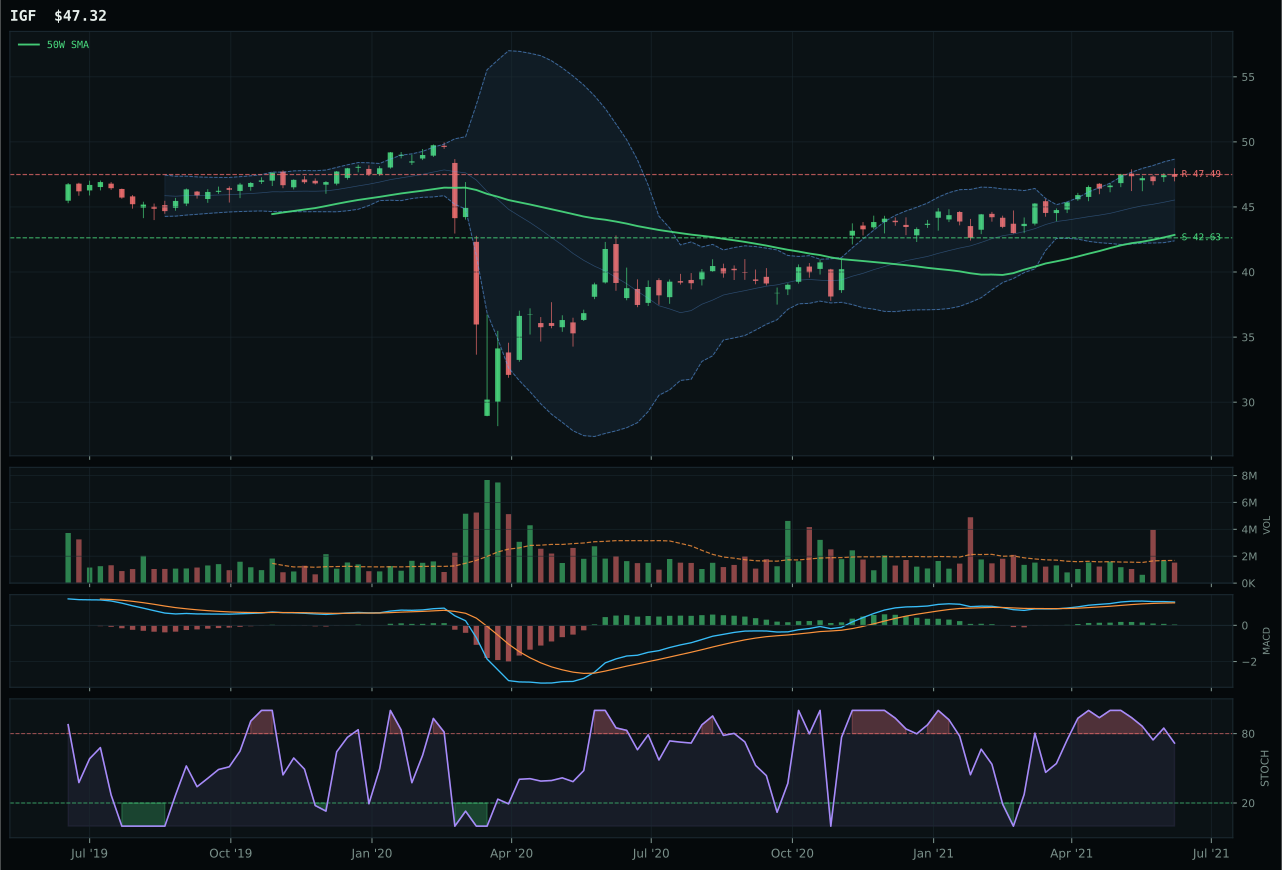
IGF has a neutral structure profile with -3.1% 13-week relative strength versus SPY.
A failed hold above support would weaken the setup.
Actionable but governed by invalidation levels.
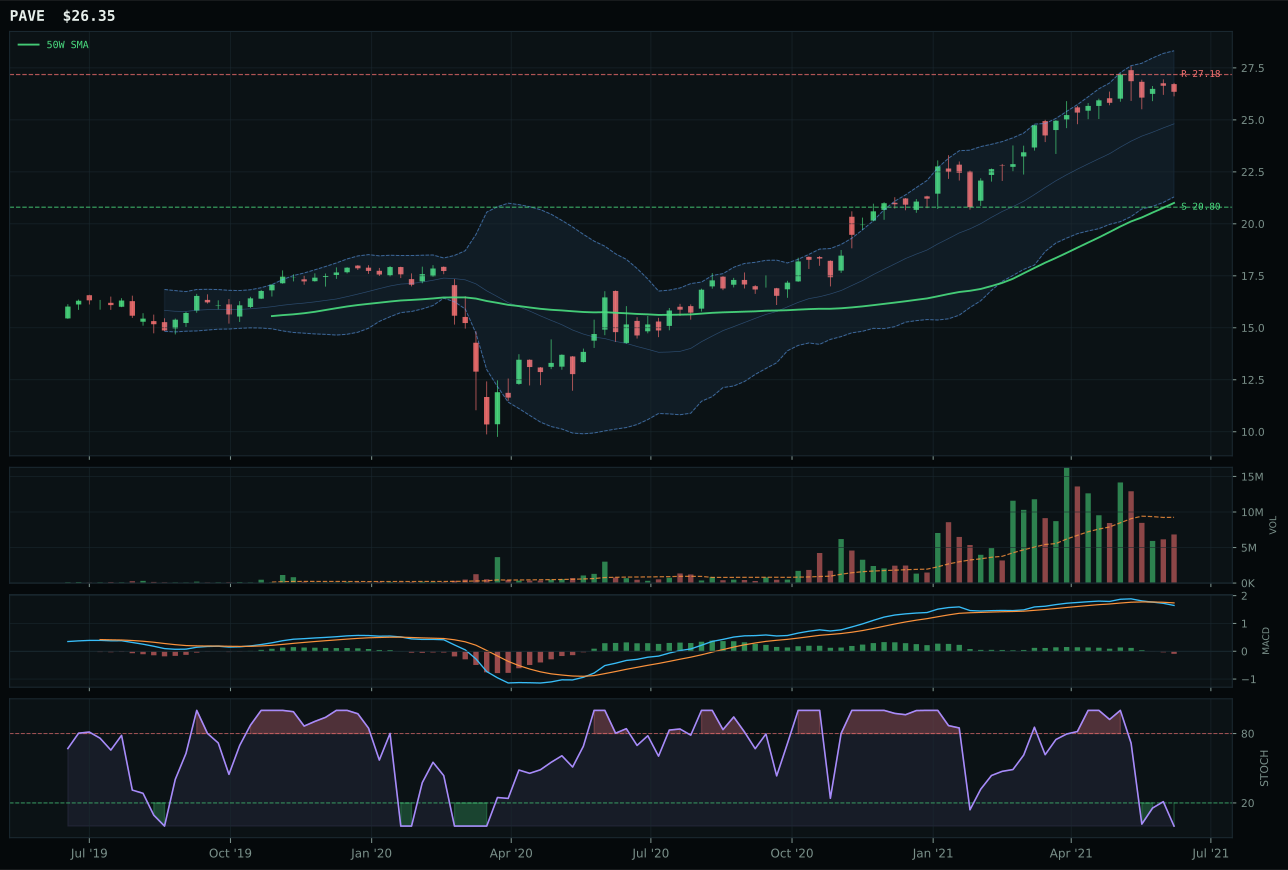
PAVE has a vertical extension profile with -1.2% 13-week relative strength versus SPY.
A failed hold above support would weaken the setup.
Actionable but governed by invalidation levels.
XLU wins utilities with a composite score of 73 versus IGF's 69, driven by superior timing (70 vs 62) and risk/reward (47.2 vs 37.6) despite near-identical trend execution (both 93–91/100). XLU's entry advantage is decisive: at only 5.8% above the 50W in a neutral structure with compression of 85.0/100, price sits in the sweet spot where trend is confirmed without exhaustion. The stochastic RSI at 0.56 (falling/neutral) is superior to IGF's matching 0.56 because XLU sits closer to support, creating a 13.3% downside cushion versus IGF's similar cushion at a higher price. Both show bullish but flattening MACD, yet XLU's regulatory-utility defensibility (the 93.4/100 trend without -3.1% SPY drag) outweighs IGF's global infrastructure income story when timing risk is paramount. The 0.0% category-relative strength tie is broken by structure cleanliness: XLU's 77.7/100 versus IGF's 76.2/100 confirms the regulated story is cleaner.
Utilities & Infrastructure earns 5% allocation in tier-2 because its 49.9 category score ranks below the top-2 threshold, despite solid macro fit of 60.0/100 supported by disinflation pressure (+6) and modest Goldilocks support (+4). The technical evidence of 66.0/100 is respectable but middle-of-the-pack—XLU's near-50W price offers clean entry, yet the 5.9% 13-week return shows momentum is muted compared to energy or precious metals. The category's challenge is cyclical: in Goldilocks, utilities are not scarce (like metals), not extended (like defense), and not emerging (like India)—they are simply defensive insurance that trades at fair value. To earn top-2 status, utilities would need either a macro deterioration (credit stress, deflationary shock) that makes defensive duration valuable, or XLU would need to sustain a 10–15% breakout above 33.60 resistance on volume expansion, signaling a shift toward cyclical infrastructure and away from pure rate defense.
AI — SMH
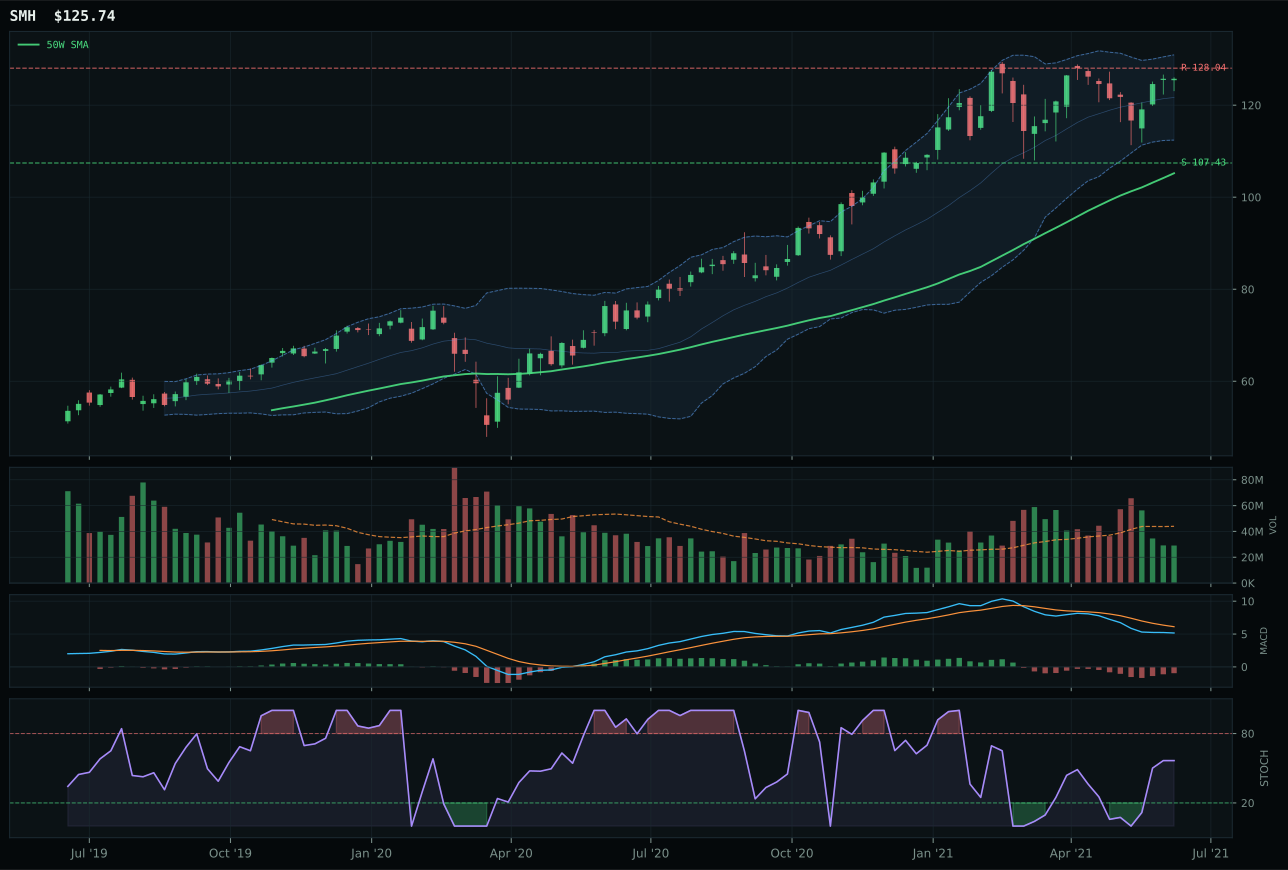
SMH has a vertical extension profile with 1.2% 13-week relative strength versus SPY.
A failed hold above support would weaken the setup.
Actionable but governed by invalidation levels.
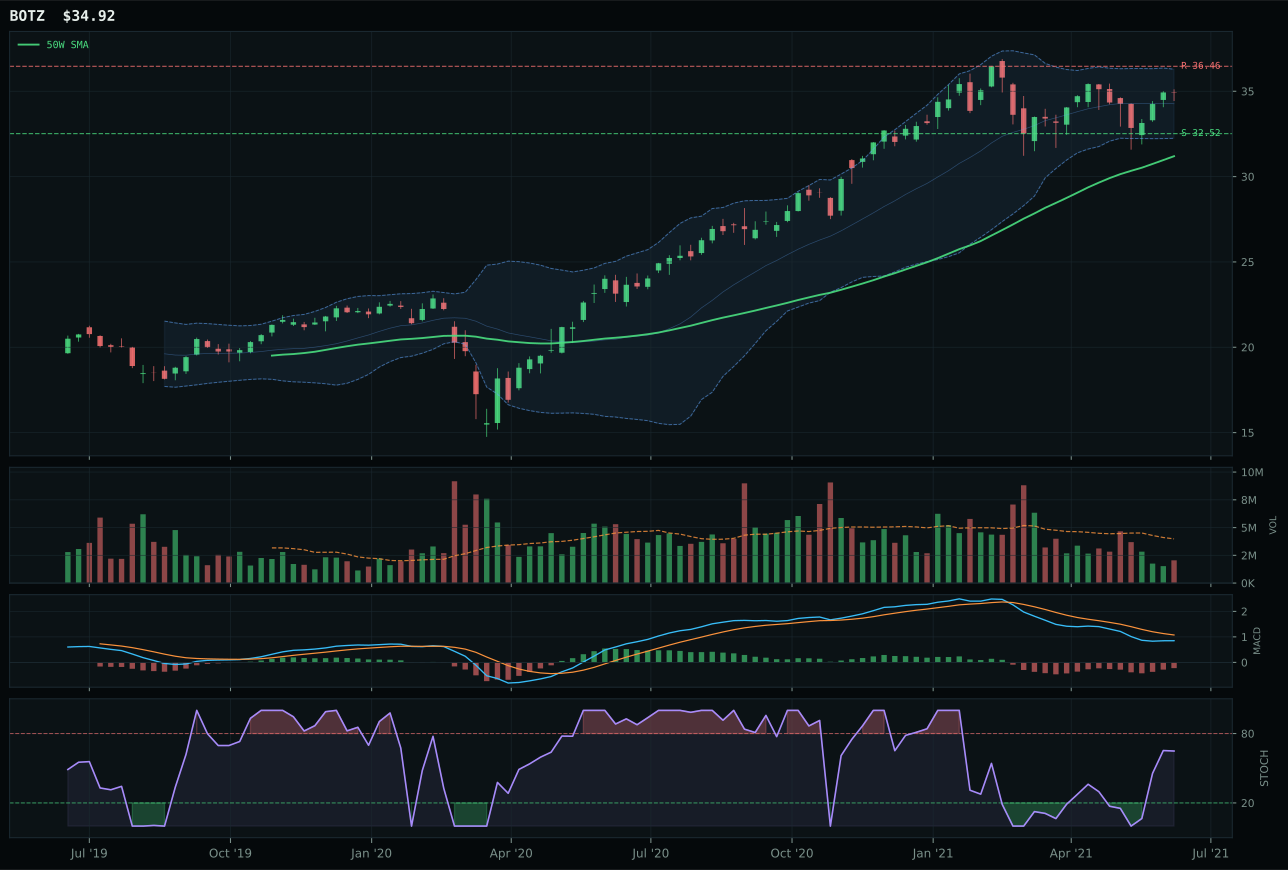
BOTZ has a neutral structure profile with -3.4% 13-week relative strength versus SPY.
A failed hold above support would weaken the setup.
Actionable but governed by invalidation levels.
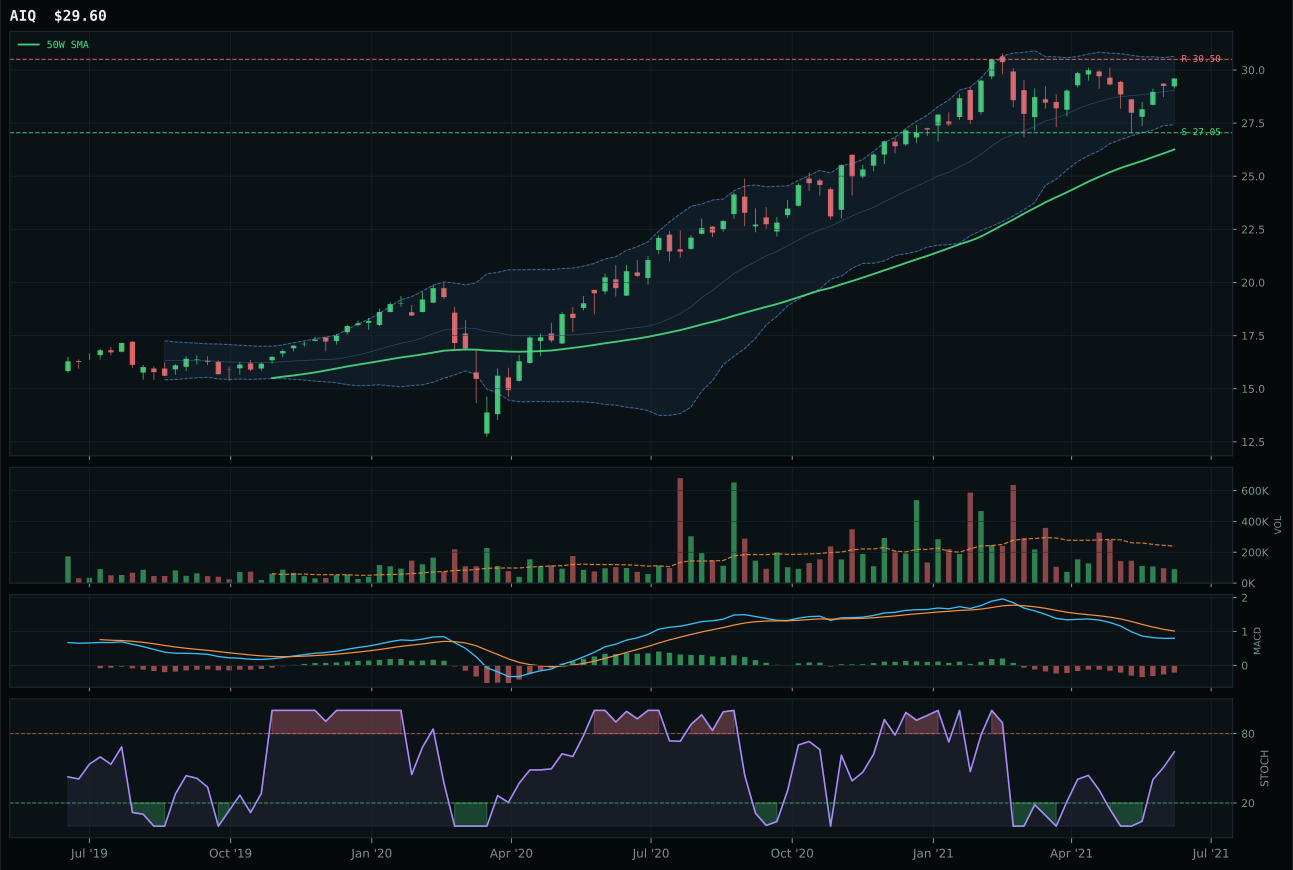
AIQ has a neutral structure profile with -4.6% 13-week relative strength versus SPY.
A failed hold above support would weaken the setup.
Tracked, but not top-2 eligible because: .
SMH wins the AI category on relative strength inside its three-ETF basket, posting 4.6% outperformance versus the category median versus BOTZ's 0.0%—a clean differentiator when trend scores are nearly identical. Its 8.9% 13-week return and 1.2% SPY-relative strength prove that semiconductor allocation is being accumulated despite the 19.5% extension above the 50W, which would normally penalize entry timing. The thin participation at 0.66x 20W volume is a structural headwind, yet MACD's bullish improvement and stochastic RSI at 0.57 (rising mid-zone, not overbought) suggest the move has duration remaining. BOTZ's neutral structure and -3.4% SPY underperformance expose robotics as the lagging thematic within a tech-led rally—the 83-point timing score cannot compensate for category-relative weakness when capital is rotating toward the stronger player.
AI receives 5% as a tier-2 holding because its 47.6 category score falls below the top-2 cutoff despite SMH's strong momentum. The technical evidence base is solid at 54.8/100 for the representative, but macro fit of only 44.0/100 drags the category lower; credit stress active (-6) and a Goldilocks regime that only modestly helps (+10) leave no tailwind for an extended valuation story. At this stage of the cycle, AI's overbought timing and thin volume confirmation make it a momentum hedge rather than a core allocation. The category would need either a significant pullback to 50W support that resets entry risk, or a shift in credit conditions toward outright stress that makes semiconductor scarcity and supply-chain defensibility much more valuable to portfolio protection.
Defense & Aerospace — XAR
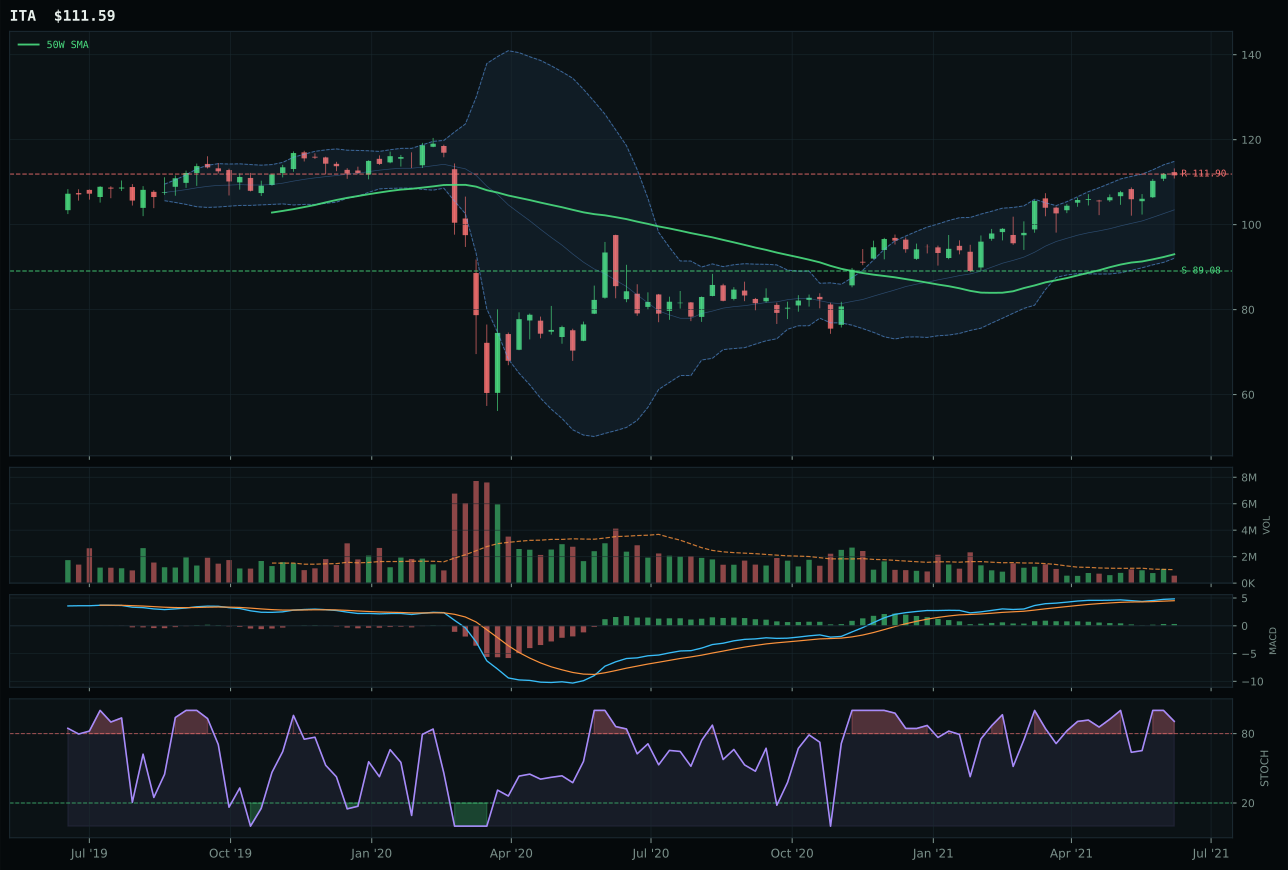
ITA has a vertical extension profile with -2.0% 13-week relative strength versus SPY.
A failed hold above support would weaken the setup.
Actionable but governed by invalidation levels.
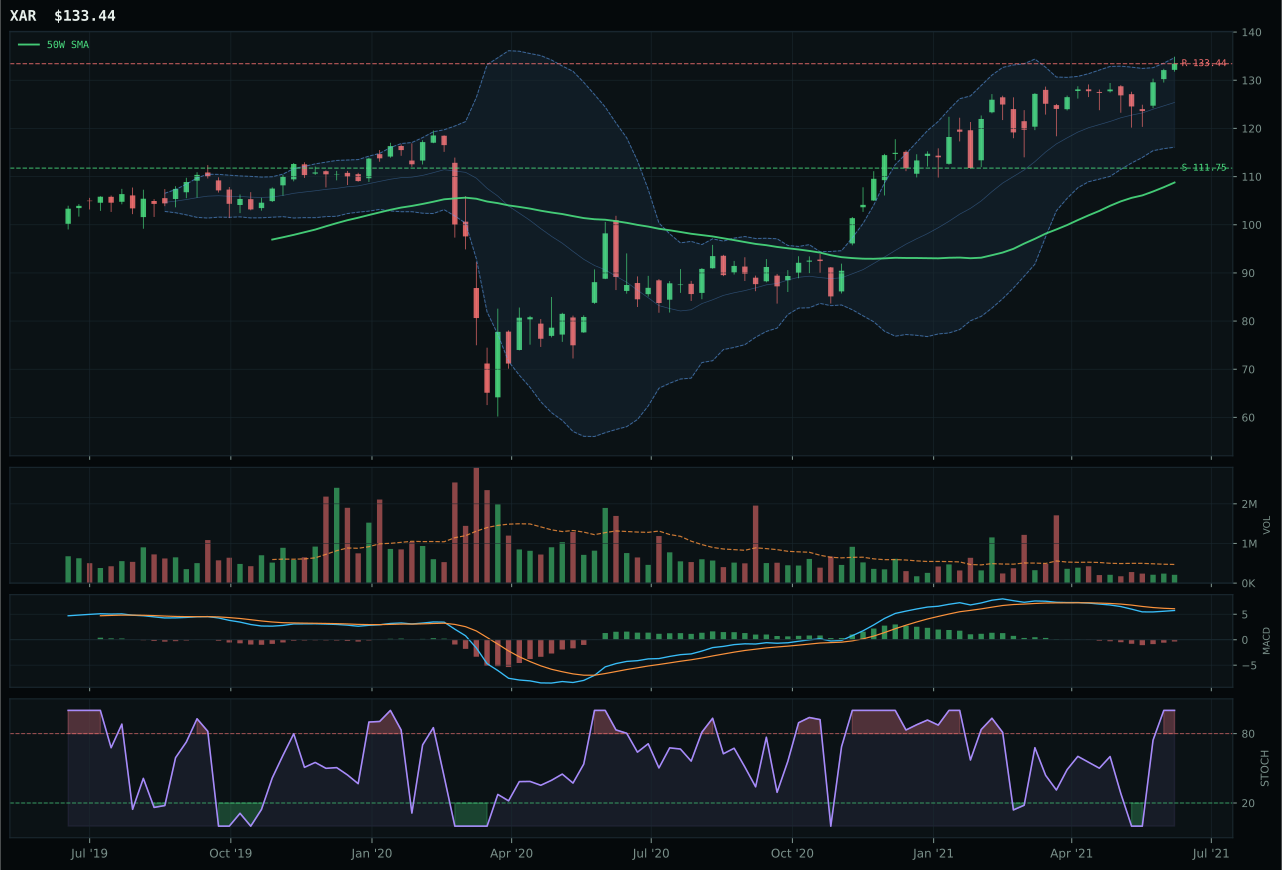
XAR has a vertical extension profile with -2.7% 13-week relative strength versus SPY.
A failed hold above support would weaken the setup.
Actionable but governed by invalidation levels.
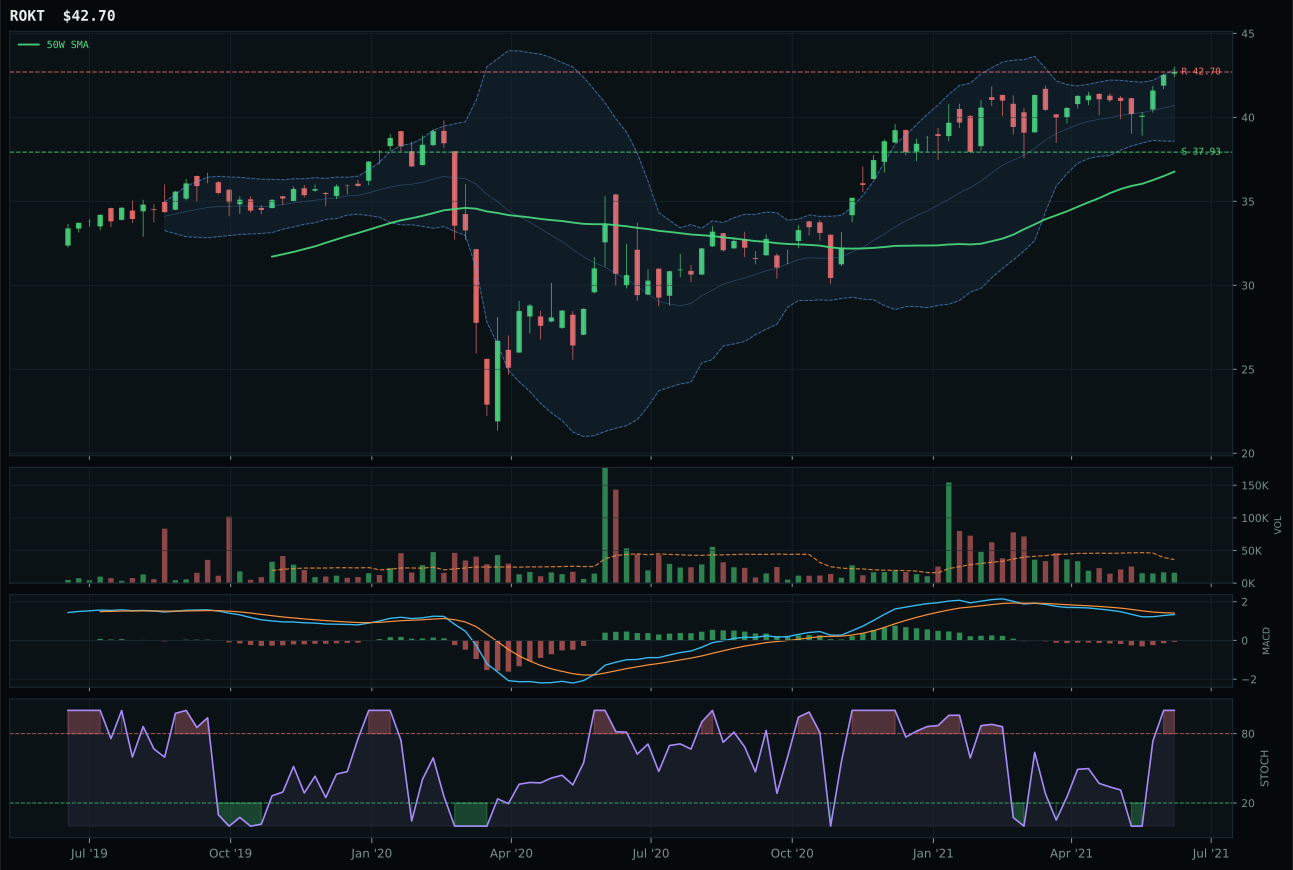
ROKT has a vertical extension profile with -4.4% 13-week relative strength versus SPY.
A failed hold above support would weaken the setup.
Tracked, but not top-2 eligible because: .
XAR wins the defense category by default over a weak field—composite score 58 versus ITA's 62 reflects how brutally extended both setups have become. XAR justifies selection because its trend score of 89/100 remains clean (price above 50W and 200W, slope 0.9%), and the 0.0% category-relative strength at least avoids lagging. The 22.7% extension above the 50W is severe, and timing at 37.0/100 clearly penalizes entry, yet the compression score of 83.1 on the structure suggests the volatility range remains disciplined. ITA's loss hinges entirely on worse risk/reward (37.2 vs 44.4)—the defense-prime story reads as more durable on paper, but its setup offers no edge when both candidates are priced near 52W highs with zero margin for error on the downside.
Defense & Aerospace earns 5% allocation in the tier-2 slot with a 39.6 category score that reflects fundamental weakness masking operational quality. The technical evidence is thin at 40.6/100; macro fit of 50.0/100 provides no lift because no category-specific descriptor profile applies—the Goldilocks regime offers only neutral support, and credit stress is actually slightly positive (+2), which is unusual. The real problem is timing and setup risk: at 22.7% extension and stochastic RSI already overbought at 1.00, the category is priced for perfection. To earn a higher allocation tier, defense would need either a 15–20% pullback that resets the 50W slope and creates a clean compression base, or a macroeconomic shift toward geopolitical stress or supply-chain fragmentation that justifies defensive premium valuations.
Traditional Energy — FCG
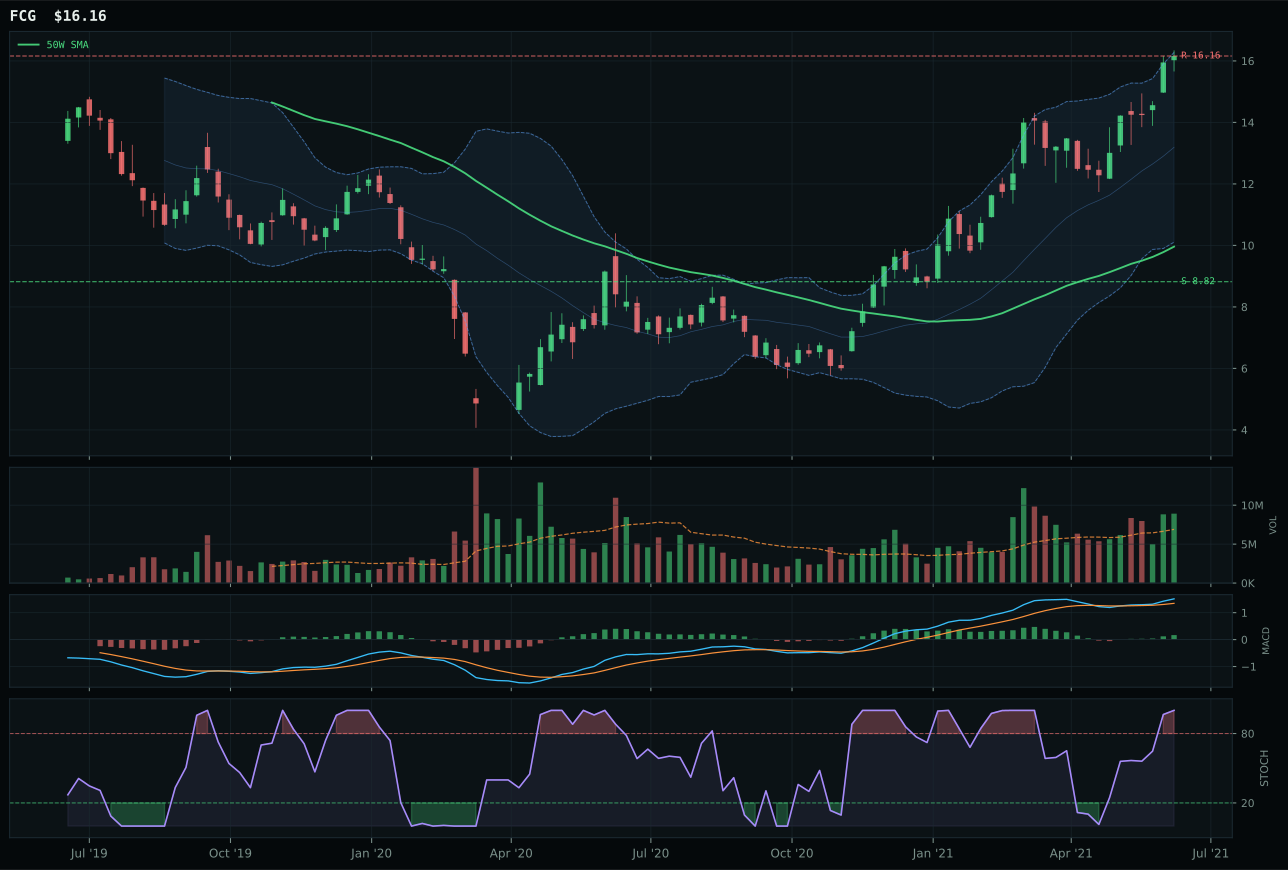
FCG has a vertical extension profile with 7.3% 13-week relative strength versus SPY.
A failed hold above support would weaken the setup.
Actionable but governed by invalidation levels.
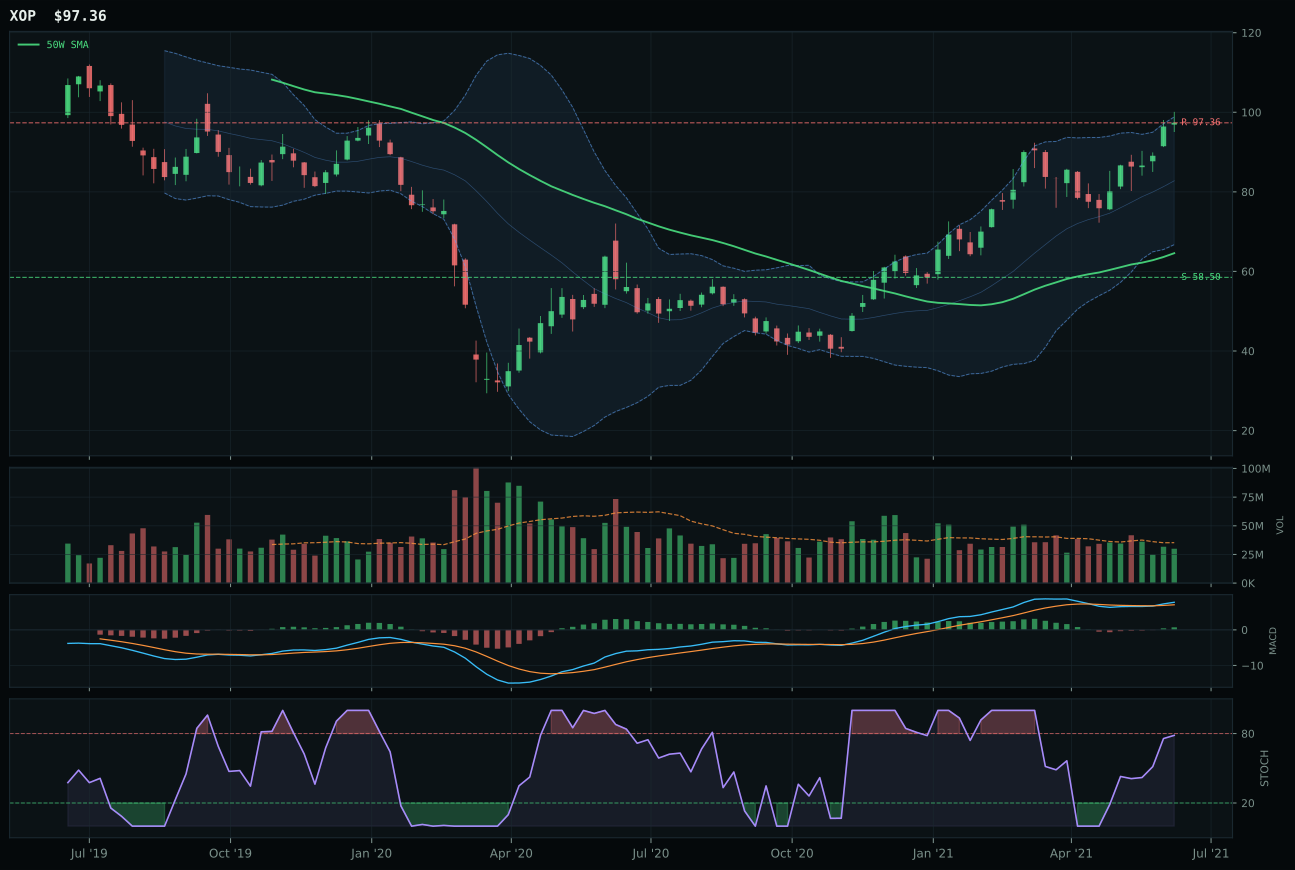
XOP has a vertical extension profile with -0.0% 13-week relative strength versus SPY.
A failed hold above support would weaken the setup.
Actionable but governed by invalidation levels.
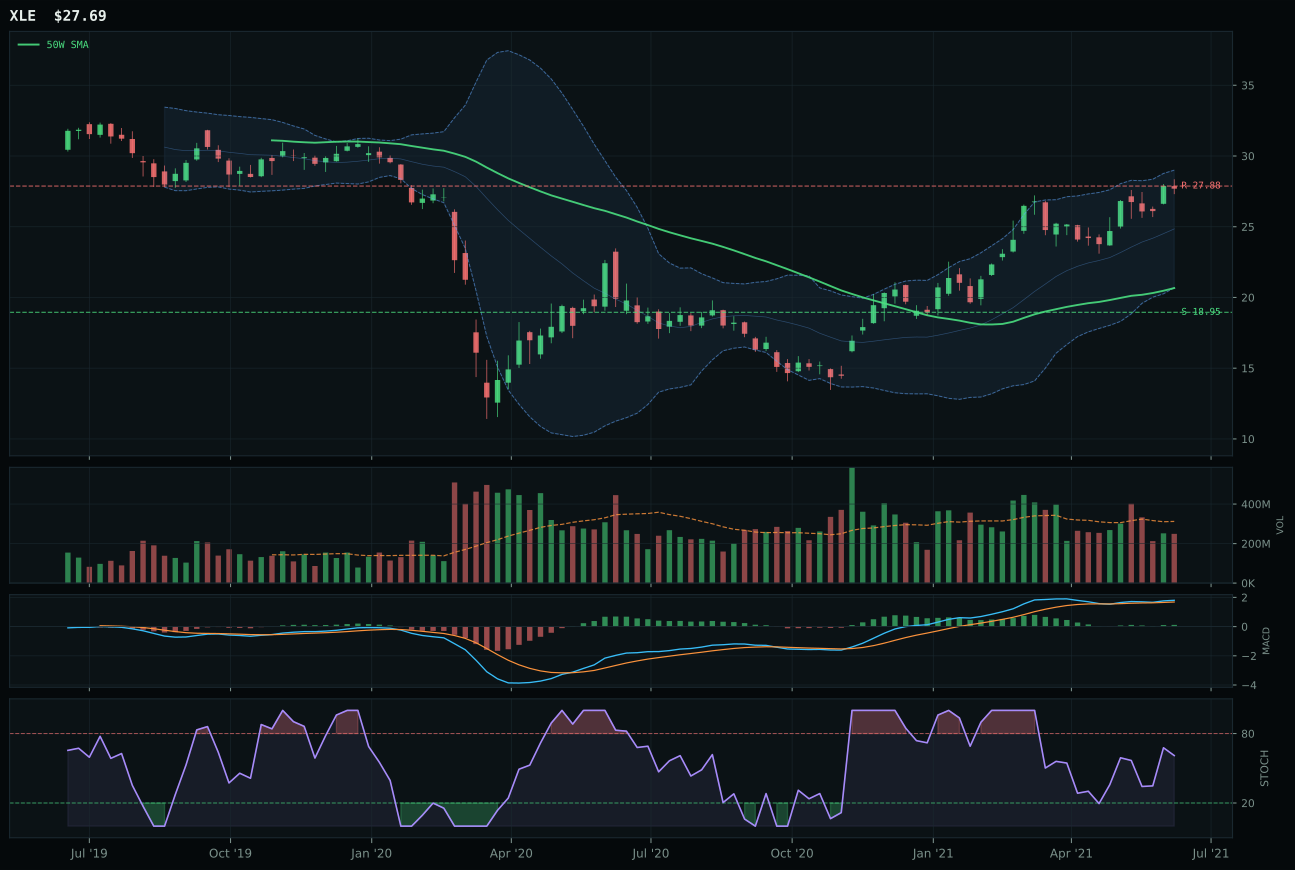
XLE has a vertical extension profile with -4.3% 13-week relative strength versus SPY.
A failed hold above support would weaken the setup.
Actionable but governed by invalidation levels.
FCG wins traditional energy with perfect execution on trend and momentum—both scoring 100/100—yet the category receives 0% allocation because the risk/reward becomes untenable at 62.2% extension above the 50W. FCG's 14.9% 13-week return and 7.3% category-relative strength are the strongest in its peer set, and volume confirmation is above-average at 1.29x, validating that accumulation is real and broad. The MACD is bullish and improving, and the 13W/4W momentum readings (14.9%/13.4%) show continuation potential. XOP's loss is structural—0.0% category-relative strength and neutral volume participation expose crude-focused exposure as a laggard within energy strength, while cleanliness disadvantage (70.4 vs 76.0) suggests the uptrend is becoming choppy. Yet FCG's 38.7/100 risk/reward and zero margin to resistance eliminate it from consideration: downside to support is 83.2%, meaning a pullback would be catastrophic.
Traditional Energy receives 0% allocation this week, ranking outside funded categories, despite FCG's impressive momentum because timing and valuation preclude prudent deployment. The category score of 33.6 ranks 9th or 10th, a consequence of poor macro fit at only 40.0/100: disinflation pressure is active and working against energy (-10), credit stress is live (-7), and real asset sponsorship only marginally helps (+7). More critically, FCG's 62.2% extension above the 50W and vertical-extension structure leave zero room for error—a 5% pullback would breach support and trigger capitulation selling. The macro regime is Goldilocks, which is neutral for energy, and no category-specific descriptor profile applies. For traditional energy to re-enter allocation, FCG would need a 20–25% pullback to the 50W and fresh accumulation at support, combined with either a confirmed supply disruption (geopolitical shock, OPEC production cut) or a pivot away from disinflation into inflation fears that reprices real assets higher.
Agriculture & Livestock — MOO
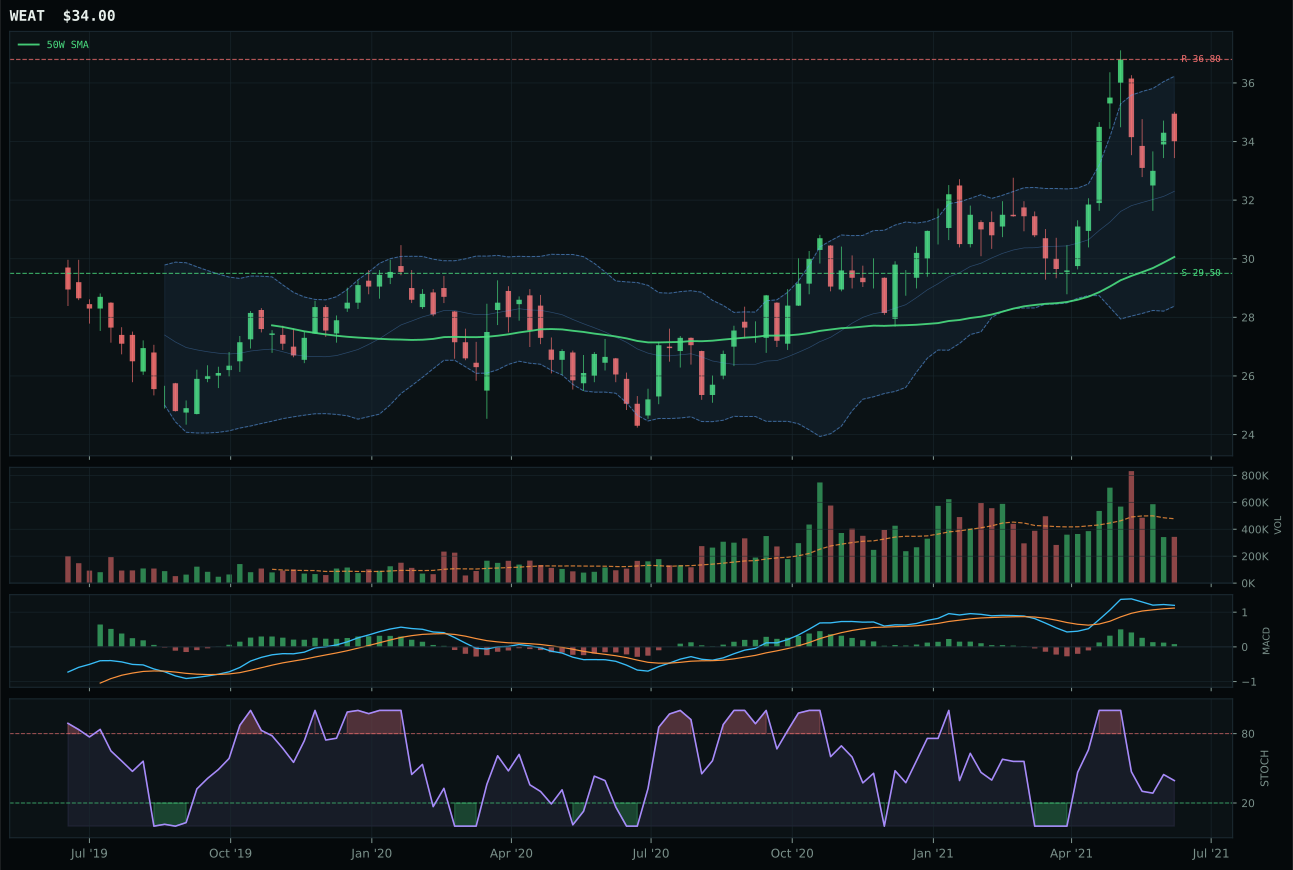
WEAT has a neutral structure profile with 2.7% 13-week relative strength versus SPY.
A failed hold above support would weaken the setup.
Actionable but governed by invalidation levels.
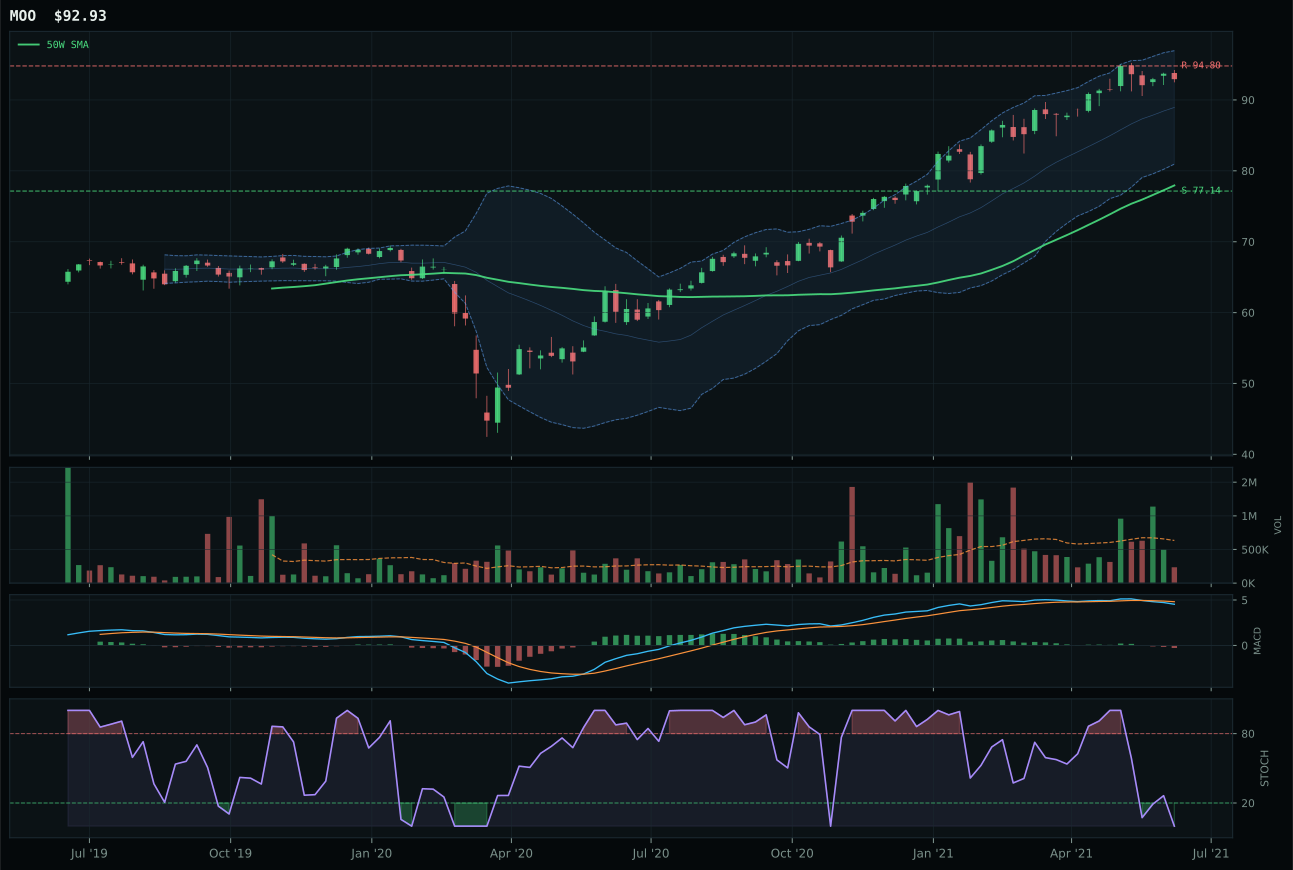
MOO has a vertical extension profile with -2.8% 13-week relative strength versus SPY.
A failed hold above support would weaken the setup.
Actionable but governed by invalidation levels.
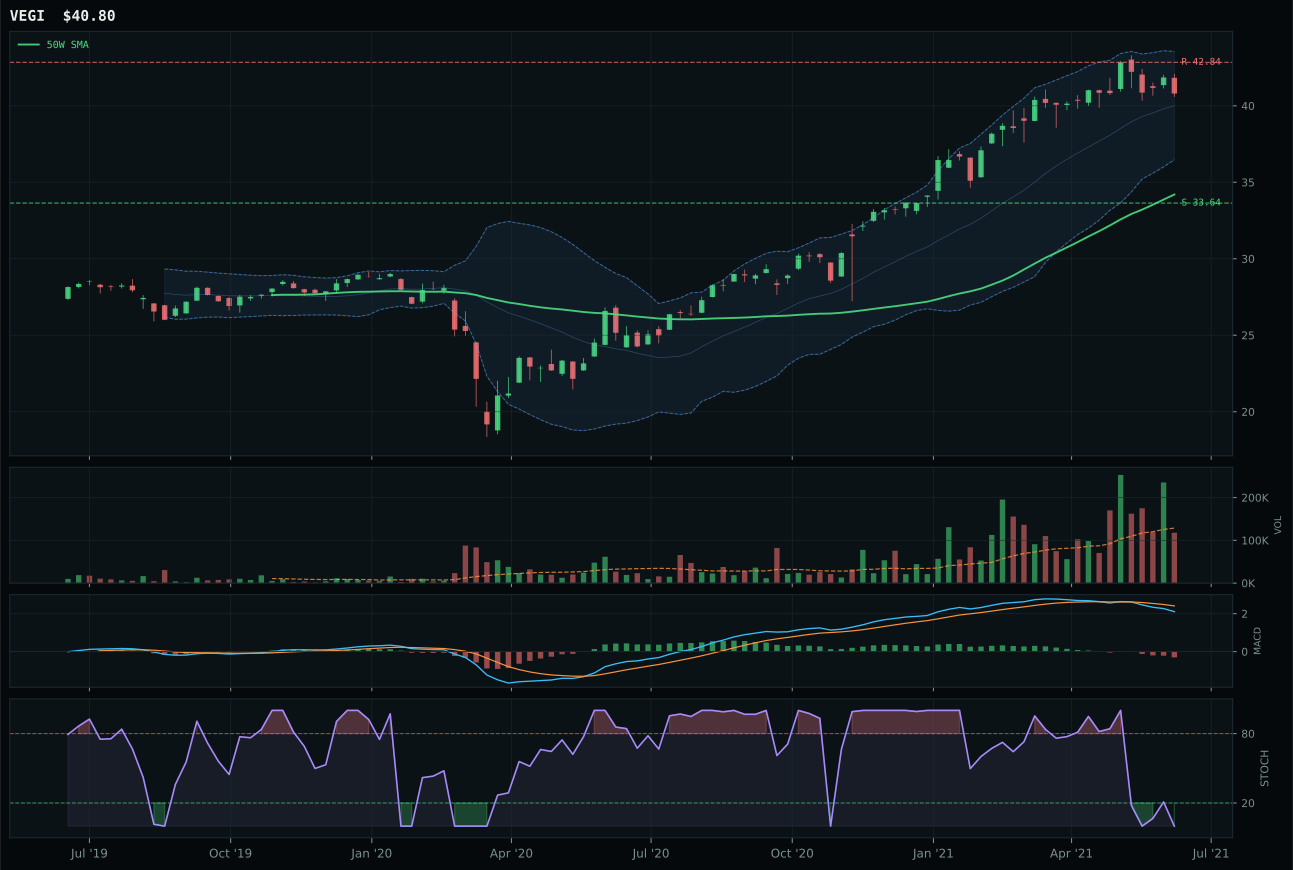
VEGI has a vertical extension profile with -6.6% 13-week relative strength versus SPY.
A failed hold above support would weaken the setup.
Tracked, but not top-2 eligible because: .
MOO wins the agriculture category in name only—it receives 0% allocation because the entire category is shut out this week due to its 30.8 final score, ranking 9th or 10th in the allocation queue. MOO's victory over WEAT is entirely technical: it owns the cleaner structure at 73.9/100 versus WEAT's 68.0/100, even though WEAT dominates on trend (90 vs 78), momentum (73 vs 29), and especially relative strength (2.7% vs -2.8%). The problem is terminal: MOO's MACD is bearish and weakening, stochastic RSI is oversold at 0.00, and the 4W return is negative at -0.7%, all signaling momentum exhaustion. WEAT's bullish but flattening MACD and rising mid-zone stochastic offer hope for continuation, yet both setups are 19–20% extended from the 50W with thin volume confirmation (0.37x for MOO, 0.76x for WEAT)—neither can sustain allocation when risk asymmetry is this severe.
Agriculture earns 0% allocation this week, ranking outside the funded categories, because its 30.8 score and weak technical foundation cannot compete with stronger setups elsewhere in the portfolio. Real asset sponsorship is active (+8) and commodity breadth is positive (+5), which would normally support the category, yet disinflation pressure is working hard against it (-8), and the macro fit of only 55.0/100 leaves no room for extended valuations. The core issue is execution: both MOO and WEAT are 19–20% extended above their 50W moving averages with volume participation collapsing, creating a setup that offers only downside risk with minimal upside cushion. For agriculture to re-enter allocation, it would need a 15–25% pullback that rebuilds support at or near the 50W, combined with a shift in disinflation fears (either easing them or confirming real deflation in food costs), which would refresh the entire category's macro narrative.