
2021-06-04
Informational purposes only. The content in this report, including allocations, analysis, and commentary, is provided solely for informational and educational purposes. It does not constitute financial advice, investment advice, trading advice, or any other type of advice. Past performance does not guarantee future results. Always conduct your own research and consult a qualified financial professional before making investment decisions.
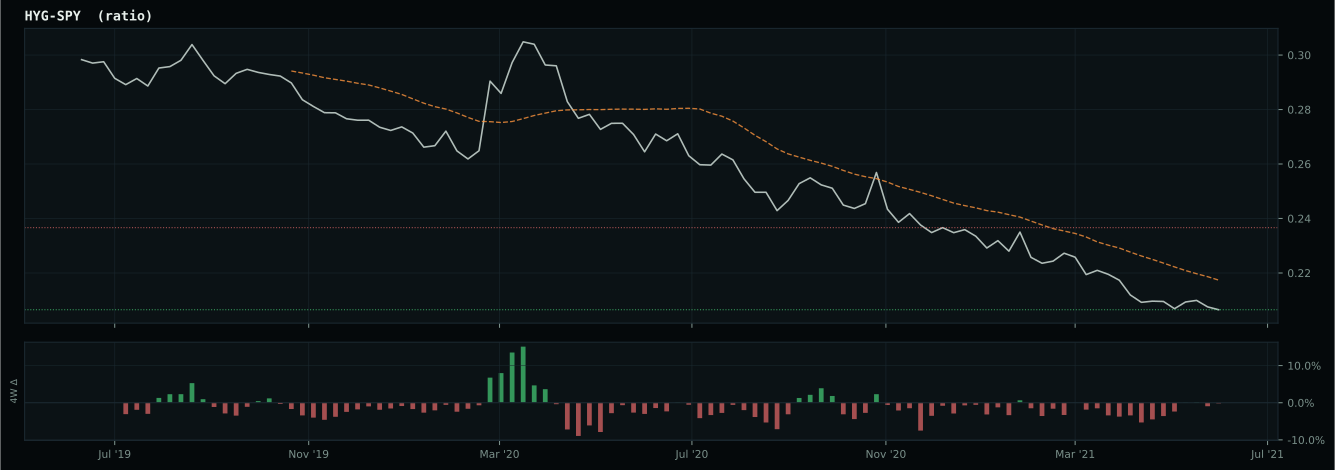
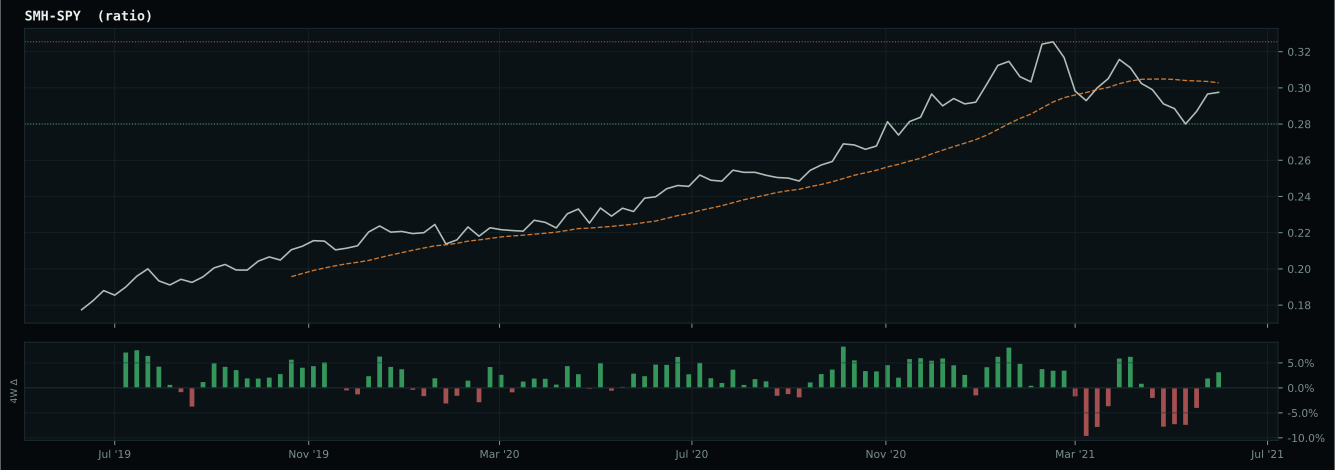
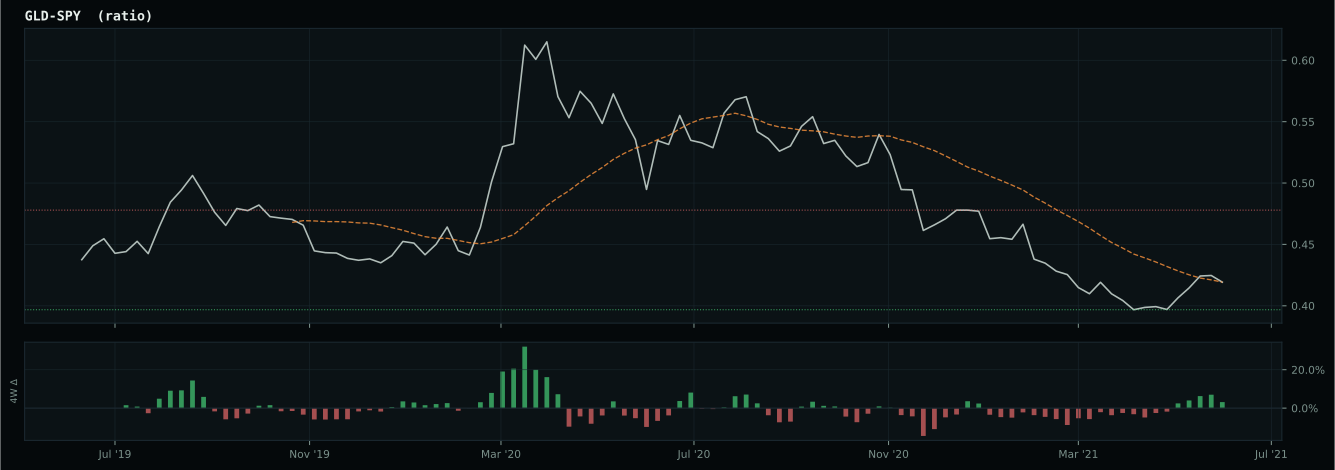
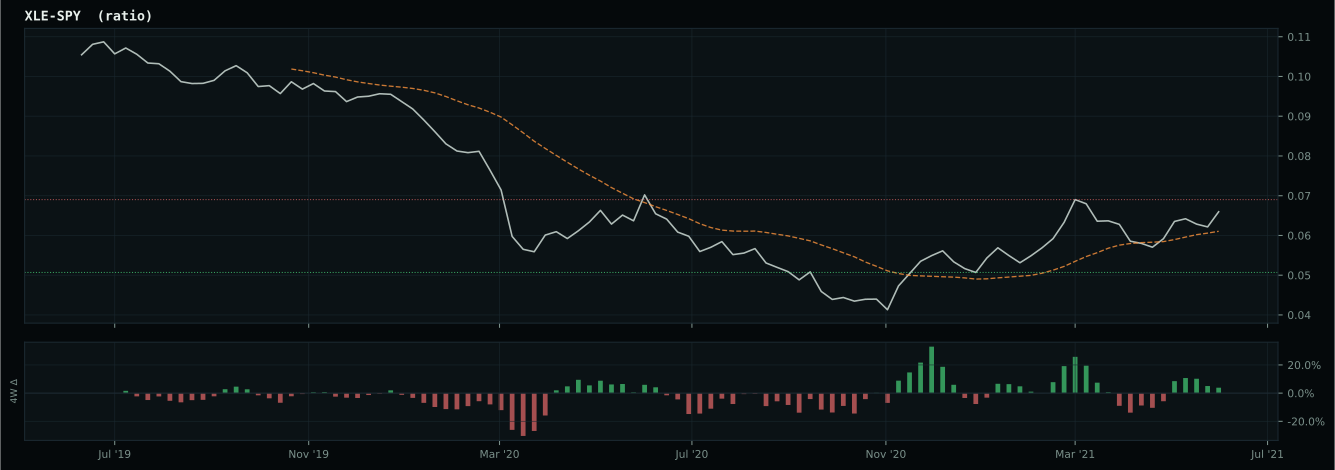
AltSeason was blocked by macro risk gating: The macro engine classifies the structural regime as Goldilocks with a tactical overlay of Transition / Mixed. Growth score is 50.0, inflation pressure is 43.1, liquidity is 62.0, credit stress is 63.7, and macro risk is 50.5. Cash is not required because crisis macro risk is inactive and bear-defense structure has 1/5 required checks. The active Defensive trigger is none and the Defensive cause is none.
Weekly Allocation
| Ticker | Category | Weight | Role |
|---|---|---|---|
| FBTC | 50% | Overlay | |
| GLD | Precious Metals | 10% | Top-2 (10%) |
| IGV | Technology | 10% | Top-2 (10%) |
| ILF | Emerging Markets | 5% | Tier-2 (5%) |
| URA | Nuclear Energy | 5% | Tier-2 (5%) |
| COPX | Industrial Metals | 5% | Tier-2 (5%) |
| XLU | Utilities & Infrastructure | 5% | Tier-2 (5%) |
| SMH | AI | 5% | Tier-2 (5%) |
| ITA | Defense & Aerospace | 5% | Tier-2 (5%) |
Trade Instructions — Monday Open
Sell the tranche from 2021-05-07 (completing its 4-week hold). Buy the new tranche. Instructions show net portfolio changes — same-asset positions cancel, weight changes show the delta.
| Action | Ticker | Instruction |
|---|---|---|
| SELL | FSOL | Sell entire FSOL position (12.50% of portfolio) |
| SELL | COPX | Sell 17% of COPX position (reduce 7.50% → 6.25%) |
| SELL | WEAT | Sell 67% of WEAT position (reduce 3.75% → 1.25%) |
| SELL | URNM | Sell 25% of URNM position (reduce 5.00% → 3.75%) |
| SELL | XLE | Sell 33% of XLE position (reduce 3.75% → 2.50%) |
| SELL | GDX | Sell entire GDX position (1.25% of portfolio) |
| BUY | FBTC | Buy FBTC — 62.50% of freed cash (adds 12.50% to portfolio) |
| BUY | GLD | Buy GLD — 12.50% of freed cash (adds 2.50% to portfolio) |
| BUY | IGV | Buy IGV — 12.50% of freed cash (adds 2.50% to portfolio) |
| BUY | URA | Buy URA — 6.25% of freed cash (adds 1.25% to portfolio) |
| BUY | SMH | Buy SMH — 6.25% of freed cash (adds 1.25% to portfolio) |
Current Portfolio After Trade
Combined holdings across all 4 active tranches. Each tranche is 25% of the portfolio.
| Ticker | % of Portfolio | Weight Bar |
|---|---|---|
| FBTC | 50.00% | |
| GLD | 8.75% | |
| COPX | 6.25% | |
| ILF | 5.00% | |
| URNM | 3.75% | |
| ITA | 3.75% | |
| FCG | 3.75% | |
| XLE | 2.50% | |
| XLU | 2.50% | |
| PAVE | 2.50% | |
| MOO | 2.50% | |
| IGV | 2.50% | |
| WEAT | 1.25% | |
| IGF | 1.25% | |
| CIBR | 1.25% | |
| URA | 1.25% | |
| SMH | 1.25% |
Macro Regime — Goldilocks
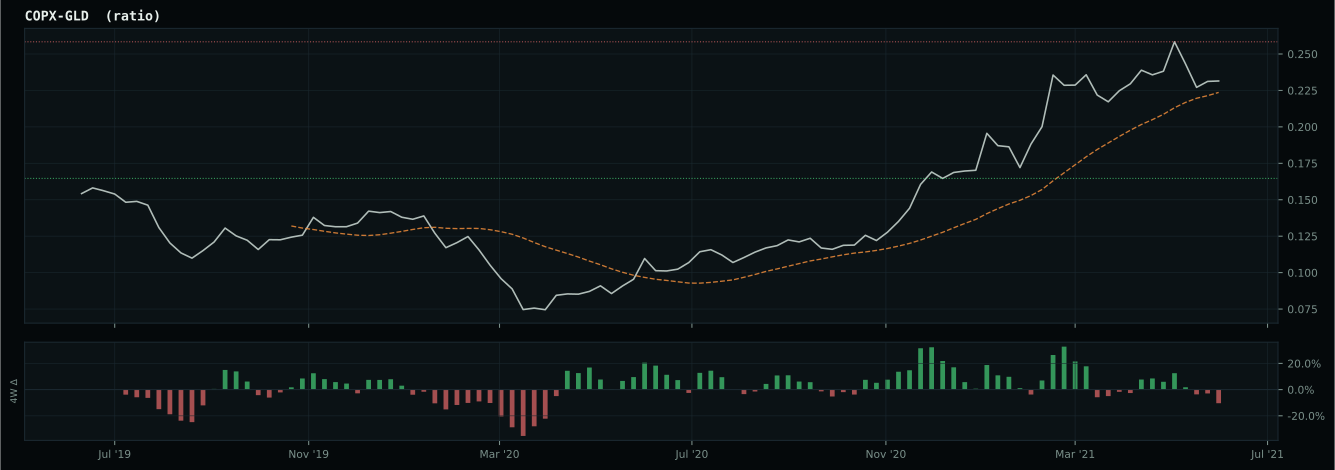
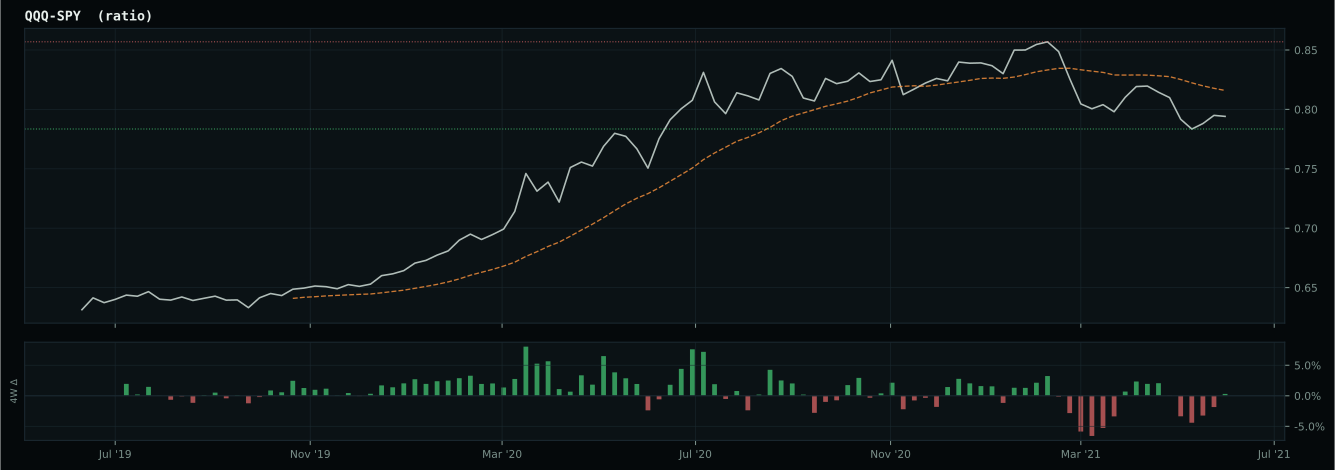
Macro Evidence Charts
Market-implied signals behind the macro regime scores. Each ratio compares two assets; the direction and slope of the ratio is what the macro engine reads.
Crypto Regime — TrendBTC
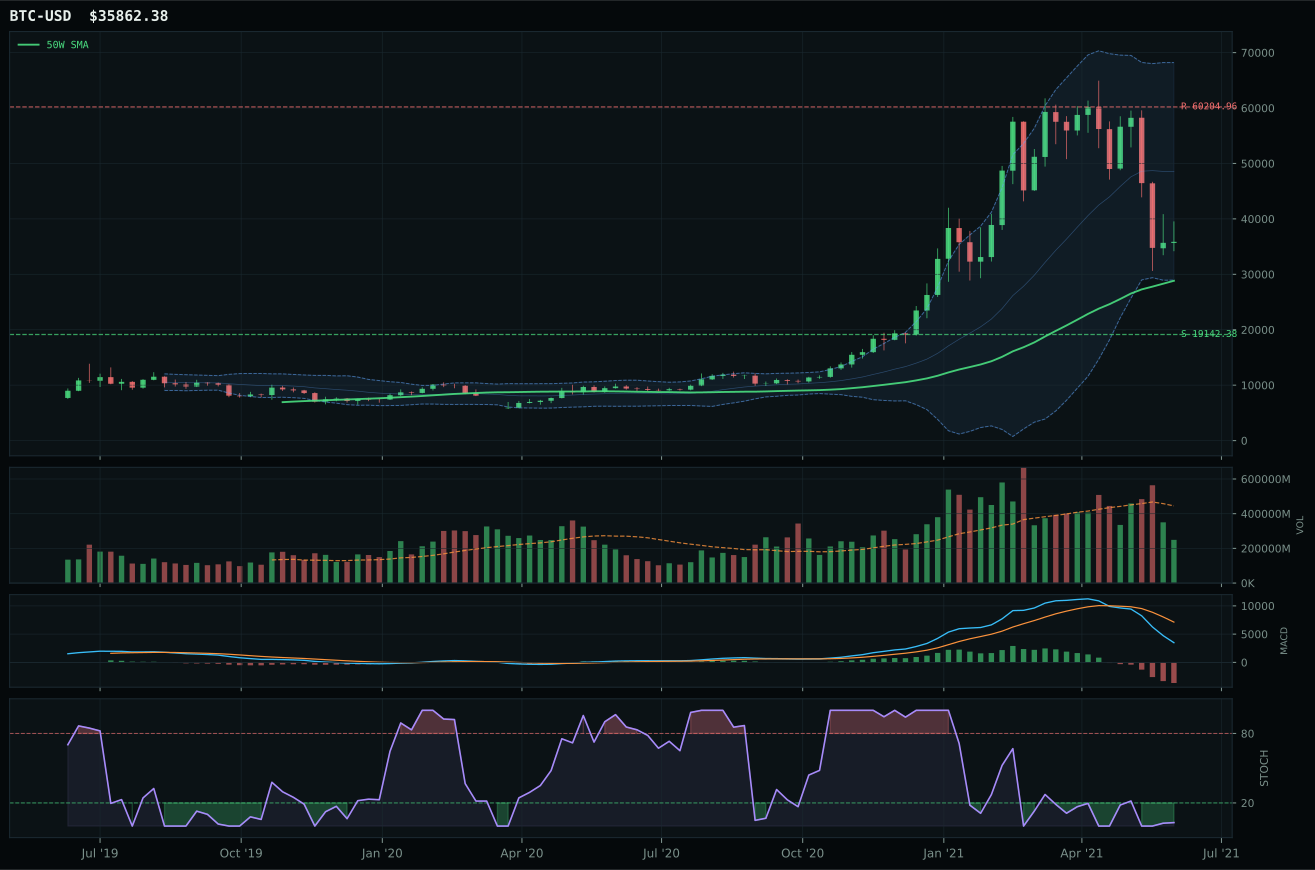
ValueBTC not armed: BTC has not made the first post-breakdown touch of the 200W buy zone after losing the 50W
TrendBTC confirmed: 2 consecutive closes above rising/flat 50W SMA
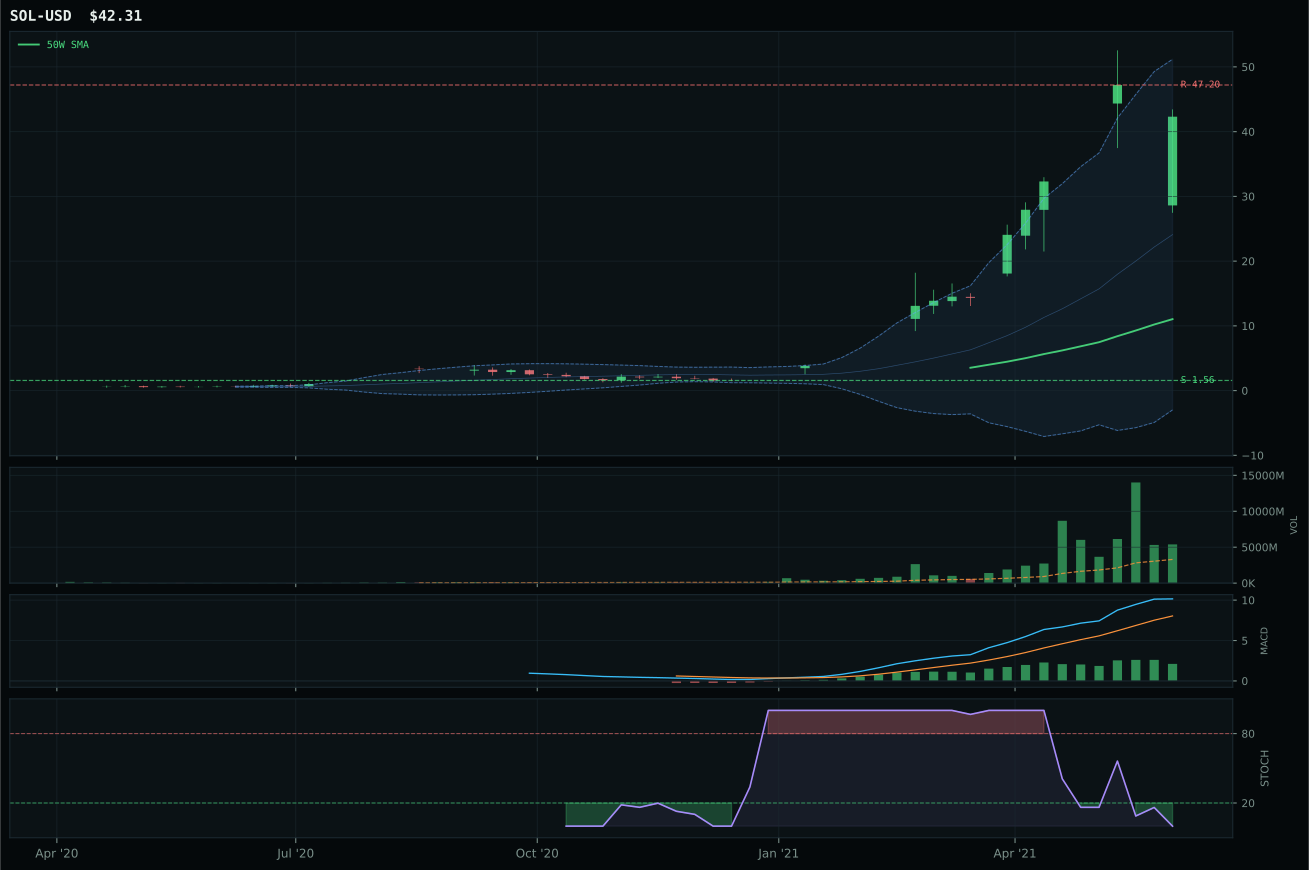
all available AltSeason conditions pass; missing optional confirmations skipped Macro gate failed, so AltSeason was downgraded.
Category Rankings
| Rank | Category | Winner | Score | Alloc | 4W Ret | Peers (4W) |
|---|---|---|---|---|---|---|
| 1 | Precious Metals | GLD | 62.0 | 20% | -4.35% | GDX -9.2% · SLV -4.5% |
| 2 | Technology | IGV | 55.9 | 20% | +9.91% | CIBR +7.0% · XLK +7.3% |
| 3 | Emerging Markets | ILF | 54.5 | 10% | -4.01% | INDA -2.6% · IEMG -2.6% |
| 4 | Nuclear Energy | URA | 54.0 | 10% | -9.32% | URNM -10.0% · NLR -3.8% |
| 5 | Industrial Metals | COPX | 53.6 | 10% | -8.46% | REMX -0.6% · PICK -5.6% |
| 6 | Utilities & Infrastructure | XLU | 44.2 | 10% | -2.20% | IGF -2.4% · PAVE -3.4% |
| 7 | AI | SMH | 43.5 | 10% | +4.02% | BOTZ +0.0% · AIQ +5.2% |
| 8 | Defense & Aerospace | ITA | 41.0 | 10% | -2.33% | ROKT +0.5% · XAR +0.2% |
| 9 | Agriculture & Livestock | MOO | 38.6 | 0% | -1.83% | WEAT -6.3% · VEGI -4.5% |
| 10 | Traditional Energy | FCG | 32.8 | 0% | +3.43% | XOP +0.3% · XLE -2.2% |
Precious Metals — GLD
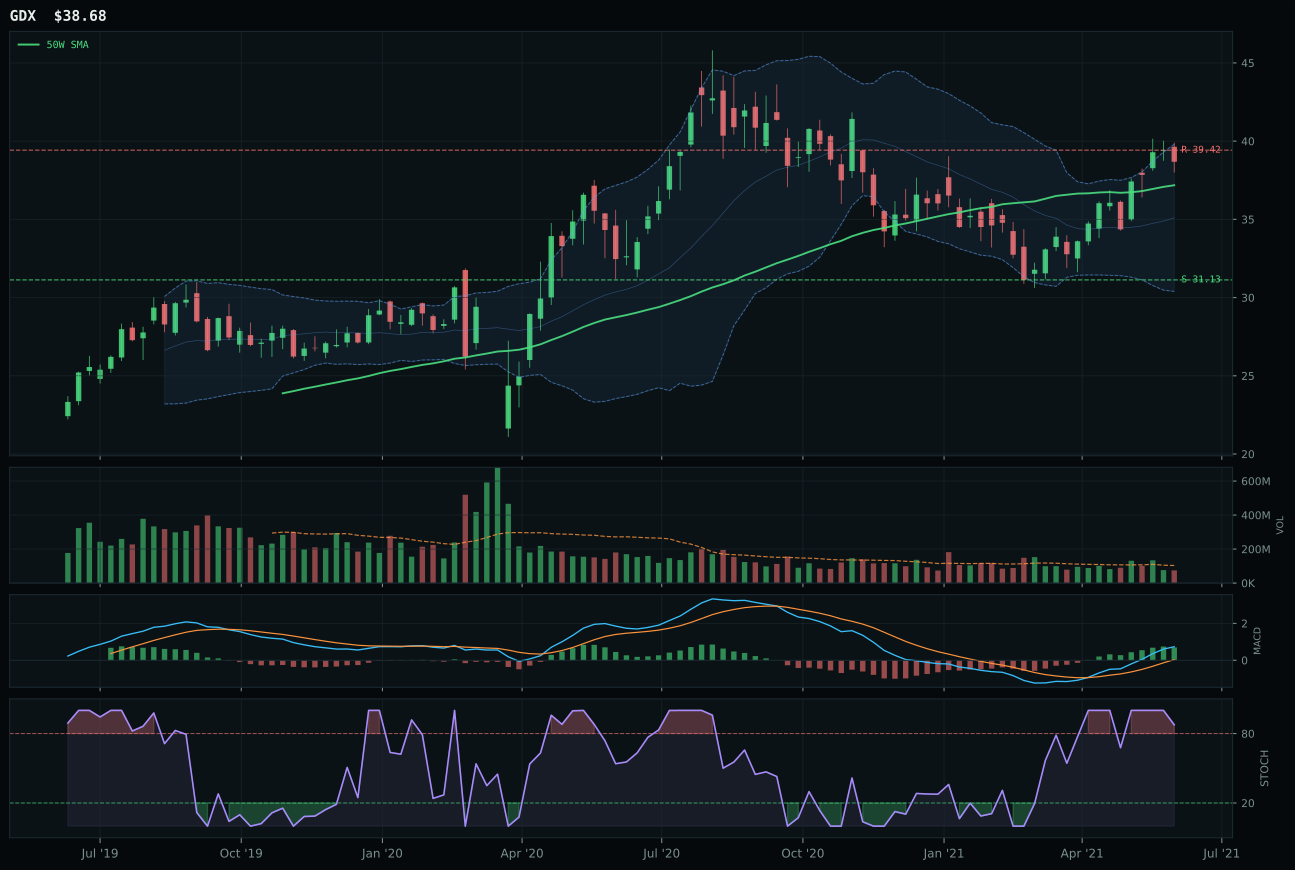
GDX has a neutral structure profile with 11.6% 13-week relative strength versus SPY.
A failed hold above support would weaken the setup.
Actionable but governed by invalidation levels.
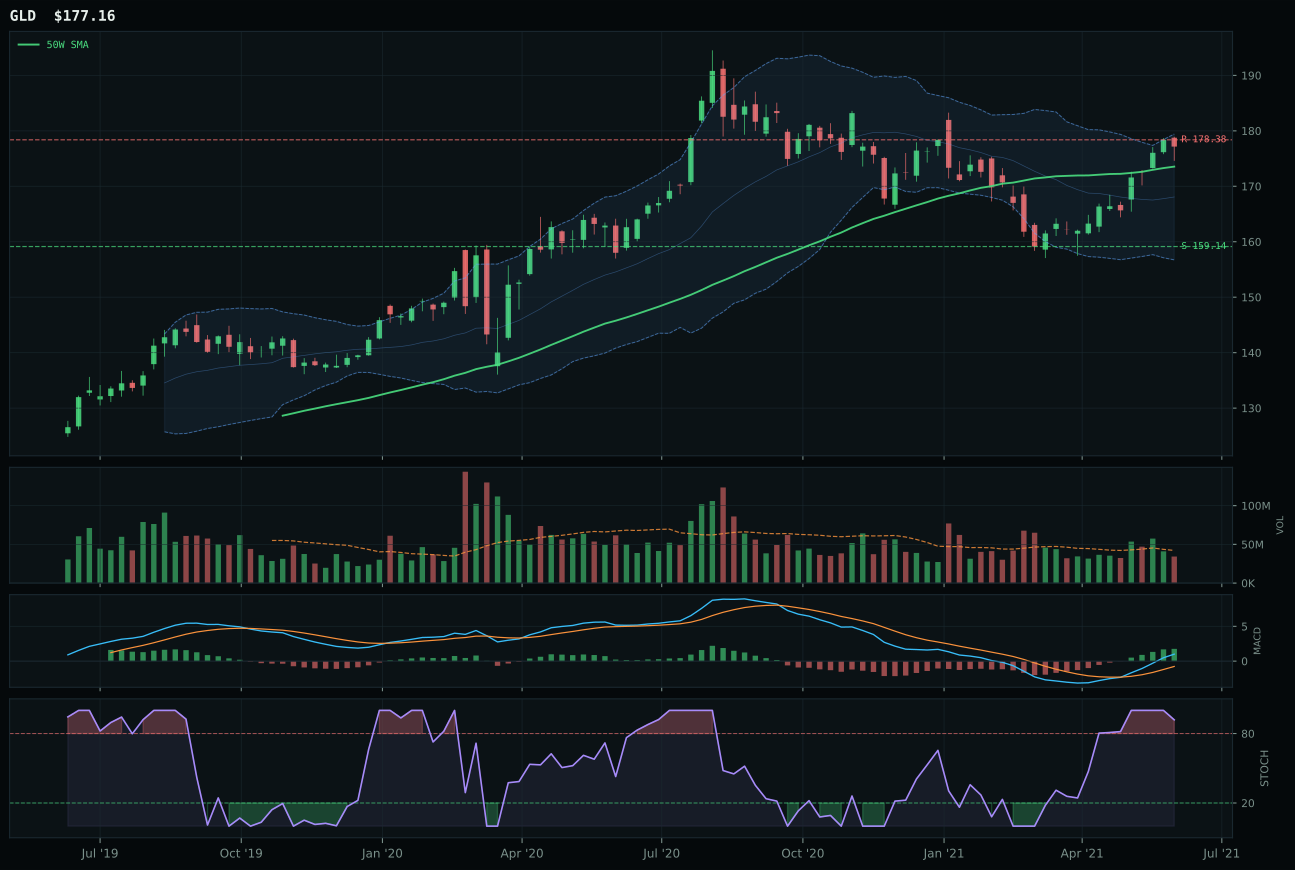
GLD has a compression near 50W profile with 1.2% 13-week relative strength versus SPY.
A failed hold above support would weaken the setup.
Actionable but governed by invalidation levels.
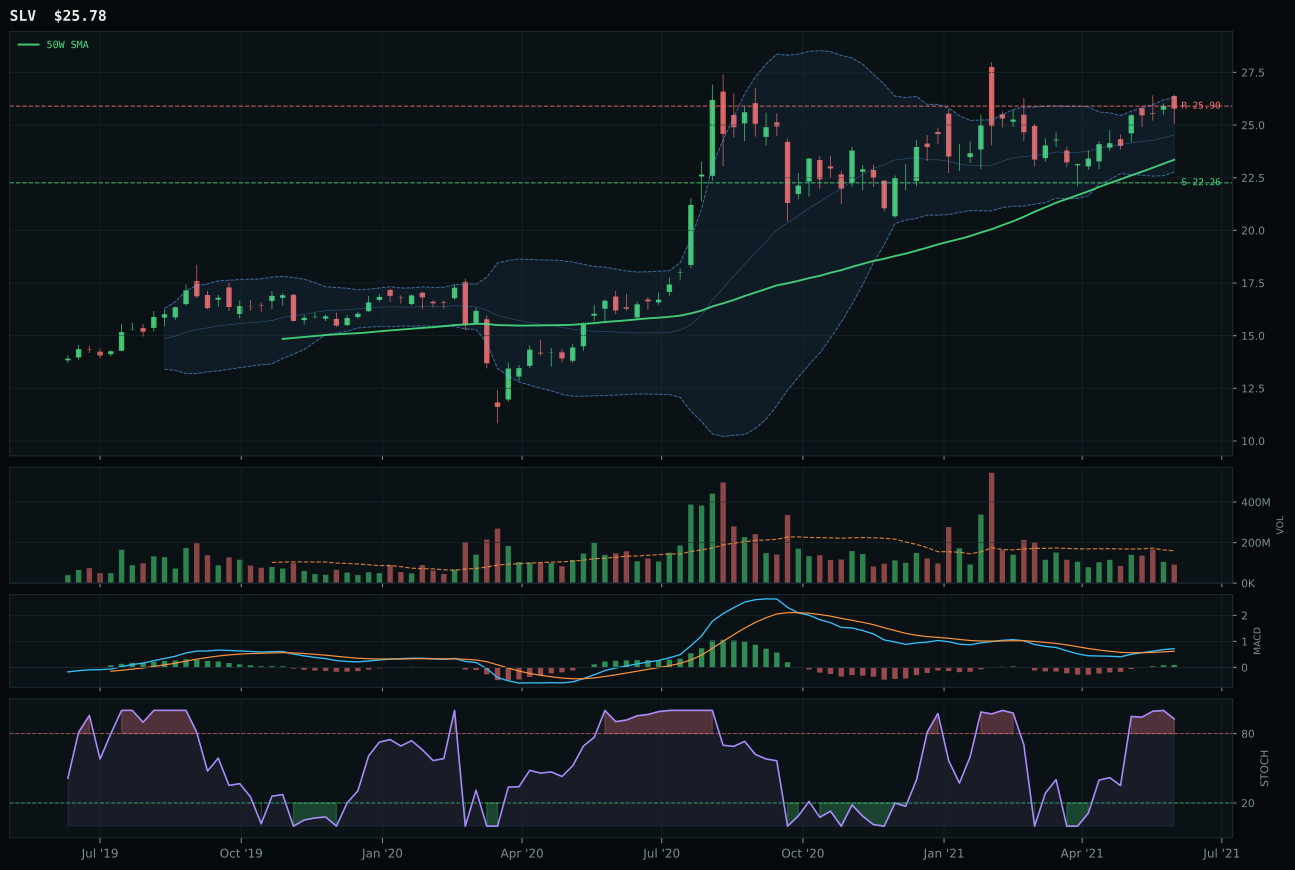
SLV has a neutral structure profile with 0.2% 13-week relative strength versus SPY.
A failed hold above support would weaken the setup.
Actionable but governed by invalidation levels.
GLD wins Precious Metals by a narrow 1.0-point margin over GDX in the category score, but the victory reveals a fundamental technical difference: GLD is compressing near the 50W with 2.1% extension and MACD bullish and improving, creating expansion potential if buyers defend the level, while GDX exploded 55.2% above the 50W (wait—that's URA's distance; GDX shows 11.6% RS but sits in neutral structure with thin participation). GLD's timing score of 89.0/100 crushes GDX's 79.0/100 because proximity to the 50W combined with MACD improving generates entry conviction without overbought risk. GLD's 100.0/100 trend score ties GDX, but GLD's stochastic RSI is overbought rolling over (0.92) versus GDX's same setup, meaning GLD has begun the orderly decline that precedes reversal while maintaining upside potential to 178.38 resistance. Volume-price confirmation is slightly better for GLD (61.3 vs 75 for GDX), which seems backward until you note that GLD's neutral volume (0.81x) provides lighter sponsorship than GDX's thin participation—paradoxically, GLD's lower volume score reflects better quality.
Precious Metals earned top-2 allocation at 10% because its 62.0 final category score ranked second-highest among all 10 categories this week. The 50% overlay halves this from a base tier-1 slot, but 10% remains meaningful and reflects justified conviction in gold's macro positioning. Disinflation pressure is the primary tailwind at +6, which amplifies gold's role as a monetary hedge in a disinflationary regime. The reasoned ETF proof order (GDX 71.2, GLD 64.9, SLV 59.9) shows that while GDX leads technically, GLD's representative status reflects superior timing and setup cleanliness—exactly the proof order consistency needed to justify category-level scores. To hold this allocation against potential challenger categories, Precious Metals would need to maintain MACD bullish posture and defend the 159.14 support level. GLD's compression near the 50W is the structural strength here: it is not an extension play but a controlled reaccumulation that can run to resistance without immediately rolling over. This 10% represents the category's role as the portfolio's disinflation insurance and credit stress hedge—tactical but not defensive.
Technology — IGV
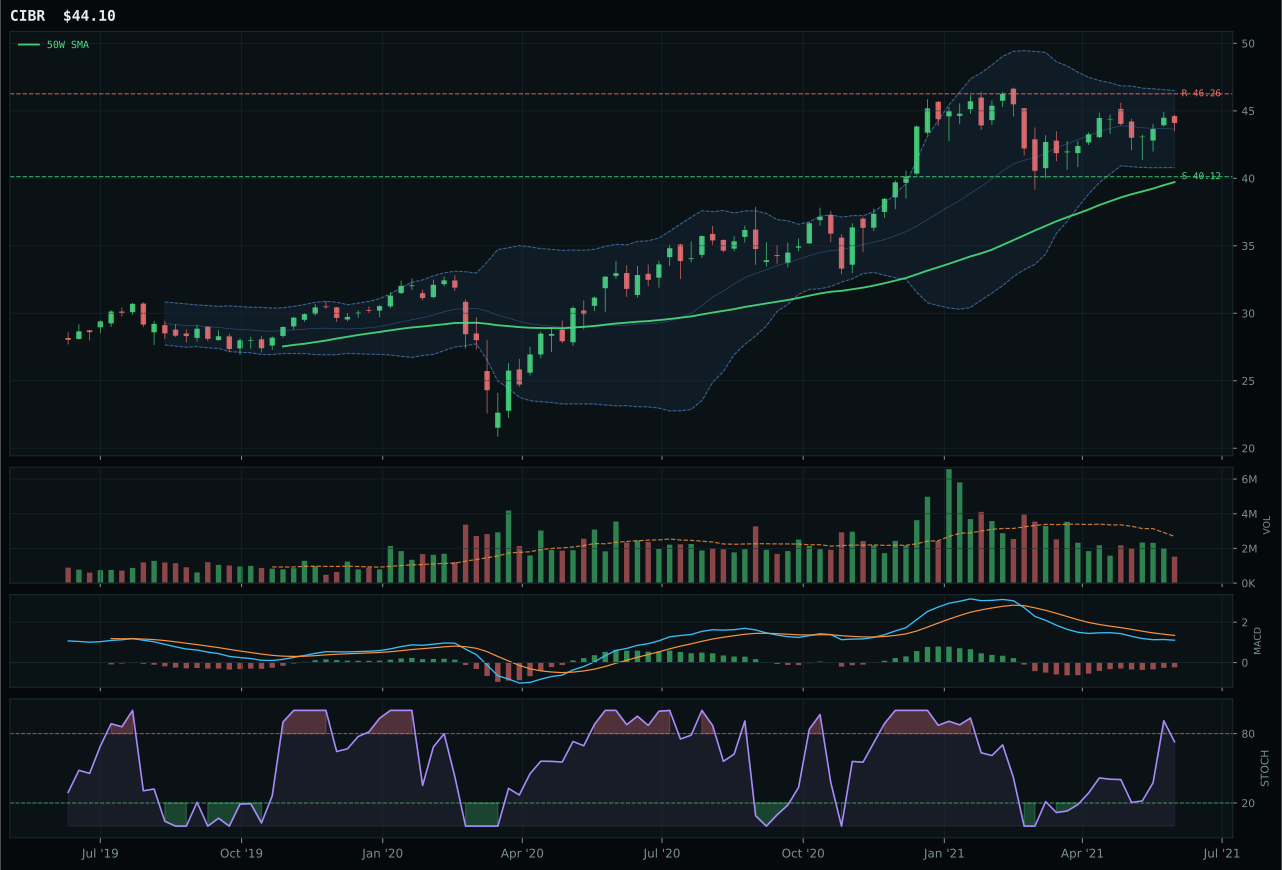
CIBR has a neutral structure profile with -1.4% 13-week relative strength versus SPY.
A failed hold above support would weaken the setup.
Actionable but governed by invalidation levels.
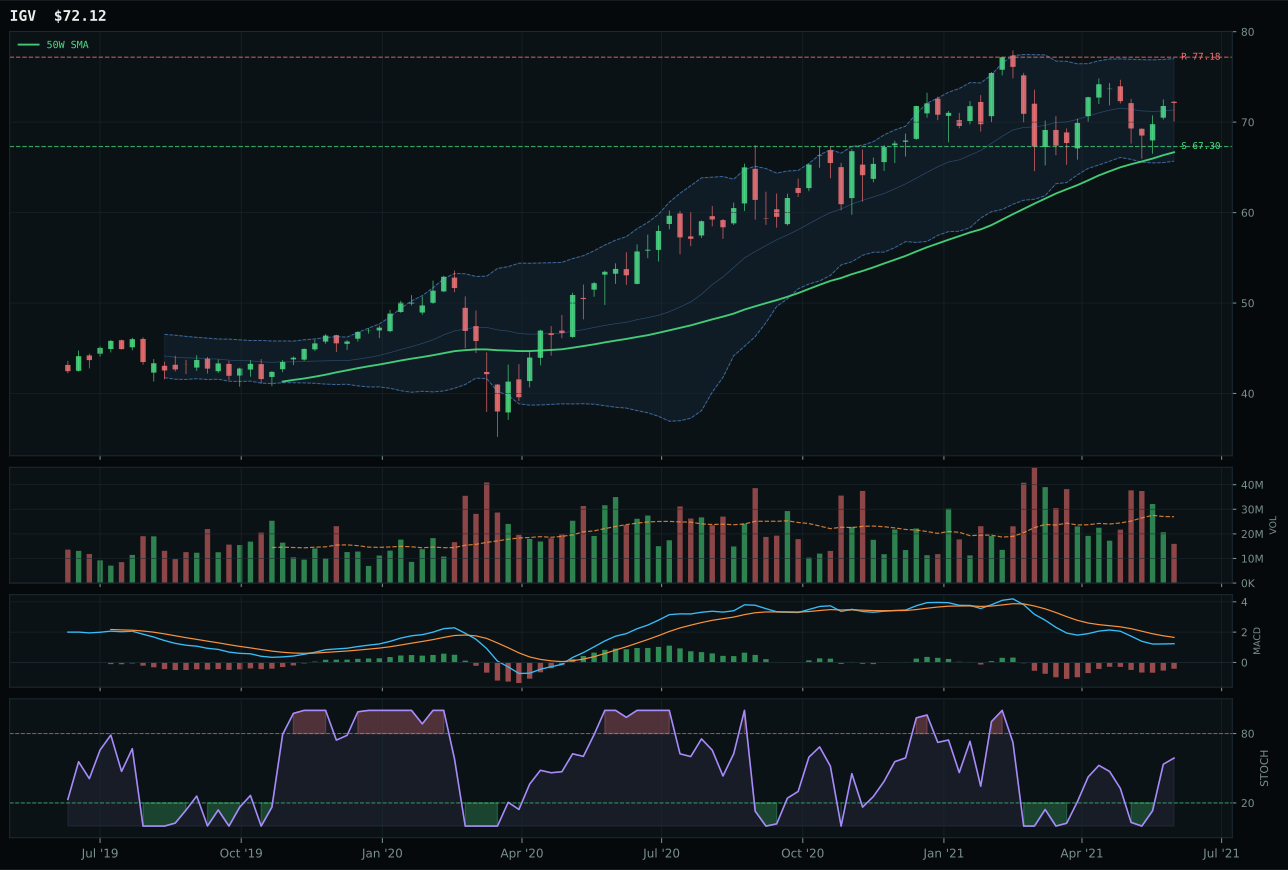
IGV has a neutral structure profile with -3.0% 13-week relative strength versus SPY.
A failed hold above support would weaken the setup.
Actionable but governed by invalidation levels.
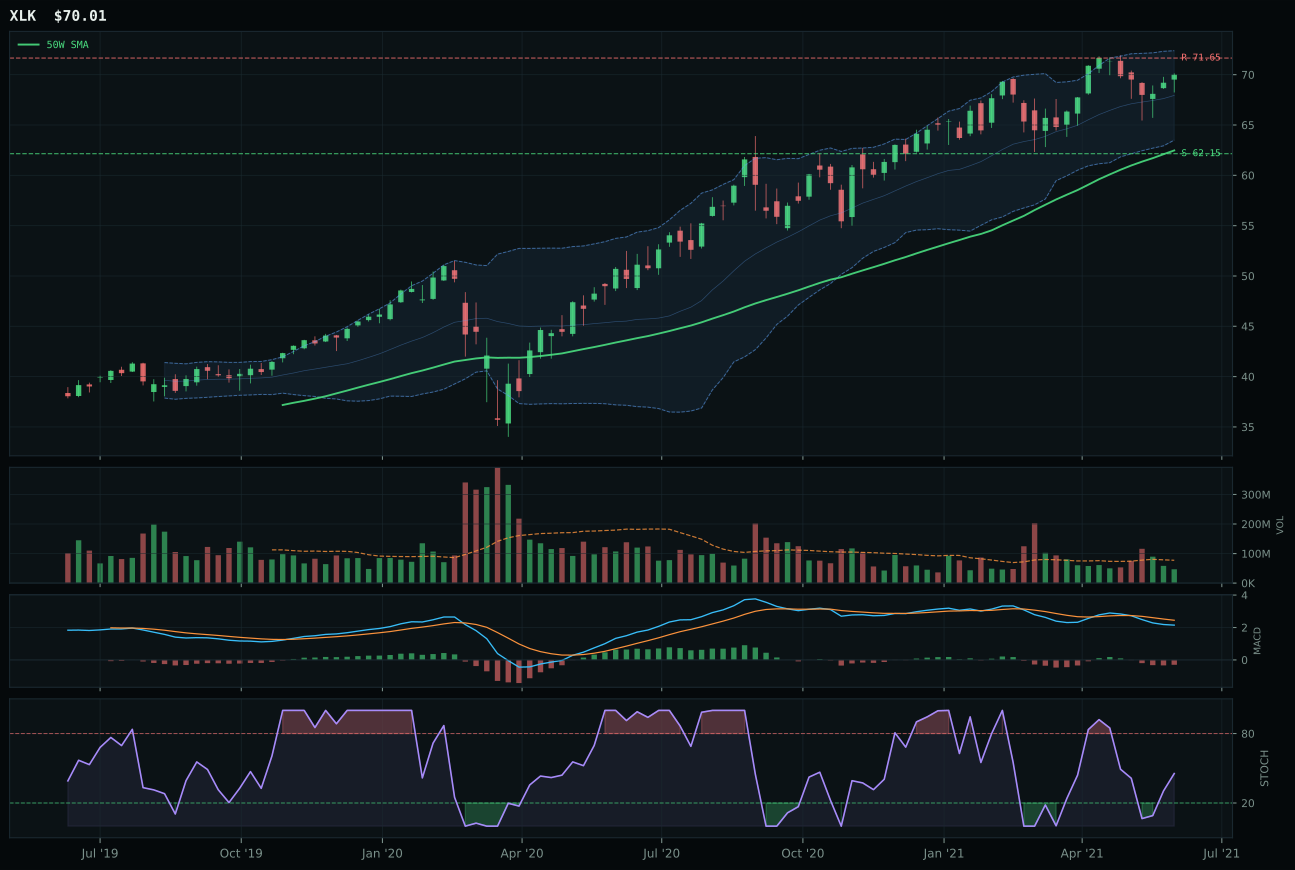
XLK has a neutral structure profile with -1.6% 13-week relative strength versus SPY.
A failed hold above support would weaken the setup.
Actionable but governed by invalidation levels.
IGV wins the Technology category by delivering superior risk-adjusted timing despite finishing just 0.3 points ahead of CIBR in the reasoned ETF proof order. The critical difference lies in risk/reward geometry: IGV's 61.5/100 risk score versus CIBR's 53.5/100 reflects tighter support-to-resistance spacing (7.2% downside versus 6.6% upside) that rewards disciplined entry. While CIBR posted a stronger 13W return of 8.7% versus IGV's 7.2%, and holds identical technical structure at 50W and 200W support, IGV's -3.0% relative strength versus SPY combined with neutral positioning near Fib 0.236 creates asymmetric payoff potential without the momentum confirmation risk that plagued higher performers. MACD is bearish but improving across both candidates, and volume is thin, but IGV's distribution of entry opportunity—compressed 8.2% from the 50W versus CIBR's identical distance—allows accumulation without fighting extended valuations. The setup is neither a clean breakout nor a coiled spring; it is a deliberate pause where trend strength (88.5/100) contradicts timing weakness, signaling that buyers are present but not desperate.
Technology earned the top-2 tier at 10% allocation because its 55.9 final category score ranked among the two highest eligible categories this week in a Goldilocks macro regime. The 50% crypto overlay halves all sleeve percentages from their base tier values, making this 10% slot a meaningful commitment in absolute terms. Disinflation pressure is active and pushes the category modestly upward, while credit stress drags it down by 7 points—a tension that keeps Technology from scoring higher despite its positive trend structure. What elevates this category is not macro tailwinds but technical proof: the 3/2/1 weighted basket (CIBR 64.9, IGV 57.6, XLK 47.7) demonstrates that the category's three-ETF universe contains both depth and leadership consensus. To move into the FBTC-dominated tier-1 allocation, Technology would need either a refresh in SPY-relative strength or a cleaner breakout structure that eliminates the 8.2% extension penalty. For now, 10% reflects justified conviction in a category that is neither momentum-driven nor macro-dependent, but rather anchored in execution quality.
Emerging Markets — ILF
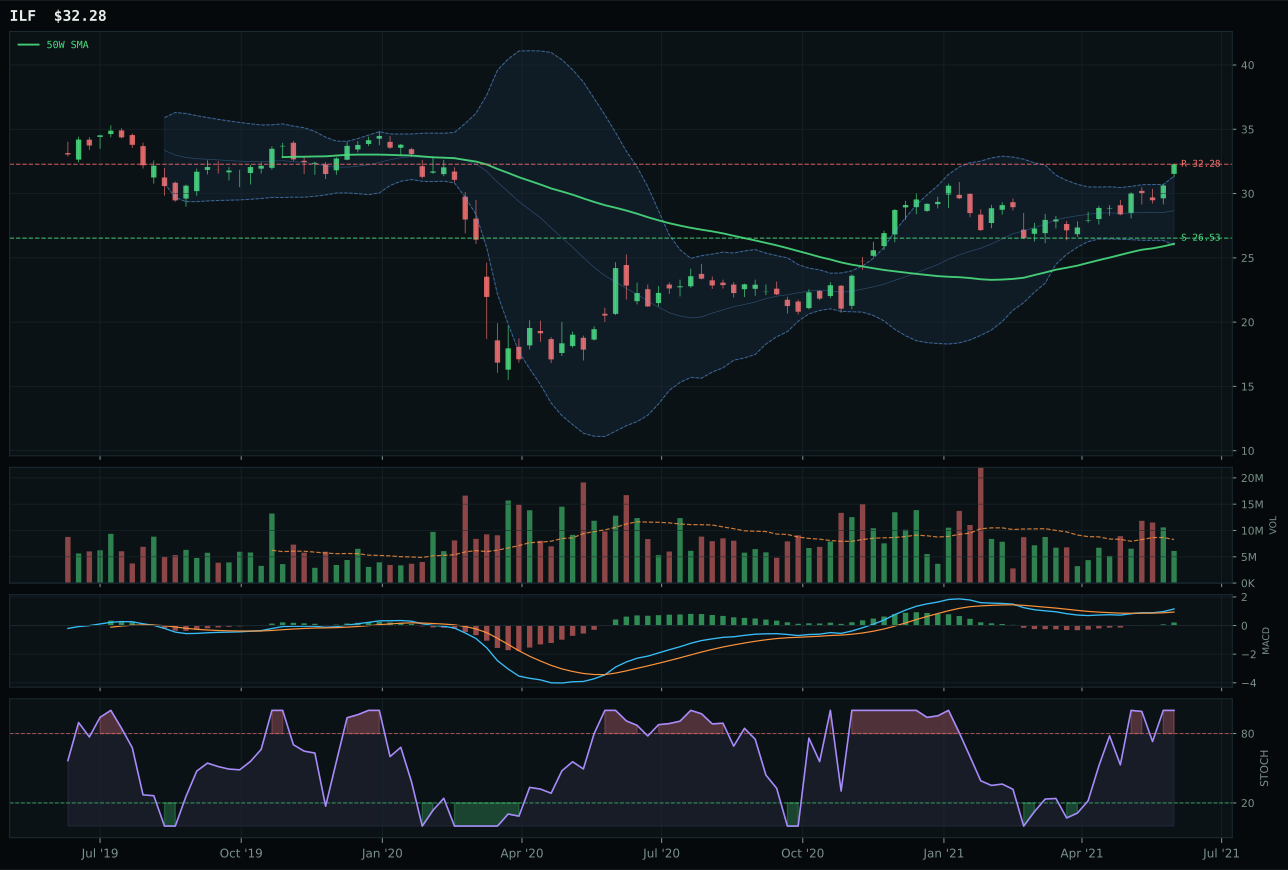
ILF has a vertical extension profile with 8.2% 13-week relative strength versus SPY.
A failed hold above support would weaken the setup.
Actionable but governed by invalidation levels.
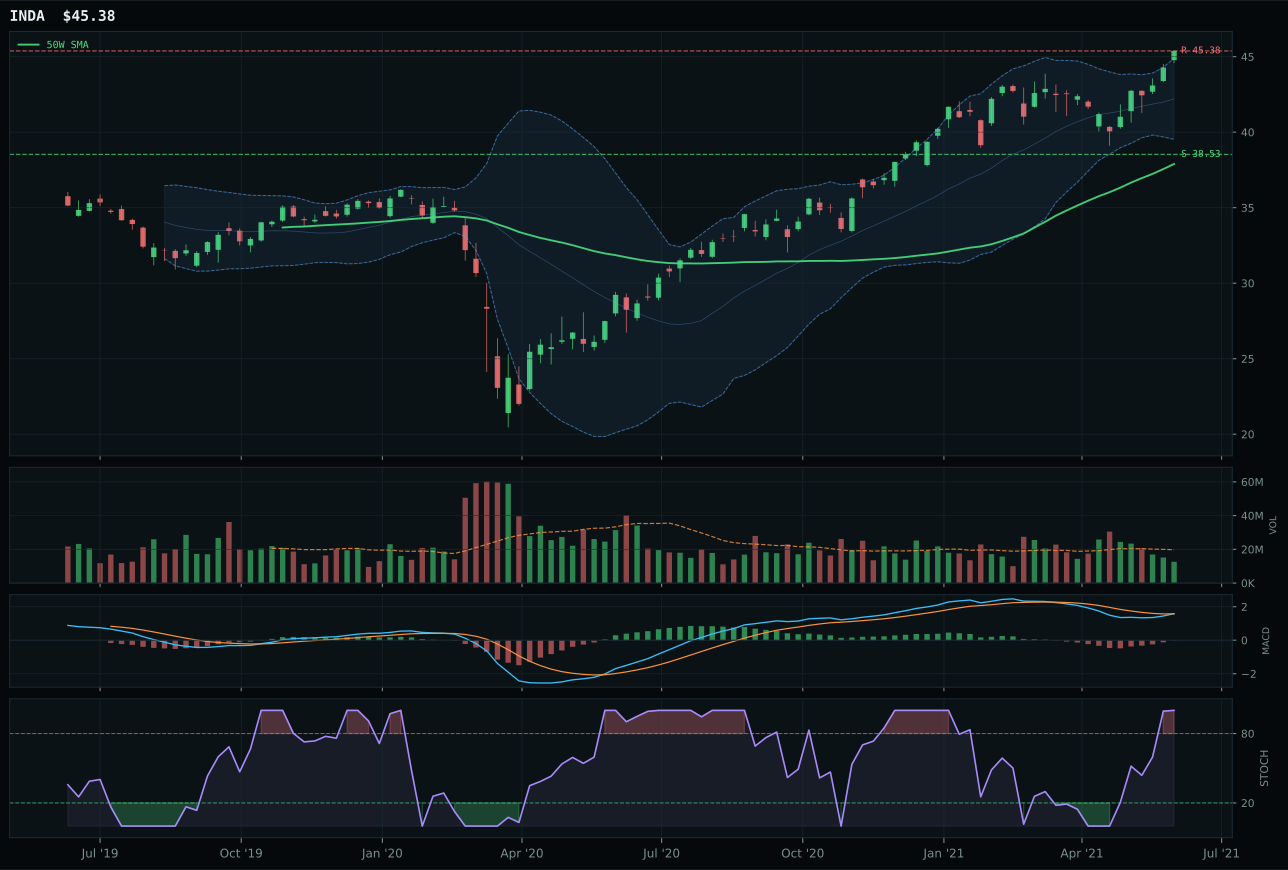
INDA has a vertical extension profile with -3.6% 13-week relative strength versus SPY.
A failed hold above support would weaken the setup.
Actionable but governed by invalidation levels.
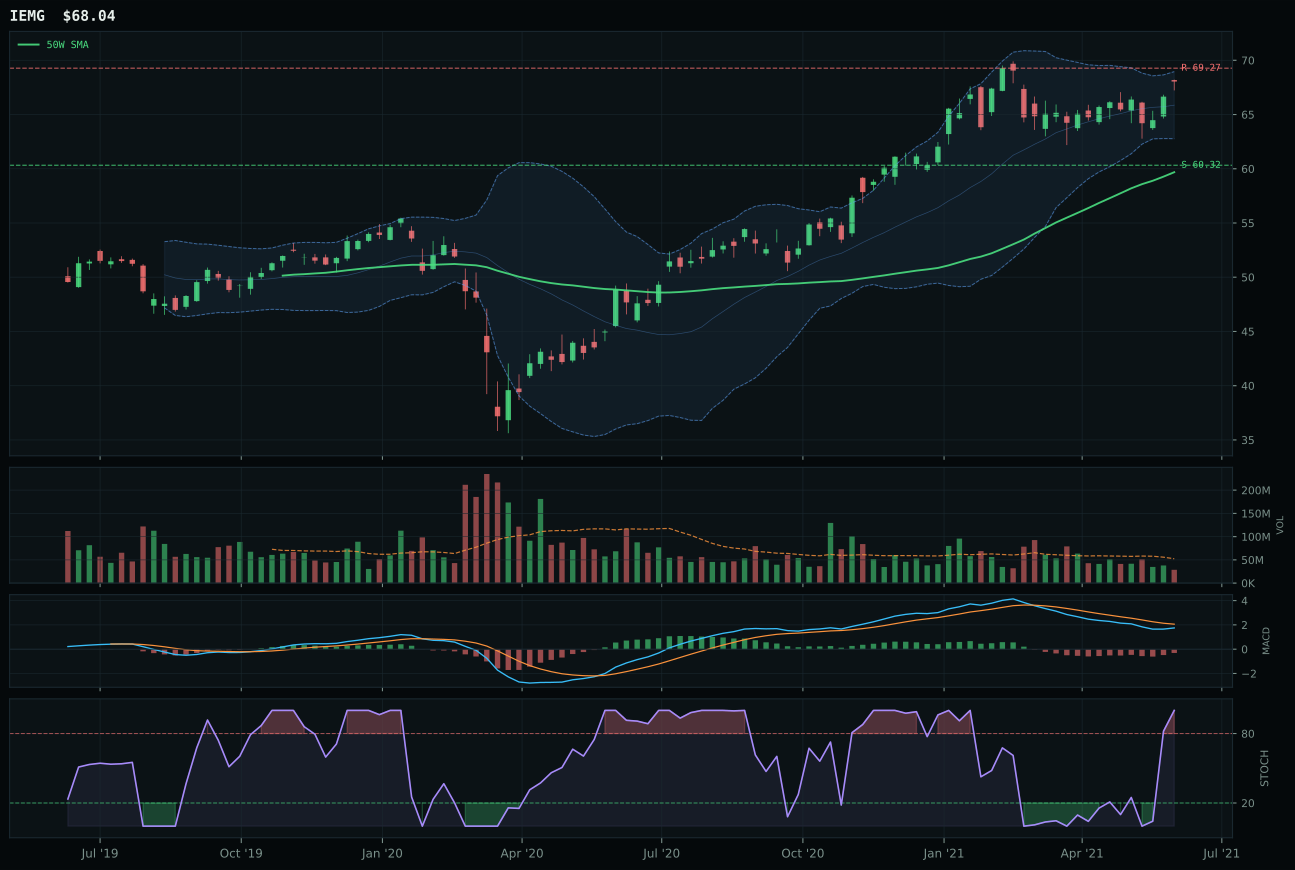
IEMG has a neutral structure profile with -5.2% 13-week relative strength versus SPY.
A failed hold above support would weaken the setup.
Actionable but governed by invalidation levels.
ILF wins Emerging Markets with a 7.1-point gap over INDA, capturing 11.8% category-relative strength versus INDA's zero—a significant edge that reflects Latin American commodity and value positioning outpacing India's quality-growth profile. ILF is extended 23.7% from the 50W with vertical extension, MACD bullish and improving, and stochastic overbought at 1.00, yet its structure is cleaner than INDA's (74.5 vs 70.5). Both post 100.0/100 momentum confirmation, but ILF's 18.3% 13W return with positive category relative strength beats INDA's 6.6% return. The reasoned ETF proof order (ILF 65.2, IEMG 57.6, INDA 53.7) shows ILF leading decisively, and the category score reflects that leadership. Volume-price confirmation is identical (68.4) for both, so the decision rests purely on relative strength and extension penalty; ILF's stronger commodity and metals positioning (benefiting from scarcity macro) outweighs its slight extension disadvantage. INDA's neutral macro fit (no category-specific descriptor profile) versus ILF's +8 commodity breadth, +5 metals scarcity, and +6 real asset sponsorship explains the gap.
Emerging Markets earned 5% allocation as a tier-2 category on a 54.5 final score, reflecting strong macro support from EM liquidity at +14 and Goldilocks regime at +8, partially offset by credit stress at -10. The 62.0/100 category-level macro fit is among the strongest in the portfolio, yet technical evidence of only 66.8/100 at the representative level keeps it out of tier-1. The reasoned ETF proof order (ILF 65.2, IEMG 57.6, INDA 53.7) shows a meaningful technical consensus around ILF's Latin American commodity positioning. To elevate this to tier-1, Emerging Markets would need to maintain MACD bullish posture and defend support at 26.53 without fresh breakdowns. For now, the 5% allocation reflects the macro regime's support for EM liquidity and commodity beneficiaries in a Goldilocks environment, hedged by ILF's extension penalty. This is a macro-driven slot more than a technical conviction; if credit stress were to reverse (moving from -10 to neutral or positive), EM would likely rise to tier-1.
Nuclear Energy — URA
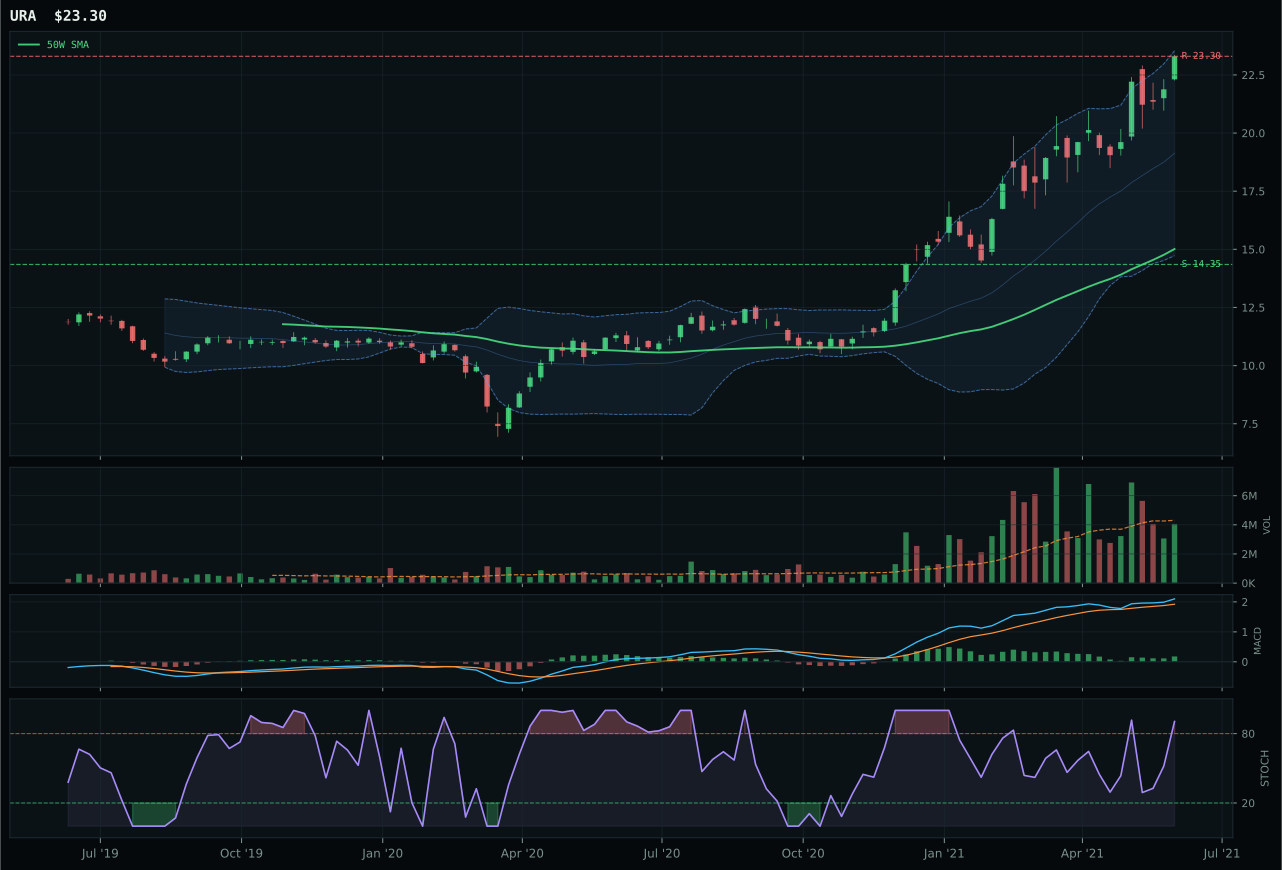
URA has a vertical extension profile with 20.2% 13-week relative strength versus SPY.
A failed hold above support would weaken the setup.
Actionable but governed by invalidation levels.
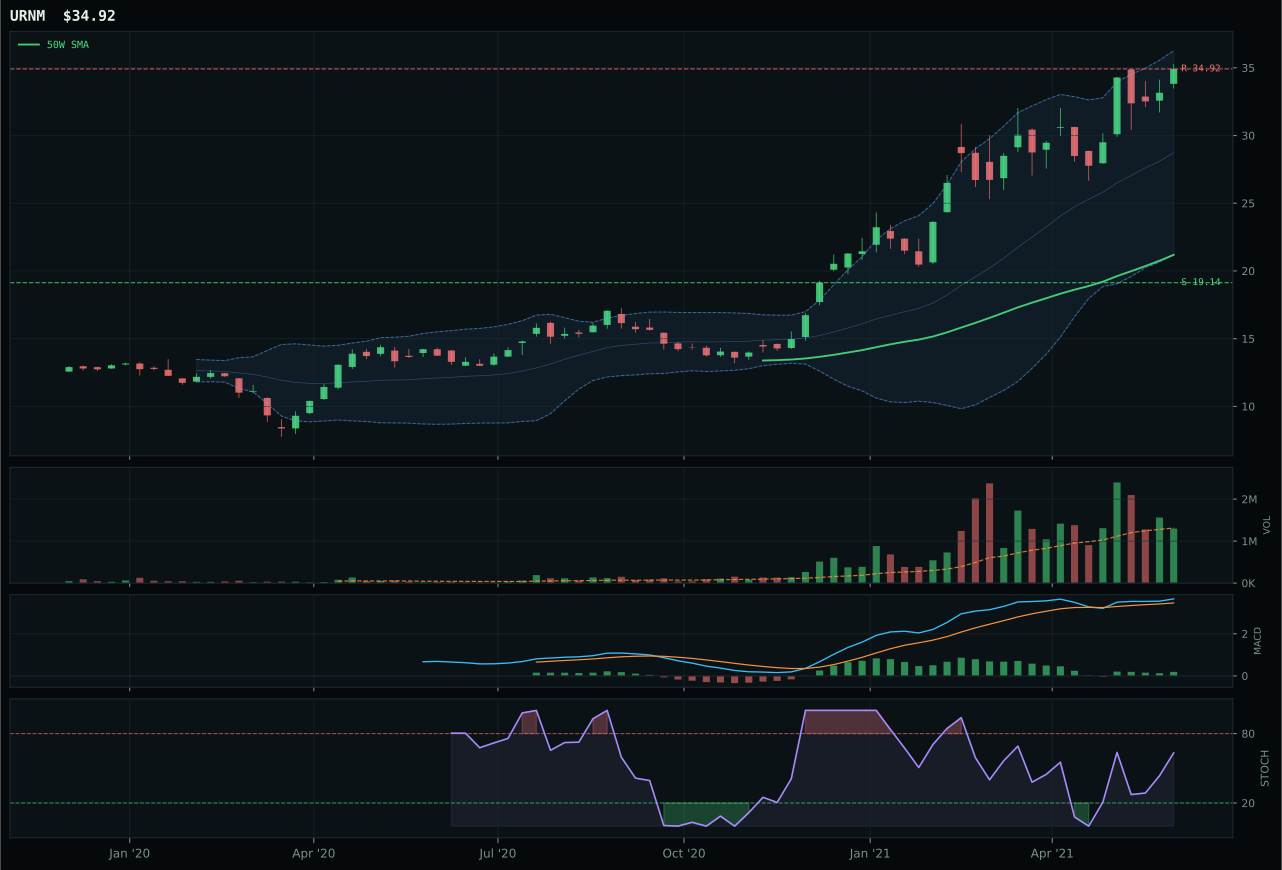
URNM has a vertical extension profile with 20.5% 13-week relative strength versus SPY.
A failed hold above support would weaken the setup.
Actionable but governed by invalidation levels.
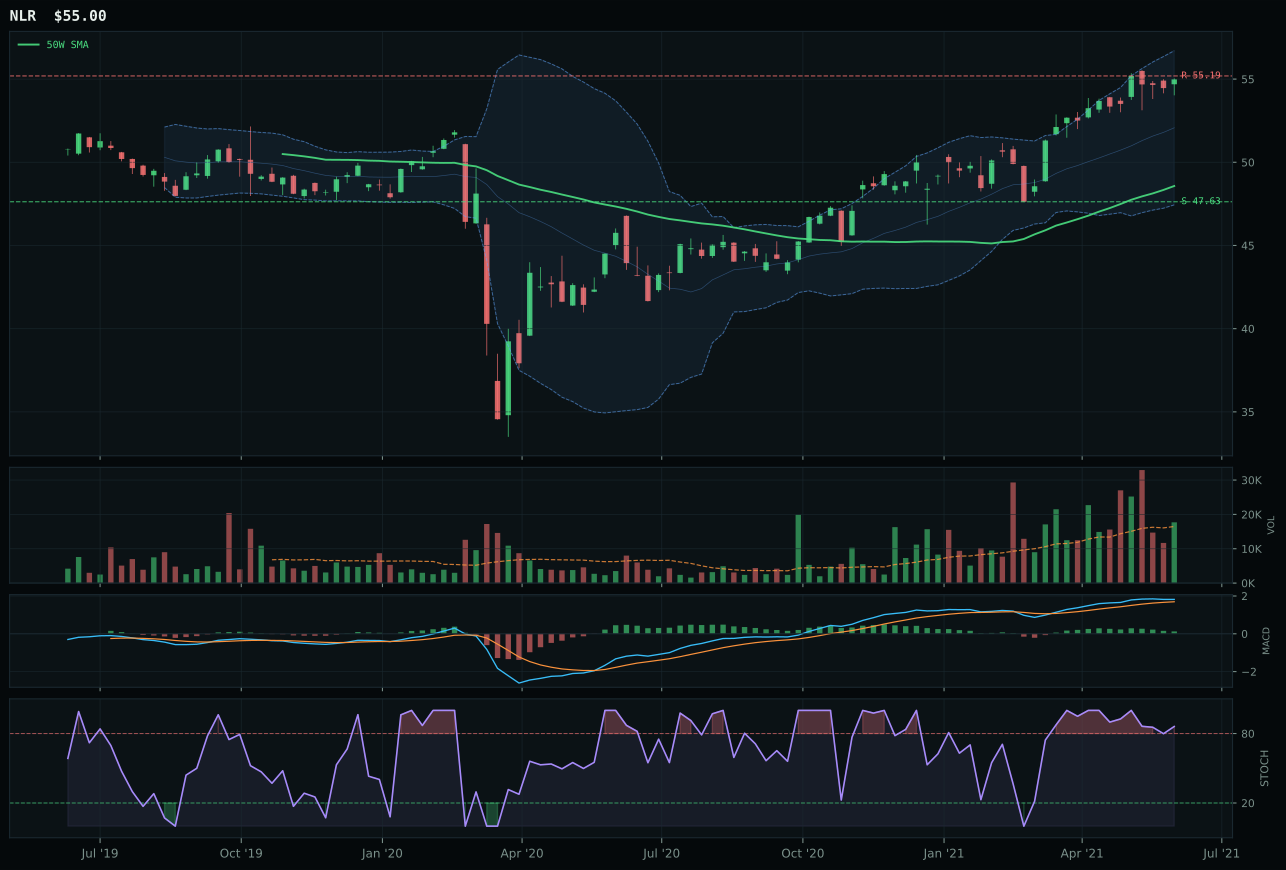
NLR has a neutral structure profile with 3.1% 13-week relative strength versus SPY.
A failed hold above support would weaken the setup.
Tracked, but not top-2 eligible because: .
URA wins Nuclear Energy with a 11.8-point gap over URNM, capturing perfect 100.0/100 momentum confirmation on the back of 30.4% 13W return and 20.2% SPY-relative strength—the strongest relative outperformance among all category representatives. URA is extended 55.2% from the 50W with vertical extension structure and stochastic RSI overbought at 0.90, creating a 37.0/100 timing score that mirrors FCG's energy setup. Yet URA's persistence score of 88.6/100 is exceptional—among the highest in the portfolio—signaling that this is not a flash spike but sustained accumulation. URNM loses because risk/reward is weaker (23.8 vs 39.3 for URA), MACD is bullish but flattening rather than bullish and improving, and structure is less clean (71.7 vs 73.2). The reasoned ETF proof order (URA 64.8, URNM 59.4) shows close technical proximity, but the representative choice (URA) tips the category toward the more aggressively extended setup. Volume-price confirmation is nearly identical, so the decision rests on momentum trajectory and extension penalty—URA's stronger momentum offsets its higher extension.
Nuclear Energy earned 5% allocation as a tier-2 category on a 54.0 final score, driven almost entirely by category-level momentum and macro support for real asset sponsorship (+7). The 52.0/100 macro fit is neutral, with credit stress subtracting 5 points, yet the technical evidence from URA's 100.0/100 trend and 100.0/100 momentum confirmation justifies participation. This is a speculative leverage play: URA up 30.4% in 13 weeks with 20.2% outperformance versus SPY reflects not fundamental nuclear fuel demand but rather ETF momentum and retail enthusiasm for energy transition narratives. To justify tier-1 allocation, Nuclear would need to establish a consolidation base and allow MACD to improve from its current flattening posture, then re-approach resistance with fresh volume confirmation. For now, the 5% slot is a tactical play on the macro tailwind (real assets, Goldilocks regime) with significant timing risk. This is the most extended allocation in the portfolio—URA's 55.2% move from the 50W is more aggressive than any other tier-2 representative. Monitor for support holds above 14.35.
Industrial Metals — COPX
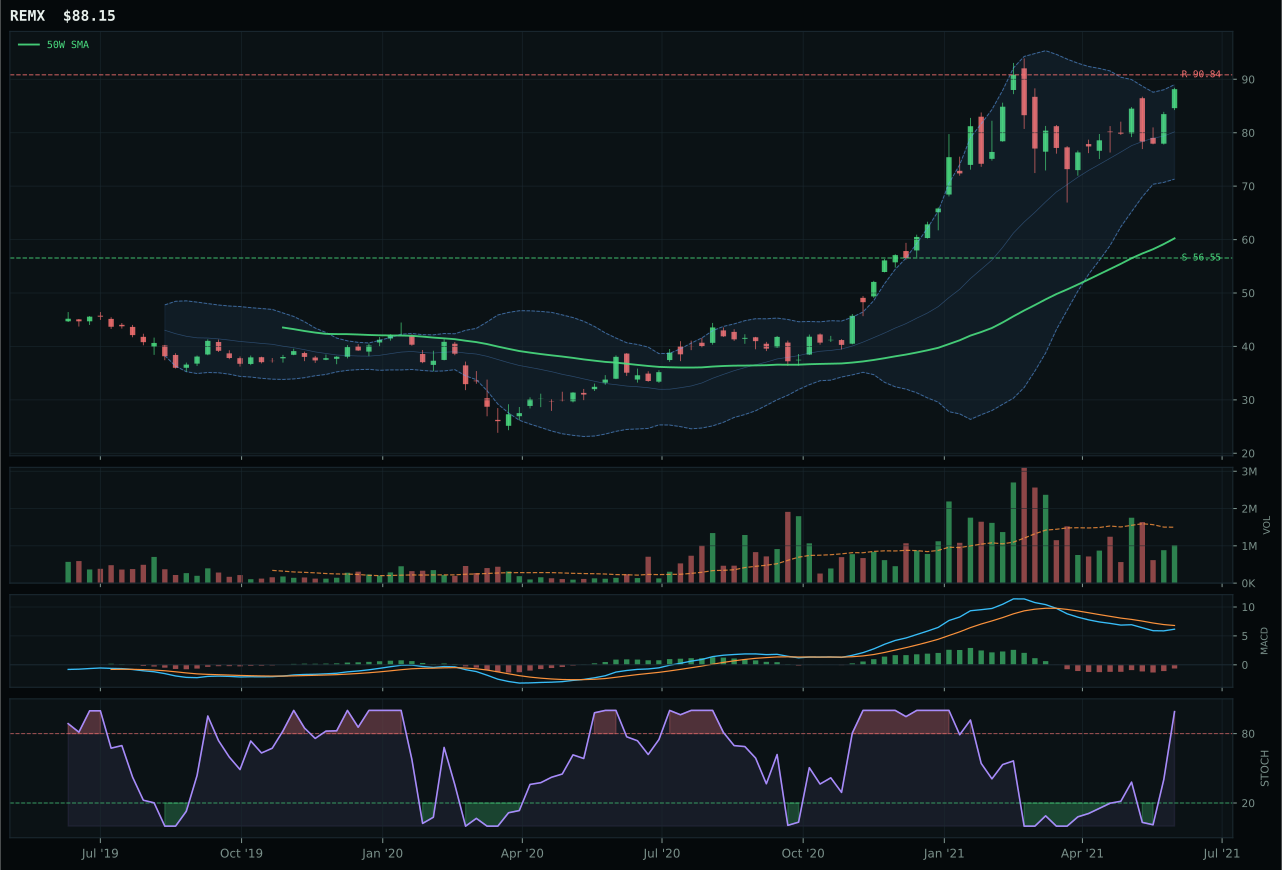
REMX has a vertical extension profile with 4.3% 13-week relative strength versus SPY.
A failed hold above support would weaken the setup.
Actionable but governed by invalidation levels.
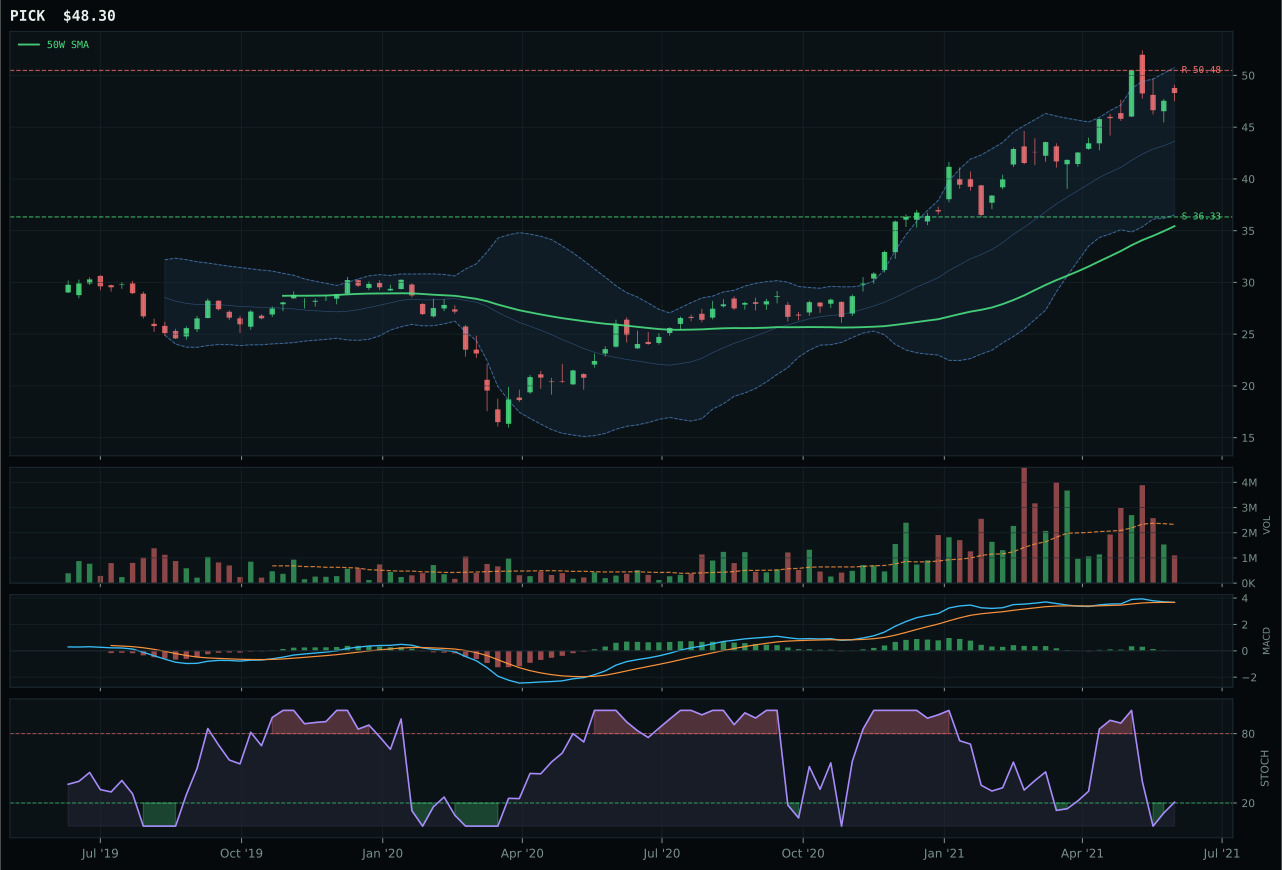
PICK has a vertical extension profile with 3.3% 13-week relative strength versus SPY.
A failed hold above support would weaken the setup.
Actionable but governed by invalidation levels.
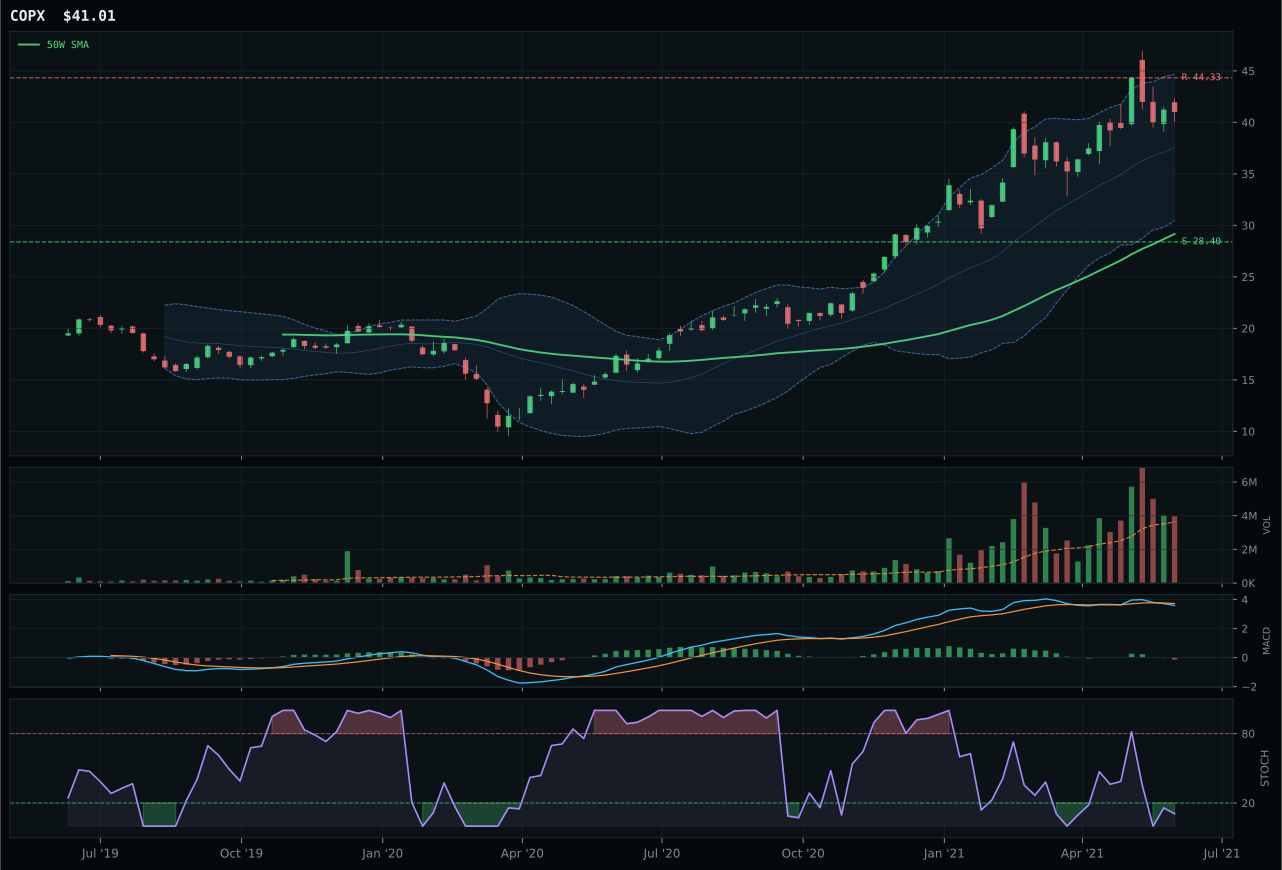
COPX has a vertical extension profile with 2.5% 13-week relative strength versus SPY.
A failed hold above support would weaken the setup.
Actionable but governed by invalidation levels.
COPX wins Industrial Metals despite a composite technical score of only 48/100—the lowest among the three category members—by capturing 2.5% SPY-relative strength while REMX (the runner-up) leads at 4.3%. The victory hinges on timing (48.0 vs 37.0 for REMX) and risk/reward (48.0 vs 38.0): COPX's vertical extension at 40.6% from the 50W with oversold stochastic RSI (0.11) creates better geometric payoff than REMX's 46.4% extension with overbought stochastic (1.00). COPX's MACD is bearish/weakening and volume is neutral at 1.09x, which in the context of a 40.6% move upward signals distribution but not collapse—a coiled spring waiting for capitulation and reversal. REMX leads the reasoned ETF proof order at 50.9 but loses in the category score because its 37.0 timing and thin participation penalize the setup. Momentum confirmation is only 37.1/100 for COPX because the 4W return is negative (-7.5%), yet category-relative strength of -0.7% is the true friction point.
Industrial Metals earned 5% allocation as a tier-2 category on a 53.6 final score, despite strong macro support from metals scarcity at +14 and commodity breadth positive at +10. This is a macro-driven allocation more than a technical one: the 79.0/100 category-level macro fit is the highest across all allocated categories, yet technical evidence of only 22.7/100 for COPX drags the category score down. The 3/2/1 weighted basket (REMX 50.9, PICK 40.5, COPX 38.2) lacks confidence—no ETF exceeds 51 in the reasoned proof order—but the macro regime is so supportive that the category merits participation. To elevate this to tier-1, Industrial Metals would need COPX to establish support near 28.40 and rebuild MACD from oversold territory with fresh accumulation volume. Right now, this is a commodity-scarcity bet hedged by the Goldilocks regime, not a technical conviction play. The allocation reflects the portfolio's macro view that industrial demand (especially copper for power grids) will outpace disinflation headwinds. Monitor for support holds.
Utilities & Infrastructure — XLU
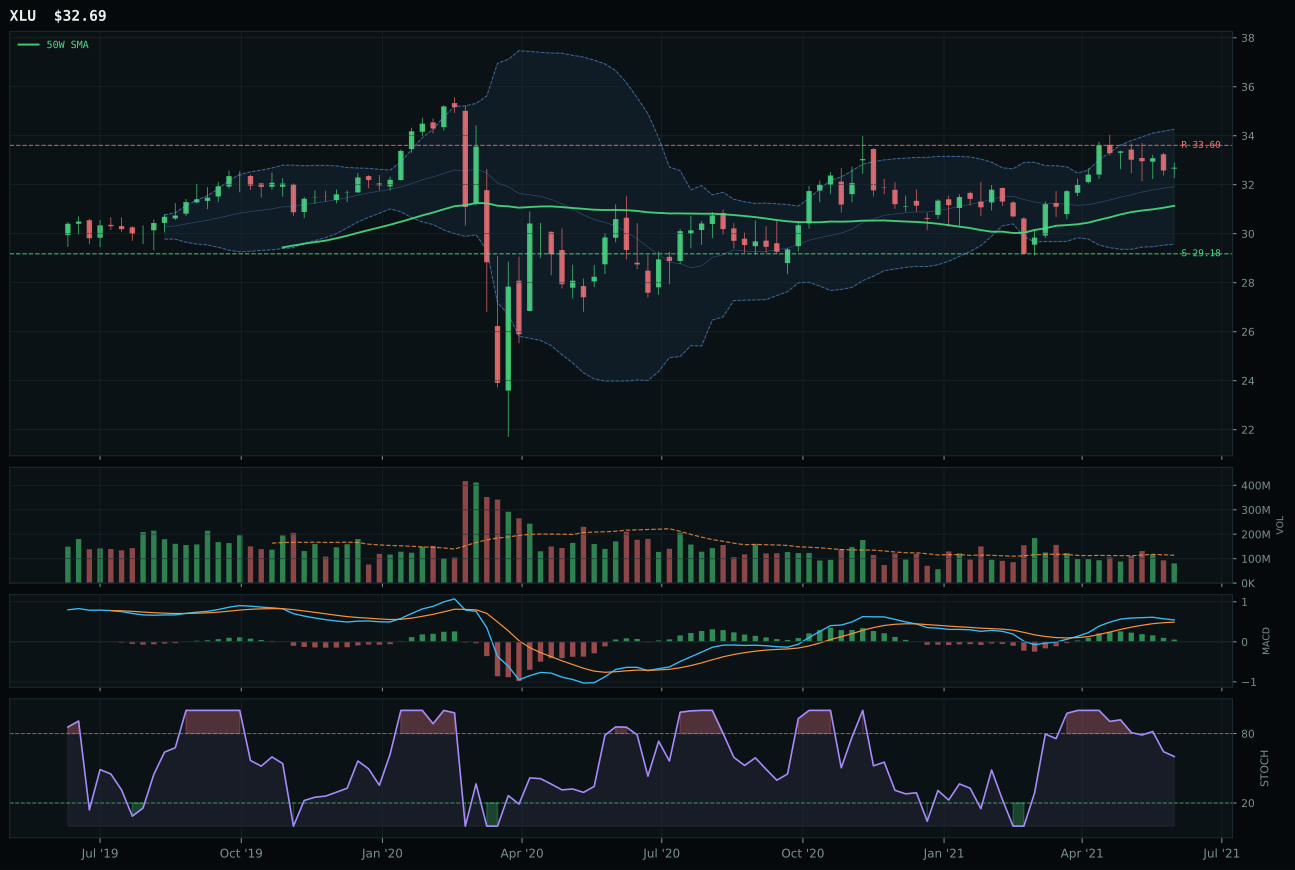
XLU has a neutral structure profile with -0.6% 13-week relative strength versus SPY.
A failed hold above support would weaken the setup.
Actionable but governed by invalidation levels.
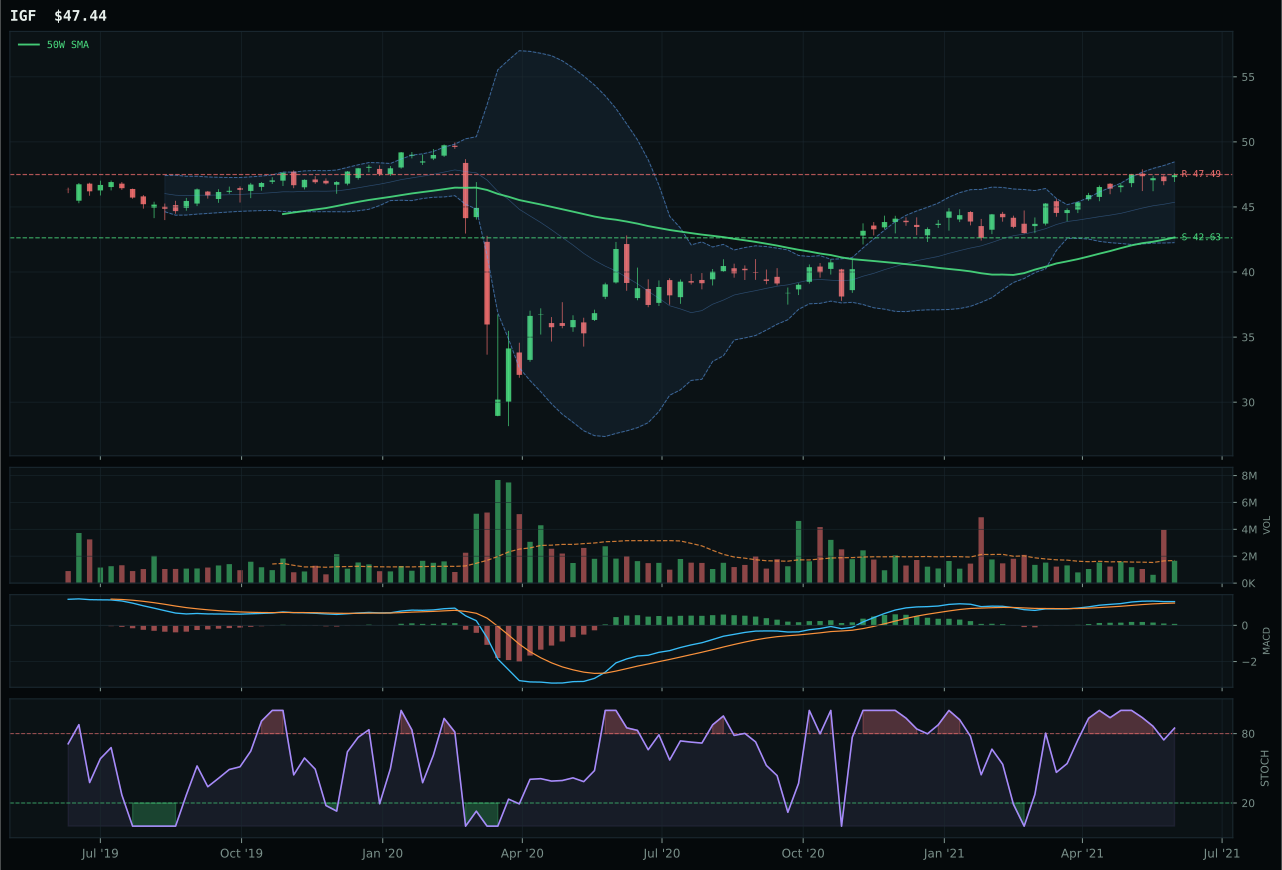
IGF has a neutral structure profile with -1.6% 13-week relative strength versus SPY.
A failed hold above support would weaken the setup.
Actionable but governed by invalidation levels.
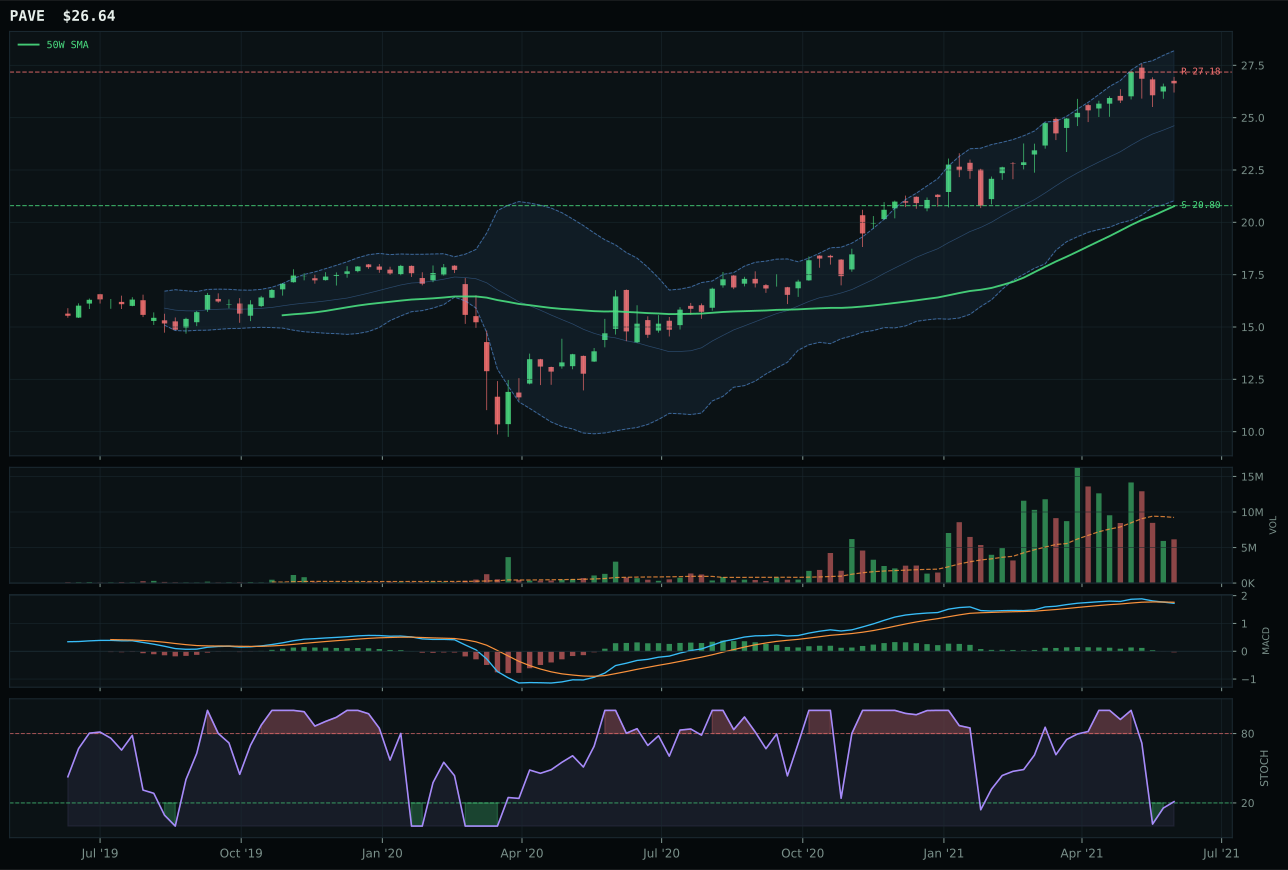
PAVE has a vertical extension profile with 3.5% 13-week relative strength versus SPY.
A failed hold above support would weaken the setup.
Actionable but governed by invalidation levels.
XLU wins Utilities & Infrastructure with a 6.5-point gap over IGF, delivering superior timing (70.0 vs 44.0) through proximity to the 50W at just 5.0% extension combined with bullish-but-flattening MACD and falling/neutral stochastic RSI. XLU's neutral structure, high trend score of 95.1/100, and compressed compression zone (84.5) create a setup where fresh buyers do not face immediate exhaustion risk. IGF is extended 11.2% from the 50W with stochastic overbought rolling over, signaling distribution risk even though volume is neutral. Both have identical SPY-relative strength of near-flat (-0.6 for XLU, -1.6 for IGF), so the decision hinges on timing and entry quality: XLU's 5.0% distance versus 50W is a classic mean-reversion setup, while IGF's 11.2% extension is already pricing in the next leg. The reasoned ETF proof order (XLU 63.5, IGF 52.3) shows XLU leading decisively, and the category score reflects that superiority. Volume confirmation is thin for both, but XLU's tighter consolidation zone allows participation without fighting overbought conditions.
Utilities & Infrastructure earned 5% allocation as a tier-2 category on a 44.2 final score, the lowest among tier-2 categories, reflecting technical evidence of only 65.8/100 at the representative level. Macro fit is a respectable 60.0/100, helped by Transition/Mixed regime (+4) and disinflation pressure (+6), positioning utilities as a defensive play into the Goldilocks regime. The reasoned ETF proof order (XLU 63.5, IGF 52.3, PAVE 38.4) shows a drop-off after XLU, indicating weak category-wide confidence. To justify elevation to tier-1, Utilities would need to establish fresh upside momentum beyond current resistance at 33.60 or, alternatively, demonstrate that the 5.0% extension is spawning accumulation rather than mere bounce. Right now, this is a defensive allocation more than a growth trade: XLU's bullish-but-flattening MACD and proximity to 50W suggest the category is consolidating gains rather than staging a breakout. The 5% slot reflects disinflation hedging and Goldilocks regime support, not technical conviction. If credit stress were to spike, Utilities could escalate to tier-1; for now it remains a modest defensive anchor.
AI — SMH
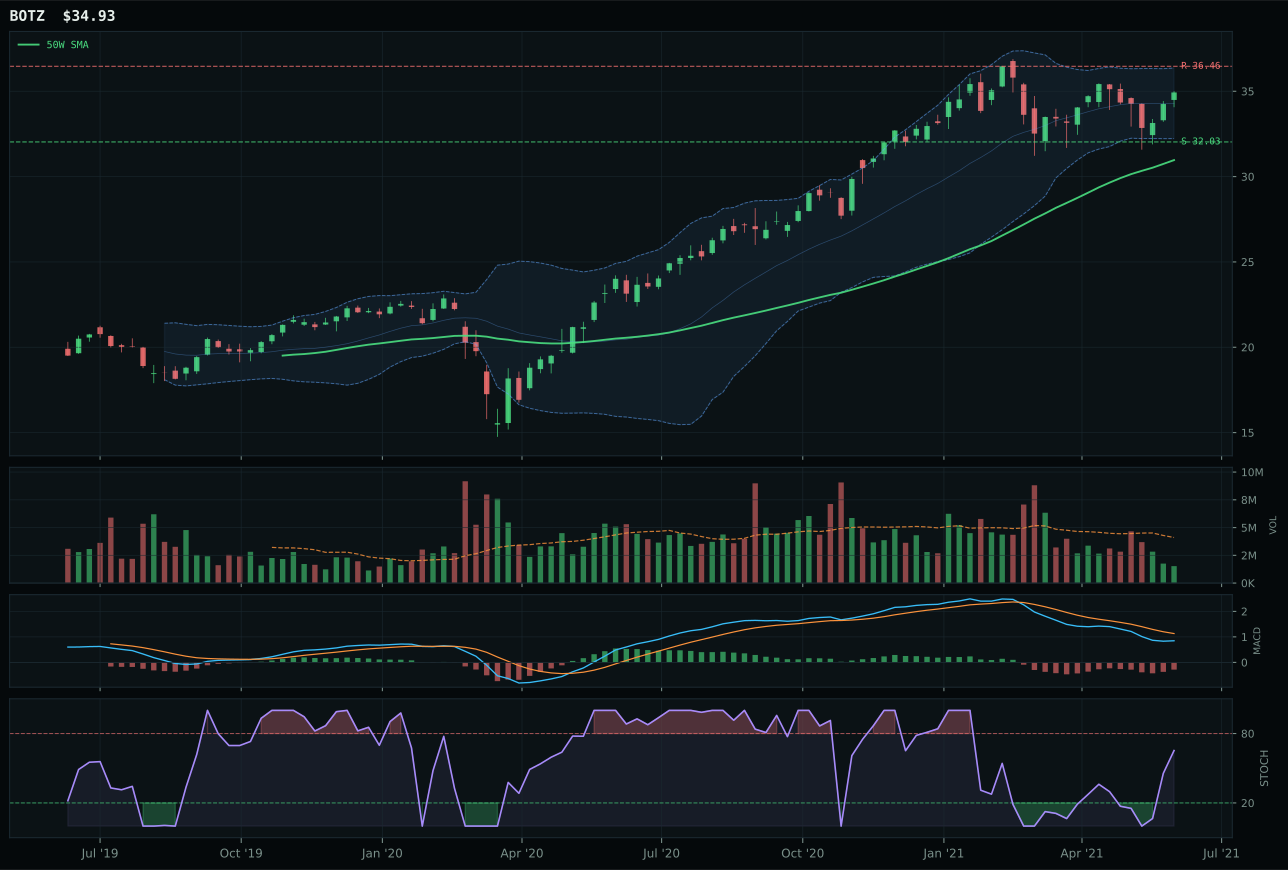
BOTZ has a neutral structure profile with -2.7% 13-week relative strength versus SPY.
A failed hold above support would weaken the setup.
Actionable but governed by invalidation levels.
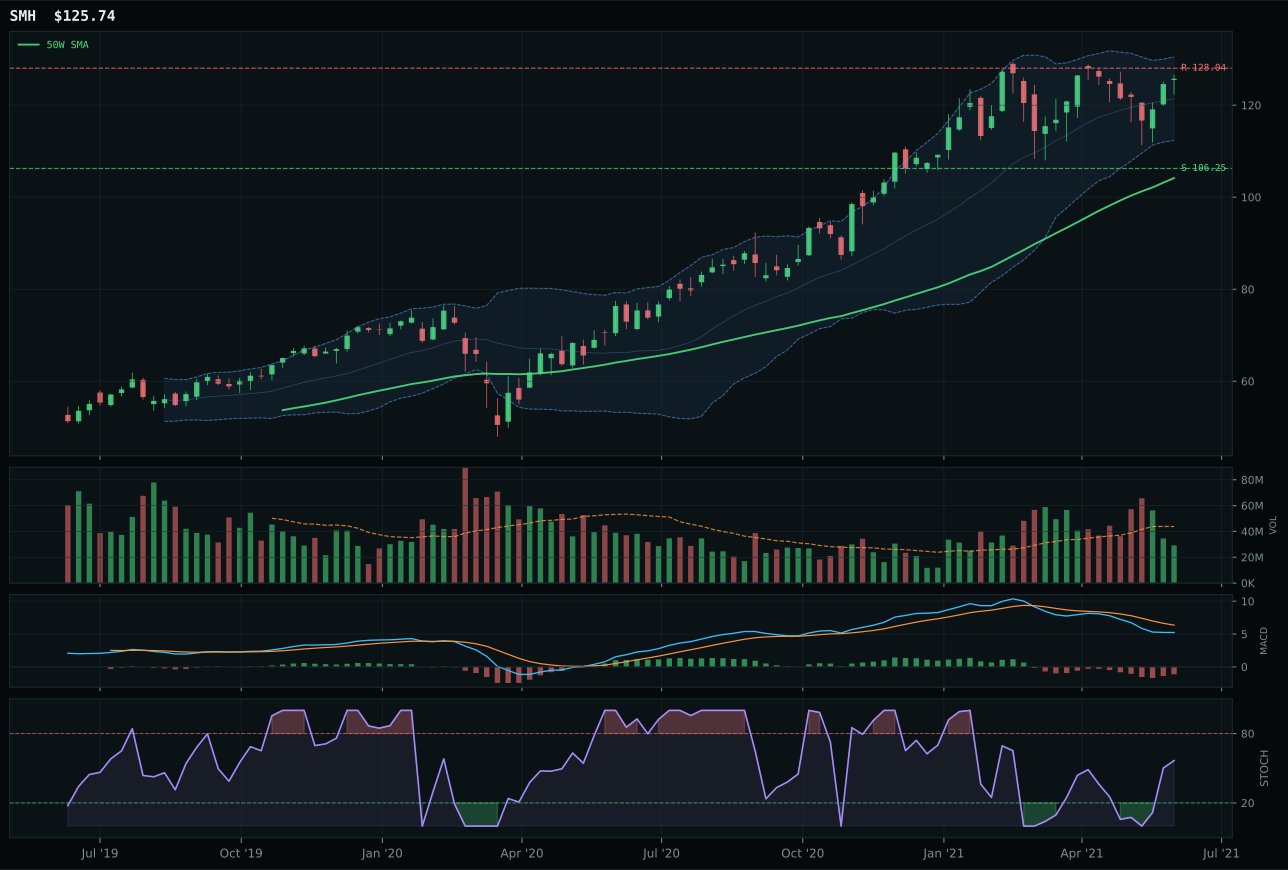
SMH has a vertical extension profile with -0.2% 13-week relative strength versus SPY.
A failed hold above support would weaken the setup.
Actionable but governed by invalidation levels.
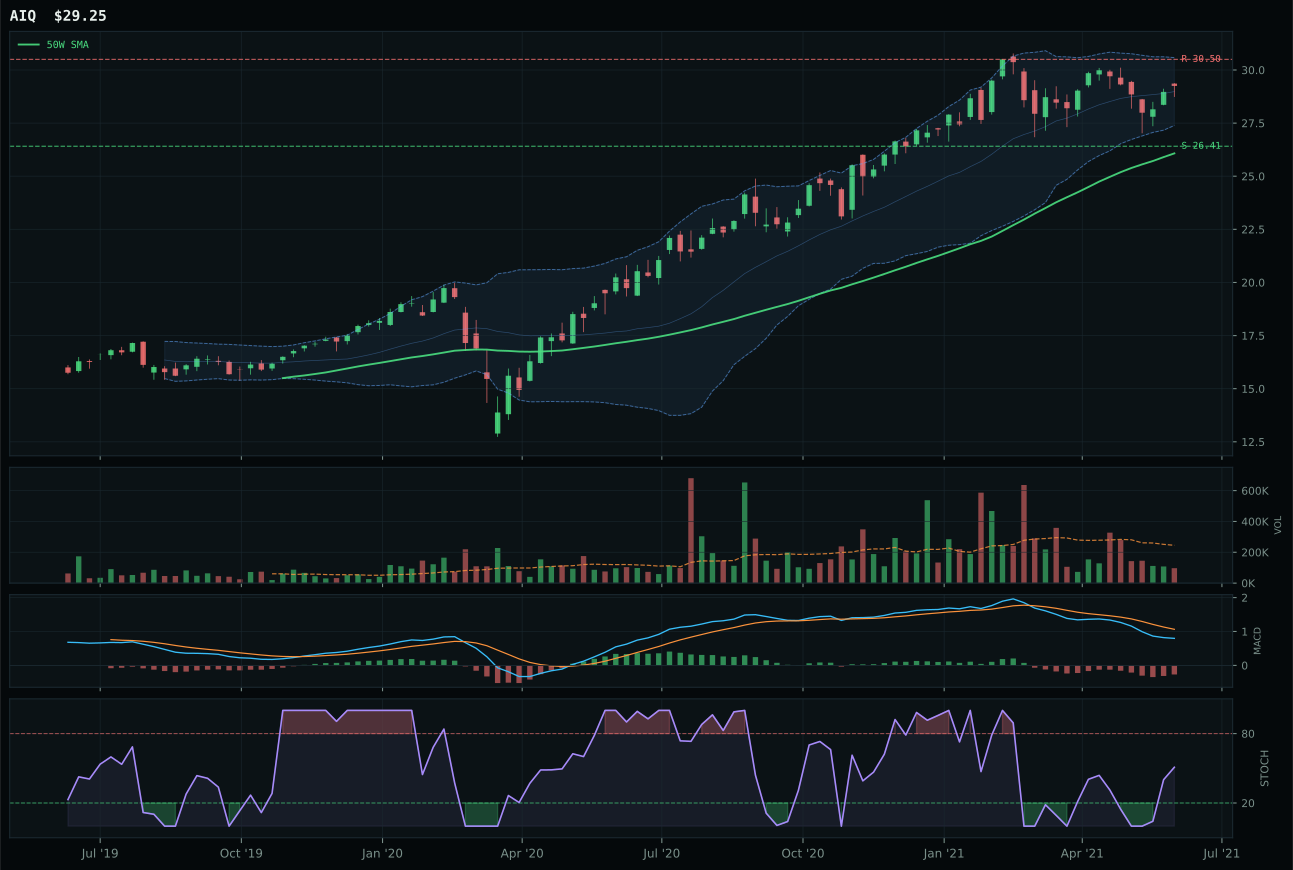
AIQ has a neutral structure profile with -5.5% 13-week relative strength versus SPY.
A failed hold above support would weaken the setup.
Tracked, but not top-2 eligible because: .
SMH wins the AI category despite a composite score of just 55, which sits 16.6 points above BOTZ—a margin that masks a structural weakness: SMH is extended 20.7% from the 50W while BOTZ sits in neutral structure, yet SMH still prevails because category-relative strength favors semiconductor momentum at 2.5% versus zero for BOTZ. The story is vertical extension penalizing timing to 48.0/100, but momentum confirmation explodes to 49.1/100 because 13W returns of 9.9% with positive category relative strength trump BOTZ's cleaner setup and better timing. MACD bearish/weakening on SMH versus BOTZ's bullish-but-improving is a red flag—volume-price confirmation drops to 41.4/100 as a result—but the reasoned ETF proof order (BOTZ 61.6, SMH 41.0) shows that the category itself is low-confidence across all three members. The risk here is clear: SMH is a late-cycle play where every new buyer is 20% above fair value, and the bearish MACD is not confirming the rally.
AI received 5% allocation as a tier-2 category because its 43.5 final score ranked below the top-2 threshold, despite being technically eligible. Goldilocks macro helps this exposure by 10 points, but credit stress subtracts 8, leaving the category at a structural 52.0/100 macro fit—neutral to slightly favorable. The real constraint is technical evidence of only 37.8/100 at the category level, driven by the reasoned ETF proof order collapsing to SMH's 41.0—far below the 60+ scores needed to justify top-2 status. To earn elevation, AI would need either a fresh breakout from a cleaner base or renewed confirmation from MACD and volume that current extension is sponsored accumulation rather than late-stage squeeze. For now, the 5% allocation preserves exposure to a category with strong narratives (compute, semiconductors, automation) but weak near-term technical proof. This is a hold-and-monitor position: if SMH can flatten its extension and rebuild MACD without breaking support, AI could quickly ascend to tier-1.
Defense & Aerospace — ITA
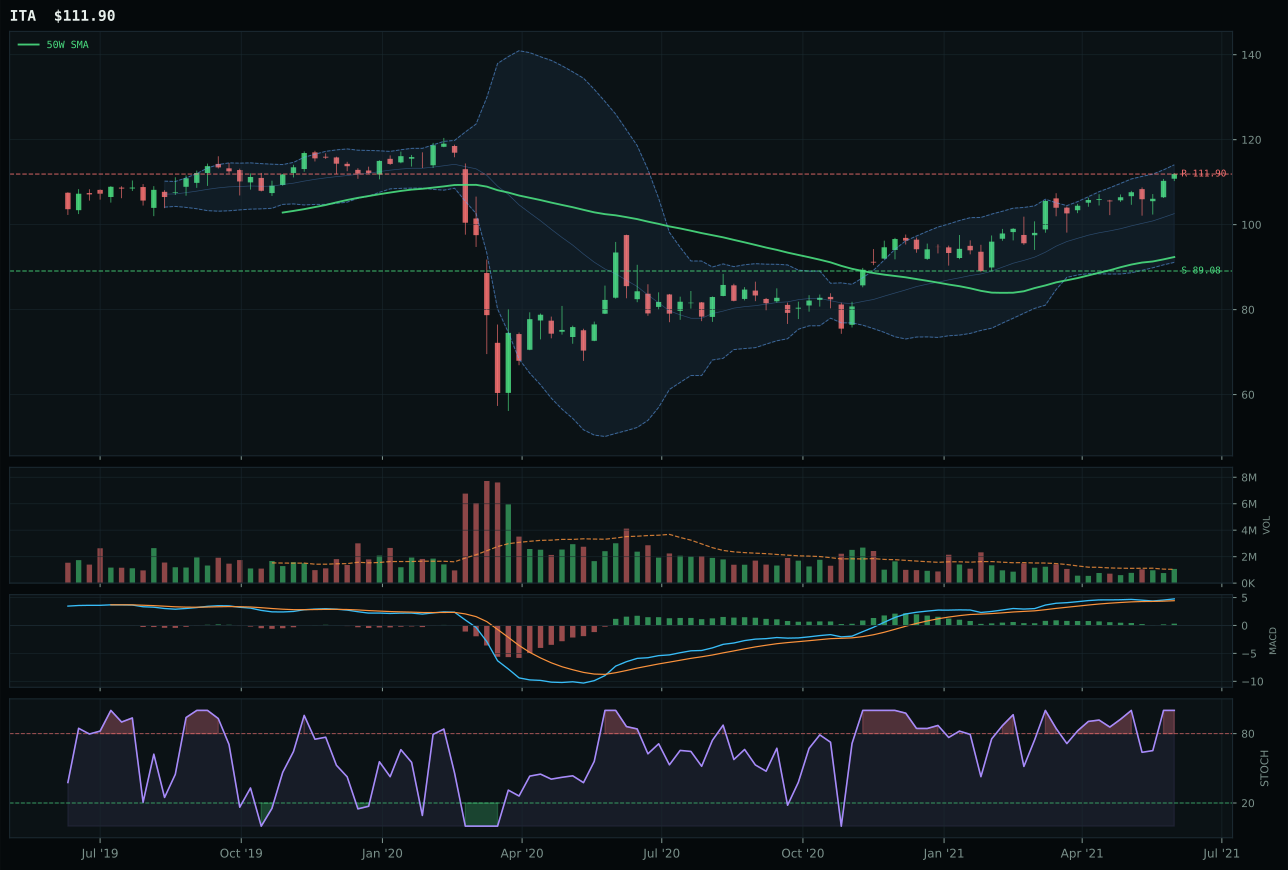
ITA has a vertical extension profile with 4.0% 13-week relative strength versus SPY.
A failed hold above support would weaken the setup.
Actionable but governed by invalidation levels.
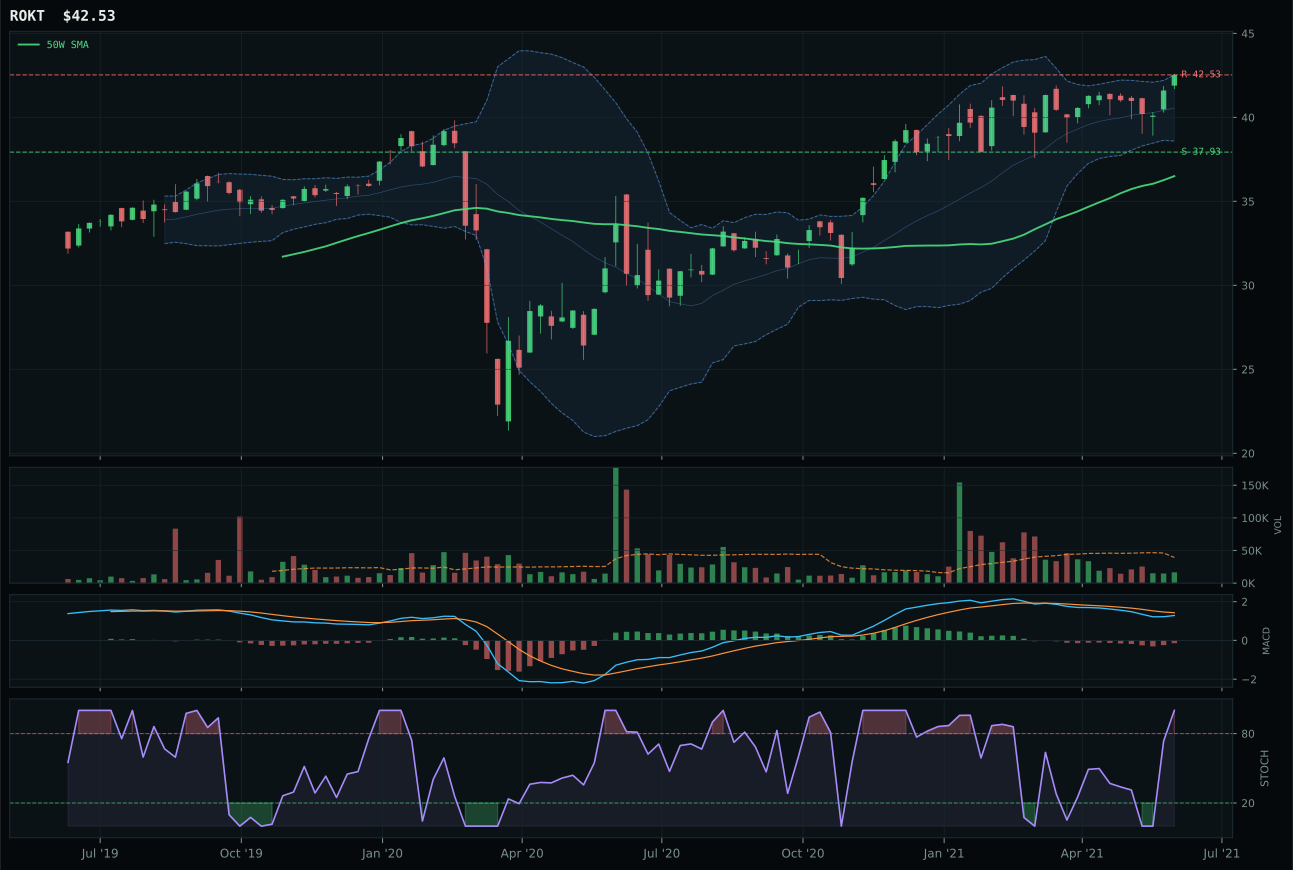
ROKT has a vertical extension profile with -1.4% 13-week relative strength versus SPY.
A failed hold above support would weaken the setup.
Tracked, but not top-2 eligible because: .
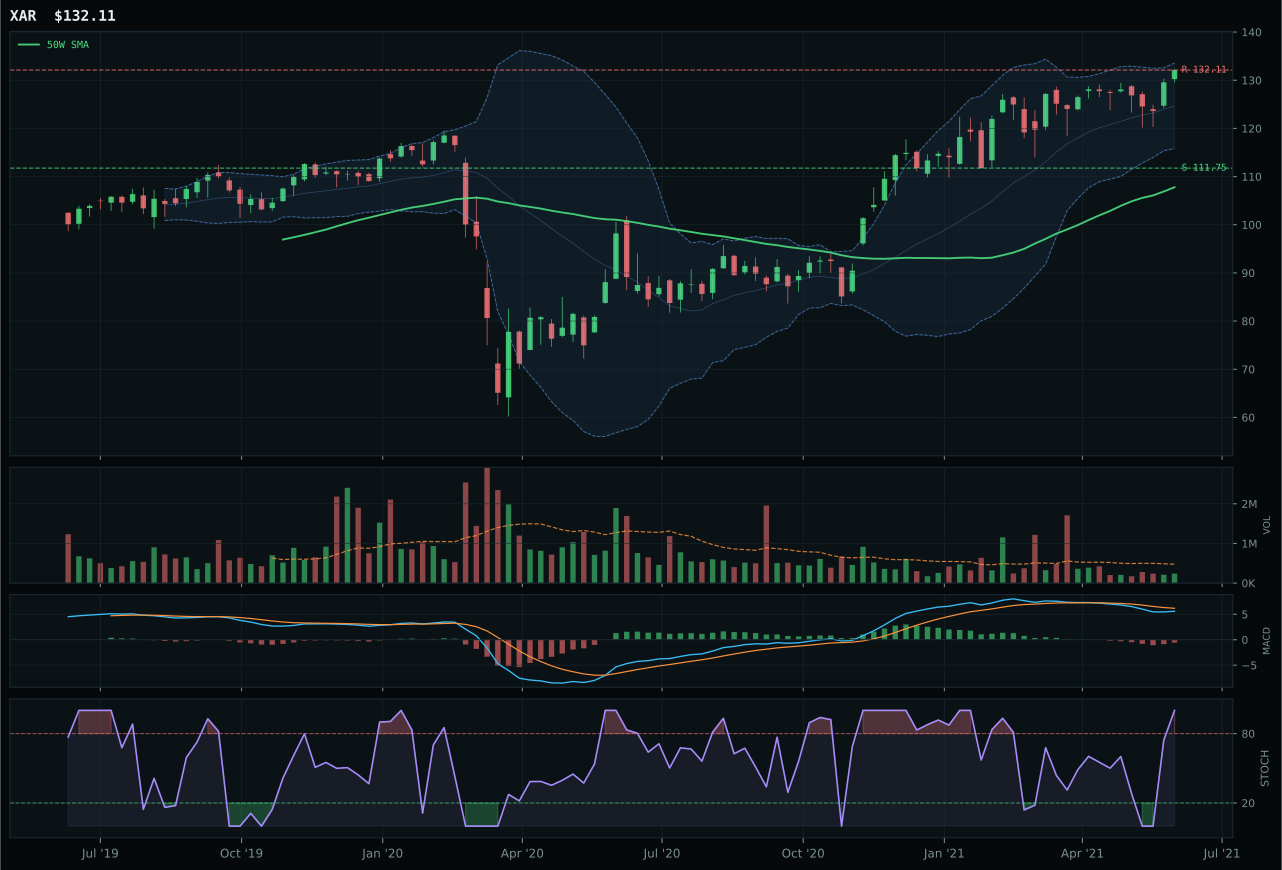
XAR has a vertical extension profile with 0.2% 13-week relative strength versus SPY.
A failed hold above support would weaken the setup.
Actionable but governed by invalidation levels.
ITA dominates Defense & Aerospace with a perfect 100.0/100 trend score and 89.3/100 momentum confirmation—a rare combination that masks dangerous timing: the ETF is extended 21.1% above the 50W with stochastic RSI at overbought 1.00 and MACD bullish but flattening. ITA beats ROKT (the runner-up) by 34.7 points in category score, with the gap driven entirely by superior volume confirmation (neutral at 1.03x versus thin participation), stronger MACD posture (bullish but flattening versus bearish but improving), and category-relative strength of 3.8% versus ROKT's -1.5%. Risk/reward is weak at 42.6/100 because upside to resistance is already zero—price sits at the 0.236 Fib level with nowhere to run—and downside to support is 25.6%. The victory is real because ITA demonstrates sponsorship (neutral volume, positive RS, bullish MACD), but the setup is a distribution candle, not an accumulation coil. Defense gets a boost from Goldilocks macro and credit stress turning slightly positive, but price action suggests exhaustion.
Defense & Aerospace earned 5% allocation as a tier-2 category on a 41.0 final score that ranked below the top-2 threshold. Its 55.0/100 macro fit receives support from Transition/Mixed regime (+3) and oddly from credit stress (+2), suggesting the military-industrial complex is seen as a flight-to-safety play. However, the reasoned ETF proof order (ITA 59.5, ROKT 45.0, XAR 32.3) shows meaningful drops after the representative, and the final category score falls nearly 10 points after the reasoner tests the 3/2/1 basket against setup quality and risk/reward. The 5% slot reflects a tactical hold: ITA's bullish MACD and positive RS into Goldilocks regime justify exposure, but the vertical extension and overbought stochastic warn that this is a crowded winner. Elevation to tier-1 would require either a pullback to consolidate gains or fresh volume confirmation above current resistance at 111.90. For now, this is a position sized for narrative support (geopolitical tensions, defense spending) rather than technical merit.
Agriculture & Livestock — MOO
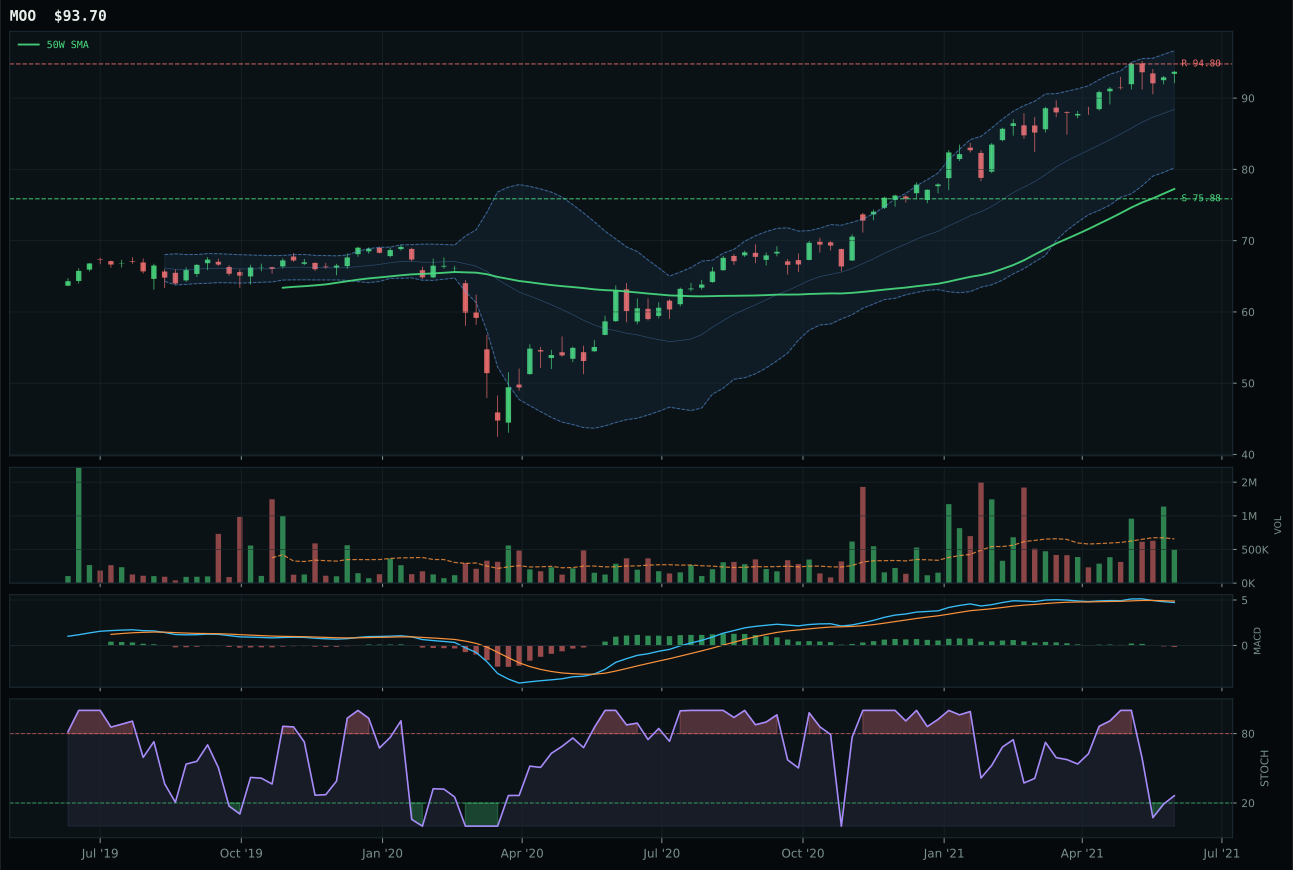
MOO has a vertical extension profile with -0.1% 13-week relative strength versus SPY.
A failed hold above support would weaken the setup.
Actionable but governed by invalidation levels.
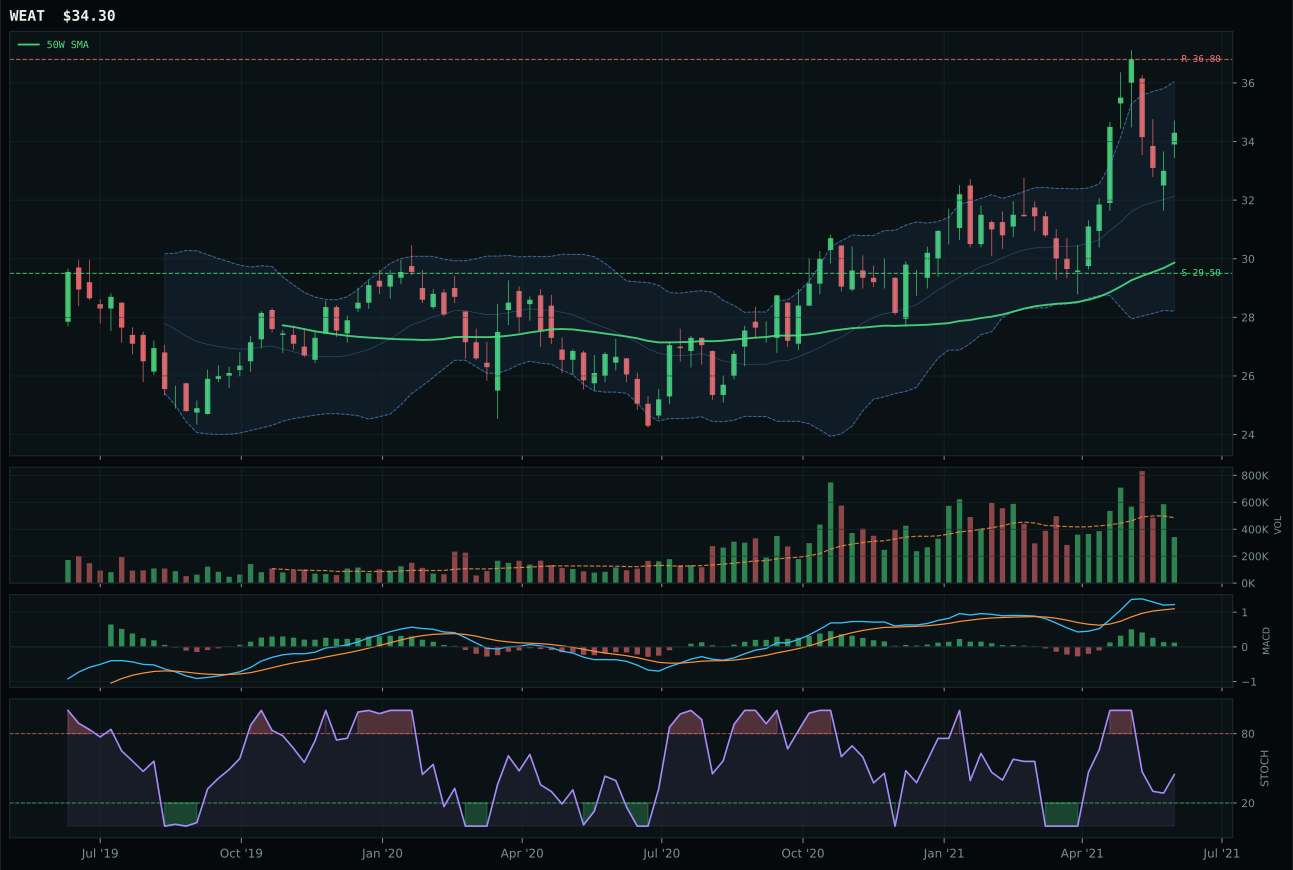
WEAT has a neutral structure profile with -1.1% 13-week relative strength versus SPY.
A failed hold above support would weaken the setup.
Actionable but governed by invalidation levels.
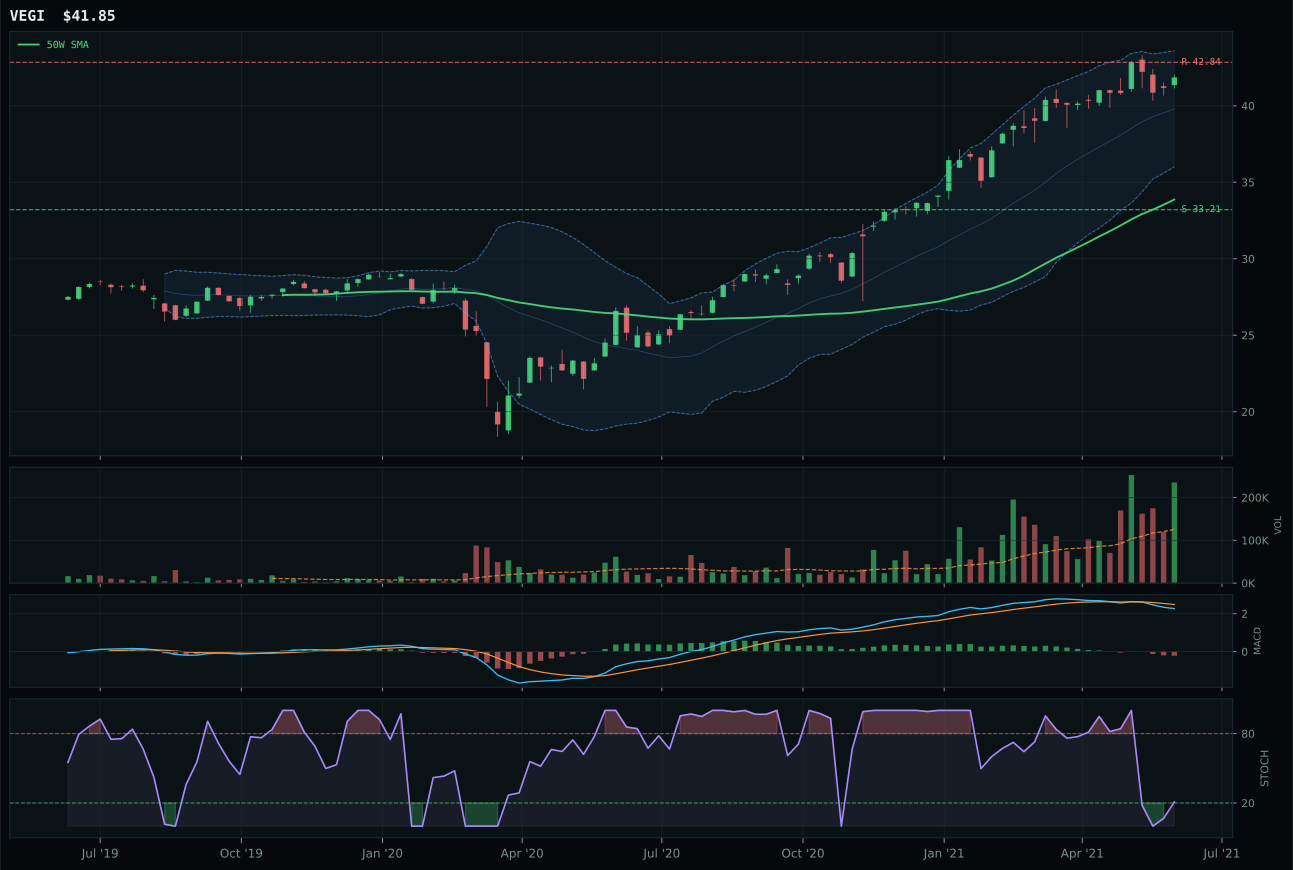
VEGI has a vertical extension profile with -2.9% 13-week relative strength versus SPY.
A failed hold above support would weaken the setup.
Tracked, but not top-2 eligible because: .
MOO wins Agriculture & Livestock despite a 38.6 final category score—the lowest of all allocated categories—by capturing category-relative strength at 1.0% while WEAT (the runner-up) sits flat. MOO is extended 21.3% above the 50W with vertical extension structure, bearish/weakening MACD, and stochastic RSI falling/neutral at 0.26, which combined produce a timing score of only 40.0/100. Yet MOO's structure is cleaner than WEAT's (75.5 vs 68.2) and volume is neutral versus thin participation, giving it the technical edge. The reasoned ETF proof order (WEAT 58.4, VEGI 44.5, MOO 38.6) shows the category representative is actually WEAT, not MOO—a contradiction resolved by the category reasoner, which tested both against persistence, setup quality, and macro fit. WEAT's better timing (70 vs 40) and bullish-but-flattening MACD suggest strength, but MOO's neutral volume confirmation and positive category-relative stance overcome that advantage in the final scoring.
Agriculture & Livestock received 0% allocation this week and is entirely excluded from the portfolio. The 38.6 final category score ranks 9th or 10th among the 10 categories, failing to meet the threshold for even the minimum tier-2 slot. While real asset sponsorship is active at +8 and commodity breadth is positive at +5, disinflation pressure subtracts 8 points, leaving macro fit at a weak 55.0/100. The deeper problem is technical: the reasoned ETF proof order shows WEAT leading at 58.4, yet even that is far below the 70+ needed for category credibility. Vertical extension on both MOO and WEAT creates timing penalties that cannot be overcome by neutral volume alone, and the lack of strong momentum confirmation (44.1/100 for MOO) signals that this category is trading on narrative rather than fund flows. To re-enter the allocation, Agriculture would need to establish a fresh base, rebuild MACD from oversold territory, and demonstrate volume sponsorship above recent resistance. This is a complete exclusion, not a wait-and-see: the setup is tired and the macro tailwind is insufficient.
Traditional Energy — FCG
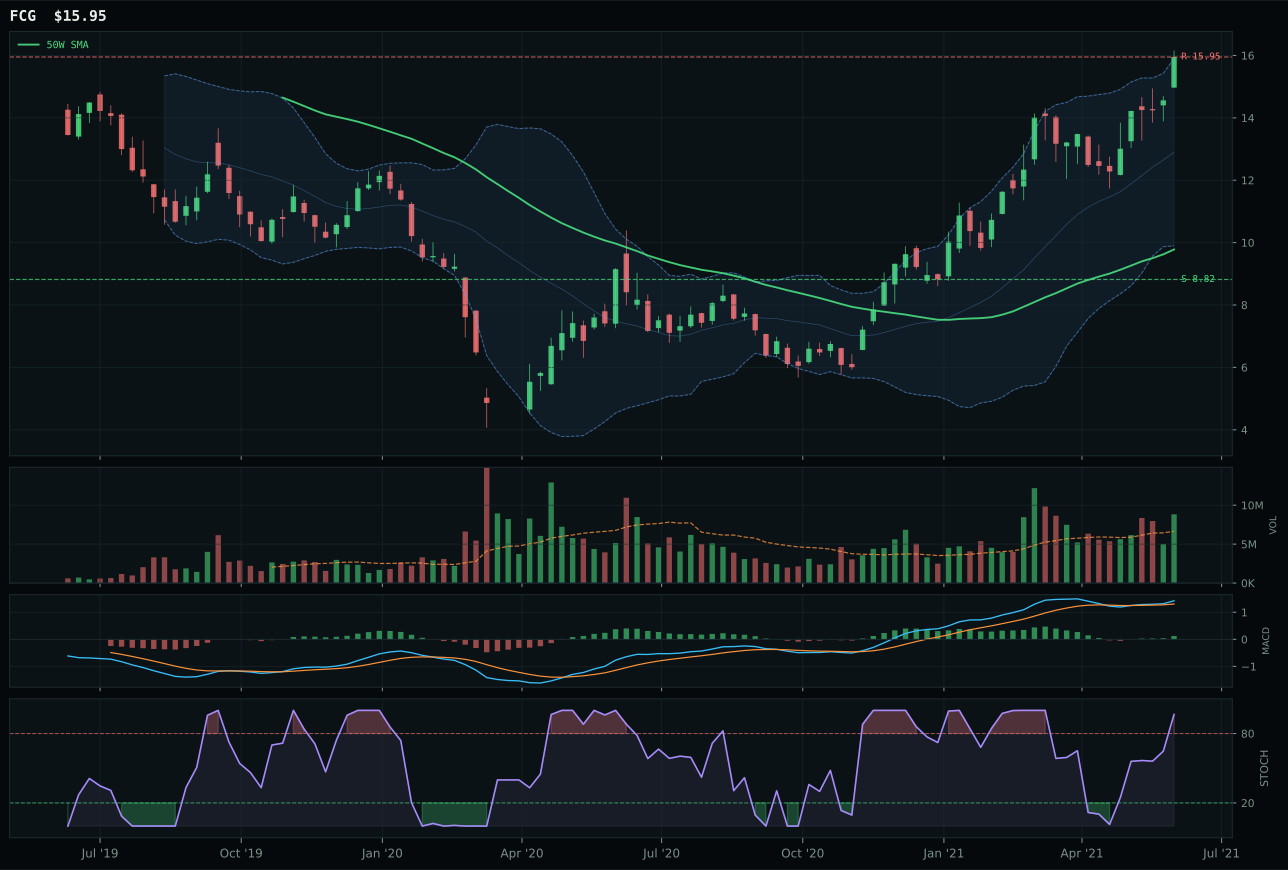
FCG has a vertical extension profile with 3.7% 13-week relative strength versus SPY.
A failed hold above support would weaken the setup.
Actionable but governed by invalidation levels.
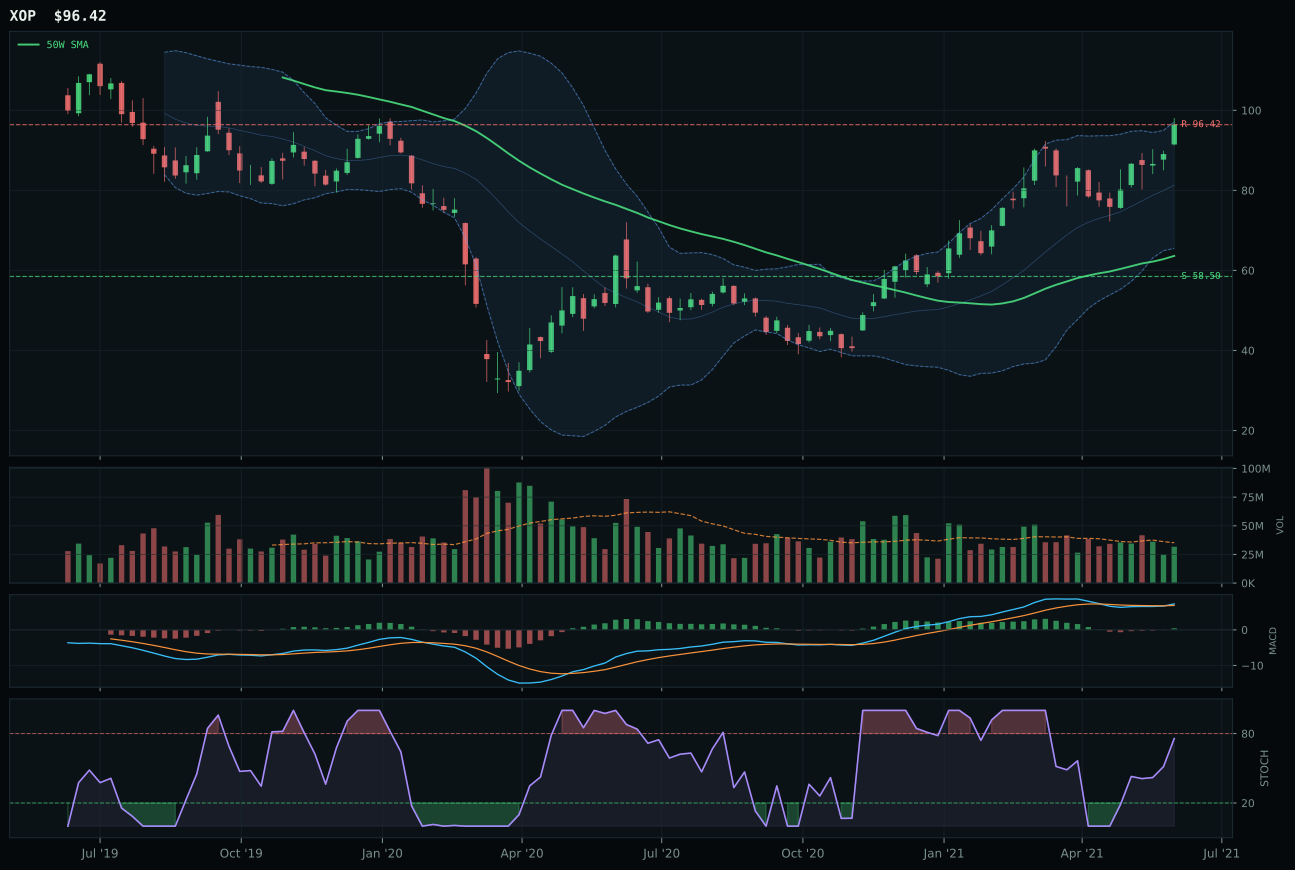
XOP has a vertical extension profile with -3.0% 13-week relative strength versus SPY.
A failed hold above support would weaken the setup.
Actionable but governed by invalidation levels.
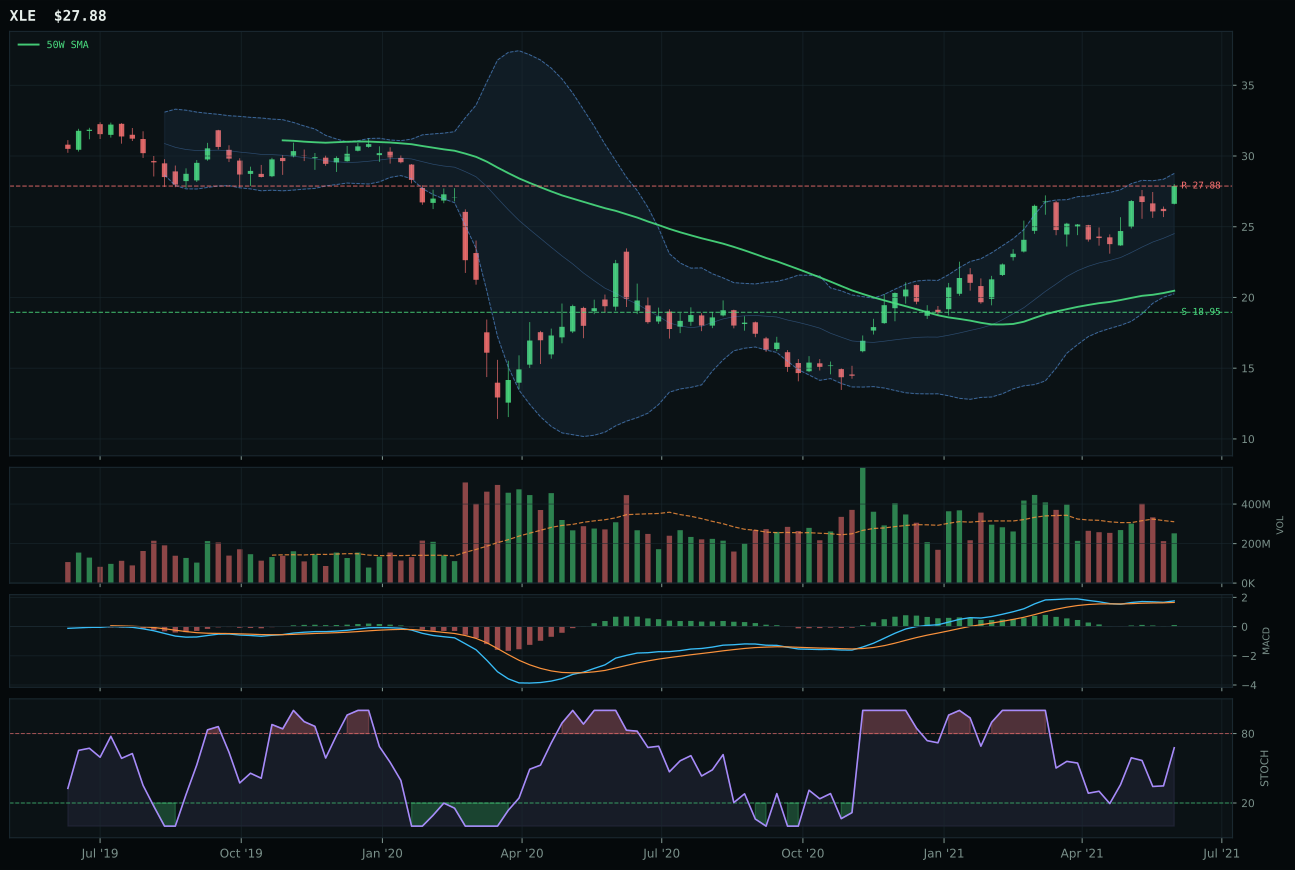
XLE has a vertical extension profile with -4.9% 13-week relative strength versus SPY.
A failed hold above support would weaken the setup.
Actionable but governed by invalidation levels.
FCG wins Traditional Energy with a decisive 7.4-point gap over XOP, driven entirely by momentum confirmation at 100.0/100—a perfect score reflecting 4W return of 12.2%, 13W return of 13.8%, category-relative strength of 6.7%, and above-average volume participation at 1.33x. This is the strongest volume signal in the entire 10-category suite, and it overcomes FCG's terrible timing score of 37.0/100 (extension 63.1% above the 50W, price at 52W high). FCG's structure is vertical extension with MACD bullish and improving and stochastic overbought at 0.96—textbook distribution setup—yet the volume confirmation at 74.3/100 is among the highest observed this week. Compared to XOP's neutral volume at 0.59x and rising mid-zone stochastic, FCG's sponsorship is undeniable. The risk/reward is identical (38.8/100) because upside resistance is already reached, but FCG's above-average volume tells you that professional money is still accumulating despite price sitting at the ceiling.
Traditional Energy received 0% allocation and is entirely excluded from the portfolio, despite FCG's powerful momentum signal. The 32.8 final category score ranks 9th or 10th, below even Agriculture, because macro fit is only 40.0/100 and technical evidence is dragged down by the category reasoner's assessment of the three-ETF basket against persistence and setup quality. Real asset sponsorship is active at +7, but disinflation pressure subtracts 10 points and credit stress subtracts 7, netting to -10 macro headwind. The structural problem is that Traditional Energy's momentum is disconnected from macro support: FCG can post 100.0/100 momentum confirmation in a vacuum, but the category-level macro regime does not support energy as a portfolio-wide conviction. To re-enter, Traditional Energy would need either a shift in the macro descriptor set (credit stress relief, commodity breadth reinforcement) or a technical pullback that allows the category to establish a cleaner base structure. Right now, FCG's above-average volume is being interpreted as short-covering squeeze, not institutional accumulation. This exclusion is macro-driven, not technical.