
2021-05-28
Informational purposes only. The content in this report, including allocations, analysis, and commentary, is provided solely for informational and educational purposes. It does not constitute financial advice, investment advice, trading advice, or any other type of advice. Past performance does not guarantee future results. Always conduct your own research and consult a qualified financial professional before making investment decisions.
AltSeason was blocked by macro risk gating: The macro engine classifies the structural regime as Goldilocks with a tactical overlay of Transition / Mixed. Growth score is 50.0, inflation pressure is 48.2, liquidity is 62.0, credit stress is 63.9, and macro risk is 53.1. Cash is not required because crisis macro risk is inactive and bear-defense structure has 2/5 required checks. The active Defensive trigger is none and the Defensive cause is none.
Weekly Allocation
| Ticker | Category | Weight | Role |
|---|---|---|---|
| FBTC | 50% | Overlay | |
| GLD | Precious Metals | 10% | Top-2 (10%) |
| COPX | Industrial Metals | 10% | Top-2 (10%) |
| URNM | Nuclear Energy | 5% | Tier-2 (5%) |
| CIBR | Technology | 5% | Tier-2 (5%) |
| MOO | Agriculture & Livestock | 5% | Tier-2 (5%) |
| ILF | Emerging Markets | 5% | Tier-2 (5%) |
| FCG | Traditional Energy | 5% | Tier-2 (5%) |
| XLU | Utilities & Infrastructure | 5% | Tier-2 (5%) |
Trade Instructions — Monday Open
Sell the tranche from 2021-04-30 (completing its 4-week hold). Buy the new tranche. Instructions show net portfolio changes — same-asset positions cancel, weight changes show the delta.
| Action | Ticker | Instruction |
|---|---|---|
| SELL | FSOL | Sell 50% of FSOL position (reduce 25.00% → 12.50%) |
| SELL | WEAT | Sell 40% of WEAT position (reduce 6.25% → 3.75%) |
| SELL | XLE | Sell 25% of XLE position (reduce 5.00% → 3.75%) |
| SELL | SLV | Sell entire SLV position (1.25% of portfolio) |
| SELL | ITA | Sell 25% of ITA position (reduce 5.00% → 3.75%) |
| BUY | ILF | Buy ILF — 6.67% of freed cash (adds 1.25% to portfolio) |
| BUY | FBTC | Buy FBTC — 66.67% of freed cash (adds 12.50% to portfolio) |
| BUY | GLD | Buy GLD — 13.33% of freed cash (adds 2.50% to portfolio) |
| BUY | FCG | Buy FCG — 6.67% of freed cash (adds 1.25% to portfolio) |
| BUY | MOO | Buy MOO — 6.67% of freed cash (adds 1.25% to portfolio) |
Current Portfolio After Trade
Combined holdings across all 4 active tranches. Each tranche is 25% of the portfolio.
| Ticker | % of Portfolio | Weight Bar |
|---|---|---|
| FBTC | 37.50% | |
| FSOL | 12.50% | |
| COPX | 7.50% | |
| GLD | 6.25% | |
| URNM | 5.00% | |
| ILF | 5.00% | |
| XLE | 3.75% | |
| ITA | 3.75% | |
| FCG | 3.75% | |
| WEAT | 3.75% | |
| XLU | 2.50% | |
| PAVE | 2.50% | |
| MOO | 2.50% | |
| GDX | 1.25% | |
| IGF | 1.25% | |
| CIBR | 1.25% |
Macro Regime — Goldilocks
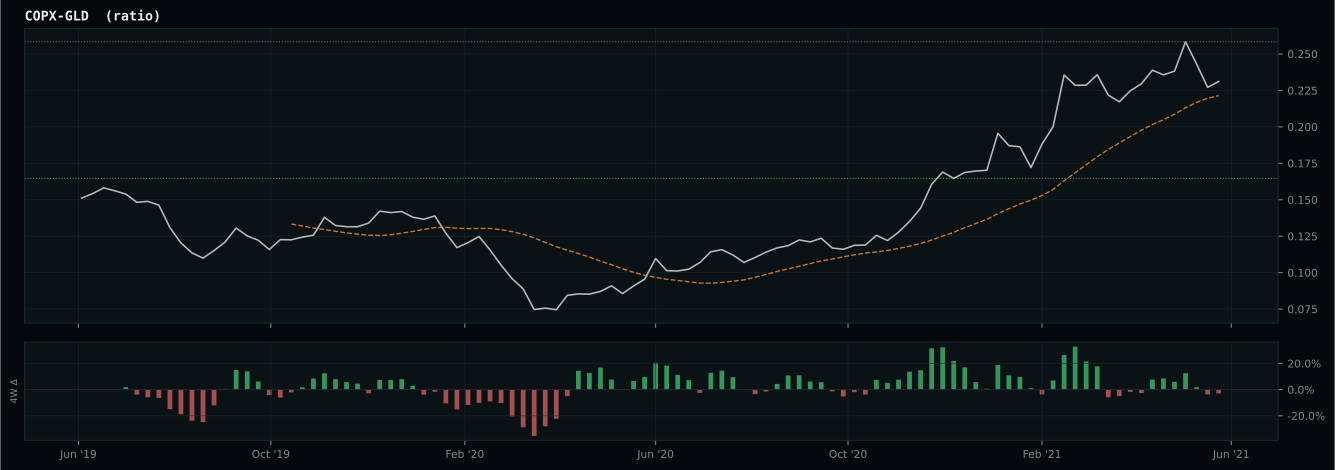
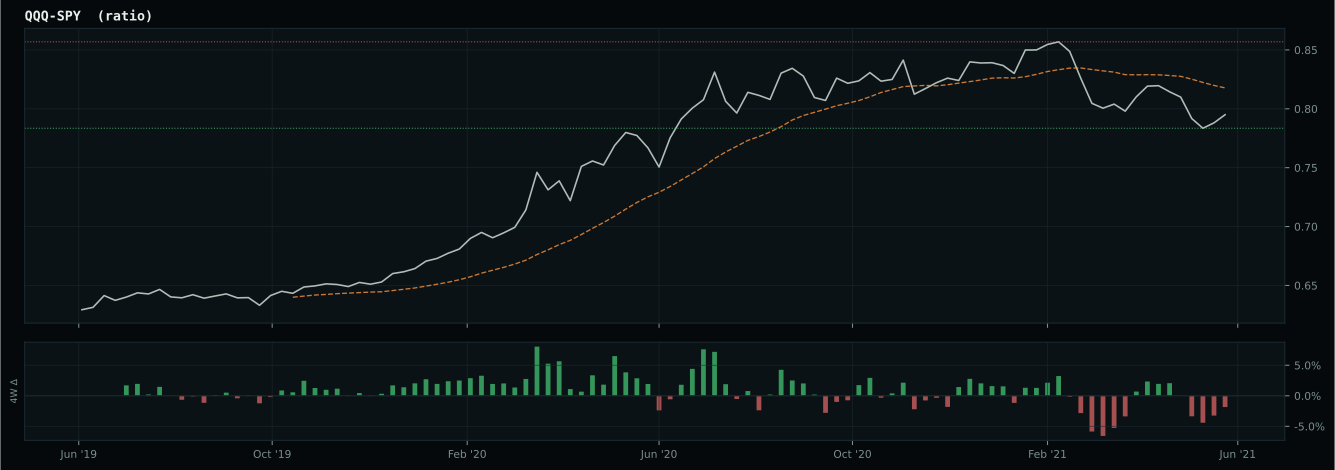
growth data is not confirming the weak market-implied risk appetite signal
Macro Evidence Charts
Market-implied signals behind the macro regime scores. Each ratio compares two assets; the direction and slope of the ratio is what the macro engine reads.
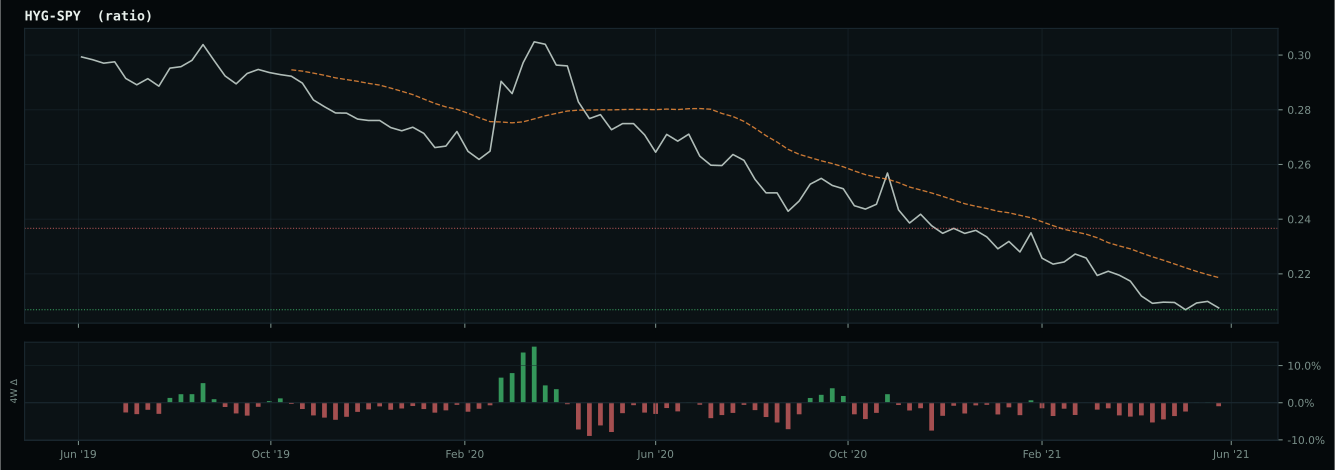
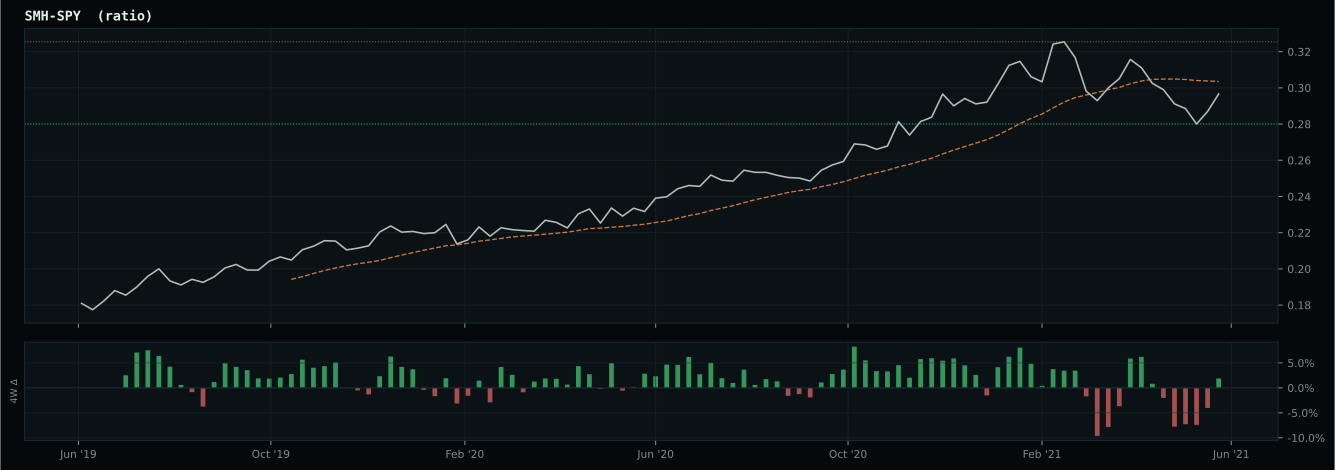
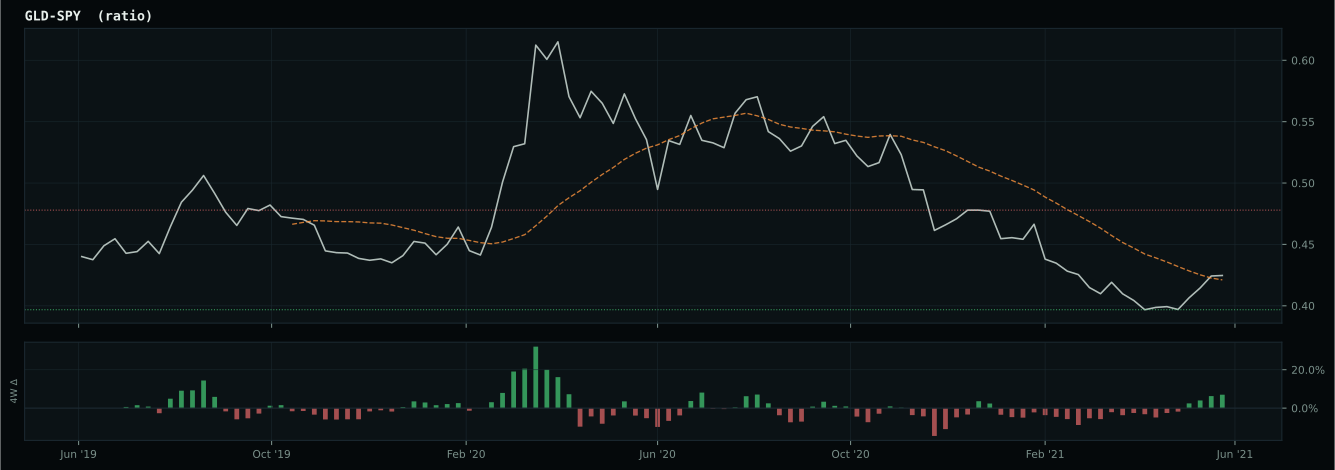
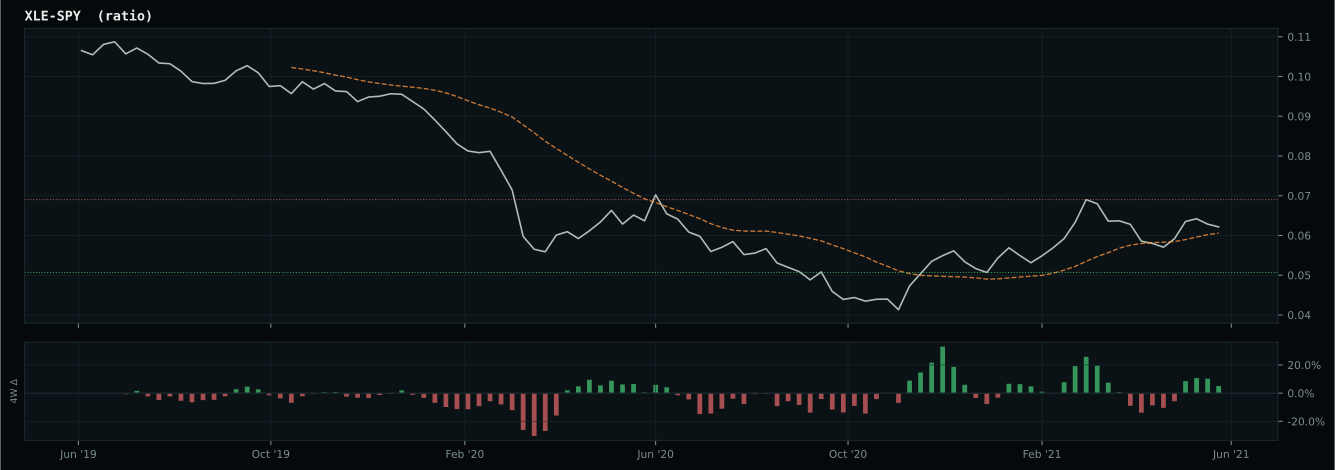
Crypto Regime — TrendBTC
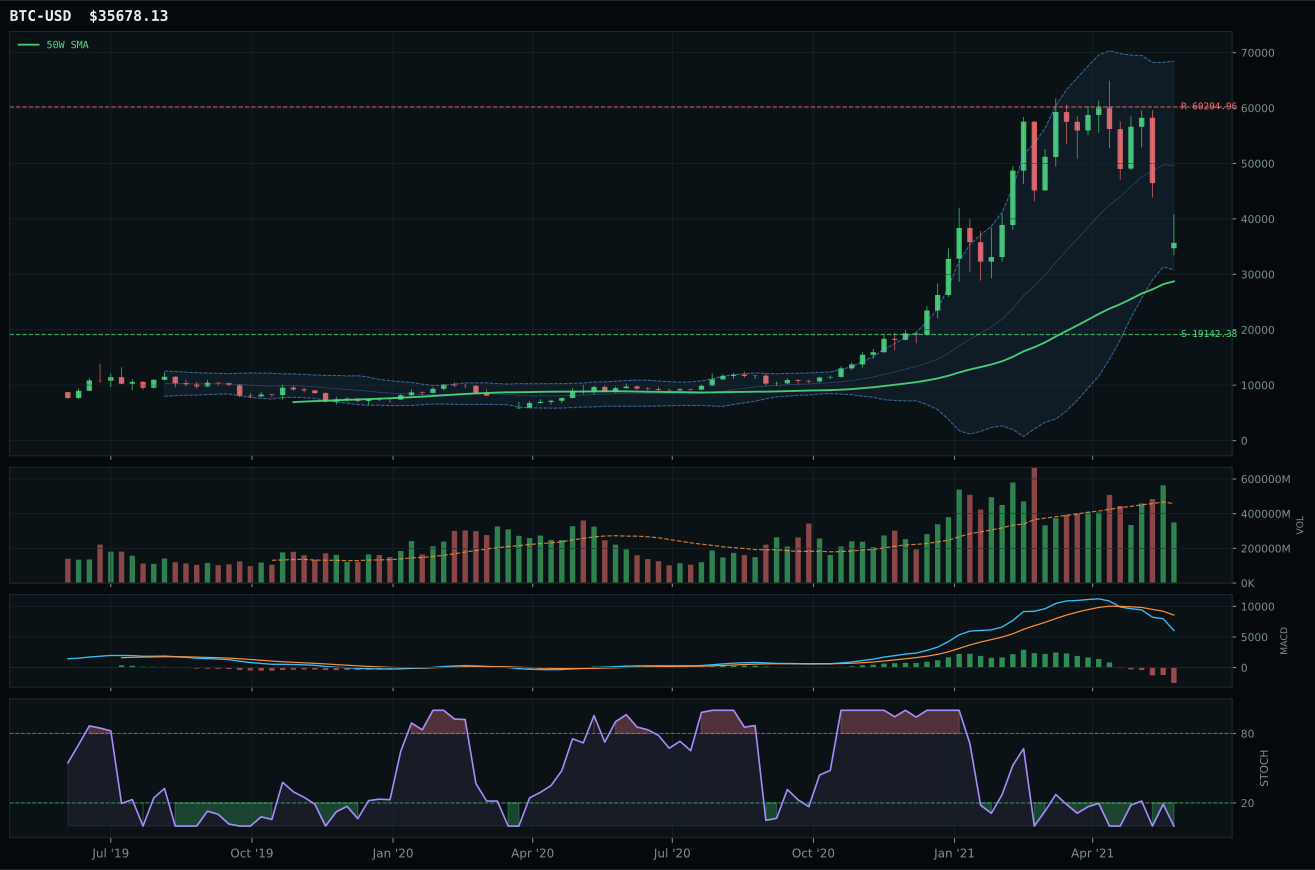
post-touch structure is too wide to count as a range; max/min close ratio is 8.87
TrendBTC confirmed: 2 consecutive closes above rising/flat 50W SMA
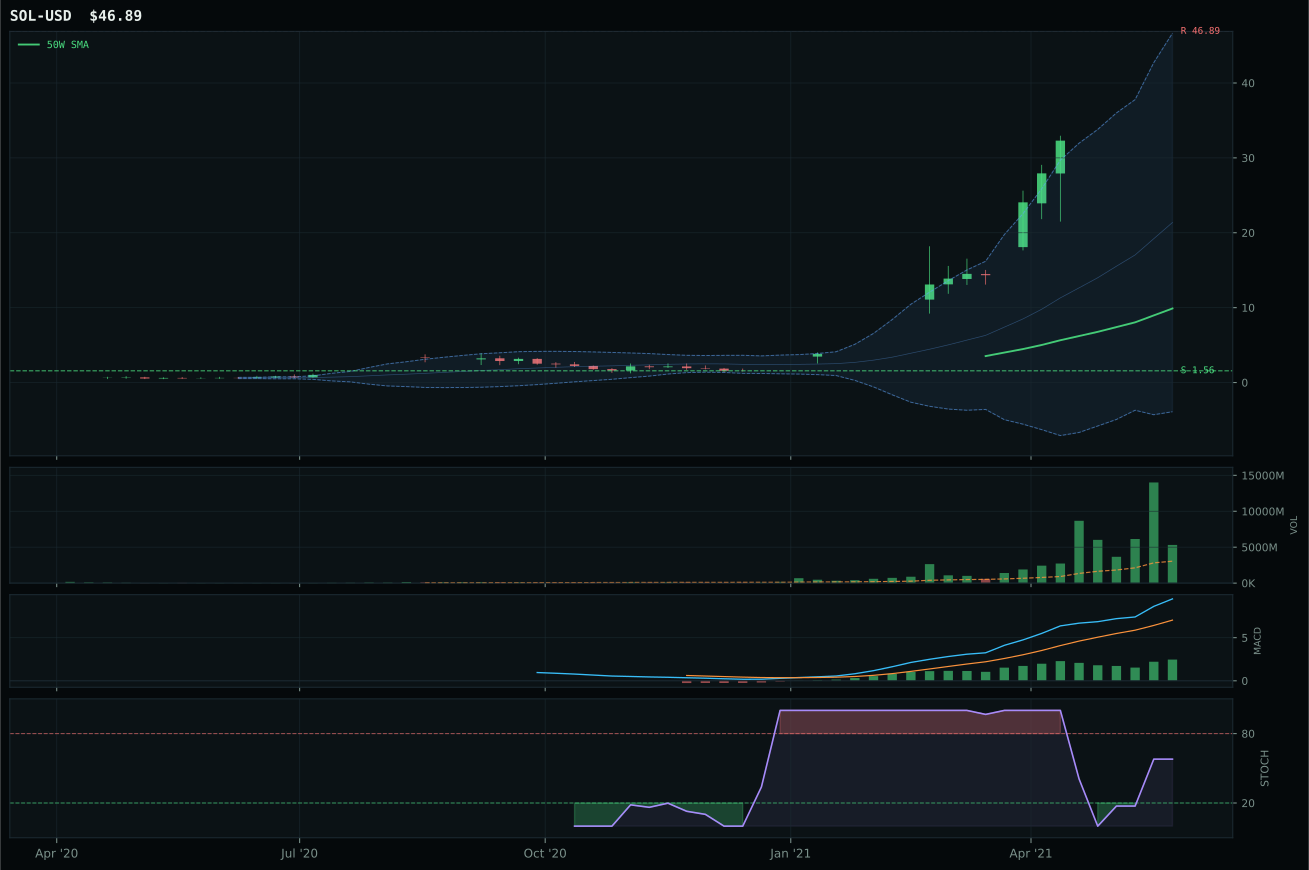
all available AltSeason conditions pass; missing optional confirmations skipped Macro gate failed, so AltSeason was downgraded.
Category Rankings
| Rank | Category | Winner | Score | Alloc | 4W Ret | Peers (4W) |
|---|---|---|---|---|---|---|
| 1 | Precious Metals | GLD | 61.7 | 20% | -6.76% | GDX -13.4% · SLV -8.2% |
| 2 | Industrial Metals | COPX | 56.4 | 20% | -10.25% | PICK -6.4% · REMX -1.7% |
| 3 | Nuclear Energy | URNM | 52.2 | 10% | -4.98% | URA -1.0% · NLR -2.7% |
| 4 | Technology | CIBR | 47.0 | 10% | +6.25% | XLK +4.9% · IGV +9.3% |
| 5 | Agriculture & Livestock | MOO | 47.0 | 10% | -2.03% | WEAT -4.4% · VEGI -3.7% |
| 6 | Emerging Markets | ILF | 46.4 | 10% | +1.14% | INDA -0.4% · IEMG -1.2% |
| 7 | Traditional Energy | FCG | 43.8 | 10% | +11.56% | XLE +3.5% · XOP +8.8% |
| 8 | Utilities & Infrastructure | XLU | 39.4 | 10% | -1.64% | IGF -2.2% · PAVE -3.1% |
| 9 | Defense & Aerospace | ITA | 35.4 | 0% | +0.71% | XAR +4.9% · ROKT +5.5% |
| 10 | AI | SMH | 35.2 | 0% | +1.82% | BOTZ +2.0% · AIQ +4.2% |
Precious Metals — GLD
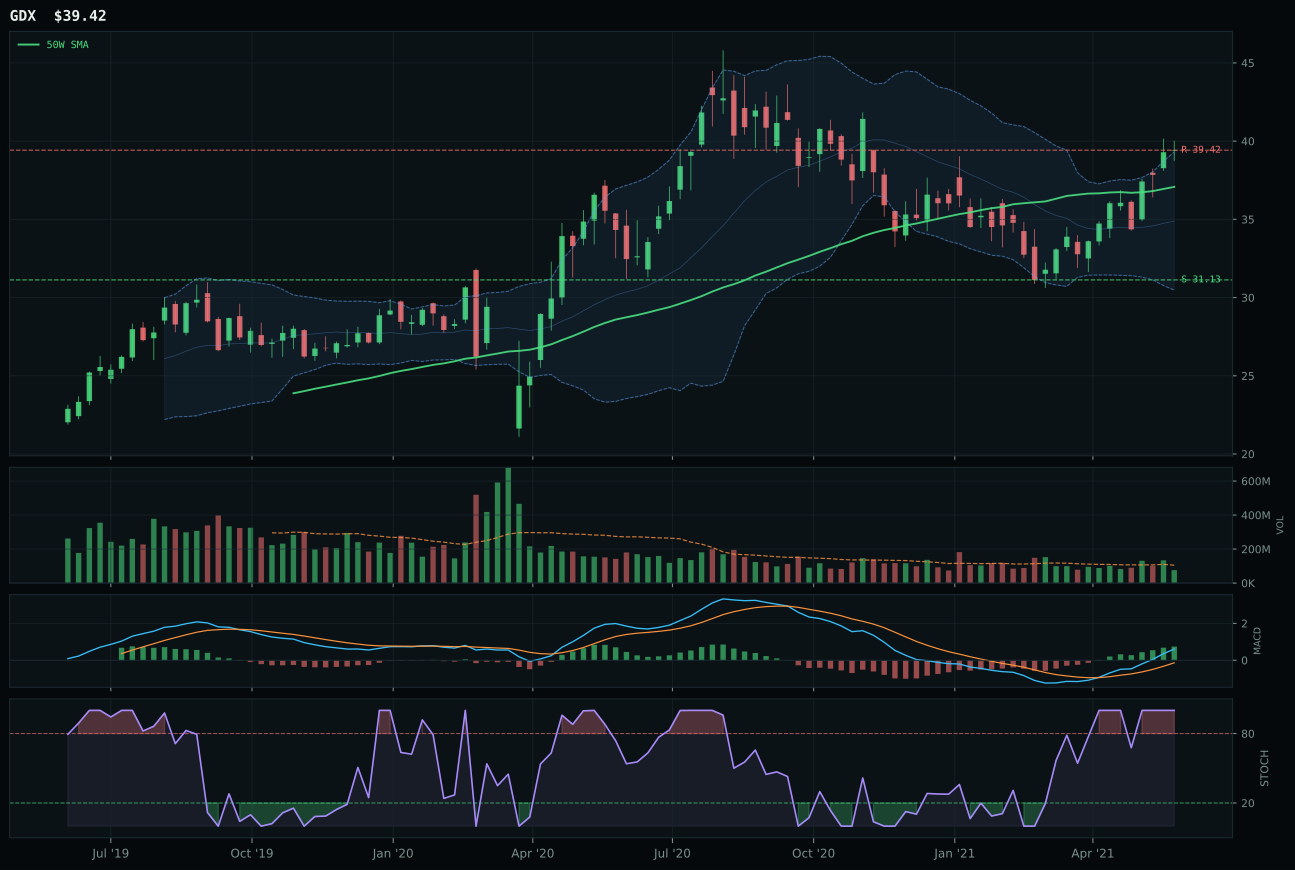
GDX has a neutral structure profile with 16.2% 13-week relative strength versus SPY.
A failed hold above support would weaken the setup.
Actionable but governed by invalidation levels.
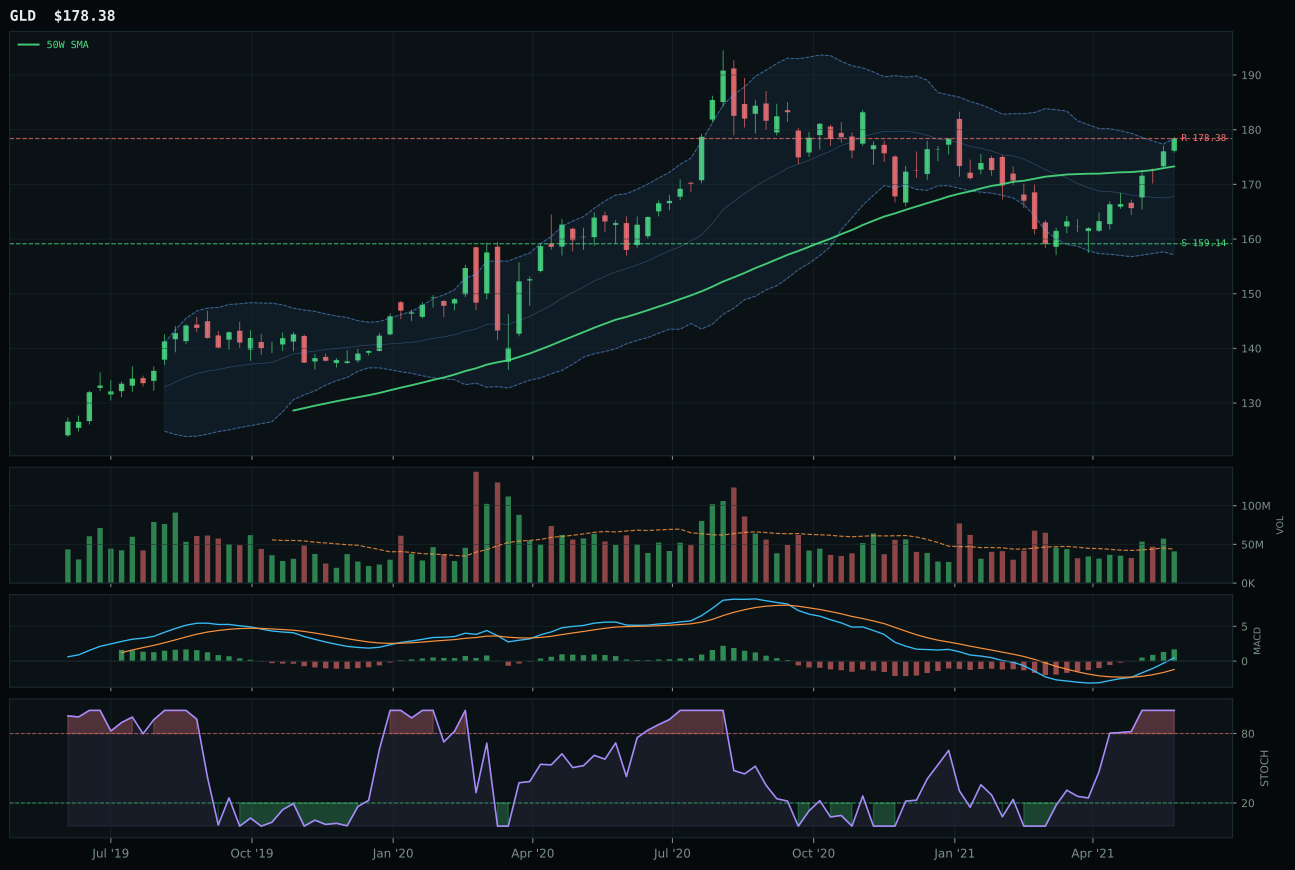
GLD has a compression near 50W profile with -0.2% 13-week relative strength versus SPY.
A failed hold above support would weaken the setup.
Actionable but governed by invalidation levels.
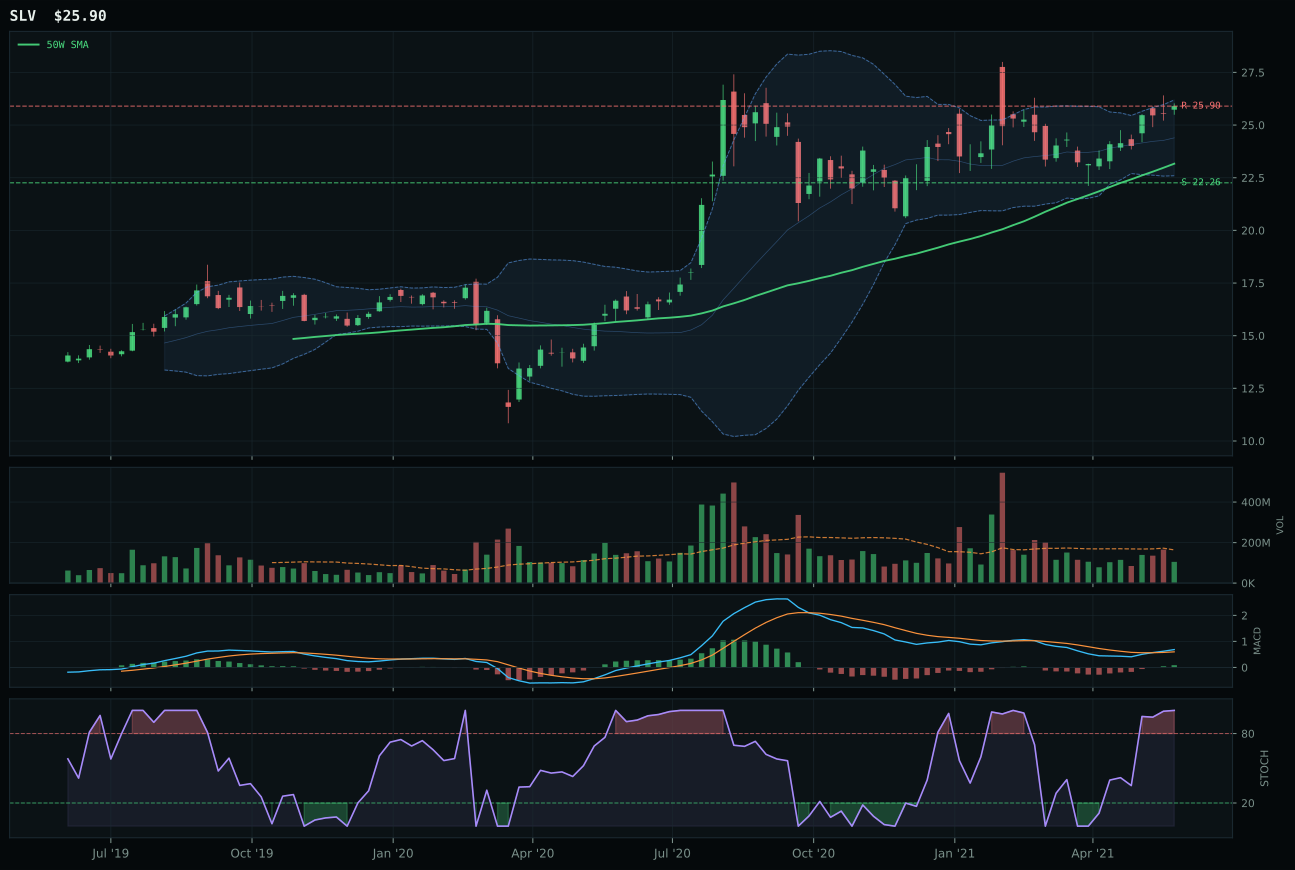
SLV has a neutral structure profile with -5.4% 13-week relative strength versus SPY.
A failed hold above support would weaken the setup.
Actionable but governed by invalidation levels.
GLD earns top-2 status by defeating GDX despite GDX posting higher technical evidence (87.9 vs 83.4) because GLD's compression near the 50-week and perfect 100.0 timing score create a cleaner entry than GDX's neutral structure and 82.0 timing penalty. GLD sits 2.9% from the 50-week with bullish, improving MACD and overbought stochastic—textbook setup for a decision point—whereas GDX is 11.3% extended at upper retracement levels with thin volume (0.68x average), meaning fresh capital must pay a premium. The gold representative's 0.0% category-relative strength matches GDX's 16.4%, yet GLD's 10.2% 13-week return proves sufficient when paired with perfect trend and timing scores. Volume confirmation and persistence both favor GLD at 72.2 and 66.6 versus GDX's lower scores, confirming that the monetary hedge is being accumulated methodically rather than squeezed higher.
Precious Metals scores 61.7 and earns a top-two allocation of 20%, making it one of only two categories fully funded this week. The category's technical evidence of 83.4 for GLD is second only to Utilities' XLU at 70.1, and macro fit of 50.0 is neutral—neither tailwind nor headwind. That neutrality is actually the point: in a Goldilocks environment where credit stress is active at minus-seven but offset by zero commodity-specific pressure, gold's monetary insurance premium holds steady. GLD's trend of 99.7, timing of 100.0, and momentum confirmation of 84.7 create the highest technical setup in the entire portfolio after excluding extended outliers. The category ranks second at 61.7 because Industrial Metals at 56.4 offers comparable real-asset sponsorship with stronger commodity breadth and metals scarcity tailwinds. Yet GLD's neutral SPY-relative strength of negative 0.2% and its positioning at the decision zone mean this is a defensive allocation: you own GLD not for explosive upside but for portfolio ballast when broad market bear stays active. The 10% allocation reflects GLD's role as dry powder in a compressed setup that can expand either direction.
Industrial Metals — COPX
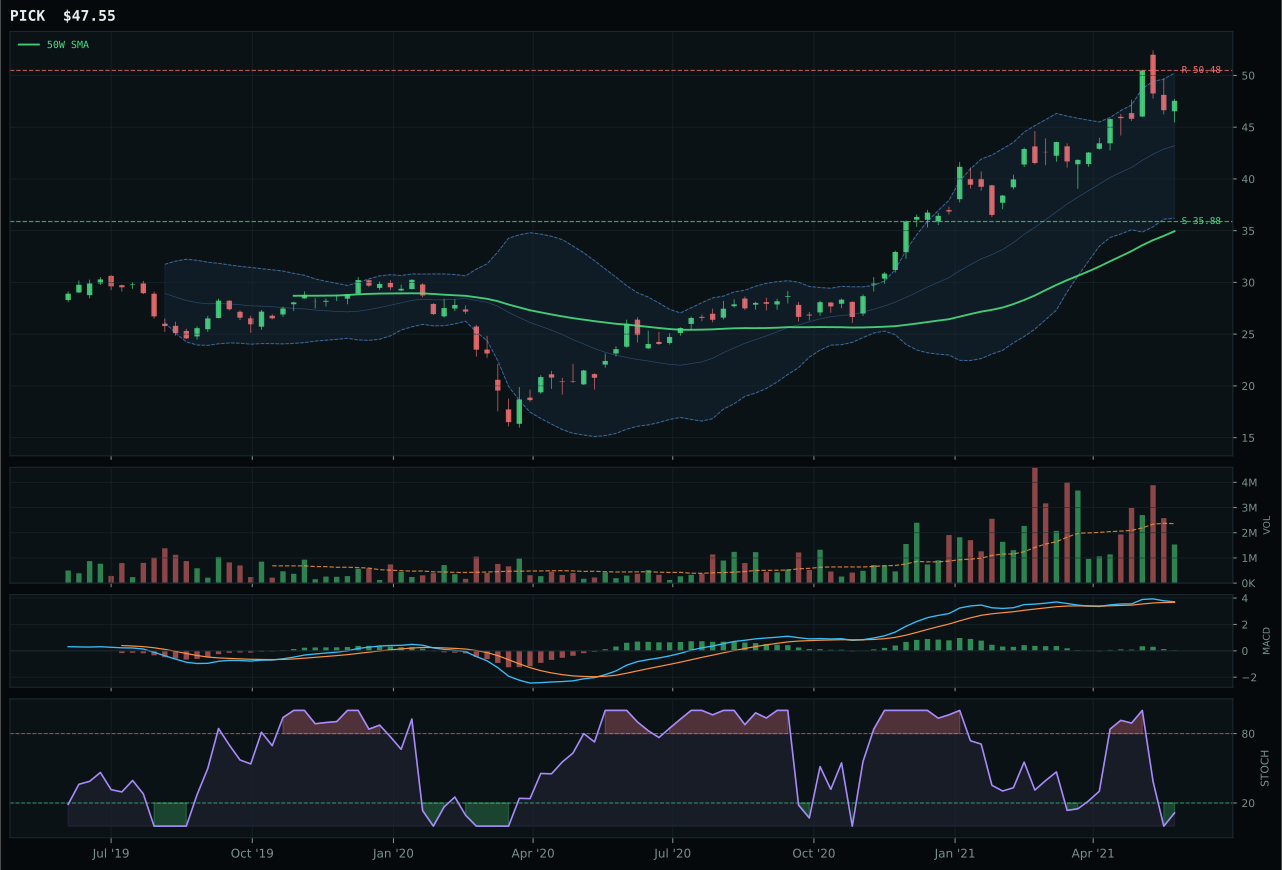
PICK has a vertical extension profile with 4.0% 13-week relative strength versus SPY.
A failed hold above support would weaken the setup.
Actionable but governed by invalidation levels.
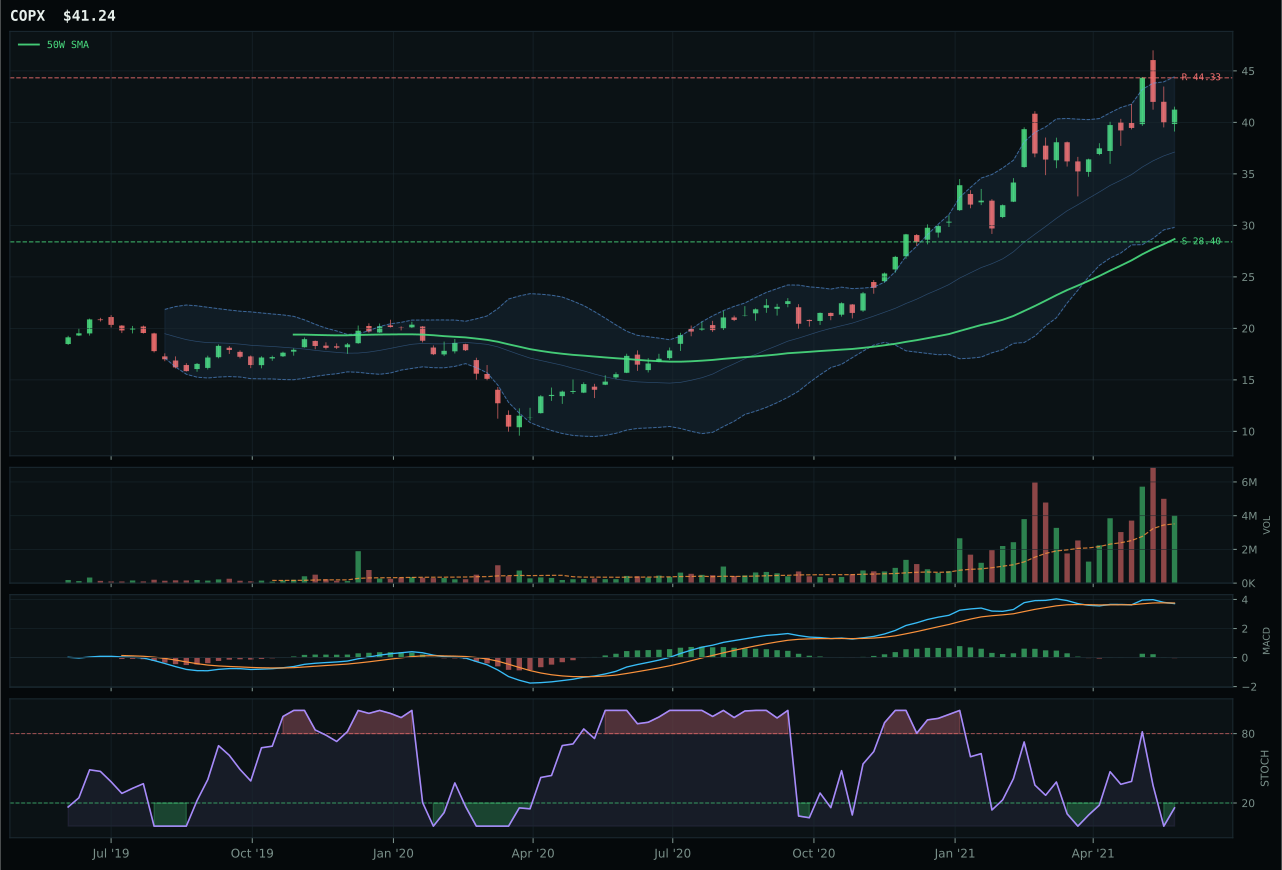
COPX has a vertical extension profile with 1.1% 13-week relative strength versus SPY.
A failed hold above support would weaken the setup.
Actionable but governed by invalidation levels.
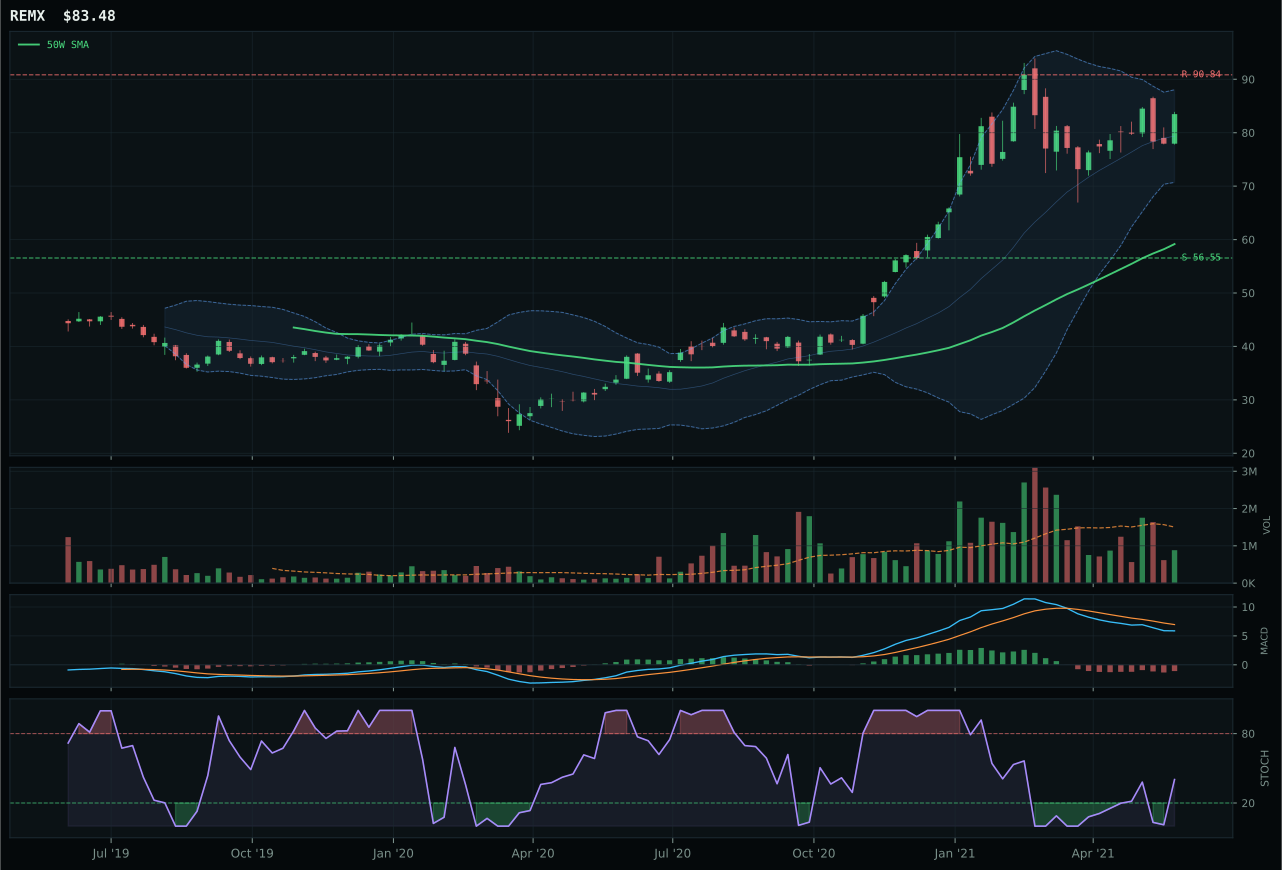
REMX has a vertical extension profile with -10.2% 13-week relative strength versus SPY.
A failed hold above support would weaken the setup.
Actionable but governed by invalidation levels.
COPX wins the category despite PICK posting superior technical evidence (56.8 vs 40.6) because COPX's 1.14x above-average volume participation vastly exceeds PICK's thin participation, and copper's macro narrative (metals scarcity +12, commodity breadth +7) outweighs diversified mining breadth on category-relative grounds. The copper specialist is extended 43.8% above the 50-week—an extreme entry price—yet its 11.5% 13-week return and 1.1% SPY-relative strength prove that industrial buyers are not deterred by valuation. PICK's bullish but flattening MACD and slightly higher RS versus SPY (4.0% vs 1.1%) suggest mining stocks are a mean-reversion mean, whereas COPX's MACD bearish/weakening indicates that copper strength is demand-driven, not oversold. The 9.5-point category score gap reflects COPX's volume sponsorship dominance over PICK's cleaner technical setup.
Industrial Metals scores 56.4 and earns a top-two allocation of 20%, ranking second among all ten categories behind only Precious Metals. The category's macro fit of 79.0 is the portfolio's highest, driven by metals scarcity at plus-fourteen, commodity breadth positive at plus-ten, and Goldilocks environment at plus-six, offset only by credit stress at minus-seven. COPX's macro/narrative fit of 69.0 directly reflects those strong commodity and scarcity tailwinds, which outweigh the negative technicals of extension and poor risk-reward at 47.8. In a regime where EM liquidity support is active and real asset sponsorship is measurable, industrial metals' fundamental demand case overrides the normal penalty for buying twenty-point extended moves. The thirteen-week return of 11.5% and category-relative strength of 0.0% are respectable if not spectacular, but the portfolio is allocating 20% to Industrial Metals because the macro regime itself—specifically the scarcity narrative in a recovery environment—is the alpha. COPX would break into a 10% allocation if volume rose above 1.35x average and MACD crossed back to bullish slope; until then, the current 20% represents conviction that commodity demand is structural, not just a bounce.
Nuclear Energy — URNM
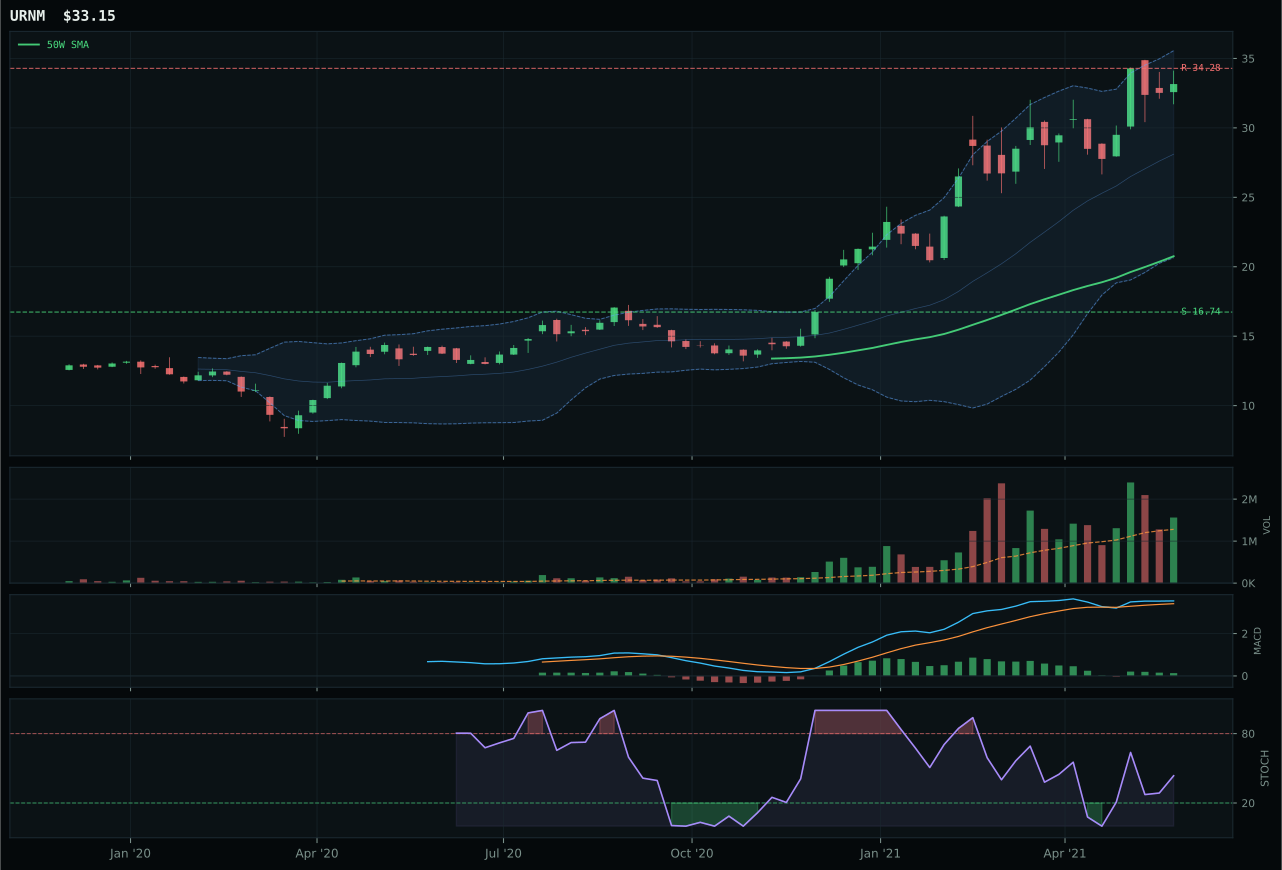
URNM has a vertical extension profile with 13.7% 13-week relative strength versus SPY.
A failed hold above support would weaken the setup.
Actionable but governed by invalidation levels.
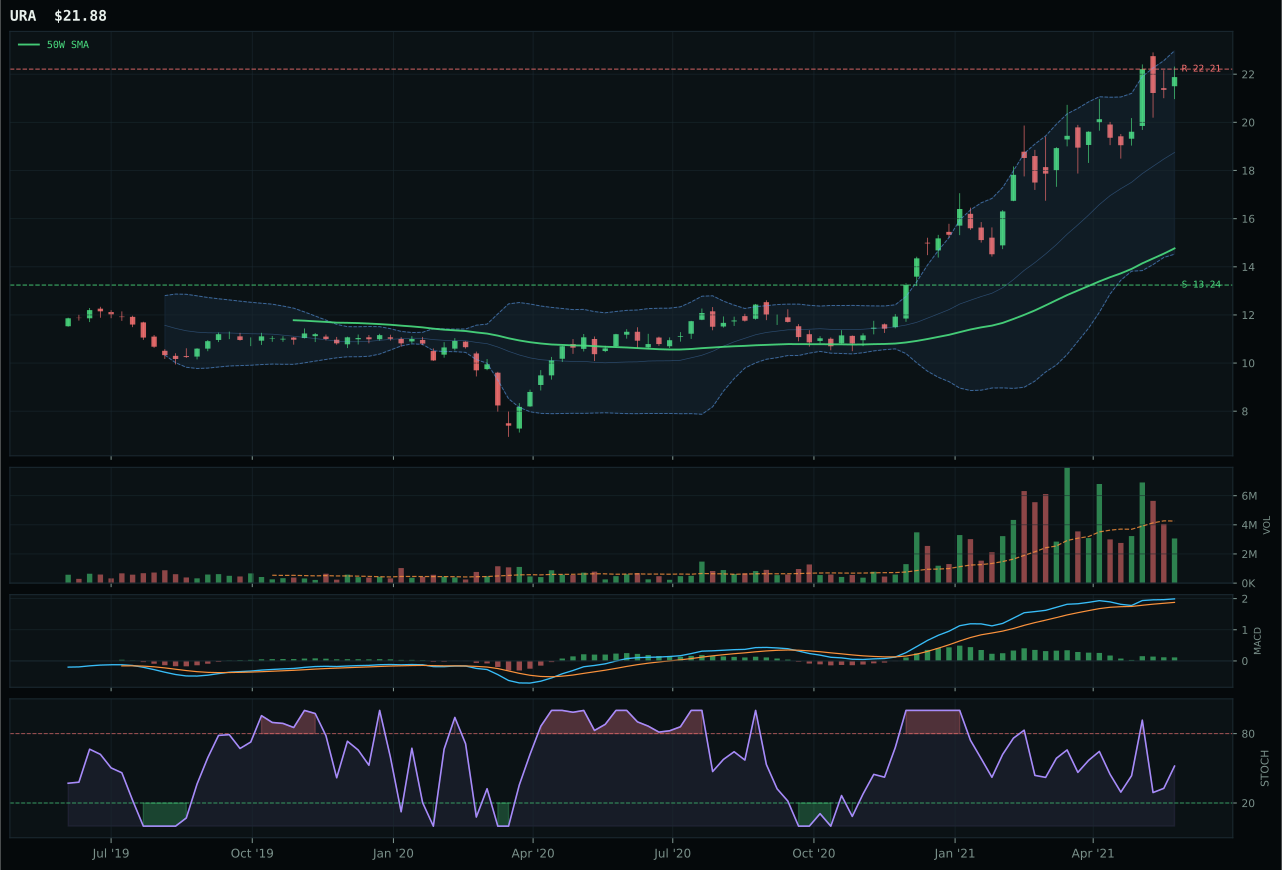
URA has a vertical extension profile with 14.6% 13-week relative strength versus SPY.
A failed hold above support would weaken the setup.
Actionable but governed by invalidation levels.
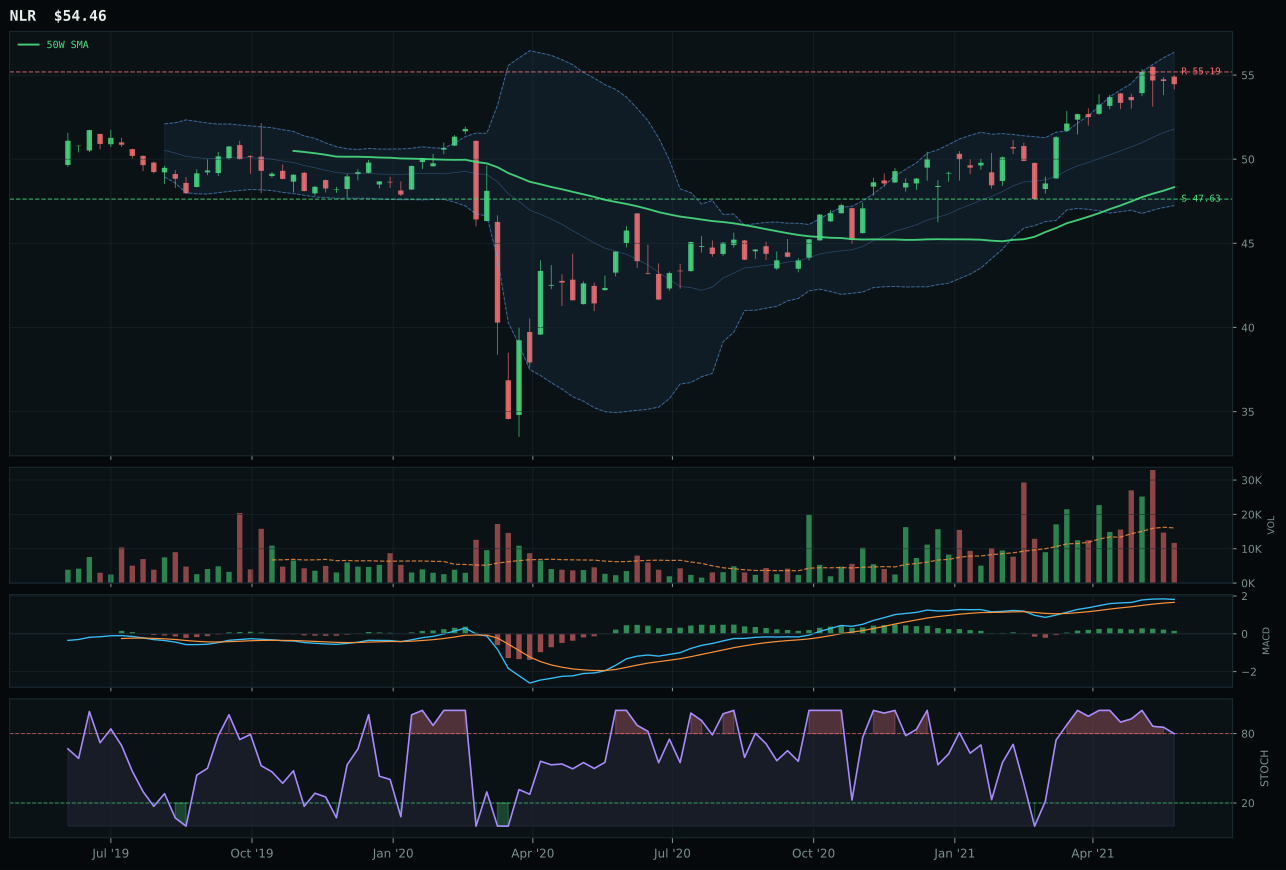
NLR has a neutral structure profile with 3.9% 13-week relative strength versus SPY.
A failed hold above support would weaken the setup.
Tracked, but not top-2 eligible because: .
URNM wins the category with a 52.2 final score despite URA posting superior technical evidence (60.5 vs 73.2) because URNM's 1.22x above-average volume participation provides institutional sponsorship that URA's thin participation (0.73x) cannot match. Uranium-miner beta is extended 59.7% above the 50-week with 24.1% 13-week returns and +13.7% SPY-relative strength—extraordinary momentum—yet URNM's above-average volume confirms the move is being accumulated, not distributed. URA's technical superiority in trend (100 vs 80) and risk/reward (37 vs 23) reflects a cleaner 14.6% extension, but the thin participation signal suggests URA is held by passive index flows rather than accumulating institutions. URNM's 69.4 volume-price confirmation and 90.8 persistence scores—the highest in the portfolio—prove that this extended rally has real buying power behind it, making it the category leader despite worse entry timing.
Nuclear Energy scores 52.2 and earns 5% allocation, ranking fifth among the ten categories. The category's technical evidence of 73.2 for URNM is impressive, but macro fit of 52.0 sits neutral—real asset sponsorship at plus-seven offsets credit stress at minus-five and risk appetite broken at minus-four. What pushes Nuclear into the portfolio despite weaker macro support is the thirteen-week return of 24.1%, which trails only Defense & Aerospace and URNM's absolute momentum strength. The 59.7% extension from the fifty-week moving average is extreme and volume confirmation becomes the category's lifeline; at 1.22x average, that volume is enough to keep the move credible despite poor risk-reward. URNM holds a 5% slot as a tactical position into energy transition demand, not as a core position. The portfolio would cut this to 0% if volume dropped below 0.95x average or if stochastic RSI rolled below 0.35; conversely, a volume push above 1.4x average with close above 30 would promote this to 10%. Until then, Nuclear sits as the fourth-tier momentum play, outranked by stronger macro fits but held due to absolute return confirmation.
Technology — CIBR
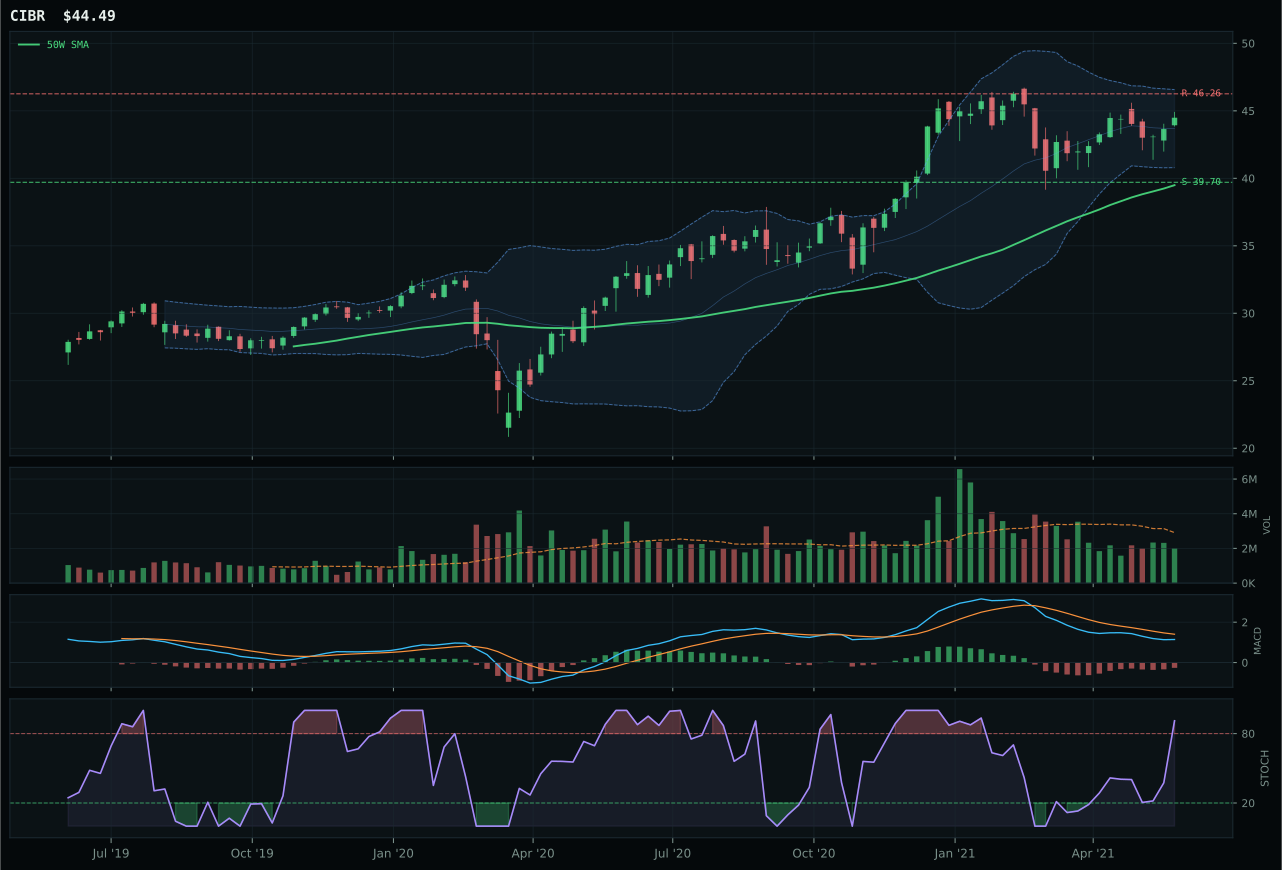
CIBR has a neutral structure profile with -5.0% 13-week relative strength versus SPY.
A failed hold above support would weaken the setup.
Actionable but governed by invalidation levels.
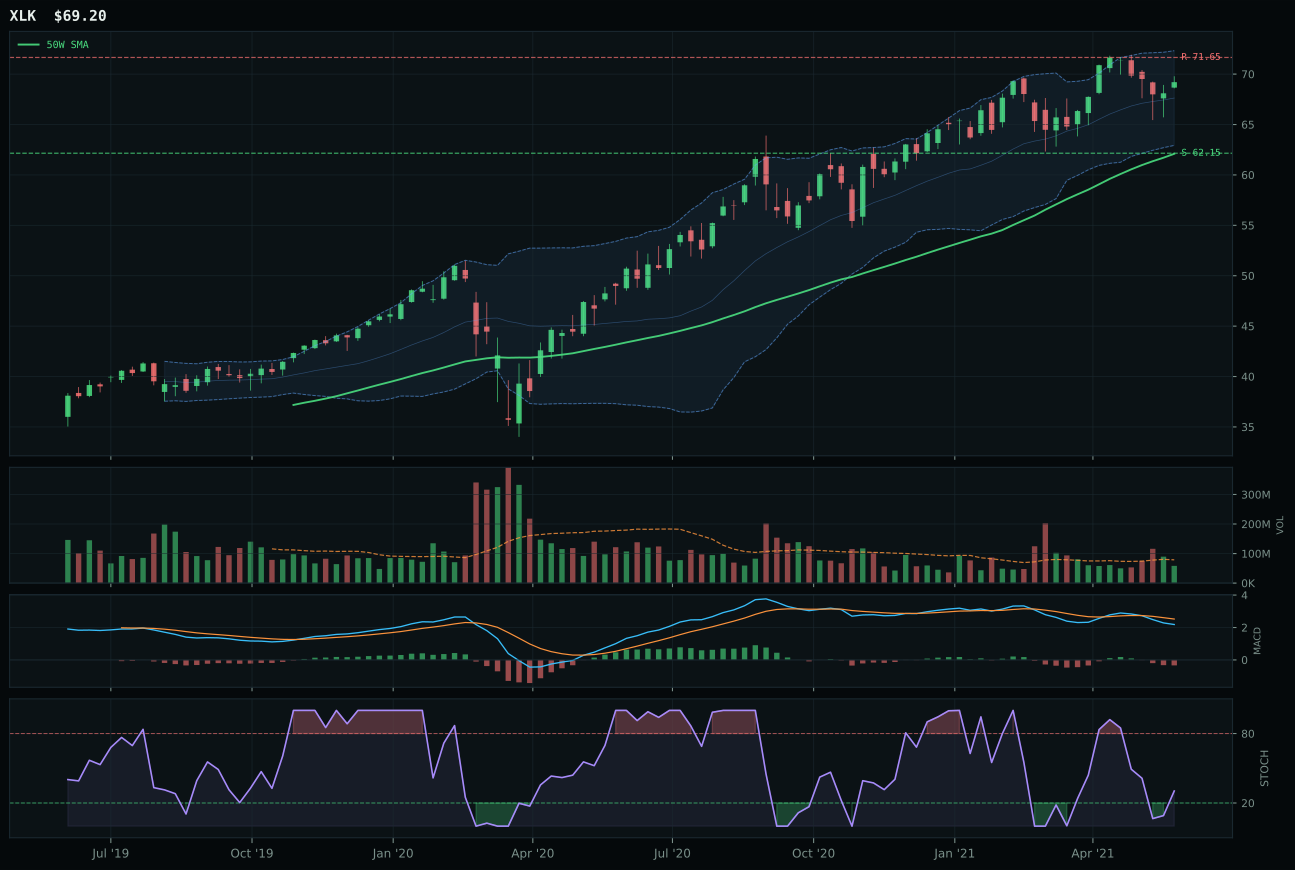
XLK has a neutral structure profile with -4.5% 13-week relative strength versus SPY.
A failed hold above support would weaken the setup.
Actionable but governed by invalidation levels.
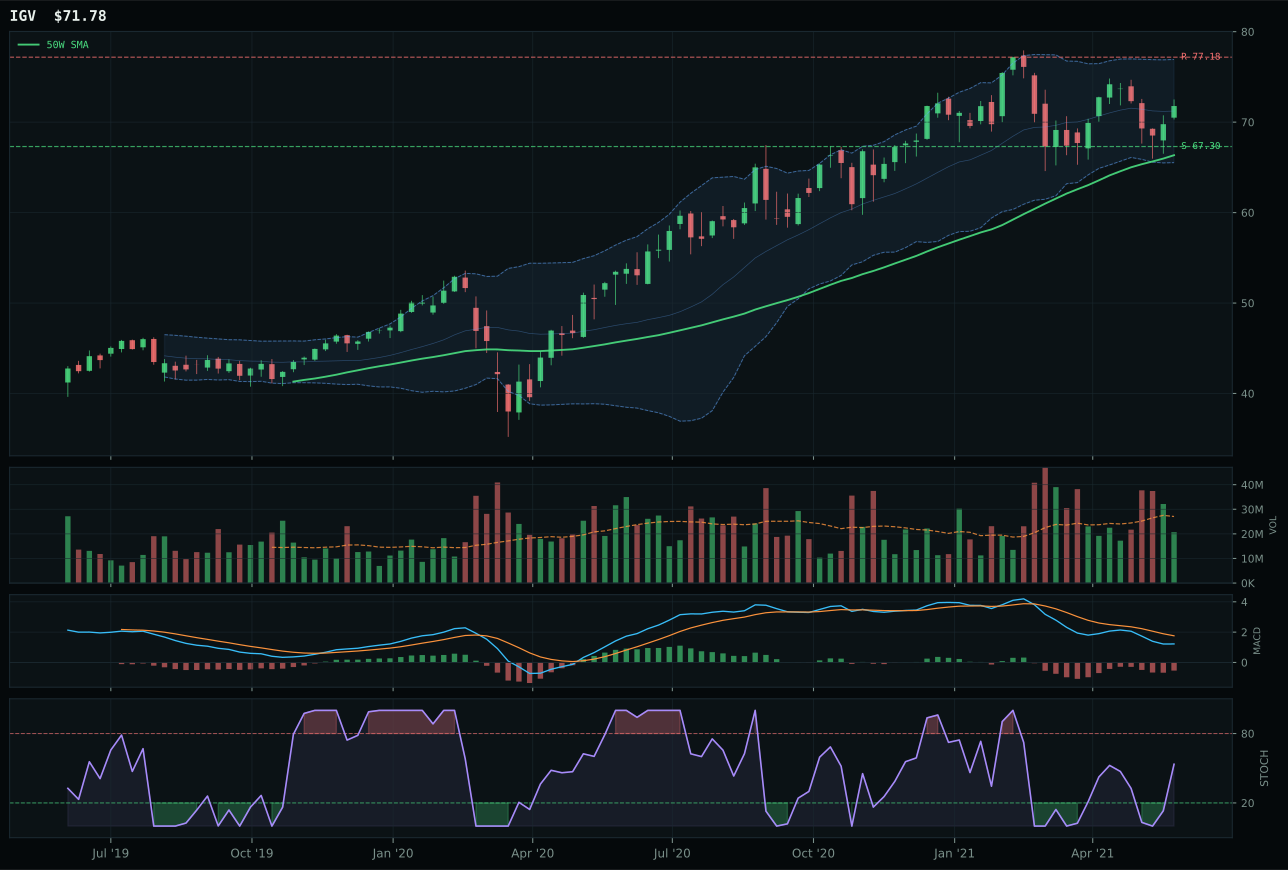
IGV has a neutral structure profile with -9.2% 13-week relative strength versus SPY.
A failed hold above support would weaken the setup.
Actionable but governed by invalidation levels.
CIBR wins the category with a 5.8-point margin over XLK because its MACD is bearish but improving while XLK's MACD is deteriorating, and cybersecurity maintains neutral structure with cleaner technical conditions despite both sitting in the upper retracement zone. The cybersecurity specialist scores 68 on composite evidence versus XLK's 62, driven by superior momentum confirmation (45.2 vs 28) and slightly better volume-price confirmation (55.3 vs 40). Both ETFs are extended 12.6% and face identical headwinds: thin participation, SPY-relative weakness around -5%, and a broad market bear macro regime that penalizes growth. The deciding factor is MACD trajectory—CIBR's improving status suggests institutional accumulation despite thin volume, whereas XLK's weakening MACD signals distribution into strength.
Technology scores 47.0 and earns a 5% slot, placing it outside the portfolio's top-two allocation tiers and below six stronger categories. The category's macro fit of 52.0 sits neutral: Goldilocks environment adds nine points of support, but active credit stress and broad market bear descriptors each subtract five to seven points. What hurts here is not the technicals of CIBR itself—which shows respectable trend strength of 85.5 and timing of 67—but the category's overall volume-price confirmation of 55.3 and weak momentum persistence of 57.1. With thirteen-week returns lagging at 5.4% and SPY-relative strength negative five points, technology lacks the real-asset sponsorship and commodity-breadth tailwinds pushing metals and energy into the top two. A break of resistance at 46.26 on CIBR with volume pickup to 0.85x average or better would open the door to a promotion; until then, this 5% holding stays in the rotational reserve.
Agriculture & Livestock — MOO
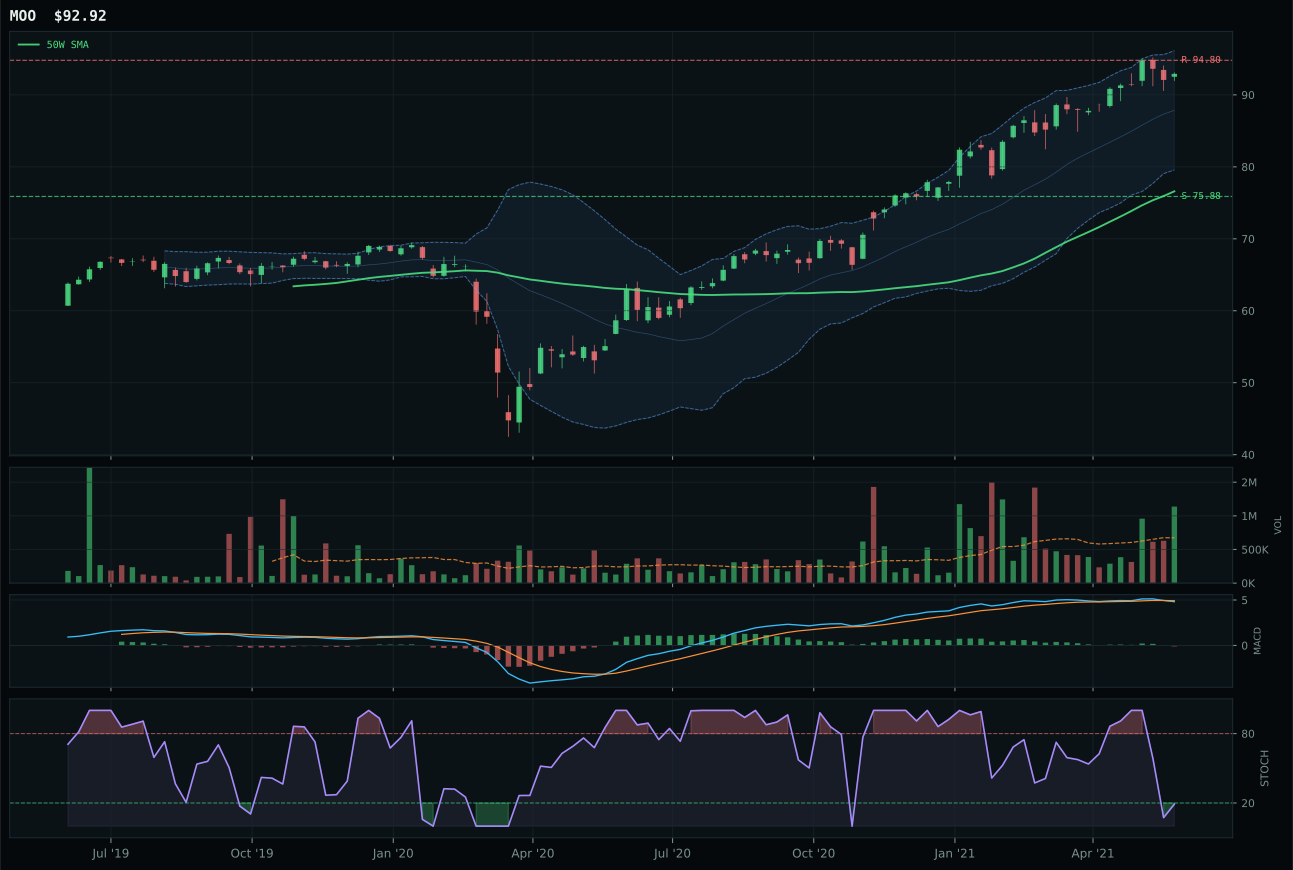
MOO has a vertical extension profile with -0.8% 13-week relative strength versus SPY.
A failed hold above support would weaken the setup.
Actionable but governed by invalidation levels.
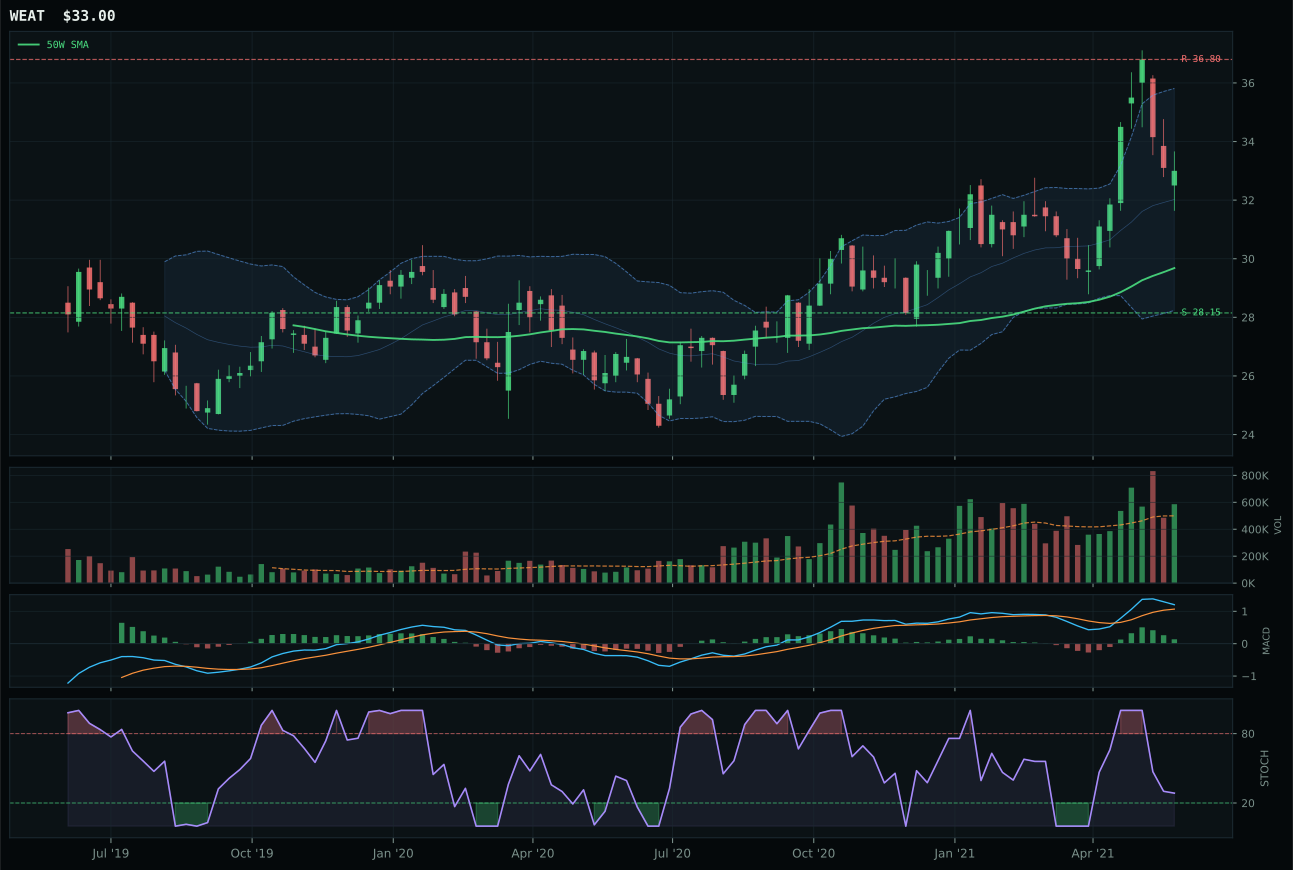
WEAT has a neutral structure profile with -5.5% 13-week relative strength versus SPY.
A failed hold above support would weaken the setup.
Actionable but governed by invalidation levels.
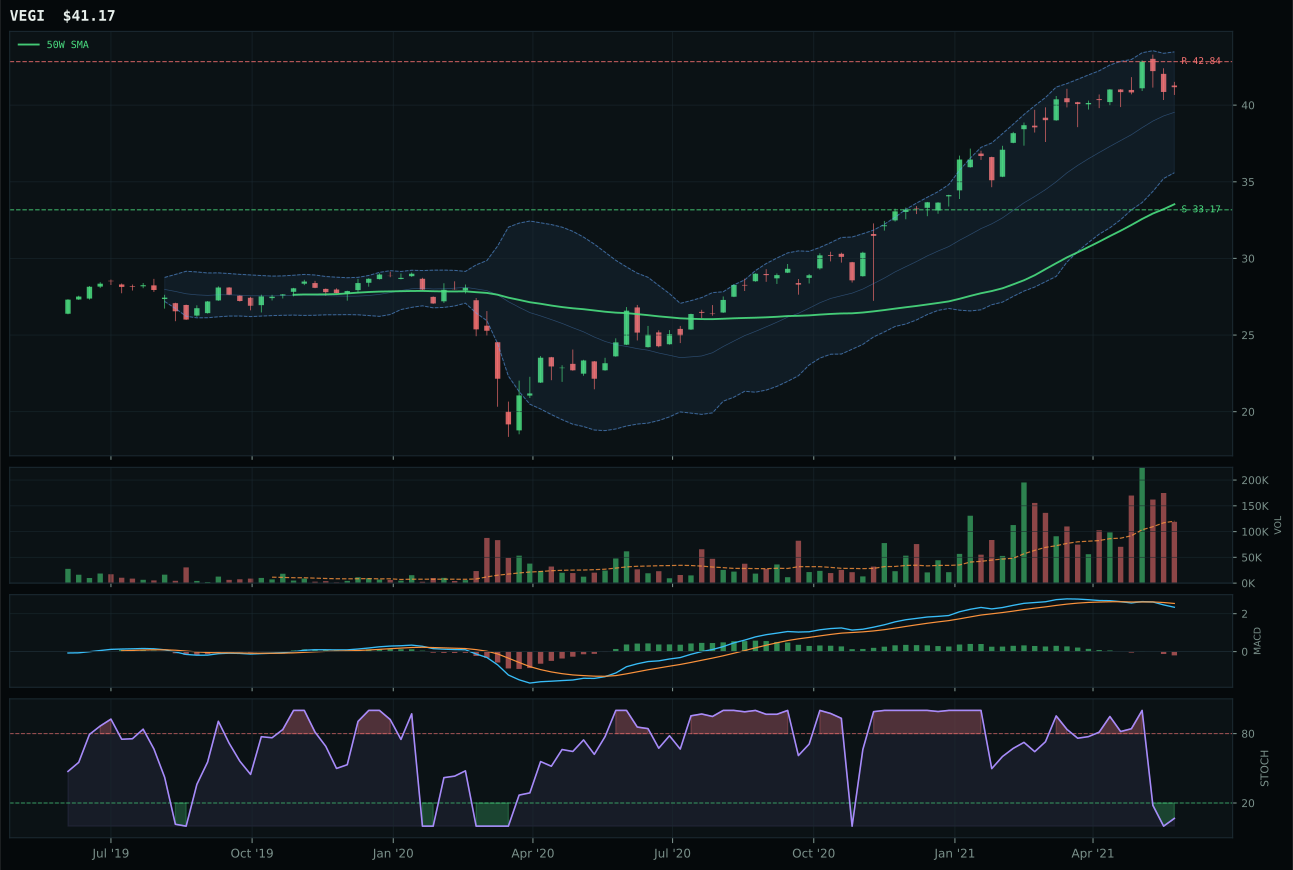
VEGI has a vertical extension profile with -3.6% 13-week relative strength versus SPY.
A failed hold above support would weaken the setup.
Tracked, but not top-2 eligible because: .
MOO wins with a 47.0 category score despite WEAT posting a higher composite 65, because MOO's 1.69x accumulation/confirmation volume far exceeds WEAT's 1.48x above-average participation, and the agribusiness representative's category-relative strength of 2.8% beats WEAT's 1.9%. Both are extended 21-22% above the 50-week, yet MOO's stochastic RSI oversold at 0.19 signals mean-reversion potential in a market where oversold conditions are rare, whereas WEAT's falling/neutral stochastic suggests distribution into strength. The structure gap (81.6 vs 70.0) reflects MOO's superior compression characteristics (85.4 vs 67.2), meaning its extended move has tighter ranges—a sign of institutional accumulation rather than retail chase.
Agriculture & Livestock scores 47.0 and earns 5% allocation, placing it in the rotational tier alongside Technology and Utilities. The category's macro fit of 63.0 is the highest among non-top-two positions due to real asset sponsorship at plus-eight and commodity breadth positive at plus-five, which pulls the category toward strength even as broad market bear drags it down by three. MOO's technical evidence of 60.9 is solid but not dominant, yet the volume-price confirmation of 60.9 and persistence of 57.3 indicate the move has structural support. What differentiates this allocation: the thirteen-week return of 9.6% substantially exceeds Technology's 5.4%, and the category's macro tailwinds from commodity and real-asset demand are active and measurable. The 21.3% extension from the fifty-week moving average is concerning, but accumulated volume at 1.69x average mitigates entry risk more than SMH's neutral volume does. For a 5% portfolio slot, MOO offers better macro alignment than Tech while maintaining respectable technical momentum confirmation.
Emerging Markets — ILF
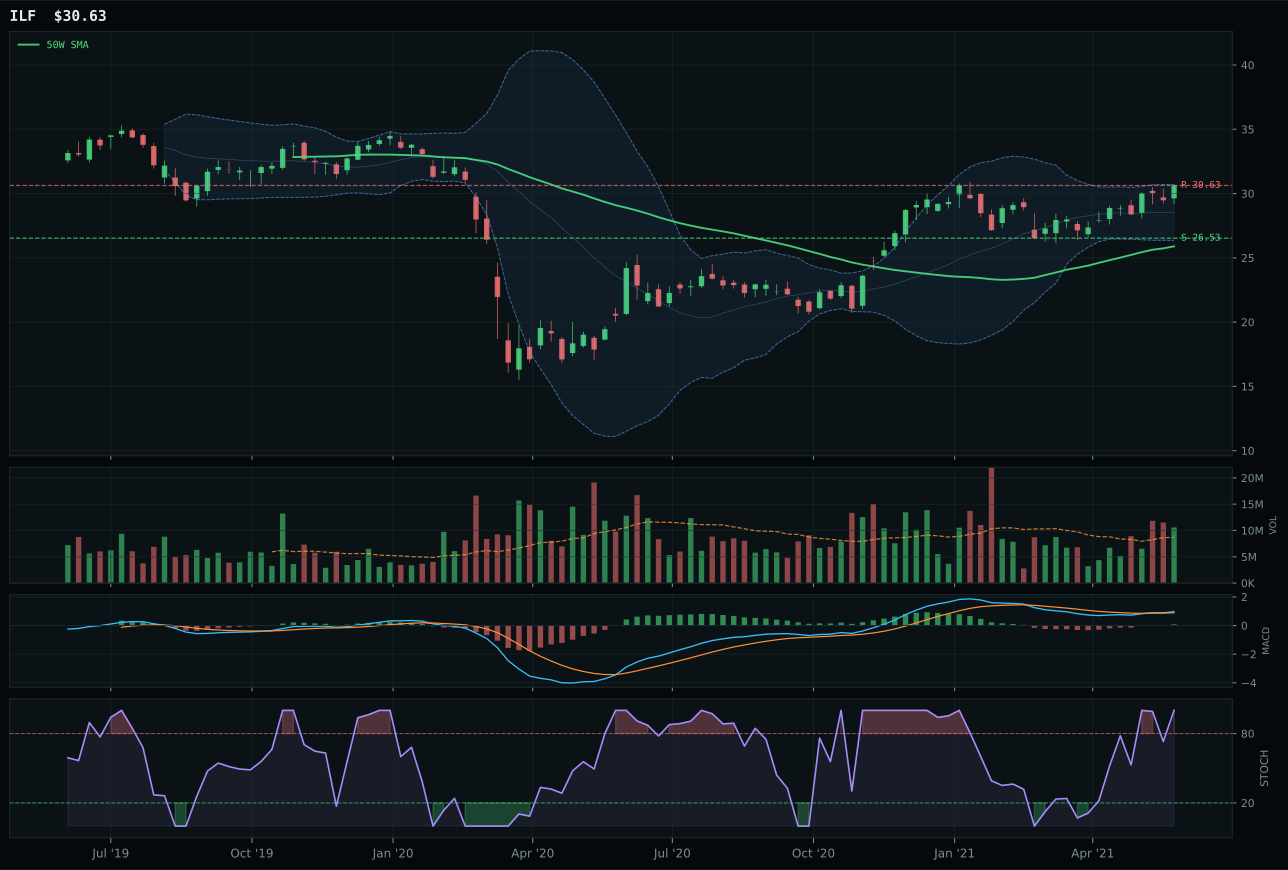
ILF has a vertical extension profile with 5.0% 13-week relative strength versus SPY.
A failed hold above support would weaken the setup.
Actionable but governed by invalidation levels.
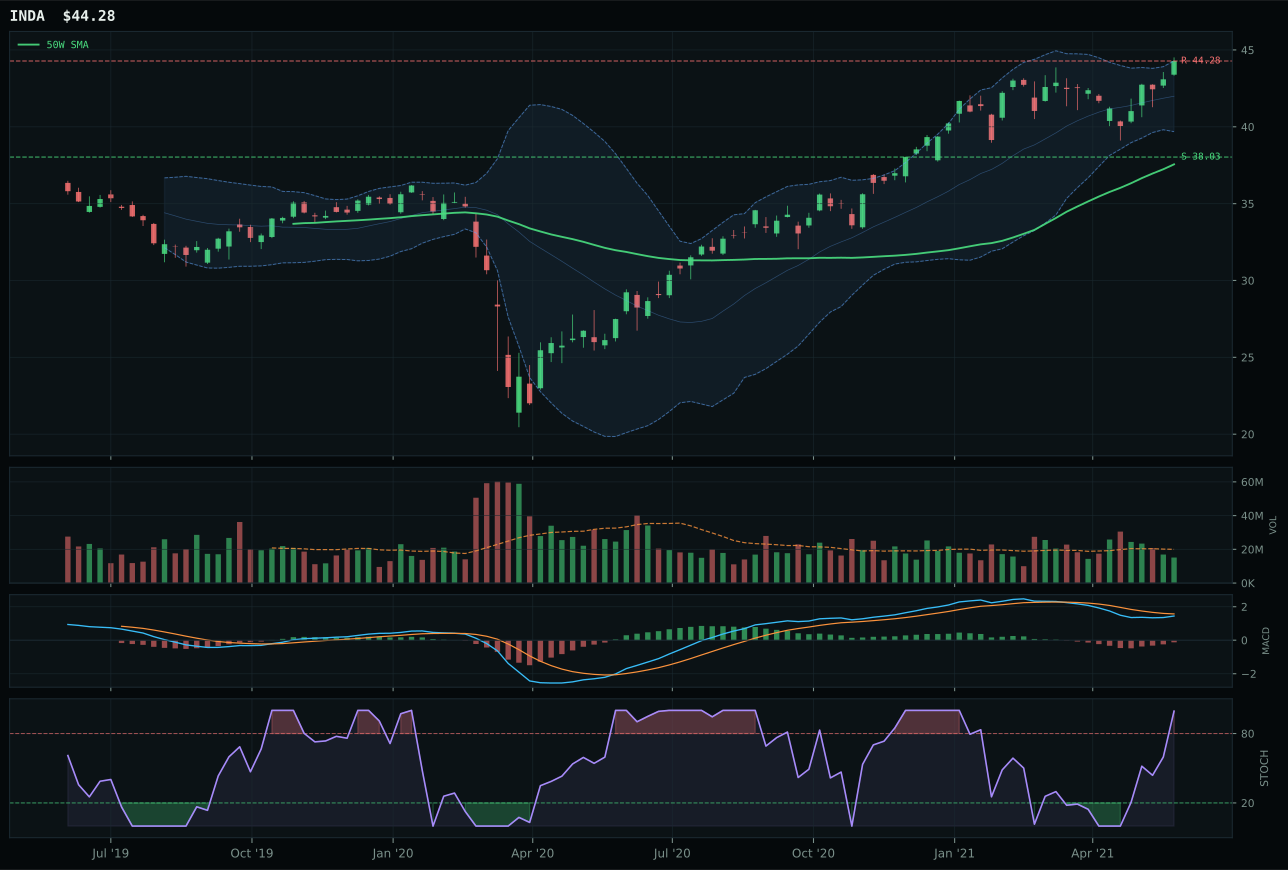
INDA has a vertical extension profile with -2.5% 13-week relative strength versus SPY.
A failed hold above support would weaken the setup.
Actionable but governed by invalidation levels.
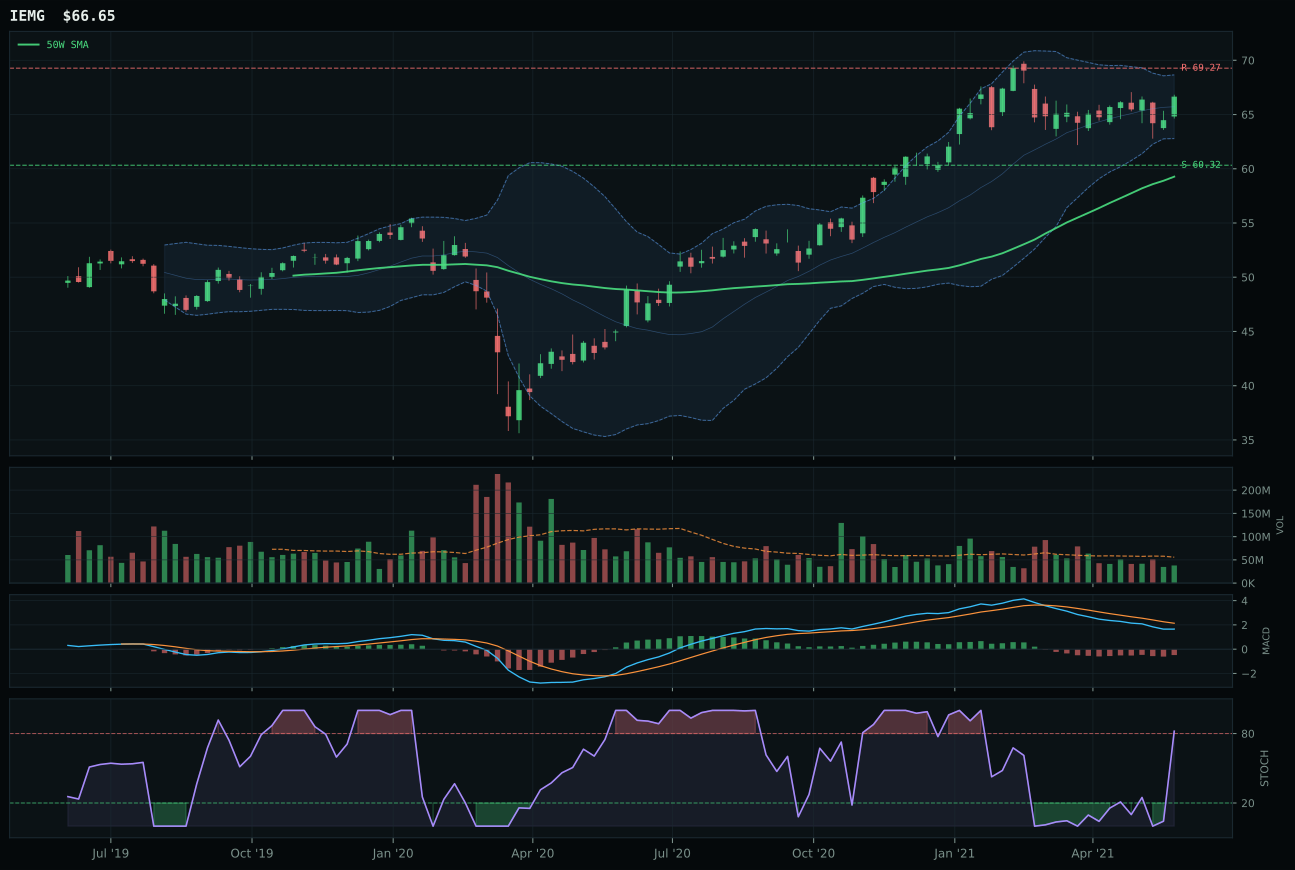
IEMG has a neutral structure profile with -7.5% 13-week relative strength versus SPY.
A failed hold above support would weaken the setup.
Actionable but governed by invalidation levels.
ILF wins with 69 composite score and 87.5 technical evidence despite INDA posting more favorable macro fit (61.0 vs 50.0 for runner-up metrics) because Latin America's 78.6 structure score, 1.22x above-average accumulation volume, and +7.5% category-relative strength decisively beat India's neutral volume and 0.0% relative performance. The emerging markets leader sits 18.3% extended with bullish, improving MACD and overbought stochastic (1.00), yet its 15.5% 13-week return and positive SPY-relative strength (5.0%) prove that commodity-beta exposure has sustained buyer conviction. INDA's 7.9% 13-week return lags despite earlier entry (smaller extension), and its bearish but improving MACD signals that India remains under distribution pressure. The 8.5-point gap reflects ILF's dominant volume-price confirmation (75.4 vs 57) and persistence (78.1 vs 69), indicating that Latin American accumulation is institutional and orderly.
Emerging Markets scores 46.4 and earns 5% allocation, ranking sixth among the ten categories. The category's macro fit of 53.0 reflects competing forces: EM liquidity support at plus-fourteen and Goldilocks at plus-eight are offset by credit stress at minus-ten and broad market bear at minus-nine. ILF's technical evidence of 87.5 is the highest among non-top-two categories, and its macro/narrative fit of 61.0 shows the Latin America commodity-beta theme is getting real traction. The thirteen-week return of 15.5% trails only Defense and Nuclear but ranks above all other portfolio holdings. What limits ILF to 5% rather than 10% is the portfolio's internal allocation hierarchy: Precious Metals and Industrial Metals already own the commodity-and-real-asset themes, so ILF becomes a complementary regional bet rather than a structural position. The category would earn 10% if SPY-relative strength pushed to plus-8 or higher, or if volume sustained above 1.3x average while MACD steepened its bullish slope. For now, ILF sits as the fourth-tier position, holding EM exposure through a commodity-sensitive Latin America vehicle that benefits from both the scarcity narrative and EM liquidity tailwinds.
Traditional Energy — FCG
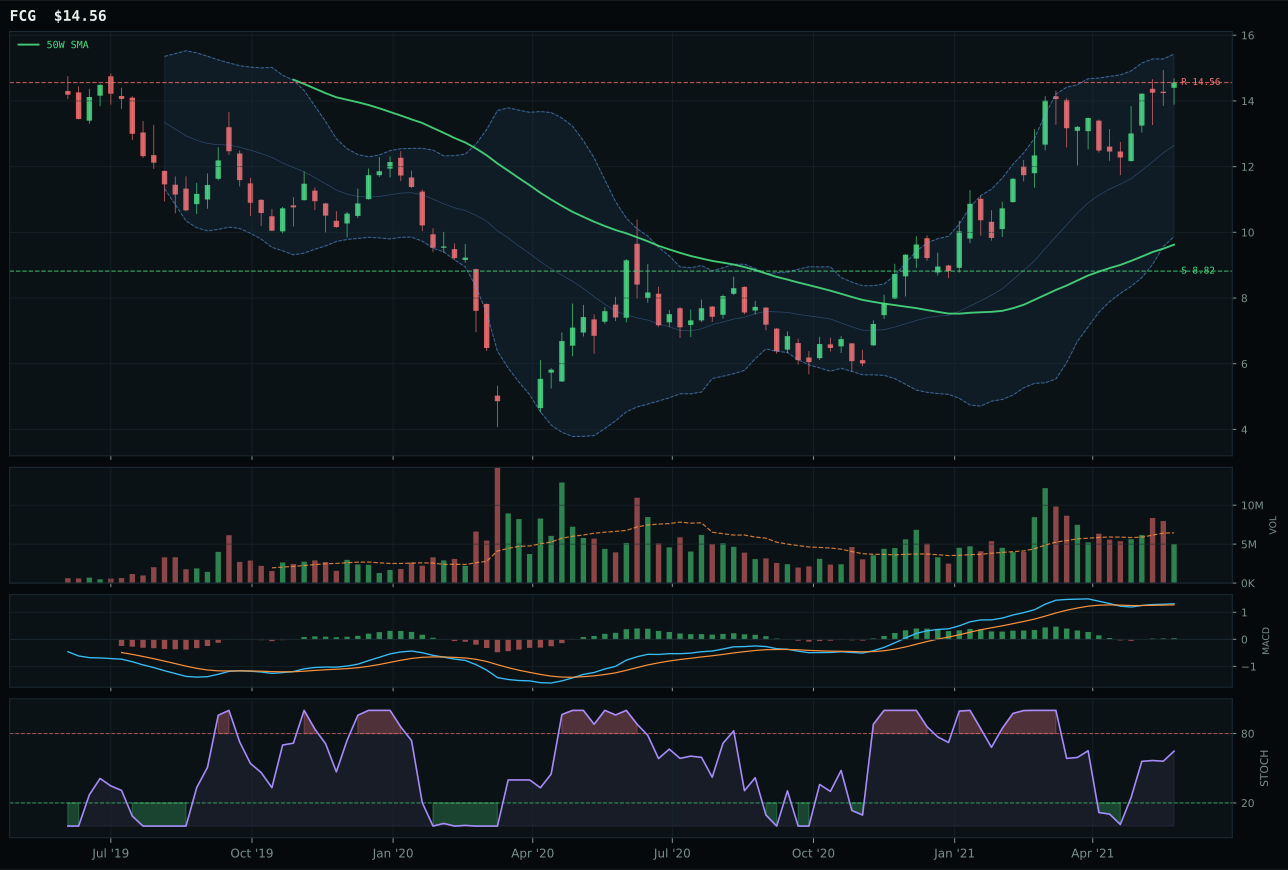
FCG has a vertical extension profile with 7.6% 13-week relative strength versus SPY.
A failed hold above support would weaken the setup.
Actionable but governed by invalidation levels.
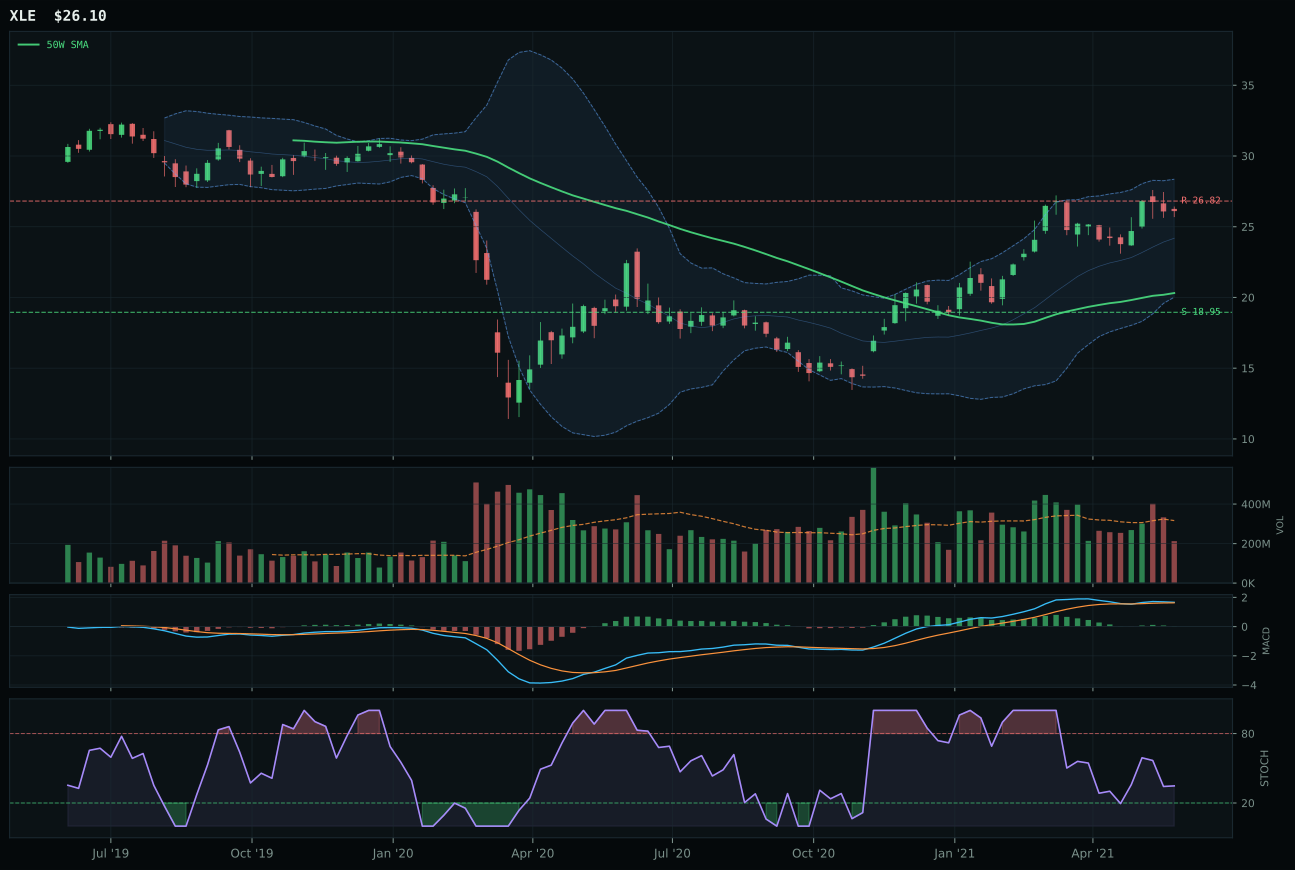
XLE has a vertical extension profile with -2.0% 13-week relative strength versus SPY.
A failed hold above support would weaken the setup.
Actionable but governed by invalidation levels.
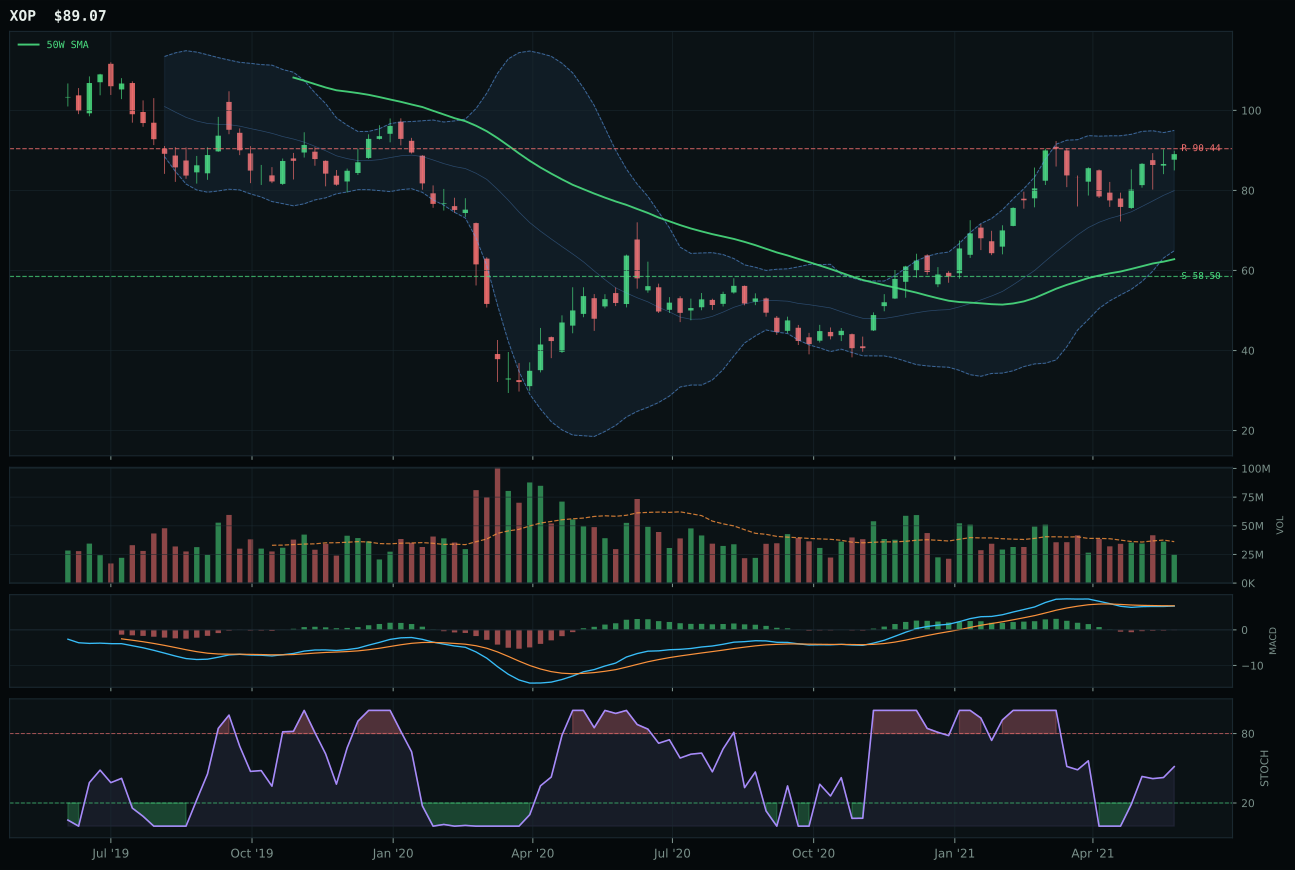
XOP has a vertical extension profile with 0.2% 13-week relative strength versus SPY.
A failed hold above support would weaken the setup.
Actionable but governed by invalidation levels.
FCG wins the category with a 57 composite score versus XLE's 51, driven by perfect 100.0 momentum confirmation (18.0% 13-week return, +7.4% category-relative strength) and superior volume-price confirmation (71.0 vs 51), despite both sitting at 51% extension above the 50-week. The natural gas specialist's MACD bullish and improving and stochastic RSI rising mid-zone (0.65) contrast sharply with XLE's MACD bullish but flattening and falling/neutral stochastic, signaling that natural gas buyers have fresher conviction than integrated energy holders. FCG's 7.6% SPY-relative strength is the second-highest in the entire portfolio, proving that energy buyers are specifically reaching for the more leveraged play. XLE's thin participation (0.74x) versus FCG's neutral volume (0.78x) is marginal, but combined with category-relative strength lag (-2.2%), it tips the scales decisively.
Traditional Energy scores 43.8 and earns only 5% allocation despite FCG's dominant thirteen-week momentum, ranking it seventh among the ten categories. The risk-reward of 24.2 is disqualifying for a larger position: FCG offers negative 0.0% upside against sixty-five percent downside, which no portfolio manager accepts even in a favorable macro regime. Macro fit of 50.0 is neutral—real asset sponsorship at plus-seven offsets credit stress at minus-seven exactly—meaning this category's allocation relies entirely on technical momentum, which is the riskiest justification. FCG would need to either pull back to 20-25% above the fifty-week moving average to reset risk-reward to 45-50, or see volume surge above 1.1x average with MACD steepen its bullish slope to justify moving to the 10% tier. The portfolio holds energy here as a tactical momentum play into an intermediate top, not as a structural position. At 5%, it sits alongside Agriculture as a rotational hold that would be first to exit if stochastic RSI rolls below 0.50 or if price closes below the rising support line.
Utilities & Infrastructure — XLU
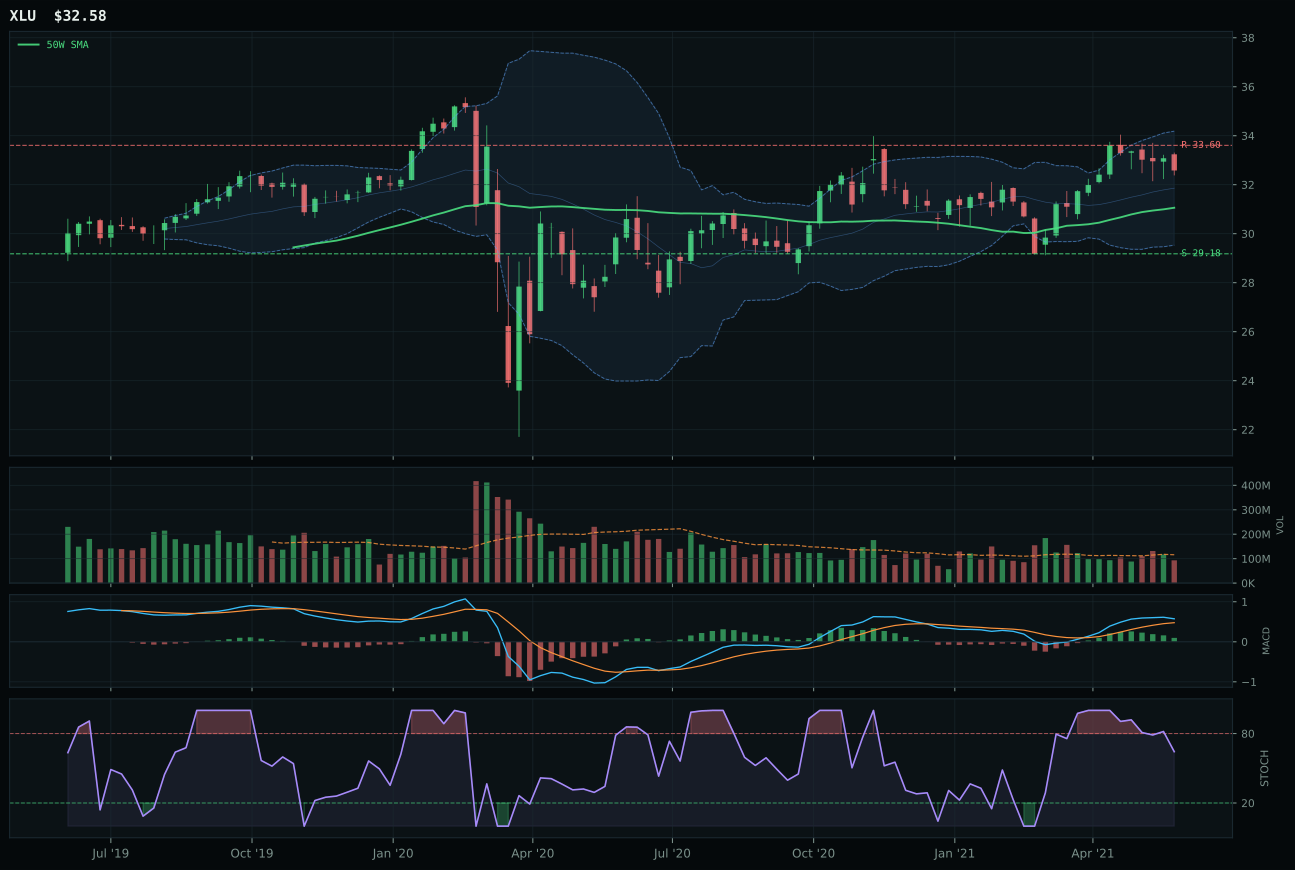
XLU has a neutral structure profile with 1.2% 13-week relative strength versus SPY.
A failed hold above support would weaken the setup.
Actionable but governed by invalidation levels.
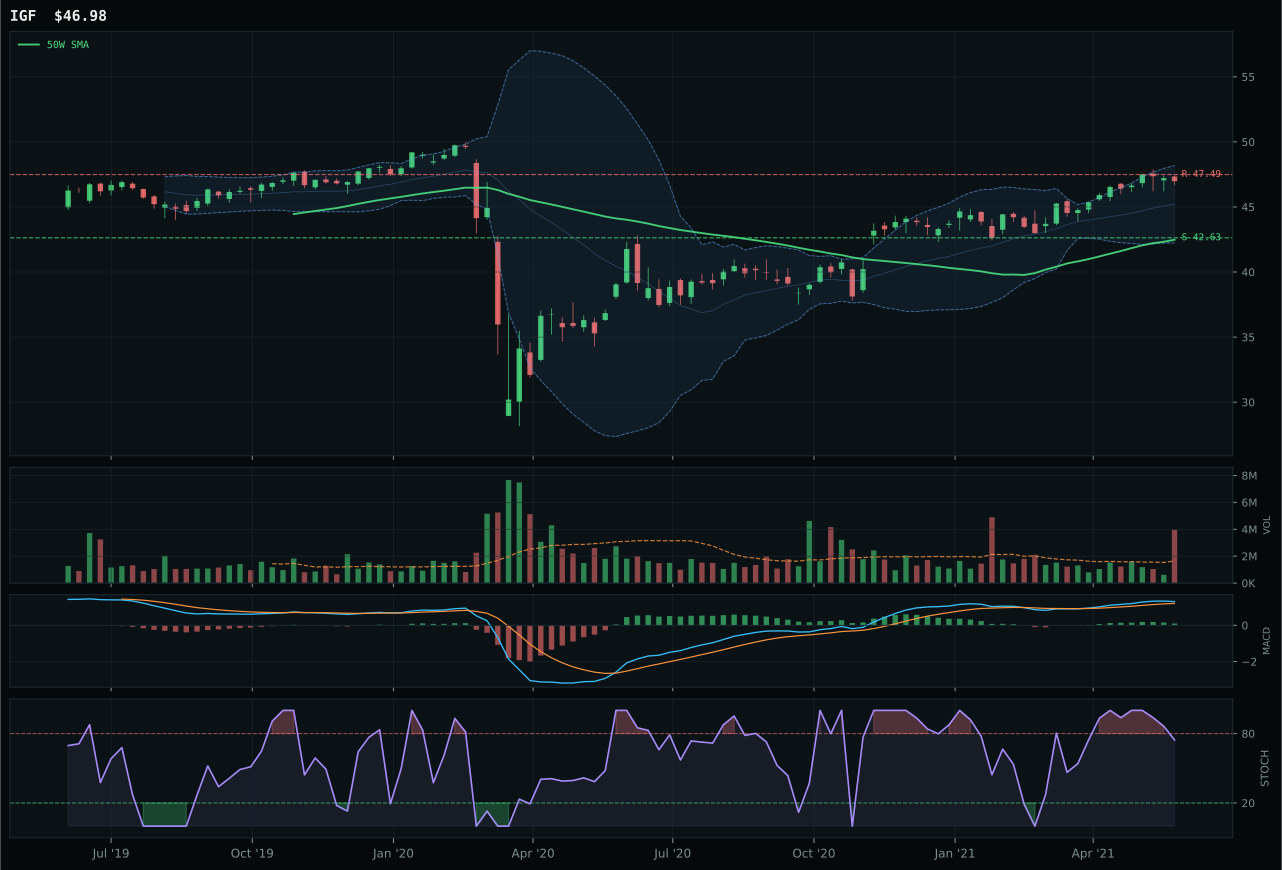
IGF has a neutral structure profile with -1.2% 13-week relative strength versus SPY.
A failed hold above support would weaken the setup.
Actionable but governed by invalidation levels.
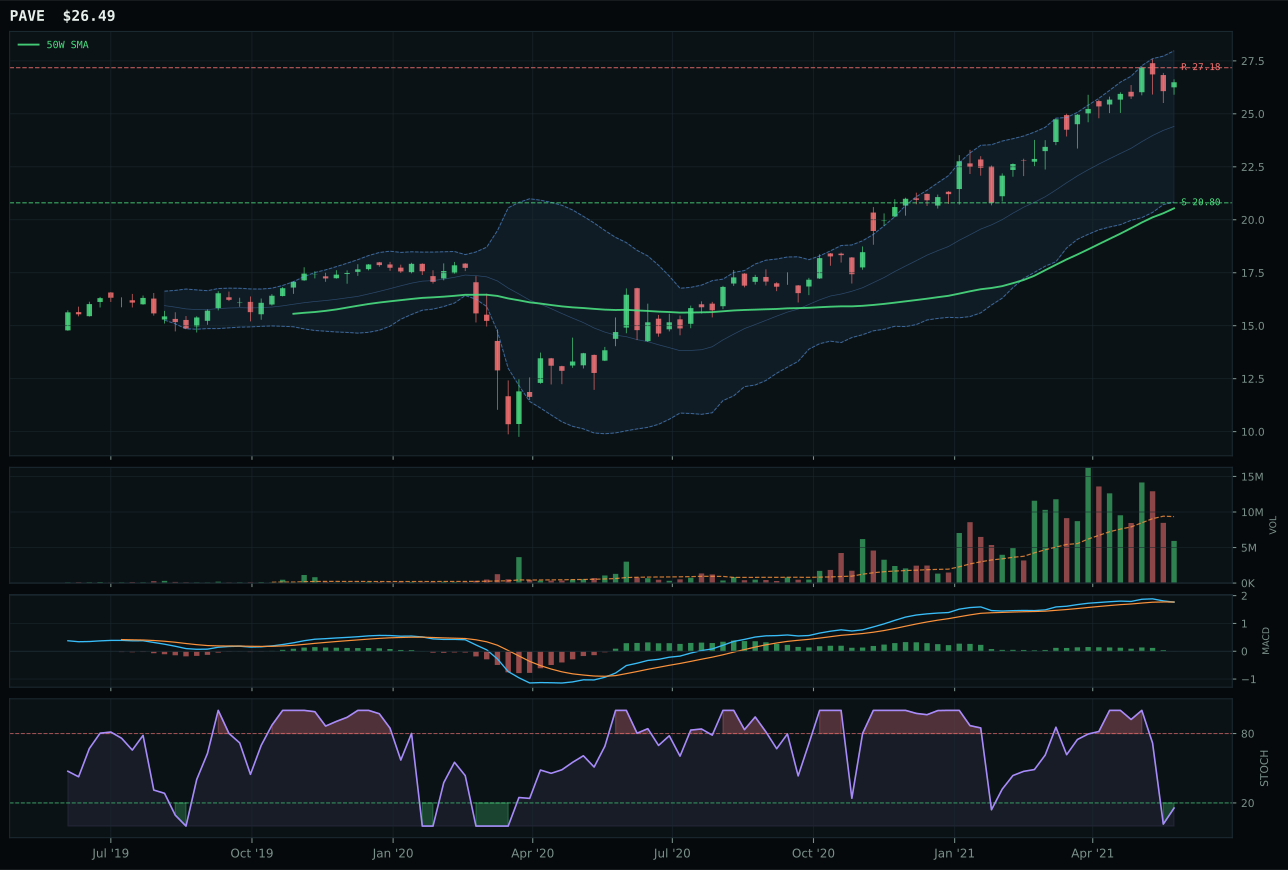
PAVE has a vertical extension profile with 5.4% 13-week relative strength versus SPY.
A failed hold above support would weaken the setup.
Actionable but governed by invalidation levels.
XLU dominates with 78 composite score and 70.1 technical evidence, beating IGF by 10.1 category points, because its 85.0 timing score (only 4.9% extended above 50-week) and 97.8% trend confidence create a low-risk entry that IGF's neutral structure and 62.0 timing score cannot match. Regulated utility defense sits in compression with bullish but flattening MACD and falling/neutral stochastic (0.64)—a coiled setup—whereas IGF is 10.6% extended with distribution pressure volume, meaning fresh capital must pay up for less conviction. XLU's 11.7% 13-week return rivals extended peers while positioned much closer to fair value, and its 1.2% SPY-relative strength matches IGF's -1.2%, proving that utility buyers exist without requiring extended valuation. The 49.7 risk/reward is symmetric (3.1% upside, 11.7% downside), ideal for a defensive holding, whereas IGF's 30.9 risk/reward and distribution volume signal deteriorating sponsorship.
Utilities & Infrastructure scores 39.4 and earns 5% allocation, ranking eighth among the ten categories. The category's macro fit of 58.0 reflects broad market bear at plus-four and Transition/Mixed environment at plus-four, providing modest tailwinds for defensive utility positioning. XLU's technical evidence of 70.1 is respectable but not top-tier; what elevates it into allocation is the timing setup—at 4.9% above the fifty-week moving average with compression of 83.4, XLU represents the best defined consolidation in the portfolio. This is a defensive play: you own XLU not for explosive upside but for a positioned entry into a name that can expand upward on a breakout above 33.60 with volume confirmation. The eleven-point gap between XLU's score and IGF's shows this is a clear category decision, but the portfolio ranks Utilities eighth because the macro environment still favors real assets and commodities over defensive sectors. XLU would earn 5% allocation if it broke above resistance at 33.60 on volume above 1.0x average, or if broad market bear descriptor intensified to trigger a risk-off rotation. Until that reversal, Utilities stays at 5% as a tactical hedge position against commodity overextension.
Defense & Aerospace — ITA
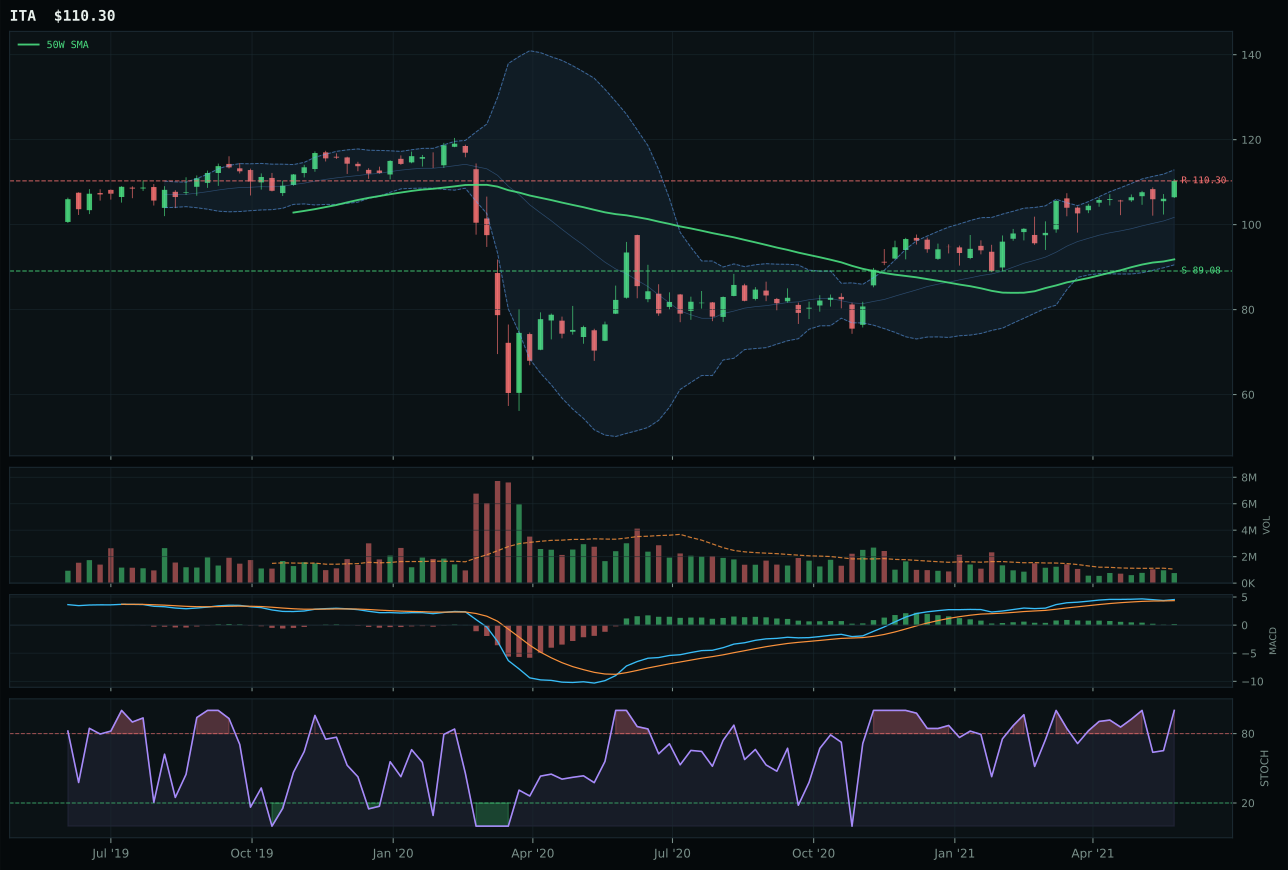
ITA has a vertical extension profile with 4.9% 13-week relative strength versus SPY.
A failed hold above support would weaken the setup.
Actionable but governed by invalidation levels.
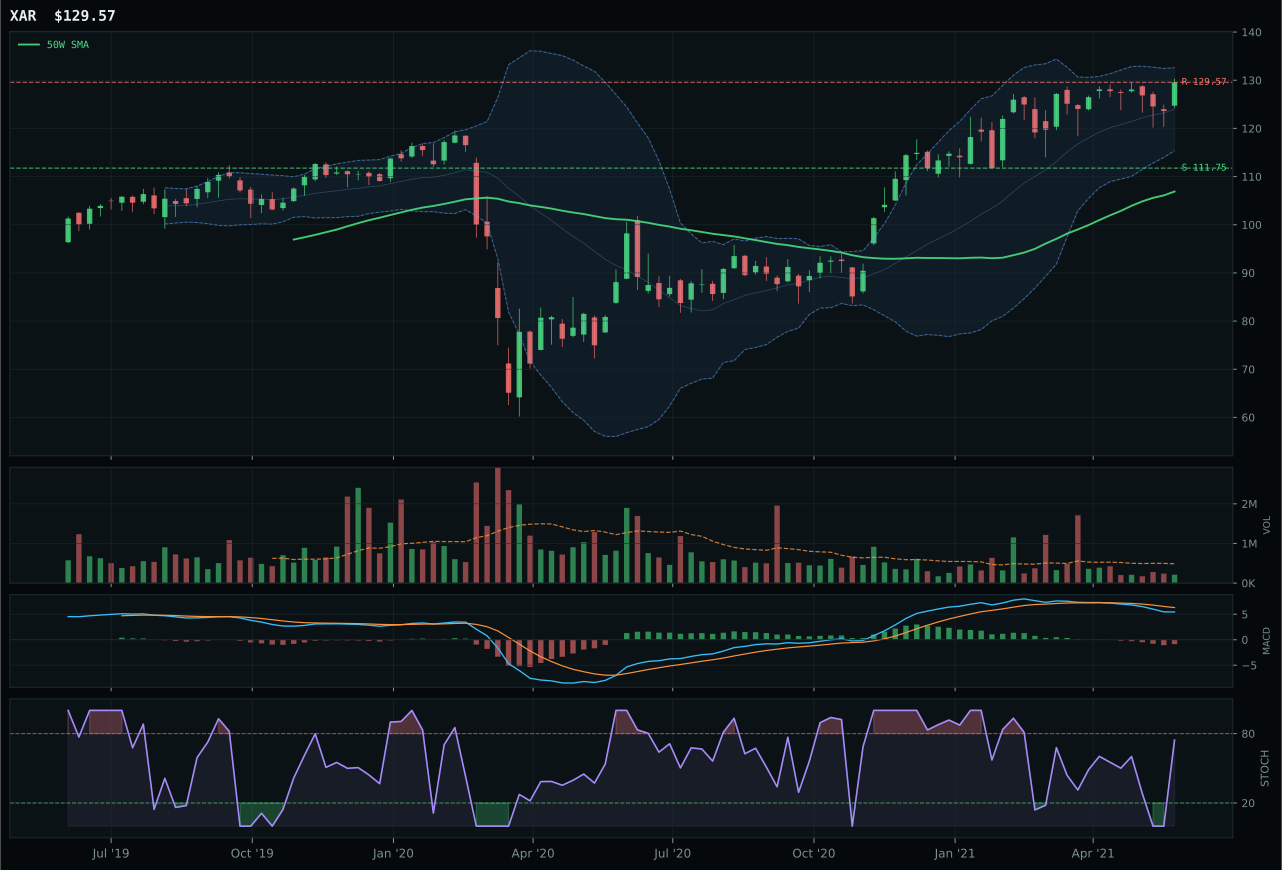
XAR has a vertical extension profile with -1.7% 13-week relative strength versus SPY.
A failed hold above support would weaken the setup.
Actionable but governed by invalidation levels.
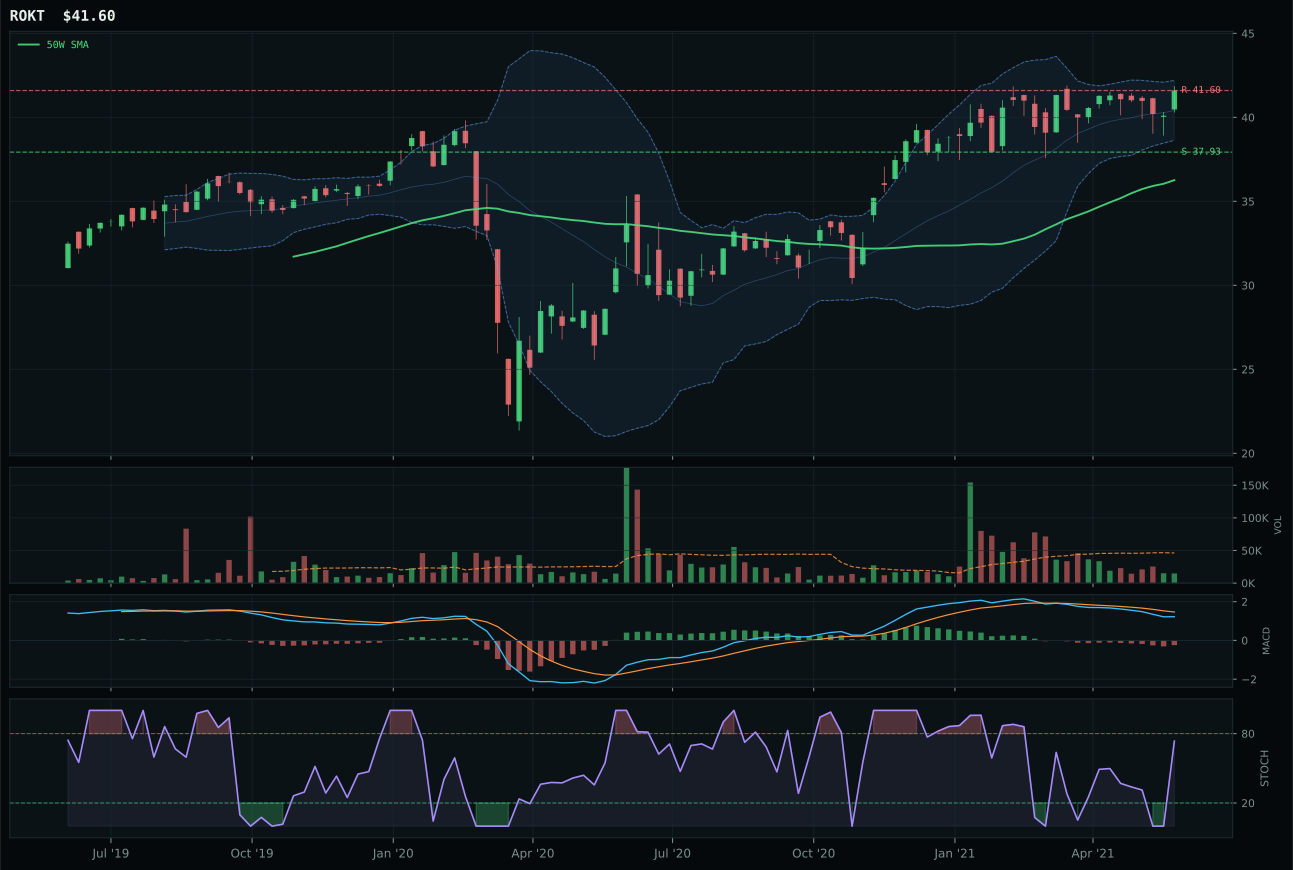
ROKT has a neutral structure profile with -4.9% 13-week relative strength versus SPY.
A failed hold above support would weaken the setup.
Tracked, but not top-2 eligible because: .
ITA dominates with a perfect 100.0 trend score and 90.7 momentum confirmation—the strongest single evidence point in this category—because its 4.9% positive relative strength versus SPY and 6.6% category-relative strength prove that buyers are actively reaching for this name despite a 20.1% extension above the 50-week level. The defense-prime representative's bullish but flattening MACD and overbought stochastic RSI (1.00) would typically signal caution, yet persistence scores 68.2 and volume-price confirmation 68.7, indicating that the extended move is being held, not distributed. XAR's 34.1 technical evidence trails by 29.6 points, anchored by a -1.7% SPY-relative performance and bearish/weakening MACD that confirms its move is mean-reversion driven rather than trend-driven.
Defense & Aerospace scores 35.4 and receives zero allocation, tied for last place among eligible categories. Even though the category's technical evidence for ITA reaches 63.7—the second-highest representative score in the portfolio after GLD—the setup is too extended and risk-reward too poor at 43.0 to justify a position. Category-level macro fit of 59.0 reflects strong support from broad market bear descriptor at plus-six, but that tailwind does not offset timing risk. At 20.1% extension above the fifty-week moving average with zero upside remaining, every new buyer at this level faces a worst-case asymmetry of 23.8% downside to support against no realistic upside. The four-week return of 3.6% sits below the thirteen-week return of 15.4%, signaling momentum is decelerating. ITA would need to pull back to compress at the fifty-week moving average, rebuild MACD, and reset stochastic RSI below 0.70 before this category becomes eligible for allocation. The broad market bear theme is valuable, but not enough to purchase extended air.
AI — SMH
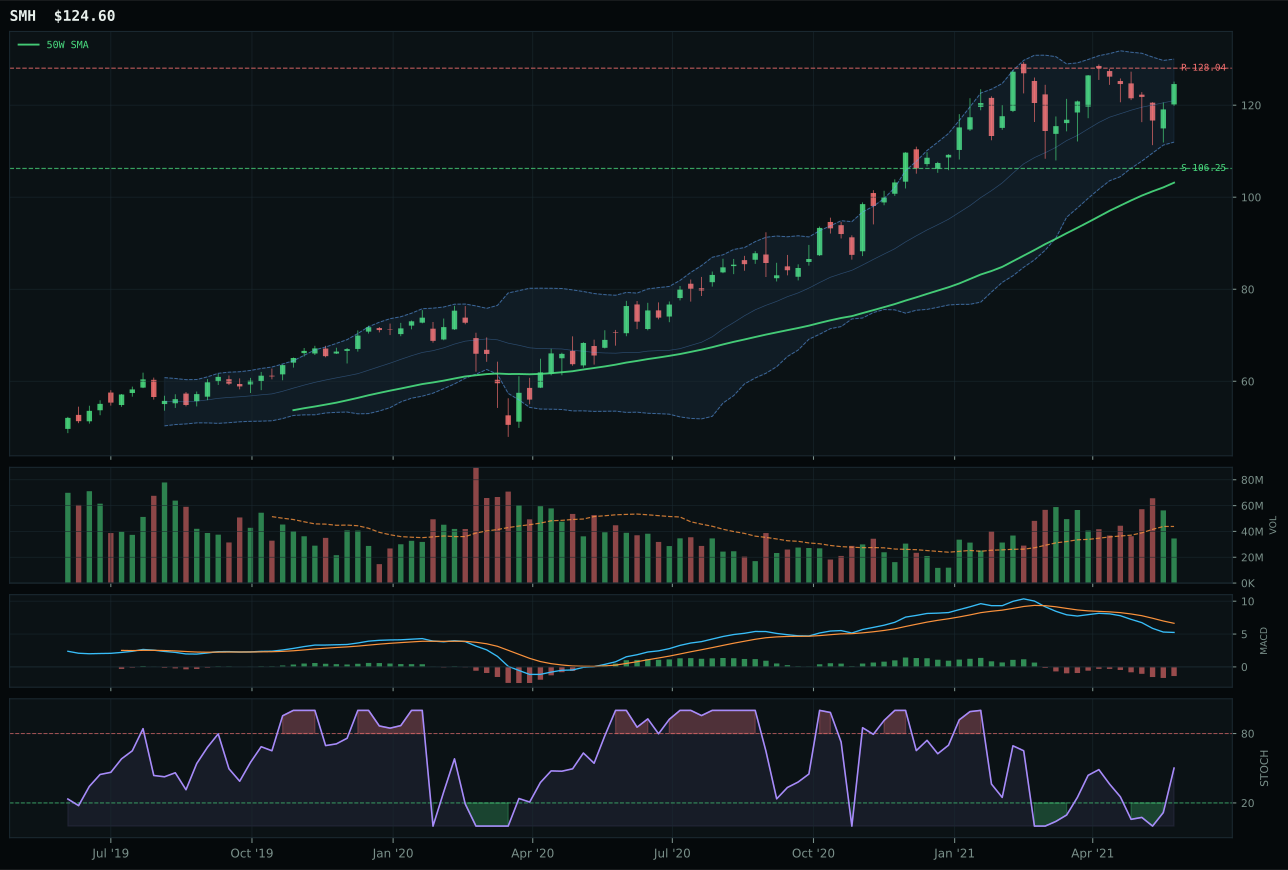
SMH has a vertical extension profile with -7.0% 13-week relative strength versus SPY.
A failed hold above support would weaken the setup.
Actionable but governed by invalidation levels.
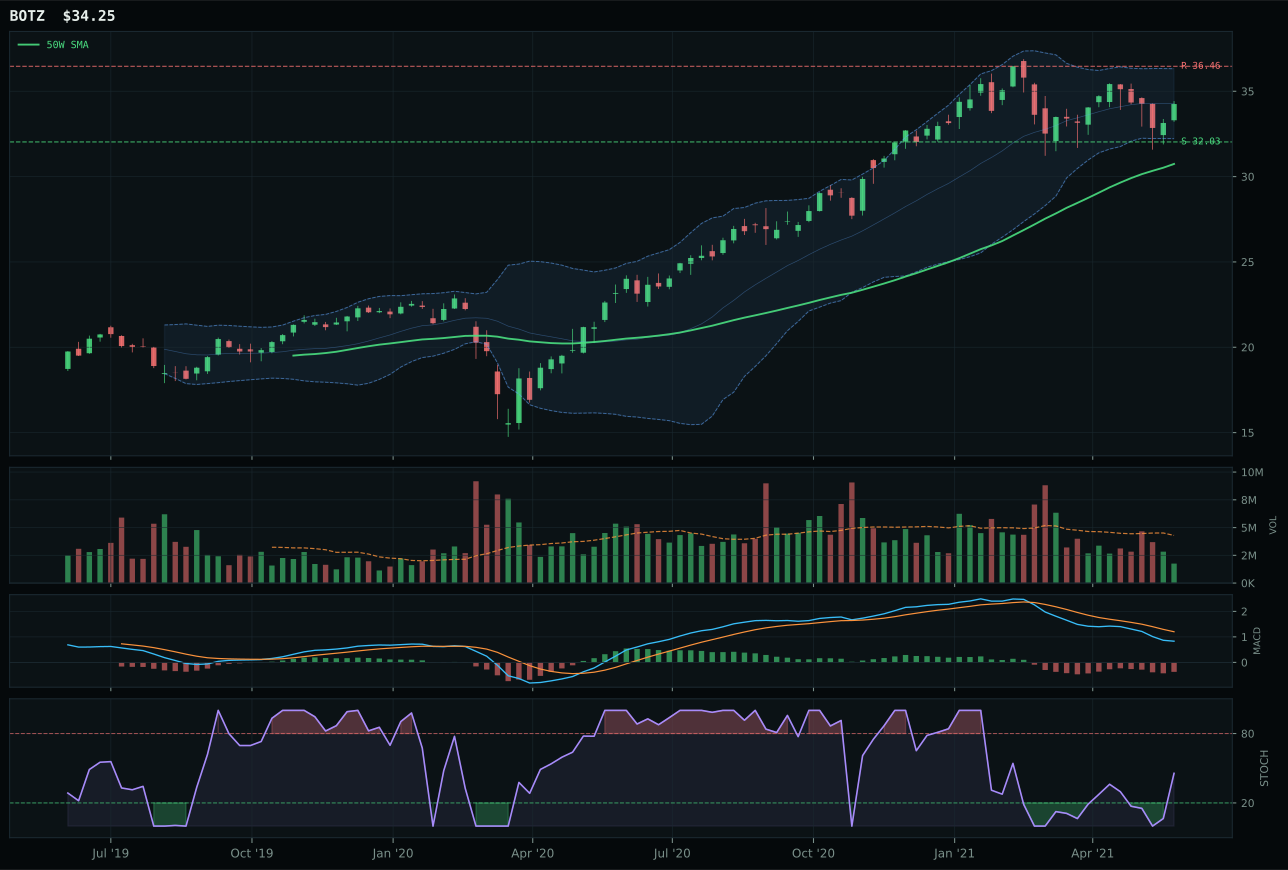
BOTZ has a neutral structure profile with -8.6% 13-week relative strength versus SPY.
A failed hold above support would weaken the setup.
Actionable but governed by invalidation levels.
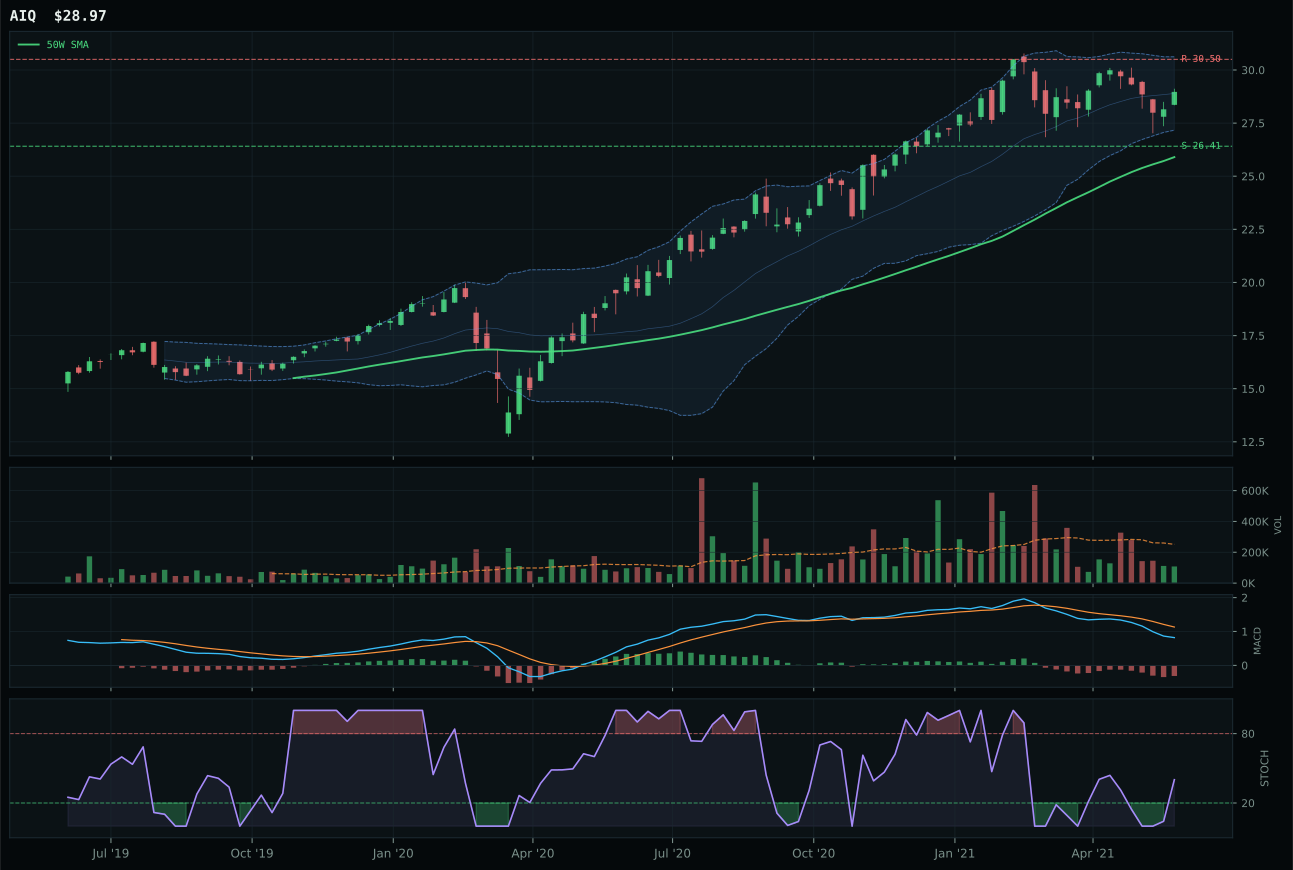
AIQ has a neutral structure profile with -9.1% 13-week relative strength versus SPY.
A failed hold above support would weaken the setup.
Tracked, but not top-2 eligible because: .
SMH wins with a composite score of 50 despite BOTZ posting 61 in technical evidence, because the composite ranking system penalizes BOTZ for thin volume participation and neutral structure while SMH's vertical extension and rising mid-zone stochastic RSI align with category-relative strength of 1.5% versus BOTZ's 0.0%. The semiconductor representative is 20.8% extended above its 50-week moving average—a steep entry for momentum—yet its 3.4% 13-week return outpaces BOTZ's anemic 1.9%, signaling that the SMH rally has more institutional conviction behind it. BOTZ's superior risk/reward (61 vs 40) and cleaner structure (68.6 vs 74.1) cannot overcome its inability to generate positive relative strength inside the category, making it the second choice by a 10.4-point gap.
AI scores 35.2 and receives zero allocation, ranking outside the portfolio's nine eligible positions. The category's technical evidence of 31.4 for the representative ETF is the real culprit: risk-reward sits at only 39.8 with seventeen percent of upside to resistance against no downside cushion. Macro fit of 37.0 compounds the problem—both credit stress and risk appetite broken descriptors subtract six and seven points respectively from a neutral baseline. In a Goldilocks regime, AI should benefit from growth appetite, and it does get a plus-ten boost from the macro state itself, but that gain is overwhelmed by negative active descriptors that penalize cyclical tech exposure when credit stability is questioned. The category's persistence score of 39.0 and volume-price confirmation of 35.5 show this move lacks staying power. SMH would need to either compress back toward the fifty-week moving average for a cleaner entry, or deliver volume surge above 1.2x average while MACD returns to bullish slope, to earn consideration for the 5% rotational tier.