
2021-05-21
Informational purposes only. The content in this report, including allocations, analysis, and commentary, is provided solely for informational and educational purposes. It does not constitute financial advice, investment advice, trading advice, or any other type of advice. Past performance does not guarantee future results. Always conduct your own research and consult a qualified financial professional before making investment decisions.
AltSeason was blocked by macro risk gating: The macro engine classifies the structural regime as Transition / Mixed with a tactical overlay of Transition / Mixed. Growth score is 50.0, inflation pressure is 57.8, liquidity is 62.0, credit stress is 60.3, and macro risk is 53.9. Cash is not required because crisis macro risk is inactive and bear-defense structure has 2/5 required checks. The active Defensive trigger is none and the Defensive cause is none.
Weekly Allocation
| Ticker | Category | Weight | Role |
|---|---|---|---|
| FBTC | 50% | Overlay | |
| FCG | Traditional Energy | 10% | Top-2 (10%) |
| GLD | Precious Metals | 10% | Top-2 (10%) |
| COPX | Industrial Metals | 5% | Tier-2 (5%) |
| URNM | Nuclear Energy | 5% | Tier-2 (5%) |
| IGF | Utilities & Infrastructure | 5% | Tier-2 (5%) |
| MOO | Agriculture & Livestock | 5% | Tier-2 (5%) |
| ILF | Emerging Markets | 5% | Tier-2 (5%) |
| ITA | Defense & Aerospace | 5% | Tier-2 (5%) |
Trade Instructions — Monday Open
Sell the tranche from 2021-04-23 (completing its 4-week hold). Buy the new tranche. Instructions show net portfolio changes — same-asset positions cancel, weight changes show the delta.
| Action | Ticker | Instruction |
|---|---|---|
| SELL | FSOL | Sell 33% of FSOL position (reduce 37.50% → 25.00%) |
| SELL | WEAT | Sell 29% of WEAT position (reduce 8.75% → 6.25%) |
| SELL | COPX | Sell 14% of COPX position (reduce 8.75% → 7.50%) |
| SELL | XLE | Sell 20% of XLE position (reduce 6.25% → 5.00%) |
| SELL | XLU | Sell 33% of XLU position (reduce 3.75% → 2.50%) |
| SELL | URA | Sell entire URA position (1.25% of portfolio) |
| SELL | SLV | Sell 50% of SLV position (reduce 2.50% → 1.25%) |
| SELL | IGV | Sell entire IGV position (1.25% of portfolio) |
| BUY | URNM | Buy URNM — 5.56% of freed cash (adds 1.25% to portfolio) |
| BUY | ILF | Buy ILF — 5.56% of freed cash (adds 1.25% to portfolio) |
| BUY | FBTC | Buy FBTC — 55.56% of freed cash (adds 12.50% to portfolio) |
| BUY | GLD | Buy GLD — 11.11% of freed cash (adds 2.50% to portfolio) |
| BUY | FCG | Buy FCG — 11.11% of freed cash (adds 2.50% to portfolio) |
| BUY | IGF | Buy IGF — 5.56% of freed cash (adds 1.25% to portfolio) |
| BUY | MOO | Buy MOO — 5.56% of freed cash (adds 1.25% to portfolio) |
Current Portfolio After Trade
Combined holdings across all 4 active tranches. Each tranche is 25% of the portfolio.
| Ticker | % of Portfolio | Weight Bar |
|---|---|---|
| FSOL | 25.00% | |
| FBTC | 25.00% | |
| COPX | 7.50% | |
| WEAT | 6.25% | |
| XLE | 5.00% | |
| ITA | 5.00% | |
| URNM | 5.00% | |
| ILF | 3.75% | |
| GLD | 3.75% | |
| XLU | 2.50% | |
| PAVE | 2.50% | |
| FCG | 2.50% | |
| SLV | 1.25% | |
| CIBR | 1.25% | |
| GDX | 1.25% | |
| IGF | 1.25% | |
| MOO | 1.25% |
Macro Regime — Transition / Mixed
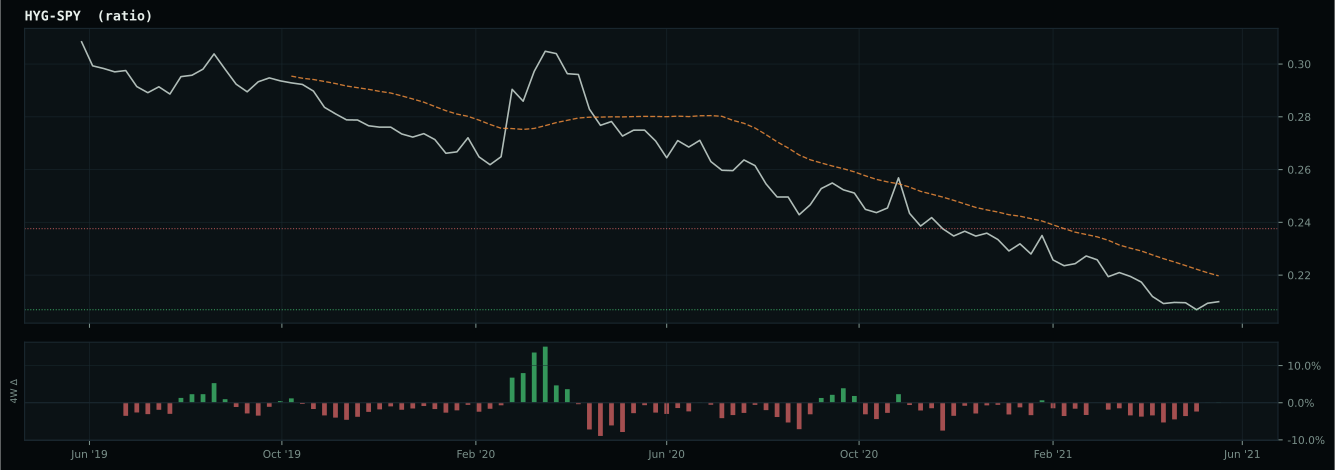
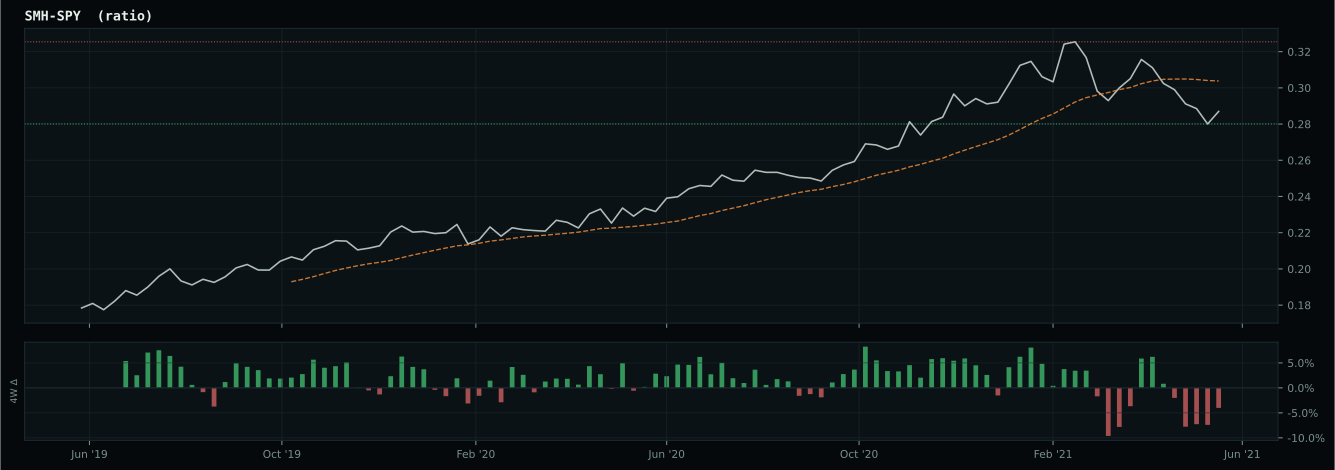
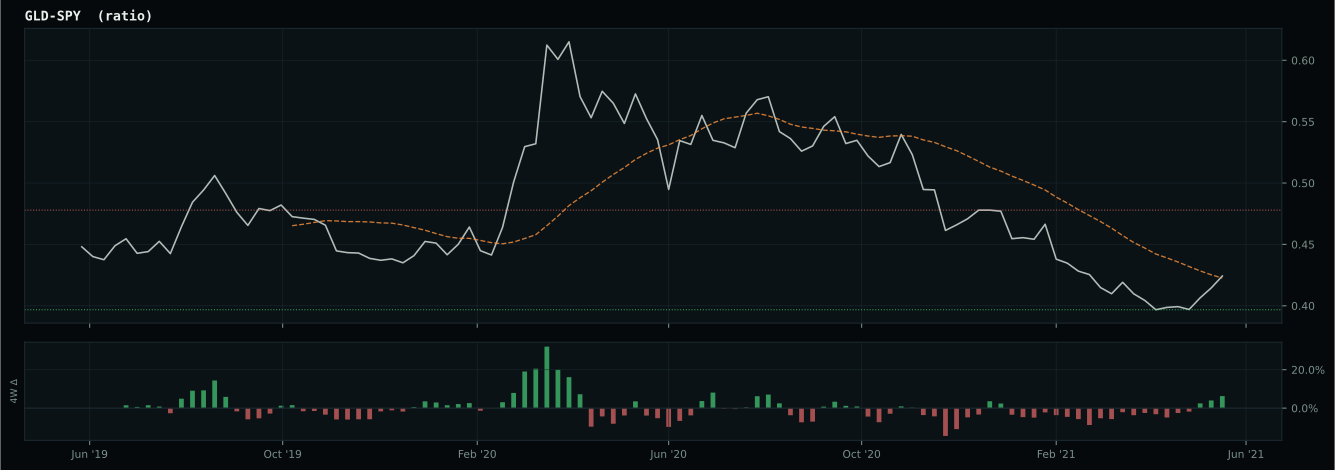
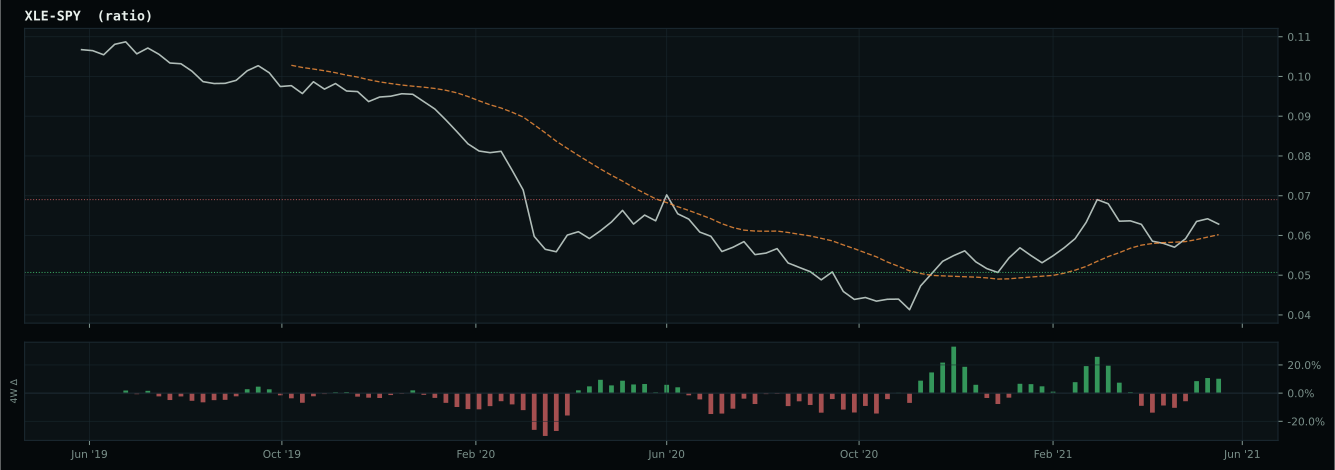
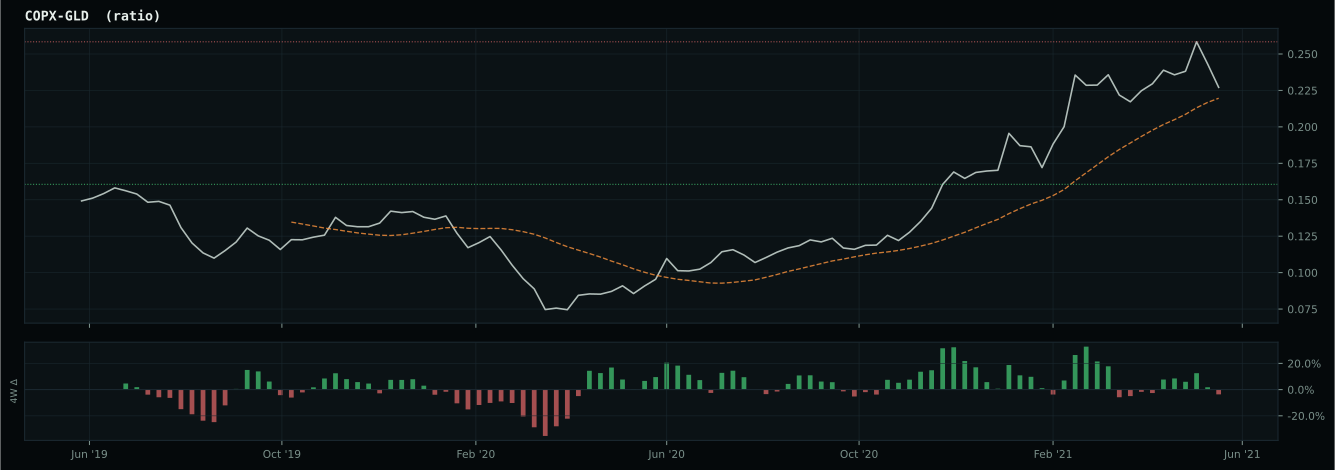
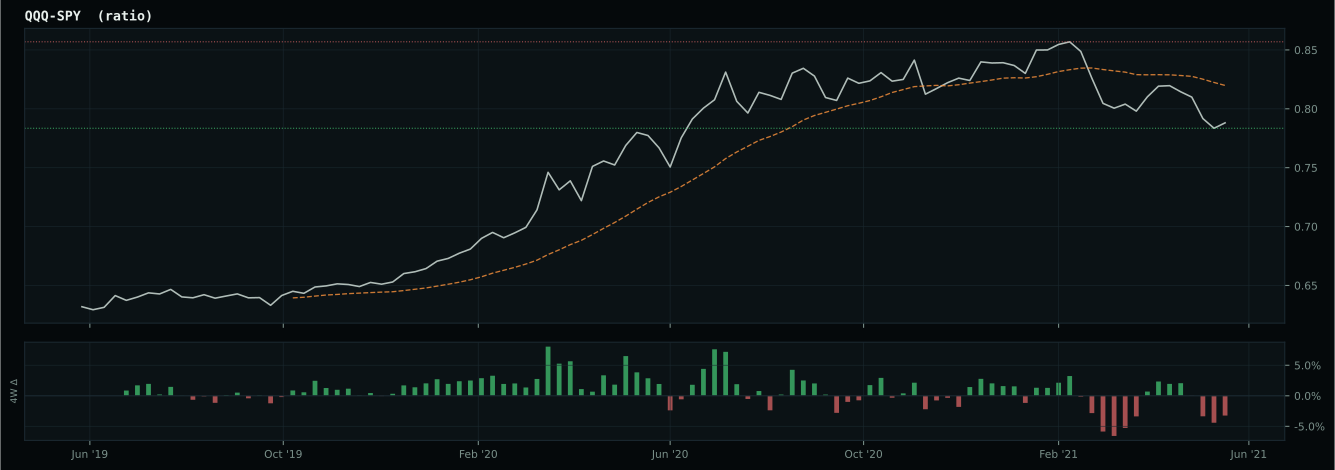
growth data is not confirming the weak market-implied risk appetite signal
Macro Evidence Charts
Market-implied signals behind the macro regime scores. Each ratio compares two assets; the direction and slope of the ratio is what the macro engine reads.
Crypto Regime — TrendBTC
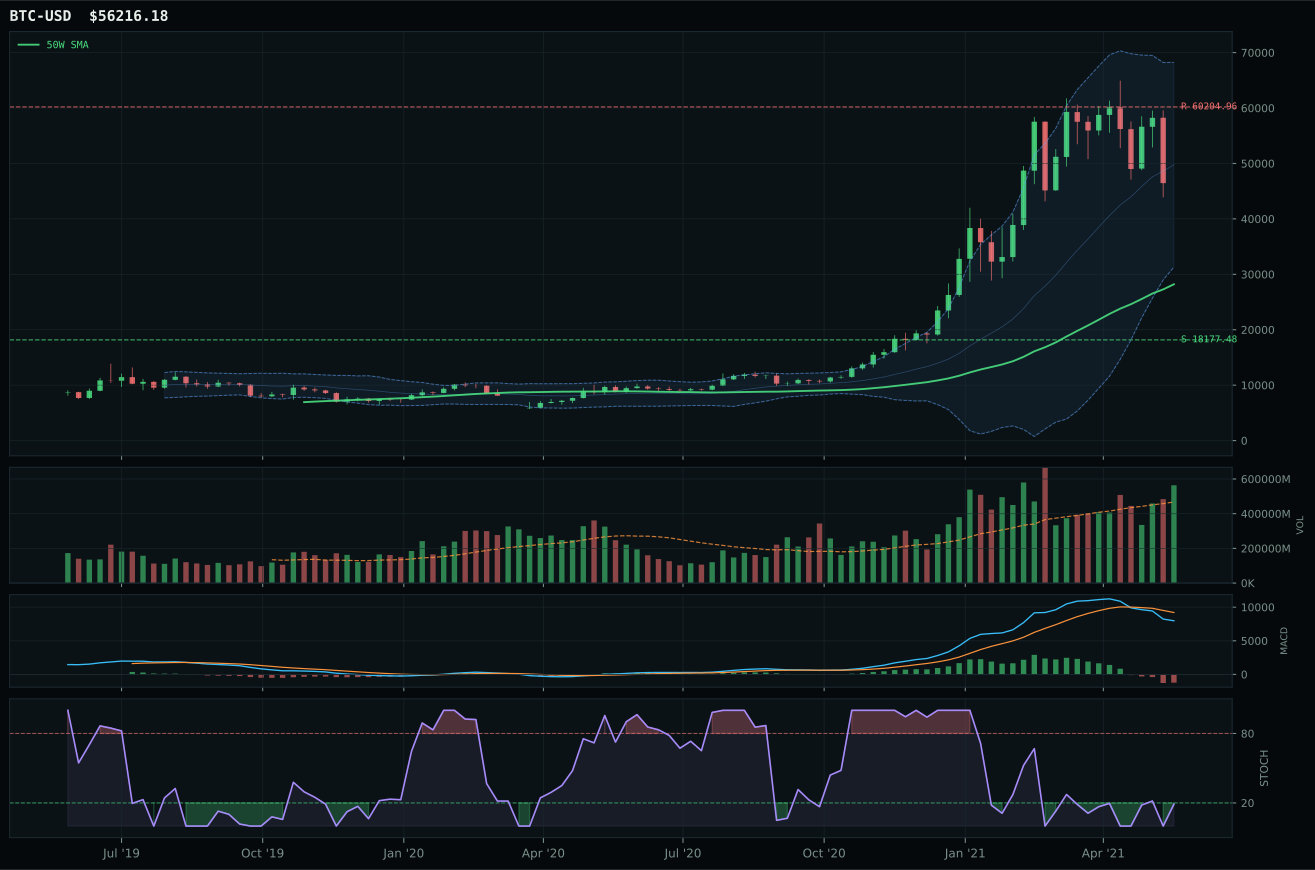
post-touch structure is too wide to count as a range; max/min close ratio is 10.17
TrendBTC confirmed: 2 consecutive closes above rising/flat 50W SMA
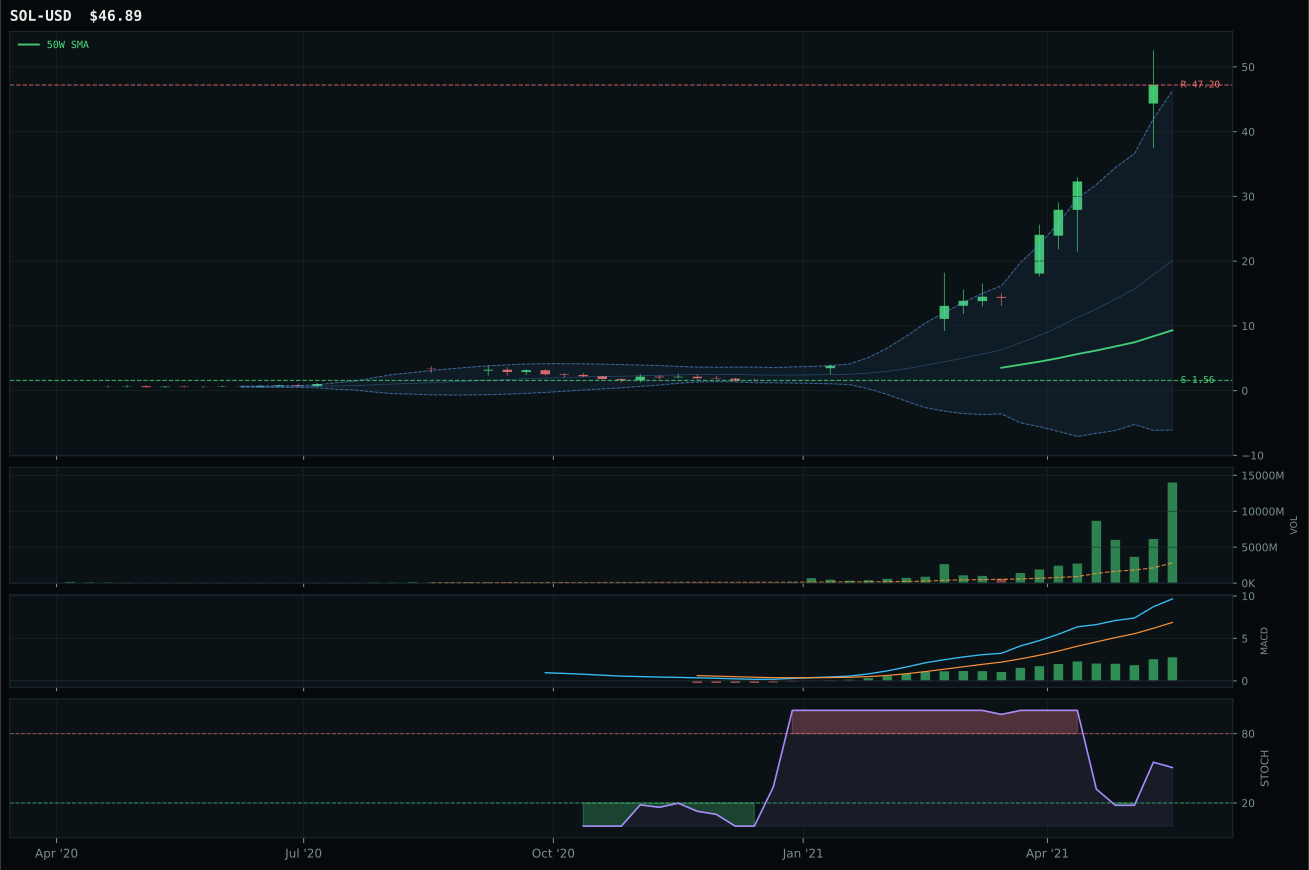
all available AltSeason conditions pass; missing optional confirmations skipped Macro gate failed, so AltSeason was downgraded.
Category Rankings
| Rank | Category | Winner | Score | Alloc | 4W Ret | Peers (4W) |
|---|---|---|---|---|---|---|
| 1 | Traditional Energy | FCG | 79.9 | 20% | +6.04% | XLE -0.4% · XOP +4.5% |
| 2 | Precious Metals | GLD | 64.4 | 20% | -5.47% | GDX -12.0% · SLV -6.4% |
| 3 | Industrial Metals | COPX | 60.0 | 10% | -11.82% | PICK -8.0% · REMX +0.8% |
| 4 | Nuclear Energy | URNM | 57.5 | 10% | -4.91% | URA -2.0% · NLR -2.7% |
| 5 | Utilities & Infrastructure | IGF | 55.8 | 10% | -2.41% | PAVE -5.3% · XLU -4.0% |
| 6 | Agriculture & Livestock | MOO | 53.9 | 10% | -3.33% | WEAT -0.2% · VEGI -6.3% |
| 7 | Emerging Markets | ILF | 39.0 | 10% | +4.83% | INDA +2.1% · IEMG +1.5% |
| 8 | Defense & Aerospace | ITA | 35.2 | 10% | +1.74% | ROKT +4.0% · XAR +4.8% |
| 9 | Technology | CIBR | 26.2 | 0% | +5.62% | XLK +3.3% · IGV +7.2% |
| 10 | AI | SMH | 17.2 | 0% | +2.75% | BOTZ +3.6% · AIQ +4.4% |
Traditional Energy — FCG
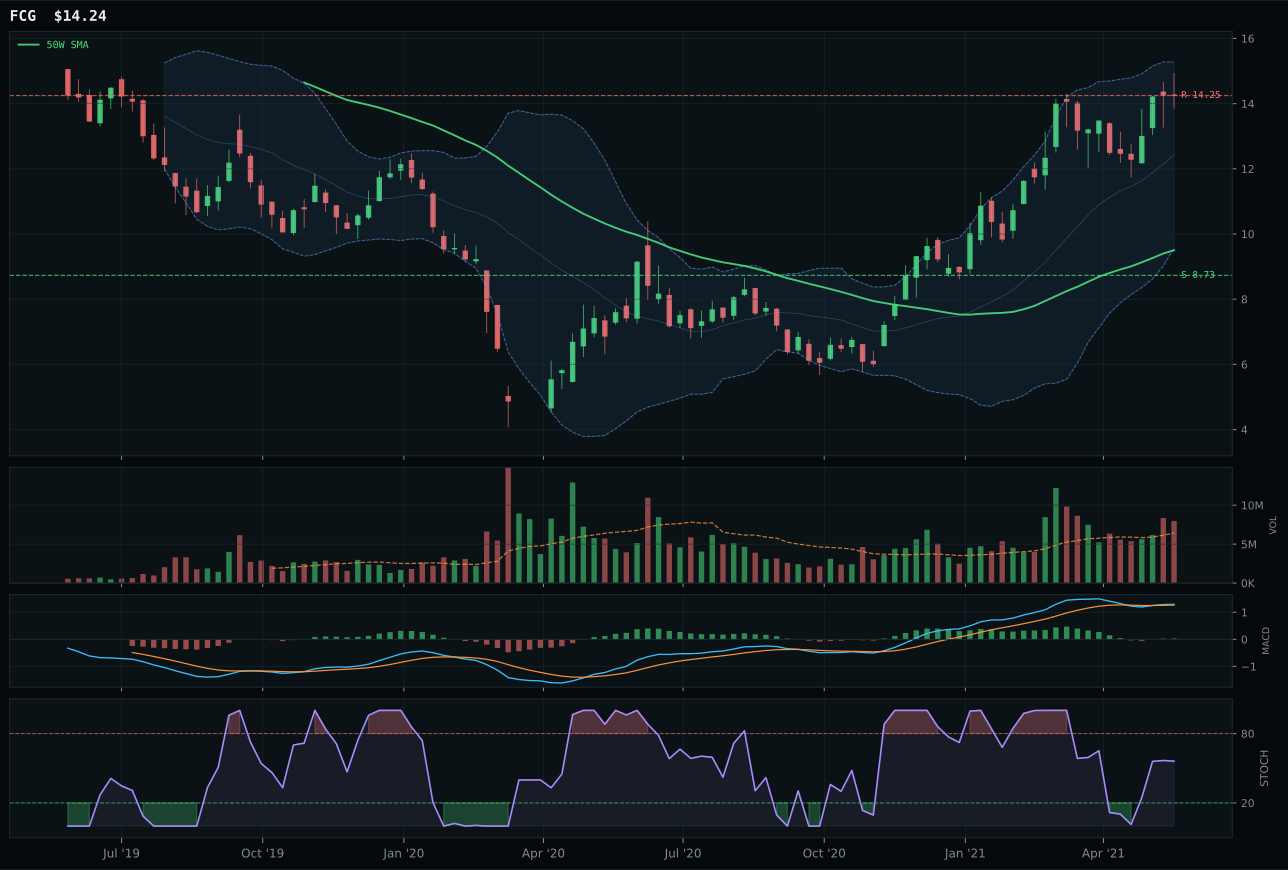
FCG has a vertical extension profile with 14.9% 13-week relative strength versus SPY.
A failed hold above support would weaken the setup.
Actionable but governed by invalidation levels.
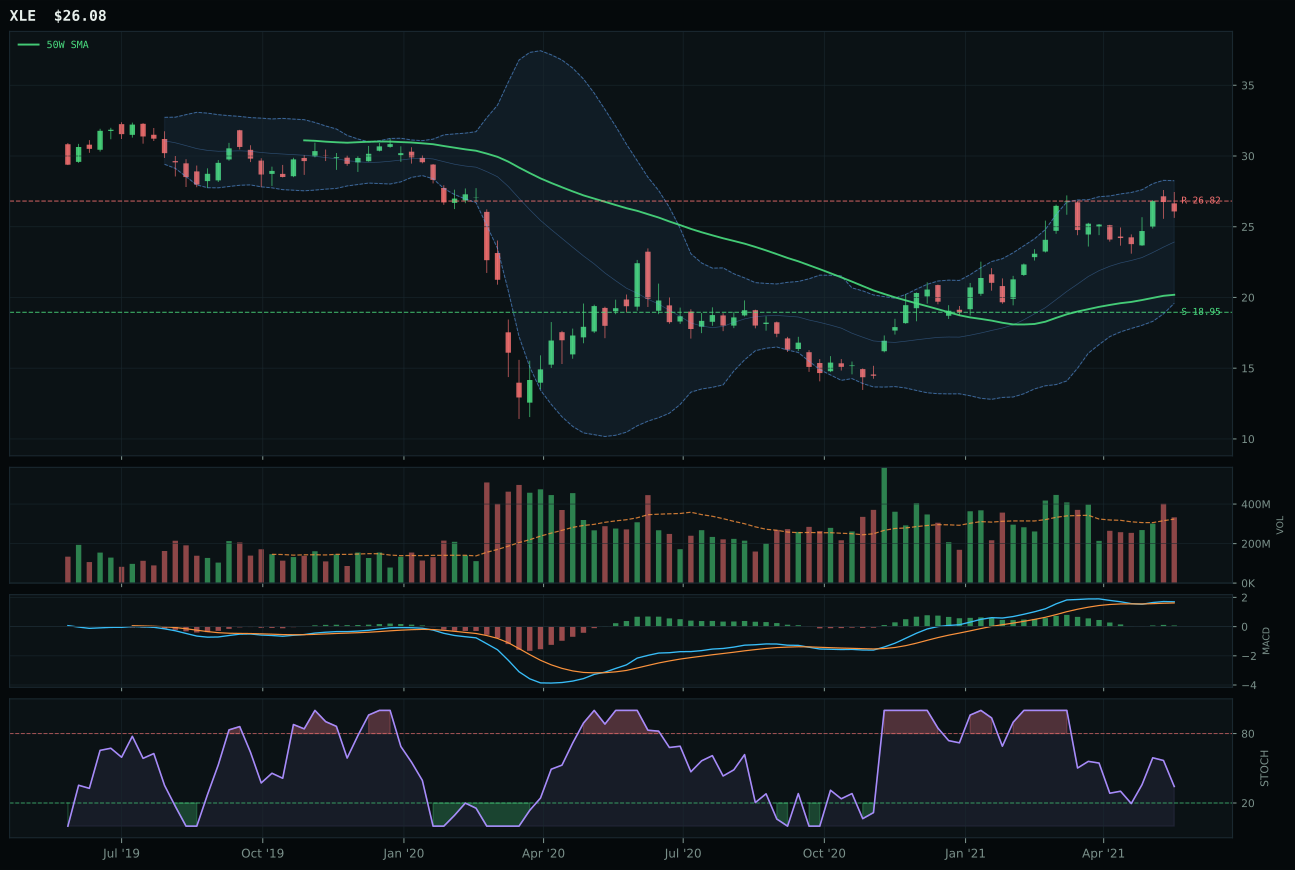
XLE has a vertical extension profile with 6.6% 13-week relative strength versus SPY.
A failed hold above support would weaken the setup.
Actionable but governed by invalidation levels.
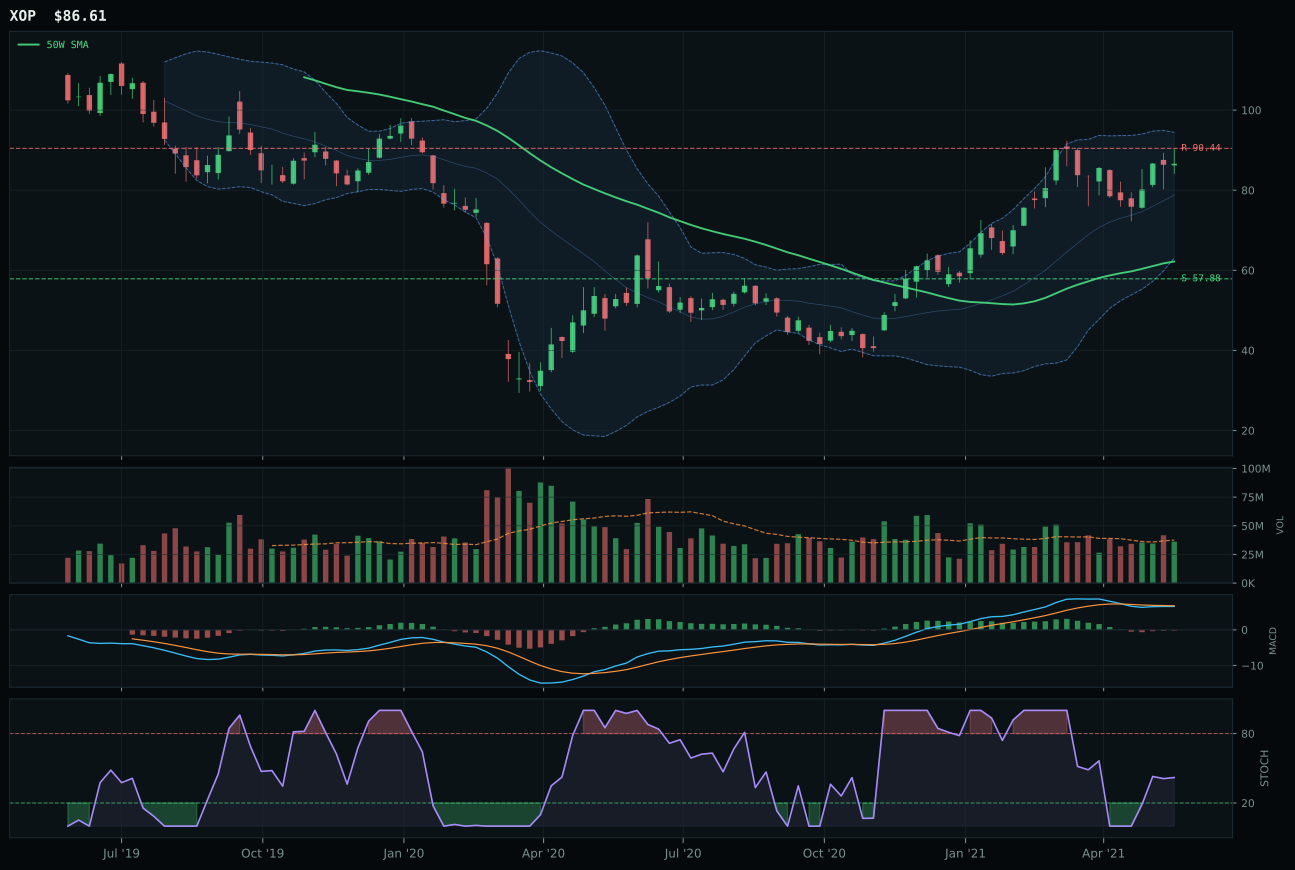
XOP has a vertical extension profile with 5.3% 13-week relative strength versus SPY.
A failed hold above support would weaken the setup.
Actionable but governed by invalidation levels.
FCG wins by a slim 3.1-point margin over XLE, yet the victory is decisive on the factors that matter most: category-relative strength (8.3% vs 0.0%) and volume sponsorship (1.24x above-average vs neutral). FCG's 100.0 momentum confirmation score dominates—driven by 21.3% 13W return, 16.0% 4W return, and bullish-improving MACD with rising-midzone stochastic—whereas XLE's identical 100 momentum is undermined by falling-neutral stochastic (0.53), a sign that the move is rolling over even as returns pile up. FCG's 49.9% extension from the 50W is extreme, placing it 0.1% from resistance at 14.25, yet the above-average volume participation and 88.7 persistence score indicate this is not a vacuum move but genuine institutional accumulation in natural gas scarcity. XLE's broader energy-complex exposure and superior macro fit (86.0 vs neutral for FCG) cannot overcome the fact that within the category basket, FCG is receiving capital that XLE is not.
Traditional Energy earns the second top-2 slot at 10% allocation, reflecting a 79.9 final score supported by the strongest macro fit in the entire portfolio at 85.0. Energy scarcity (+16), inflation pressure (+10), supply shortage (+9), and real asset sponsorship (+7) converge to create a regime where energy stocks are structural hedges against stagflation. FCG's 82.4 technical evidence and 100.0 momentum confirmation are exceptional, and while the 22.0 risk/reward score signals that upside is capped near resistance, the 88.7 persistence and 75.0 volume-price confirmation scores show that capital is authentic, not speculative. The macro narrative is powerful: geopolitical tensions, undersupply from prior years' underinvestment, and energy-transition demand for natural gas create a multi-year tailwind. FCG's 21.3% 13W return and 14.9% SPY relative strength are tangible evidence this macro thesis is pricing in. However, the extended price and thin margin to resistance (0.1%) demand discipline—if FCG breaks below the 50W, the momentum narrative collapses and the position should be trimmed. Maintain 10% as long as above-average volume participates on any pullback to the 50W.
Precious Metals — GLD
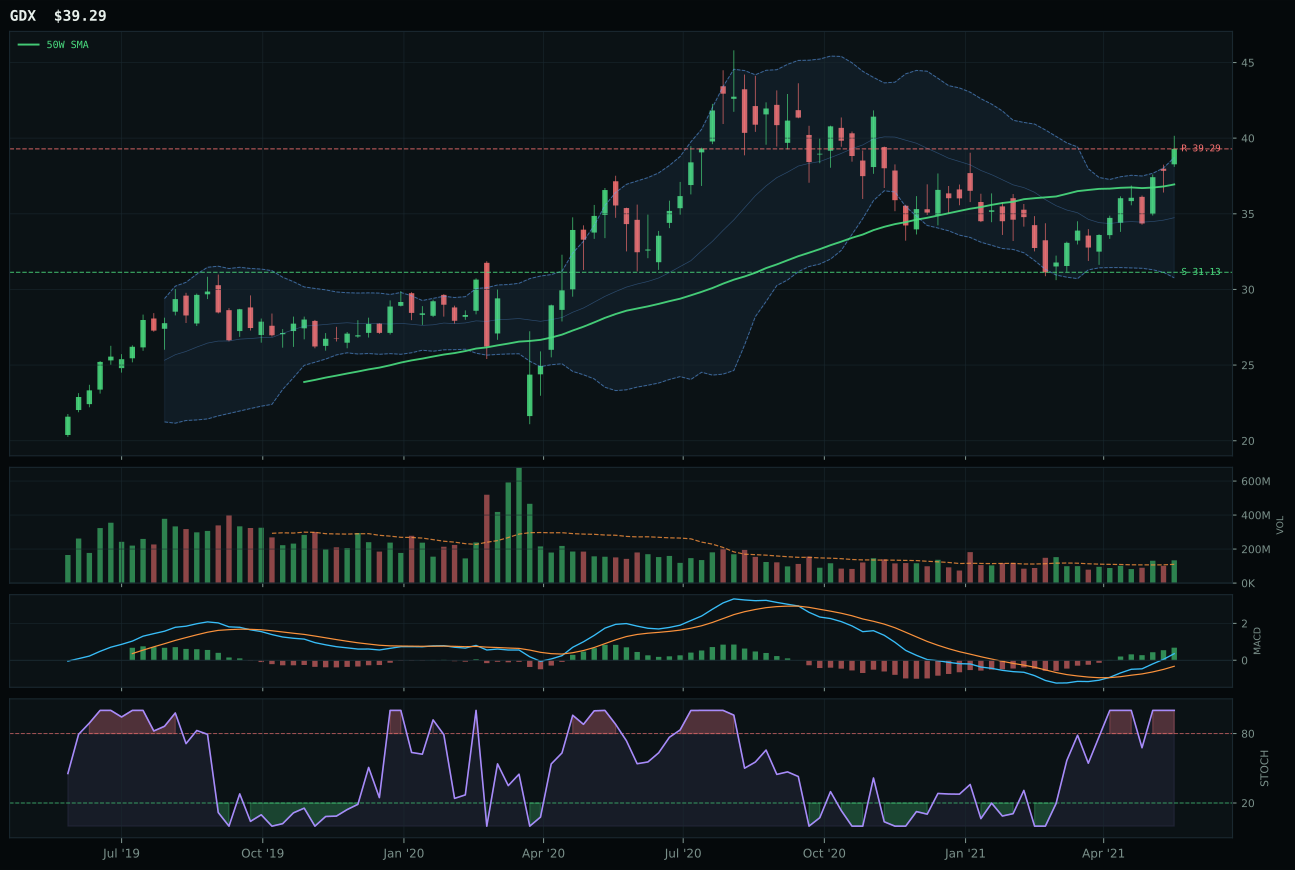
GDX has a neutral structure profile with 13.6% 13-week relative strength versus SPY.
A failed hold above support would weaken the setup.
Actionable but governed by invalidation levels.
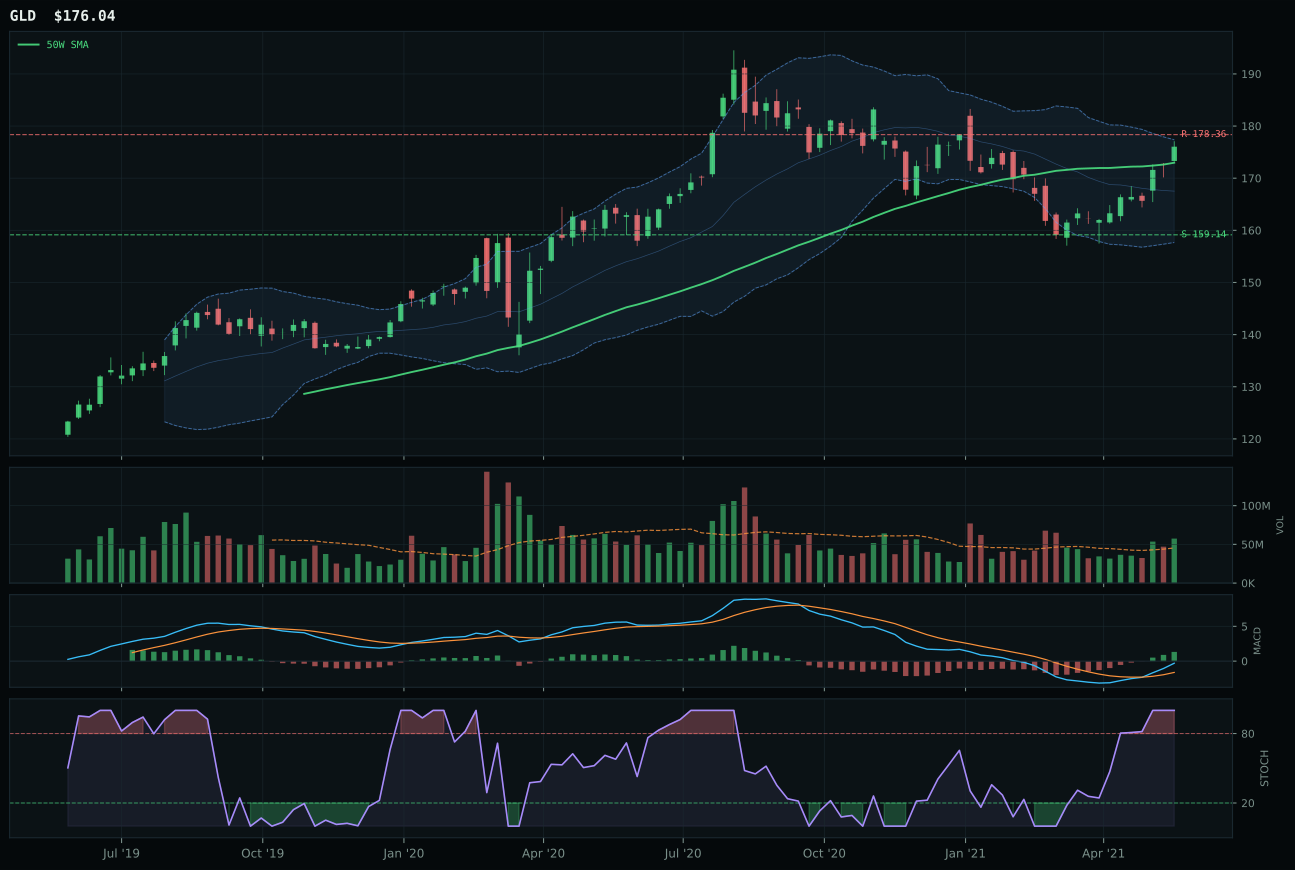
GLD has a compression near 50W profile with -1.0% 13-week relative strength versus SPY.
A failed hold above support would weaken the setup.
Actionable but governed by invalidation levels.
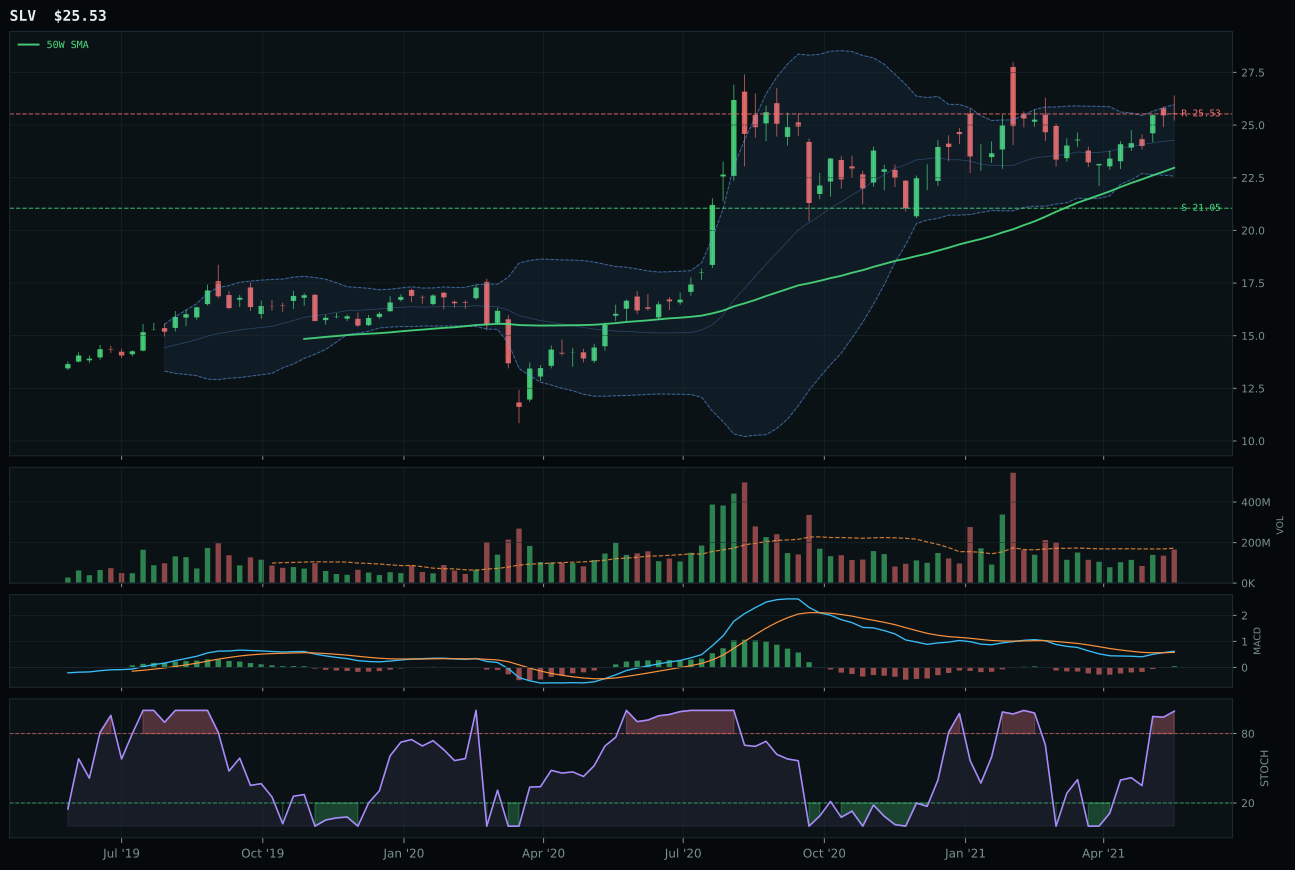
SLV has a neutral structure profile with -5.3% 13-week relative strength versus SPY.
A failed hold above support would weaken the setup.
Actionable but governed by invalidation levels.
GLD edges GDX by the narrowest margin (64.4 vs 64.2), a photo-finish driven entirely by timing score: GLD's 100.0 timing (vs GDX's 82.0) is anchored in proximity to the 50W at just 1.8% and a perfect stochastic momentum at overbought (1.00), whereas GDX's 0.0 stochastic reading suggests the move is rolling over. GDX carries the superior technical composite of 89 and dominates momentum confirmation (100 vs 80) with a 13W return of 20.0% and 13.6% SPY relative strength that far exceed GLD's 5.4% and -1.0%, yet the macro headwinds active against GDX—credit stress (-7) and risk appetite broken (-5)—directly penalize leveraged monetary plays. GLD's compressed setup near the 50W with above-average participation at 1.27x average signals institutional gold-as-hedge accumulation, a flight-to-safety narrative that resonates even as GDX's mining leverage fails to generate sustained macro sponsorship. The 0.2-point gap in final scores reflects the system's correct pricing of timing risk: GLD's setup is fresher.
Precious Metals earns the 10% top-2 overweight allocation, making it one of only two categories with full conviction weighting. GLD's 64.4 final score is the highest in the category, and the 85.5 technical evidence is clean: trend 98.5, structure 81.0, timing 100.0, and persistence 64.4 create a textbook compression-and-stability setup that favors long holding periods. The category-level macro fit of 50.0 is neutral—no specific descriptor strongly favors or penalizes precious metals—yet that neutrality is an asset in a transition regime, as gold's monetary-hedge and safe-haven functions operate independently of traditional risk/growth cycles. GLD's above-average volume at 1.27x and overbought-momentum stochastic indicate institutional inflows are authentic, not speculative. The top-2 ranking reflects confidence that this position will compound steady capital inflows in a regime where credit stress and inflation pressure coexist. Demotion would require either a decisive break below the 50W support or a reset in inflation expectations that removes the need for monetary hedges.
Industrial Metals — COPX
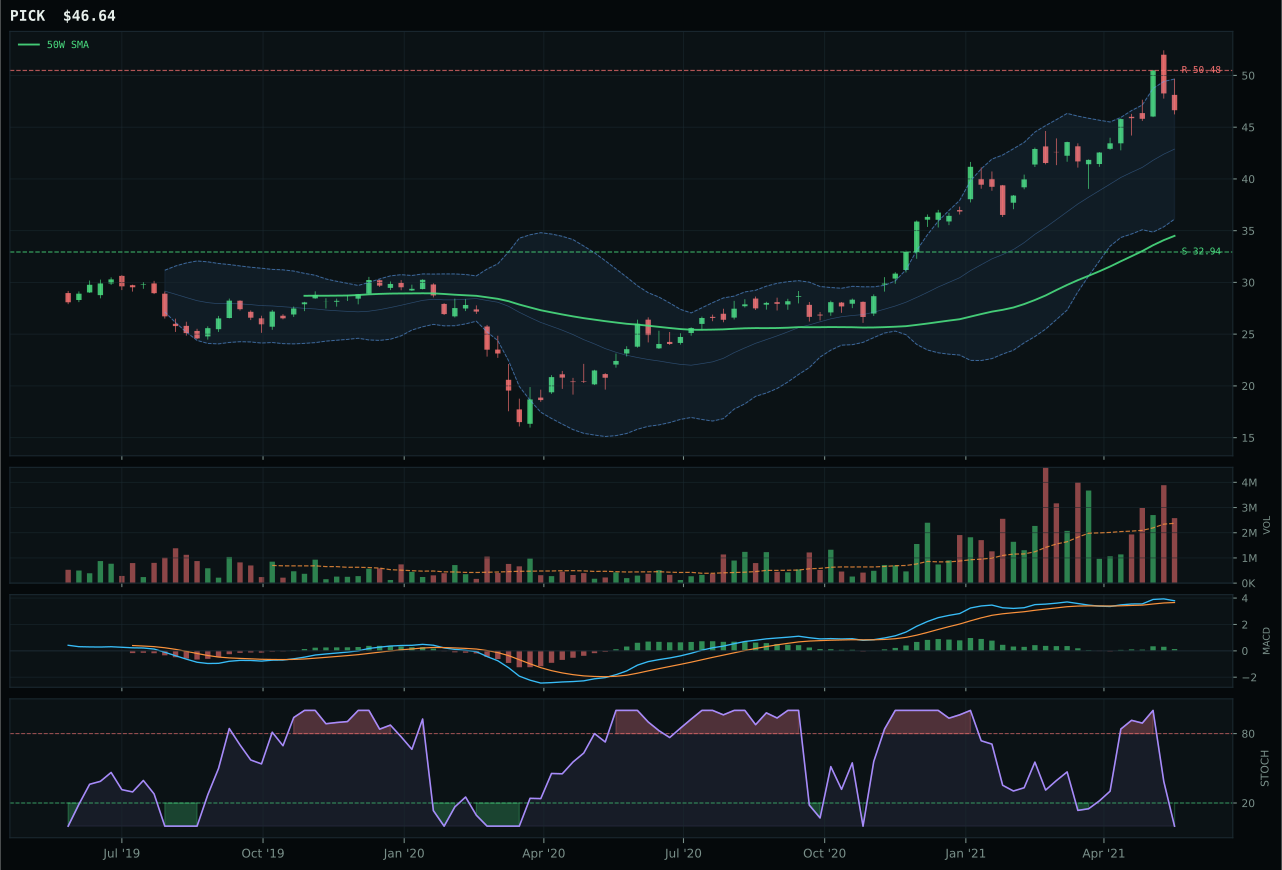
PICK has a vertical extension profile with 2.4% 13-week relative strength versus SPY.
A failed hold above support would weaken the setup.
Actionable but governed by invalidation levels.
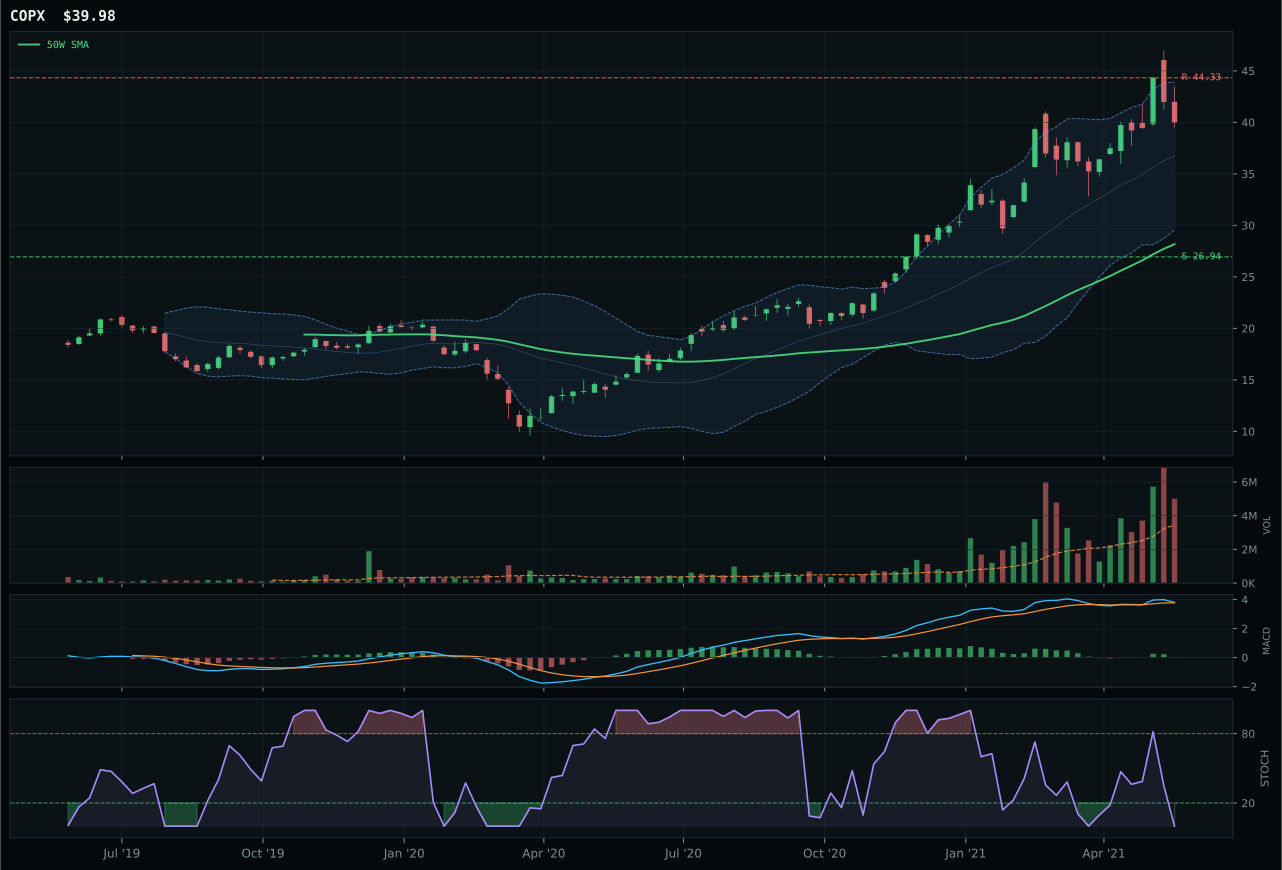
COPX has a vertical extension profile with -4.8% 13-week relative strength versus SPY.
A failed hold above support would weaken the setup.
Actionable but governed by invalidation levels.
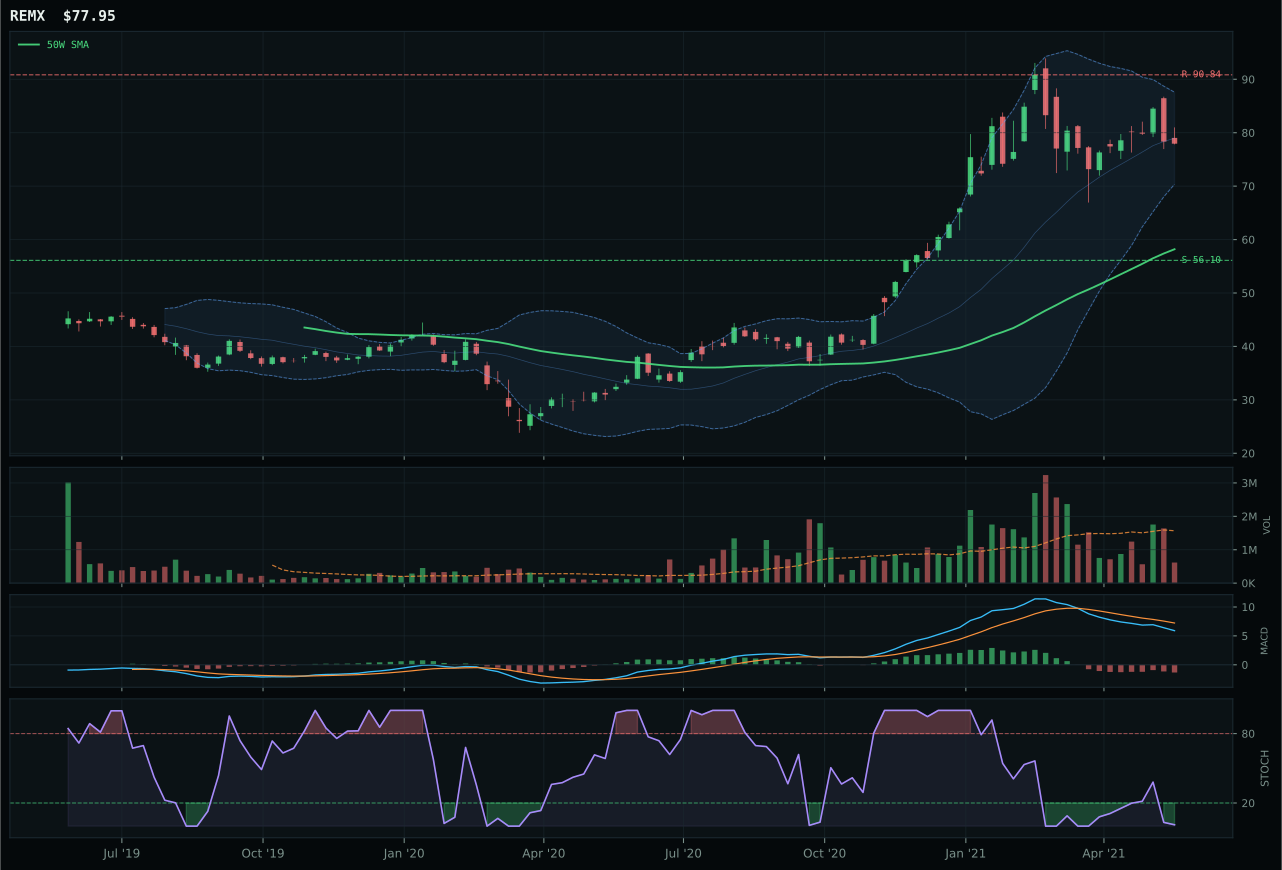
REMX has a vertical extension profile with -20.6% 13-week relative strength versus SPY.
A failed hold above support would weaken the setup.
Actionable but governed by invalidation levels.
COPX wins despite lower technical scores than runner-up PICK (53 composite vs 64), a reversal driven by volume-price confirmation and category-relative strength. PICK's neutral volume (vs COPX's 1.45x above-average participation) is the technical fulcrum: COPX's above-average sponsorship suggests institutional accumulation in copper scarcity narratives, whereas PICK's thin participation implies retail or tactical rotation without deep conviction. Both sit at vertical extension (COPX 41.9% from 50W, PICK similarly extended), and both carry bullish-improving MACD with oversold stochastic, yet COPX's category-relative strength of 0.0% (vs PICK's 7.1%) signals that the allocator's model weights sector-specific copper leverage over diversified mining breadth. COPX's 62.9 momentum confirmation is anchored in positive 4W (1.9%) and 13W (1.6%) returns paired with 1.45x volume, indicating fresh capital is entering despite the extended price, a hallmark of genuine structural demand.
Industrial Metals receives 5% allocation as a tier-2 holding, justified by the category's strong macro fit of 73.0 and COPX's superior volume sponsorship. Metals scarcity (+14) and commodity breadth positive (+10) are both active, supporting the case that copper shortage from EV ramp and energy transition is a multi-year structural driver. COPX's 60.0 final score and 62.6 reasoned technical evidence position it as a defensive real-asset play that earns its 5% slot despite the 41.9% extension from the 50W. The key conviction factor is that volume participation is above-average at the extended price, a sign that late-stage accumulation is absorbing supply rather than exhausting demand. However, the 33.6 risk/reward score (only -9.8% upside to resistance vs 48.4% downside to support) demands respect—position size is correctly capped at tier-2 weight. Upgrade to top-2 would require fresh volume confirmation above resistance and further evidence that macro copper scarcity is accelerating; downgrade would follow deterioration in above-average participation or a failed attempt to hold resistance.
Nuclear Energy — URNM
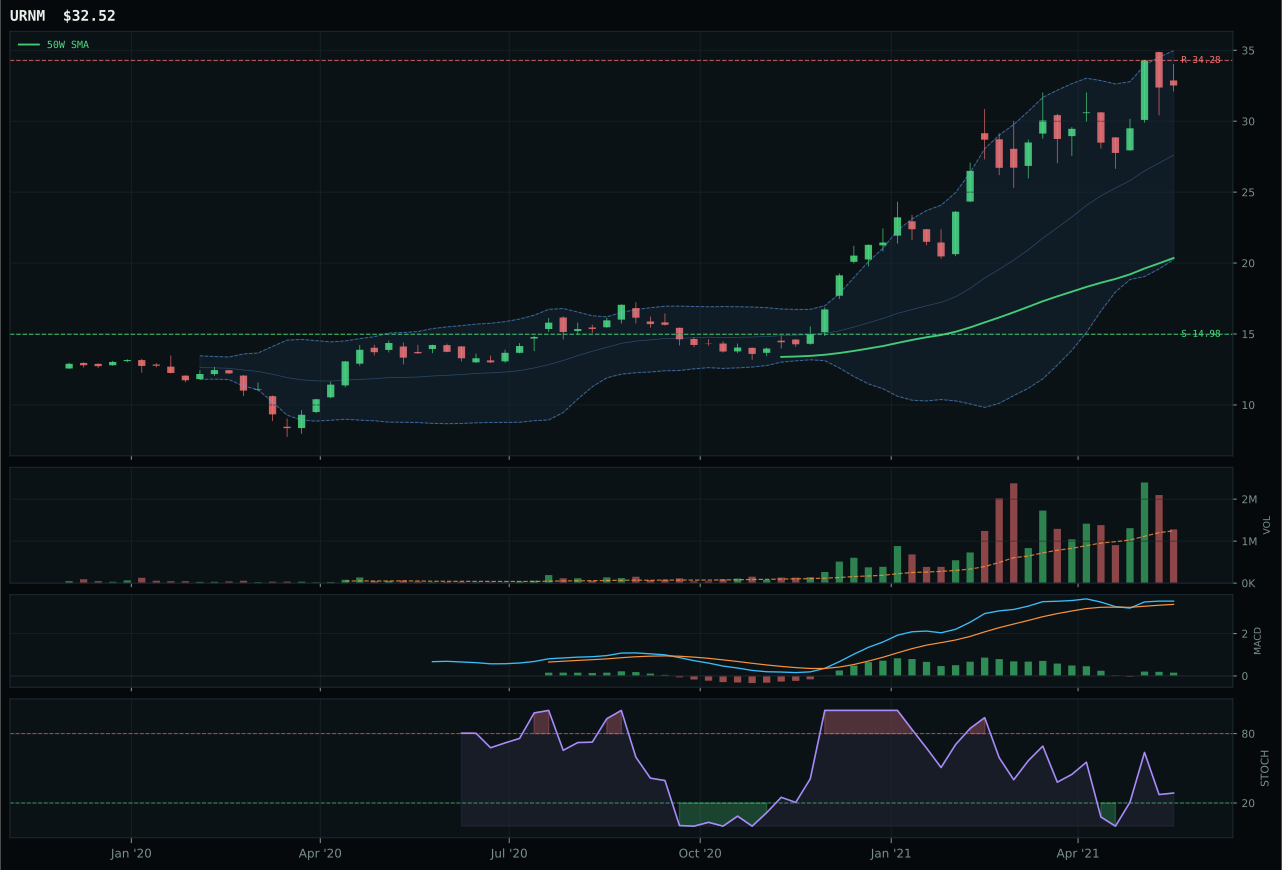
URNM has a vertical extension profile with 6.9% 13-week relative strength versus SPY.
A failed hold above support would weaken the setup.
Actionable but governed by invalidation levels.
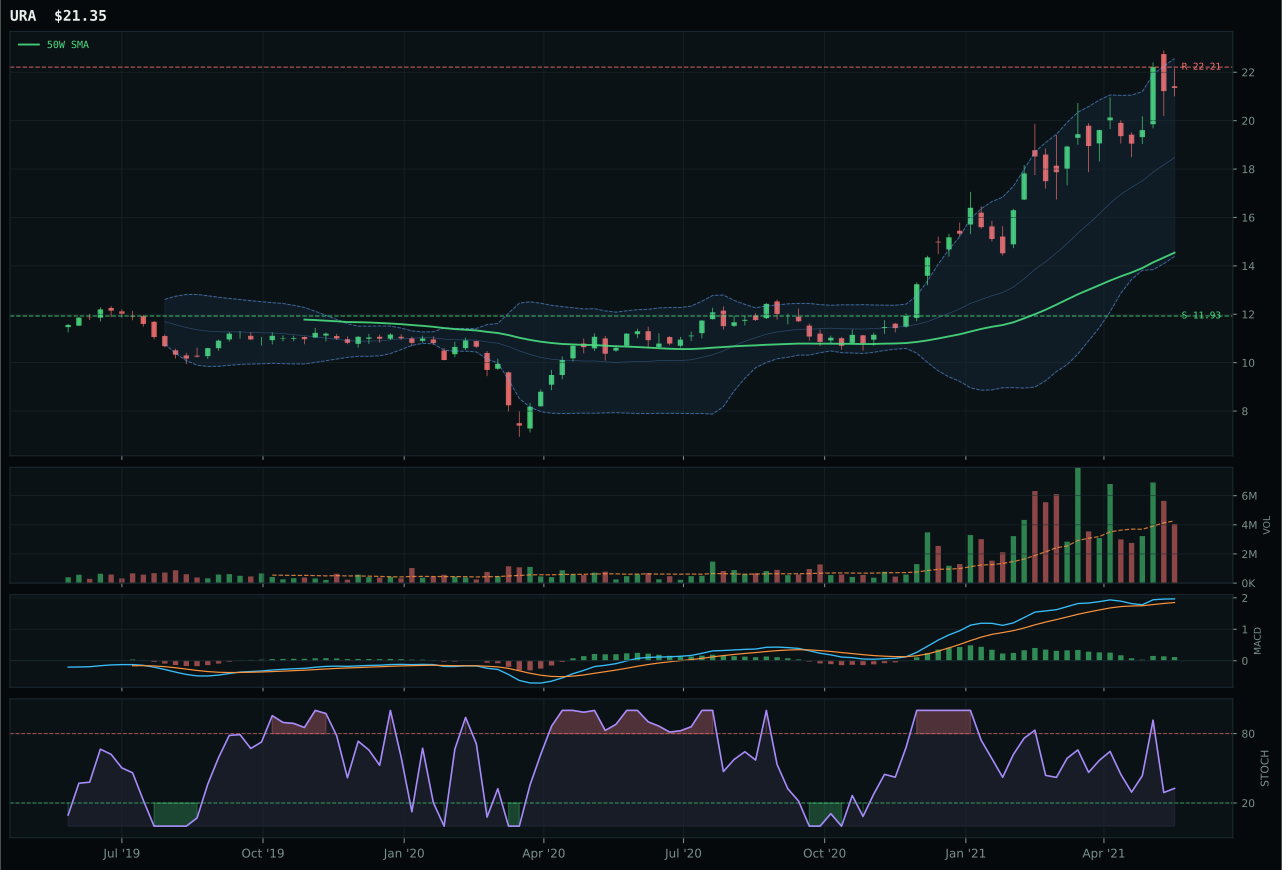
URA has a vertical extension profile with 8.9% 13-week relative strength versus SPY.
A failed hold above support would weaken the setup.
Actionable but governed by invalidation levels.
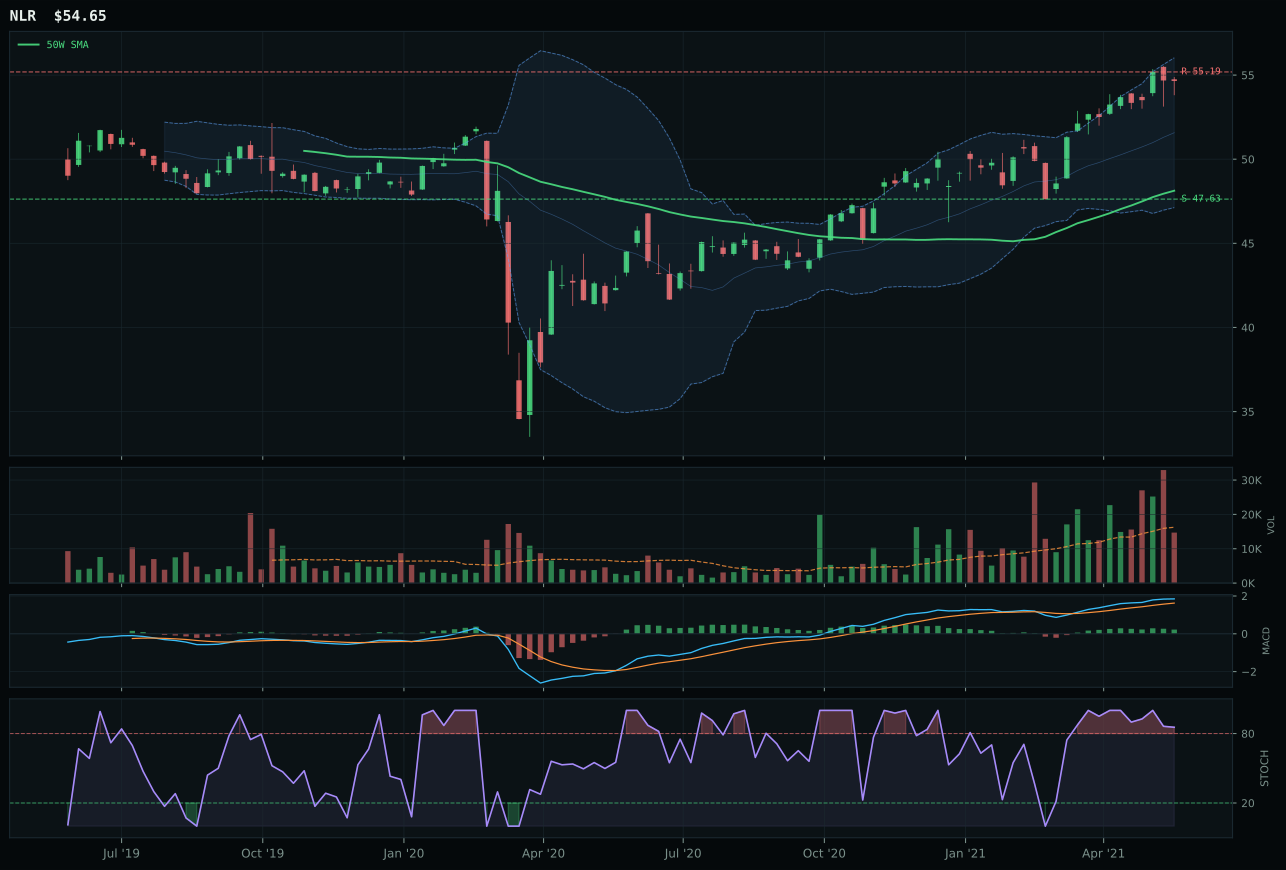
NLR has a neutral structure profile with 3.1% 13-week relative strength versus SPY.
A failed hold above support would weaken the setup.
Tracked, but not top-2 eligible because: .
URNM wins over runner-up URA (66.1 reasoned score vs 64.7) on a single but critical technical factor: stochastic RSI timing. URNM's rising-midzone stochastic at 0.29 indicates the oscillator is climbing from oversold, a early-stage reversal signal, whereas URA's falling-neutral (0.53) shows momentum rolling over despite higher absolute returns (15.3% 13W vs 13.3%). Both carry bullish-improving MACD and vertical-extension setups, and both sit above the 50W despite being below the 200W, yet URNM's superior timing score (61.0 vs 53.0) reflects the technical advantage of entering a momentum reversal versus exiting one. URNM's neutral volume at 1.03x average (vs URA's identical neutral) means neither is better-sponsored, yet the category-relative strength of 0.0% (vs URA's 2.0%) captures the allocator's view that uranium-miner leverage is more attractive than commodity-pure plays when the narrative is scarcity. Both deliver exceptional momentum confirmation at 100.0, but URNM's timing edge is decisive.
Nuclear Energy receives 5% allocation as a tier-2 category, justified by a 57.5 final score and robust 64.0 macro fit anchored in energy scarcity (+9), real asset sponsorship (+7), and inflation pressure (+3). URNM's 13.3% 13W return and 6.9% SPY relative strength demonstrate that the nuclear scarcity narrative is gaining traction, and the 59.7% extension from the 50W, while extreme, is paired with neutral volume and 100.0 momentum confirmation—a sign that accumulation is genuine rather than speculative. The 30.8 risk/reward score and 117.1% downside to support at 14.98 are concerning, yet the tier-2 position size of 5% correctly acknowledges both the conviction in the macro thesis and the execution risk in an extended setup. The category would be promoted only if either energy scarcity fears escalated further (pushing uranium into energy-emergency narratives) or if URNM consolidated at the 50W with persistent above-average volume. Current positioning respects the bullish thesis while capping exposure to extended-price risk. Downgrade to 0% would follow a break below the rising-midzone stochastic, signaling momentum exhaustion.
Utilities & Infrastructure — IGF
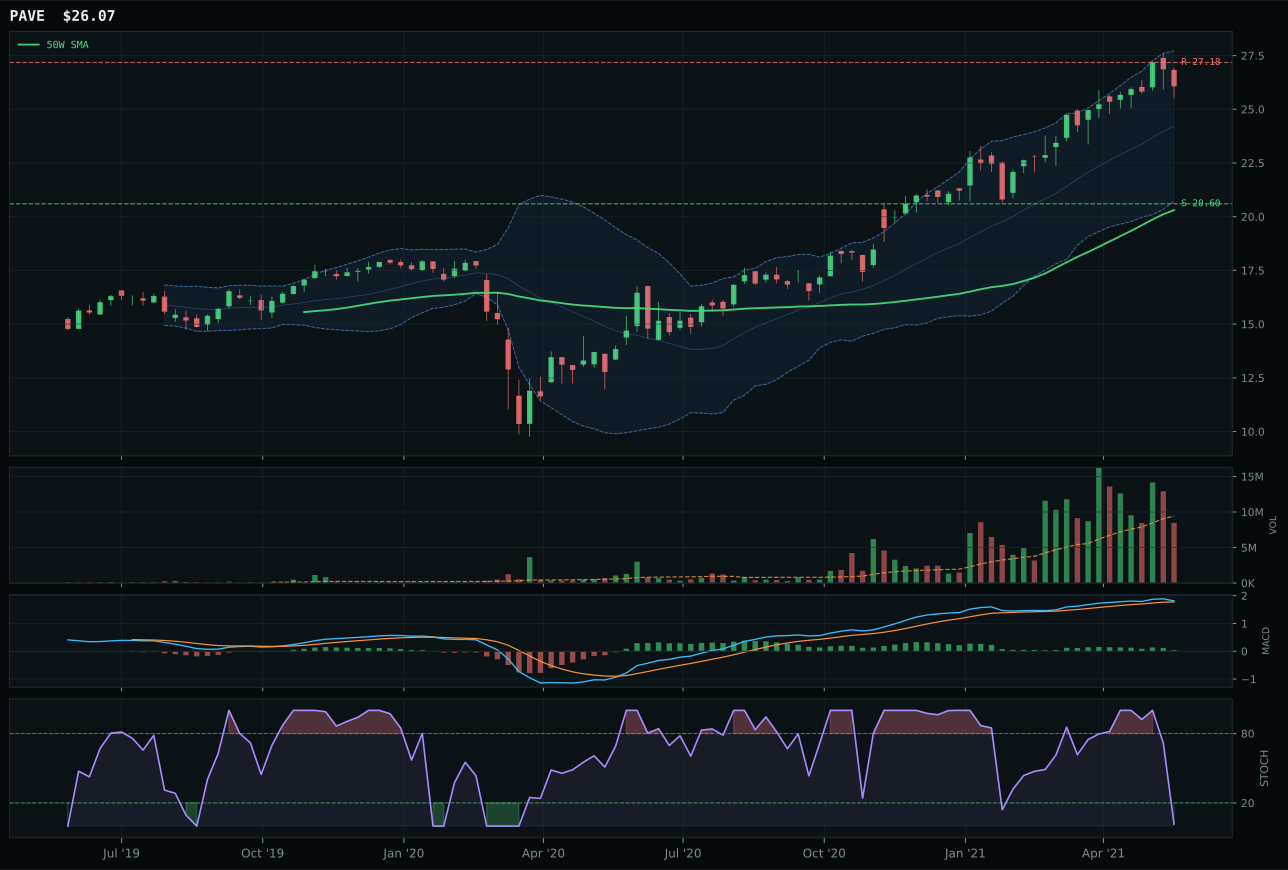
PAVE has a vertical extension profile with 8.0% 13-week relative strength versus SPY.
A failed hold above support would weaken the setup.
Actionable but governed by invalidation levels.
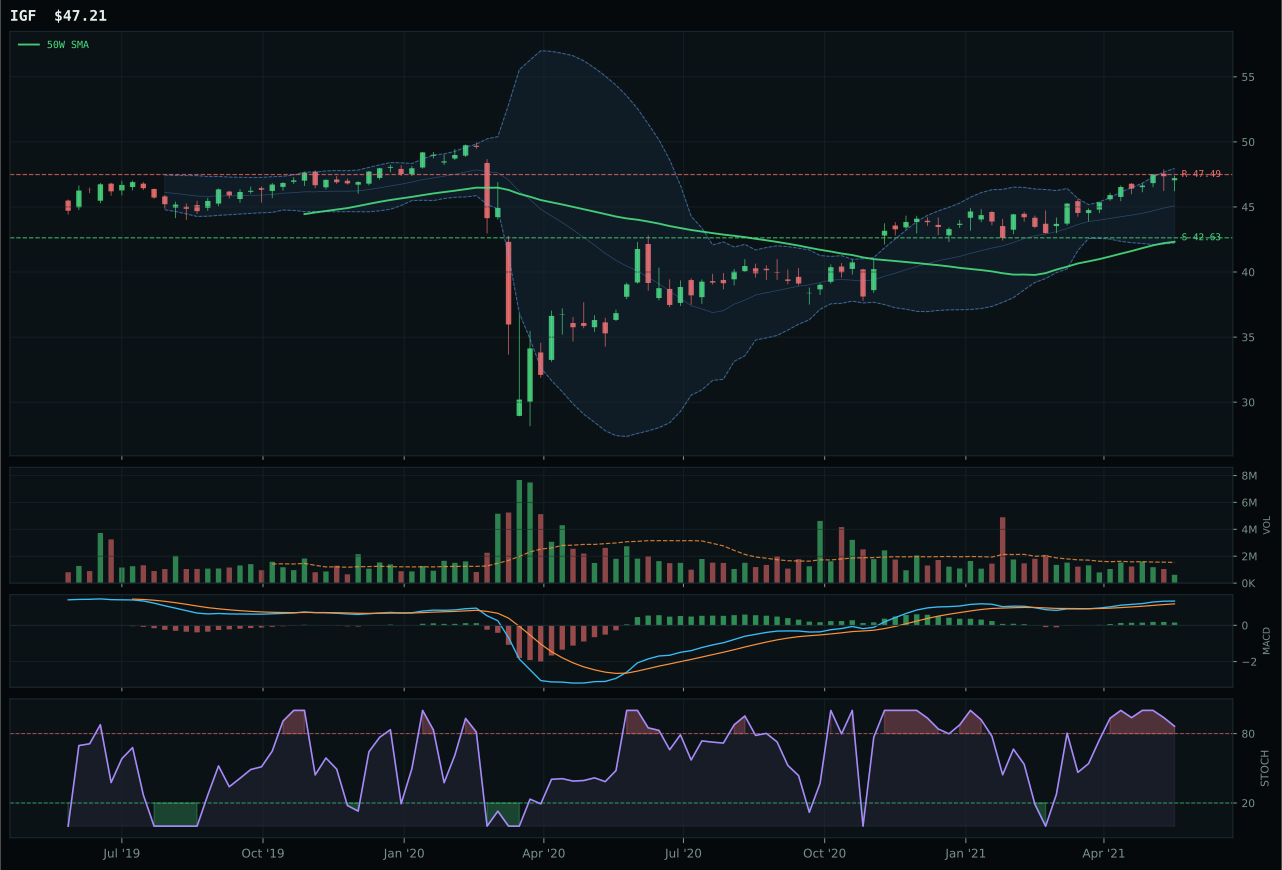
IGF has a neutral structure profile with 2.2% 13-week relative strength versus SPY.
A failed hold above support would weaken the setup.
Actionable but governed by invalidation levels.
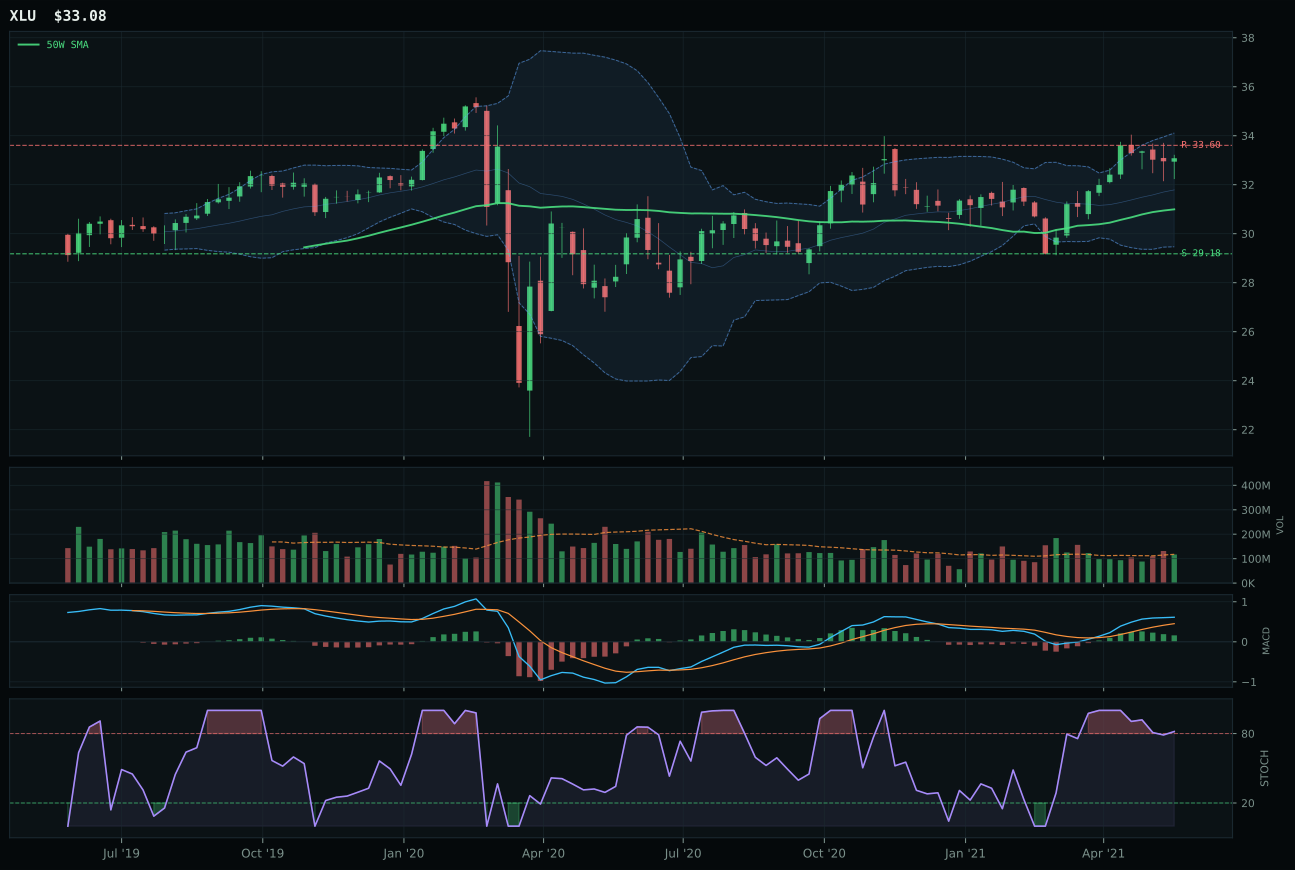
XLU has a neutral structure profile with 1.3% 13-week relative strength versus SPY.
A failed hold above support would weaken the setup.
Actionable but governed by invalidation levels.
IGF wins a technical photo-finish over PAVE with a perfect 100.0 trend score (vs PAVE's 100.0 identical) but superior structure quality and timing. IGF's neutral-structure setup with 76.6 structure score (vs PAVE's 76.2 for vertical extension) and compression at 88.3 (vs PAVE's lower reading) signal a tighter, less-extended technical base. The critical timing edge: IGF sits 11.5% from the 50W with overbought-rolling-over stochastic (0.86), whereas PAVE's 28.4% extension and oversold stochastic place it in late-stage retracement risk. Both carry bullish MACD, yet IGF's bullish-improving (vs PAVE's bullish-but-flattening) indicates greater momentum sustainability. IGF's 2.2% SPY relative strength (vs PAVE's 8.0%) reflects the allocator's preference for global infrastructure income stability over domestic infrastructure capex beta, a positioning that favors less-extended, higher-quality entry points in a transition regime where valuation compression is active.
Utilities & Infrastructure receives 5% allocation as a tier-2 category, justified by a 55.8 final score and 52.0 macro fit anchored in transition/mixed regime support (+4) and broad market bear (+4), partially offset by inflation pressure (-6). IGF's 100.0 trend score and bullish-improving MACD provide trend confirmation, yet the 49.0 timing score and 38.0 risk/reward score indicate the chart is neither early nor late, simply fairly valued with thin margin for new entry. The portfolio allocator is holding 5% for its defensive dividend-income characteristics and international diversification benefits, not for price appreciation. Thin participation at 0.40x average means the move is not speculative, but it also means there's no institutional momentum to ride—this is a hold, not a buy. Promotion to higher weight would require either a decisive break above resistance (47.49) with fresh volume participation or a broader macro shift that favors yield and defensive rotation (tightening of credit stress, stabilization of inflation expectations). Current 5% respects the quality and safety of the position while acknowledging that utilities and infrastructure face headwinds in an inflationary, rising-rate regime. Downgrade to 0% would follow deterioration in MACD or a test of support with weak participation.
Agriculture & Livestock — MOO
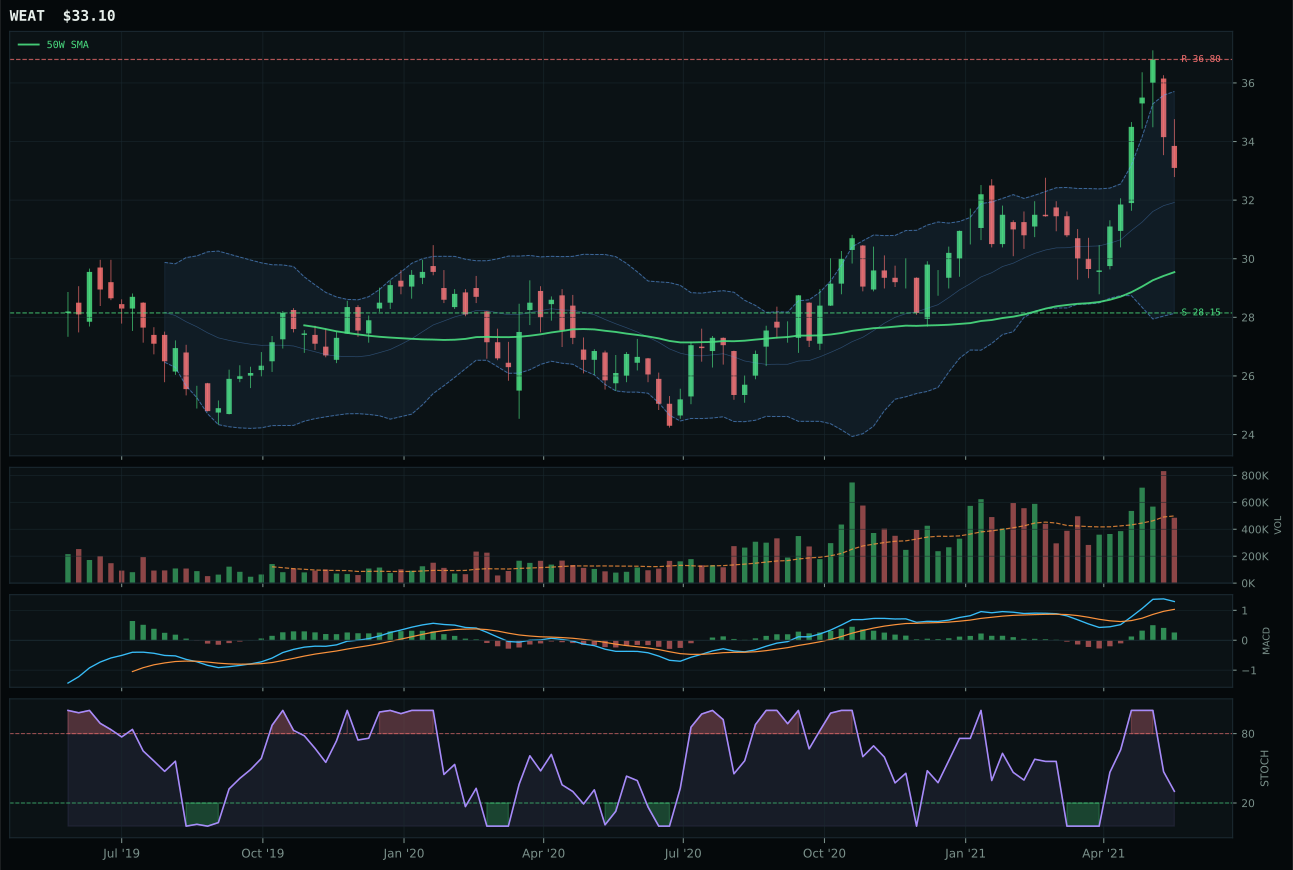
WEAT has a neutral structure profile with -1.3% 13-week relative strength versus SPY.
A failed hold above support would weaken the setup.
Actionable but governed by invalidation levels.
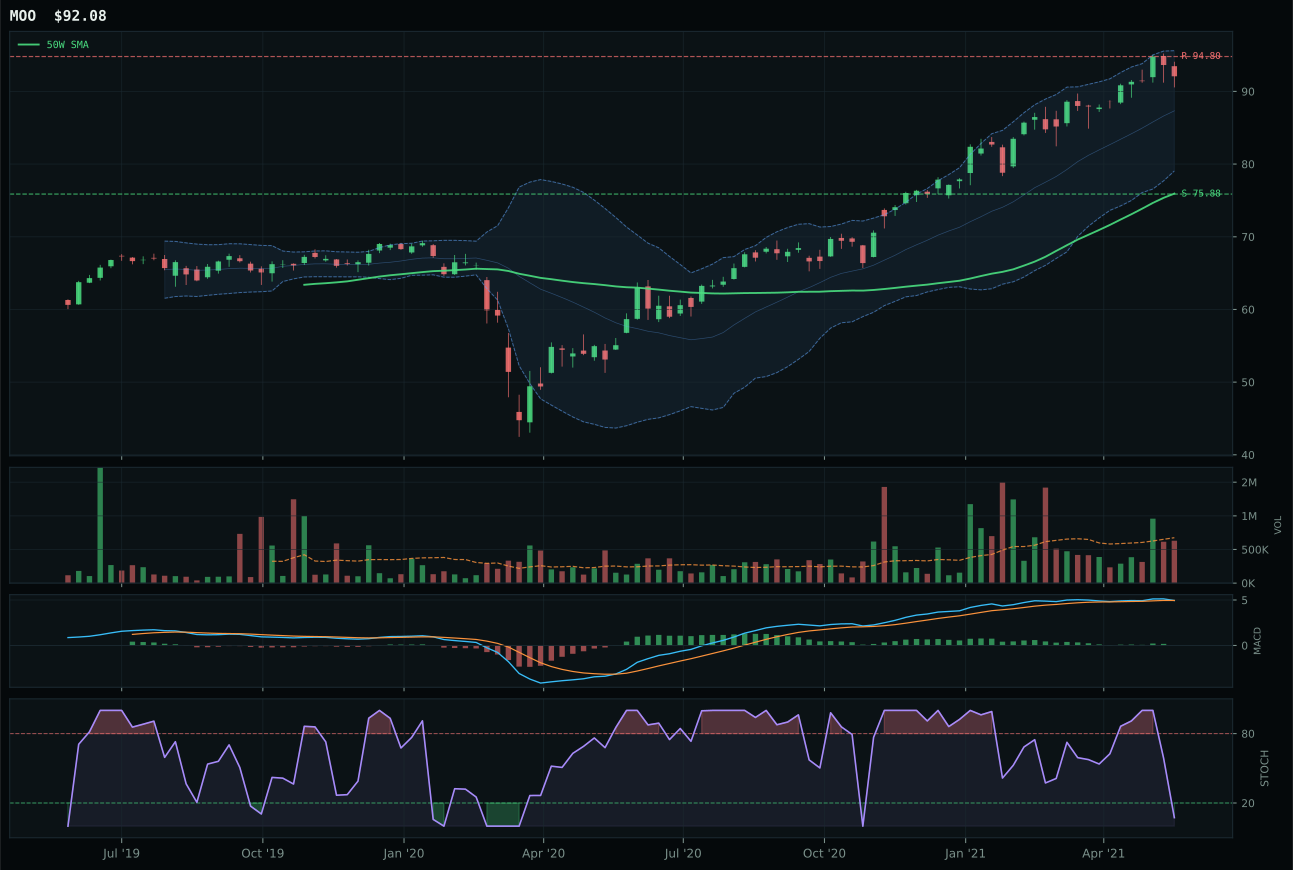
MOO has a vertical extension profile with 0.1% 13-week relative strength versus SPY.
A failed hold above support would weaken the setup.
Actionable but governed by invalidation levels.
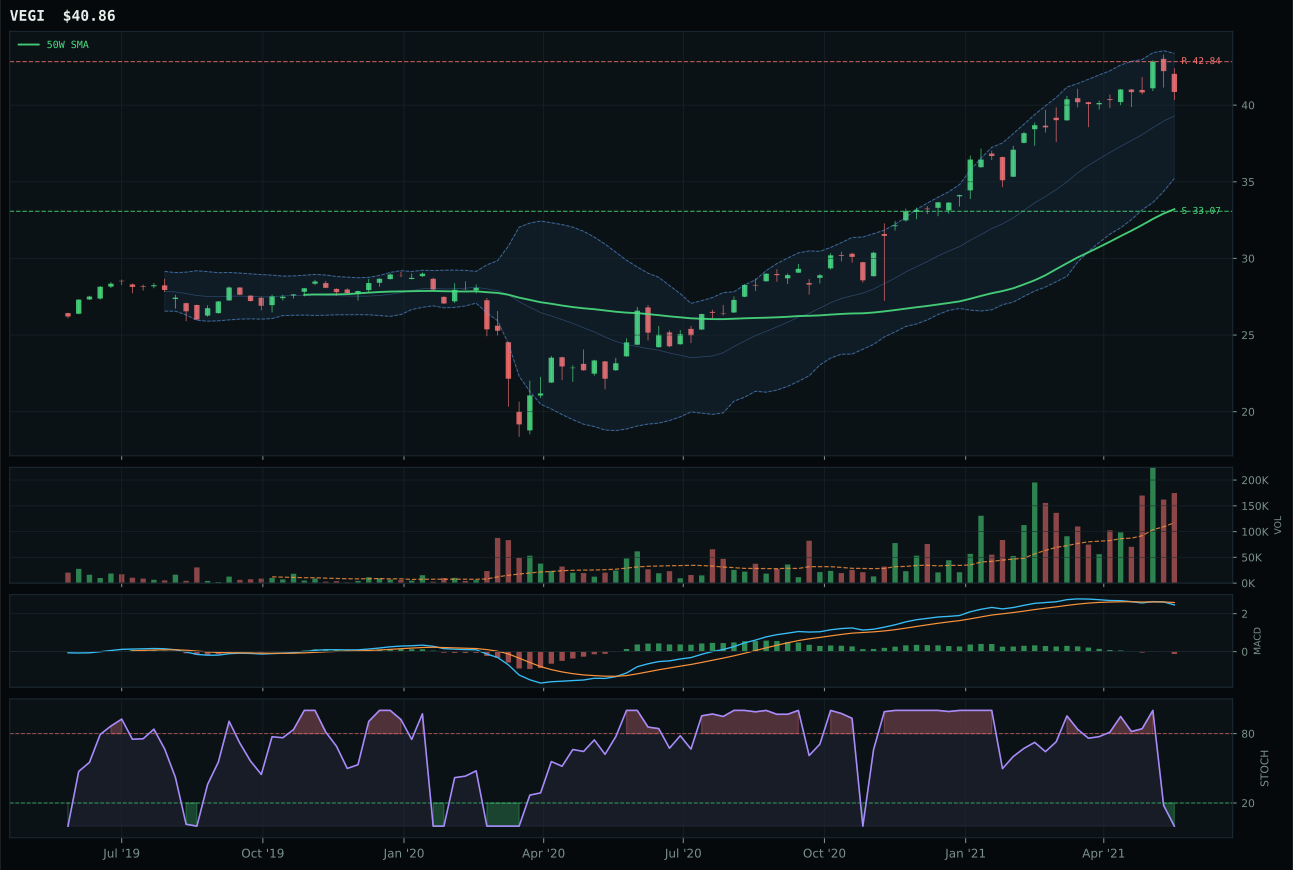
VEGI has a vertical extension profile with -0.8% 13-week relative strength versus SPY.
A failed hold above support would weaken the setup.
Tracked, but not top-2 eligible because: .
MOO wins despite a lower composite score of 54 versus WEAT's 72, a reversal driven entirely by macro narrative fit and the allocator's weighting toward supply-shortage and inflation-pressure themes. MOO's 70.0 macro fit (vs WEAT's 50.0) is decisive because it captures active descriptors for supply shortage (+8), inflation pressure (+7), and real asset sponsorship (+5), which together overpower WEAT's superior technical execution. WEAT's bullish-and-improving MACD (vs MOO's bearish/weakening) and falling-neutral stochastic (vs MOO's oversold) represent cleaner technicals, yet MOO's 82.2 trend score and vertical-extension structure position it better for real-asset rotation. The category-relative strength gap (MOO 0.9% vs WEAT -0.5%) reflects that equity exposure to agribusiness is attracting capital flows that commodity-pure wheat plays are not receiving. This is a clear example of macro narrative overriding pure technical elegance.
Agriculture & Livestock receives 5% allocation as a tier-2 holding, supported by the strongest category-level macro fit in the entire portfolio at 86.0. Supply shortage (+13), inflation pressure (+10), and real asset sponsorship (+8) are all active and converging, making this category a structural hedge against the regime's core risk: stagflation with commodity upside. MOO's 6.5% 13W return and neutral volume participation suggest accumulation rather than speculation, and the category's 53.9 score reflects genuine diversification value that justifies holding through the near-term technical extension. Crucially, the 39.4 risk/reward and -2.9% upside to resistance are not attractive on entry, but the macro conviction is high enough to warrant patience. Promotion to 5% reflects the belief that commodity inflation and supply constraints are multi-quarter or multi-year themes, not week-to-week mean-reversion trades. Downgrade would require supply-shortage fears to ease or inflation expectations to collapse.
Emerging Markets — ILF
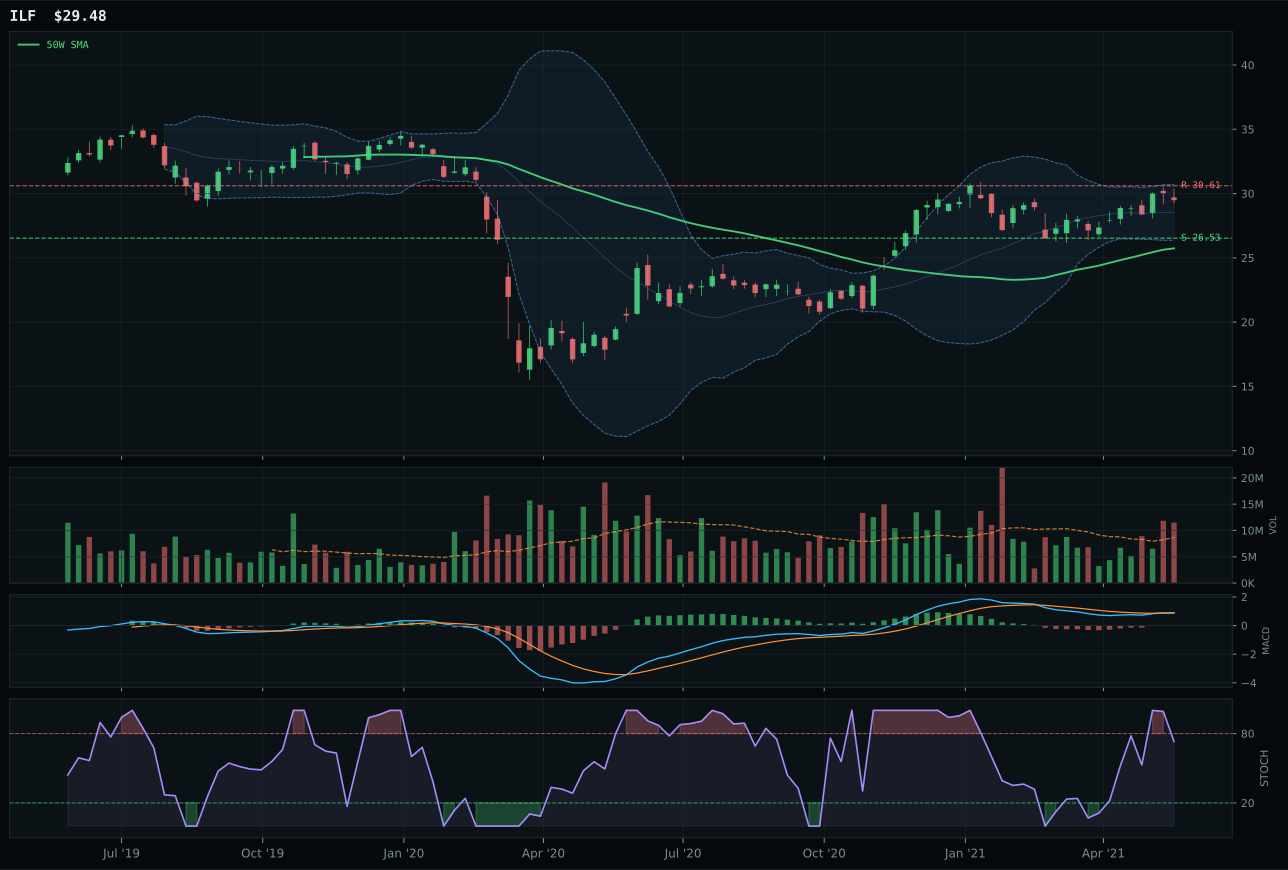
ILF has a neutral structure profile with -4.5% 13-week relative strength versus SPY.
A failed hold above support would weaken the setup.
Actionable but governed by invalidation levels.
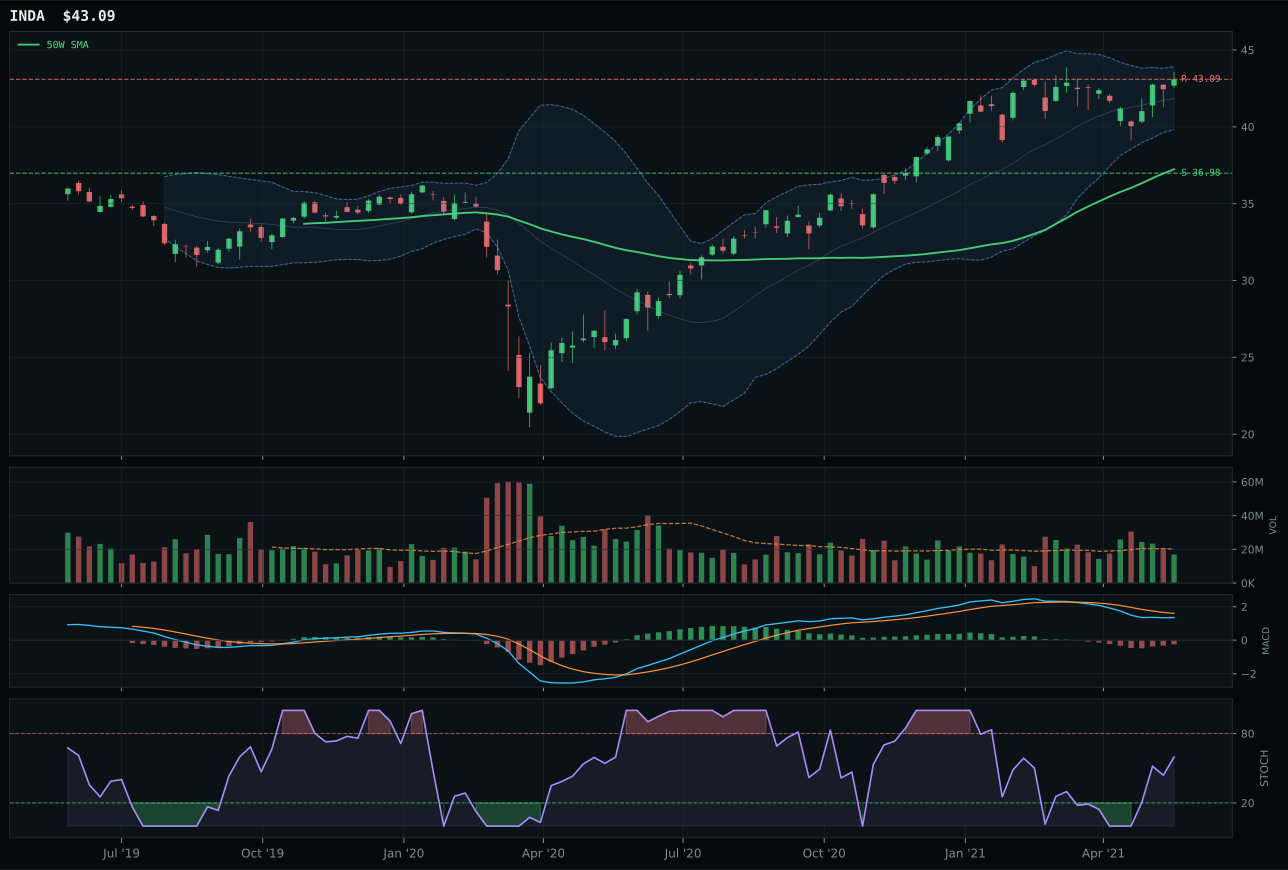
INDA has a vertical extension profile with -5.5% 13-week relative strength versus SPY.
A failed hold above support would weaken the setup.
Actionable but governed by invalidation levels.
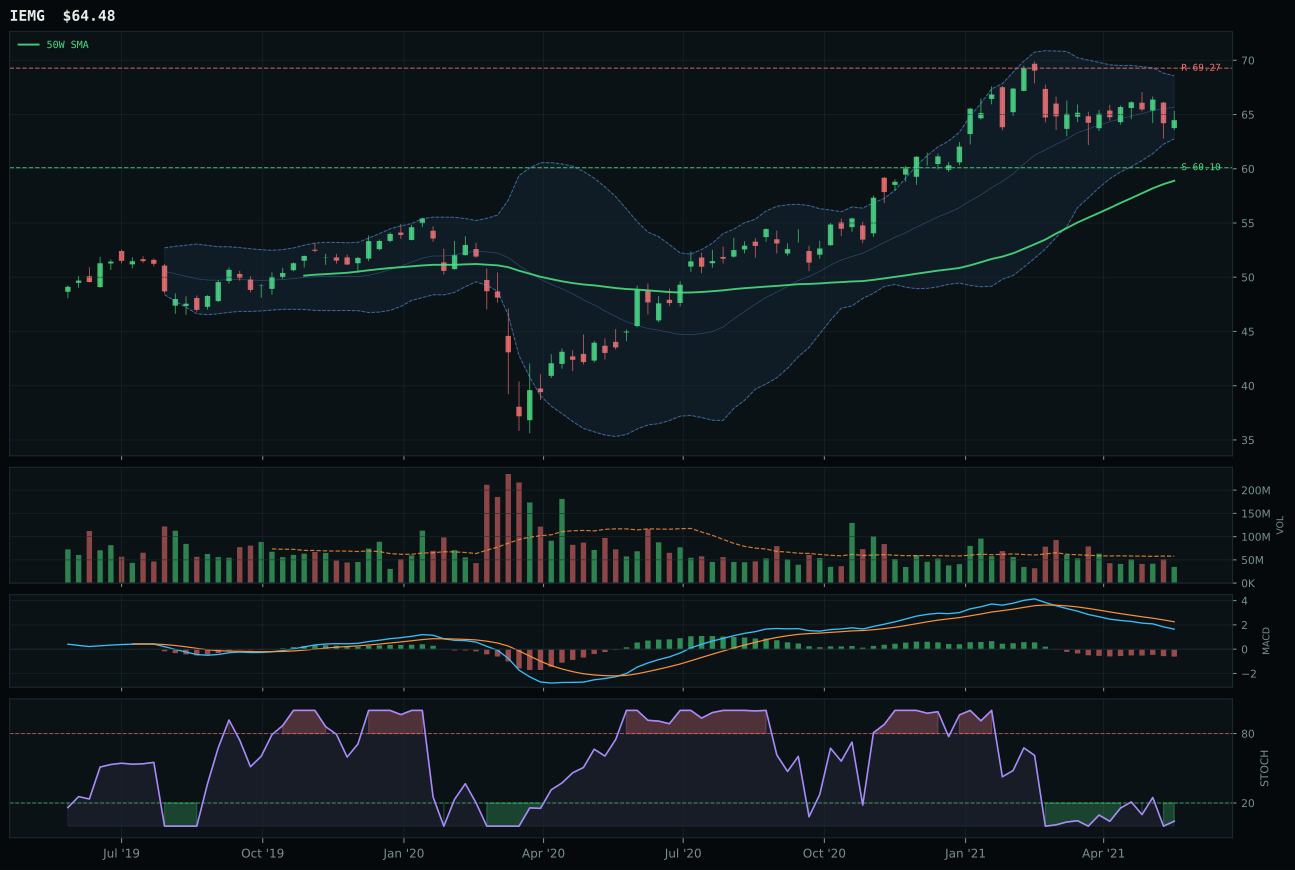
IEMG has a neutral structure profile with -13.0% 13-week relative strength versus SPY.
A failed hold above support would weaken the setup.
Actionable but governed by invalidation levels.
ILF wins the category over INDA with the widest margin of any three-horse contest (score gap of 11.0 points), a dominance anchored in timing and structure quality. ILF's timing score of 83.0 towers over INDA's 53.0, driven by proximity to the 50W (14.5% vs INDA's distance at higher 52W extension), bullish-improving MACD (vs INDA's bearish-but-improving), and rising-midzone stochastic (vs INDA's identical reading but inferior structure context). ILF's neutral-structure setup with 78.5 structure score (vs INDA's 72.0 for vertical extension) and above-average volume at 1.33x average (vs INDA's neutral) signal that institutional money is rotating toward commodity-diversified Latin America rather than India's stretched growth premium. ILF's 1.0% category-relative strength (vs INDA's 0.0%) captures this capital flow difference. While INDA's trend score of 85 exceeds ILF's 73, and INDA sits above both the 50W and 200W, the timing and volume disadvantages are disqualifying in a transition regime where valuation matters.
Emerging Markets receives 5% allocation as a tier-2 category, supported by a 39.0 final score and 45.0 macro fit anchored in emerging-market liquidity support (+14), which is only partially offset by credit stress (-10) and broad market bear (-9). ILF's 79.5 technical evidence and 66.0 macro fit reflect Latin America's structural exposure to commodity inflation, real asset sponsorship, and supply-scarcity themes that resonate in the current macro regime. The 1.9% 13W return is modest, yet the above-average volume participation at 1.33x average and bullish-improving MACD indicate that institutional allocators are using weakness to accumulate, not panicking out. However, the 51.0 risk/reward score with -3.7% upside to resistance and 11.1% downside to support argues against aggressive overweight. Tier-2 positioning reflects belief in the emerging-market macro thesis (commodity linkage, real-asset defensiveness) without betting the farm on execution. Promotion would require fresh volume confirmation on any test of resistance and sustained evidence that EM liquidity is absorbing selling; demotion would follow deterioration in volume sponsorship or a decisive break below the 50W, signaling that institutional accumulation failed to hold the line.
Defense & Aerospace — ITA
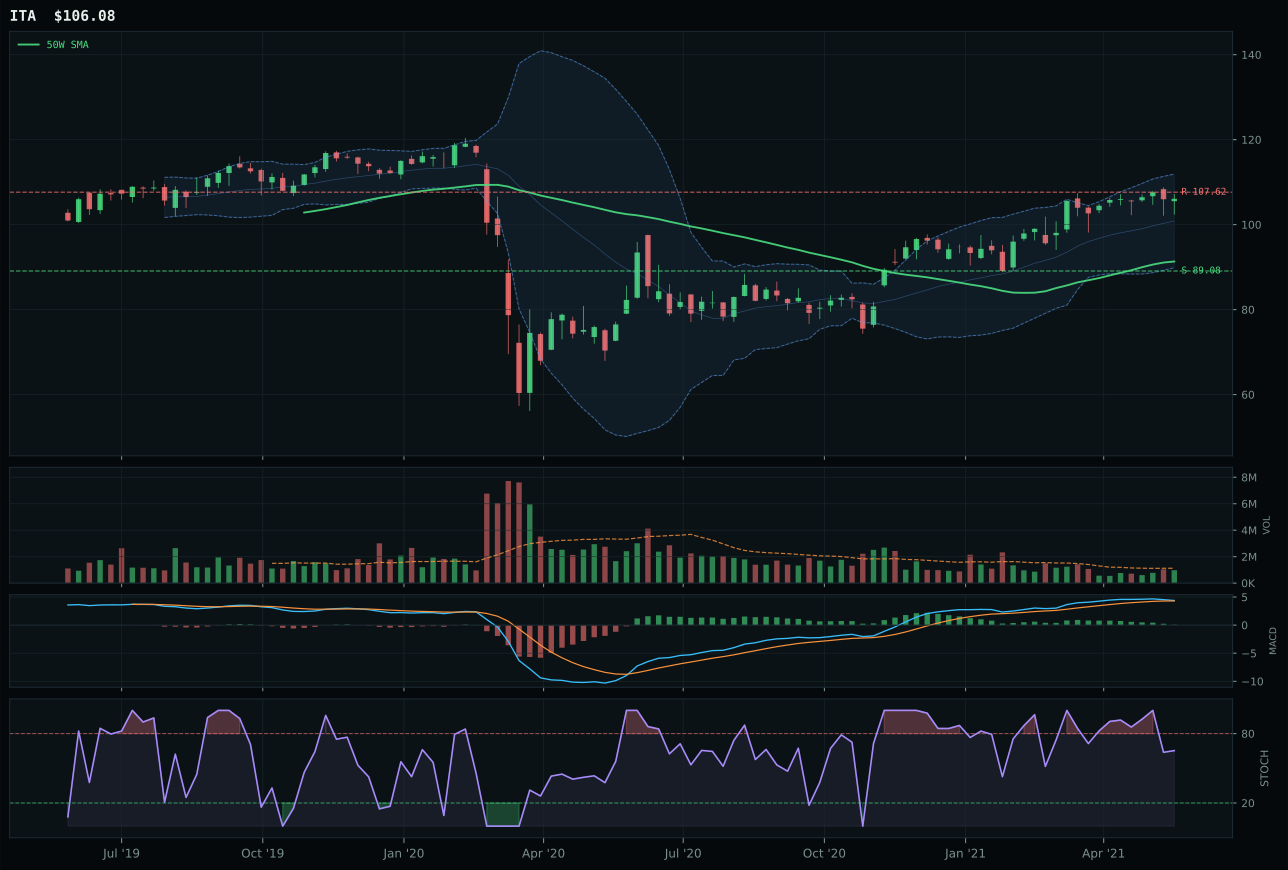
ITA has a vertical extension profile with 0.8% 13-week relative strength versus SPY.
A failed hold above support would weaken the setup.
Actionable but governed by invalidation levels.
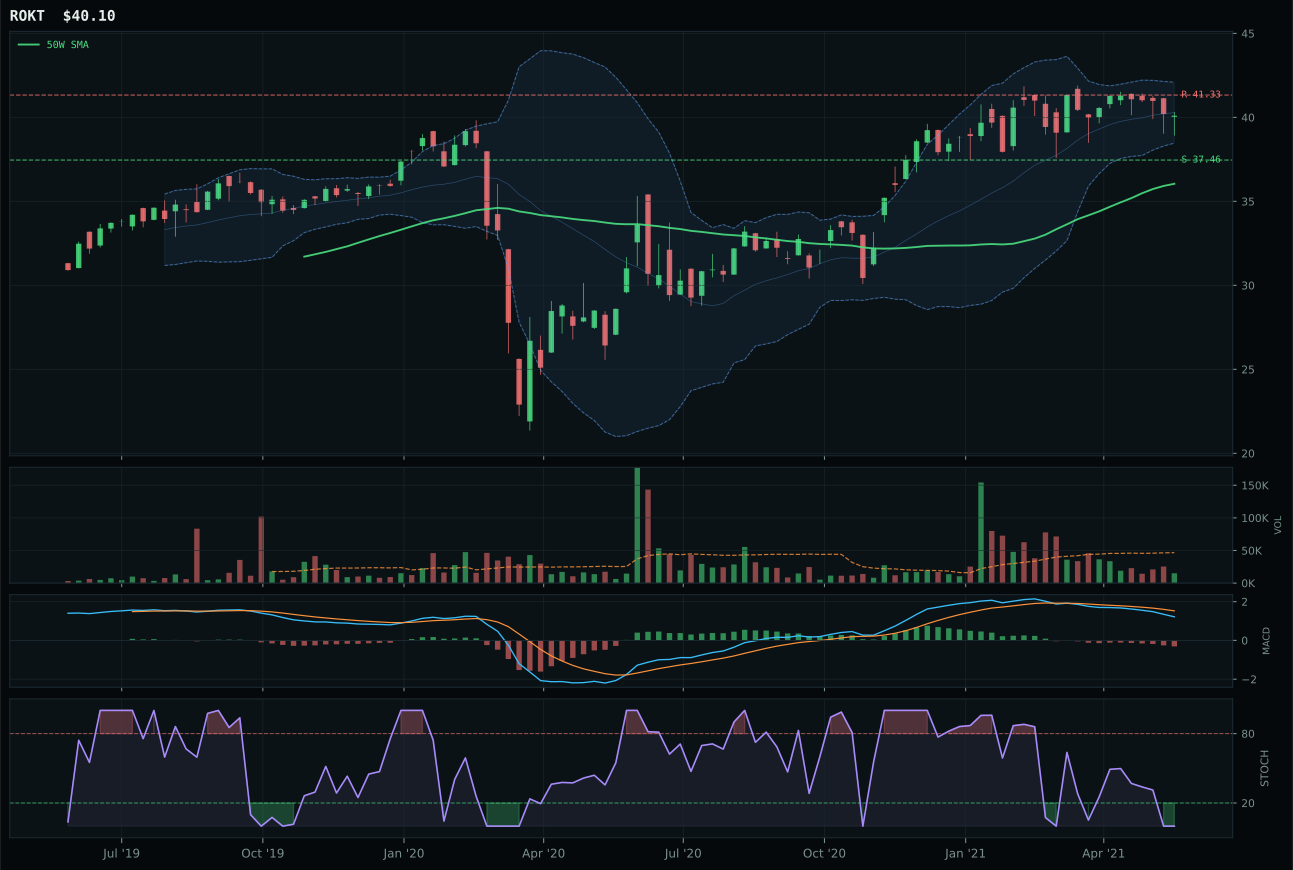
ROKT has a neutral structure profile with -8.6% 13-week relative strength versus SPY.
A failed hold above support would weaken the setup.
Tracked, but not top-2 eligible because: .
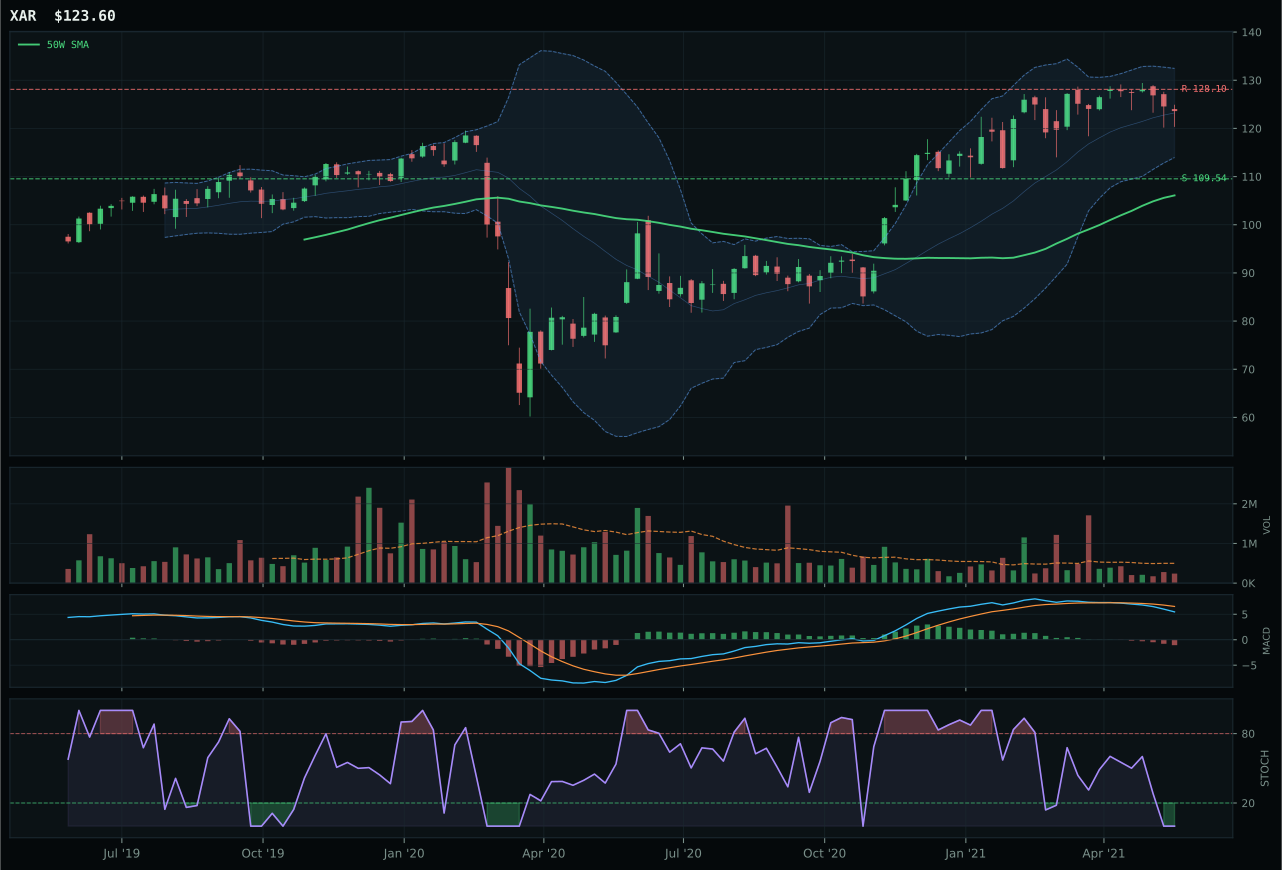
XAR has a vertical extension profile with -7.5% 13-week relative strength versus SPY.
A failed hold above support would weaken the setup.
Actionable but governed by invalidation levels.
ITA dominates this category with a remarkable 97.1 trend score, the highest in the entire analysis, driven by a 0.3% 50W slope and near-perfect SPY relative strength of 0.8%. The critical distinction from runner-up ROKT is not just trend—ITA's bullish-but-flattening MACD is superior to ROKT's bearish/weakening because it indicates the trend is maturing but still intact, whereas ROKT's deterioration signals reversal risk. ITA's 78.1 momentum confirmation (vs ROKT's 8) reflects 7.1% 13W returns and 8.2% category relative strength that dwarf competitors, and this is anchored by neutral volume at 0.86x average, suggesting the move is not speculative retail accumulation but steady institutional inflow. The 16.2% extension from the 50W is concerning on entry, but the category-relative dominance and persistence score of 72.7 indicate this is a genuine leadership move, not a mean-reversion trap.
Defense & Aerospace earns 5% allocation as a tier-2 category, justified by its 35.2 final score and strong macro fit of 59.0. The broad market bear descriptor is actually beneficial here (+6), as flight-to-quality rotation favors defense-prime durability over cyclicals; moreover, the category's resilience through credit stress concerns shows defensive equity characteristics. ITA's positive absolute and relative momentum argues for holding this position despite the extended price action—when durability names are leading in a bear market, that's a signal to respect the trend rather than chase mean reversion. The category would graduate to top-2 only if either the macro regime shifted decisively away from broad market bear (reducing the safety premium) or if relative strength began to deteriorate, signaling that the flight-to-quality trade was exhausted. For now, 5% represents fair value for a category that offers convex protection without offering exceptional alpha.
Technology — CIBR
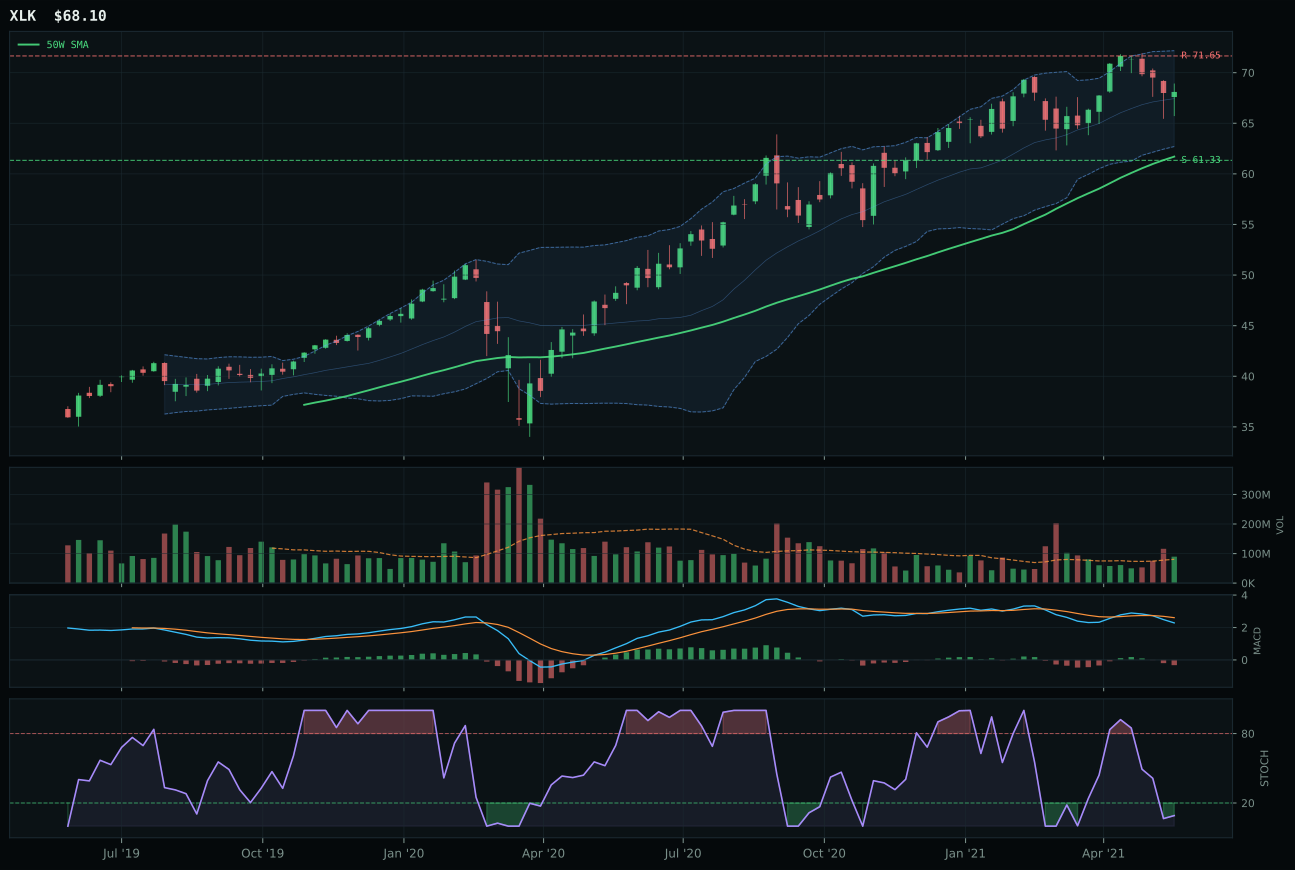
XLK has a neutral structure profile with -6.3% 13-week relative strength versus SPY.
A failed hold above support would weaken the setup.
Actionable but governed by invalidation levels.
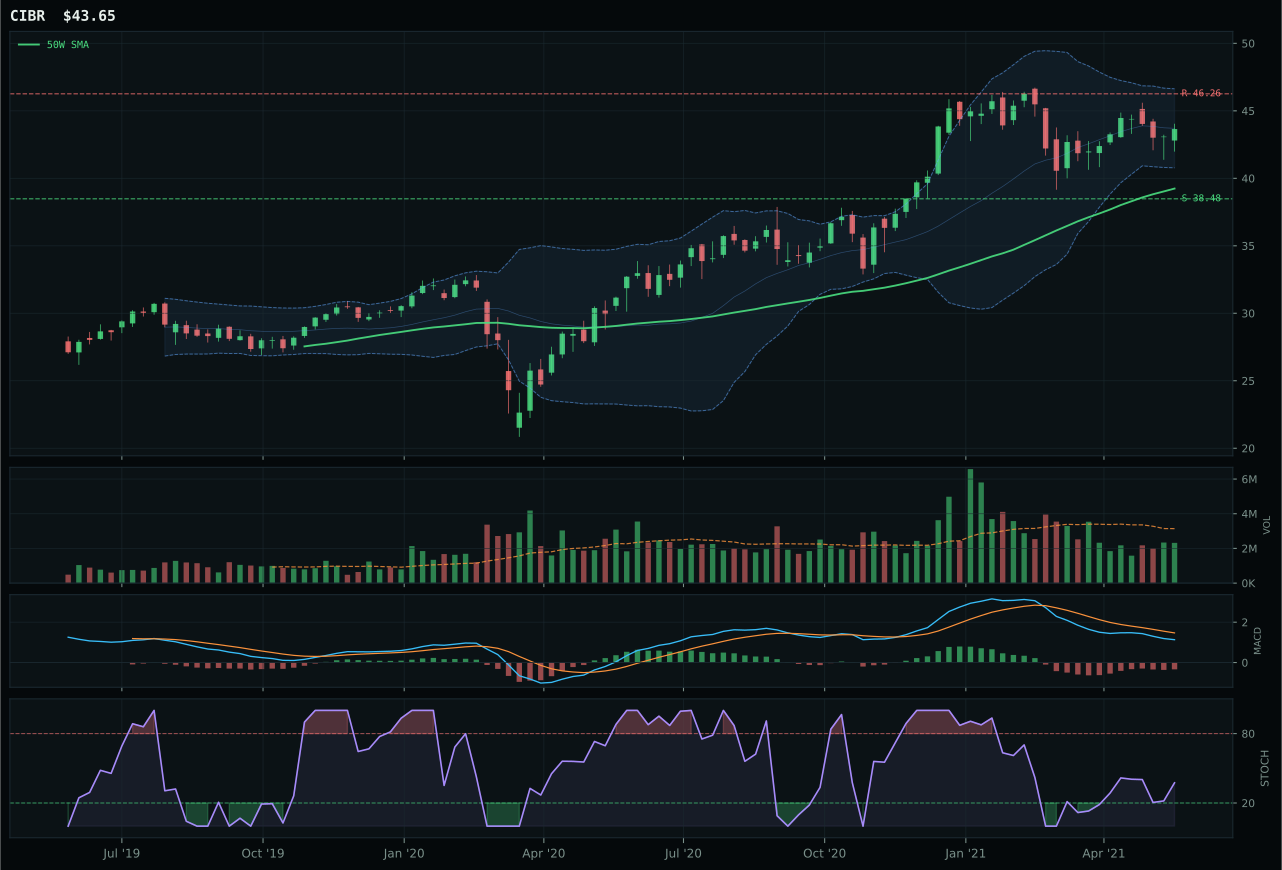
CIBR has a neutral structure profile with -10.4% 13-week relative strength versus SPY.
A failed hold above support would weaken the setup.
Actionable but governed by invalidation levels.
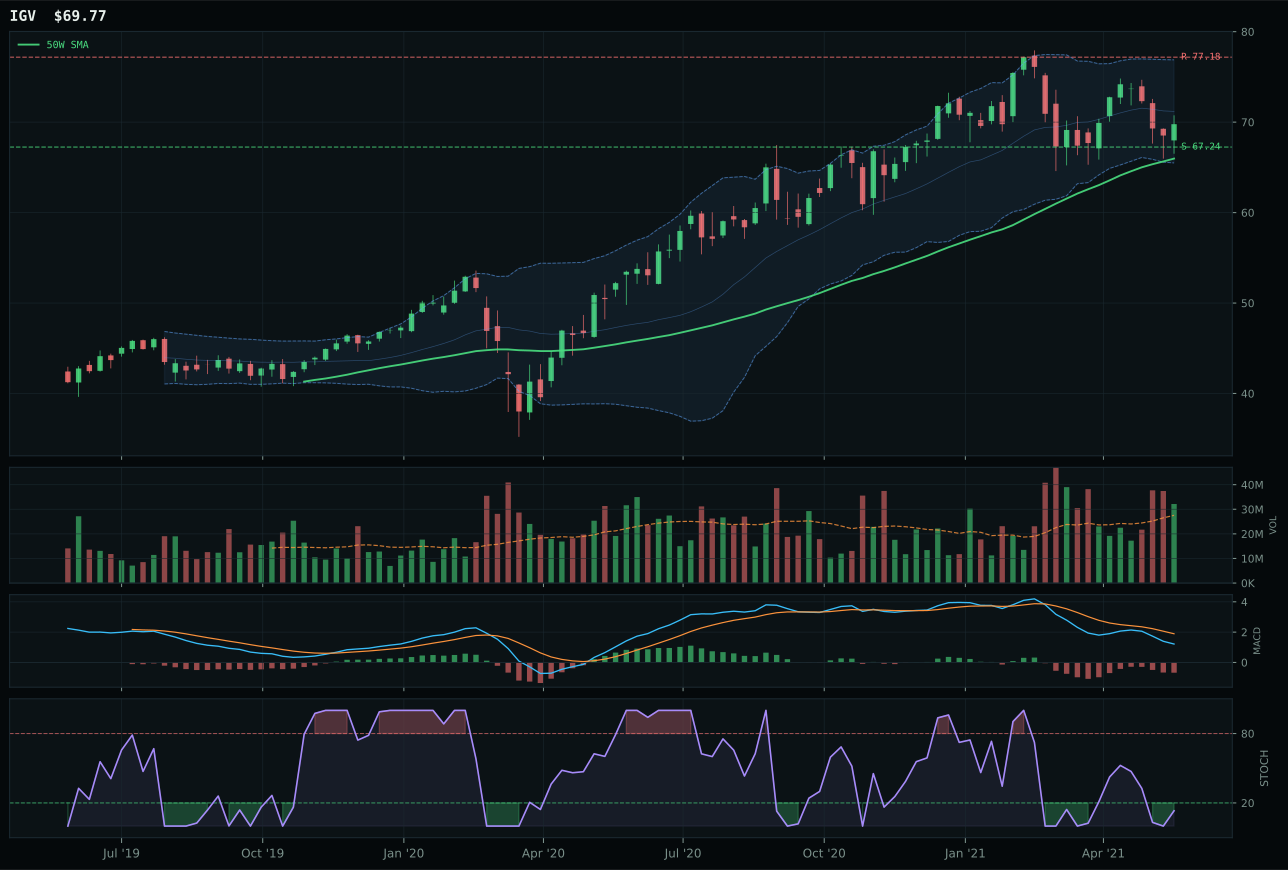
IGV has a pullback into support profile with -14.7% 13-week relative strength versus SPY.
A failed hold above support would weaken the setup.
Actionable but governed by invalidation levels.
CIBR wins the category despite a composite score of only 56, as it demonstrates better technical sponsorship than XLK's 62 through a critical difference in volume-price confirmation and persistence. XLK's oversold stochastic RSI and above-average volume participation suggest aggressive short-covering rather than institutional accumulation, whereas CIBR's thin participation at 0.74x average and falling-neutral stochastic reading indicate a more selective, quality-based setup. The 11.2% distance from the 50W places CIBR in the upper retracement zone, but its neutral structure and cleanliness score of 58.3 avoid the false-breakout risk that plagues extended setups. What separates CIBR from runner-up IGV is not trend strength—both sit above both major moving averages with near-identical 67 trend scores—but rather momentum confirmation, where CIBR's 7 composite (vs IGV's 0) captures the fact that at least *some* recent strength is present beneath the surface.
Technology receives 0% allocation this week, ranking 9th or 10th among the ten categories, and this exclusion is correct given the macro backdrop. Credit stress and broad market bear are both active headwinds, and the category's macro/narrative fit of 39.0 reflects a genuine structural headwind: rising rates penalize software multiples, supply chain anxiety keeps semiconductor sentiment fragile, and the transition toward inflation and real assets has broken risk appetite for capital-light, growth-dependent names. CIBR's -10.4% relative strength versus SPY and the wider category's inability to generate conviction in the face of deteriorating MACD confirms this is not a timing problem but a regime problem. For Technology to earn a position, the allocator would need to see either a clear stabilization in credit conditions or a reset in inflation expectations—not minor chart bounces but a fundamental macro shift that restores multiple expansion.
AI — SMH
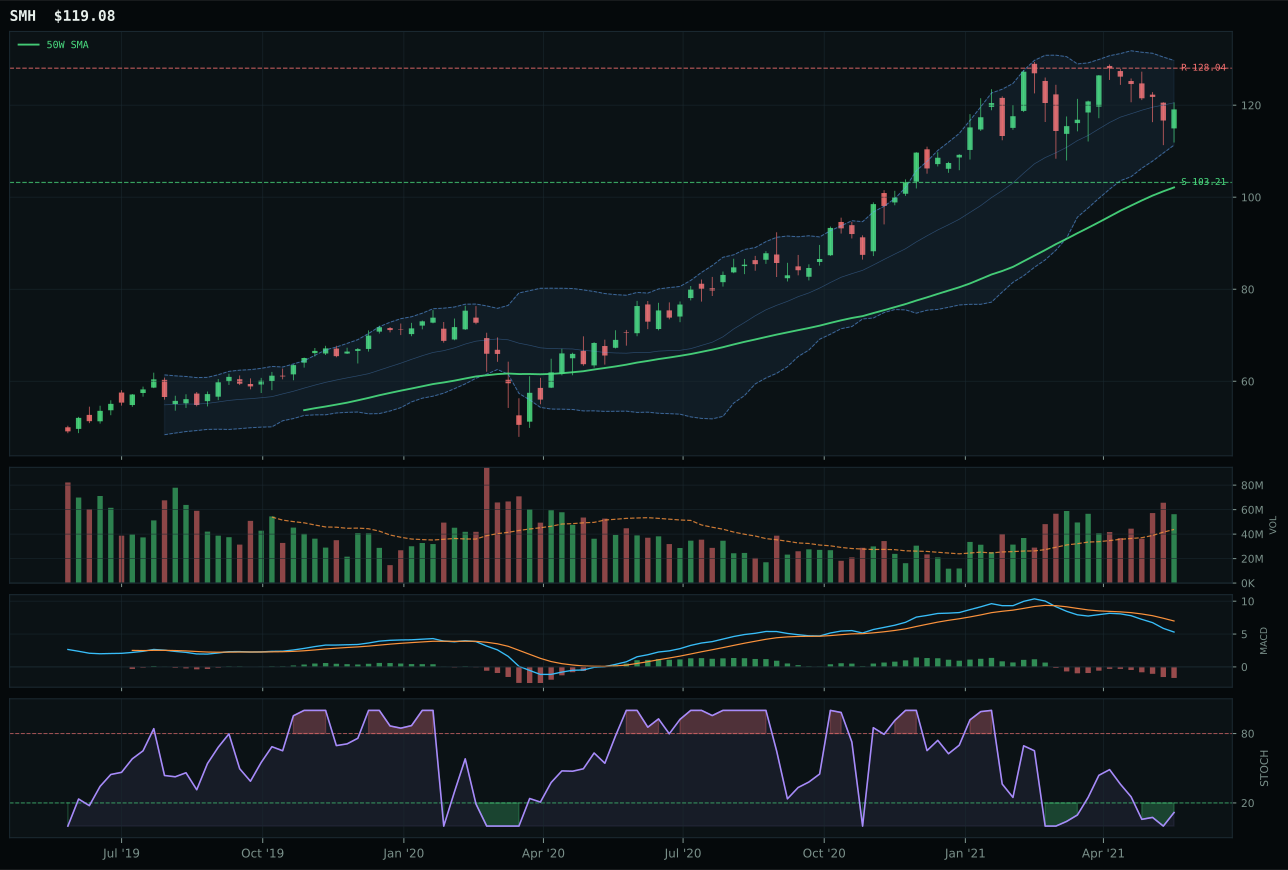
SMH has a vertical extension profile with -12.6% 13-week relative strength versus SPY.
A failed hold above support would weaken the setup.
Actionable but governed by invalidation levels.
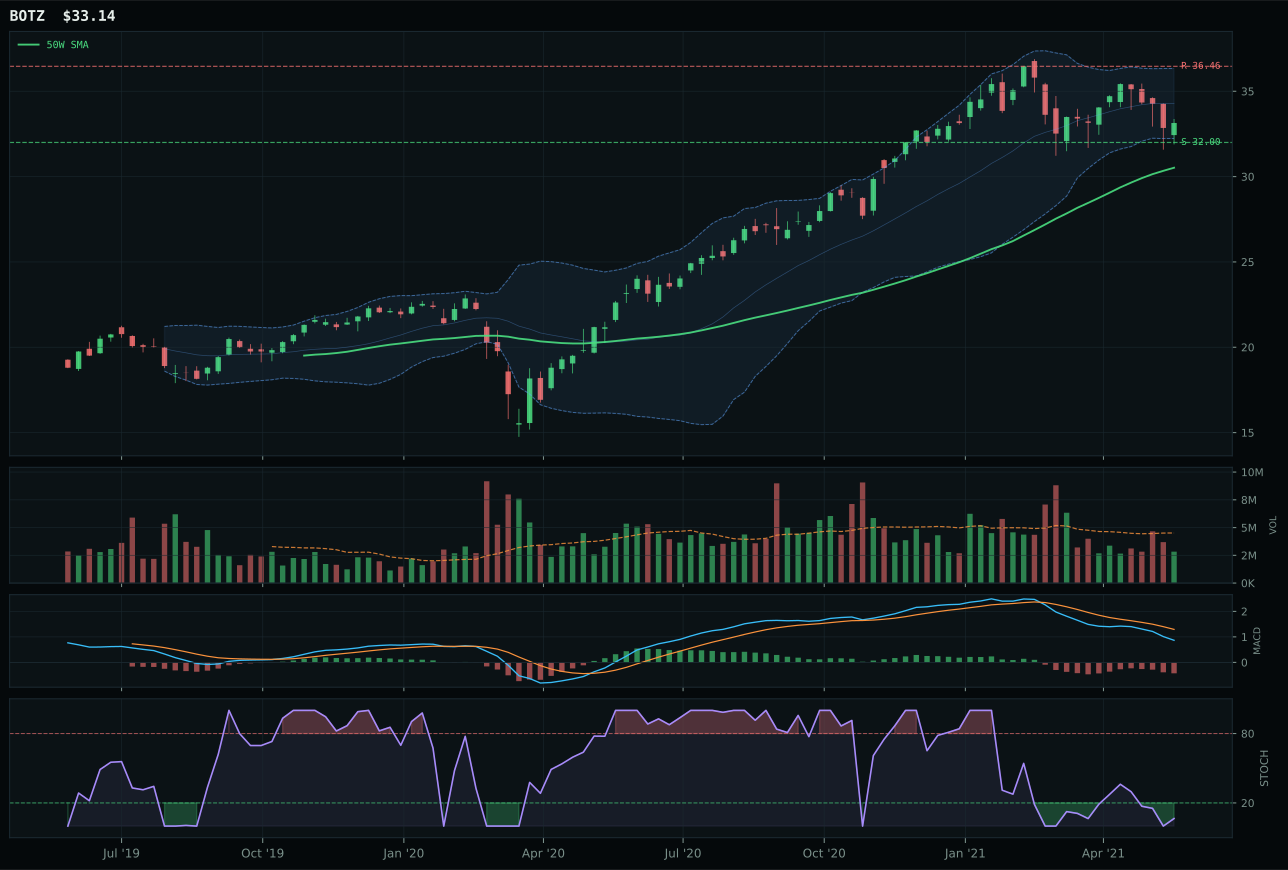
BOTZ has a pullback into support profile with -13.8% 13-week relative strength versus SPY.
A failed hold above support would weaken the setup.
Actionable but governed by invalidation levels.
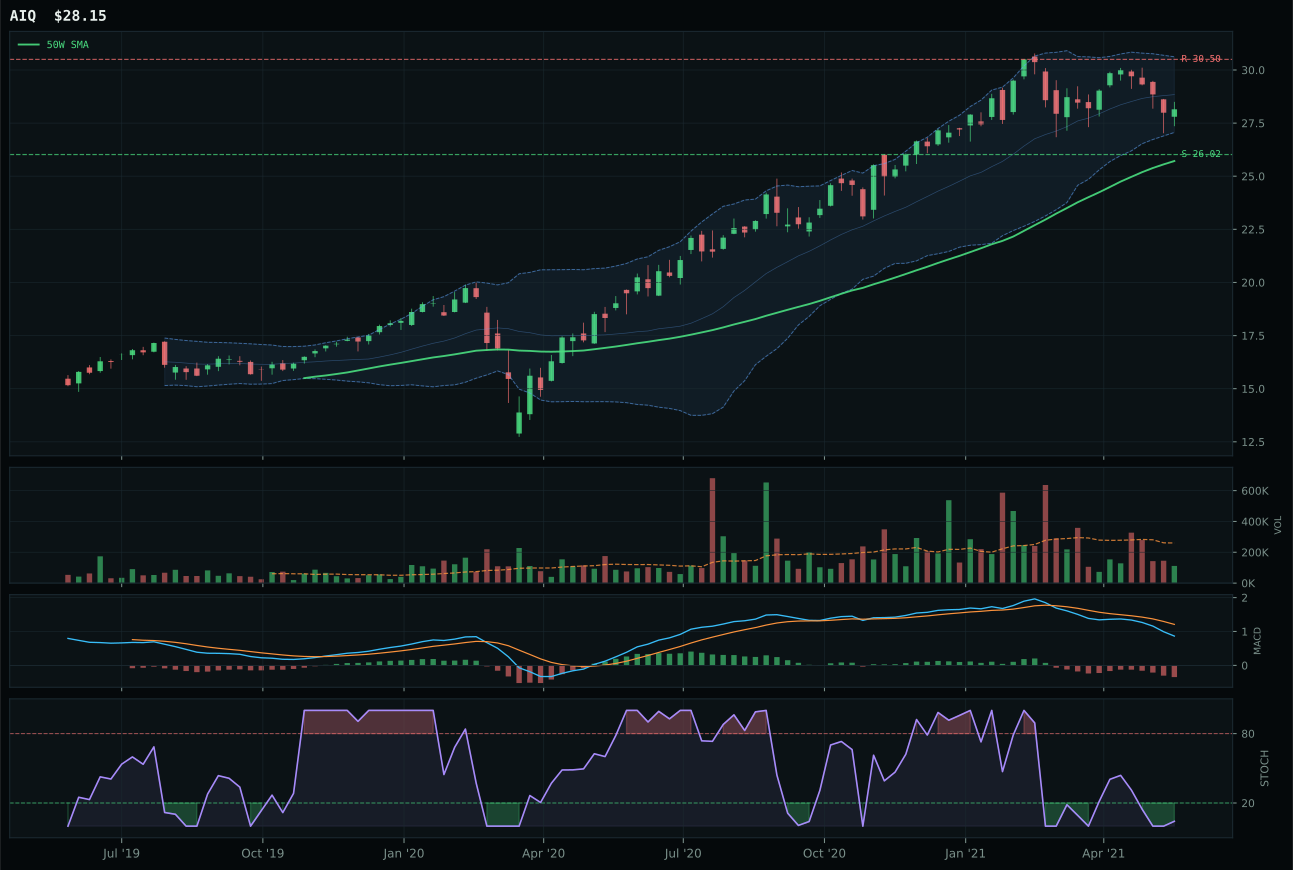
AIQ has a neutral structure profile with -13.7% 13-week relative strength versus SPY.
A failed hold above support would weaken the setup.
Tracked, but not top-2 eligible because: .
SMH wins by the narrowest margin over BOTZ, with the decisive factor being volume-price confirmation rather than trend magnitude. Both sport identical 67 trend scores and sit above key moving averages, but SMH's above-average participation at 1.28x average paired with oversold-turn-up stochastic momentum (0.12) signals that fresh buying is entering at lower prices, whereas BOTZ's thin participation combined with a flat oversold reading suggests exhaustion without confirmation. The 16.6% extension above the 50W is penalized in timing (62 vs 80 for BOTZ), yet the structure differential (73.9 vs 65.8 for cleanliness and compression) shows CIBR's setup is tighter and less vulnerable to false reversals. SMH's category-relative strength of 1.1% versus BOTZ's -0.1% captures this subtle but crucial sponsorship difference—institutional money is rotating toward semiconductors as a proxy for compute demand rather than generalist robotics bets.
AI receives 0% allocation this week, ranked outside the top eight categories, a consequence of both technical weakness and a fundamentally adverse macro regime. The category's 34.0 macro fit is dragged down by active credit stress (-8) and broad market bear (-8), which together suppress venture-capital-dependent robotics narratives and create margin-of-safety concerns across the entire compute stack. SMH's -12.6% relative strength versus SPY tells the story: even semiconductor strength is failing to keep pace with the broader market, a sign that multiple compression is outweighing earnings momentum. The technical setup (extended prices, weak MACD, thin sponsorship) combined with macro headwinds creates a setup where the risk-reward is inverted—entry point is poor, timing is late, and macro tailwinds are absent. Recovery would require credit stress to relax and risk appetite to shift back toward growth, neither of which is visible in the current transition state.