
2021-05-14
Informational purposes only. The content in this report, including allocations, analysis, and commentary, is provided solely for informational and educational purposes. It does not constitute financial advice, investment advice, trading advice, or any other type of advice. Past performance does not guarantee future results. Always conduct your own research and consult a qualified financial professional before making investment decisions.
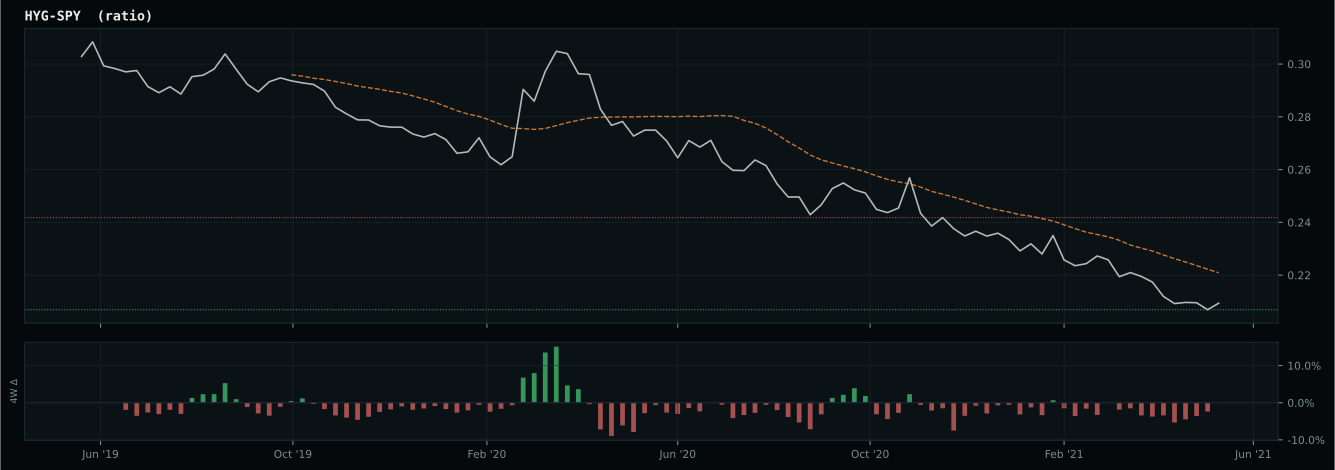
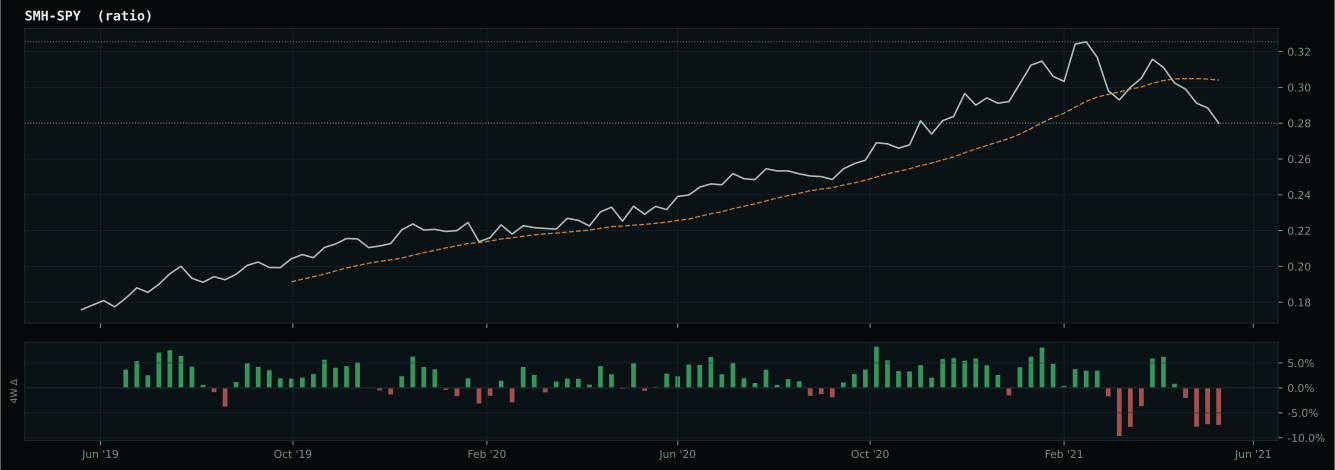
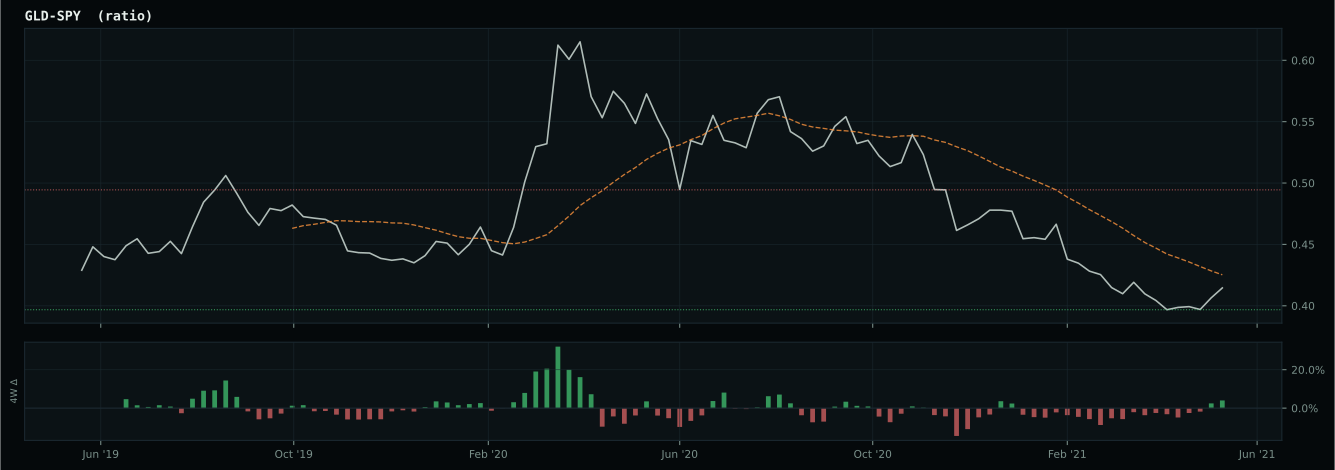
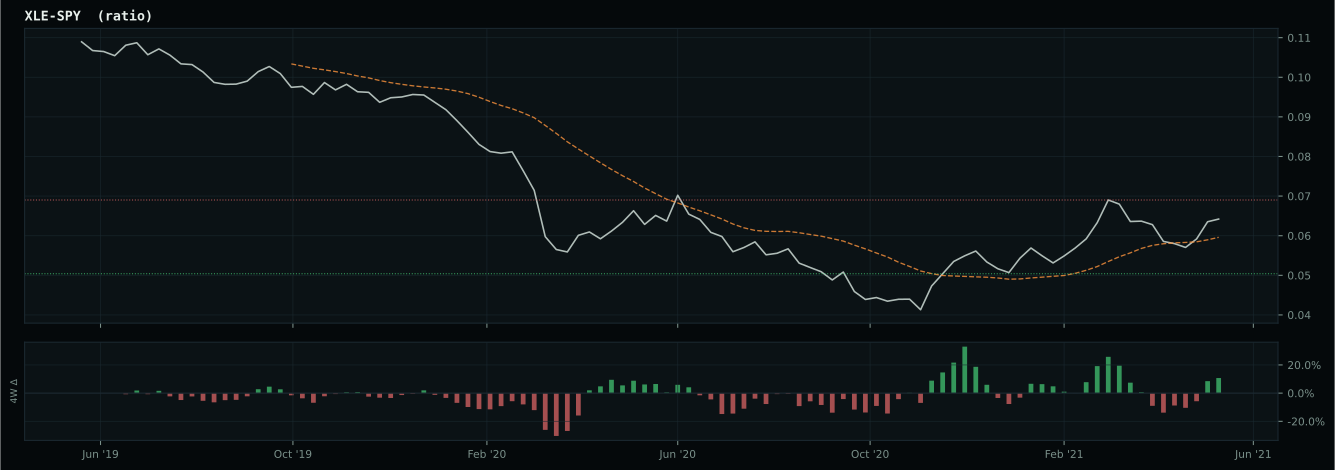
AltSeason was blocked by macro risk gating: The macro engine classifies the structural regime as Transition / Mixed with a tactical overlay of Transition / Mixed. Growth score is 50.0, inflation pressure is 92.2, liquidity is 62.0, credit stress is 60.2, and macro risk is 54.0. Cash is not required because crisis macro risk is inactive and bear-defense structure has 2/5 required checks. The active Defensive trigger is none and the Defensive cause is none.
Weekly Allocation
| Ticker | Category | Weight | Role |
|---|---|---|---|
| FBTC | 50% | Overlay | |
| XLE | Traditional Energy | 10% | Top-2 (10%) |
| PAVE | Utilities & Infrastructure | 10% | Top-2 (10%) |
| GLD | Precious Metals | 5% | Tier-2 (5%) |
| WEAT | Agriculture & Livestock | 5% | Tier-2 (5%) |
| COPX | Industrial Metals | 5% | Tier-2 (5%) |
| URNM | Nuclear Energy | 5% | Tier-2 (5%) |
| ILF | Emerging Markets | 5% | Tier-2 (5%) |
| ITA | Defense & Aerospace | 5% | Tier-2 (5%) |
Trade Instructions — Monday Open
Sell the tranche from 2021-04-16 (completing its 4-week hold). Buy the new tranche. Instructions show net portfolio changes — same-asset positions cancel, weight changes show the delta.
| Action | Ticker | Instruction |
|---|---|---|
| SELL | FSOL | Sell 25% of FSOL position (reduce 50.00% → 37.50%) |
| SELL | XLU | Sell 40% of XLU position (reduce 6.25% → 3.75%) |
| SELL | URA | Sell 50% of URA position (reduce 2.50% → 1.25%) |
| SELL | SLV | Sell 33% of SLV position (reduce 3.75% → 2.50%) |
| SELL | XAR | Sell entire XAR position (1.25% of portfolio) |
| SELL | XLK | Sell entire XLK position (1.25% of portfolio) |
| BUY | ITA | Buy ITA — 6.25% of freed cash (adds 1.25% to portfolio) |
| BUY | URNM | Buy URNM — 6.25% of freed cash (adds 1.25% to portfolio) |
| BUY | ILF | Buy ILF — 6.25% of freed cash (adds 1.25% to portfolio) |
| BUY | FBTC | Buy FBTC — 62.50% of freed cash (adds 12.50% to portfolio) |
| BUY | PAVE | Buy PAVE — 12.50% of freed cash (adds 2.50% to portfolio) |
| BUY | GLD | Buy GLD — 6.25% of freed cash (adds 1.25% to portfolio) |
Current Portfolio After Trade
Combined holdings across all 4 active tranches. Each tranche is 25% of the portfolio.
| Ticker | % of Portfolio | Weight Bar |
|---|---|---|
| FSOL | 37.50% | |
| FBTC | 12.50% | |
| WEAT | 8.75% | |
| COPX | 8.75% | |
| XLE | 6.25% | |
| ITA | 5.00% | |
| URNM | 3.75% | |
| XLU | 3.75% | |
| SLV | 2.50% | |
| ILF | 2.50% | |
| PAVE | 2.50% | |
| URA | 1.25% | |
| IGV | 1.25% | |
| CIBR | 1.25% | |
| GDX | 1.25% | |
| GLD | 1.25% |
Macro Regime — Transition / Mixed
growth data is not confirming the weak market-implied risk appetite signal
Macro Evidence Charts
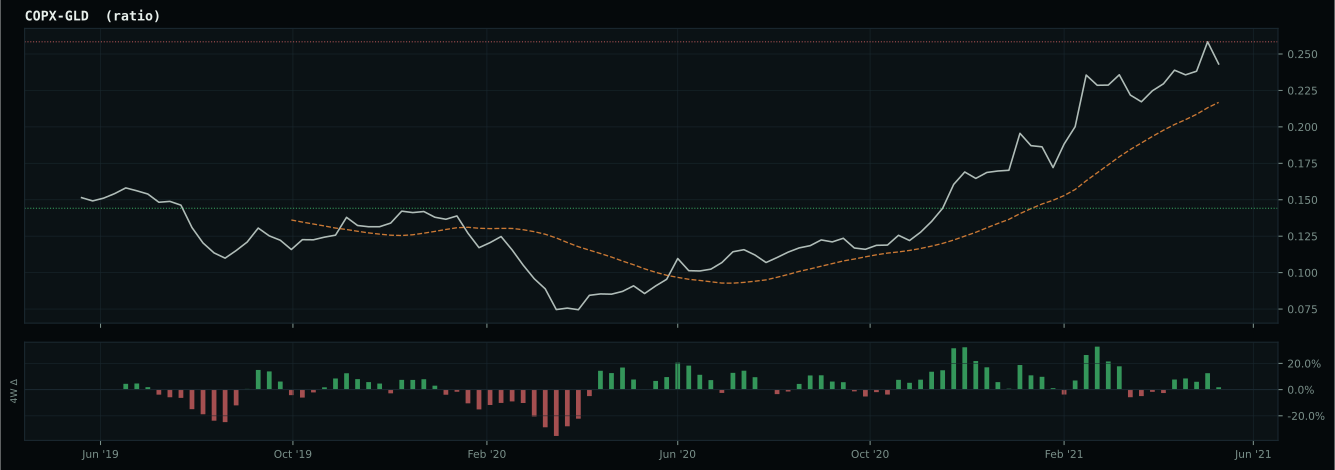
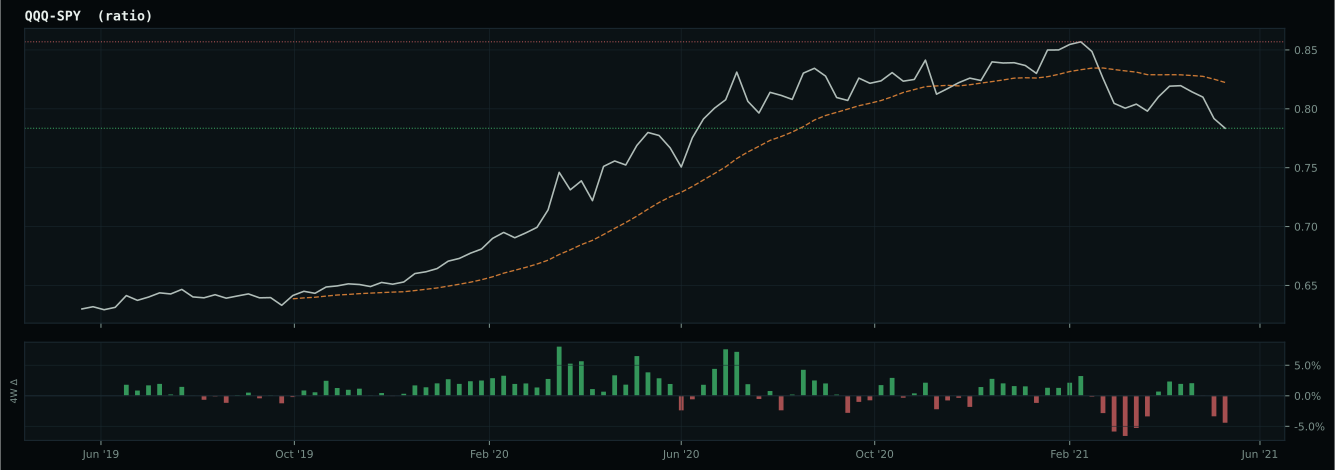
Market-implied signals behind the macro regime scores. Each ratio compares two assets; the direction and slope of the ratio is what the macro engine reads.
Crypto Regime — TrendBTC
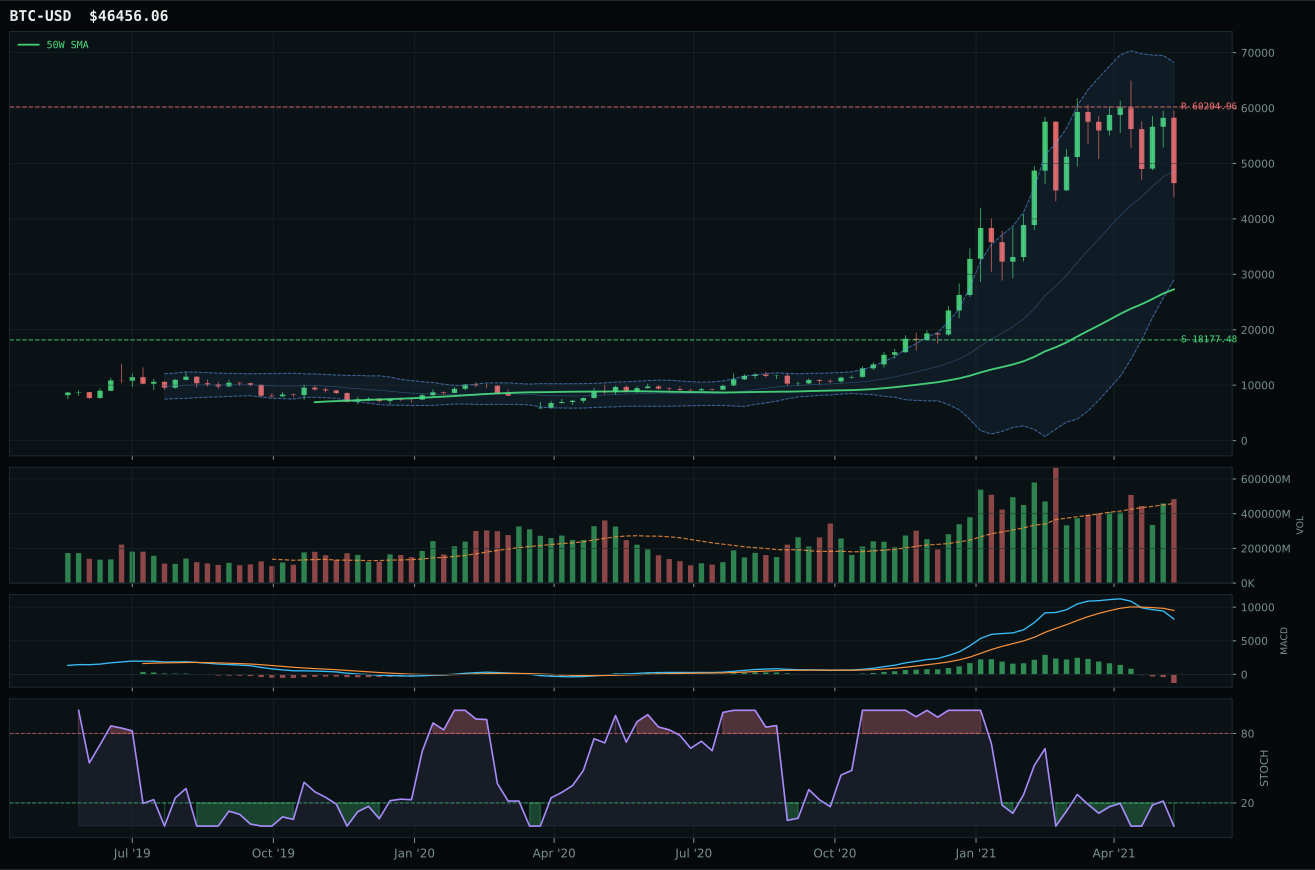
post-touch structure is too wide to count as a range; max/min close ratio is 10.33
TrendBTC confirmed: 2 consecutive closes above rising/flat 50W SMA
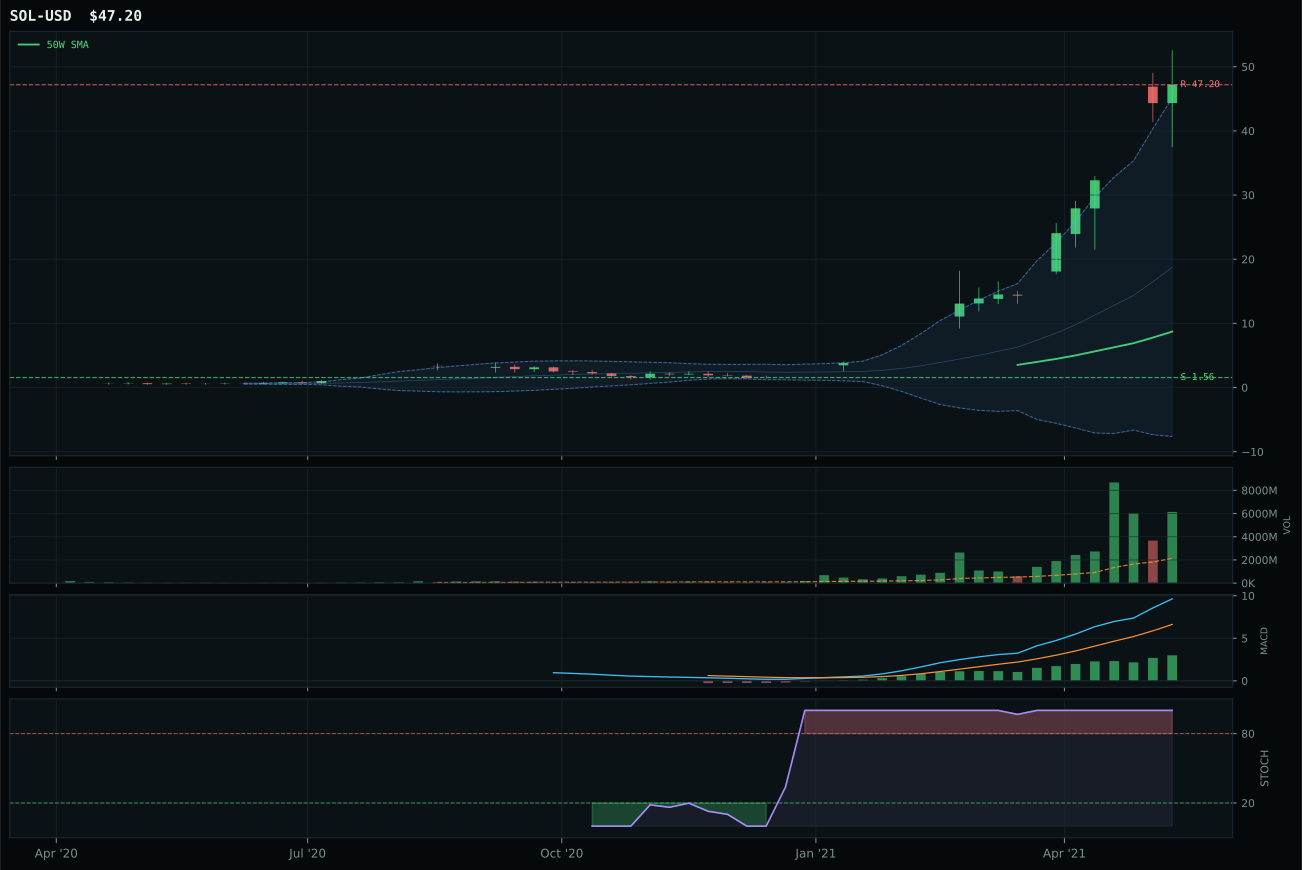
all available AltSeason conditions pass; missing optional confirmations skipped Macro gate failed, so AltSeason was downgraded.
Category Rankings
| Rank | Category | Winner | Score | Alloc | 4W Ret | Peers (4W) |
|---|---|---|---|---|---|---|
| 1 | Traditional Energy | XLE | 78.7 | 20% | +4.28% | FCG +14.3% · XOP +13.8% |
| 2 | Utilities & Infrastructure | PAVE | 60.9 | 20% | -1.71% | IGF +0.9% · XLU +0.4% |
| 3 | Precious Metals | GLD | 60.7 | 10% | -0.08% | GDX -1.8% · SLV +0.1% |
| 4 | Agriculture & Livestock | WEAT | 57.2 | 10% | -2.95% | MOO -0.6% · VEGI -2.8% |
| 5 | Industrial Metals | COPX | 52.6 | 10% | -4.98% | PICK -2.2% · REMX +7.1% |
| 6 | Nuclear Energy | URNM | 41.4 | 10% | +7.22% | URA +9.1% · NLR +1.5% |
| 7 | Emerging Markets | ILF | 40.3 | 10% | +7.14% | INDA +5.9% · IEMG +5.3% |
| 8 | Defense & Aerospace | ITA | 34.8 | 10% | +5.78% | ROKT +7.1% · XAR +7.6% |
| 9 | Technology | CIBR | 27.2 | 0% | +8.11% | XLK +5.1% · IGV +10.3% |
| 10 | AI | BOTZ | 13.6 | 0% | +7.83% | AIQ +6.8% · SMH +9.6% |
Traditional Energy — XLE
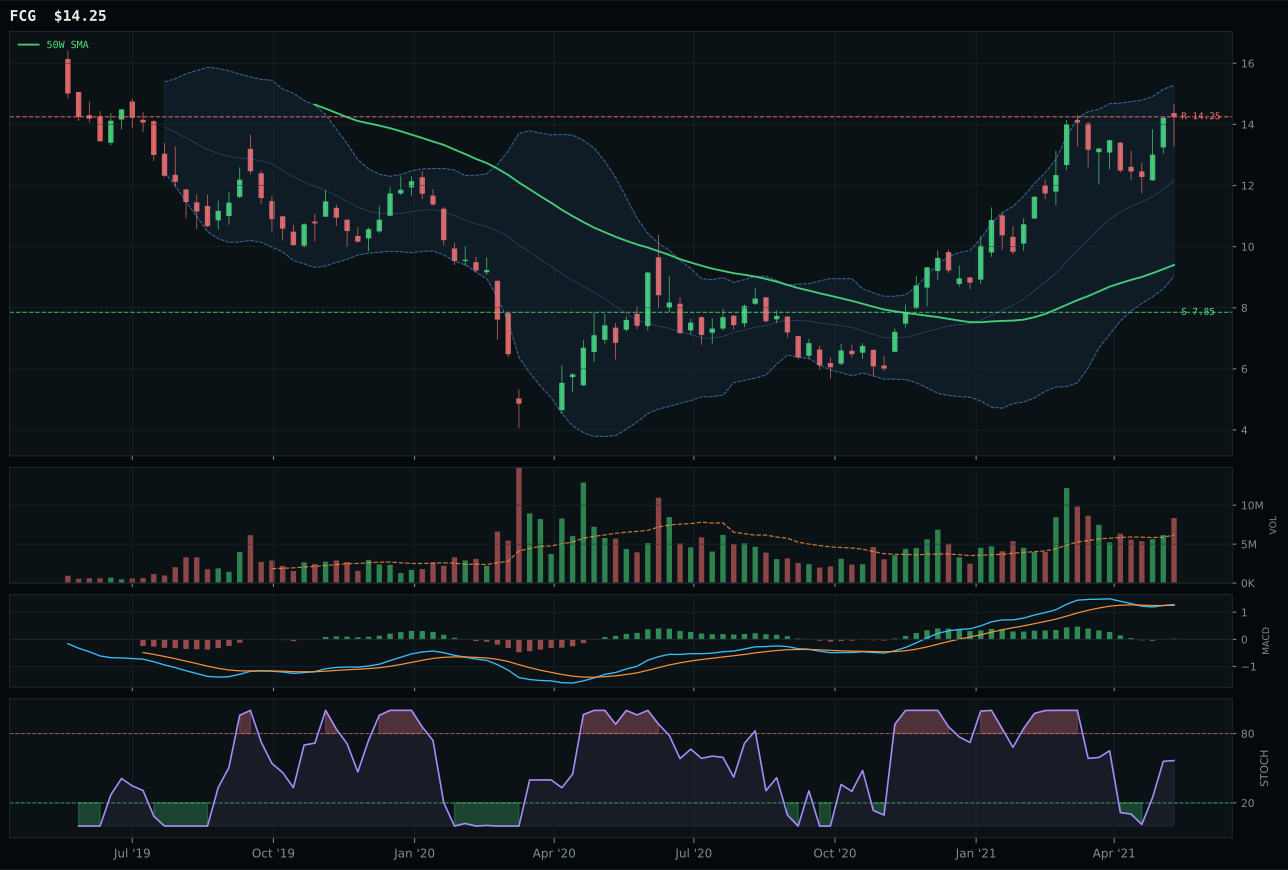
FCG has a vertical extension profile with 16.4% 13-week relative strength versus SPY.
A failed hold above support would weaken the setup.
Actionable but governed by invalidation levels.
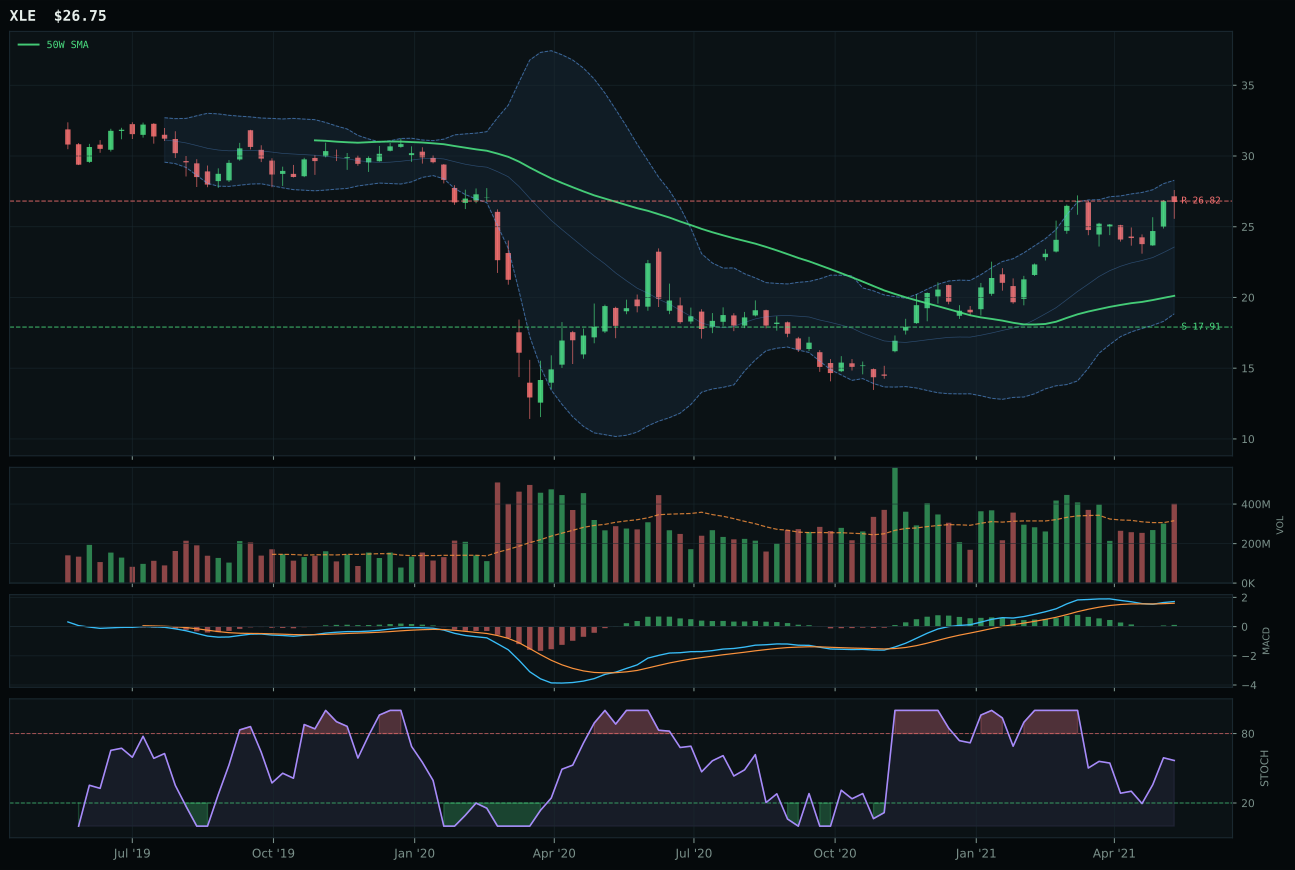
XLE has a vertical extension profile with 13.6% 13-week relative strength versus SPY.
A failed hold above support would weaken the setup.
Actionable but governed by invalidation levels.
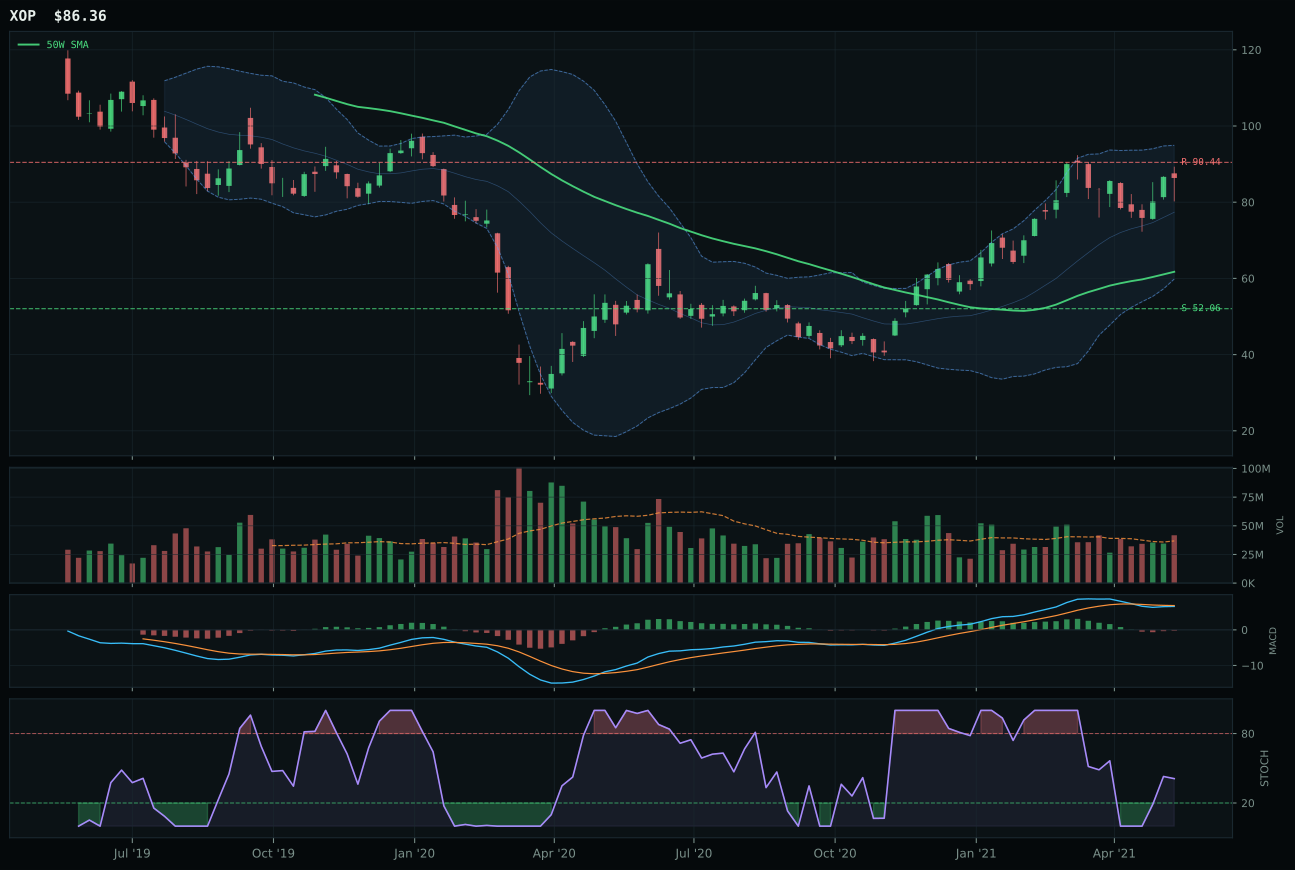
XOP has a vertical extension profile with 8.1% 13-week relative strength versus SPY.
A failed hold above support would weaken the setup.
Actionable but governed by invalidation levels.
XLE wins the top-2 slot because its momentum confirmation score of 100.0 combines a 19.7% 13-week return, bullish-but-flattening MACD, and above-average volume participation at 1.27x to prove that energy cash-flows are under accumulation despite the 33.0% extension above the 50-week. The relative strength versus SPY of 13.6% is commanding—telling you that crude, natural gas, and integrated energy are outperforming broad equities—and the persistence score of 77.0 validates that the move is being held by volume. The trend score of 86.0 reflects price above the 50-week but notably below the 200-week, which moderates conviction slightly; however, the 0.7% 50-week slope is non-deteriorating, and MACD is still bullish despite flattening. FCG, the runner-up, posted a 22.5% 13-week return and 16.4% RS/SPY—superior to XLE's own scores—but its timing penalty of 48.0 versus XLE's 48.0 masks FCG's extended position at 51.6% above the 50-week, compared to XLE's 33.0%, which worsened risk/reward to 23.8 versus XLE's 37.1.
Traditional Energy secured 10% allocation as a top-2 category with a final score of 78.7, the second-highest in the portfolio this week. The macro fit of 85.0 is dominant, driven by energy scarcity (+16), inflation pressure (+10), supply shortage (+9), and real asset sponsorship (+7)—a four-pillar tailwind that made this category a natural overweight in a Transition/Mixed regime where commodity breadth is positive and defensive positioning is rising. XLE's technical evidence of 70.6/100 is solid but not exceptional; the real power comes from the macro narrative, which is why this category earned top-2 despite the 33.0% extension creating moderate entry risk. The allocation rationale is clear: energy cash-flows and scarcity protection matter more than perfect technical entry points in an inflationary transition environment. For XLE or the category to maintain top-2 status, crude prices must hold above $60 per barrel and the energy scarcity descriptor must remain active—any reversal in those fundamentals would rapidly downgrade the category.
Utilities & Infrastructure — PAVE
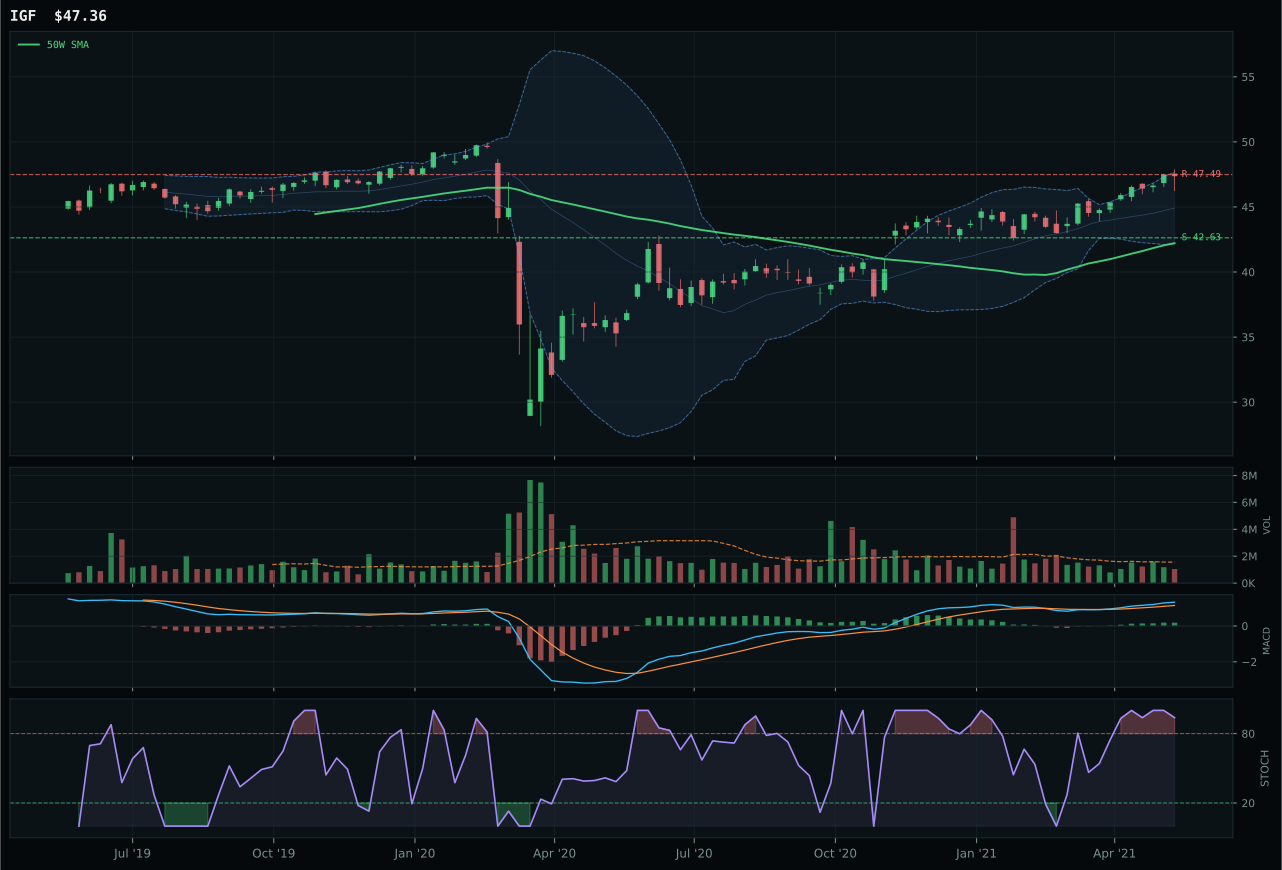
IGF has a neutral structure profile with 1.0% 13-week relative strength versus SPY.
A failed hold above support would weaken the setup.
Actionable but governed by invalidation levels.
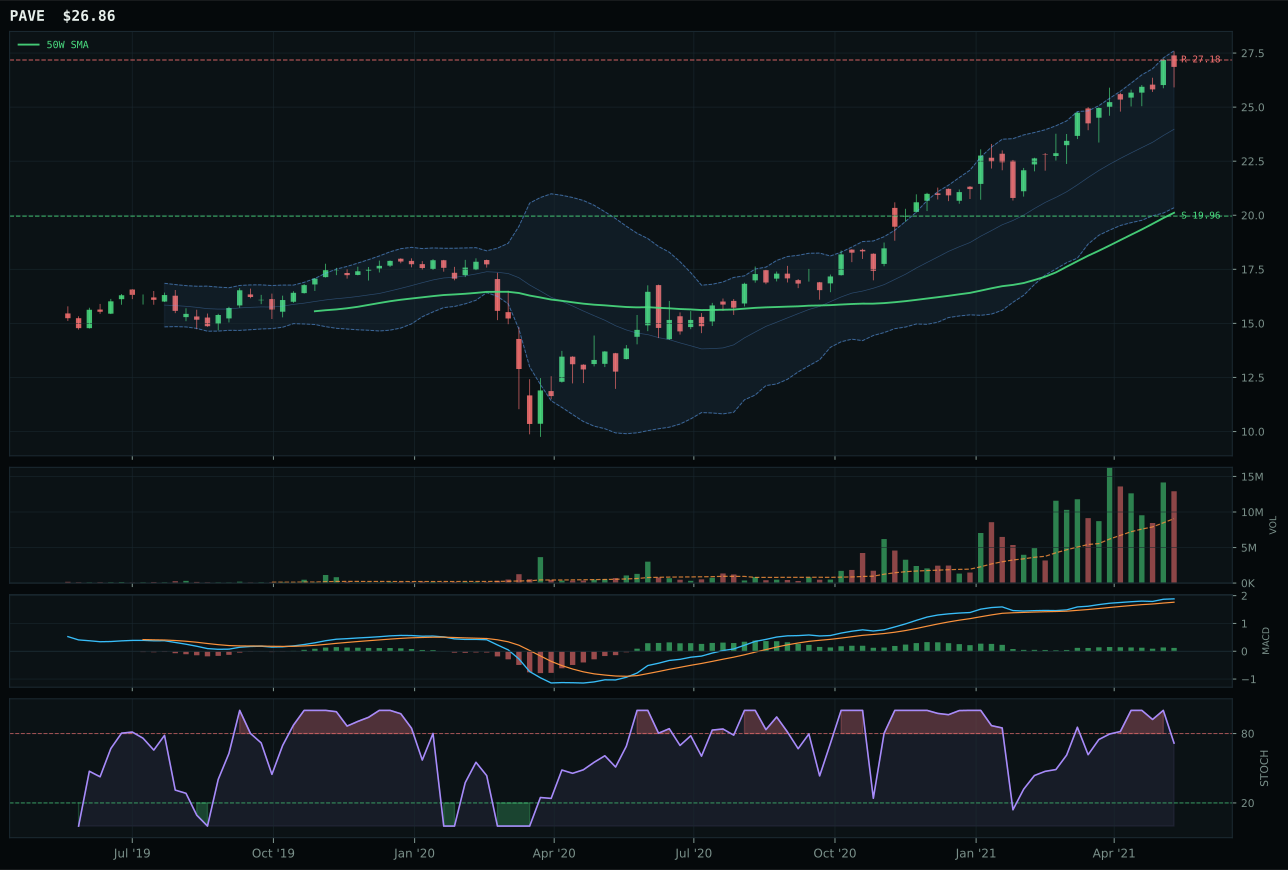
PAVE has a vertical extension profile with 12.6% 13-week relative strength versus SPY.
A failed hold above support would weaken the setup.
Actionable but governed by invalidation levels.
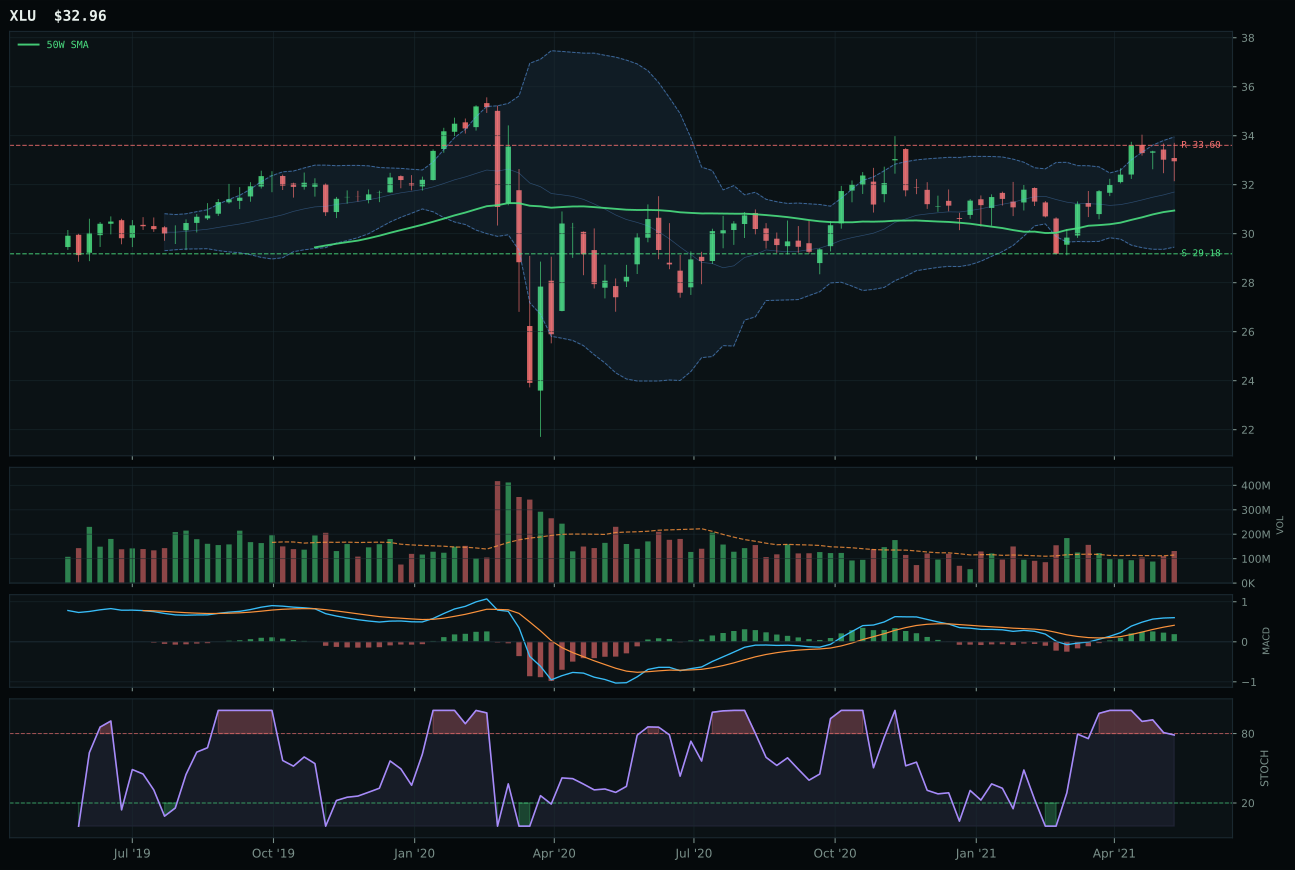
XLU has a neutral structure profile with -0.8% 13-week relative strength versus SPY.
A failed hold above support would weaken the setup.
Actionable but governed by invalidation levels.
PAVE wins the top-2 slot because its trend score of 100.0 reflects price above both the 50-week and 200-week moving averages with a strong 1.2% 50-week slope—meaning the uptrend is accelerating, not decelerating. Its momentum confirmation of 100.0 is built on an 18.7% 13-week return, 12.6% RS/SPY (outperforming the broad market), and 11.6% category relative strength (leading within Infrastructure), backed by bullish-but-flattening MACD and above-average volume participation at 1.43x. The structure score of 81.7 reflects a cleaner vertical extension (75.0 cleanliness) with tighter compression (79.7 compression score), and the volume-price confirmation of 79.7 and persistence of 82.3 are the highest in this category analysis, meaning professionals are actively accumulating despite the 33.5% extension. IGF, the runner-up, has comparable technical evidence (74.5 vs PAVE's 74.4) but lost on breadth: its 1.0% RS/SPY and 0.0% category relative strength tell you it's a pure interest-rate or dividend play without the growth equity sponsorship.
Utilities & Infrastructure secured 10% allocation as a top-2 category with a final score of 60.9. The macro fit of 52.0 is middling but constructive: the Transition/Mixed regime itself adds 4 points, broad market bear adds 4 points (suggesting defensive positioning), but inflation pressure subtracts 6 points (utility margins are pressured by rising costs). PAVE's technical evidence of 74.4/100 combined with above-average momentum and outperformance versus SPY and its peers made this category a natural co-leader with Energy. The allocation thesis is straightforward: infrastructure capex spending is sticky even in bear markets, PAVE's domestic orientation limits currency and geopolitical risk, and the 12.6% RS/SPY proves that this theme is attracting fresh capital despite broader market weakness. For PAVE to maintain top-2 status, the technical setup must hold above the 50-week (currently at 19.96); any close below that level with heavy volume would signal a loss of accumulation and could demote the category to tier-2 quickly.
Precious Metals — GLD
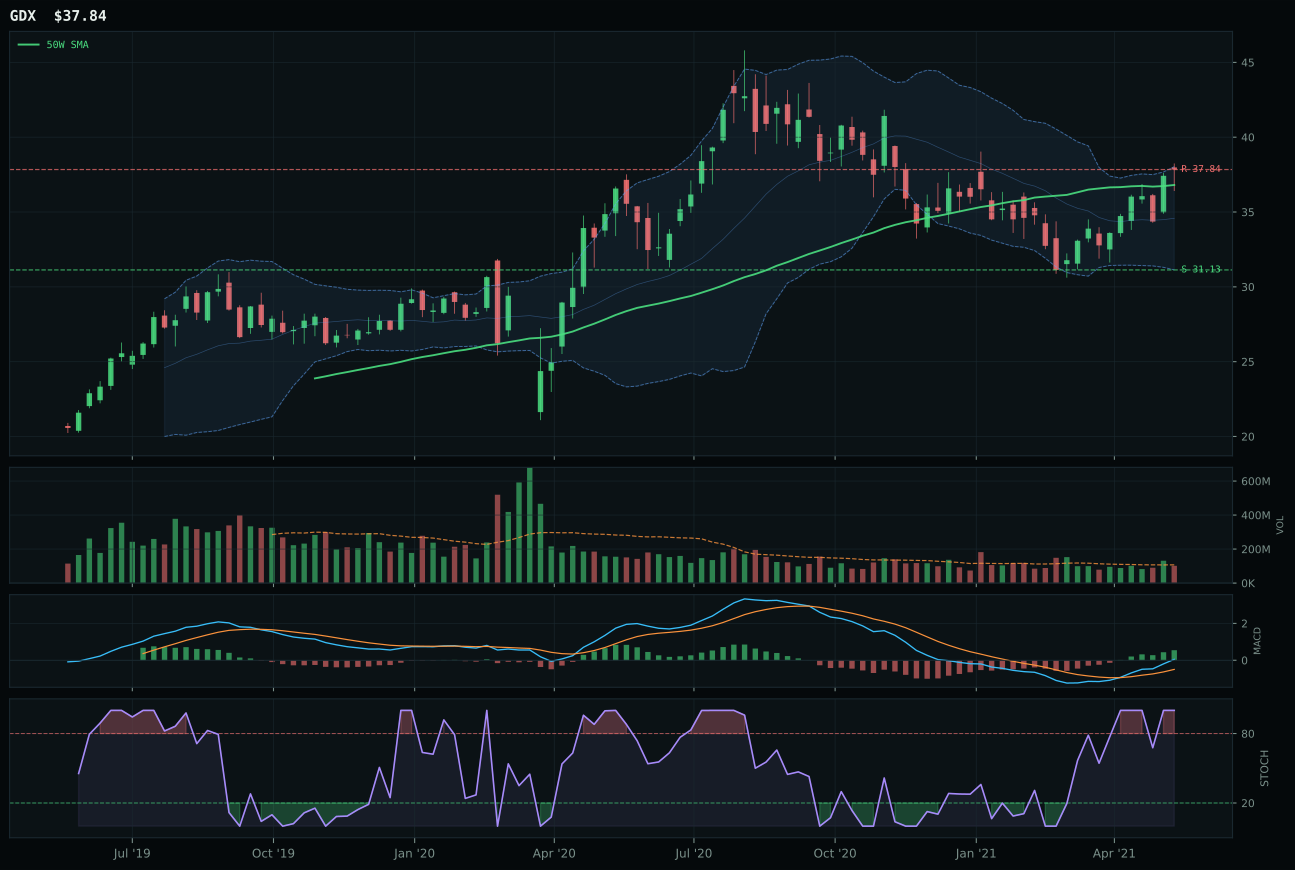
GDX has a compression near 50W profile with 2.7% 13-week relative strength versus SPY.
A failed hold above support would weaken the setup.
Actionable but governed by invalidation levels.
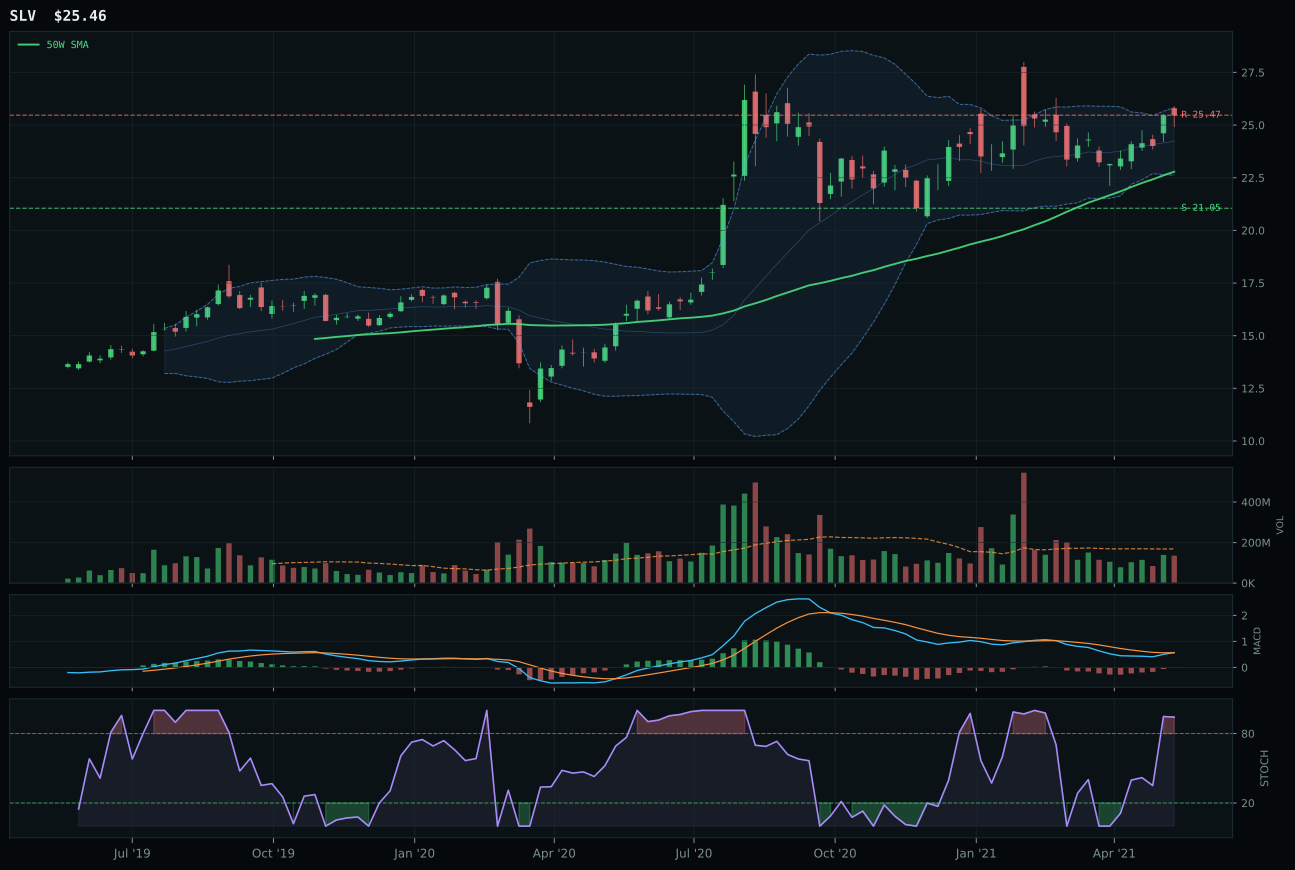
SLV has a neutral structure profile with -5.5% 13-week relative strength versus SPY.
A failed hold above support would weaken the setup.
Actionable but governed by invalidation levels.
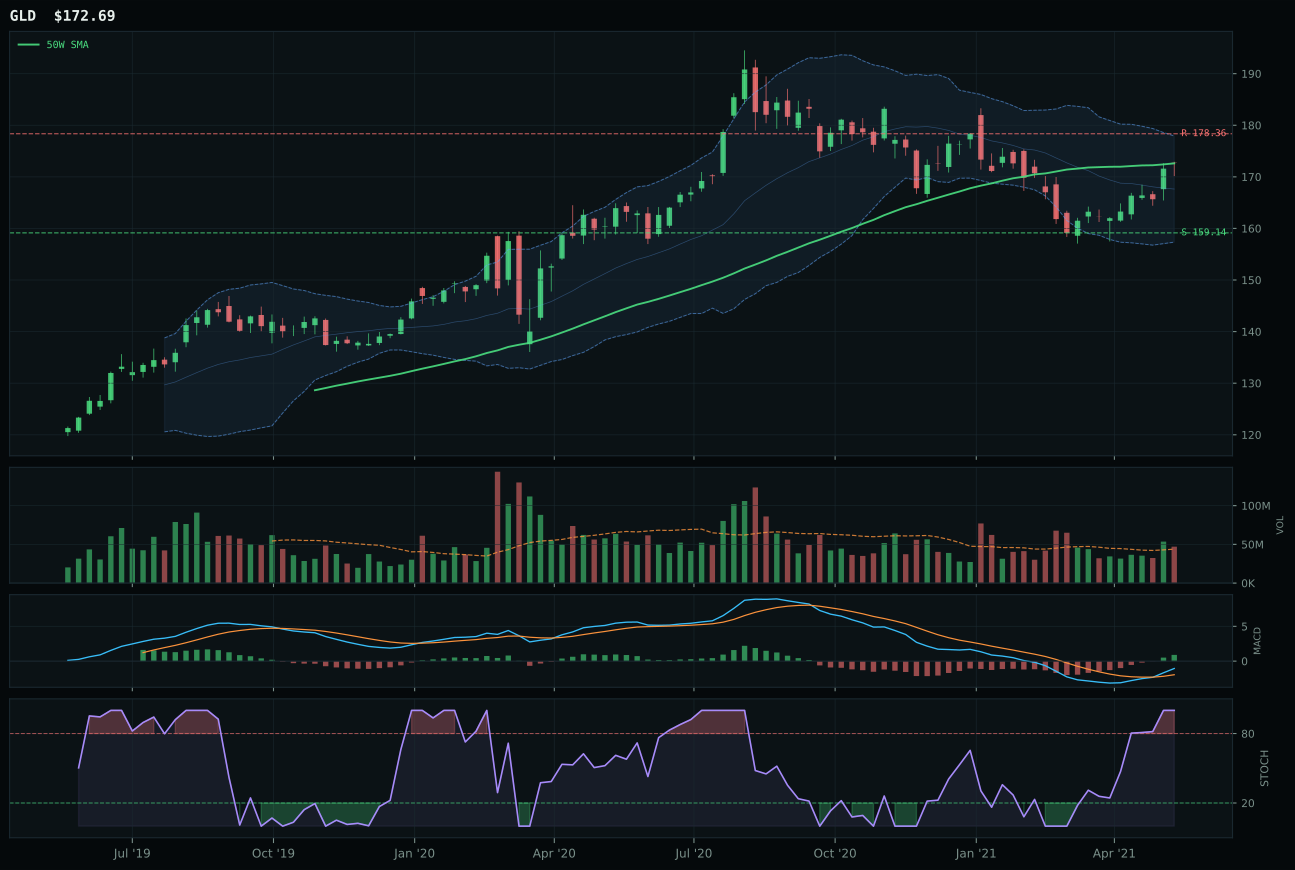
GLD has a compression near 50W profile with -4.9% 13-week relative strength versus SPY.
A failed hold above support would weaken the setup.
Actionable but governed by invalidation levels.
GLD wins because its timing score of 100.0 is the only perfect timing mark in this category analysis, achieved by sitting exactly 0.0% from the 50-week moving average (price at the decision point) while MACD is bullish and improving and stochastic RSI is overbought momentum at 1.00. This is textbook coiling for expansion: the chart shows compression near the 50-week with 87.5 compression score and support/resistance at 159.14/178.36 offering 8.5% downside and 3.2% upside—asymmetric toward the downside but in a constructive position. GDX, the runner-up, has superior technical scores (93.5 evidence vs GLD's 75.0) and posted an 8.8% 13-week return versus GLD's flat 1.2%, but GDX's macro fit of 38.0 is penalized by active credit stress (-7) and risk appetite broken (-5), while GLD's neutral 50.0 macro fit suffers no directional penalties. The winner's edge is the timing perfection at the 50-week coil.
Precious Metals earned 5% allocation as a tier-2 holding with a category score of 60.7. The macro fit of 50.0 is neutral—no descriptor profile strongly favors or penalizes the exposure—which means GLD's technical case must stand alone. The category's risk/reward profile is balanced (59.7 for both GLD and GDX), but the thinness of conviction is reflected in the 62.8 volume-price confirmation score, well below the 70+ range seen in top-2 categories. GDX's 93.5 technical evidence is the highest technical score in Precious Metals, but its 38.0 macro fit drags the whole category down compared to categories with stronger narrative support. To climb to top-2, Precious Metals would need either GLD to break above 178.36 with volume expansion (proving the coil resolves upward) or a macro shift that activates the inflation-hedge descriptor strongly enough to offset credit stress—a reacceleration in CPI prints or Fed-induced volatility, neither currently present.
Agriculture & Livestock — WEAT
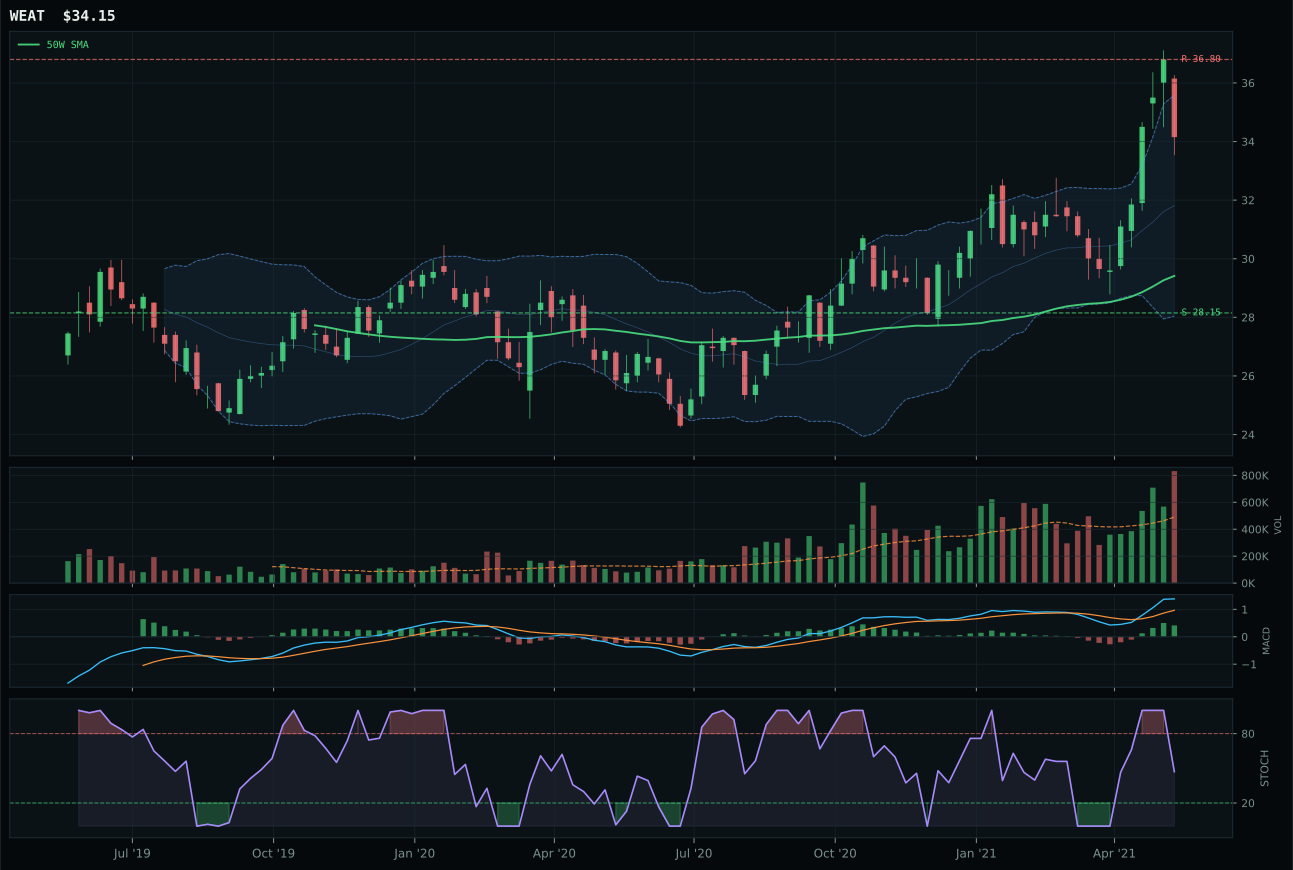
WEAT has a vertical extension profile with 4.8% 13-week relative strength versus SPY.
A failed hold above support would weaken the setup.
Actionable but governed by invalidation levels.
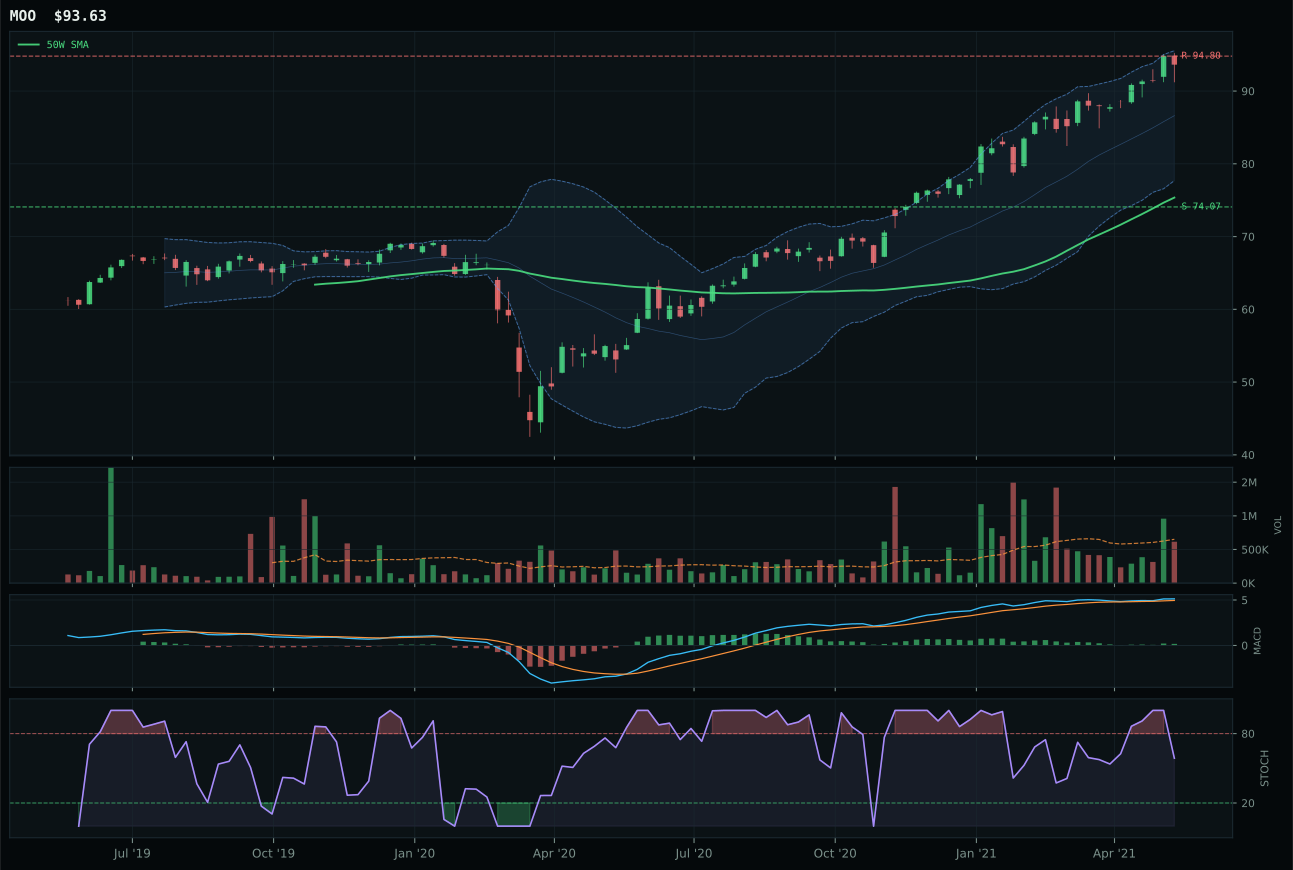
MOO has a vertical extension profile with 3.2% 13-week relative strength versus SPY.
A failed hold above support would weaken the setup.
Actionable but governed by invalidation levels.
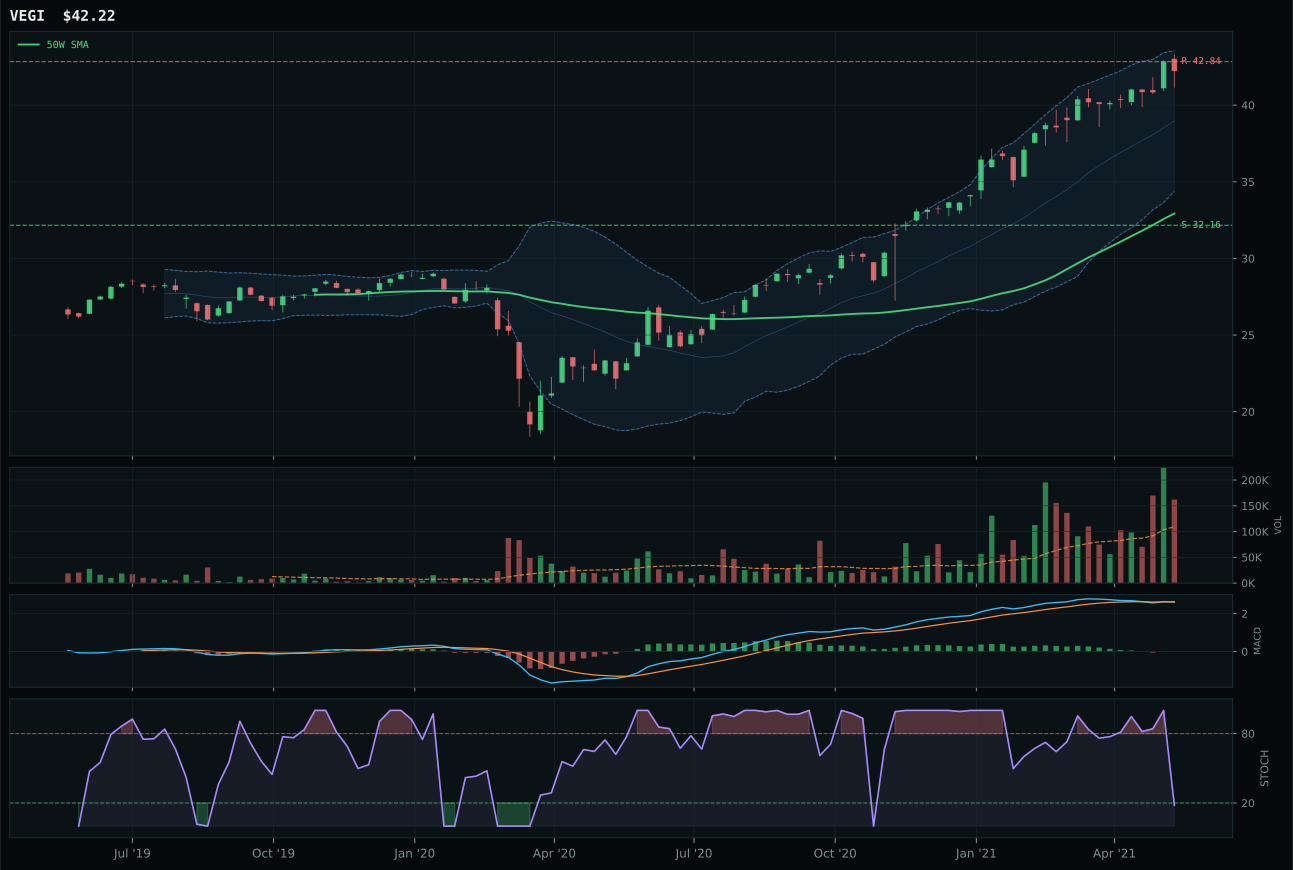
VEGI has a vertical extension profile with 4.5% 13-week relative strength versus SPY.
A failed hold above support would weaken the setup.
Tracked, but not top-2 eligible because: .
WEAT wins in a close-call category (score gap of only -1.5 points versus MOO) because its timing score of 53.0 beats MOO's 45.0, driven by a more favorable distance to the 50-week at 16.1% versus MOO's 24.2% stretch. Both names are extended beyond entry risk territory, but WEAT's stochastic RSI at 0.47 (falling/neutral) provides better oscillator confirmation than MOO's similar reading; the real edge is WEAT's tighter compression zone (74.5 vs 79.5 for MOO) and its bullish-and-improving MACD versus MOO's also-bullish reading. The momentum confirmation of 81.3 is identical in quality (both post 13-week gains near 10%), but WEAT's category relative strength of 0.3% edges MOO's -1.4%, signaling that wheat specifically is holding its own within agricultural exposure. Distribution pressure volume of 1.69x is heavy, which means professionals are taking profits, but the persistence score of 53.8 still validates the trend.
Agriculture & Livestock earned 5% allocation in tier-2 as a 57.2-ranked category. The macro fit score of 86.0 is the strongest in this week's portfolio, driven by active supply shortage (+13), inflation pressure (+10), real asset sponsorship (+8), and commodity breadth positive (+5)—a full suite of tailwinds that nearly offset the category's technical evidence of only 40.5/100 in WEAT's case. The reason Agriculture landed tier-2 rather than top-2 is pure technical: both WEAT and MOO are extended above entry-risk zones (16.1% and 24.2% respectively above their 50-weeks), and the risk/reward scores reflect that premium (43.1 and 37.8). For the category to reach top-2 allocation, either prices need to consolidate and let the 50-week slope flatten—proving the uptrend is sustainable—or the macro descriptors need to strengthen further, which would require fresh supply shortage or real-asset sponsorship signals that haven't yet emerged.
Industrial Metals — COPX
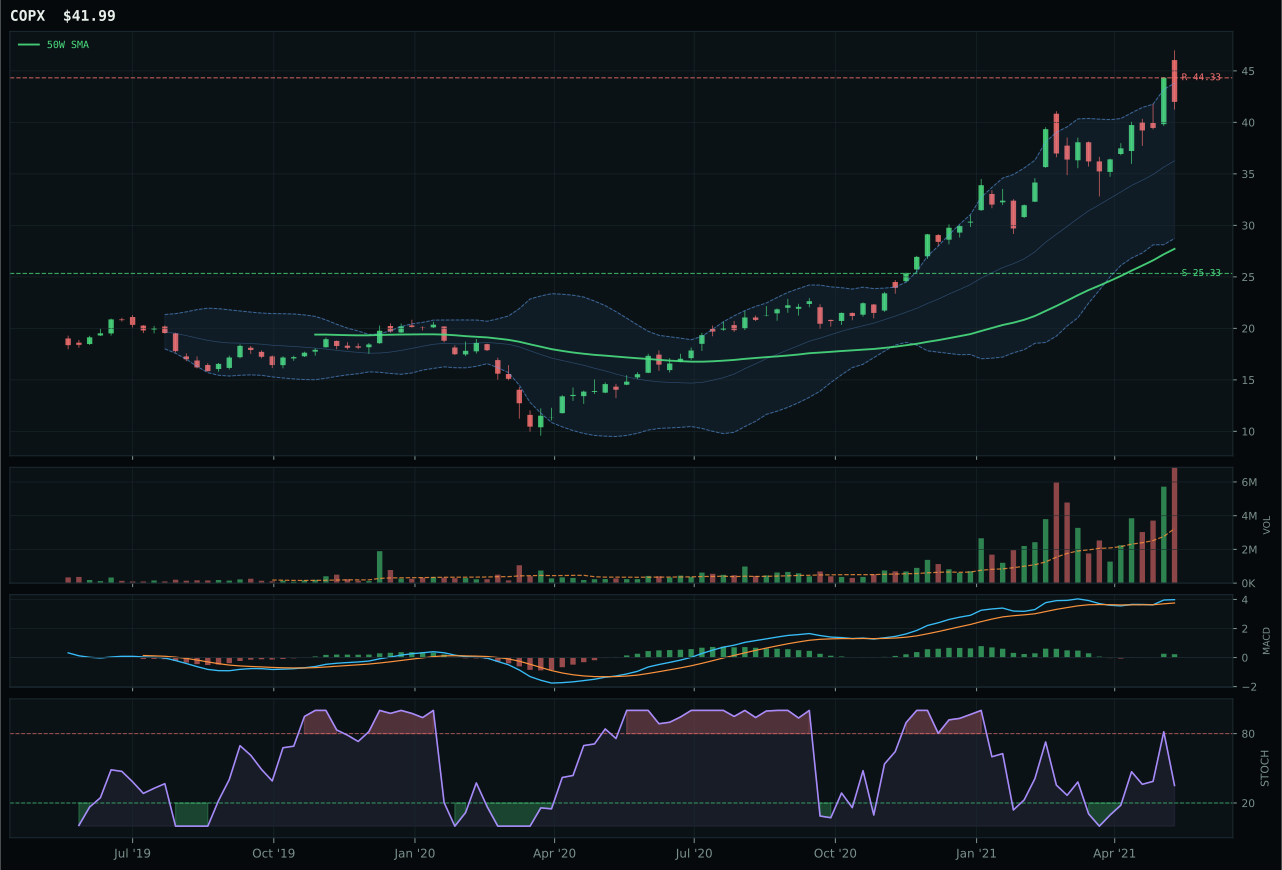
COPX has a vertical extension profile with 16.8% 13-week relative strength versus SPY.
A failed hold above support would weaken the setup.
Actionable but governed by invalidation levels.
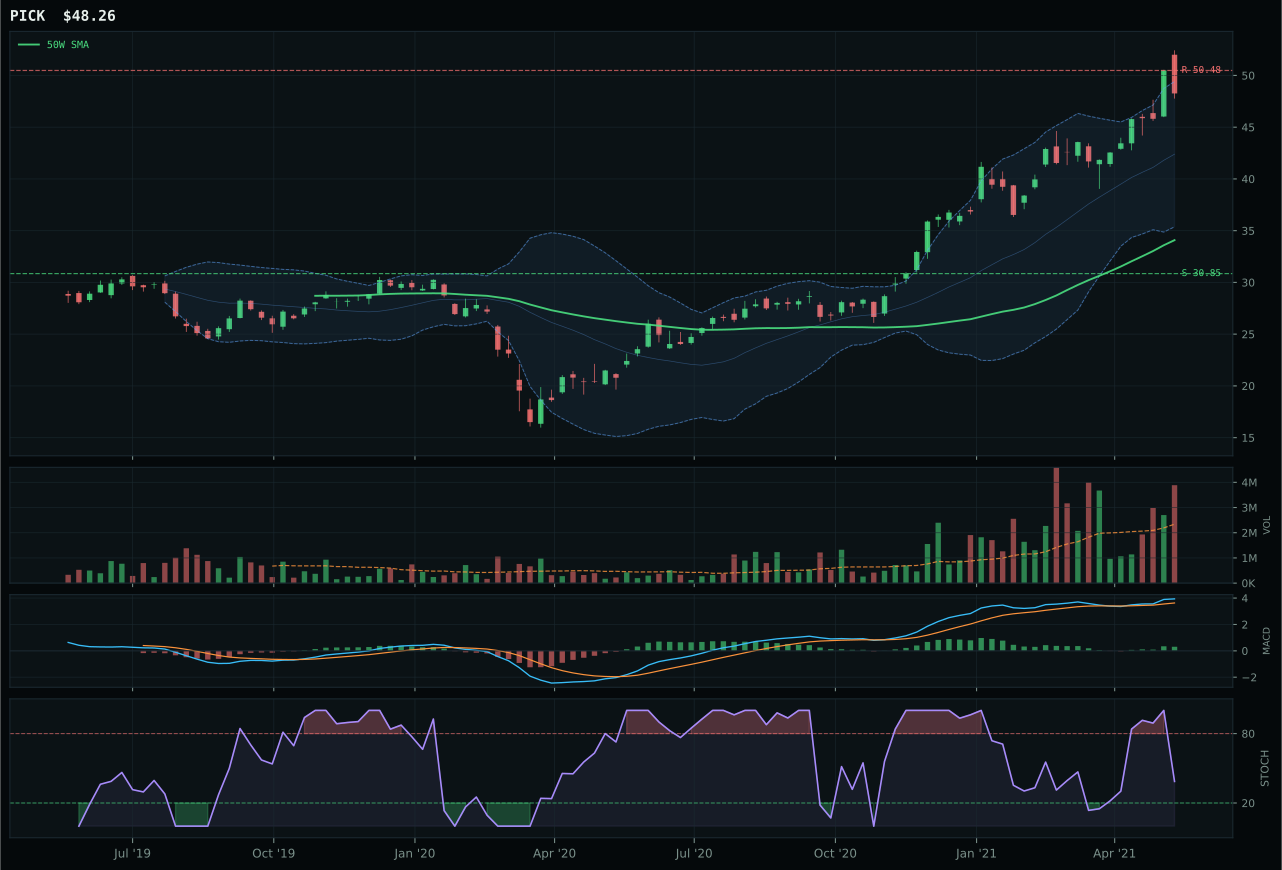
PICK has a vertical extension profile with 14.6% 13-week relative strength versus SPY.
A failed hold above support would weaken the setup.
Actionable but governed by invalidation levels.
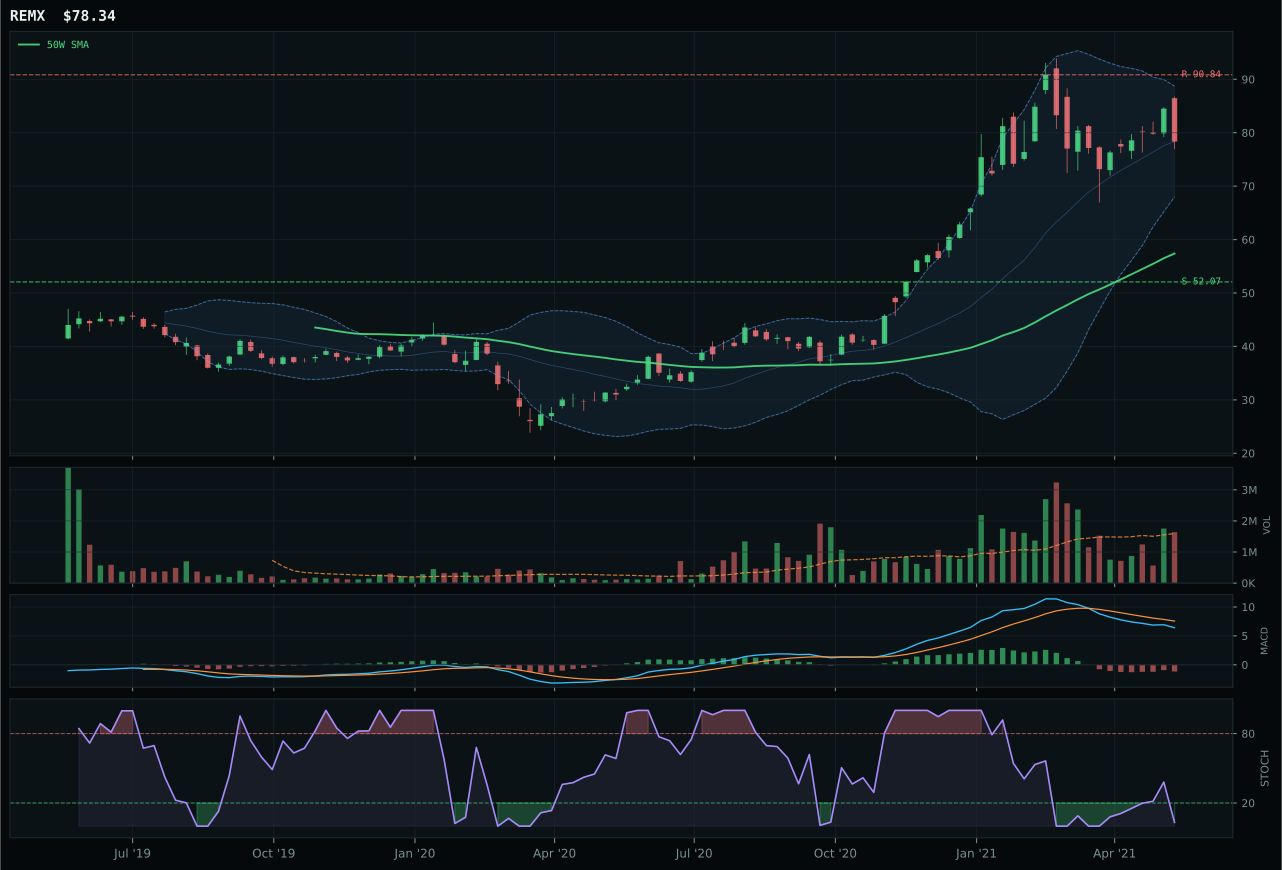
REMX has a vertical extension profile with -13.8% 13-week relative strength versus SPY.
A failed hold above support would weaken the setup.
Actionable but governed by invalidation levels.
COPX wins despite having a drastically weaker risk/reward score of 23.4 (versus PICK's 38.0) because its momentum confirmation is perfect at 100.0—the 22.9% 13-week return, bullish-and-improving MACD, and 2.2% category relative strength align to prove that copper demand and miners are under accumulation despite the 51.5% extension above the 50-week. The relative strength versus SPY of 16.8% is the highest in the category, proving that copper is outperforming broad markets even as it faces extended valuation. Volume at 3.06x the 20-week is distribution pressure (professionals selling into strength), but the persistence score of 69.2 confirms that the MACD and trend are still intact despite that profit-taking. PICK, the runner-up, has better risk/reward (38.0 vs 23.4) and comparable momentum (100.0 vs 100.0), but its category relative strength of 0.0% versus COPX's 2.2% tells you that within the metals-mining space, copper-specific exposure is pulling ahead.
Industrial Metals earned 5% allocation as a tier-2 holding with a final score of 52.6 and a strong macro fit of 73.0, driven by active metals scarcity (+14), commodity breadth positive (+10), and real asset sponsorship (+6). COPX's technical evidence of 42.1/100 is modest, but the macro fit of 69.0 provides enough tailwind to lift the category above the tier-2 threshold. The tension in this category is acute: COPX is extended 51.5% above its 50-week, which means risk/reward has deteriorated sharply to 23.4, yet the momentum and relative strength are undeniable. For Industrial Metals to climb to top-2, either prices need to consolidate and prove the uptrend is sustainable on lower absolute heights above the moving average, or the macro descriptors need to strengthen further (a fresh supply-shortage signal in copper specifically). The current setup is a classic late-stage trend where breadth and macro narrative are strongest but entry risk is highest.
Nuclear Energy — URNM
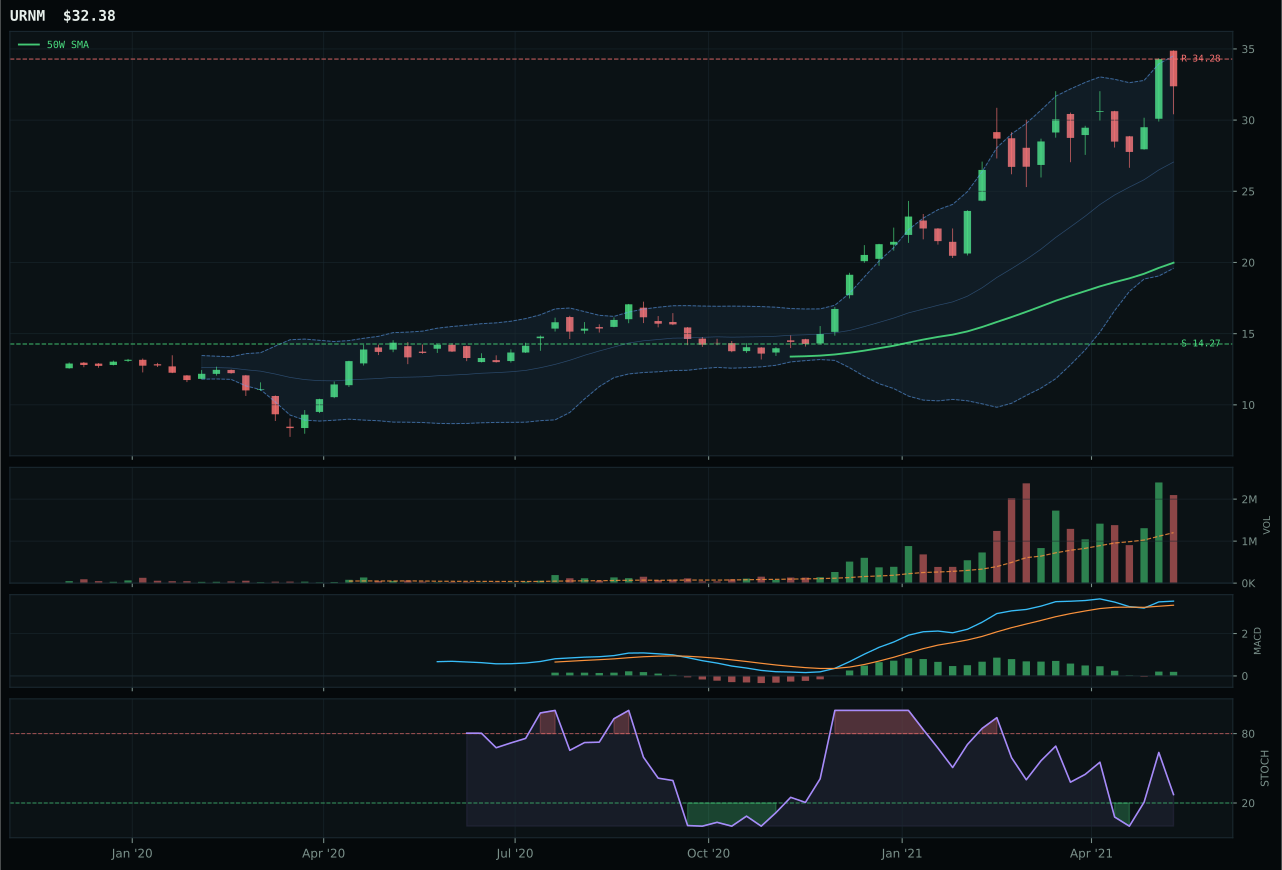
URNM has a vertical extension profile with 16.1% 13-week relative strength versus SPY.
A failed hold above support would weaken the setup.
Actionable but governed by invalidation levels.
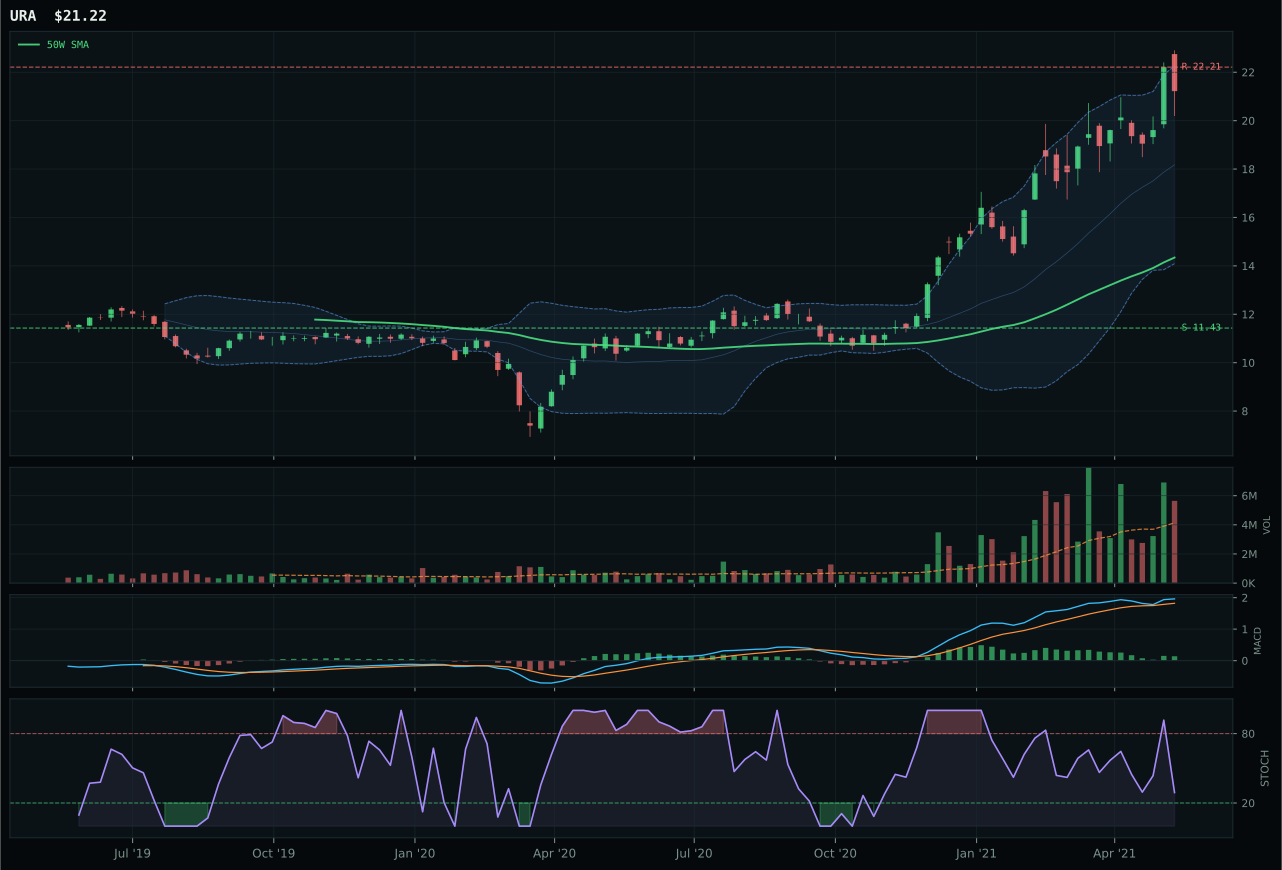
URA has a vertical extension profile with 13.0% 13-week relative strength versus SPY.
A failed hold above support would weaken the setup.
Actionable but governed by invalidation levels.
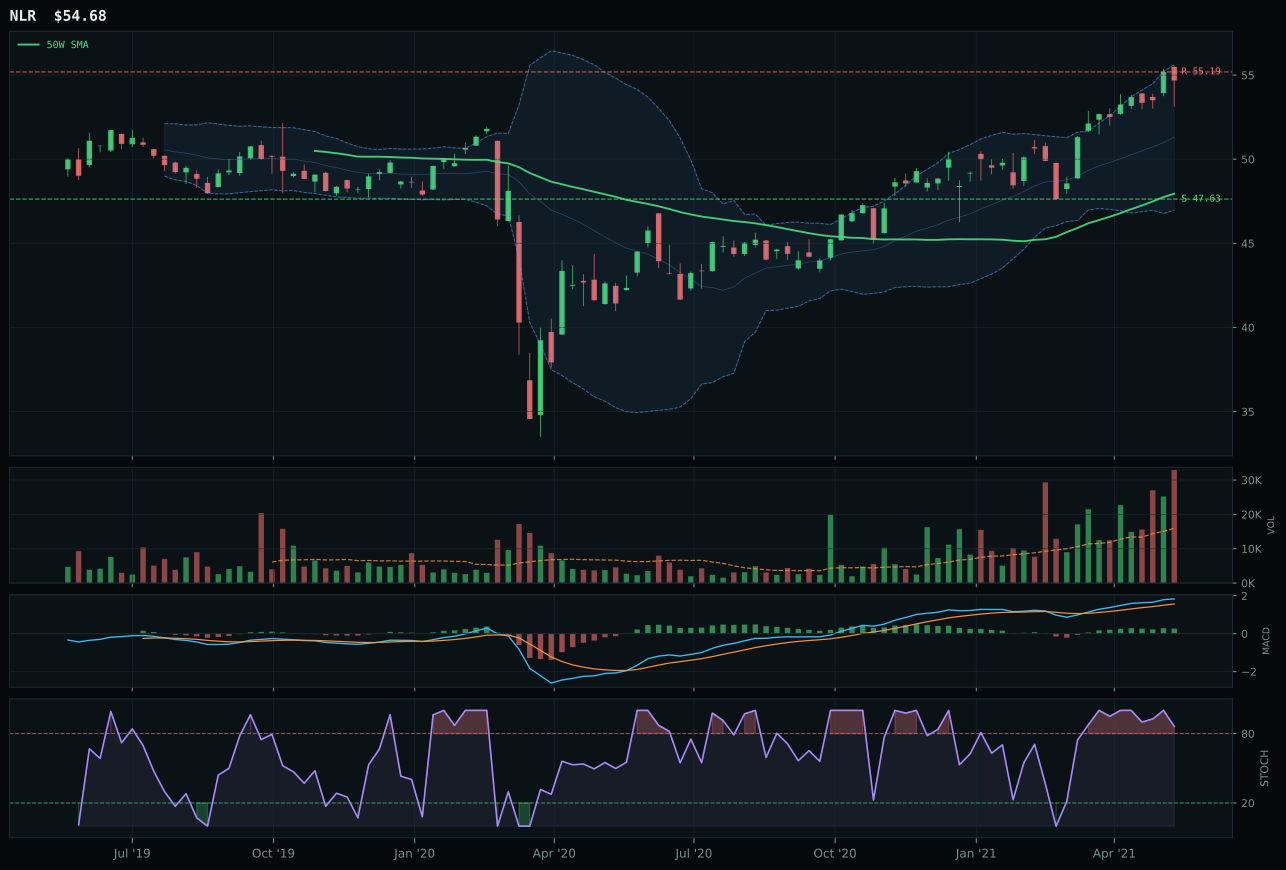
NLR has a neutral structure profile with 1.9% 13-week relative strength versus SPY.
A failed hold above support would weaken the setup.
Tracked, but not top-2 eligible because: .
URNM wins a tightly contested category because its timing score of 56.0 edges URA's 48.0 through stochastic RSI confirmation: URNM's oscillator sits at 0.27 rising mid-zone (suggesting fresh buyers entering), while URA's sits at 0.64 falling/neutral (suggesting buyers are taking profits). Both ETFs are extended (URNM at 62.0% above the 50-week, URA below it), but URNM's structure score of 64.7 maintains credibility through the vertical extension setup, while the persistence score of 74.8 proves volume and trend are still aligned. The momentum confirmation of 100.0 is identical for both (both posted 22%+ 13-week returns), but URNM's category relative strength of 3.1% versus URA's 0.0% tells you that uranium-miner beta is pulling ahead within the nuclear space. URA's technical evidence of 70.0/100 is actually superior (versus URNM's 27.2), but that excellence in trend and volume could not overcome the timing and breadth disadvantage.
Nuclear Energy earned 5% allocation as a tier-2 holding with a final score of 41.4 and a macro fit of 60.0 that includes energy scarcity (+9), real asset sponsorship (+7), and inflation pressure (+3) but carries credit stress (-5) and risk appetite broken (-4) headwinds. URNM's technical evidence of 27.2/100 is weak—the weakest among all tier-2 winners—which explains why Nuclear did not crack top-2 despite strong macro narrative support. The category's risk/reward is terrible at 22.8 for the winner, driven by 126.8% downside to support, a consequence of URNM's 62.0% extension above the 50-week. The macro case is sound (uranium scarcity, energy transition support, inflation hedge), but the technical setup is now stretched beyond prudent entry-risk tolerance. For Nuclear to reach top-2, prices must consolidate and allow the 50-week to catch up to price, resetting the risk/reward to a more attractive 20-30% downside zone, which would require a 3-4 week pause in the current rally.
Emerging Markets — ILF
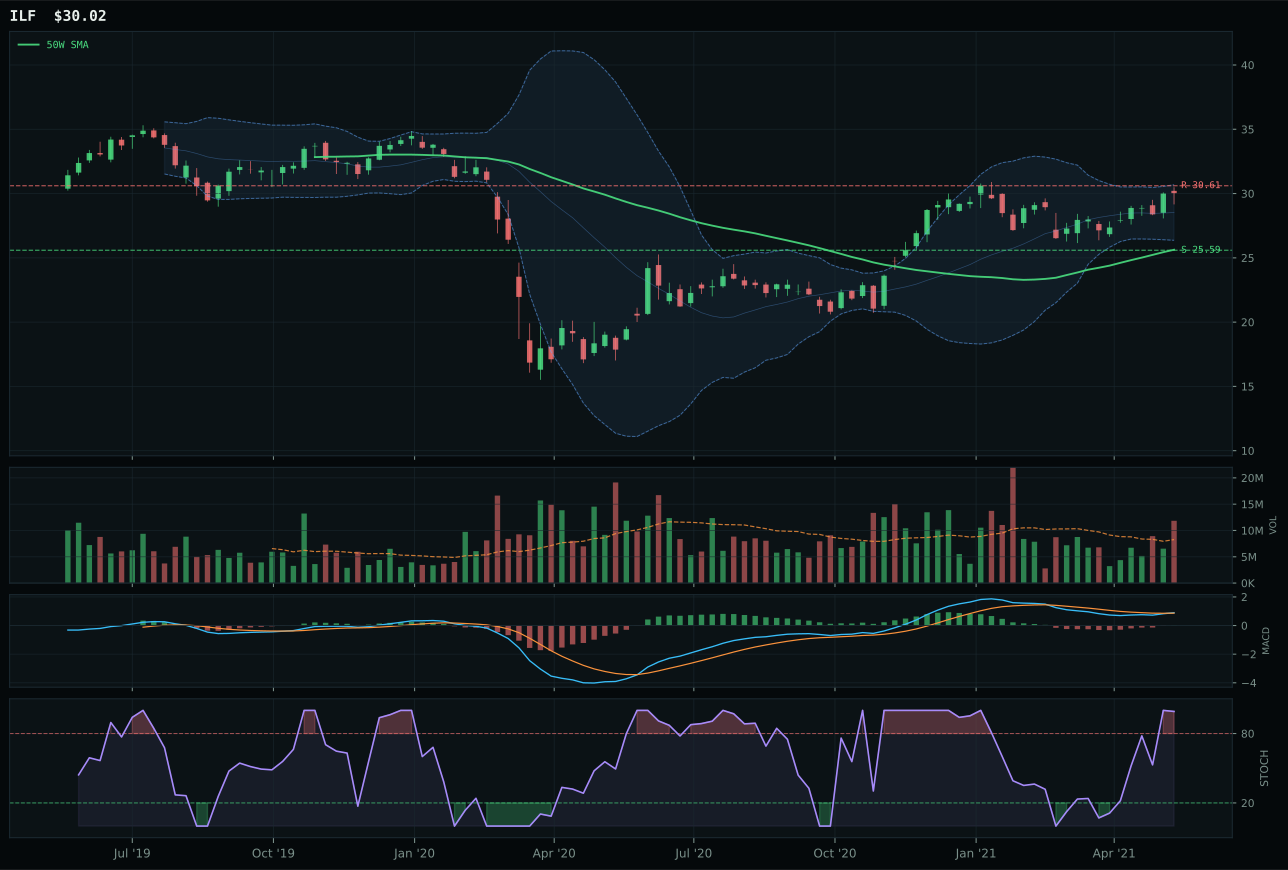
ILF has a vertical extension profile with -2.9% 13-week relative strength versus SPY.
A failed hold above support would weaken the setup.
Actionable but governed by invalidation levels.
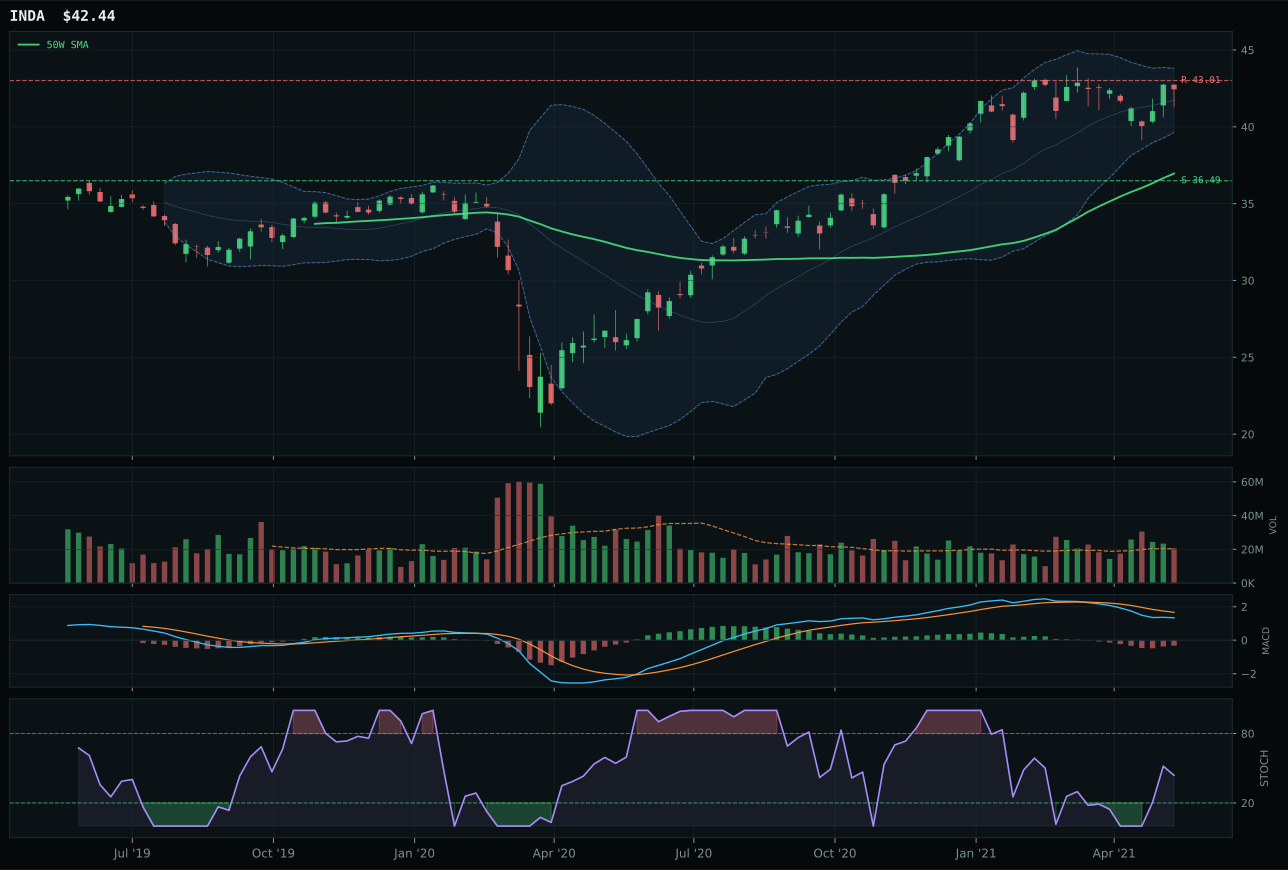
INDA has a neutral structure profile with -7.4% 13-week relative strength versus SPY.
A failed hold above support would weaken the setup.
Actionable but governed by invalidation levels.
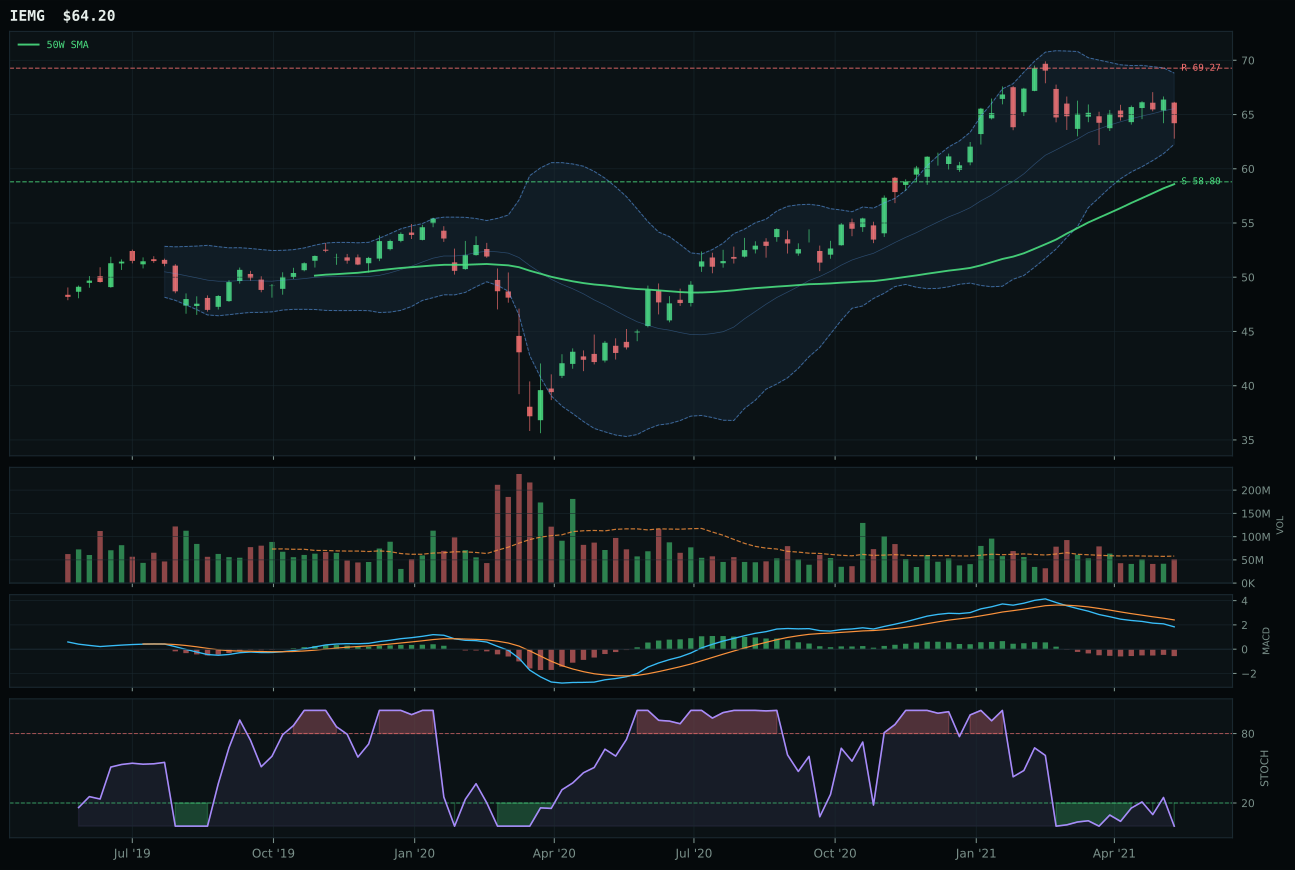
IEMG has a neutral structure profile with -13.4% 13-week relative strength versus SPY.
A failed hold above support would weaken the setup.
Actionable but governed by invalidation levels.
ILF wins because its structure score of 78.7 is the cleanest in the category—meaning the vertical extension setup has fewer false breakouts and tighter compression history—while ITA's 76.7 structure carries slightly more noise. The volume-price confirmation score of 61.0 and persistence of 67.2 both edge INDA's scores, indicating that Latin America commodity and value beta is sustaining its rally through active accumulation rather than just bouncing. ILF's 13-week return of 3.2% is modest compared to INDA's -1.3%, but the category relative strength of 4.5% (versus INDA's 0.0%) proves that ILF is the breadth leader within Emerging Markets. The macro fit explains some divergence: ILF benefits from commodity breadth and metals scarcity tailwinds (+13 combined), while INDA's quality-growth orientation gets no boost from those real-asset descriptors. Both charts sit in vertical extension near 52-week highs, but ILF's 17.1% distance from the 50-week is tighter than you'd expect given the category's macro support.
Emerging Markets received 5% allocation as a tier-2 holding with a final score of 40.2 and a macro fit of 45.0 that carries both tailwinds and headwinds: EM liquidity support is active (+14), but credit stress (-10) and broad market bear (-9) are offsetting that support. The category's technical evidence is split between ILF's strong 74.3 (Latin America benefits from commodity and real-asset tailwinds) and INDA's 61.4 (India growth gets no help from inflation/supply-shortage narratives). The reason Emerging Markets landed tier-2 rather than top-2 is the macro tension: while ILF's commodity hedge aspect provides narrative support, the broader EM category lacks the strong, unambiguous macro tailwind seen in Energy or Infrastructure. For Emerging Markets to reach top-2, either the broad market bear descriptor must flip off (signaling risk appetite recovery) and credit stress must ease, or ILF must prove that Latin American commodity exposure can decouple from SPY weakness—neither condition currently holds.
Defense & Aerospace — ITA
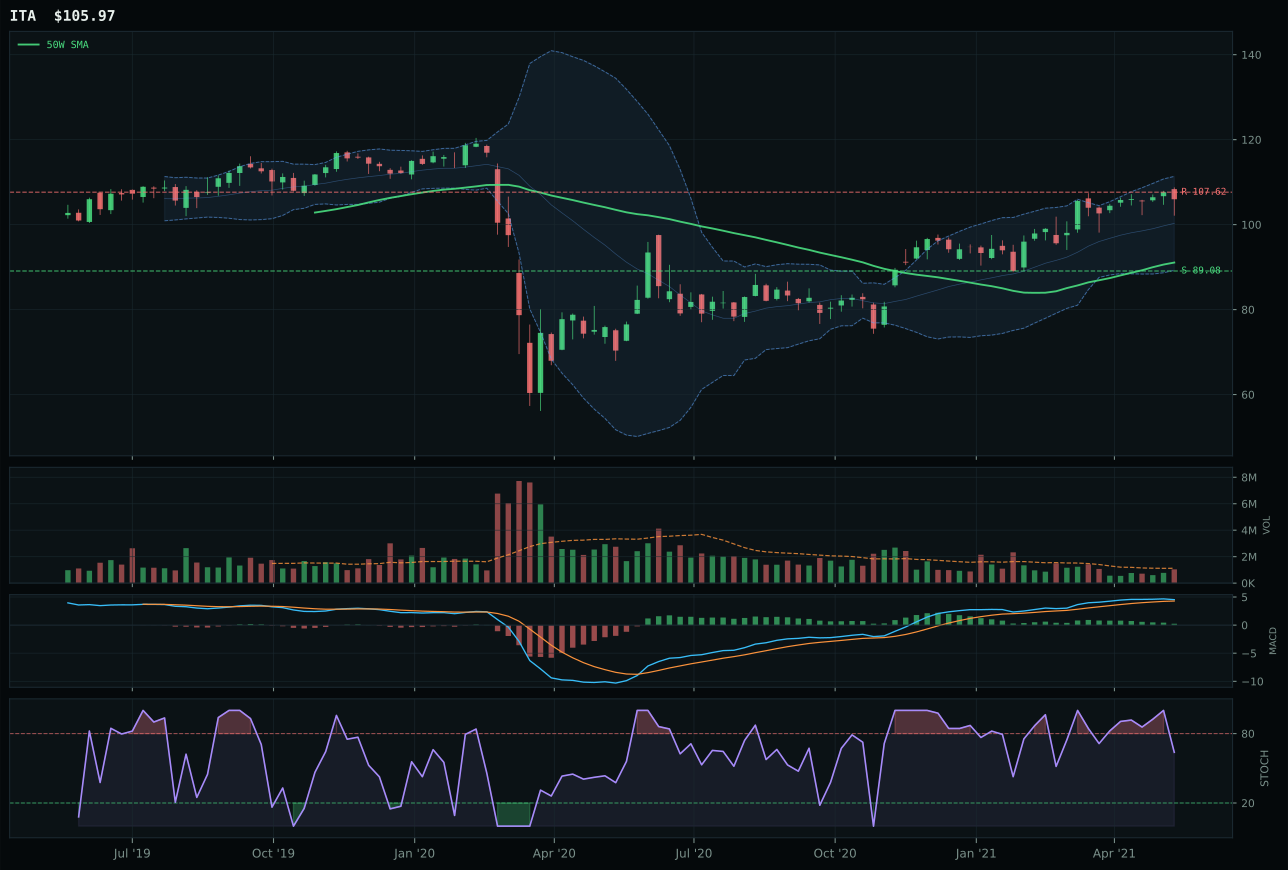
ITA has a vertical extension profile with 2.1% 13-week relative strength versus SPY.
A failed hold above support would weaken the setup.
Actionable but governed by invalidation levels.
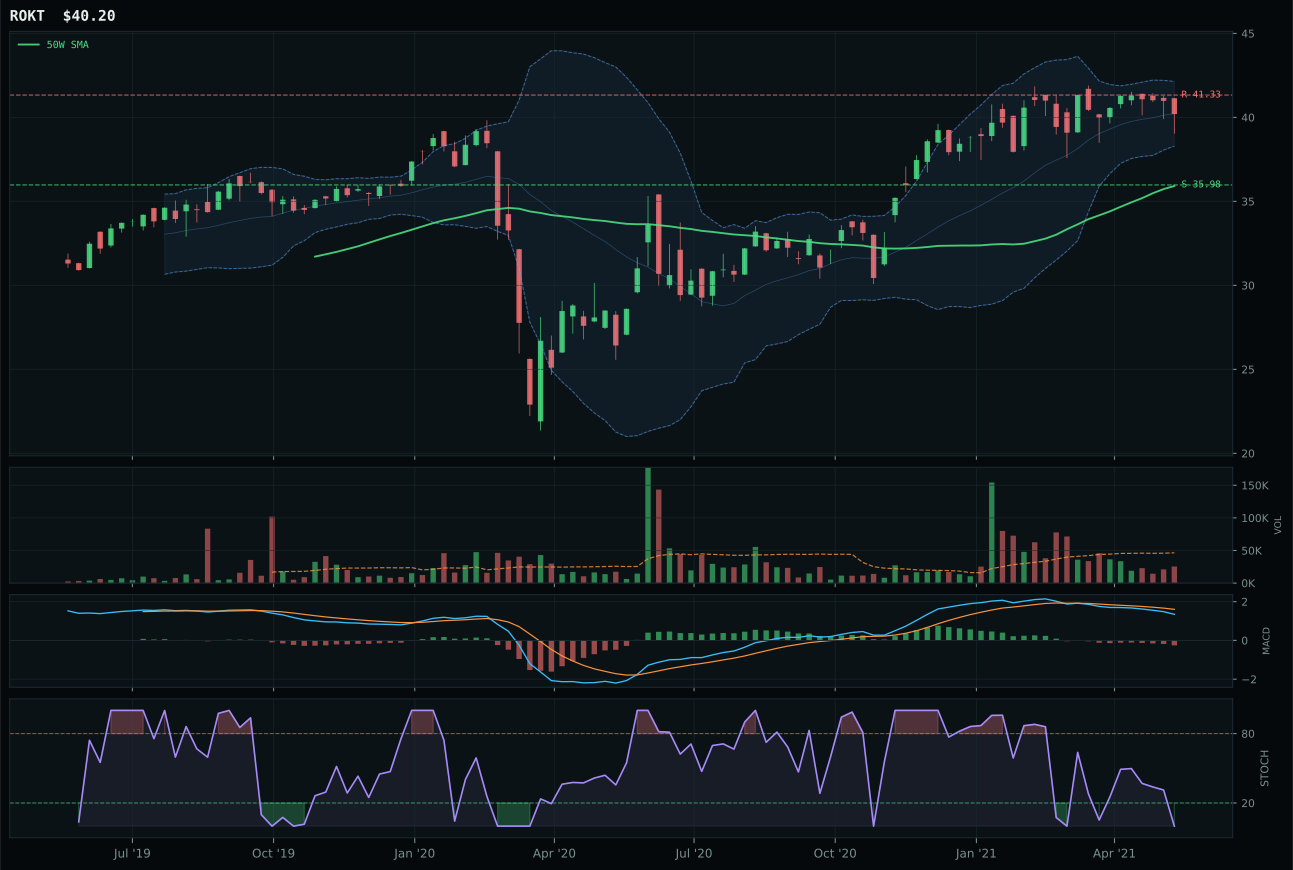
ROKT has a neutral structure profile with -8.1% 13-week relative strength versus SPY.
A failed hold above support would weaken the setup.
Tracked, but not top-2 eligible because: .
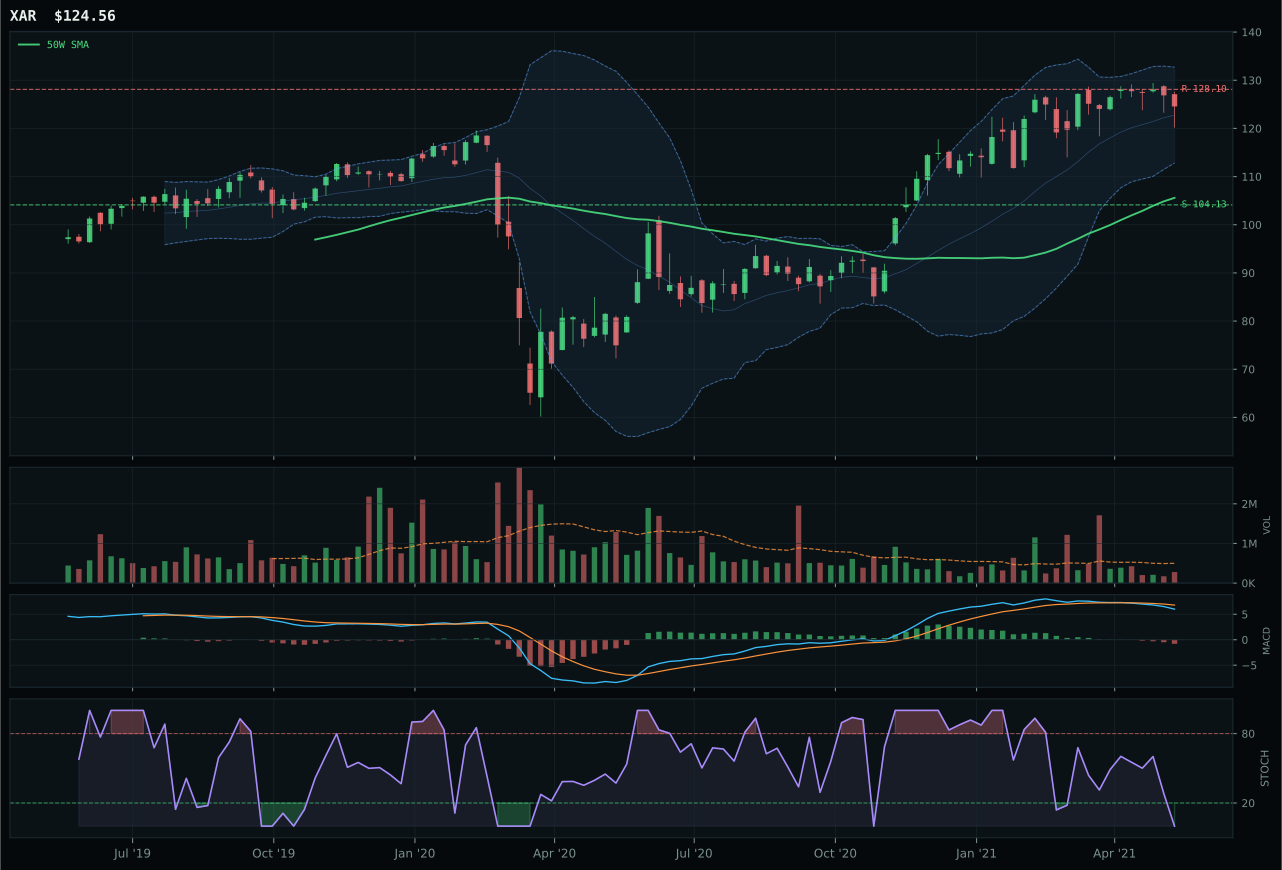
XAR has a vertical extension profile with -7.2% 13-week relative strength versus SPY.
A failed hold above support would weaken the setup.
Actionable but governed by invalidation levels.
ITA wins because its trend score of 99.2 reflects price 16.4% above the 50-week moving average while RS versus SPY sits at a positive 2.1%—a rare sight this week—and its category relative strength of 9.3% proves the strength is genuine, not borrowed from a rising sector. The momentum confirmation score of 82.0 is the highest signal in the category, driven by an 8.2% 13-week return and bullish-but-flattening MACD that confirms participants are still accumulating despite the extended position. The structure score of 74.2 reflects vertical extension setup quality that is cleaner than ROKT's 65.1, and the persistence score of 75.0 means volume and price movements are corroborating the uptrend. ROKT lost because its -8.1% RS/SPY, bearish/weakening MACD, oversold stochastic RSI, and thin volume painted a picture of a name that was bouncing off support but lacked the breadth sponsorship to drive fresh highs.
Defense & Aerospace received 5% allocation as a tier-2 holding, ranked outside the top-2 despite a score of 34.8. The category's macro fit of 59.0 is middling; while the broad market bear descriptor adds 6 points (suggesting defensive durability), credit stress and risk appetite broken subtract 7 and 2 points respectively, creating no strong tailwind for the space. ITA's technical evidence of 63.9/100 is solid, but the timing score of 40.0 reflects the 16.4% extension above the 50-week, which means every new buyer from here faces deteriorating risk/reward. To climb to top-2, Defense & Aerospace would need either a pullback that resets the risk/reward geometry while maintaining positive RS/SPY, or a regime shift that pins the broad market bear descriptor off and removes inflation/credit headwinds—unlikely in the next few weeks given the current macro state.
Technology — CIBR
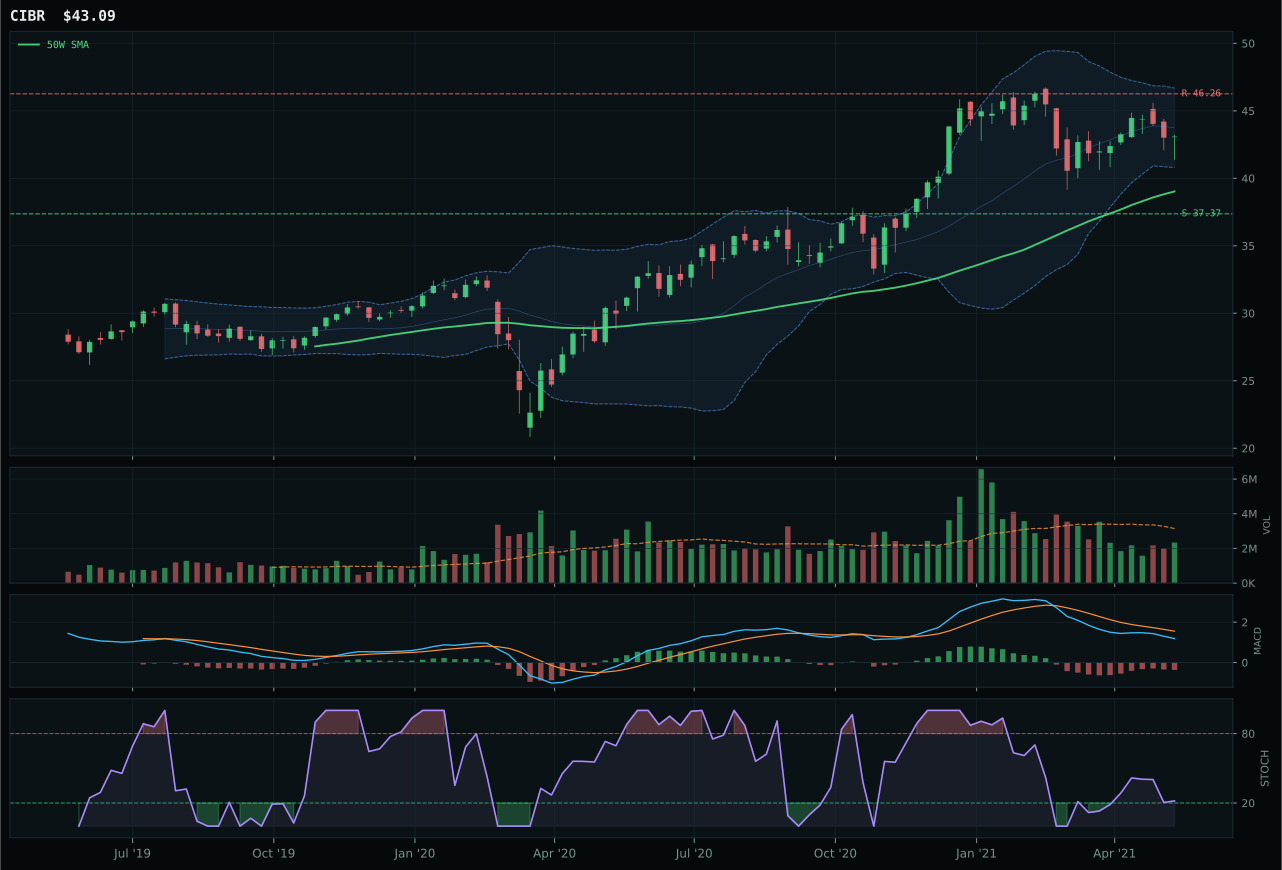
CIBR has a neutral structure profile with -12.9% 13-week relative strength versus SPY.
A failed hold above support would weaken the setup.
Actionable but governed by invalidation levels.
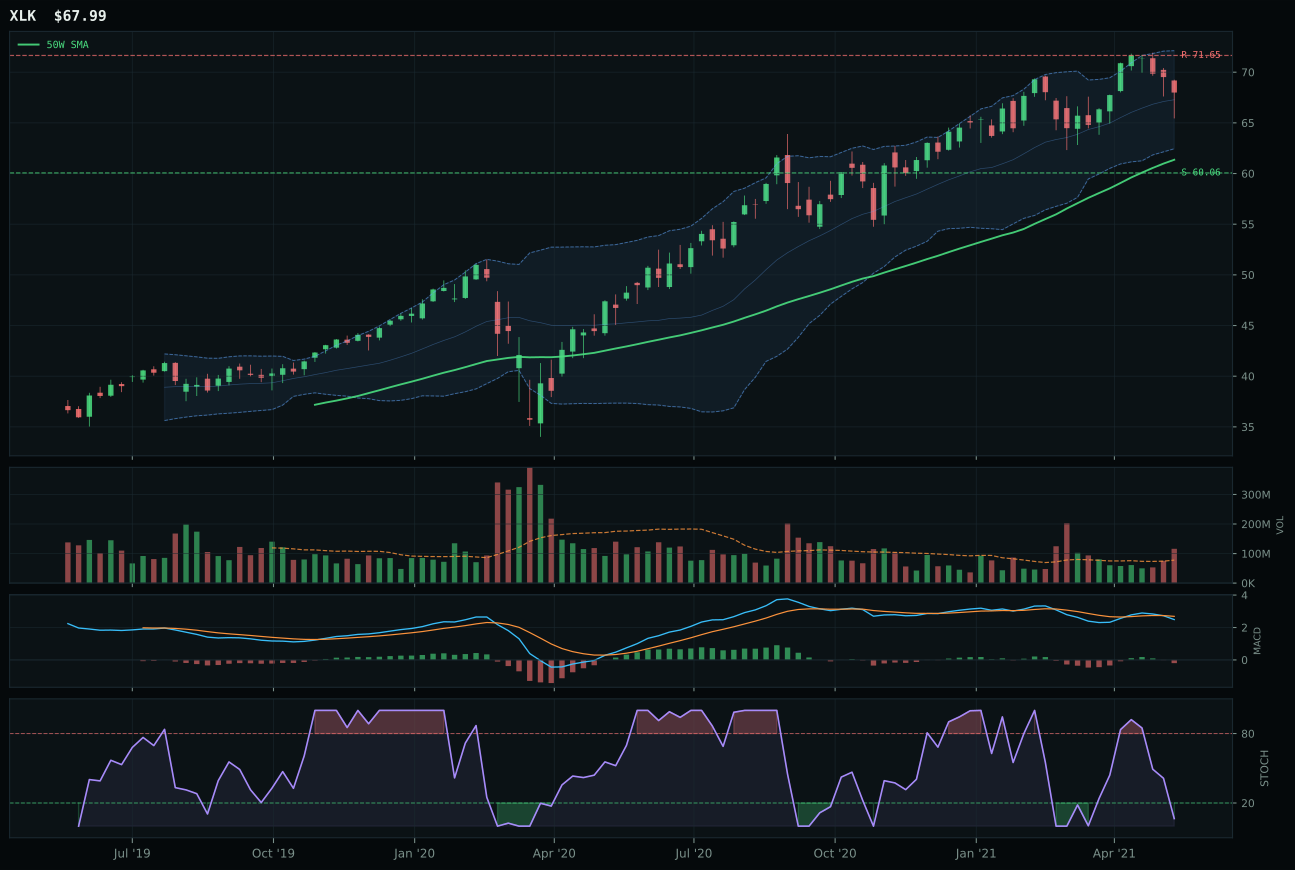
XLK has a neutral structure profile with -8.0% 13-week relative strength versus SPY.
A failed hold above support would weaken the setup.
Actionable but governed by invalidation levels.
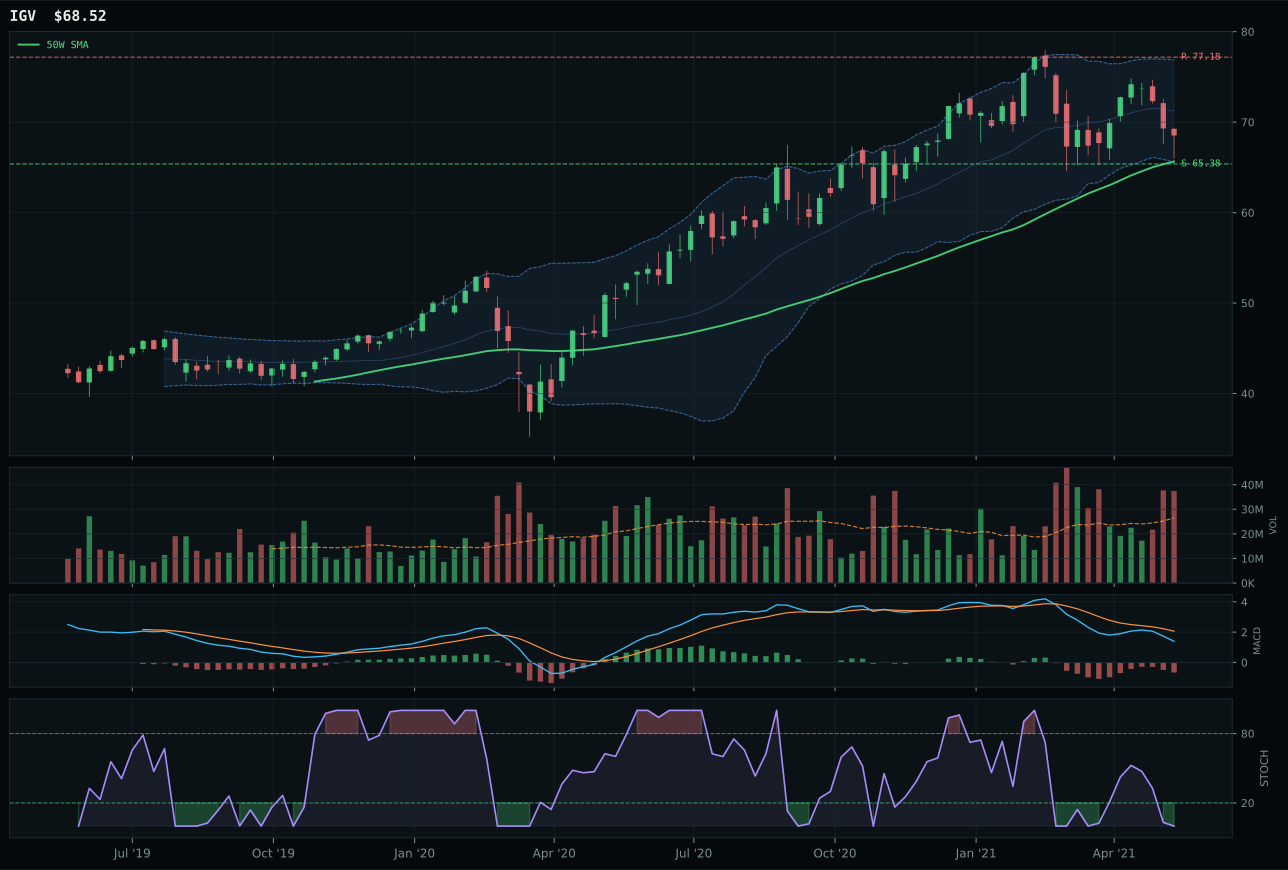
IGV has a pullback into support profile with -17.3% 13-week relative strength versus SPY.
A failed hold above support would weaken the setup.
Actionable but governed by invalidation levels.
CIBR wins the category because its trend score of 78.0 reflects price anchored above both the 50-week and 200-week moving averages with a stable 0.5% 50-week slope—a foundation that matters when relative strength versus SPY sits at -12.9%, telling you that broad tech weakness is not yet a CIBR problem. The timing score of 75.0 edges XLK's 70.0 because CIBR's MACD is bearish but improving while stochastic RSI sits in the neutral falling zone at 0.22, suggesting accumulation is possible if the next bar holds. Volume at 0.74x the 20-week average is thin, which penalizes conviction, but that same thinness means the support/resistance zone from 37.37 to 46.26 hasn't been rejected on heavy selling yet. XLK, the runner-up, failed on timing and risk/reward: its MACD deteriorated into bearish/weakening territory and its stochastic RSI collapsed to oversold levels, leaving it looking like a bounce candidate rather than a setup worth committing fresh capital toward.
Technology ranked 9th or 10th among the ten categories and earned 0% allocation this week. The category's final score of 27.2 was dragged down by a 39.0 macro fit rating in a Transition/Mixed regime where credit stress and inflation pressure are both active headwinds—both penalize growth hardware and software equally. The technical ETF evidence in the basket averaged just 49.4/100, reflecting broad negative momentum, MACD deterioration, and relative weakness versus SPY that signals buyers are stepping back across the entire three-ETF basket (CIBR, XLK, IGV). For Technology to earn a top-2 or even tier-2 slot, the category would need either a sharp reversal in relative strength (the -12.9% RS/SPY gap must narrow to positive) or a macro shift that removes the credit and inflation pressure descriptors—neither is imminent in this transition environment.
AI — BOTZ
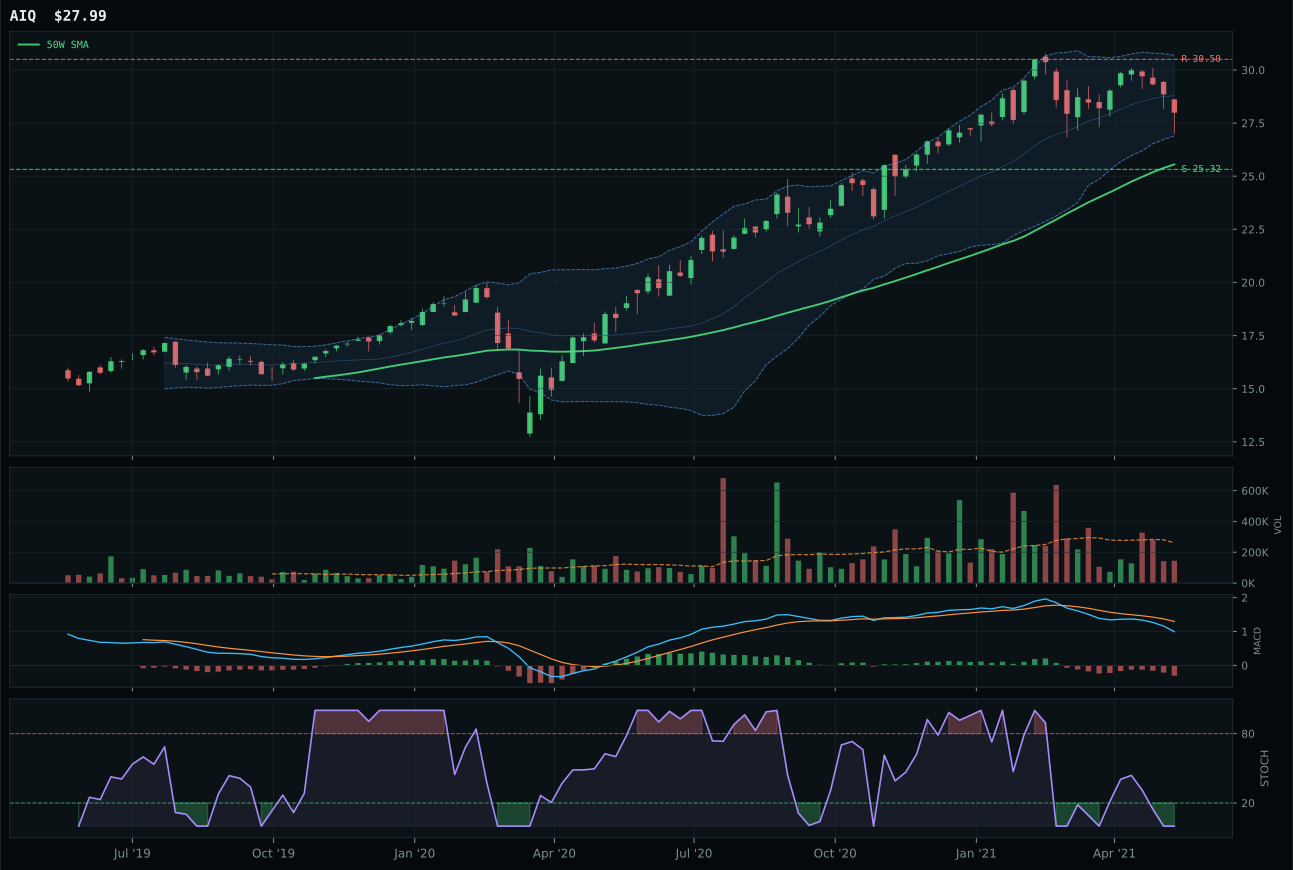
AIQ has a neutral structure profile with -14.3% 13-week relative strength versus SPY.
A failed hold above support would weaken the setup.
Tracked, but not top-2 eligible because: .
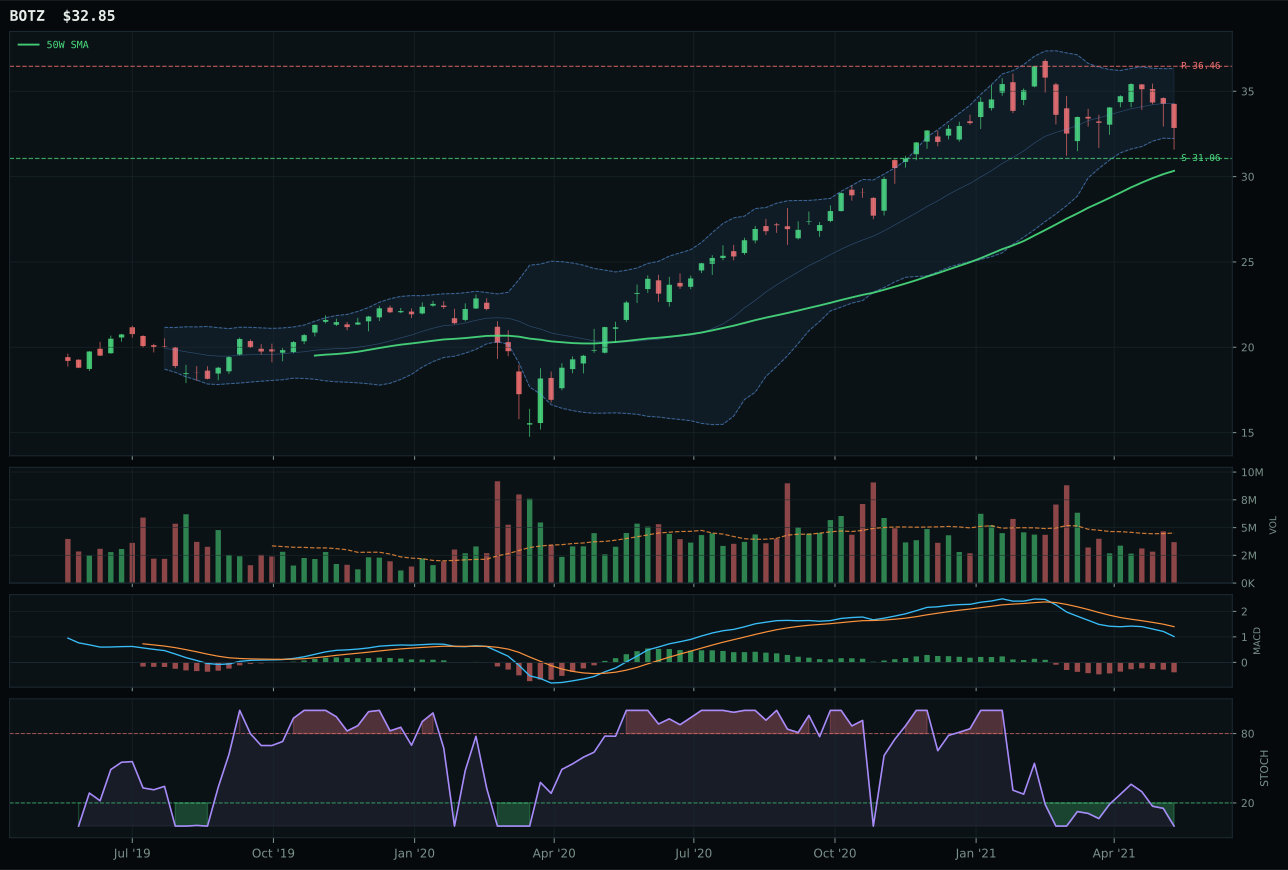
BOTZ has a neutral structure profile with -16.0% 13-week relative strength versus SPY.
A failed hold above support would weaken the setup.
Actionable but governed by invalidation levels.
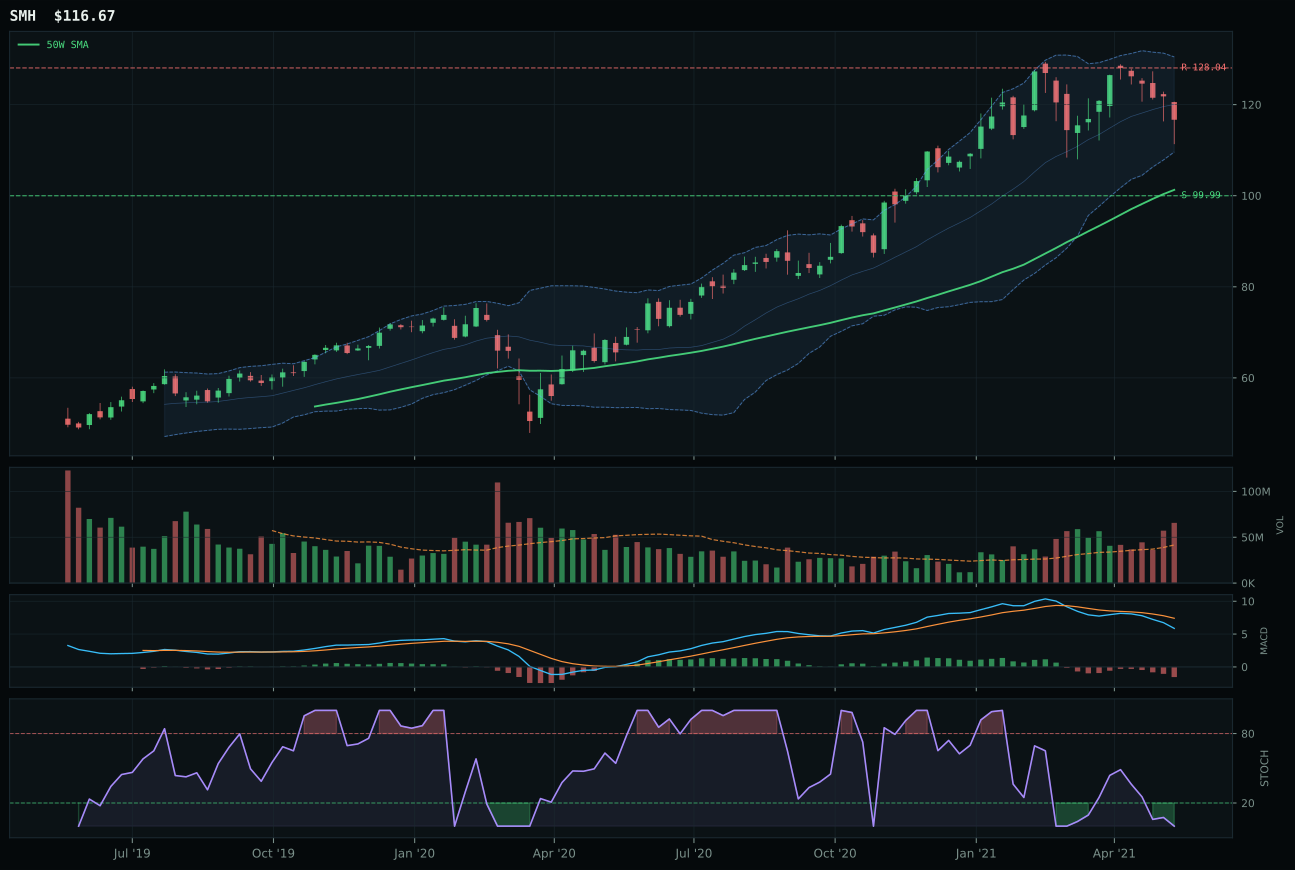
SMH has a vertical extension profile with -14.4% 13-week relative strength versus SPY.
A failed hold above support would weaken the setup.
Actionable but governed by invalidation levels.
BOTZ wins because its 75.9 risk/reward score—driven by -9.9% upside to resistance and only 5.8% downside to support—offers the cleaner entry point in a category where all three ETFs are oversold and momentum is zero across the board. Its 0.82x volume (neutral participation) beats AIQ's thin 0.74x, which matters when both names are correcting and you need to see whether buyers are showing up or disappearing. The structure score of 65.0 reflects neutral setup quality, and MACD is uniformly bearish/weakening across the category, but BOTZ's stochastic RSI at 0.00 is deep enough that a reversal bar would register immediately on the oscillator. AIQ lost because its 59.0 risk/reward score combined with thin volume and a marginally weaker structure left it without the asymmetry that would justify taking the setup despite the category's -16.0% relative weakness to SPY and near-zero momentum.
AI ranked outside the allocation entirely at 0%, placing in the bottom tier this week. The final category score of 13.6 reflects a severely challenged macro fit of 34.0 in a regime where both credit stress and broad market bear are active, simultaneously penalizing cyclical AI hardware demand and risk appetite for growth. BOTZ's technical evidence scored just 25.4/100, with 13-week returns at -9.9%, SPY relative strength at -16.0%, and category relative strength at -1.6%—all telling you that artificial intelligence and robotics equity are undefended against the current regime. The gap between macro need (39.0 fit score) and technical validation (25.4 evidence score) is too wide to overcome with a narrow upside/downside ratio; until either credit stress clears or the category posts a positive 13-week return with improving MACD and positive category breadth, AI remains on the sideline.