
2021-05-07
Informational purposes only. The content in this report, including allocations, analysis, and commentary, is provided solely for informational and educational purposes. It does not constitute financial advice, investment advice, trading advice, or any other type of advice. Past performance does not guarantee future results. Always conduct your own research and consult a qualified financial professional before making investment decisions.
Weekly Allocation
| Ticker | Category | Weight | Role |
|---|---|---|---|
| FSOL | 50% | Overlay | |
| COPX | Industrial Metals | 10% | Top-2 (10%) |
| WEAT | Agriculture & Livestock | 10% | Top-2 (10%) |
| URNM | Nuclear Energy | 5% | Tier-2 (5%) |
| XLE | Traditional Energy | 5% | Tier-2 (5%) |
| XLU | Utilities & Infrastructure | 5% | Tier-2 (5%) |
| GDX | Precious Metals | 5% | Tier-2 (5%) |
| ILF | Emerging Markets | 5% | Tier-2 (5%) |
| ITA | Defense & Aerospace | 5% | Tier-2 (5%) |
Trade Instructions — Monday Open
Sell the tranche from 2021-04-09 (completing its 4-week hold). Buy the new tranche. Instructions show net portfolio changes — same-asset positions cancel, weight changes show the delta.
| Action | Ticker | Instruction |
|---|---|---|
| SELL | XLE | Sell 17% of XLE position (reduce 7.50% → 6.25%) |
| SELL | URNM | Sell 33% of URNM position (reduce 3.75% → 2.50%) |
| SELL | MOO | Sell entire MOO position (1.25% of portfolio) |
| SELL | XAR | Sell 50% of XAR position (reduce 2.50% → 1.25%) |
| SELL | SLV | Sell 25% of SLV position (reduce 5.00% → 3.75%) |
| SELL | PICK | Sell entire PICK position (1.25% of portfolio) |
| SELL | SMH | Sell entire SMH position (1.25% of portfolio) |
| BUY | WEAT | Buy WEAT — 28.57% of freed cash (adds 2.50% to portfolio) |
| BUY | COPX | Buy COPX — 28.57% of freed cash (adds 2.50% to portfolio) |
| BUY | ITA | Buy ITA — 14.29% of freed cash (adds 1.25% to portfolio) |
| BUY | GDX | Buy GDX — 14.29% of freed cash (adds 1.25% to portfolio) |
| BUY | ILF | Buy ILF — 14.29% of freed cash (adds 1.25% to portfolio) |
Current Portfolio After Trade
Combined holdings across all 4 active tranches. Each tranche is 25% of the portfolio.
| Ticker | % of Portfolio | Weight Bar |
|---|---|---|
| FSOL | 50.00% | |
| WEAT | 8.75% | |
| COPX | 8.75% | |
| XLE | 6.25% | |
| XLU | 6.25% | |
| SLV | 3.75% | |
| ITA | 3.75% | |
| URNM | 2.50% | |
| URA | 2.50% | |
| XAR | 1.25% | |
| XLK | 1.25% | |
| IGV | 1.25% | |
| CIBR | 1.25% | |
| GDX | 1.25% | |
| ILF | 1.25% |
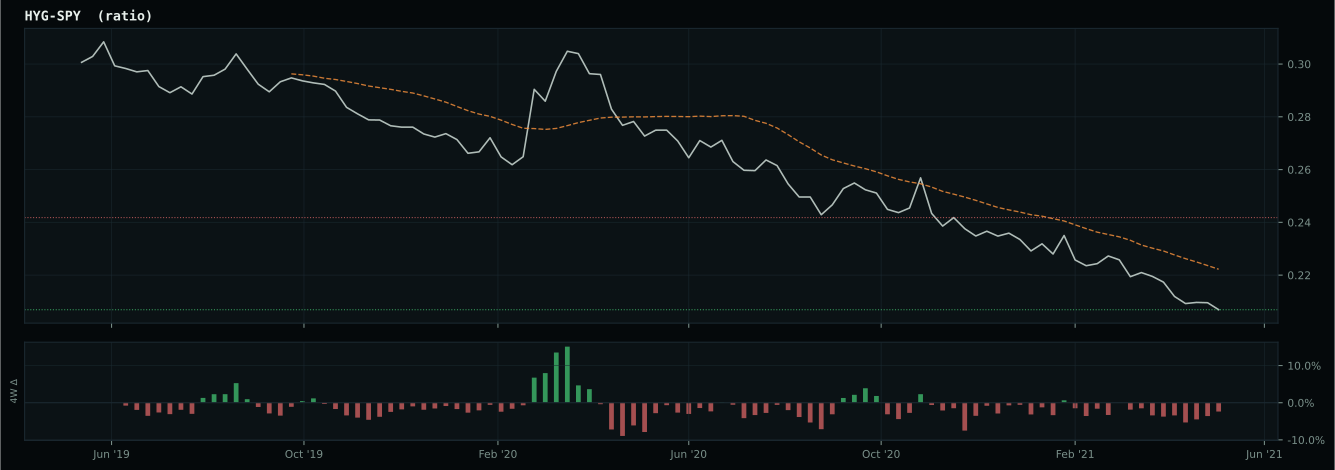
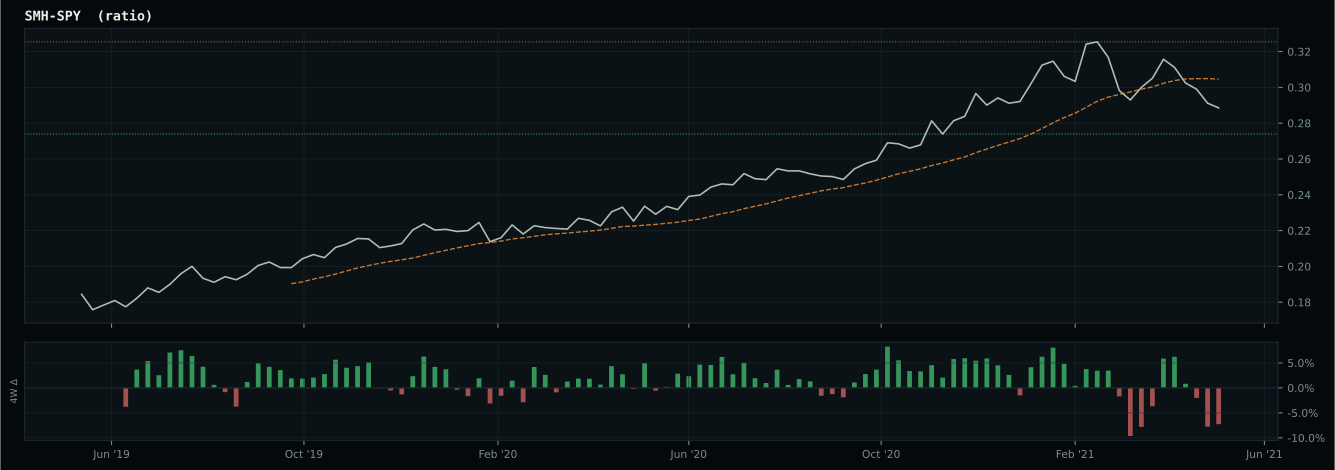
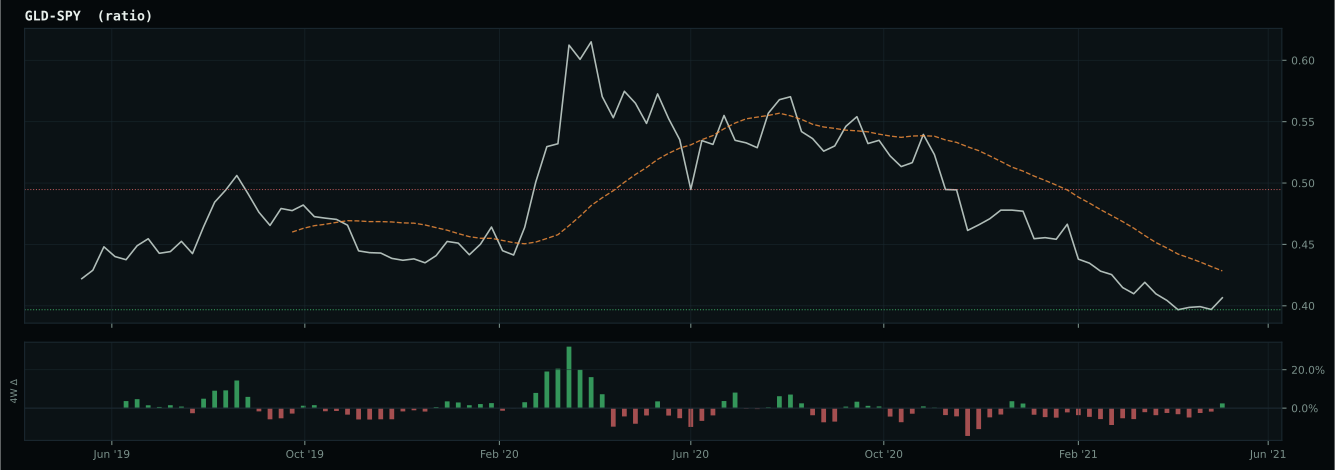
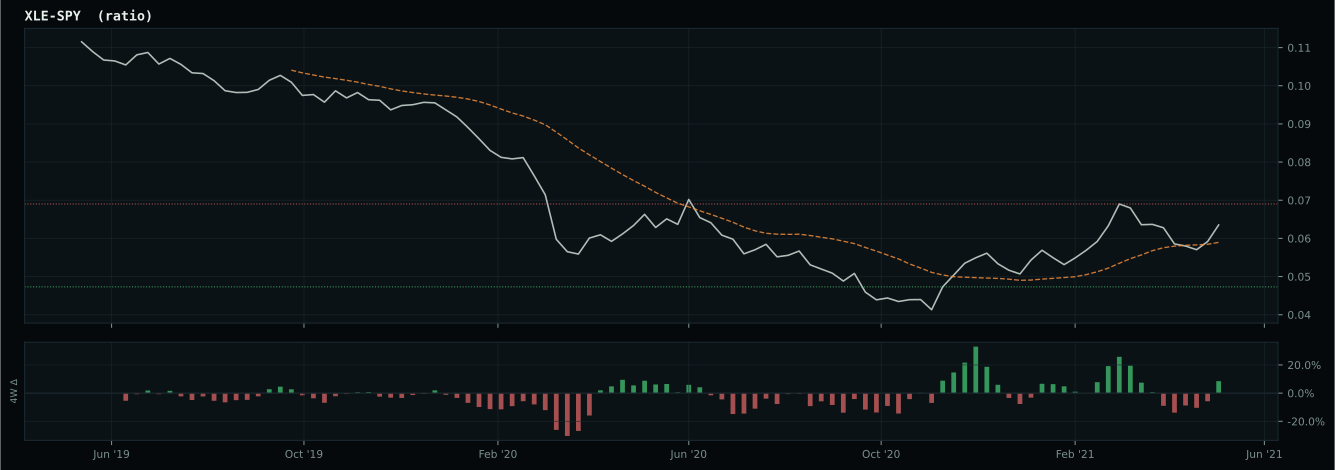
Macro Regime — Transition / Mixed
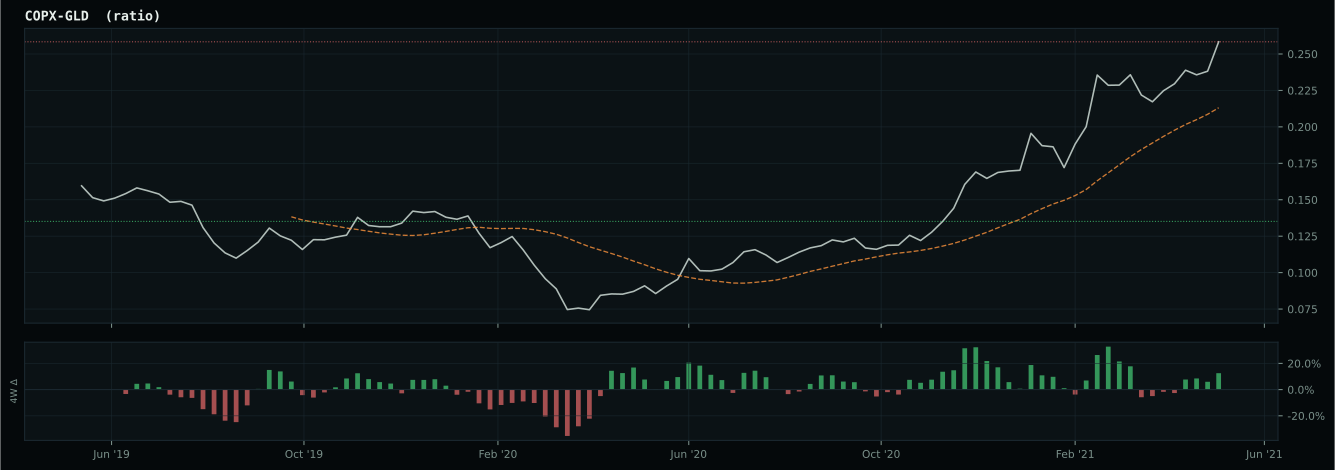
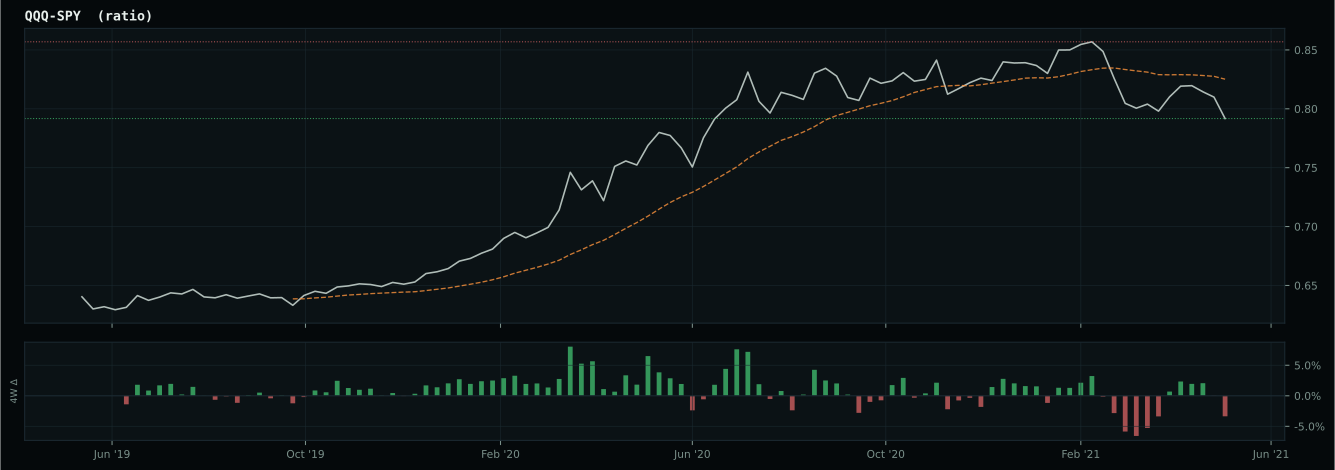
Macro Evidence Charts
Market-implied signals behind the macro regime scores. Each ratio compares two assets; the direction and slope of the ratio is what the macro engine reads.
Crypto Regime — AltSeason
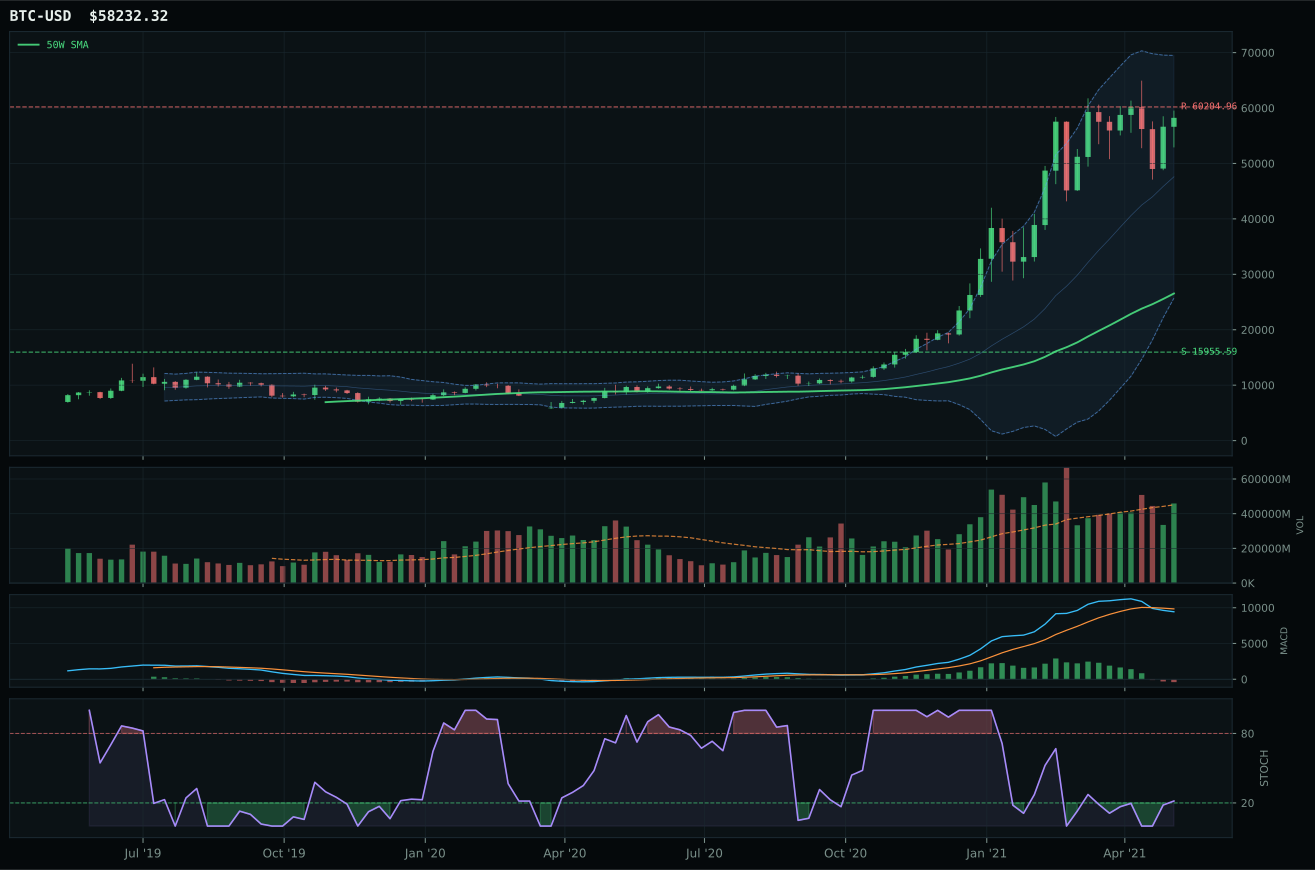
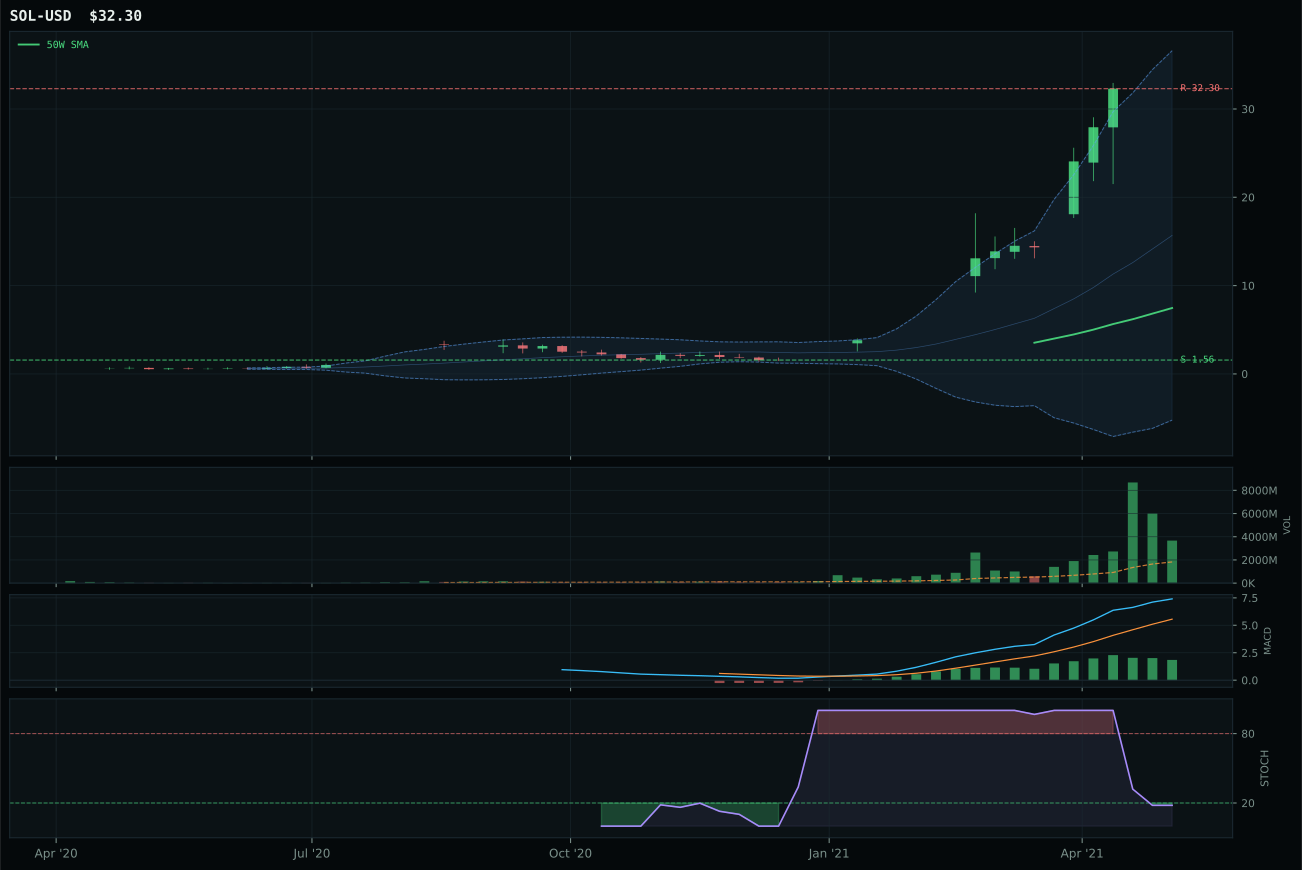
post-touch structure is too wide to count as a range; max/min close ratio is 11.16
TrendBTC confirmed: 2 consecutive closes above rising/flat 50W SMA
all available AltSeason conditions pass; missing optional confirmations skipped
Category Rankings
| Rank | Category | Winner | Score | Alloc | 4W Ret | Peers (4W) |
|---|---|---|---|---|---|---|
| 1 | Industrial Metals | COPX | 77.7 | 20% | -11.16% | PICK -7.1% · REMX +0.8% |
| 2 | Agriculture & Livestock | WEAT | 75.8 | 20% | -3.32% | MOO -1.1% · VEGI -2.8% |
| 3 | Nuclear Energy | URNM | 68.2 | 10% | +0.30% | URA +3.3% · NLR -0.5% |
| 4 | Traditional Energy | XLE | 64.0 | 10% | +2.65% | FCG +11.5% · XOP +10.7% |
| 5 | Utilities & Infrastructure | XLU | 59.3 | 10% | -1.10% | PAVE -2.4% · IGF -0.1% |
| 6 | Precious Metals | GDX | 58.9 | 10% | +1.50% | GLD +2.4% · SLV +0.0% |
| 7 | Emerging Markets | ILF | 42.7 | 10% | +6.45% | INDA +6.3% · IEMG +2.5% |
| 8 | Defense & Aerospace | ITA | 39.8 | 10% | +3.69% | ROKT +3.5% · XAR +4.0% |
| 9 | Technology | CIBR | 33.1 | 0% | +2.44% | XLK +1.1% · IGV +4.1% |
| 10 | AI | BOTZ | 25.9 | 0% | +1.99% | SMH +4.1% · AIQ +2.1% |
Industrial Metals — COPX
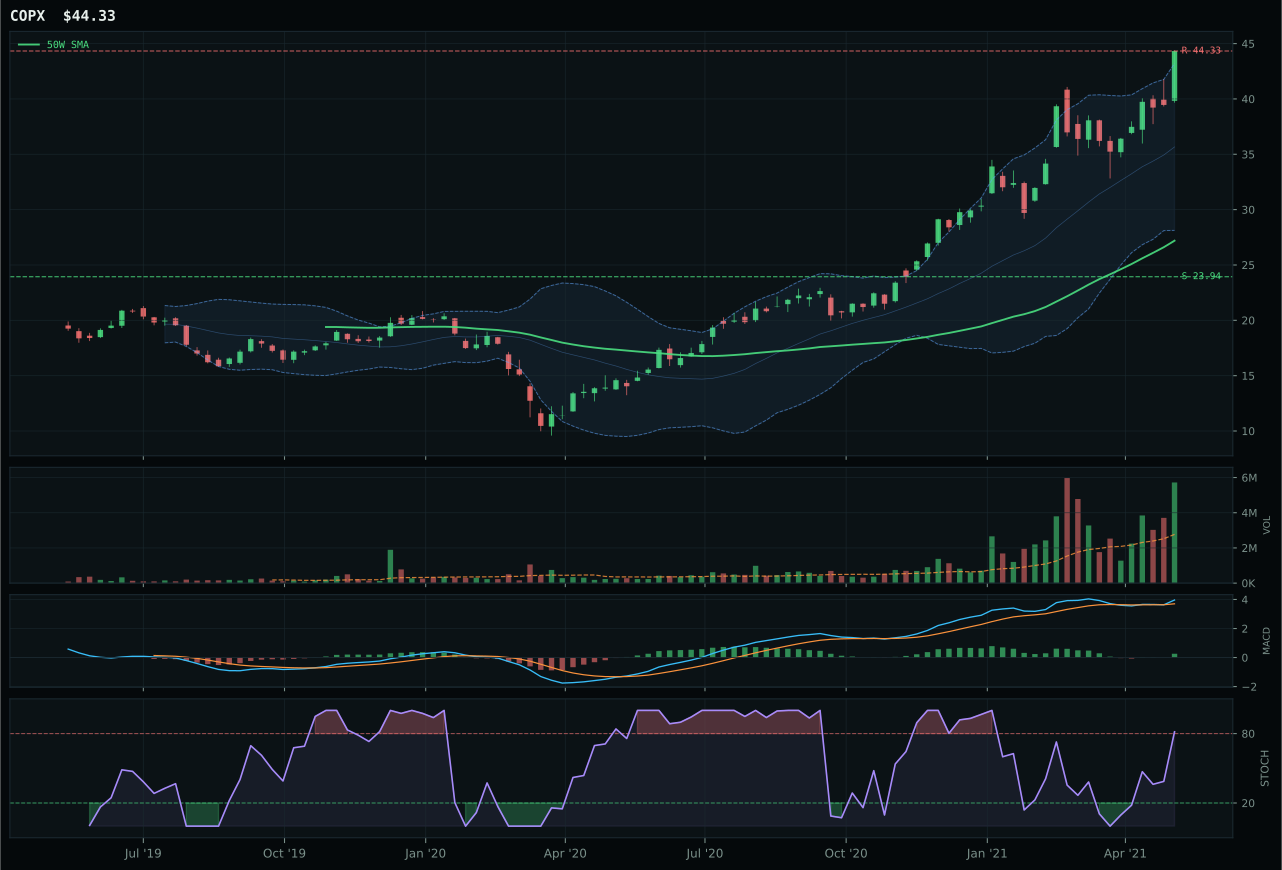
COPX has a vertical extension profile with 29.8% 13-week relative strength versus SPY.
A failed hold above support would weaken the setup.
Actionable but governed by invalidation levels.
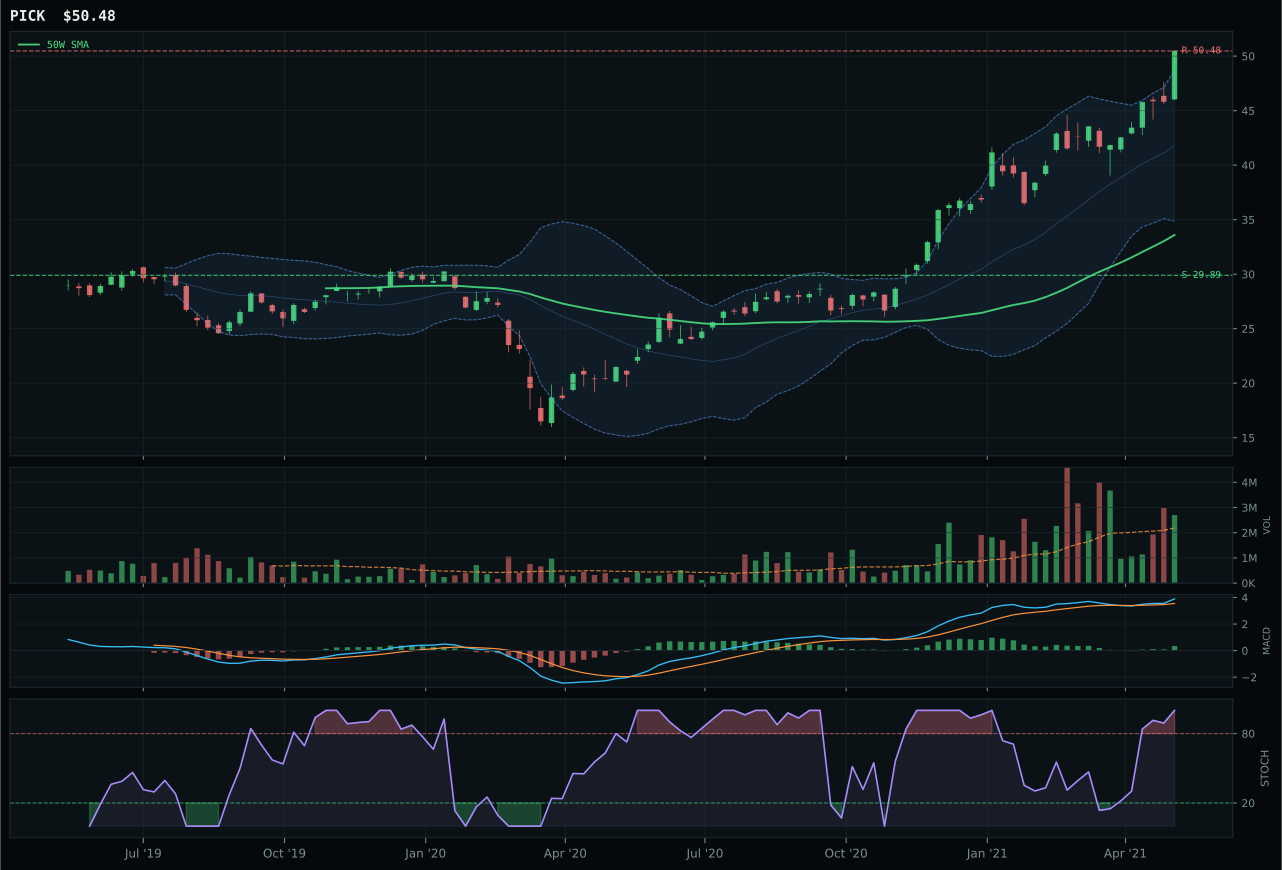
PICK has a vertical extension profile with 22.6% 13-week relative strength versus SPY.
A failed hold above support would weaken the setup.
Actionable but governed by invalidation levels.
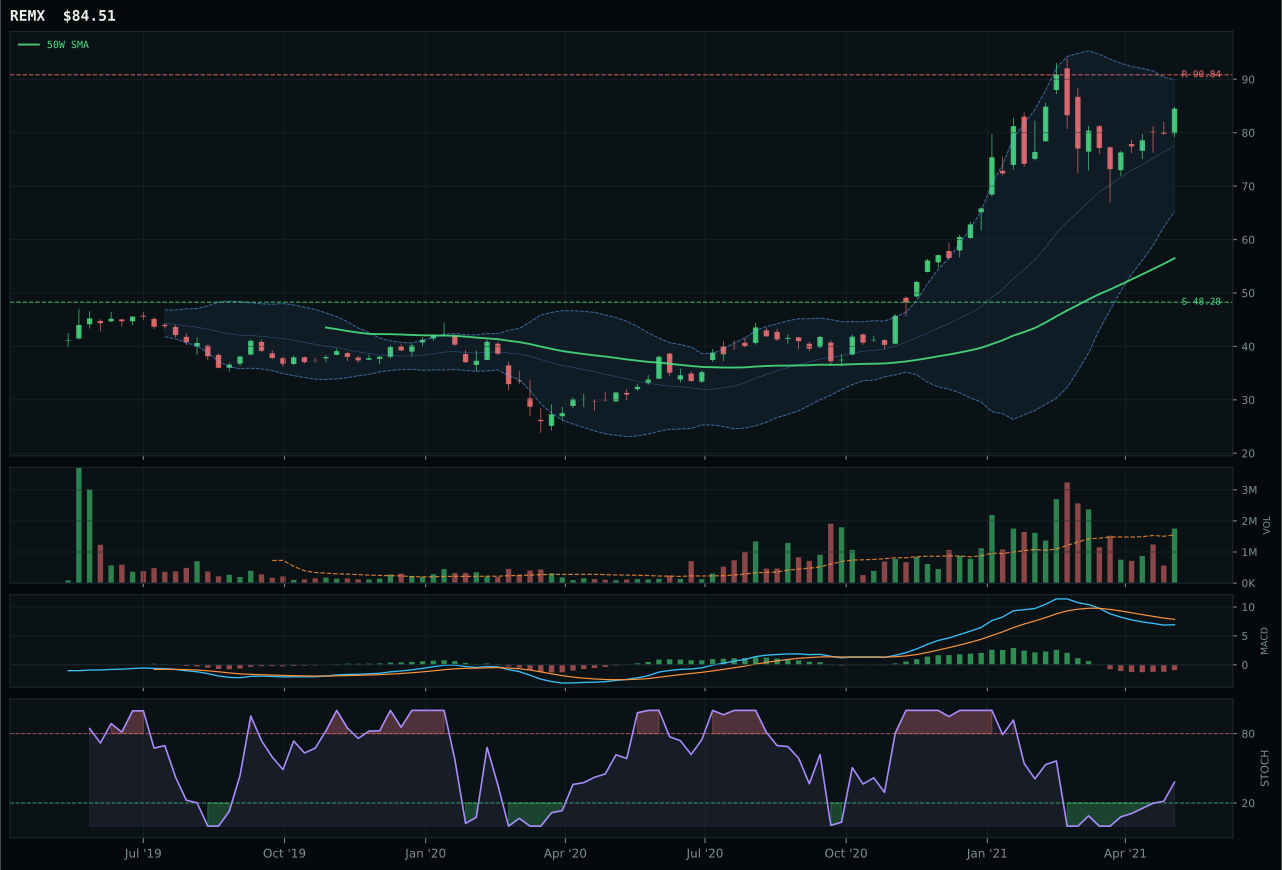
REMX has a vertical extension profile with 1.7% 13-week relative strength versus SPY.
A failed hold above support would weaken the setup.
Actionable but governed by invalidation levels.
COPX and PICK trade at a dead heat with technically identical 100.0 trend scores, but COPX edges ahead through superior volume sponsorship and category-relative momentum. The copper play shows 29.8% RS versus SPY—a commanding outperformance that signals industrial buyers are willing to pay up for scarcity—and 38.7% 13W return with perfect 100.0 momentum confirmation. Its 2.07x volume at accumulation/confirmation levels validates that the extended 63.0% move above the 50W is being actively accumulated, not abandoned. PICK's 22.6% SPY-relative strength and 31.5% 13W return both lag, and its volume drops to above-average participation rather than accumulation confirmation. Both face timing penalties from extension (37.0 for both), but COPX's vastly superior volume-price confirmation of 93.6 versus PICK's 77.0 reveals that institutional buyers are selecting COPX as the copper vehicle. The 0.0-point gap in the model is a toss-up; the allocator chose COPX's volume proof.
Industrial Metals earns a top-2 overweight at 10% allocation with a 77.7 category score that matches WEAT at the pinnacle of conviction. The macro fit of 73.0 is nearly as strong as agriculture's, driven by metals scarcity (+14), commodity breadth positive (+10), and real asset sponsorship (+6), offset only partially by credit stress (-7). In an AltSeason regime with a 50% crypto overlay, traditional commodities become the real-asset alternative to equities, and copper—tied directly to industrial production, infrastructure, and electrification—is the bellwether. COPX's 96.1 technical evidence score combined with 69.0 macro fit creates a rare alignment: the setup is extended and timing-constrained, but the volume and relative strength confirm institutional adoption. The allocation assumes commodity supercycle momentum persists through the summer; any evidence of industrial slowdown or Chinese demand deterioration would quickly force a downgrade to tier-2 or lower.
Agriculture & Livestock — WEAT
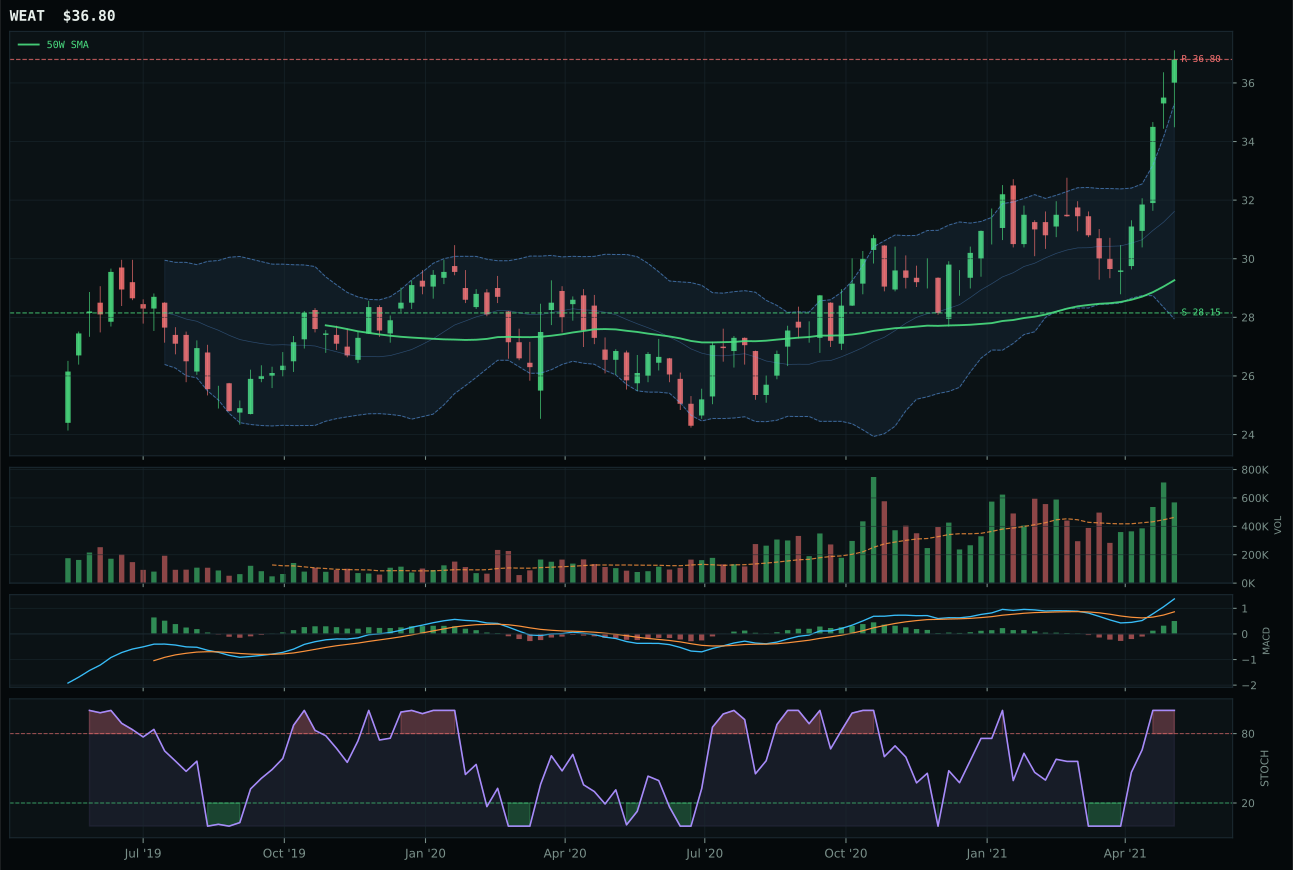
WEAT has a vertical extension profile with 9.8% 13-week relative strength versus SPY.
A failed hold above support would weaken the setup.
Actionable but governed by invalidation levels.
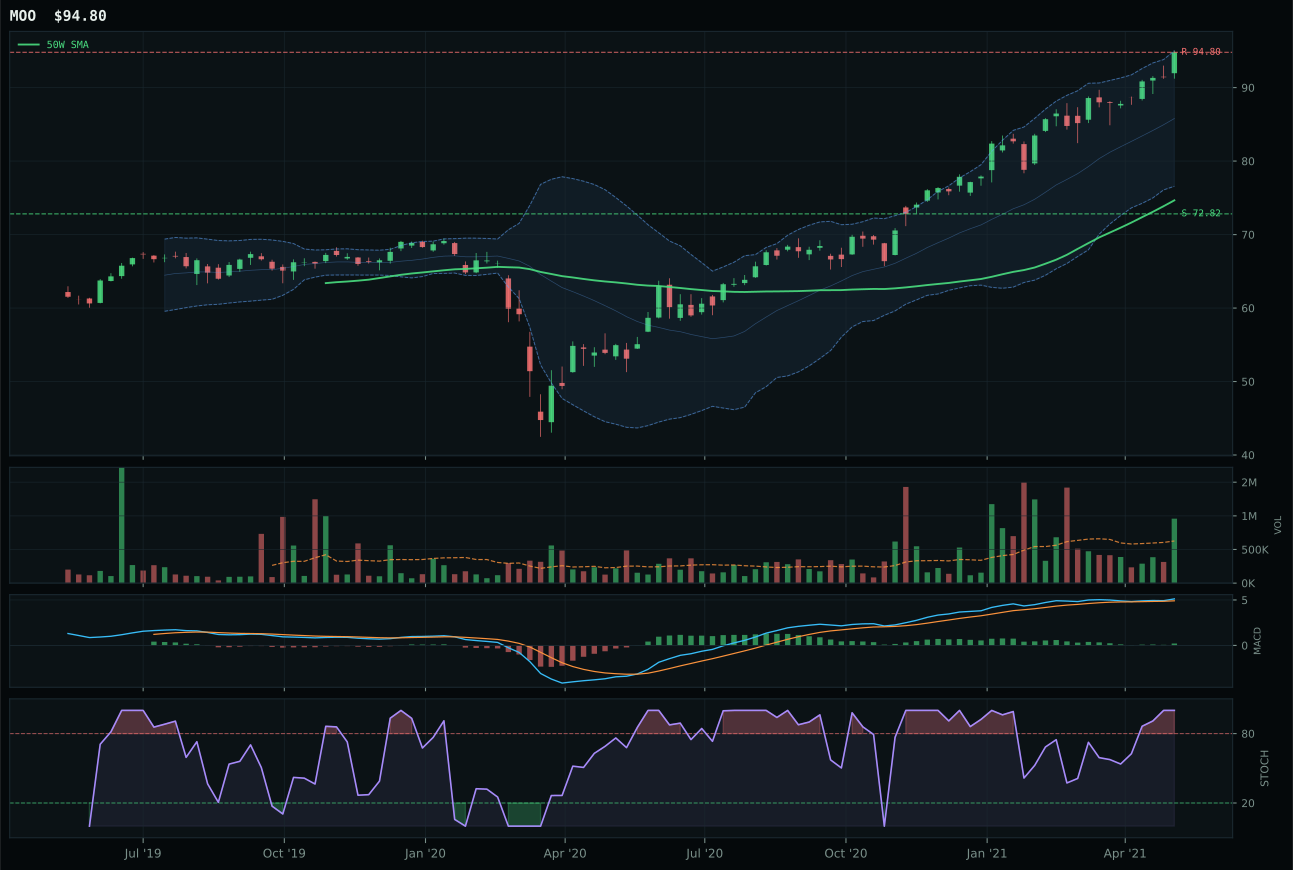
MOO has a vertical extension profile with 4.7% 13-week relative strength versus SPY.
A failed hold above support would weaken the setup.
Actionable but governed by invalidation levels.
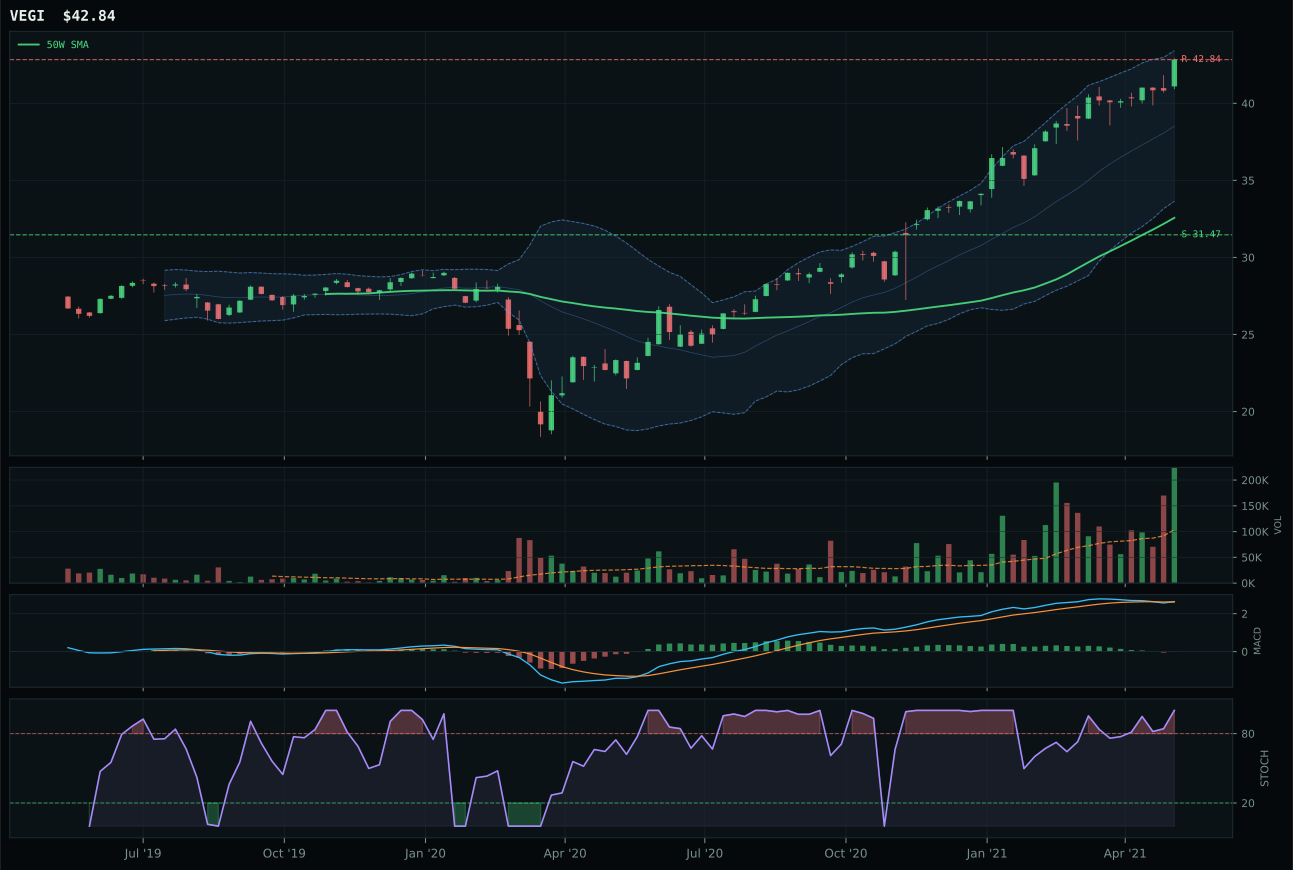
VEGI has a vertical extension profile with 6.6% 13-week relative strength versus SPY.
A failed hold above support would weaken the setup.
Tracked, but not top-2 eligible because: .
WEAT wins the agriculture category despite a -4.4 point technical deficit to MOO, powered by superior SPY-relative momentum that signals real market sponsorship. The wheat-focused ETF shows 9.8% RS versus SPY and 18.7% 13W return with perfect 100.0 momentum confirmation, whereas MOO's 4.7% SPY-relative strength and 13.6% 13W return read as participation in a broader commodity move without the alpha. Both trade extended at 25.7% and 30% above the 50W respectively, but WEAT's above-average 1.23x volume participation and bullish, improving MACD suggest accumulation rather than merely riding a wave. MOO's 82.4 technical evidence score actually exceeds WEAT's 75.8, yet the category-level reasoning elevated WEAT to the winner slot, reflecting macro descriptor weighting that penalizes breadth trades and rewards single-commodity conviction plays in supply shortage environments.
Agriculture & Livestock earns a top-2 overweight at 10% allocation, justified by a 75.8 category score that places it among the two highest-ranked categories in the portfolio. The macro fit of 86.0 is exceptional, driven by four active positive descriptors: supply shortage (+13), inflation pressure (+10), real asset sponsorship (+8), and commodity breadth positive (+5). This is the regime where commodity producers outperform equities and bonds alike—WEAT's extended chart is not a liability but evidence that the market is willing to chase the story higher. The 37.0 timing score penalizes entry risk, but the 100.0 momentum confirmation and above-average volume participation offset that concern. For this allocation to hold, supply-side disruptions or agricultural weather events must remain newsworthy; any reversal in inflation expectations or reversion to ample grain stocks would quickly erode the macro thesis.
Nuclear Energy — URNM
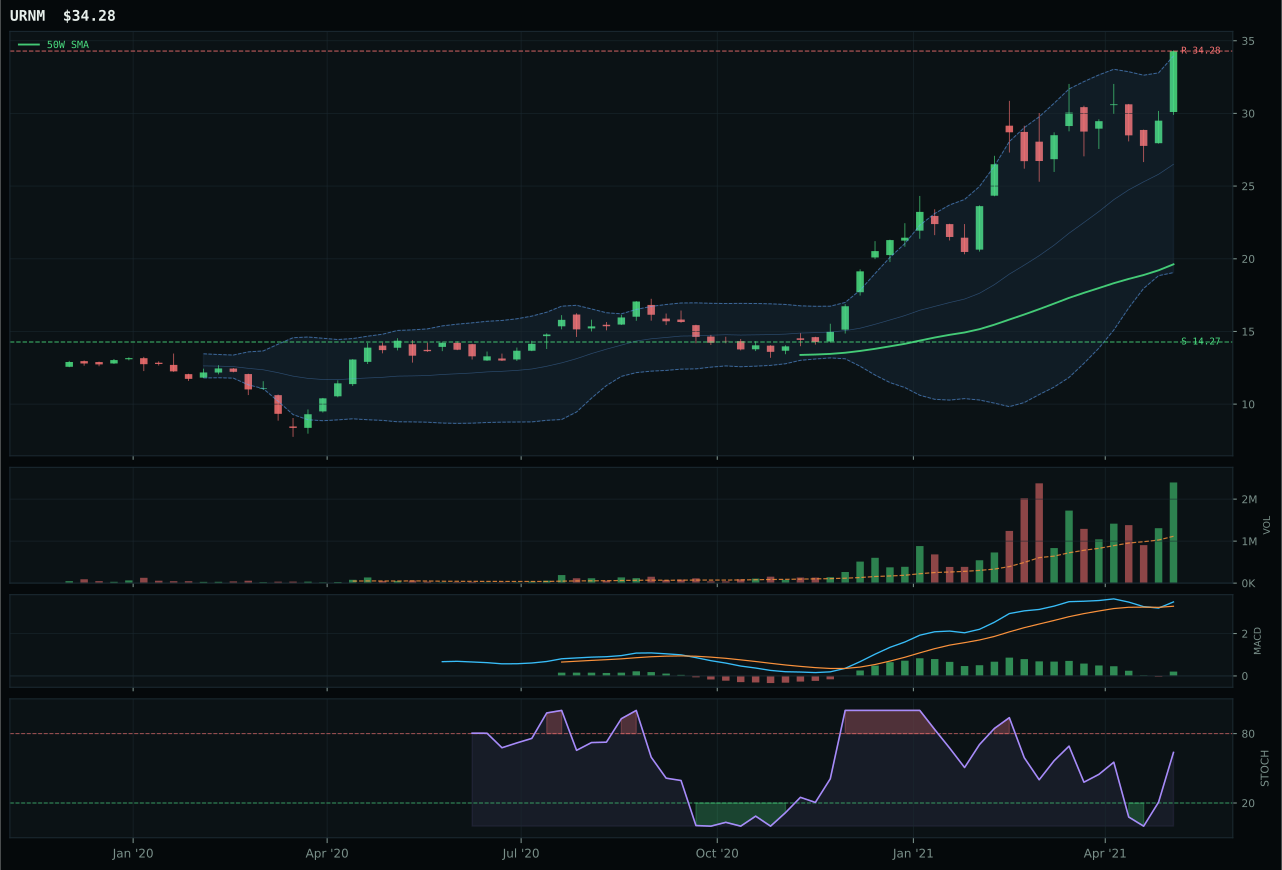
URNM has a vertical extension profile with 36.3% 13-week relative strength versus SPY.
A failed hold above support would weaken the setup.
Actionable but governed by invalidation levels.
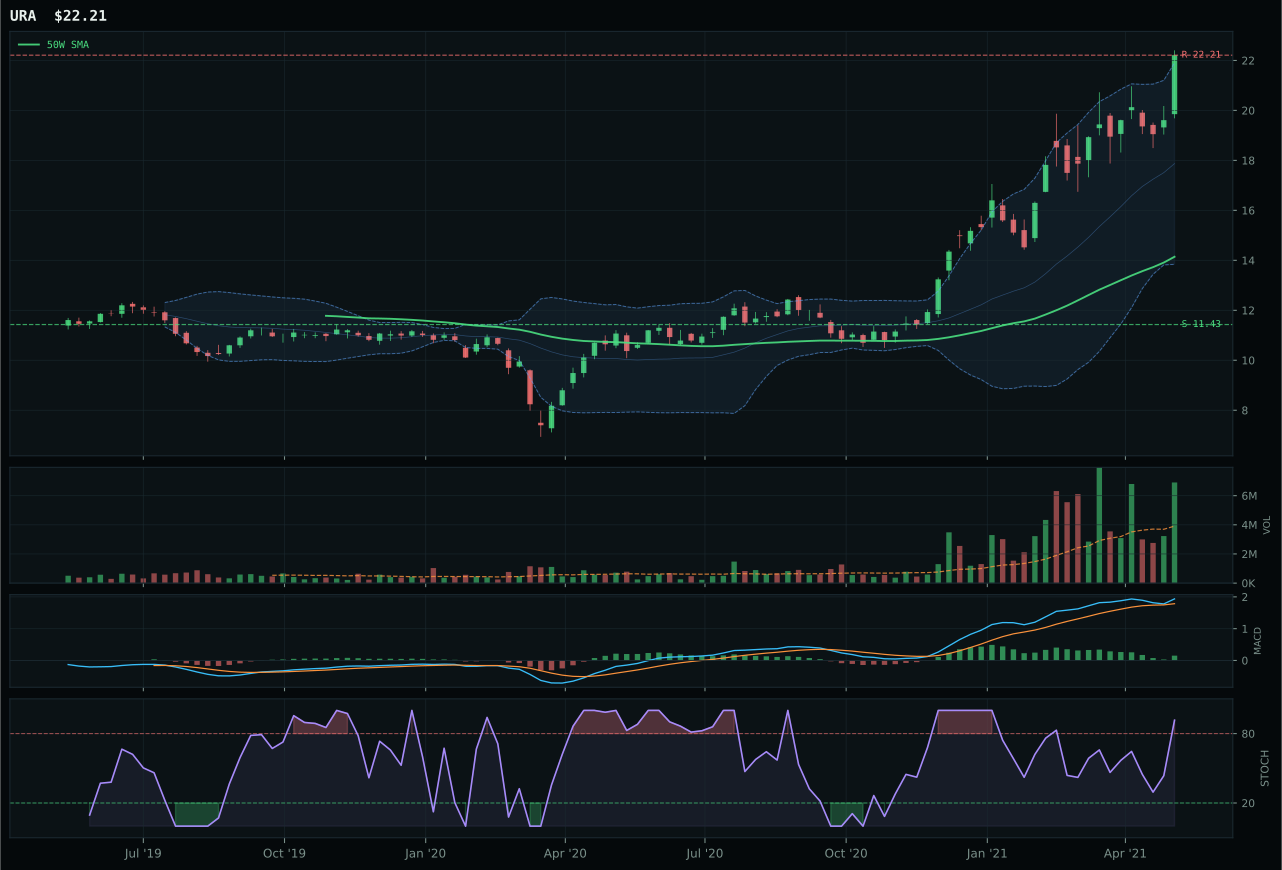
URA has a vertical extension profile with 27.4% 13-week relative strength versus SPY.
A failed hold above support would weaken the setup.
Actionable but governed by invalidation levels.
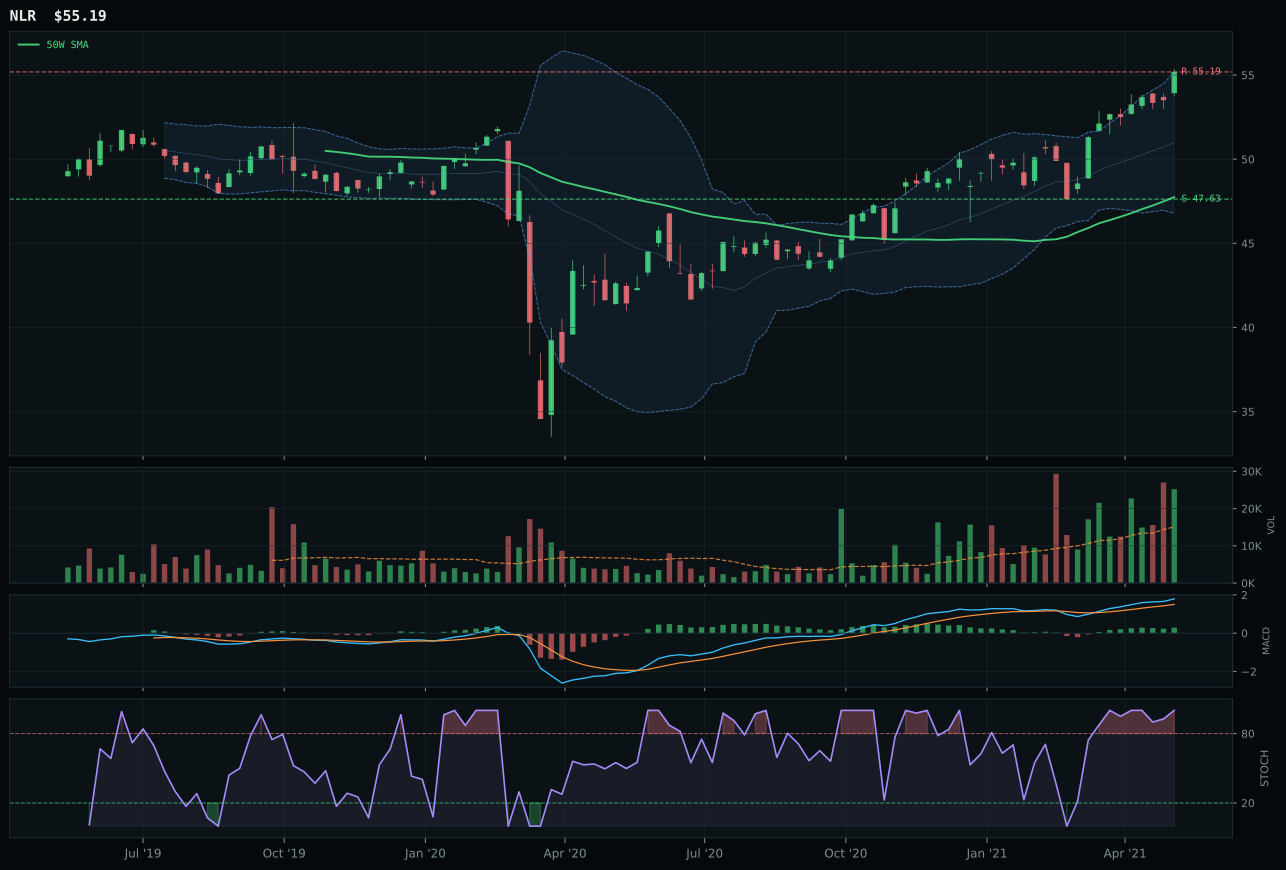
NLR has a vertical extension profile with 1.3% 13-week relative strength versus SPY.
A failed hold above support would weaken the setup.
Tracked, but not top-2 eligible because: .
URNM bests URA by 9.8 points through superior timing mechanics despite trailing on absolute 13W return and SPY-relative strength. The uranium-miner play trades 74.7% extended above the 50W with MACD bullish but flattening and stochastic RSI in the rising mid-zone at 0.64, whereas URA's overbought stochastic at 1.00 signals potential for a pullback. Both show perfect 100.0 momentum confirmation from 13W returns (URNM 45.2%, URA 36.3%), but URNM's 48.0 timing score reads as more technically sound than URA's 32.0 because the stochastic is not yet at extremes. URA's higher trend score of 100.0 (price above 50W but below 200W with stronger accumulation participation) is offset by URNM's cleaner 8.9% category-relative strength versus URA's 0.0% reading. The 87.9 volume-price confirmation and 100.0 persistence on URNM versus URA's equivalent metrics confirm that the uranium story is consolidating strength rather than reaching distribution peaks.
Nuclear Energy earns 5% allocation as a tier-2 position on the strength of a 68.2 category score and 64.0 macro fit that reflects active energy scarcity (+9), real asset sponsorship (+7), and inflation pressure (+3). URNM's 89.3 technical evidence score is exceptional—among the highest in the entire portfolio—and the 45.2% 13W return demonstrates the intensity of demand for uranium exposure. The 28.0 risk-reward score is the allocation's weakness: URNM trades near 52W highs with 140.2% downside to support, creating asymmetric risk that forces tier-2 placement despite technical strength. The portfolio treats nuclear as a tactical allocation to energy transition and decarbonization tailwinds rather than a core holding; any sharp pullback toward the 14.27 support level would be viewed as a reinvestment opportunity. For URNM to earn top-2 status, uranium spot prices must confirm above $30/lb or utilities must accelerate capital commitments to new reactor builds.
Traditional Energy — XLE
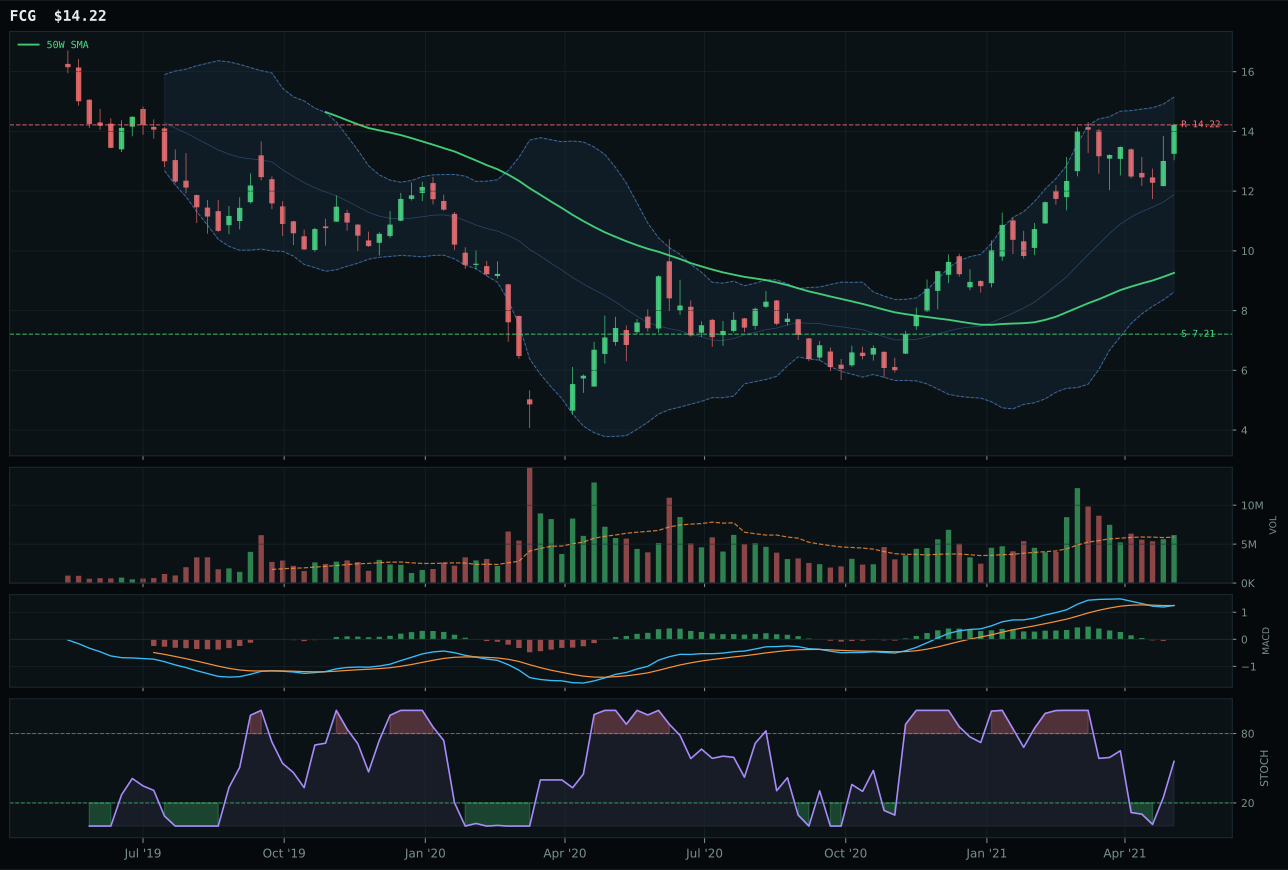
FCG has a vertical extension profile with 23.7% 13-week relative strength versus SPY.
A failed hold above support would weaken the setup.
Actionable but governed by invalidation levels.
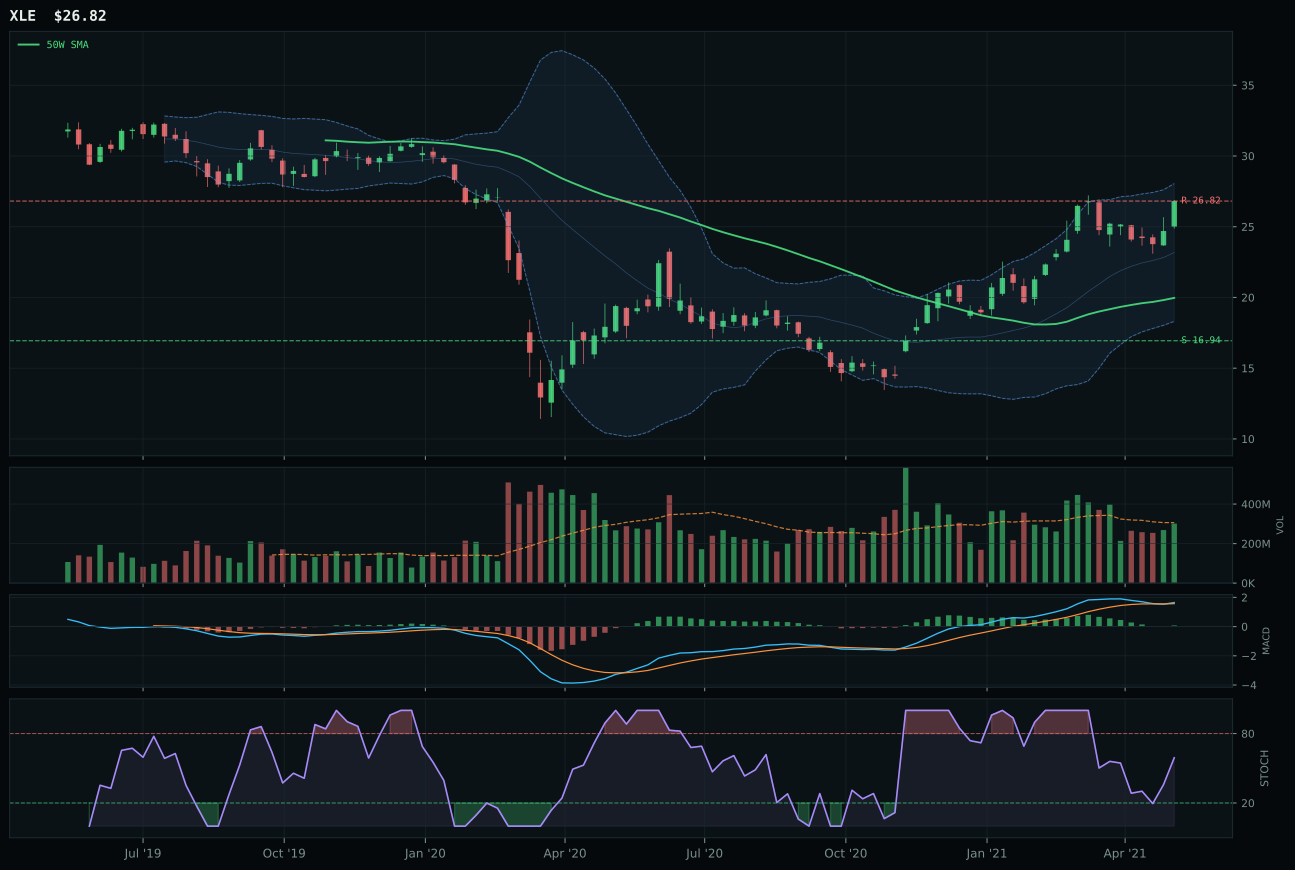
XLE has a vertical extension profile with 17.1% 13-week relative strength versus SPY.
A failed hold above support would weaken the setup.
Actionable but governed by invalidation levels.
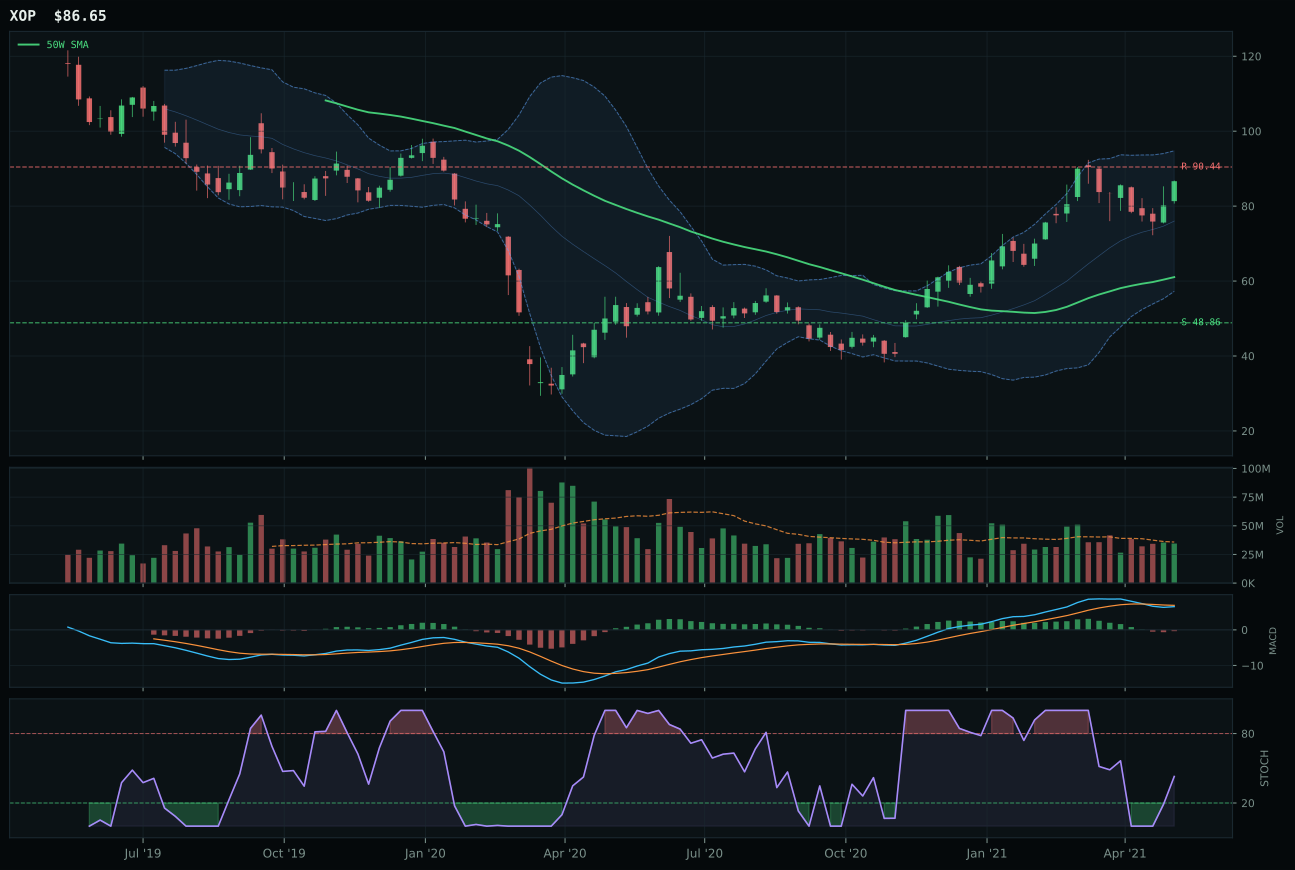
XOP has a vertical extension profile with 14.9% 13-week relative strength versus SPY.
A failed hold above support would weaken the setup.
Actionable but governed by invalidation levels.
XLE edges FCG by 7.3 points through superior technical discipline despite FCG's stronger momentum. The integrated-energy play trades 34.3% above the 50W with MACD bullish but flattening and stochastic RSI in the rising mid-zone at 0.59, a more measured approach than FCG's overbought setup at 0.88 with deteriorating MACD. XLE's trend score of 86.0 reflects price above the 50W but below the 200W, signaling an intermediate uptrend that has not yet confirmed a major cycle shift—a conservative read that protects against entry near cycle peaks. FCG's 72.0 trend score carries the same technical warning but with weaker MACD confirmation, making XLE's 39.5 risk-reward superior to FCG's 23.5. Both show massive 13W returns (XLE 26.0%, FCG 32.5%) and category-flat momentum (XLE 0.0% category-relative, FCG 6.5%), but XLE's neutral volume and structure quality edge out FCG's extended setup and deteriorating confirmation.
Traditional Energy earns 5% allocation as a tier-2 position despite a strong 64.0 category score and exceptional 85.0 macro fit. The energy scarcity descriptor is active at +16, real asset sponsorship at +7, and inflation pressure at +10, making this one of the macro-favored categories in the entire portfolio. The -7 credit stress penalty is far lighter than in growth names, reflecting energy's status as a durable cash-flow business. XLE's 86.0 trend score demonstrates conviction, and the 100.0 momentum confirmation validates the 26.0% 13W move. Yet the allocation sits at 5% rather than 10% because the timing score of 48.0 signals extension: the entry is not ideal, and the 39.5 risk-reward offers limited upside to 26.82 with substantial downside to 16.94. The portfolio holds this as macro exposure to energy scarcity, but conviction remains contingent on oil prices holding above key support; any break below $65/barrel would force a re-evaluation.
Utilities & Infrastructure — XLU
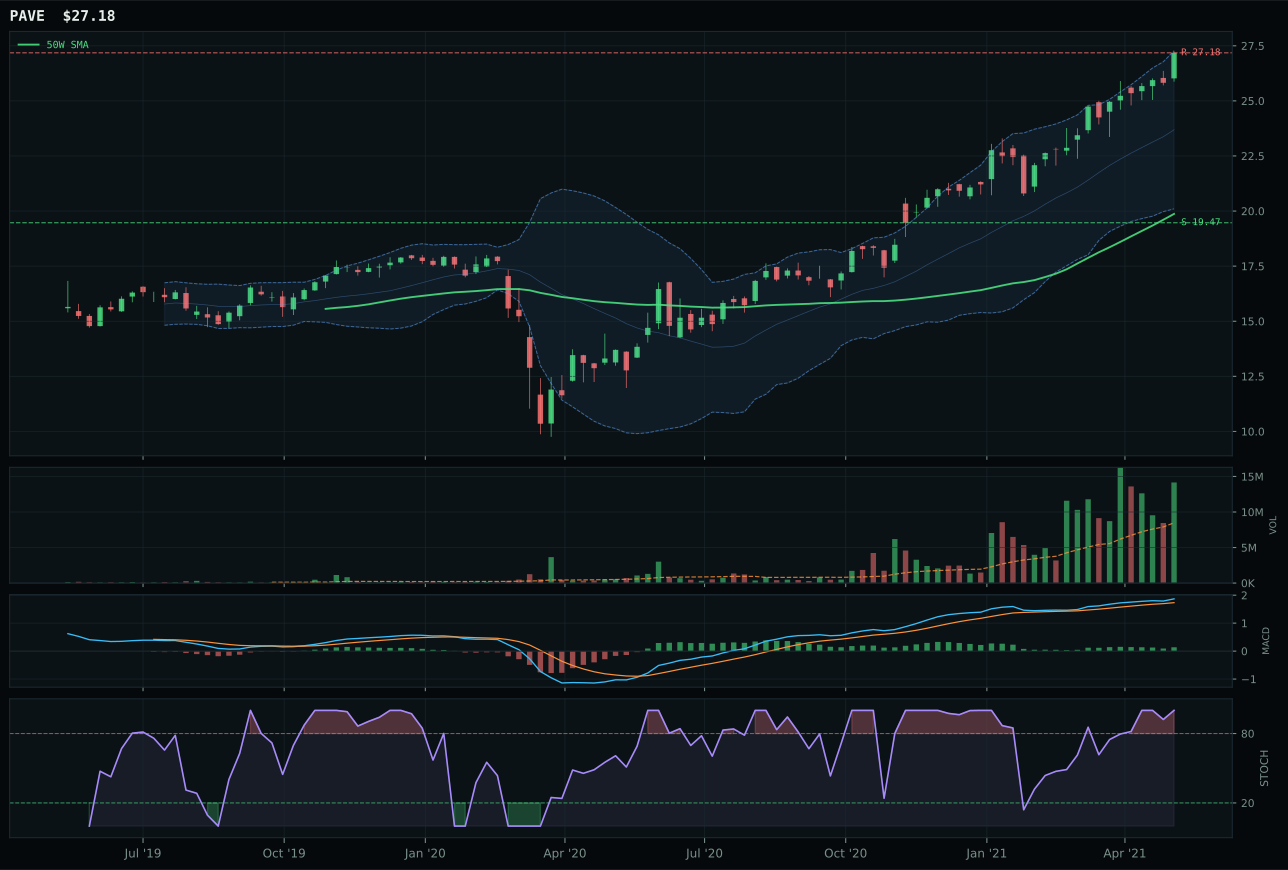
PAVE has a vertical extension profile with 14.2% 13-week relative strength versus SPY.
A failed hold above support would weaken the setup.
Actionable but governed by invalidation levels.
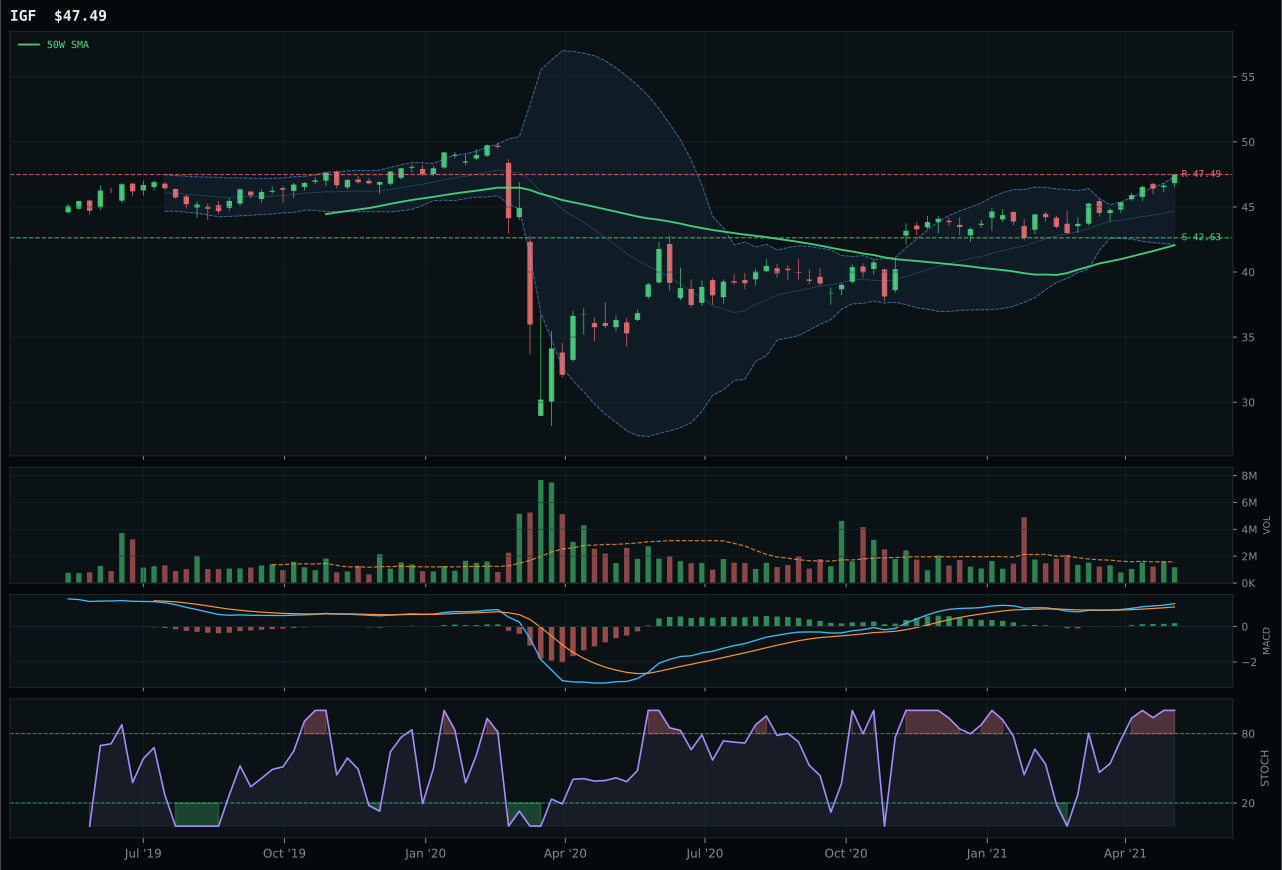
IGF has a neutral structure profile with -2.0% 13-week relative strength versus SPY.
A failed hold above support would weaken the setup.
Actionable but governed by invalidation levels.
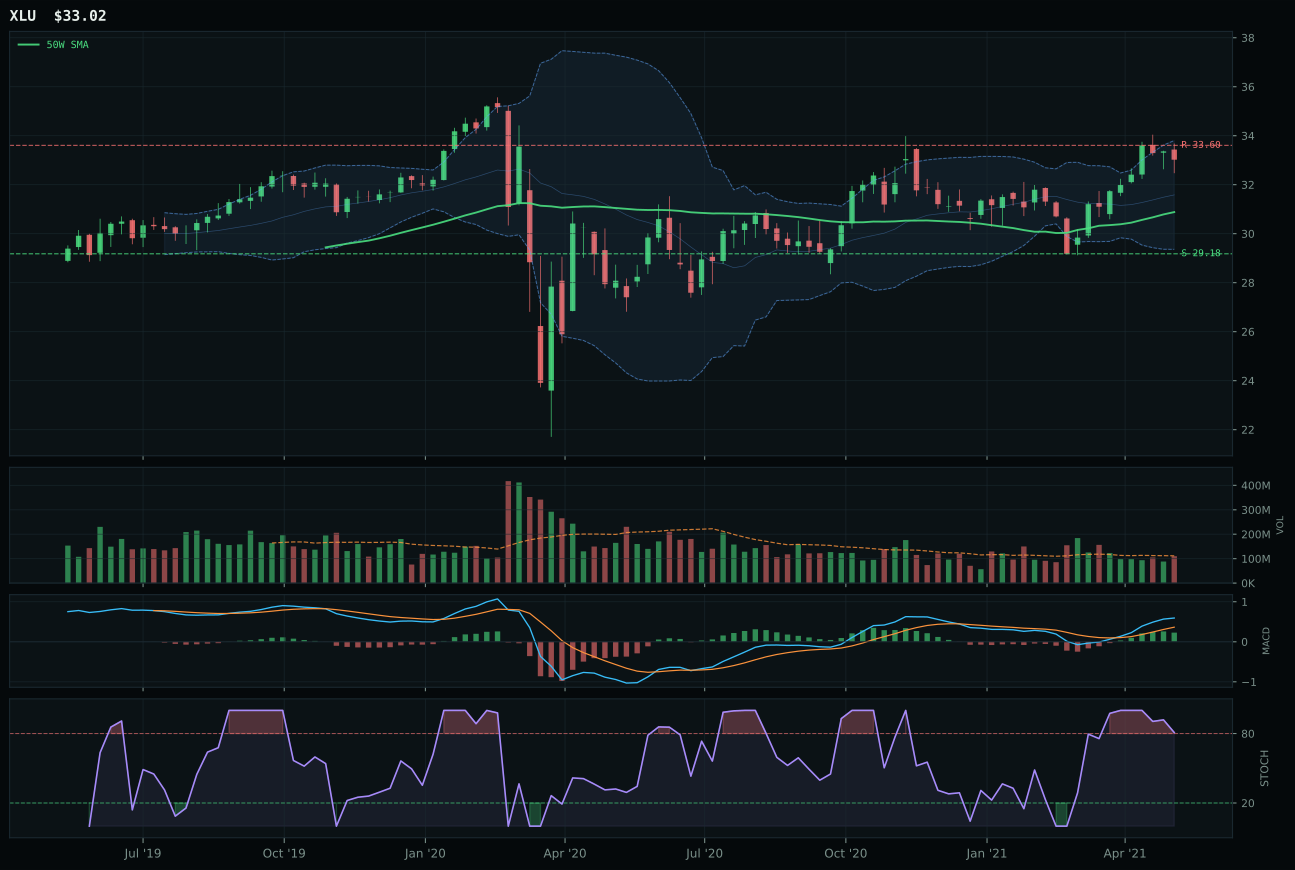
XLU has a neutral structure profile with -5.0% 13-week relative strength versus SPY.
A failed hold above support would weaken the setup.
Actionable but governed by invalidation levels.
XLU edges PAVE by 3.5 points through defensive positioning and timing discipline that sidestep the entry risks PAVE courts. The regulated-utility ETF trades just 6.9% above the 50W with MACD bullish and improving and stochastic RSI overbought but rolling over at 0.81, signaling a mature move that is losing momentum without confirming a breakdown. PAVE, by contrast, trades 36.8% extended with timing score of only 32 versus XLU's 57, and its MACD bullish but flattening reads as topping action. XLU's trend score of 92.5 from price above both moving averages with a gentle 0.3% slope reflects stability over excitement, whereas PAVE's 100.0 trend masks the extension risk. Both carry negative category-relative strength (XLU -3.0%, PAVE +16.2%), yet XLU's proximity to the 50W and improving MACD profile make it the technically prudent choice. PAVE's 89.8 technical evidence score is higher in absolute terms, but XLU's risk-reward of 47.4 versus PAVE's 45.6 proves defensive is the better entry here.
Utilities & Infrastructure earns 5% allocation as a tier-2 position on a 59.3 category score that reflects a macro fit of 48.0 weighted by Transition/Mixed regime support (+4) offset by inflation pressure (-6). The category serves a defensive role in the portfolio's mixed regime backdrop; XLU's 92.5 trend and 3.9% 13W return offer stability without the extended risk that PAVE courts. The allocation is contingent on inflation concerns remaining contained enough to allow utility multiple expansion; any acceleration in inflation or sharp rise in 10-year rates would force a reduction or exit. XLU's neutral volume participation and modest momentum confirmation of 47.8 reflect a steady accumulation rather than enthusiasm, appropriate for a macro-weighted defensive sleeve. The category would graduate to tier-1 only if recession fears spike or if evidence emerges that rate-hike cycles are near their terminus, conditions that would boost utility duration and valuation multiples.
Precious Metals — GDX
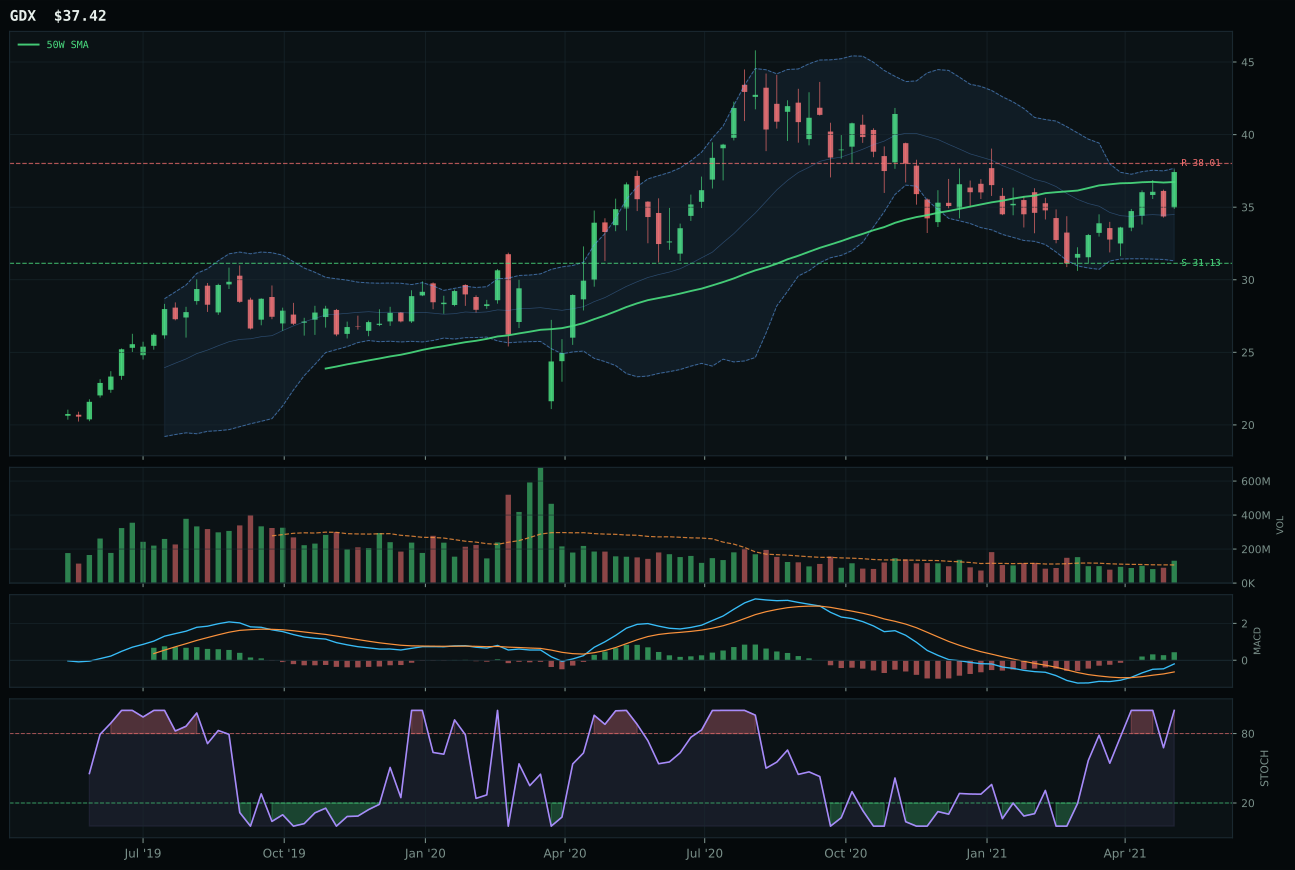
GDX has a compression near 50W profile with -0.8% 13-week relative strength versus SPY.
A failed hold above support would weaken the setup.
Actionable but governed by invalidation levels.
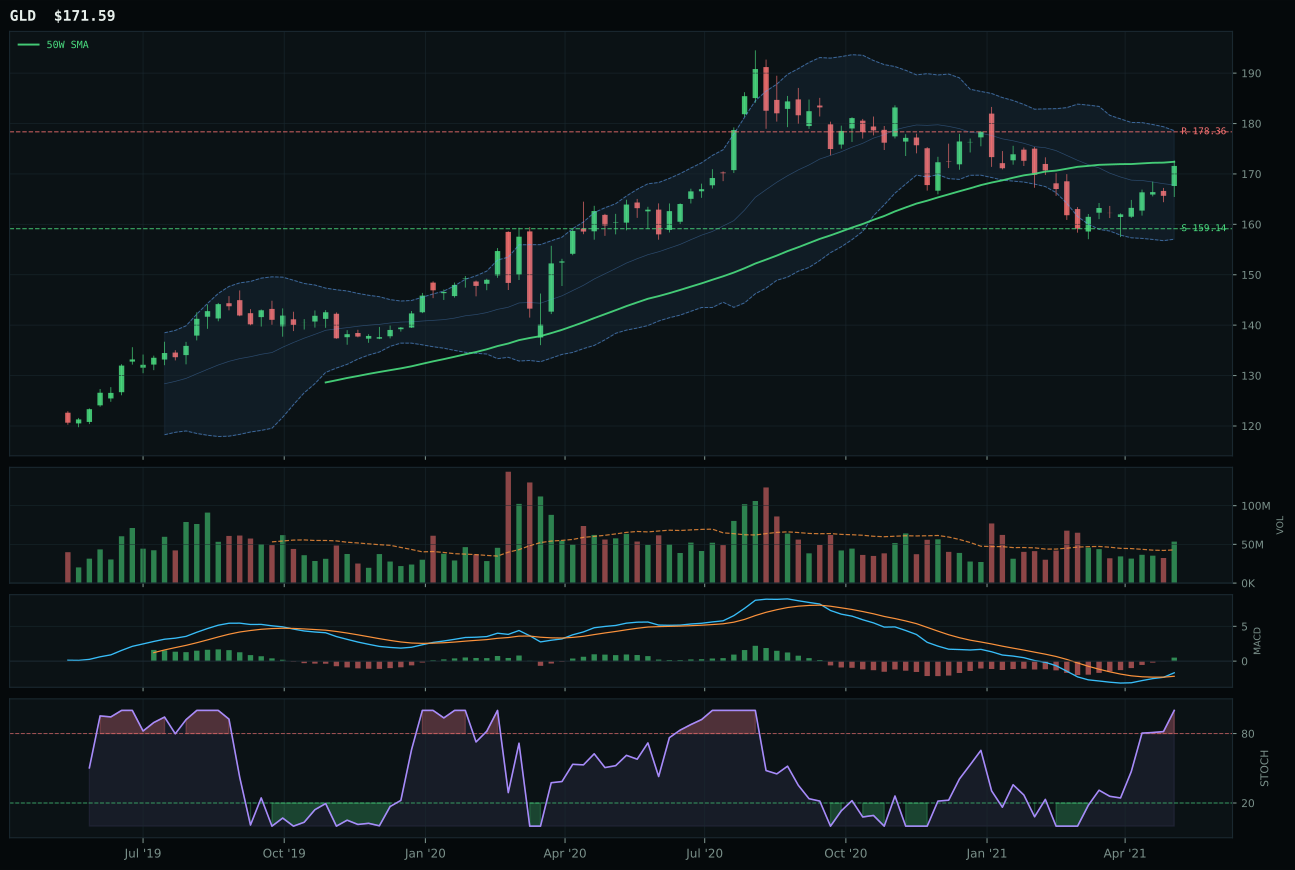
GLD has a compression near 50W profile with -7.8% 13-week relative strength versus SPY.
A failed hold above support would weaken the setup.
Actionable but governed by invalidation levels.
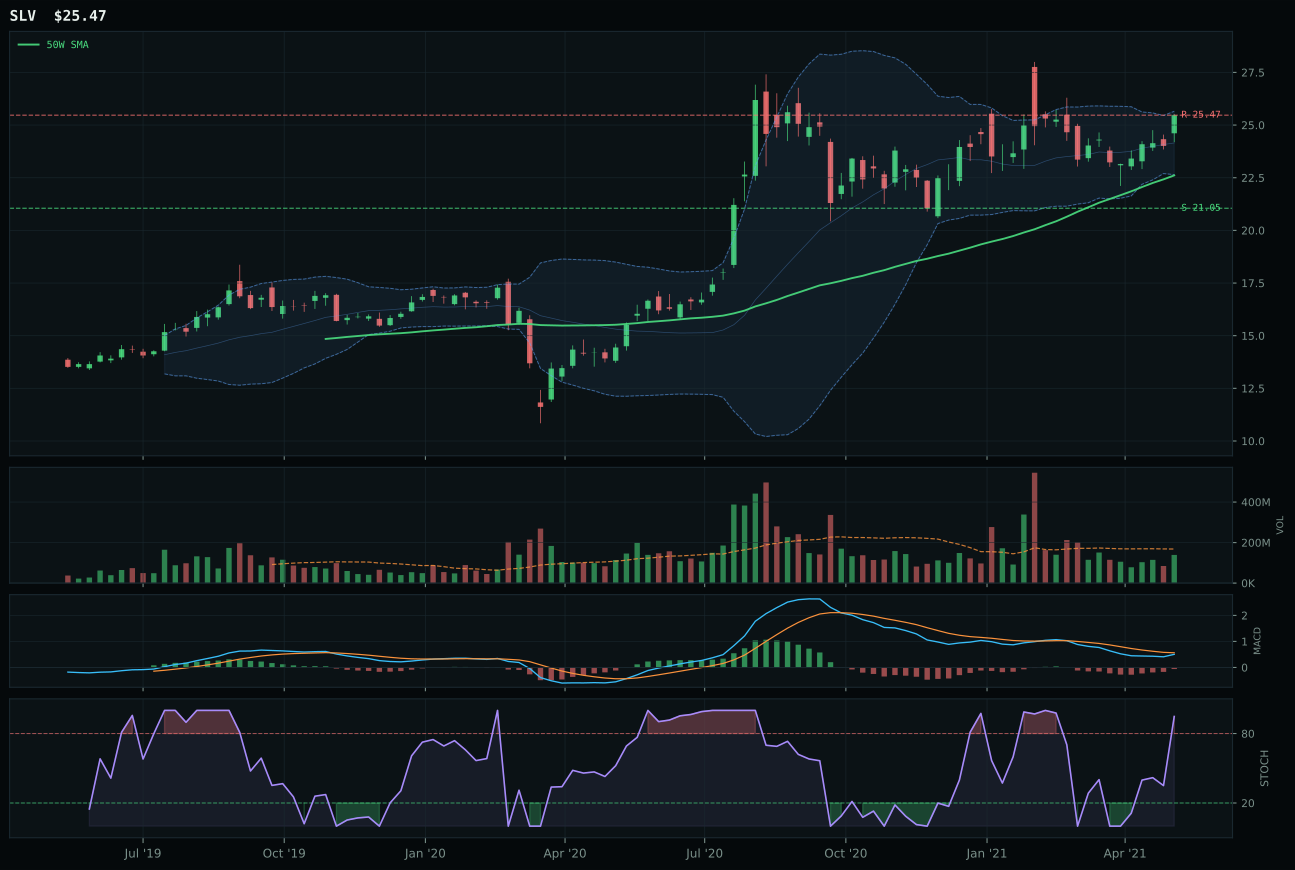
SLV has a neutral structure profile with -6.8% 13-week relative strength versus SPY.
A failed hold above support would weaken the setup.
Actionable but governed by invalidation levels.
GDX crushes GLD with a 22.5-point margin, translating a compression setup into far superior technical proof. The gold-miner ETF trades just 1.9% above the 50W with MACD bullish and improving and stochastic RSI overbought at 1.00, creating a coiled spring where every new buyer is close enough to the entry point that accumulation looks genuine. GLD, trading the same compression pattern but showing 13W return of only 1.0% versus GDX's 8.1%, reveals the performance gap: GDX's 6.0% category-relative strength towers over GLD's -1.0% deficit, and its 95.0 momentum confirmation dominates GLD's 61.0. GLD's -7.8% SPY-relative strength versus GDX's -0.8% is the clearest tells—GDX participates in the broad real-asset rally while GLD acts as pure monetary hedge. Both benefit from bullish MACD setups near the 50W level, but GDX's tighter proximity to the entry and superior relative momentum make it the technical winner by a wide margin.
Precious Metals earns 5% allocation as a tier-2 position with a 58.9 category score that trails both overweighted commodities but ranks ahead of growth categories. The macro fit of 50.0 is neutral—no single descriptor strongly favors or penalizes the exposure—meaning the allocation reflects pure technical evidence at 95.6 for GDX itself. GDX's perfect 100.0 timing score on the compression setup and 98.9 trend (price above both moving averages with near-zero slope) provide conviction, and the 54.4 risk-reward offers downside protection to 31.13 with limited upside to 38.01. The portfolio holds this position as tactical exposure to monetary uncertainty without directional conviction; the allocation sits below commodities-proper because inflation expectations have not yet shifted decisively enough to make precious metals a macro staple. GDX would graduate to tier-1 only if credit stress escalates or real rates turn sharply negative.
Emerging Markets — ILF
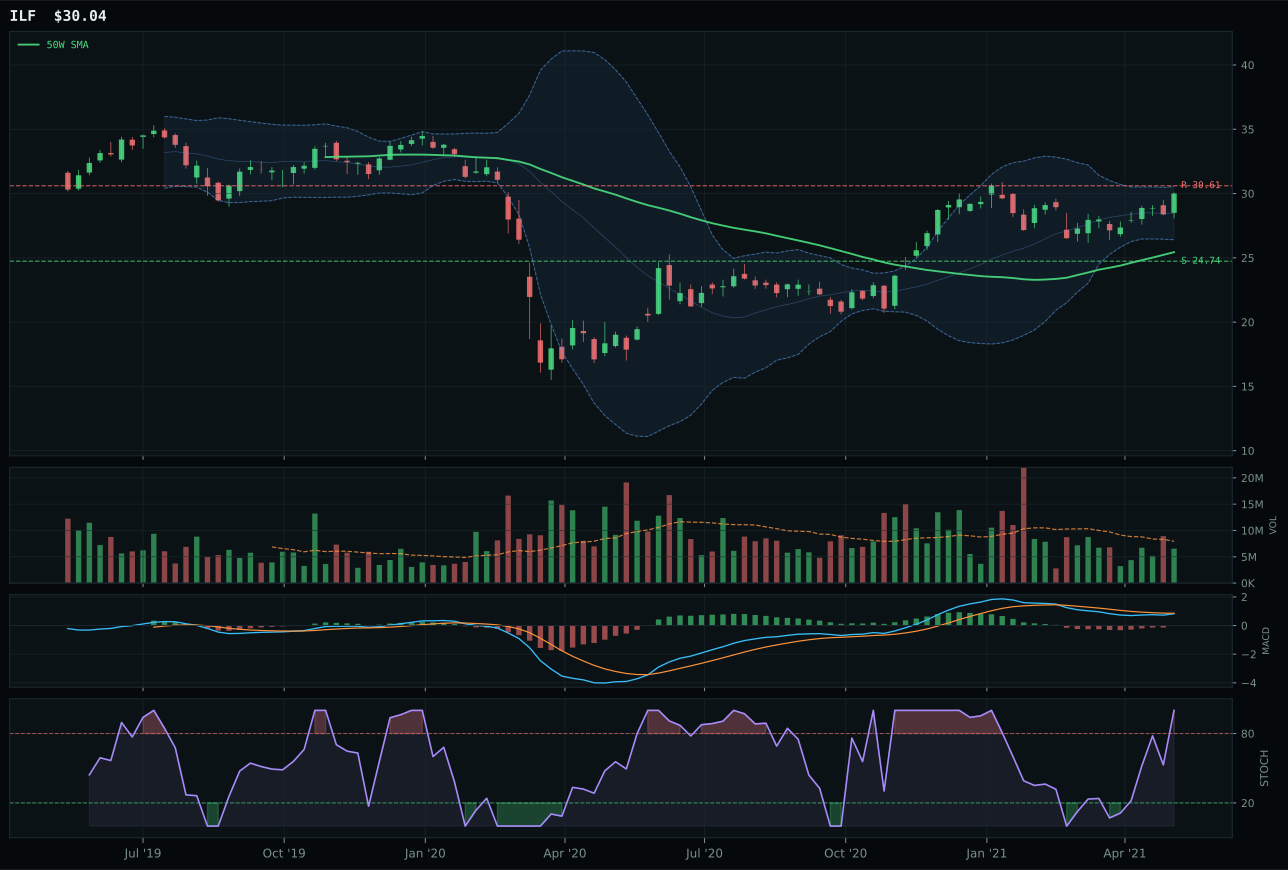
ILF has a vertical extension profile with -4.8% 13-week relative strength versus SPY.
A failed hold above support would weaken the setup.
Actionable but governed by invalidation levels.
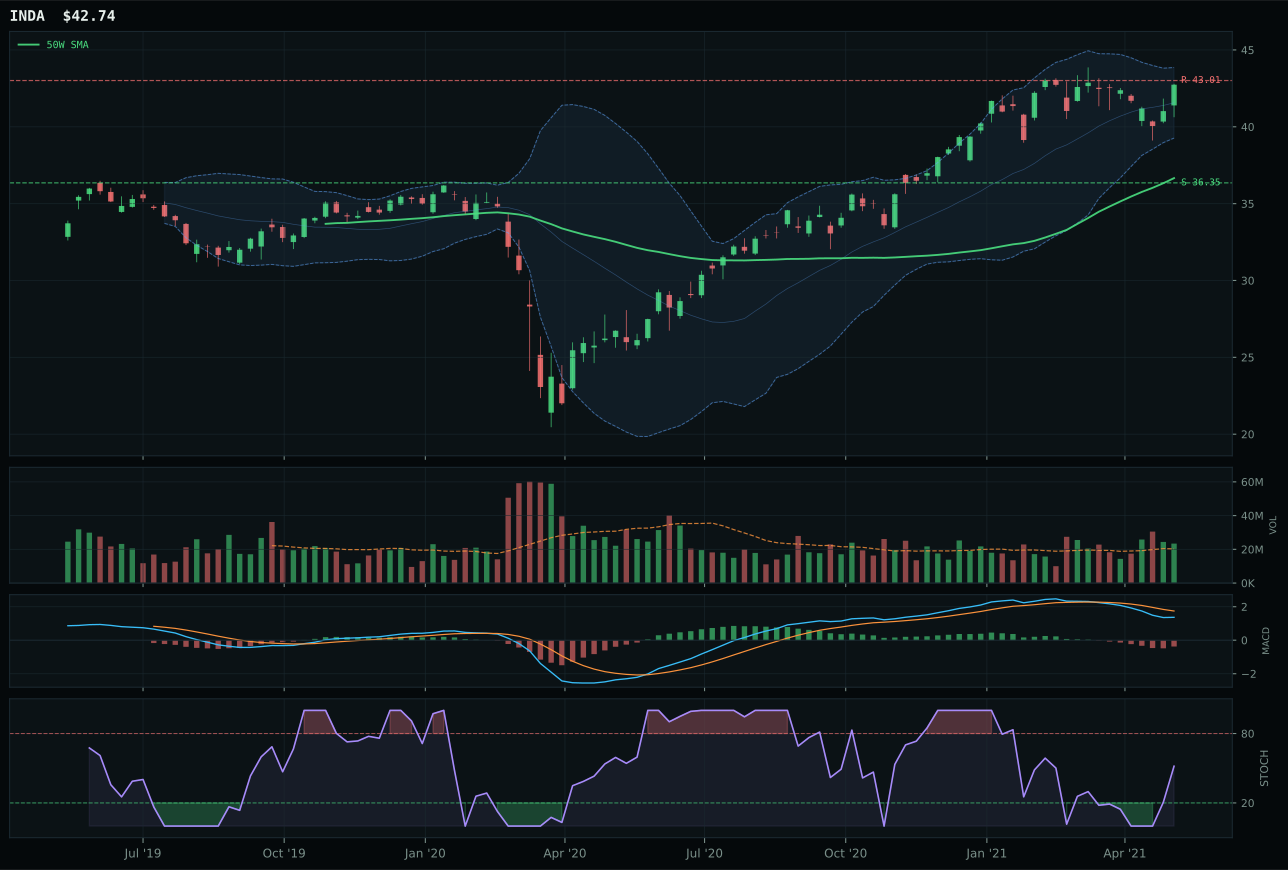
INDA has a vertical extension profile with -7.6% 13-week relative strength versus SPY.
A failed hold above support would weaken the setup.
Actionable but governed by invalidation levels.
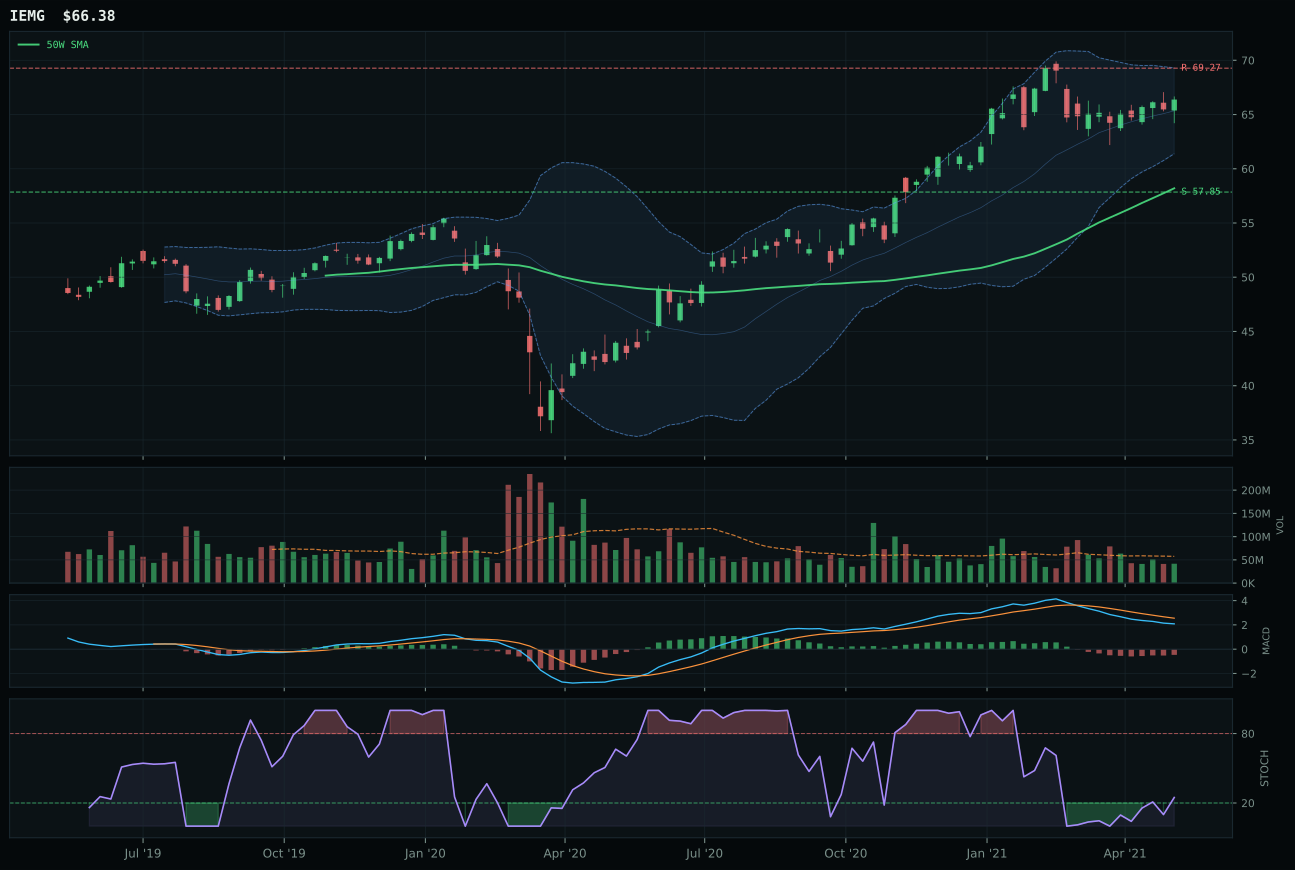
IEMG has a neutral structure profile with -10.4% 13-week relative strength versus SPY.
A failed hold above support would weaken the setup.
Actionable but governed by invalidation levels.
ILF narrowly wins the emerging-markets category with a 2.6-point edge over INDA, driven by superior structure cleanliness and category-relative strength despite modest absolute momentum. The Latin America play trades 18.1% above the 50W with MACD bearish but improving and structure score of 75.8 versus INDA's 71.9, signaling less chaotic price action. ILF's 2.8% category-relative strength and 65.5 momentum confirmation outpace INDA's 0.0% and 33.0 respectively, suggesting that within the weak emerging-markets basket, ILF is being selected over India exposure. Both trade in vertical extension near 52W highs with timing scores of 37, but ILF's neutral volume participation and better Fib zone placement near upper retracement create a crisper technical picture. INDA's -7.6% SPY-relative weakness and deteriorating MACD compound the category-relative deficit, making ILF the clear category expression despite neither showing strength on an absolute basis.
Emerging Markets earns 5% allocation as a tier-2 position with a modest 42.7 category score that reflects a 54.0 macro fit weighted by em liquidity support (+14) offset by credit stress (-10). ILF's Latin America tilt provides commodity and metals scarcity exposure that double-counts the portfolio's real-asset thesis, and commodity breadth positive (+8) and metals scarcity (+5) add secondary macro support. The allocation sits at tier-2 rather than tier-1 because emerging-markets technicals are weak across the board—even the category winner ILF shows -4.8% SPY-relative weakness and only 4.1% 13W absolute return. The portfolio holds this position for diversification and as a hedge to dollar strength in a Transition/Mixed regime, but conviction is minimal. ILF would need to break above 30.61 resistance with volume confirmation or show a sharp improvement in 4W momentum to warrant consideration for tier-1 status.
Defense & Aerospace — ITA
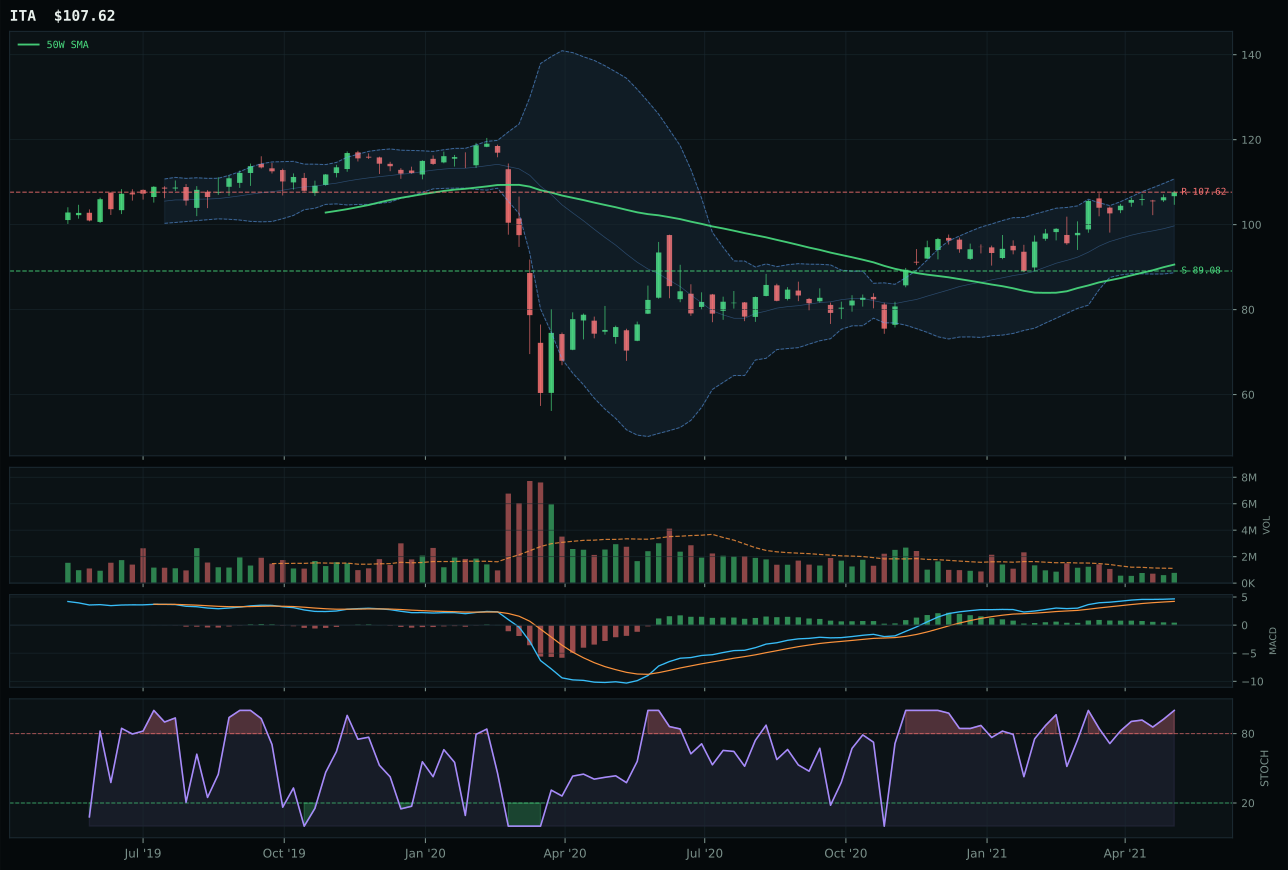
ITA has a vertical extension profile with 3.2% 13-week relative strength versus SPY.
A failed hold above support would weaken the setup.
Actionable but governed by invalidation levels.
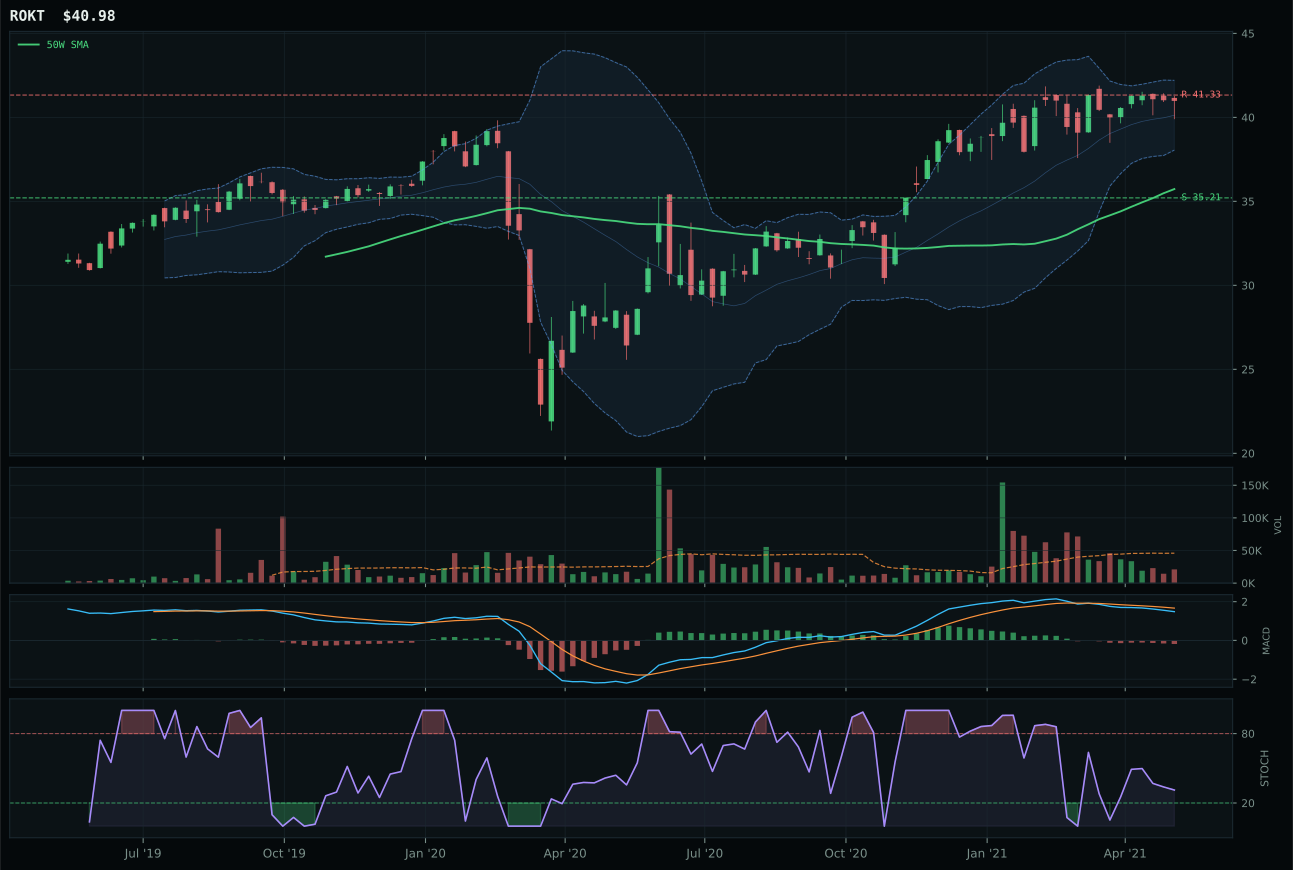
ROKT has a neutral structure profile with -7.9% 13-week relative strength versus SPY.
A failed hold above support would weaken the setup.
Tracked, but not top-2 eligible because: .
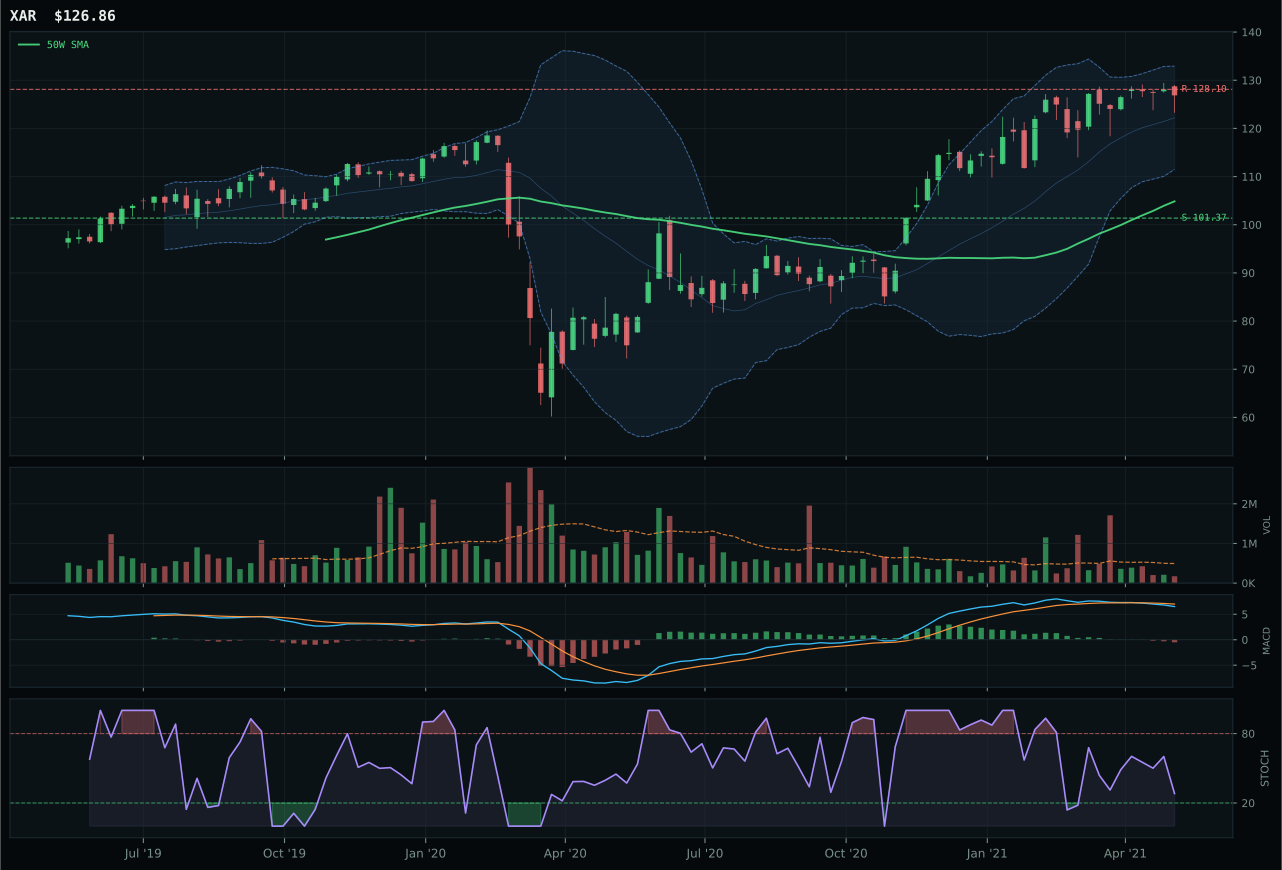
XAR has a vertical extension profile with -4.9% 13-week relative strength versus SPY.
A failed hold above support would weaken the setup.
Actionable but governed by invalidation levels.
ITA dominates the category with a 38-point gap over ROKT, driven by pure momentum confirmation and relative strength that validates the extended move despite entry risk. The defense-prime ETF shows a 12.1% 13W return, +3.2% RS versus SPY, and a perfect 8.1% category-relative advantage that signals genuine sponsorship beyond the broader market. Trend scores an ideal 100.0 from price above both the 50W and 200W with a 0.7% slope, and momentum confirmation registers 83.7 from both 4W and 13W outperformance. ROKT, by contrast, shows only 1.0% 13W return with -7.9% SPY-relative weakness, flattening MACD, and falling stochastic RSI, suggesting the chart is rolling over while ITA remains in confirmed uptrend. The 18.8% extension above the 50W penalizes timing to 32.0, but the conviction behind ITA's move is unmistakable.
Defense & Aerospace earns 5% allocation as a tier-2 position despite a 39.8 category score that ranks below the two overweighted leaders. The Transition/Mixed regime provides mild support (+3 from the macro state itself), and credit stress carries a neutral read here (+2) rather than the heavy penalty it inflicts on growth categories, making duration and stability assets relatively attractive. ITA's SPY-relative strength of 3.2% provides modest evidence of differentiation in a mixed environment, though the setup is extended and timing-constrained. The allocation reflects a defensive rotation play where durability matters more than growth, but conviction remains limited; the category would need a stronger macro backdrop or tighter entry point to graduate to tier-1 status.
Technology — CIBR
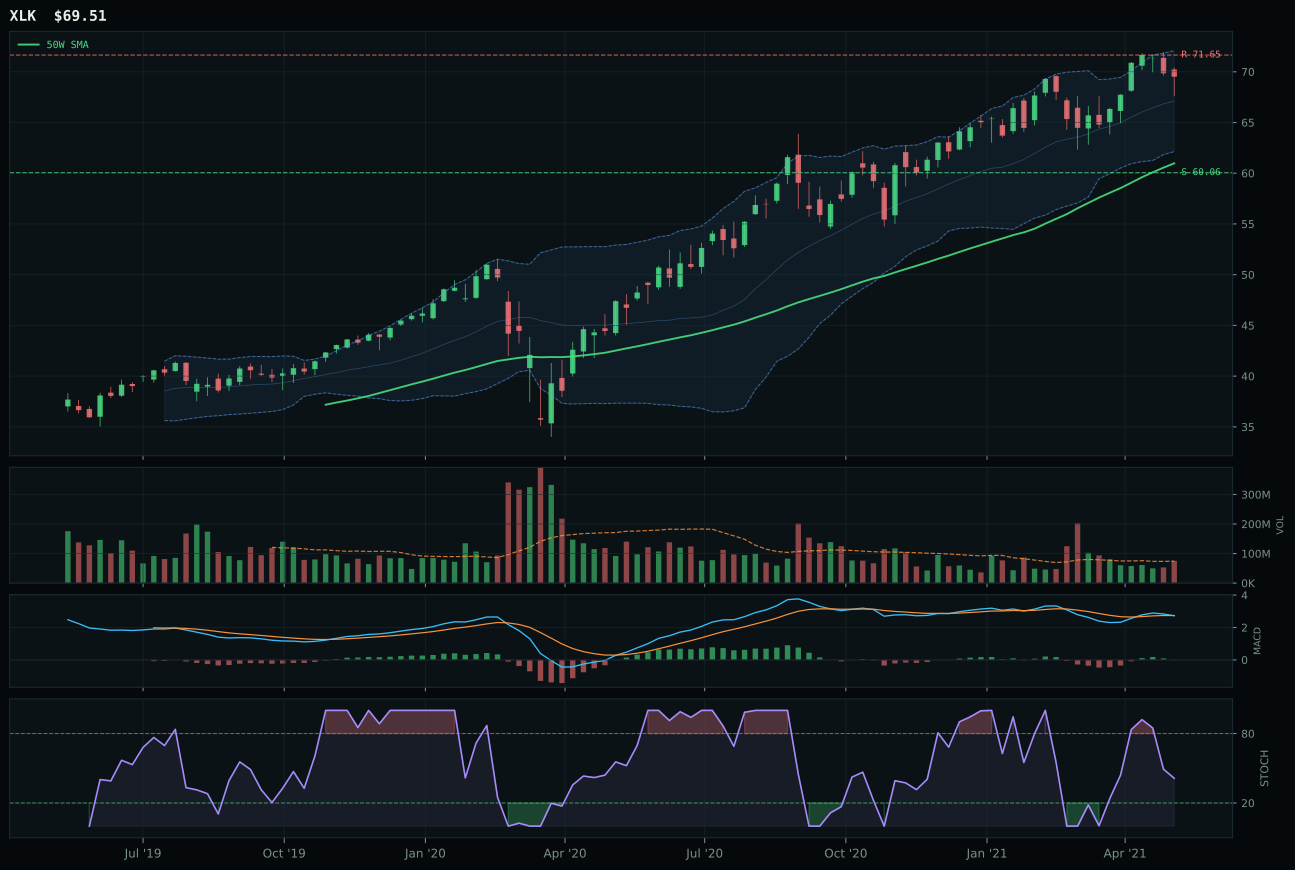
XLK has a neutral structure profile with -6.1% 13-week relative strength versus SPY.
A failed hold above support would weaken the setup.
Actionable but governed by invalidation levels.
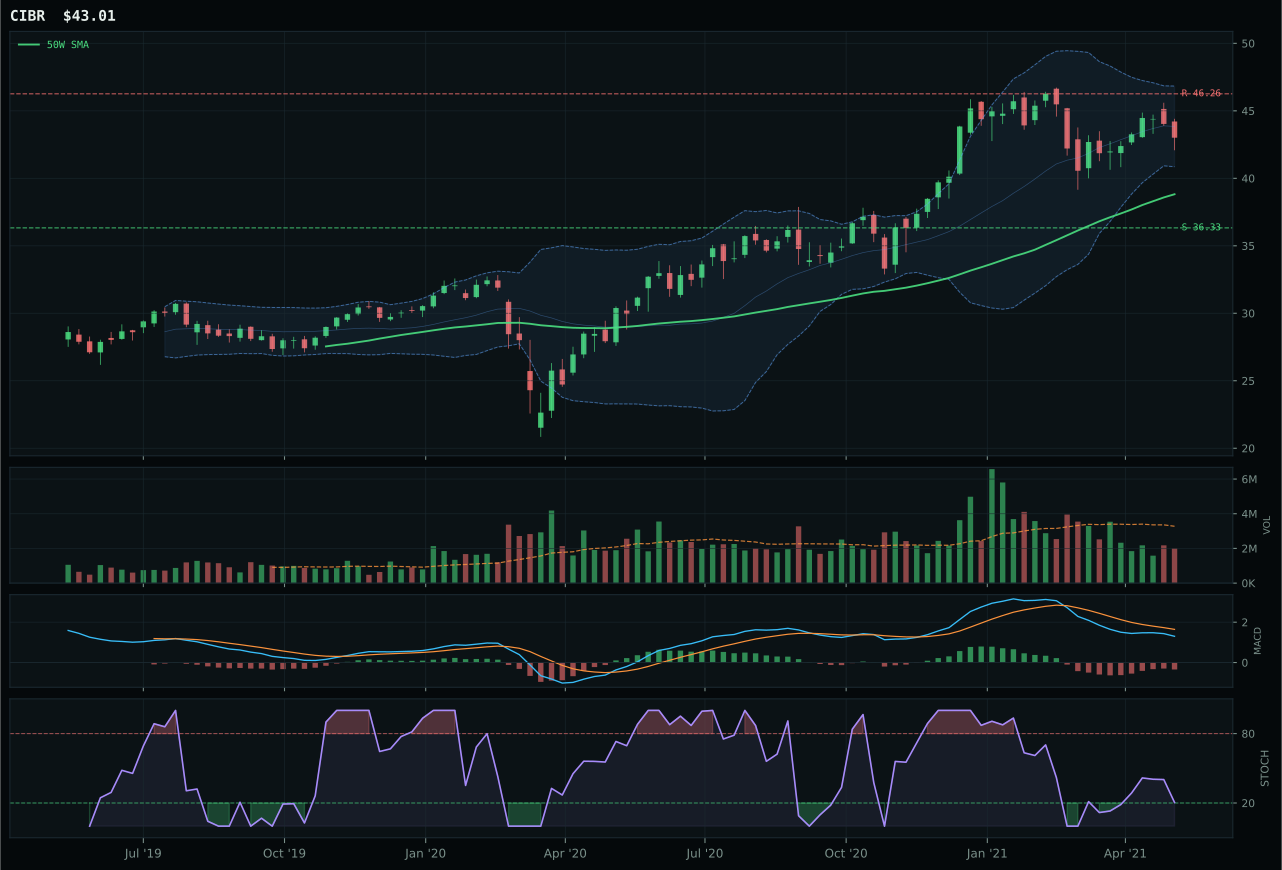
CIBR has a neutral structure profile with -14.1% 13-week relative strength versus SPY.
A failed hold above support would weaken the setup.
Actionable but governed by invalidation levels.
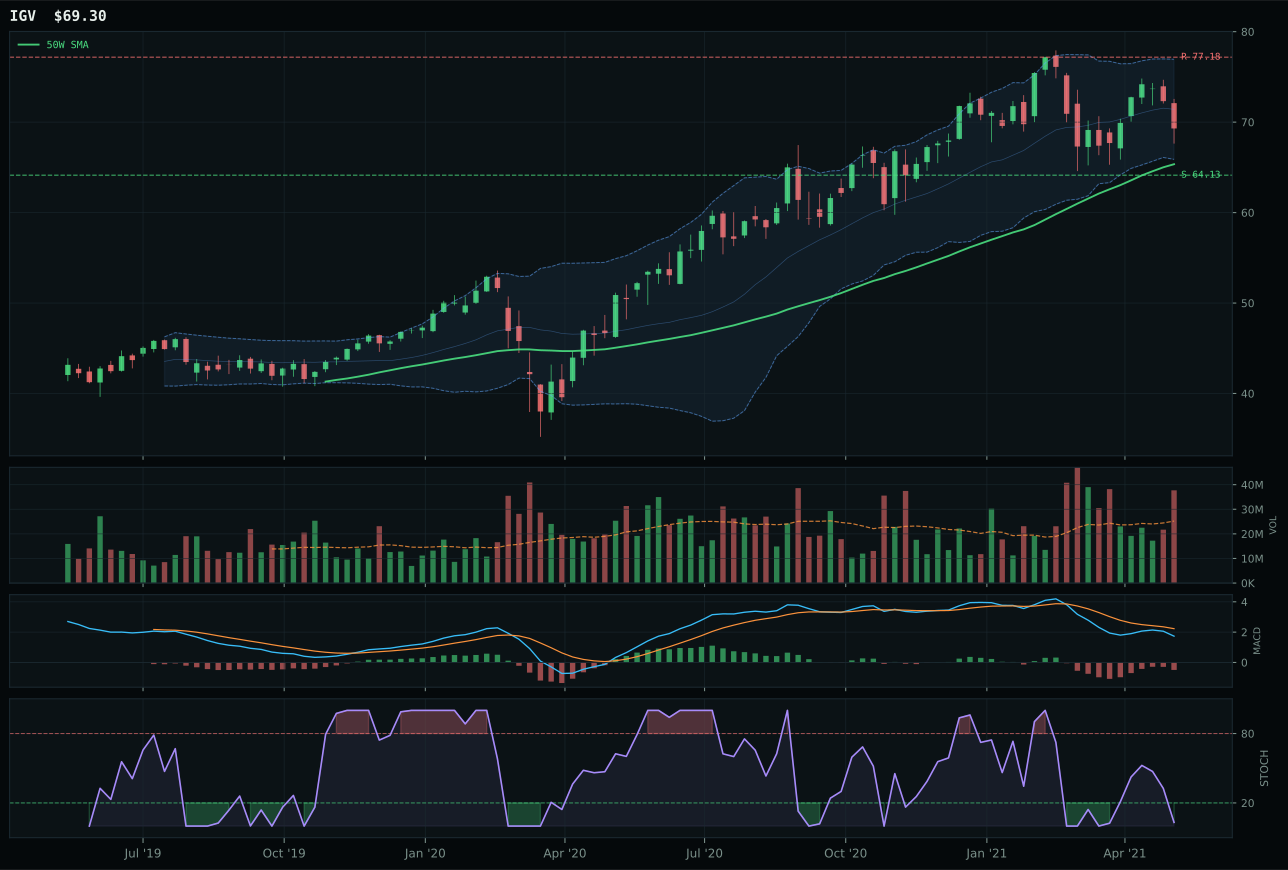
IGV has a neutral structure profile with -17.0% 13-week relative strength versus SPY.
A failed hold above support would weaken the setup.
Actionable but governed by invalidation levels.
CIBR wins the category with a 4.7-point edge over XLK, anchored in superior timing mechanics and risk-reward asymmetry. The cybersecurity specialist sits 10.8% above its 50W with MACD bearish but improving and stochastic RSI falling neutral at 0.21—a setup that rewards patience over entry urgency. XLK, by contrast, trades 21.3% extended with timing score of 67 versus CIBR's 75, and its risk-reward of 40.4 offers less downside cushion than CIBR's 51.9. Both face headwinds from negative SPY-relative strength (CIBR at -14.1%, XLK at -6.1%), but CIBR's thin 0.61x volume participation and lower momentum confirmation of 17.3 suggest a coil-like structure where accumulation may precede the next leg, not a rejection of the trend.
Technology receives 0% allocation this week, ranking 9th or 10th among all categories and falling entirely outside the portfolio. Credit stress and inflation pressure are both active macro descriptors that penalize growth-oriented, multiple-dependent exposure at exactly the moment when rate-sensitive stories face structural headwinds. The category-level macro fit of 39.0 reflects a Transition/Mixed regime that has tilted the risk-reward against technology leadership; even CIBR's marginally tighter entry point cannot overcome the macro regime mismatch. For technology to earn a position, either credit stress must reverse—signaling a pivot toward risk-on positioning—or a cleaner consolidation below resistance would reset the technical risk-reward and allow a re-entry at a superior risk-adjusted level.
AI — BOTZ
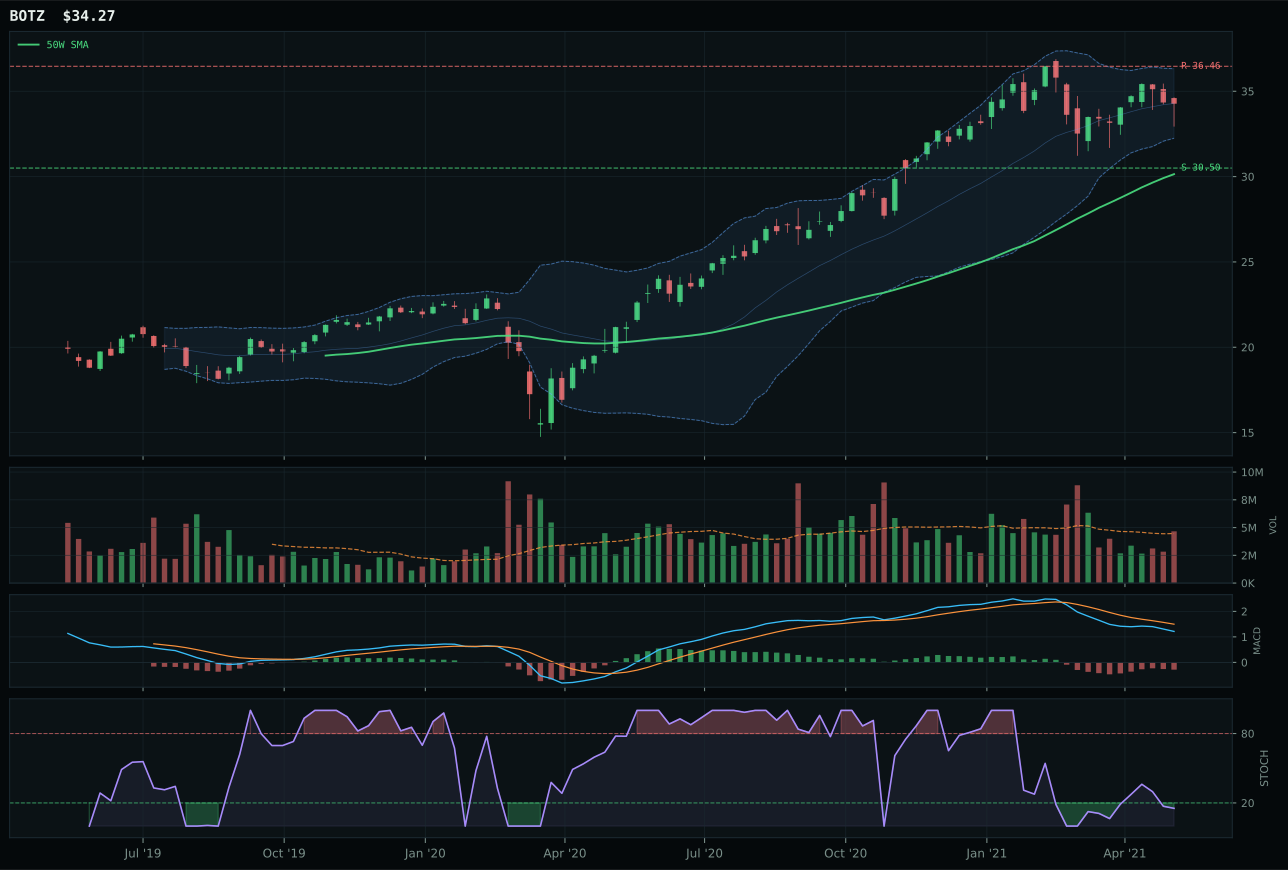
BOTZ has a neutral structure profile with -11.1% 13-week relative strength versus SPY.
A failed hold above support would weaken the setup.
Actionable but governed by invalidation levels.
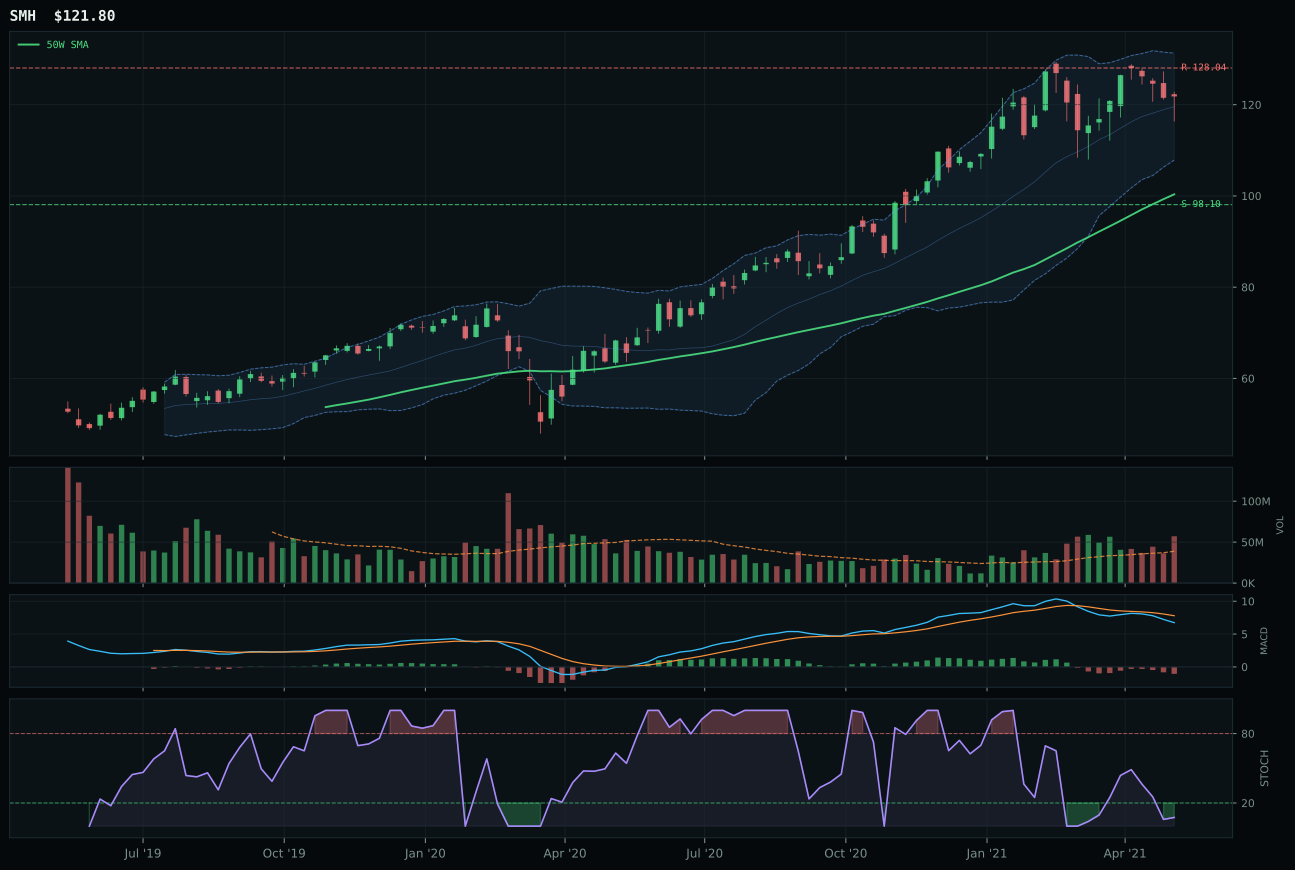
SMH has a vertical extension profile with -5.3% 13-week relative strength versus SPY.
A failed hold above support would weaken the setup.
Actionable but governed by invalidation levels.
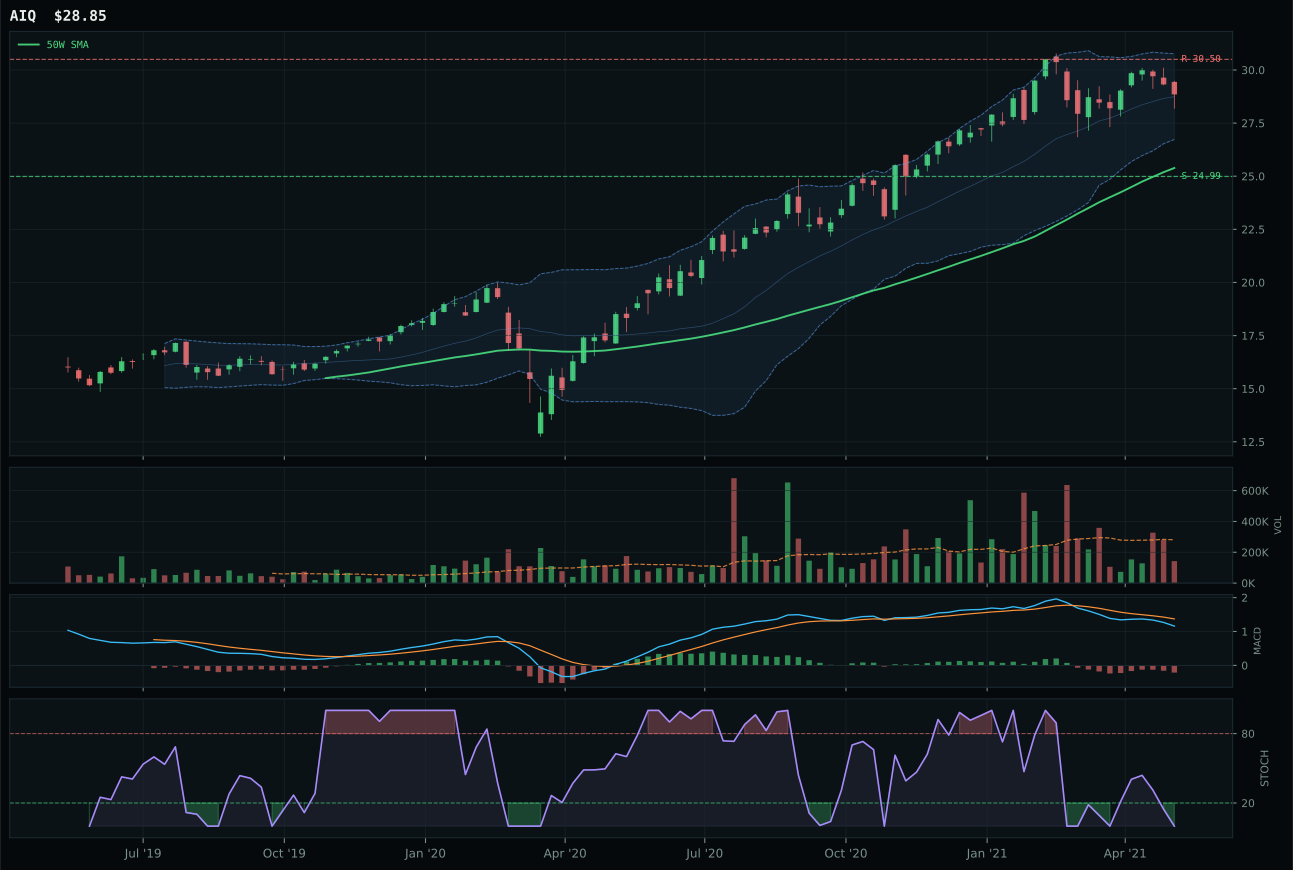
AIQ has a neutral structure profile with -11.1% 13-week relative strength versus SPY.
A failed hold above support would weaken the setup.
Tracked, but not top-2 eligible because: .
BOTZ edges SMH by 11.2 points through superior timing discipline and less punitive entry risk. The robotics-focused ETF sits 13.7% above the 50W with MACD bearish but improving and stochastic RSI in true oversold territory at 0.15, providing a genuine mean-reversion signal. SMH, meanwhile, trades in vertical extension 21.4% extended from the 50W with timing score of 48 versus BOTZ's 75, and its MACD shows bearish deterioration rather than improvement. Both carry modest SPY-relative strength that fails to justify conviction (BOTZ -11.1%, SMH -5.3%), but BOTZ's neutral volume participation at 1.04x average and category-flat momentum confirmation suggest accumulation rather than exhaustion. SMH's above-average participation and weakening MACD read as distribution into strength.
AI receives 0% allocation this week, ranked outside the top categories entirely. The 25.9 category score lags dramatically behind the two overweighted categories (COPX at 77.7 and WEAT at 75.8), reflecting a fundamental mismatch between technical evidence and macro sponsorship in a Transition/Mixed regime. Credit stress is the dominant headwind, penalizing AI's leverage to discretionary capex and semiconductor supply chains at a moment when refinancing risk dominates the macro backdrop. For AI to earn tier-2 consideration, either credit stress must resolve or BOTZ's oversold stochastic must trigger a clean, volume-confirmed breakout above 50W resistance that re-establishes category momentum leadership relative to commodities and real assets.