
2021-04-30
Informational purposes only. The content in this report, including allocations, analysis, and commentary, is provided solely for informational and educational purposes. It does not constitute financial advice, investment advice, trading advice, or any other type of advice. Past performance does not guarantee future results. Always conduct your own research and consult a qualified financial professional before making investment decisions.
Weekly Allocation
| Ticker | Category | Weight | Role |
|---|---|---|---|
| FSOL | 50% | Overlay | |
| COPX | Industrial Metals | 10% | Top-2 (10%) |
| WEAT | Agriculture & Livestock | 10% | Top-2 (10%) |
| XLE | Traditional Energy | 5% | Tier-2 (5%) |
| XLU | Utilities & Infrastructure | 5% | Tier-2 (5%) |
| URNM | Nuclear Energy | 5% | Tier-2 (5%) |
| SLV | Precious Metals | 5% | Tier-2 (5%) |
| ITA | Defense & Aerospace | 5% | Tier-2 (5%) |
| CIBR | Technology | 5% | Tier-2 (5%) |
Trade Instructions — Monday Open
Sell the tranche from 2021-04-02 (completing its 4-week hold). Buy the new tranche. Instructions show net portfolio changes — same-asset positions cancel, weight changes show the delta.
| Action | Ticker | Instruction |
|---|---|---|
| SELL | XLE | Sell 14% of XLE position (reduce 8.75% → 7.50%) |
| SELL | URNM | Sell 25% of URNM position (reduce 5.00% → 3.75%) |
| SELL | MOO | Sell 50% of MOO position (reduce 2.50% → 1.25%) |
| SELL | SMH | Sell 50% of SMH position (reduce 2.50% → 1.25%) |
| SELL | XLK | Sell 50% of XLK position (reduce 2.50% → 1.25%) |
| BUY | COPX | Buy COPX — 20.00% of freed cash (adds 1.25% to portfolio) |
| BUY | SLV | Buy SLV — 20.00% of freed cash (adds 1.25% to portfolio) |
| BUY | WEAT | Buy WEAT — 40.00% of freed cash (adds 2.50% to portfolio) |
| BUY | CIBR | Buy CIBR — 20.00% of freed cash (adds 1.25% to portfolio) |
Current Portfolio After Trade
Combined holdings across all 4 active tranches. Each tranche is 25% of the portfolio.
| Ticker | % of Portfolio | Weight Bar |
|---|---|---|
| FSOL | 50.00% | |
| XLE | 7.50% | |
| XLU | 6.25% | |
| COPX | 6.25% | |
| WEAT | 6.25% | |
| SLV | 5.00% | |
| URNM | 3.75% | |
| ITA | 2.50% | |
| XAR | 2.50% | |
| URA | 2.50% | |
| MOO | 1.25% | |
| SMH | 1.25% | |
| XLK | 1.25% | |
| PICK | 1.25% | |
| IGV | 1.25% | |
| CIBR | 1.25% |
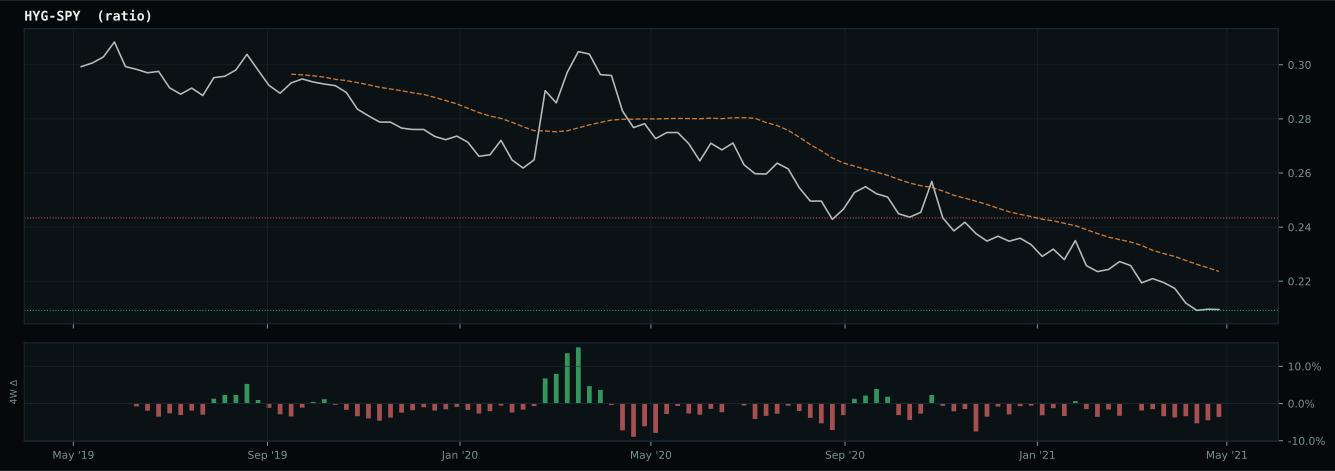
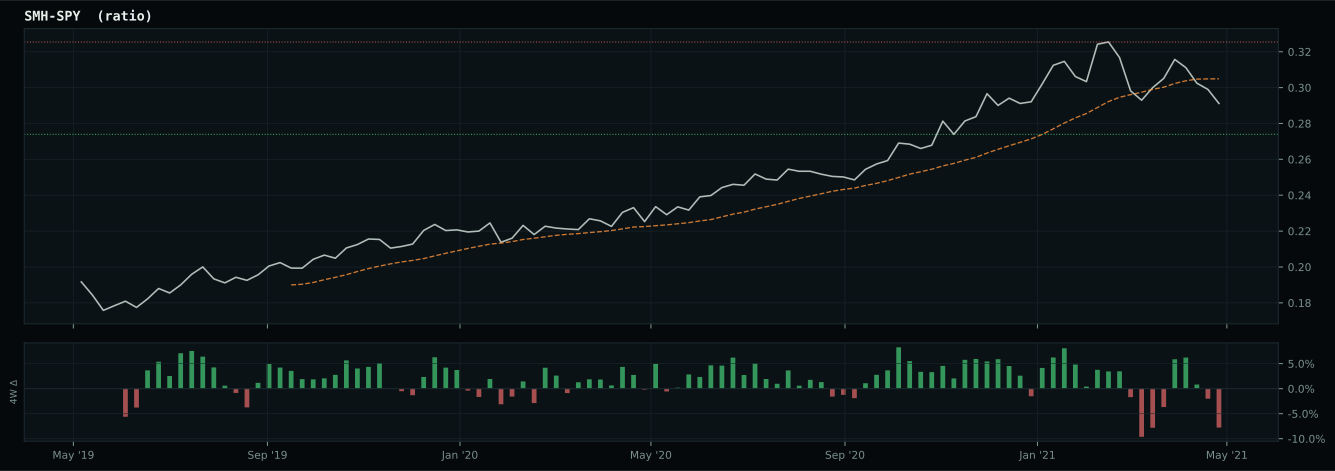
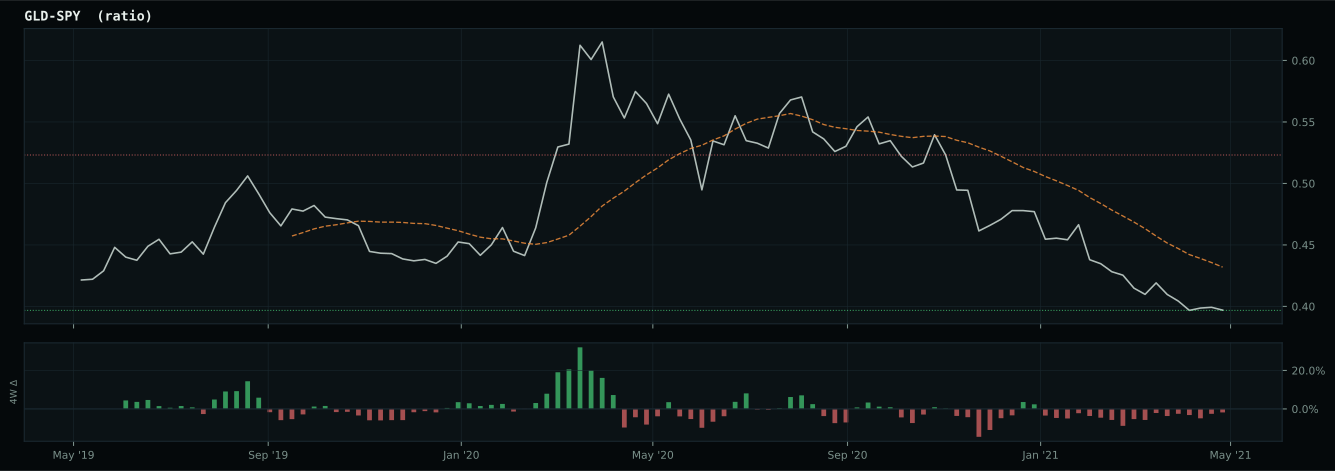
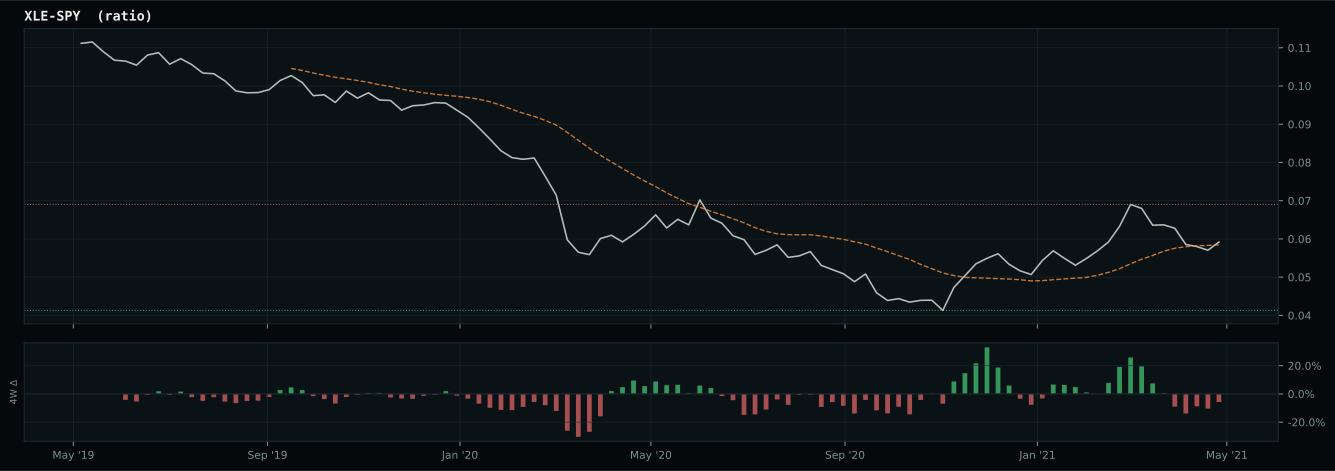
Macro Regime — Transition / Mixed
liquidity is improving but credit stress remains elevated
Macro Evidence Charts
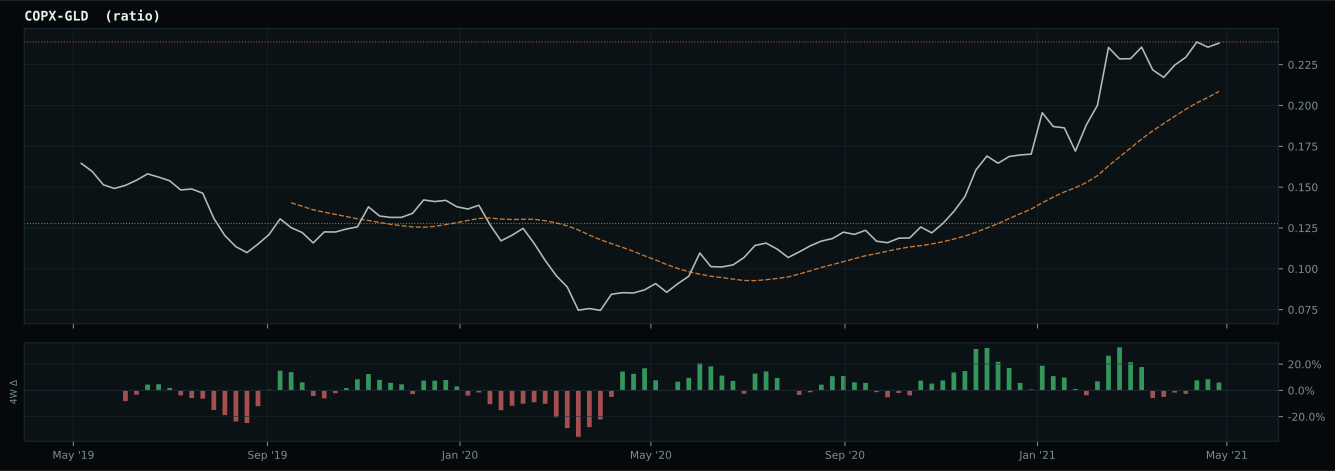
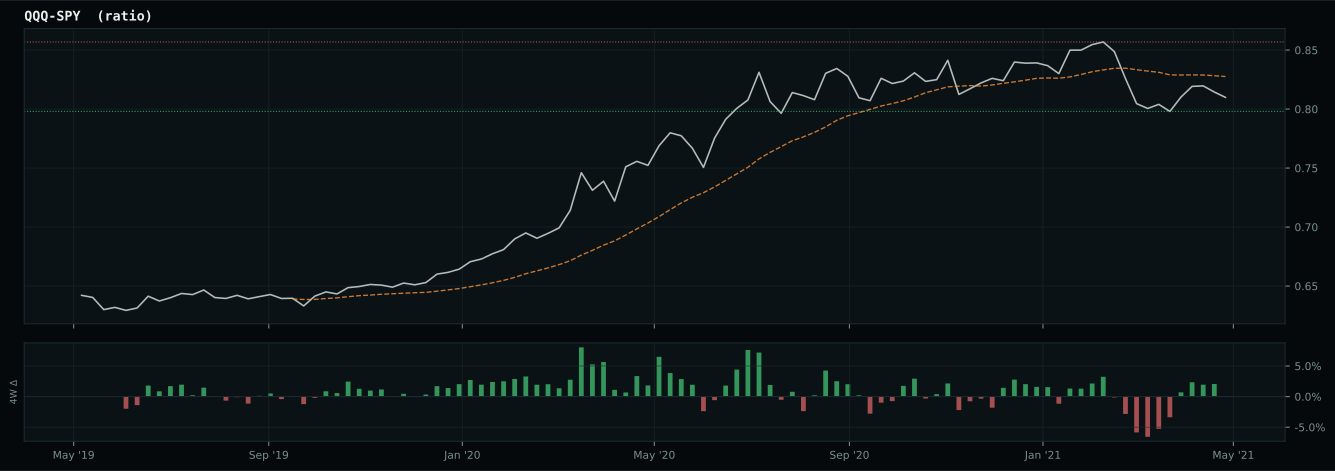
Market-implied signals behind the macro regime scores. Each ratio compares two assets; the direction and slope of the ratio is what the macro engine reads.
Crypto Regime — AltSeason
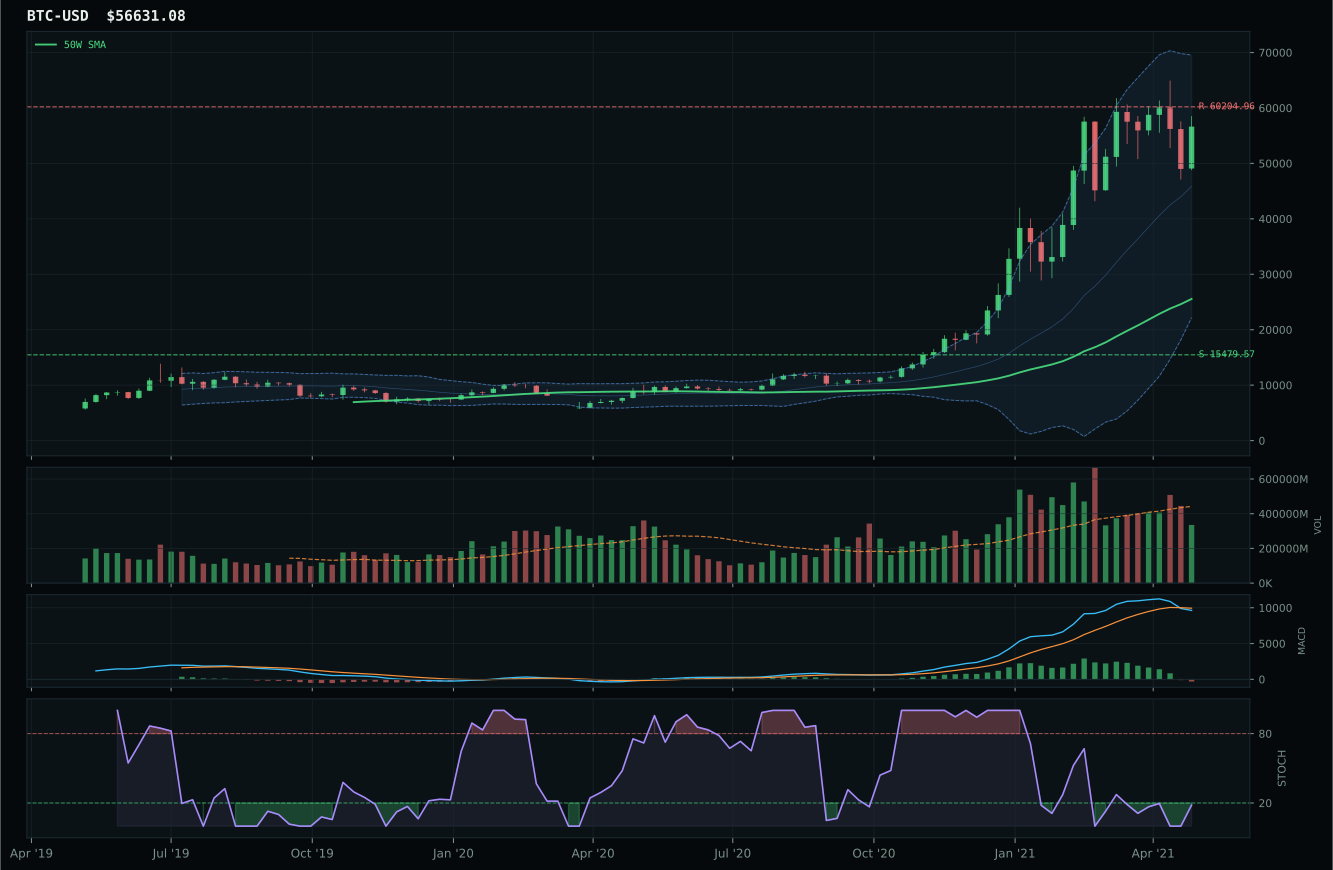
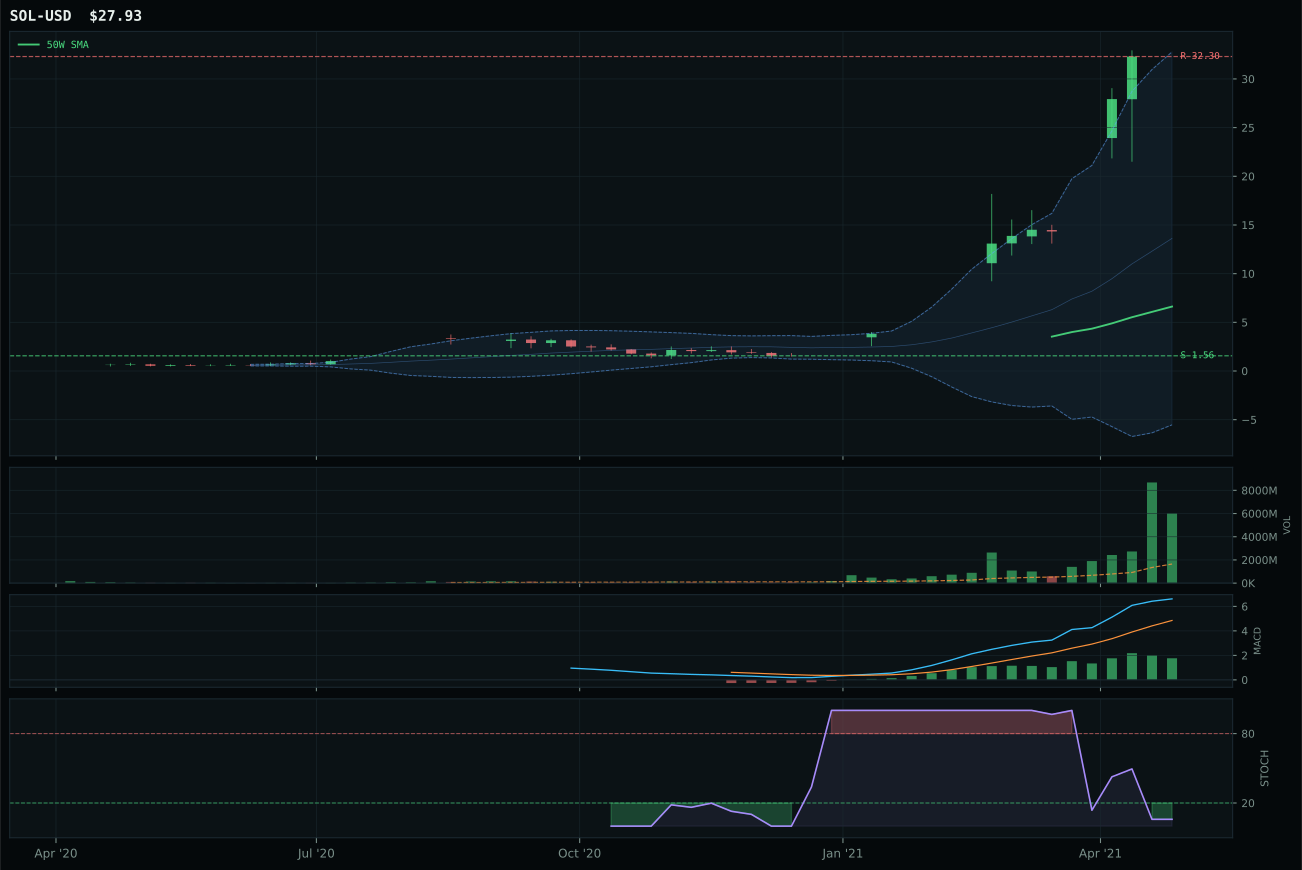
post-touch structure is too wide to count as a range; max/min close ratio is 11.16
TrendBTC confirmed: 2 consecutive closes above rising/flat 50W SMA
all available AltSeason conditions pass; missing optional confirmations skipped
Category Rankings
| Rank | Category | Winner | Score | Alloc | 4W Ret | Peers (4W) |
|---|---|---|---|---|---|---|
| 1 | Industrial Metals | COPX | 69.8 | 20% | +5.32% | PICK +6.0% · REMX +5.9% |
| 2 | Agriculture & Livestock | WEAT | 65.6 | 20% | -5.83% | MOO +1.6% · VEGI +0.6% |
| 3 | Traditional Energy | XLE | 62.9 | 10% | +6.57% | FCG +13.0% · XOP +12.5% |
| 4 | Utilities & Infrastructure | XLU | 56.5 | 10% | -2.33% | IGF +1.0% · PAVE +2.8% |
| 5 | Nuclear Energy | URNM | 51.5 | 10% | +12.36% | NLR +1.4% · URA +12.4% |
| 6 | Precious Metals | SLV | 47.4 | 10% | +7.19% | GDX +13.3% · GLD +6.7% |
| 7 | Defense & Aerospace | ITA | 43.6 | 10% | +3.85% | XAR +1.1% · ROKT +1.8% |
| 8 | Technology | CIBR | 36.6 | 10% | +0.90% | XLK -1.0% · IGV +0.2% |
| 9 | AI | BOTZ | 27.7 | 0% | -0.32% | AIQ -0.3% · SMH +2.6% |
| 10 | Emerging Markets | ILF | 26.7 | 0% | +10.63% | IEMG +4.3% · INDA +8.2% |
Industrial Metals — COPX
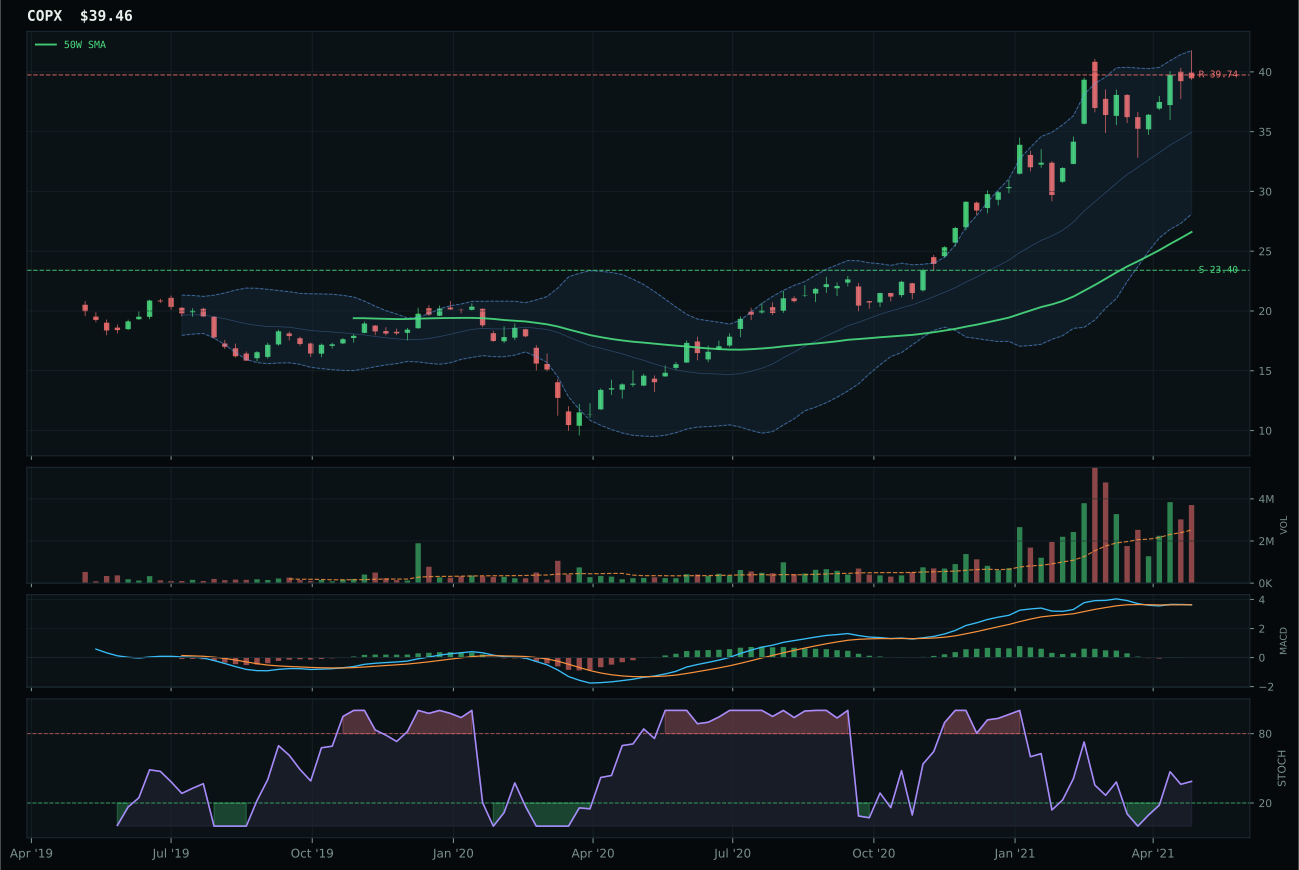
COPX has a vertical extension profile with 20.1% 13-week relative strength versus SPY.
A failed hold above support would weaken the setup.
Actionable but governed by invalidation levels.
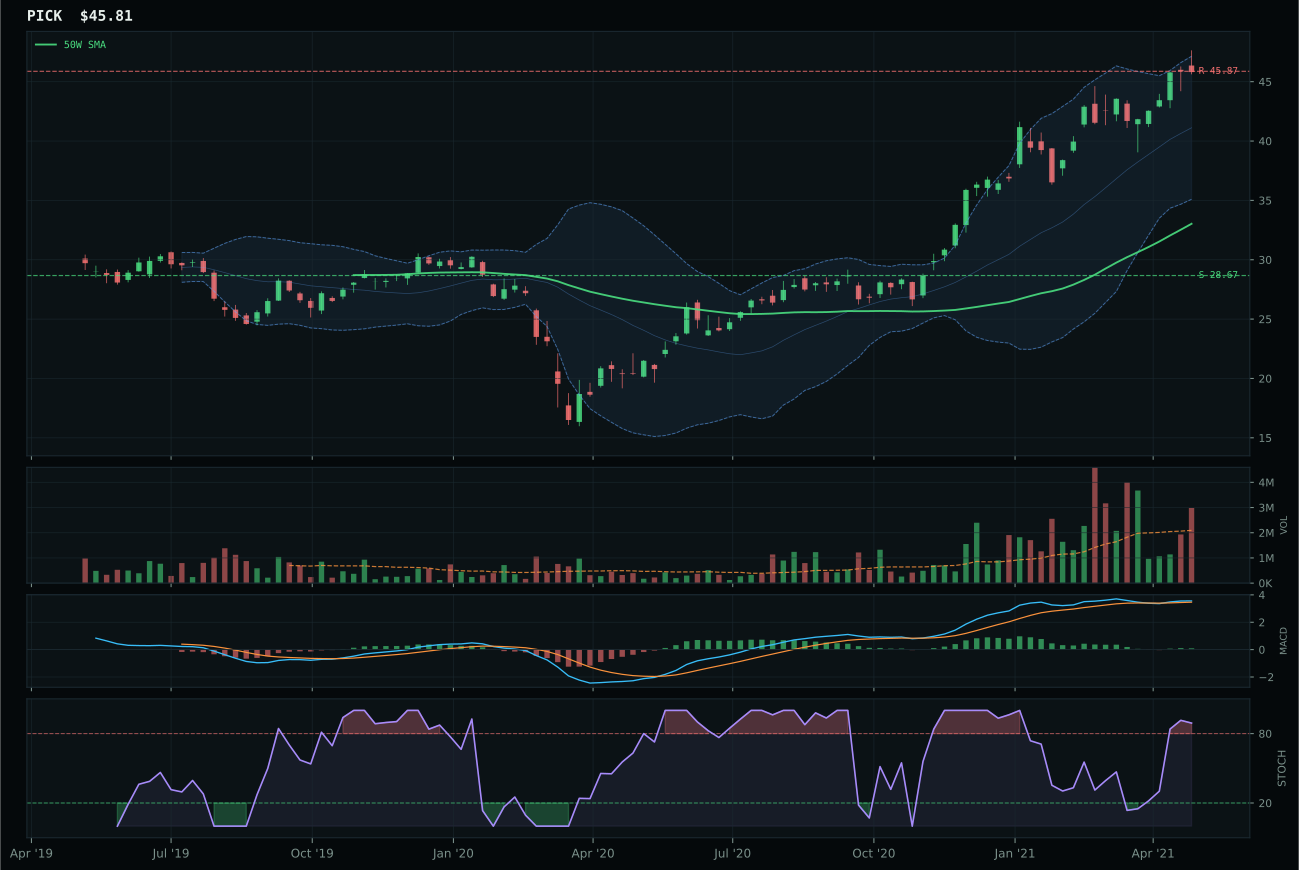
PICK has a vertical extension profile with 12.7% 13-week relative strength versus SPY.
A failed hold above support would weaken the setup.
Actionable but governed by invalidation levels.
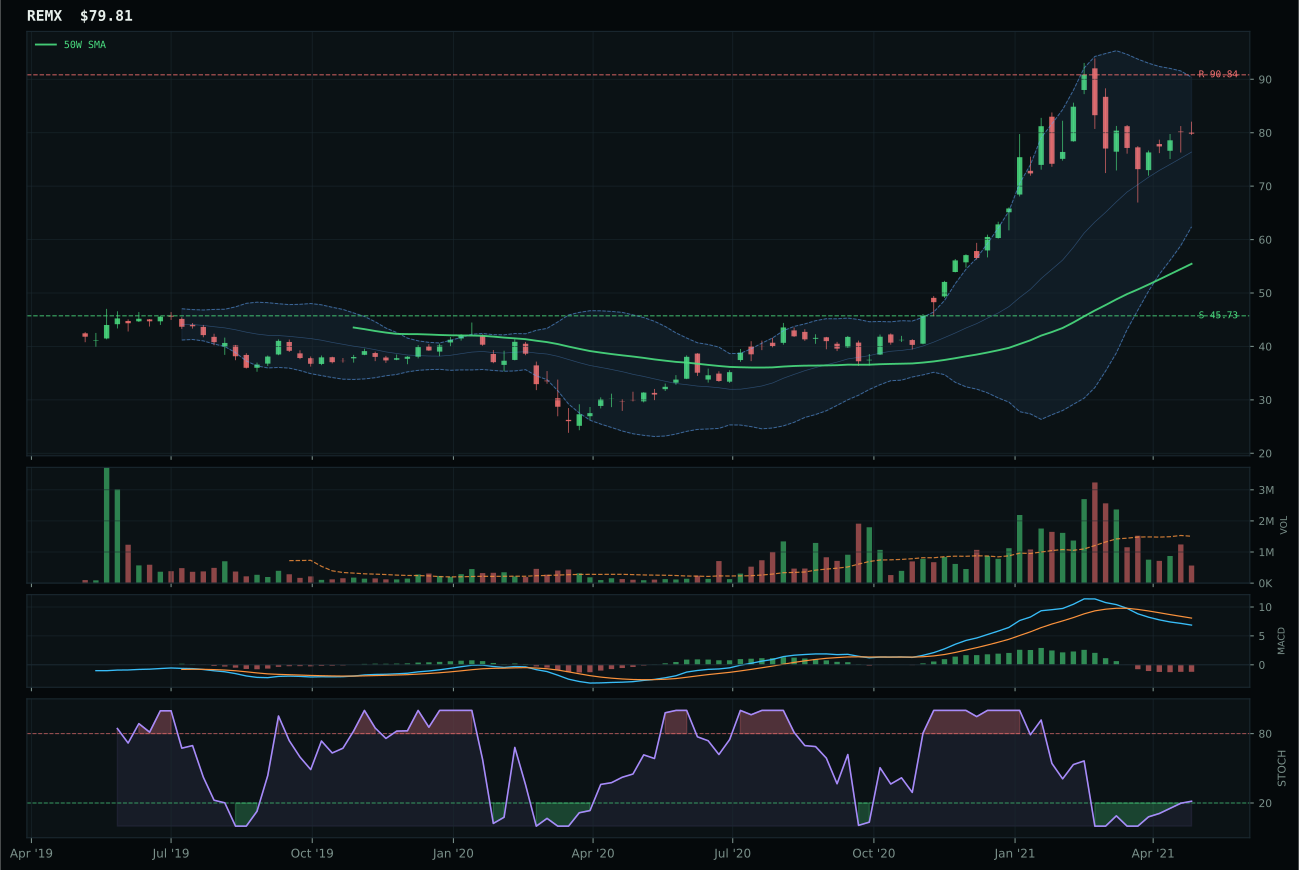
REMX has a vertical extension profile with -5.2% 13-week relative strength versus SPY.
A failed hold above support would weaken the setup.
Actionable but governed by invalidation levels.
COPX dominates with a 100.0 momentum confirmation score and persistence of 91.7, achieving the rare combination of massive recent returns (32.9% in 13 weeks) married to above-average volume participation at 1.47x the 20-week average. Price sits 48.3% above the 50-week moving average yet stochastic RSI remains in rising mid-zone rather than overbought territory—a structural anomaly that signals the move remains in the accumulation phase despite extreme extension. Copper's 20.1% relative strength versus SPY towers above PICK's 12.7%, and COPX's category-relative strength of 7.4% means it alone is winning within the three-ETF basket. PICK's stochastic RSI overbought state combined with weaker timing (37.0 vs. 53.0) marks the moment when overbought momentum replaces accumulation, a technical inflection COPX has not yet reached.
Industrial Metals earned top-2 status at 10% allocation on a category score of 69.8, anchored by the strongest macro fit in the portfolio at 73.0—metals scarcity active at +14, commodity breadth positive at +10, and real asset sponsorship at +6 create an exceptionally coherent macro narrative. The technical evidence of 80.1 for COPX proves this is not a macro-only call; the trend score of 100.0 combined with momentum confirmation of 100.0 validates that actual accumulation is occurring, not just price momentum divorced from volume. The extreme 48.3% extension above the 50-week moving average would normally disqualify entry, but the combination of rising-mid-zone stochastic RSI and above-average volume proves the move is still in its middle innings. Industrial Metals justifies top-2 capital commitment as the best blend of technical durability and macro tailwind alignment.
Agriculture & Livestock — WEAT
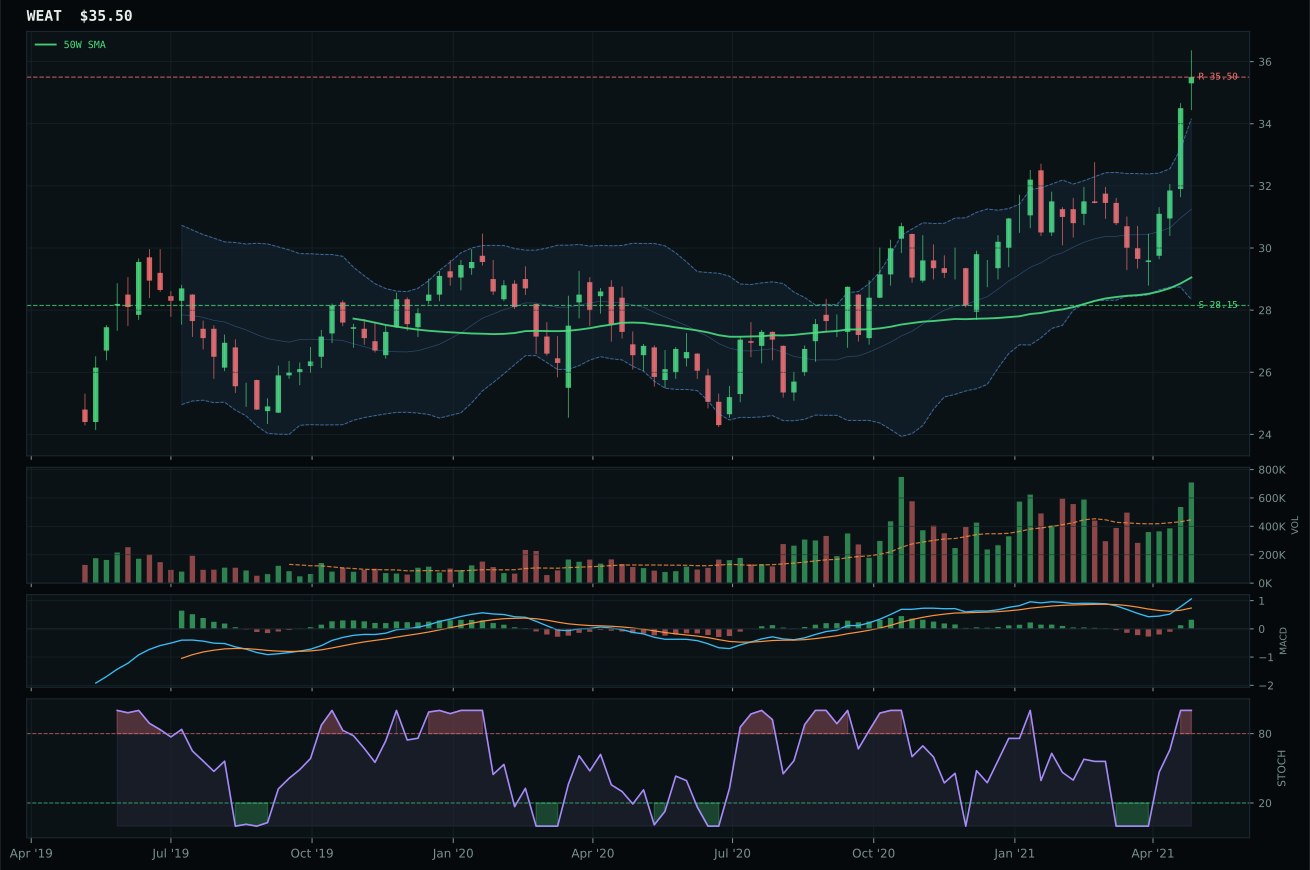
WEAT has a vertical extension profile with -0.1% 13-week relative strength versus SPY.
A failed hold above support would weaken the setup.
Actionable but governed by invalidation levels.
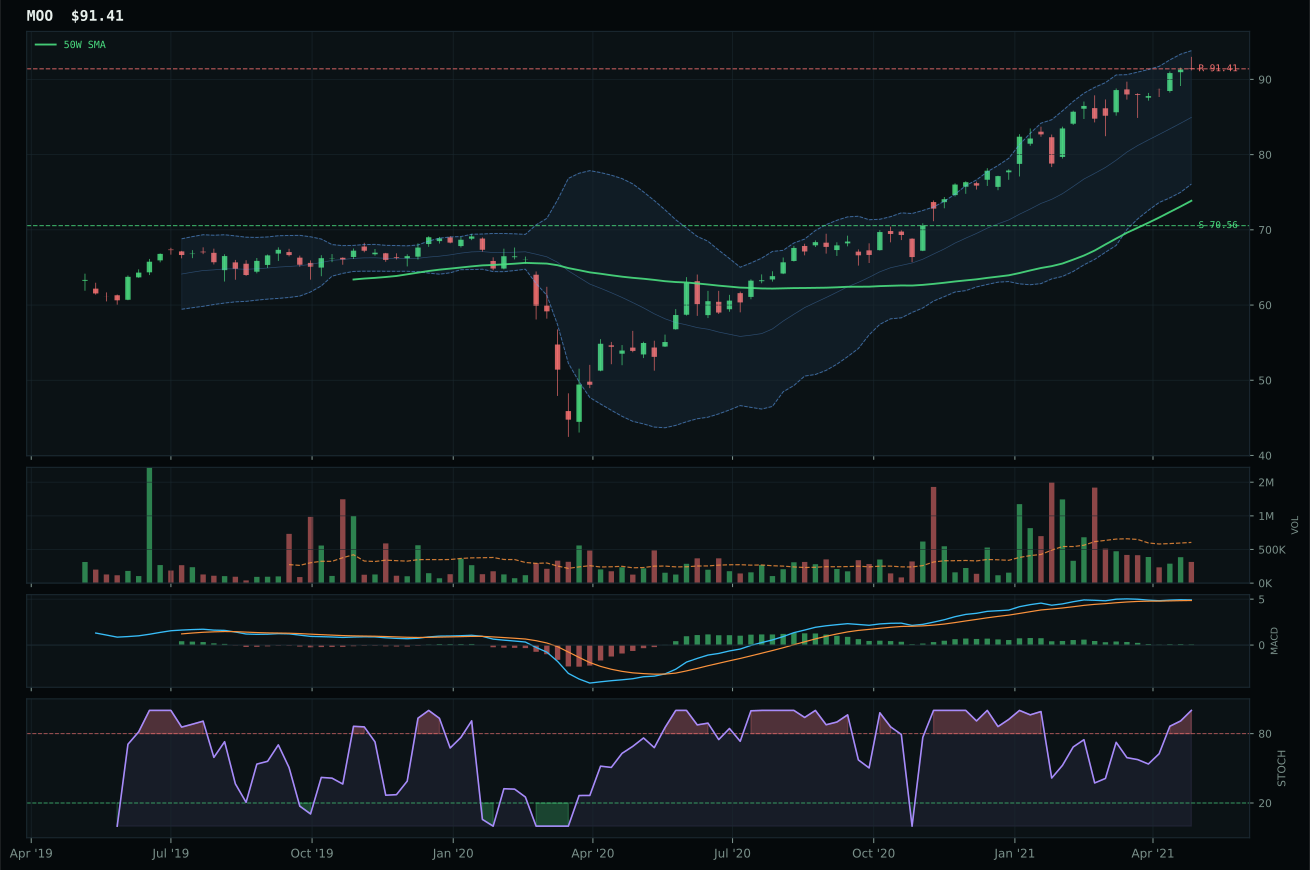
MOO has a vertical extension profile with 3.2% 13-week relative strength versus SPY.
A failed hold above support would weaken the setup.
Actionable but governed by invalidation levels.
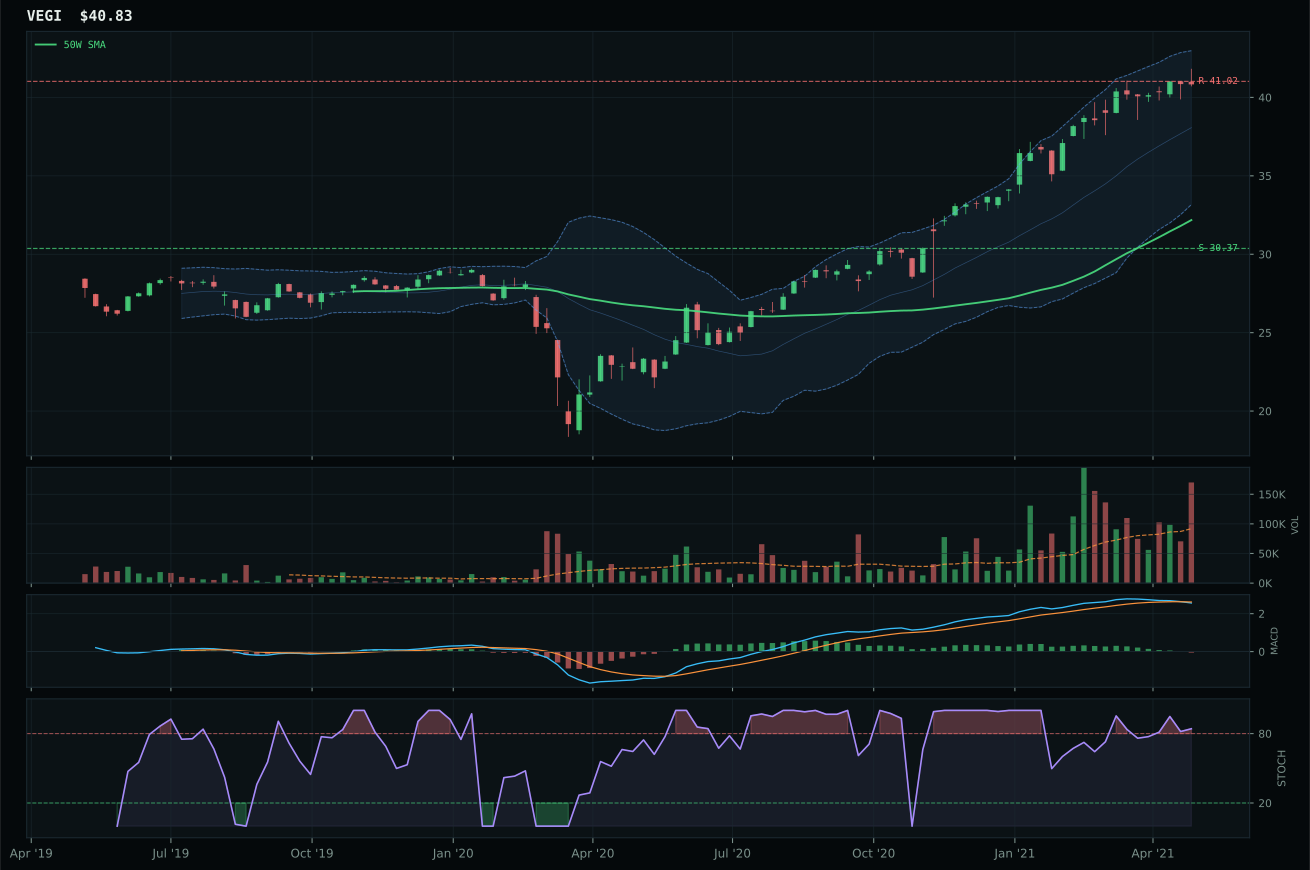
VEGI has a vertical extension profile with 3.6% 13-week relative strength versus SPY.
A failed hold above support would weaken the setup.
Tracked, but not top-2 eligible because: .
WEAT claims the category with a momentum confirmation score of 100.0 and volume-price confirmation of 80.2, translating to pure accumulation-phase structure: volume runs at 1.59x its 20-week average while price extends 22.2% above the 50-week moving average with bullish and improving MACD. This is not a tired breakout but an actively building position, evidenced by MACD's consistent improvement trajectory and stochastic RSI sustaining overbought momentum at 1.00. MOO lost on timing (37.0 vs. 32.0) and volume discipline—MOO's MACD flattening while volume retreats to thin participation signals the move may be losing sponsorship. The 1.5-point category score gap is remarkably tight, but WEAT's superior volume confirmation and more robust MACD trajectory justify the representative designation.
Agriculture & Livestock earned top-2 overweight status at 10% allocation on a category score of 65.6, reflecting the strongest macro narrative and second-best technical setup in this week's portfolio. Supply shortage active at +13, inflation pressure at +10, and real asset sponsorship at +8 combine to create a potent 86.0 macro fit score—the strongest category macro conviction in this regime. The technical evidence of 87.2 for WEAT proves the setup is genuine rather than macro-driven wishful thinking, anchored by bullish MACD improvement and accumulation-phase volume. The overlay environment (50% crypto weighting halves all allocations) actually aids commitment to real assets; capital confined to non-crypto buckets naturally gravitates toward commodity-linked equities with macro tailwinds. Agriculture's dual strength—sound technical setup married to powerful macro descriptor alignment—justifies top-2 designation.
Traditional Energy — XLE
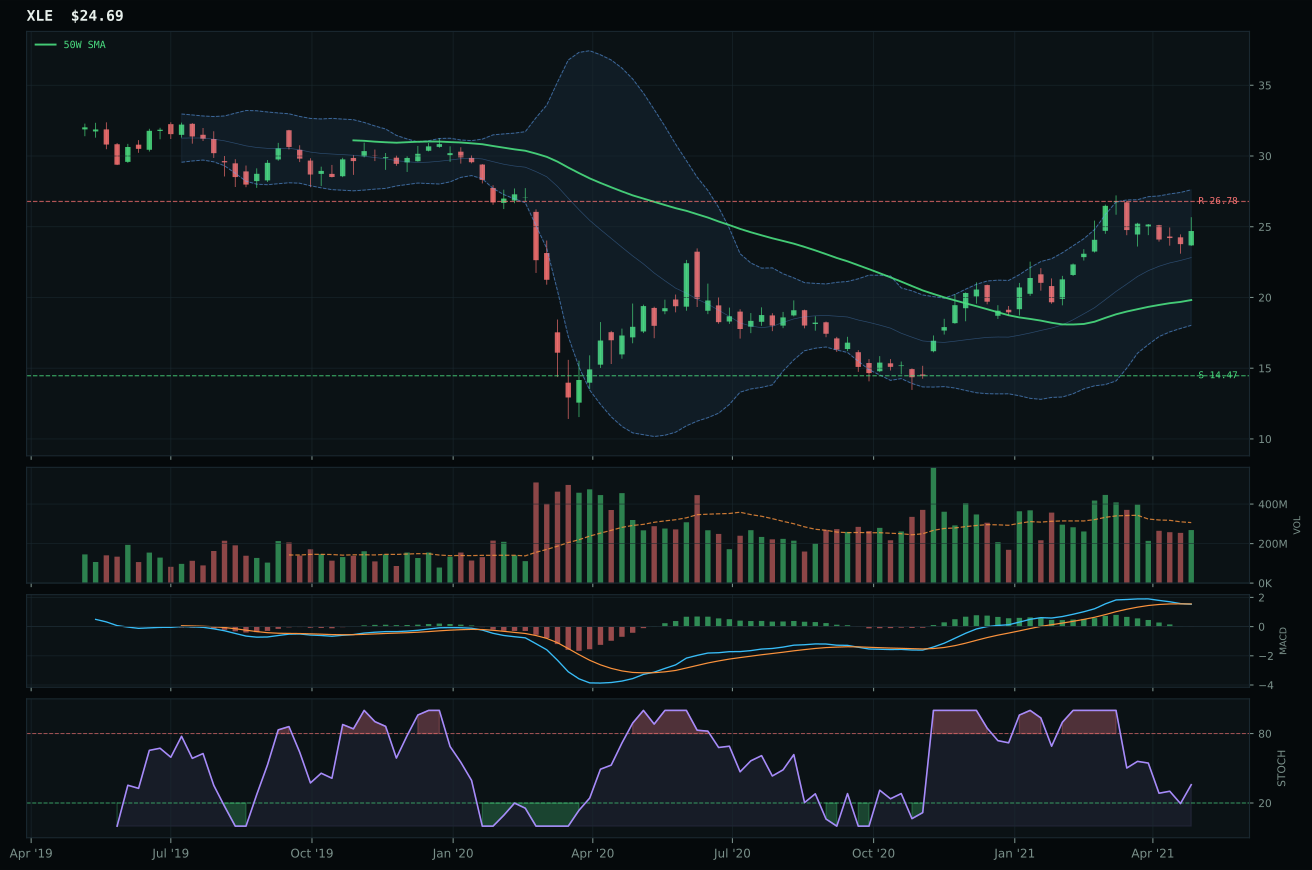
XLE has a vertical extension profile with 12.8% 13-week relative strength versus SPY.
A failed hold above support would weaken the setup.
Actionable but governed by invalidation levels.
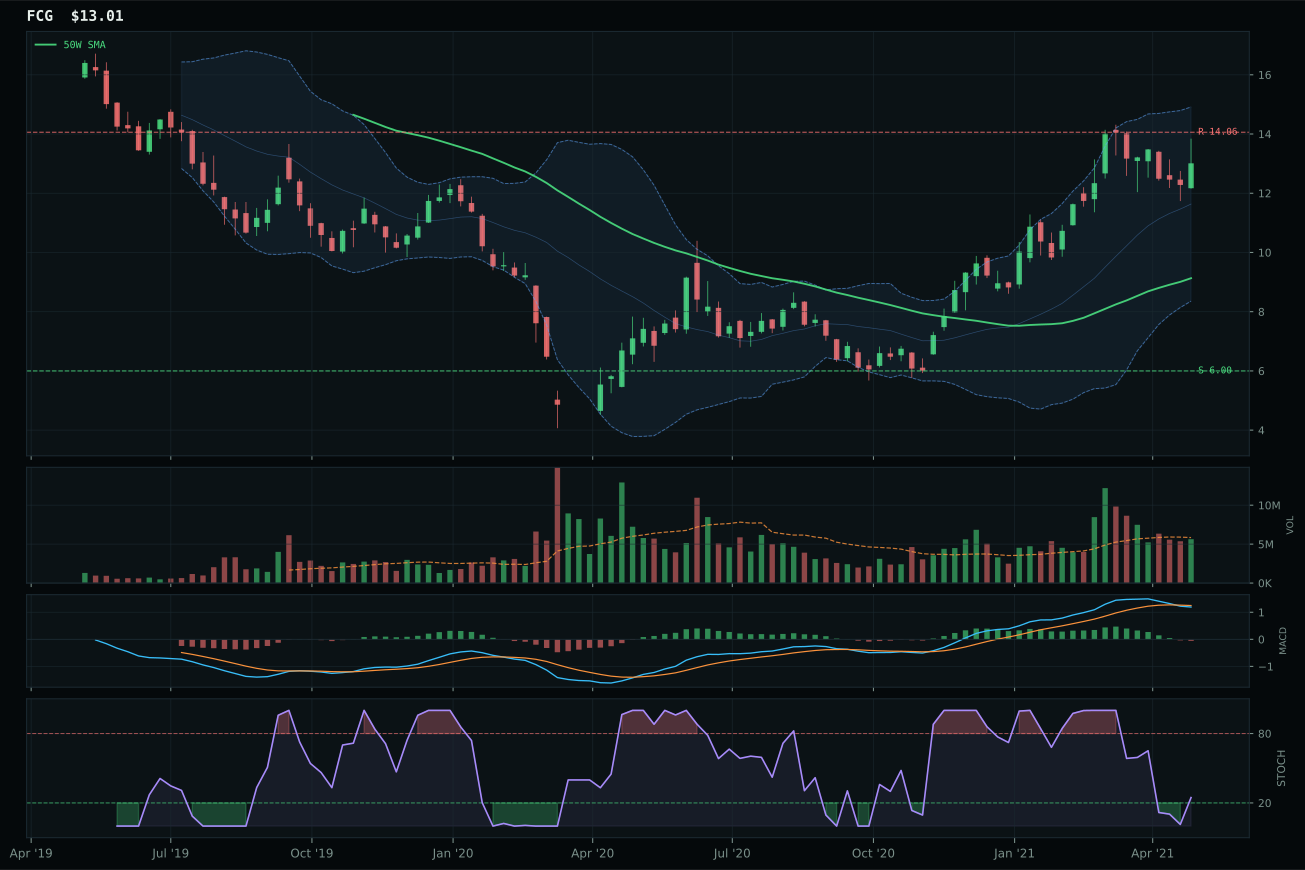
FCG has a vertical extension profile with 19.6% 13-week relative strength versus SPY.
A failed hold above support would weaken the setup.
Actionable but governed by invalidation levels.
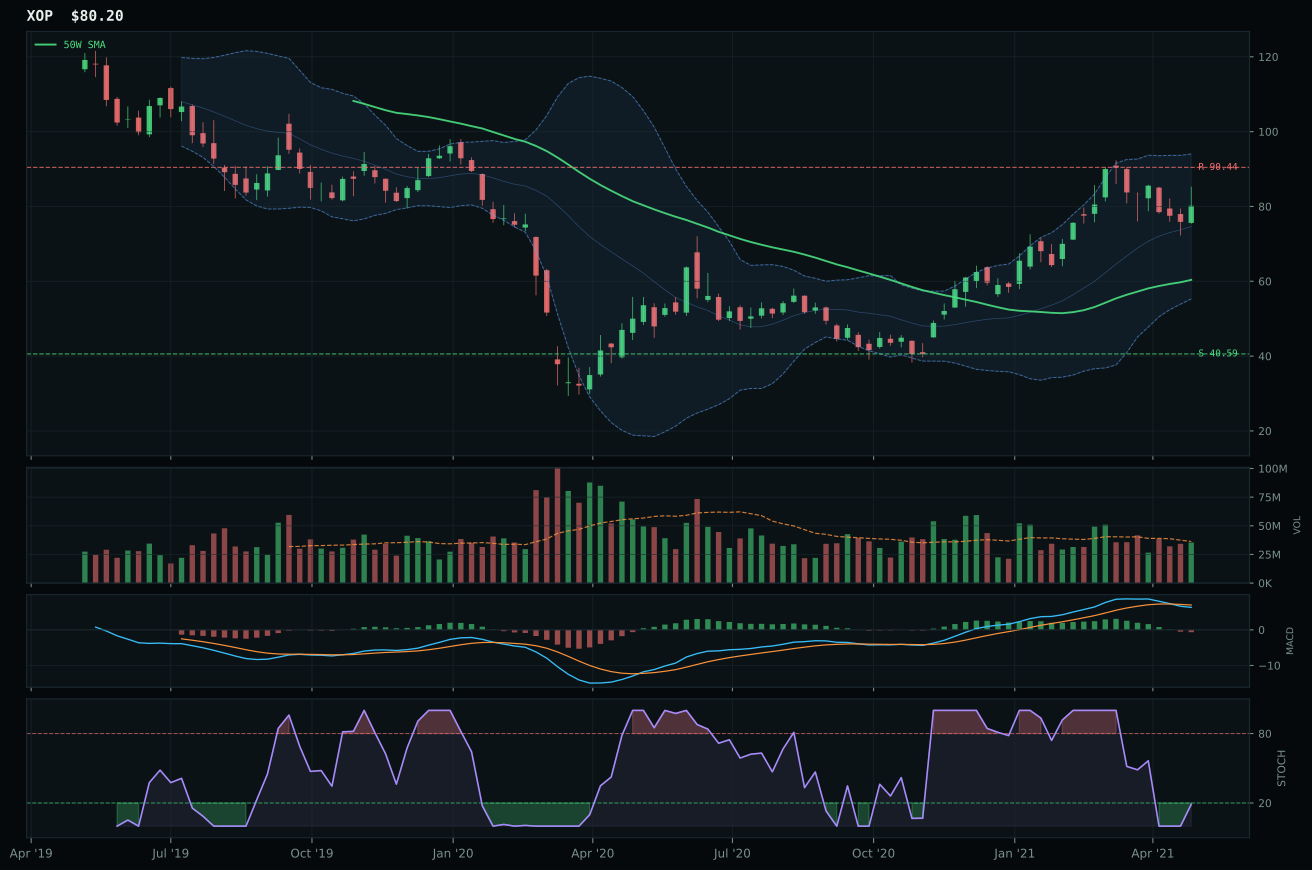
XOP has a vertical extension profile with 11.9% 13-week relative strength versus SPY.
A failed hold above support would weaken the setup.
Actionable but governed by invalidation levels.
XLE defeats FCG despite both sitting in vertical extension, with the 6.5-point category score gap driven by XLE's superior risk-reward positioning (47.0 vs. 31.1) and cleaner structure (73.9 vs. 71.2). XLE trades 24.6% above its 50-week moving average while FCG stretches to 42.5%—the latter's excess distance compounds its risk/reward penalty, leaving little room for error. Both carry bearish/weakening MACD with rising mid-zone stochastic RSI, but XLE's momentum confirmation of 77.6 edges FCG's 100.0 because XLE's risk-reward foundation is less precarious. This is a decision between two extended candidates where the less extended option wins by default—neither setup exudes conviction, but XLE's defensive positioning makes it the rational choice for a tier-2 slot.
Traditional Energy holds 5% as tier-2 allocation on a 62.9 category score supported by powerful 85.0 macro fit—energy scarcity active at +16, inflation pressure at +10, supply shortage at +9 provide the strongest macro rationale for any tier-2 category. The technical evidence of 47.3 lags other categories, reflecting XLE's awkward charting: price sits above the 50-week but below the 200-week moving average, signaling a move in progress but not yet confirmed by longer-term trend establishment. Volume is neutral and MACD is weakening, which dampens conviction despite macro tailwinds. Energy earns allocation through macro conviction and real-asset portfolio diversification rather than technical purity; the allocation tier reflects the mismatch between powerful commodity narratives and cautious technical setups. Tier-2 status is appropriate—meaningful enough to hold, not compelling enough to elevate.
Utilities & Infrastructure — XLU
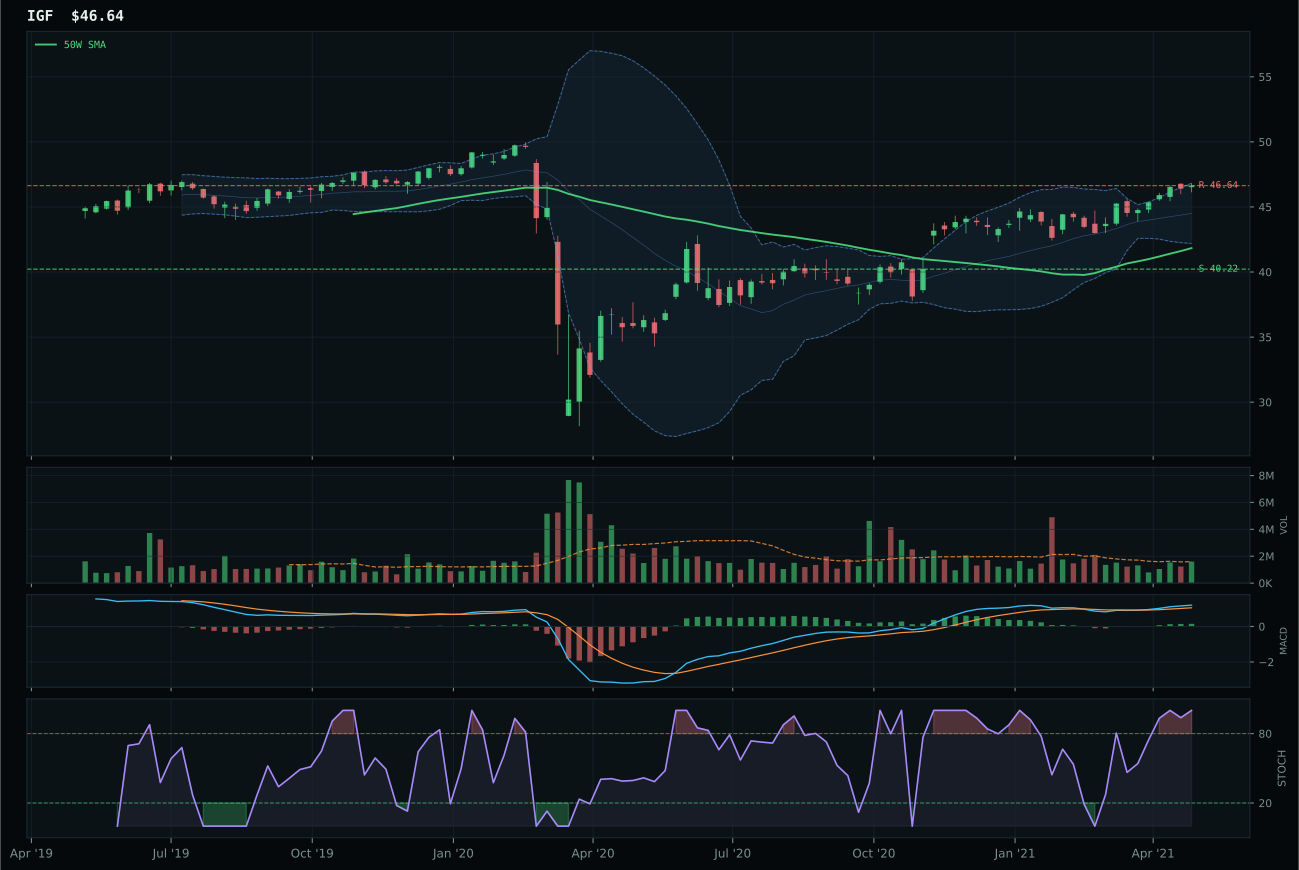
IGF has a neutral structure profile with -3.4% 13-week relative strength versus SPY.
A failed hold above support would weaken the setup.
Actionable but governed by invalidation levels.
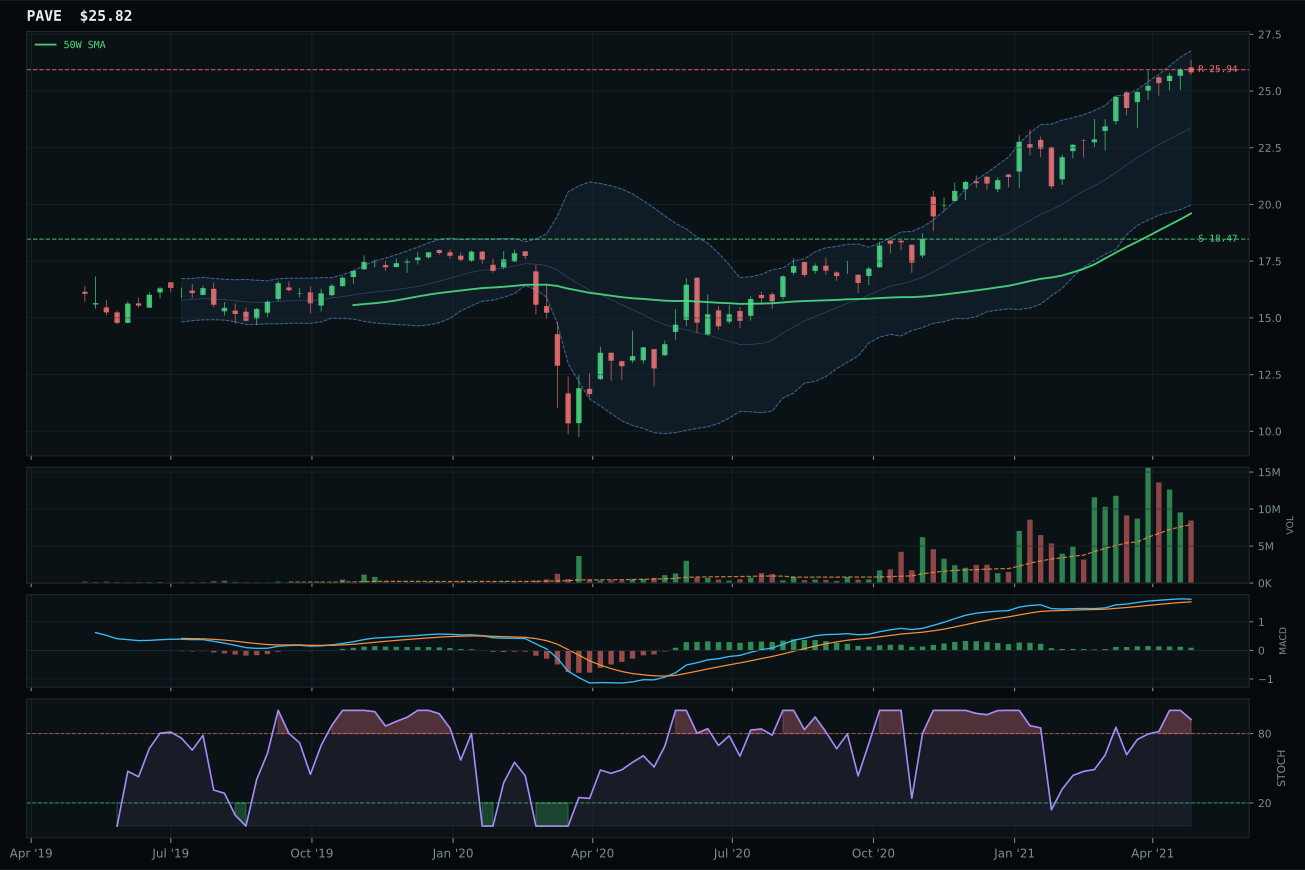
PAVE has a vertical extension profile with 11.4% 13-week relative strength versus SPY.
A failed hold above support would weaken the setup.
Actionable but governed by invalidation levels.
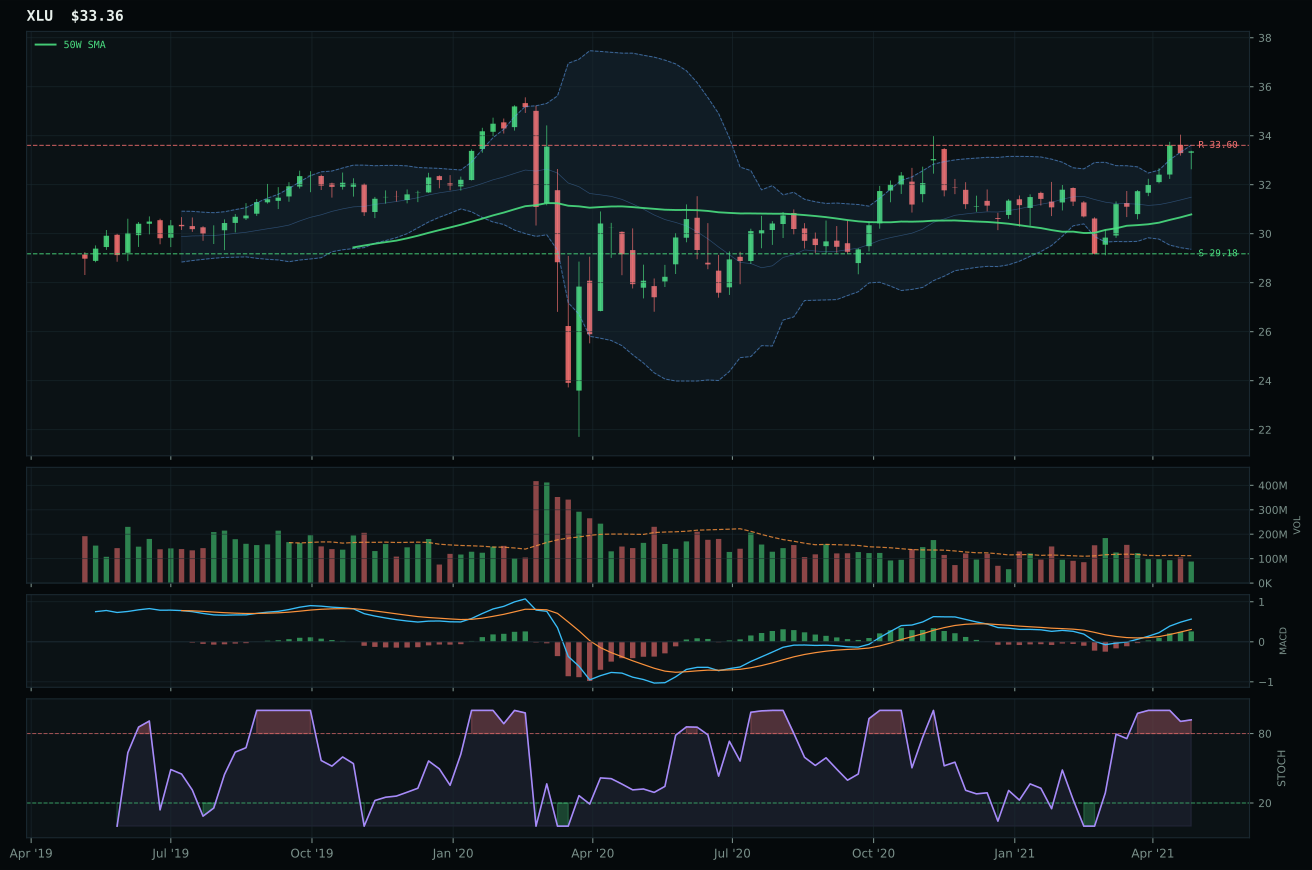
XLU has a neutral structure profile with -5.4% 13-week relative strength versus SPY.
A failed hold above support would weaken the setup.
Actionable but governed by invalidation levels.
XLU claims the category over IGF through superior ETF quality balanced across multiple dimensions rather than a single decisive score. XLU's trend score of 91.9 and bullish-improving MACD position it as a less extended alternative to IGF, which posts a 95.0 trend but carries overbought momentum stochastic RSI (0.87 vs. 0.92). Both trade in neutral structure 8-9% above their 50-week moving averages with near identical SPY-relative weakness, but XLU's stochastic RSI rolling over from overbought offers better forward momentum potential than IGF's overbought momentum state. The -4.7 point category score gap reflects a narrow decision where both candidates are defensively positioned and the winner earns its slot through slightly less toppy technical presentation rather than aggressive outperformance.
Utilities & Infrastructure holds 5% as tier-2 allocation on a 56.5 category score, supported by 48.0 macro fit that reflects mixed signals—Transition/Mixed regime helps the exposure (+4) while inflation pressure penalizes rate sensitivity (-6). The category scores notably lower than other tier-2 candidates, sitting above tier-3 primarily through defensive merit rather than offensive technical or macro strength. Technical evidence of 57.0 for XLU carries weight as regulated utility stability, but relative weakness to SPY and neutral volume confirm this is a capital preservation sleeve rather than a return driver. To advance tier-2, Utilities would require either a sustained risk-off environment that elevates defensive rotation above current levels or technical evidence of accumulation-phase volume that proves long-term players are rotating into infrastructure income. Current allocation reflects portfolio balance—meaningful enough for stability, not compelling enough for growth capital.
Nuclear Energy — URNM
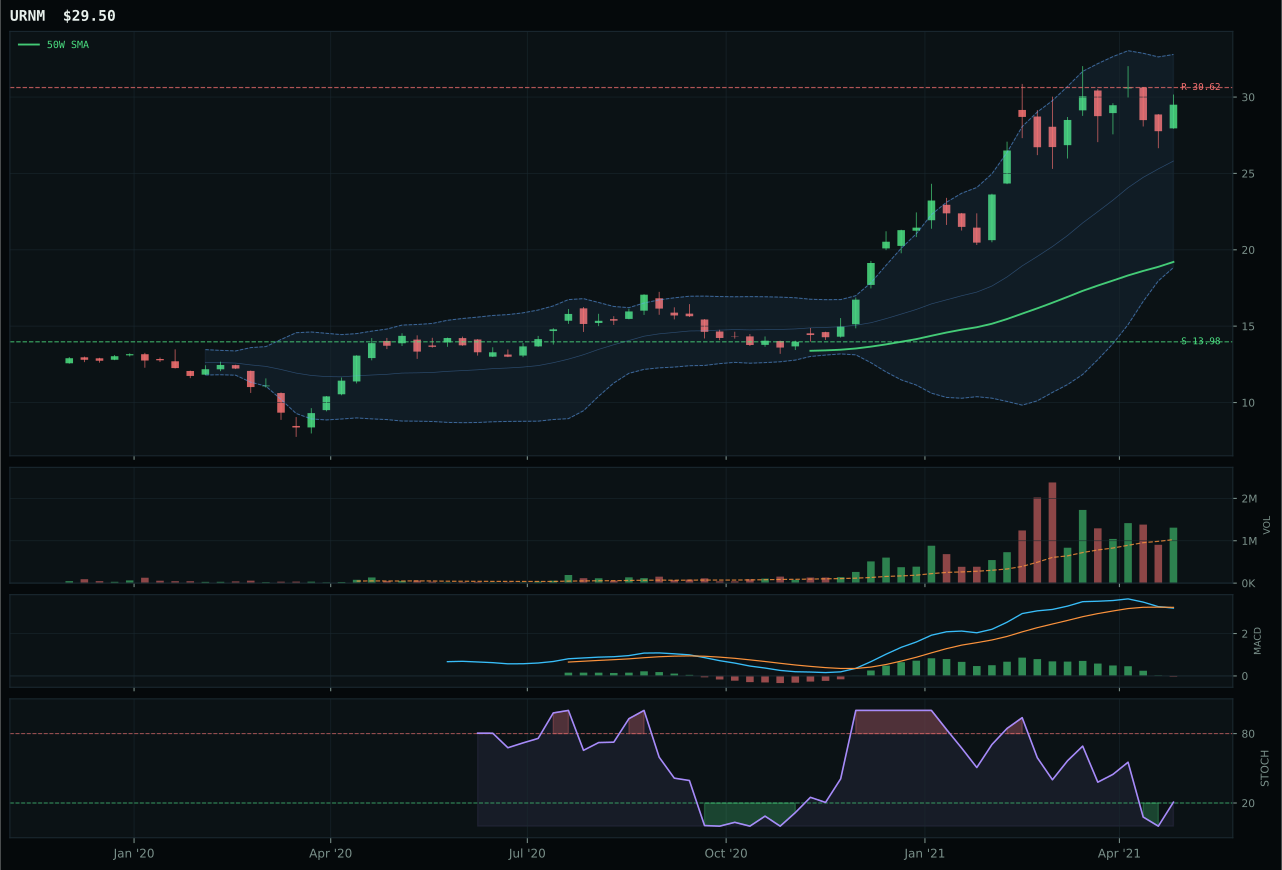
URNM has a vertical extension profile with 31.4% 13-week relative strength versus SPY.
A failed hold above support would weaken the setup.
Actionable but governed by invalidation levels.
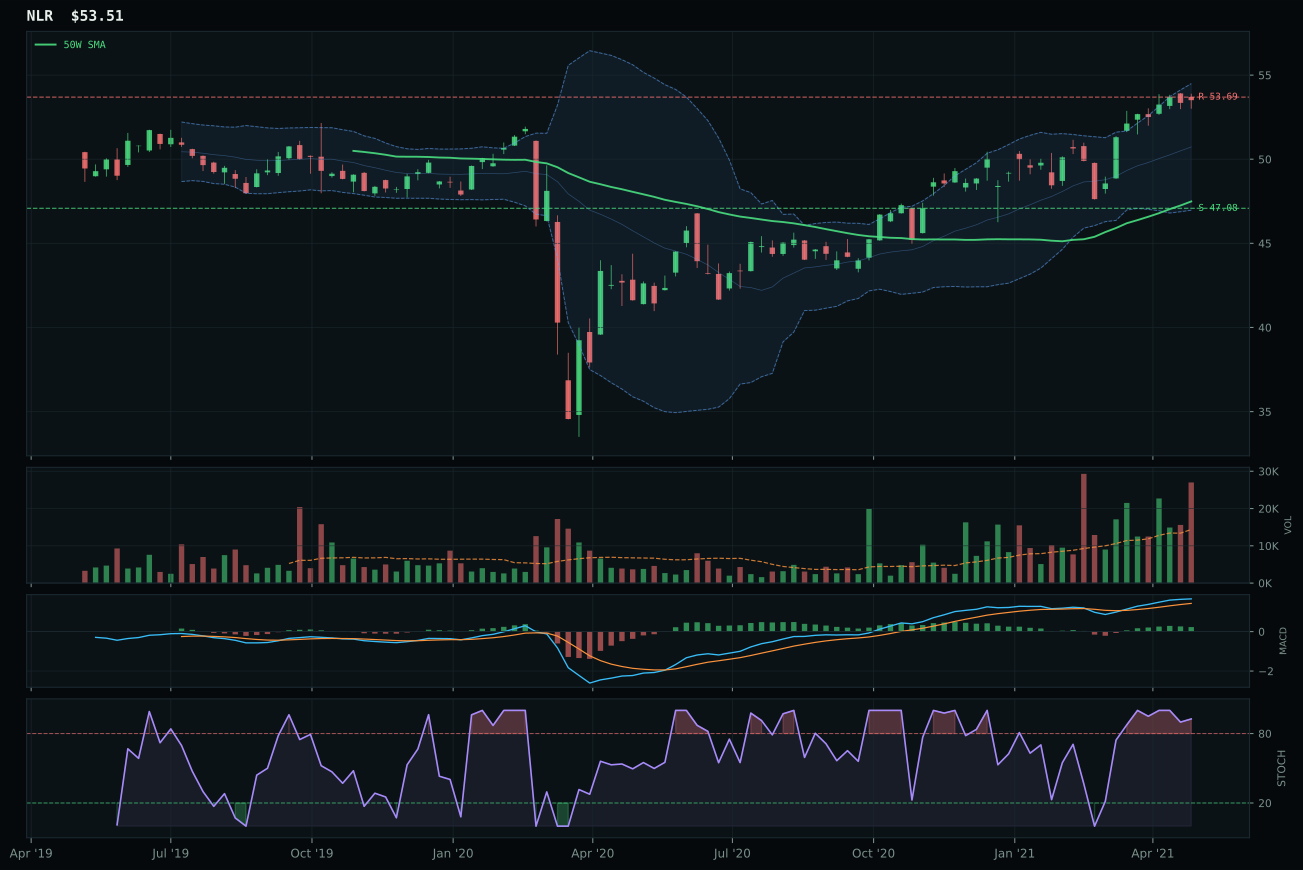
NLR has a neutral structure profile with -2.3% 13-week relative strength versus SPY.
A failed hold above support would weaken the setup.
Tracked, but not top-2 eligible because: .
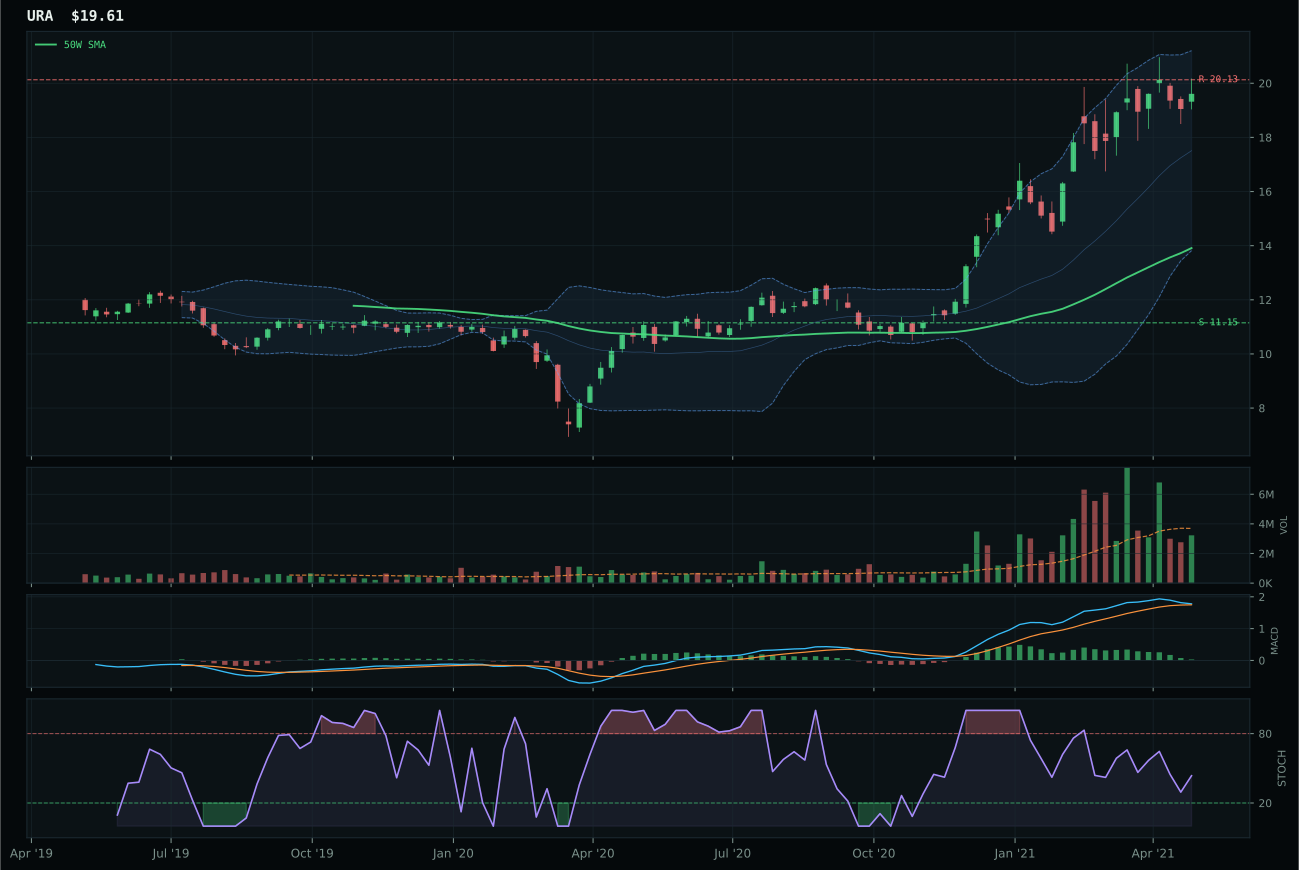
URA has a vertical extension profile with 22.3% 13-week relative strength versus SPY.
A failed hold above support would weaken the setup.
Actionable but governed by invalidation levels.
URNM defeats NLR on category-relative strength (9.1% vs. -24.6%), a decisive 33.7-point swing that proves market breadth is favoring uranium-miner leverage over nuclear utilities in this cycle. Both exhibit 100.0 momentum confirmation, yet URNM's above-average volume participation at 1.27x the 20-week average and persistence of 92.8 distinguish it from NLR's accumulation/confirmation setup. Price extends 53.6% above URNM's 50-week moving average versus NLR's near 52-week high structure, yet URNM's stochastic RSI falling/neutral combined with bearish/weakening MACD suggests exhaustion is imminent—the only reason it wins is that NLR is meaningfully worse on relative strength. This is a decision between two technically stretched candidates where the one with better SPY-relative outperformance claims the prize.
Nuclear Energy holds 5% as tier-2 allocation on a 51.5 category score, capturing 64.0 macro fit driven by energy scarcity active (+9) and real asset sponsorship active (+7). The technical evidence of 44.9 for URNM reflects the category's fundamental weakness: despite 31.4% SPY-relative return and 44.1% 13-week performance, the setup is deteriorating (MACD bearish/weakening, stochastic falling/neutral) and risk/reward is punitive at 30.6 due to 111.1% downside to support. This allocation is pure macro optionality—positioning for nuclear's energy security narrative in an inflationary, supply-constrained world—without conviction that the technical setup will sustain. To advance tier-2, URNM would require MACD improvement and stochastic RSI reset higher; current positioning reflects a calculated real-asset bet at disciplined portfolio weights rather than technical endorsement.
Precious Metals — SLV
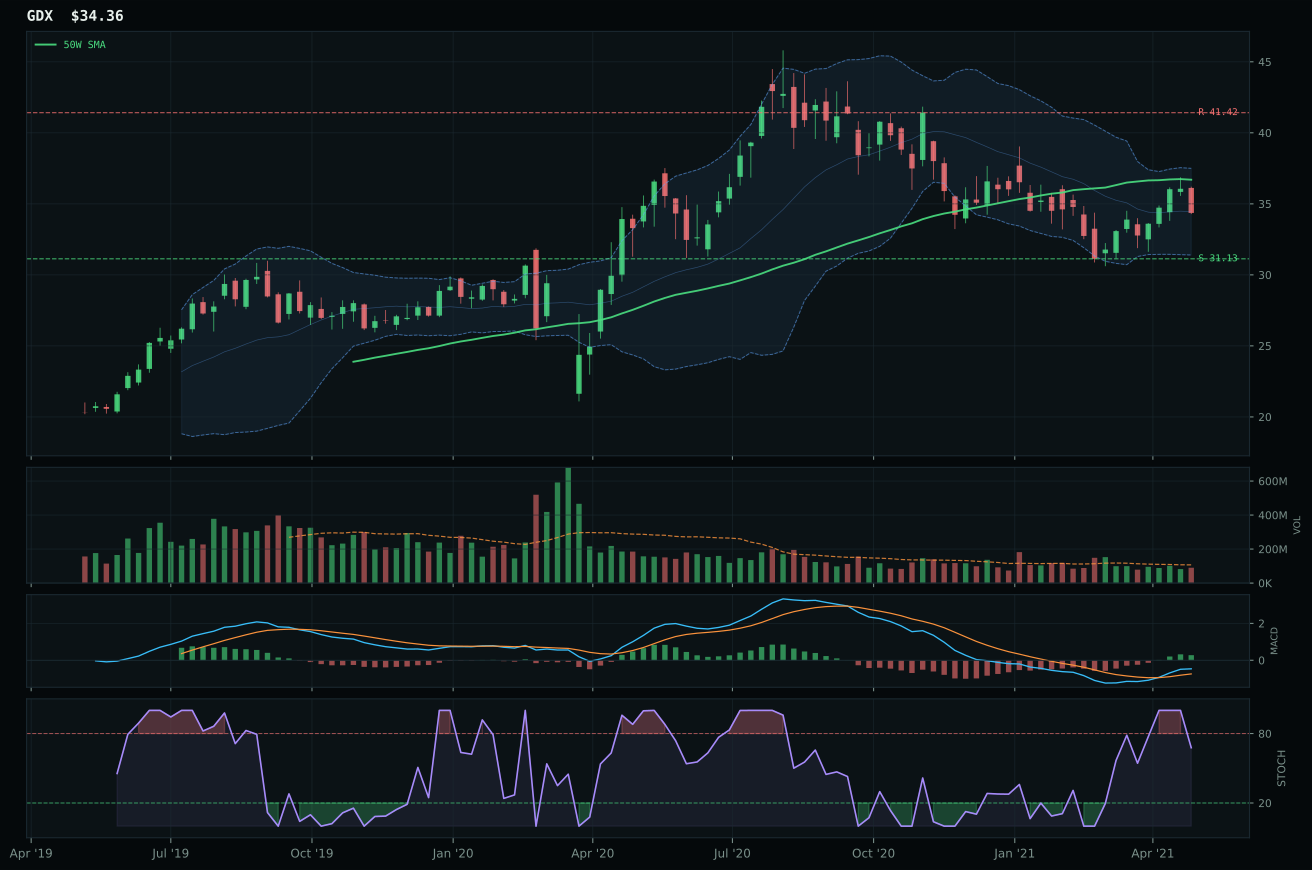
GDX has a neutral structure profile with -13.2% 13-week relative strength versus SPY.
A failed hold above support would weaken the setup.
Actionable but governed by invalidation levels.
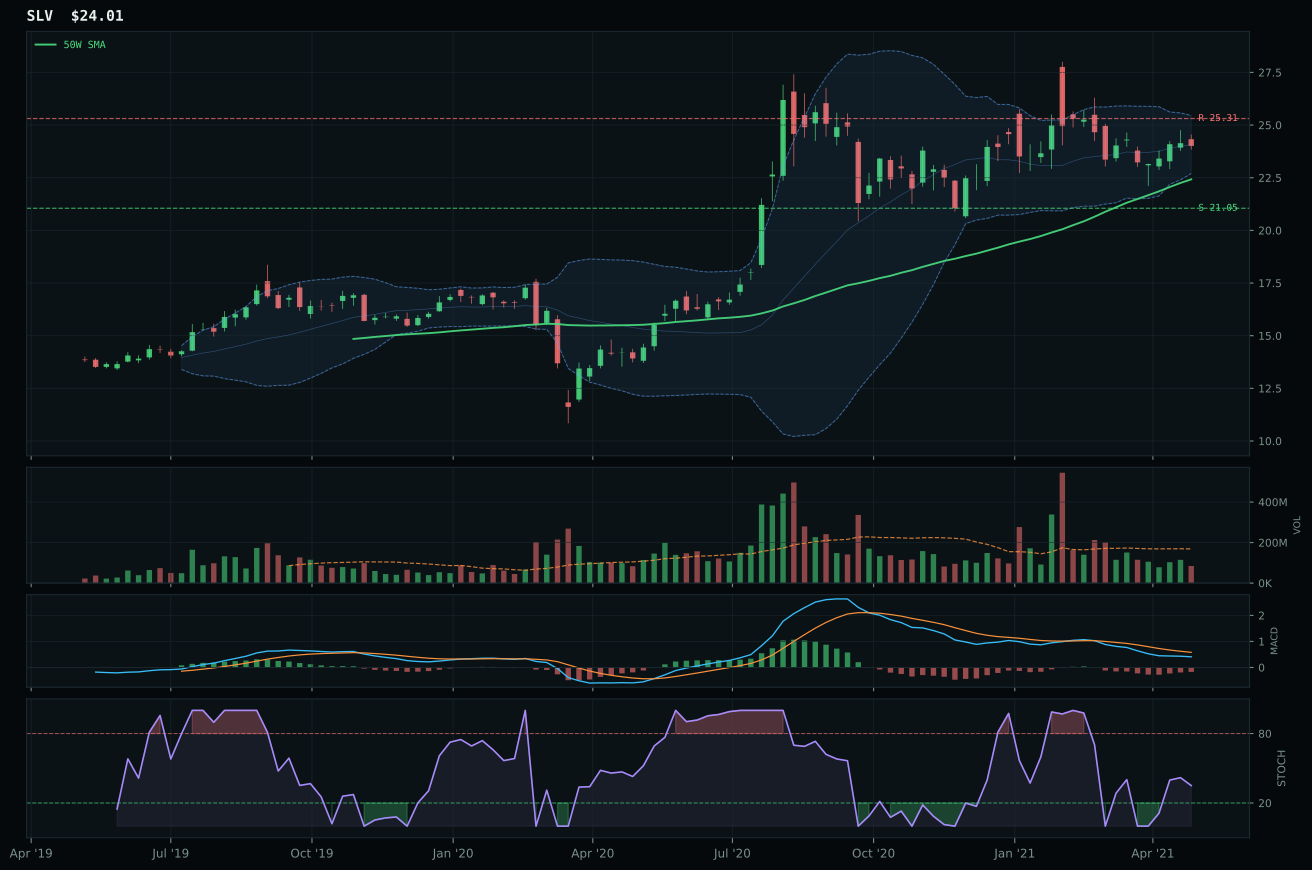
SLV has a neutral structure profile with -16.7% 13-week relative strength versus SPY.
A failed hold above support would weaken the setup.
Actionable but governed by invalidation levels.
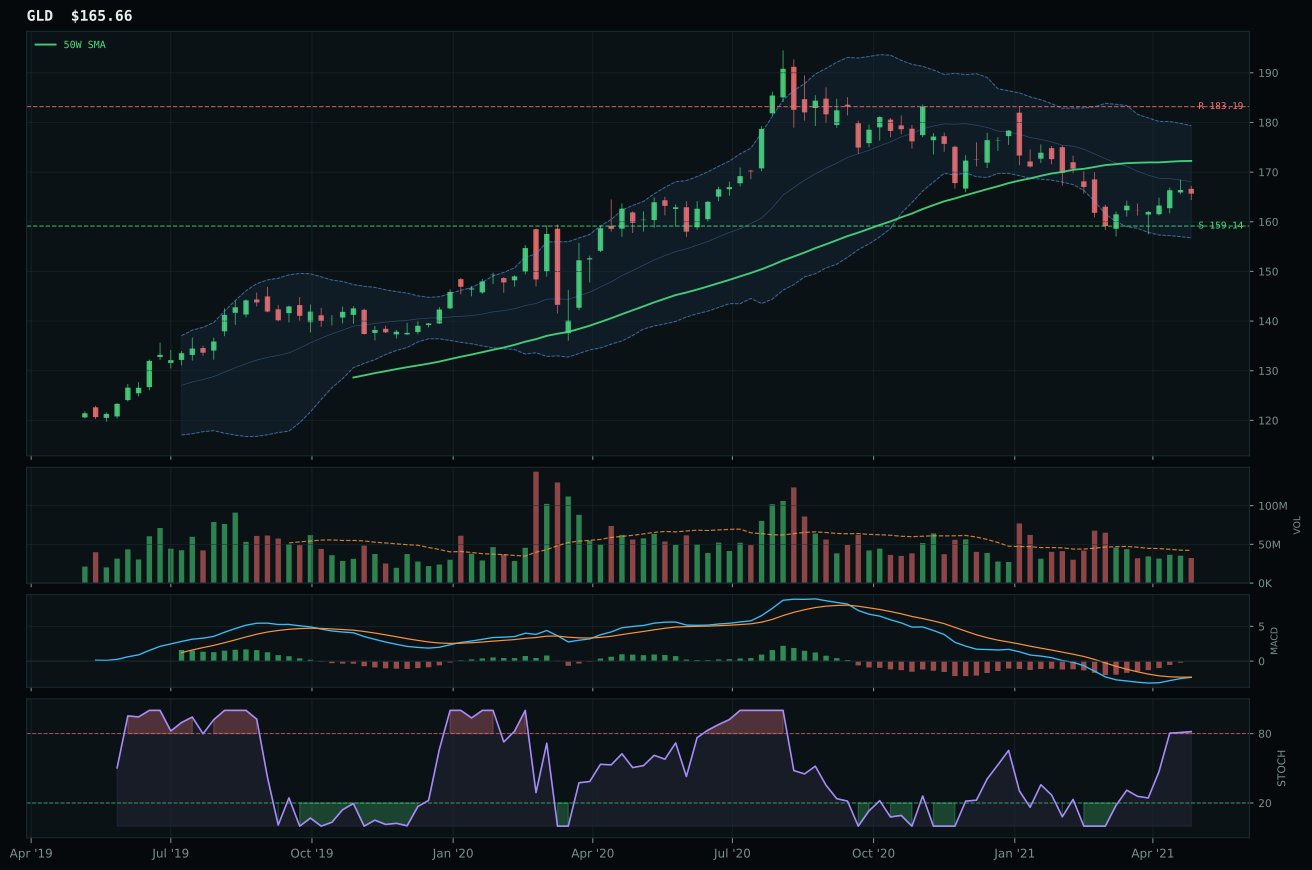
GLD has a pullback into support profile with -16.8% 13-week relative strength versus SPY.
A failed hold above support would weaken the setup.
Actionable but governed by invalidation levels.
SLV prevails over GDX on a marginal 1-point timing edge (83.0 vs. 82.0), with the decisive factor being stochastic RSI positioning: SLV's mid-zone rise at 0.35 offers better forward momentum potential than GDX's falling/neutral reading at equivalent oversold levels. Both ETFs sit 7-8% above their 50-week moving averages in neutral structure, but SLV's category-relative strength of 0.0% matches the median while GDX lags at -13.2% SPY-relative performance. The MACD divergence is telling: SLV bearish but improving provides a coiling setup, while GDX bullish and improving appears more extended into the momentum cycle. This is a tight decision reflecting a weak category overall—neither candidate carries strong conviction, and the 4-point gap to GDX masks that SLV won primarily by NOT deteriorating as quickly.
Precious Metals holds 5% as tier-2 allocation despite a 47.4 category score, supported by 62.0 macro fit driven by metals scarcity active (+7) and inflation pressure active (+5). The technical evidence of 55.5 carries less weight in this regime; metals are benefiting from real asset sponsorship and supply shortage dynamics rather than pure technical momentum. The category score sits below the tier-1 threshold because relative strength to SPY remains deeply negative across all three candidates, and volume participation is thin across the board—this is a macro call, not a technical breakout. To advance tier-2, Precious Metals would require either SPY-relative outperformance that proves institutions are rotating into hedges or volume confirmation that accumulation is broadening beyond tactical players. Current allocation reflects macro optionality at a reasonable portfolio weight.
Defense & Aerospace — ITA
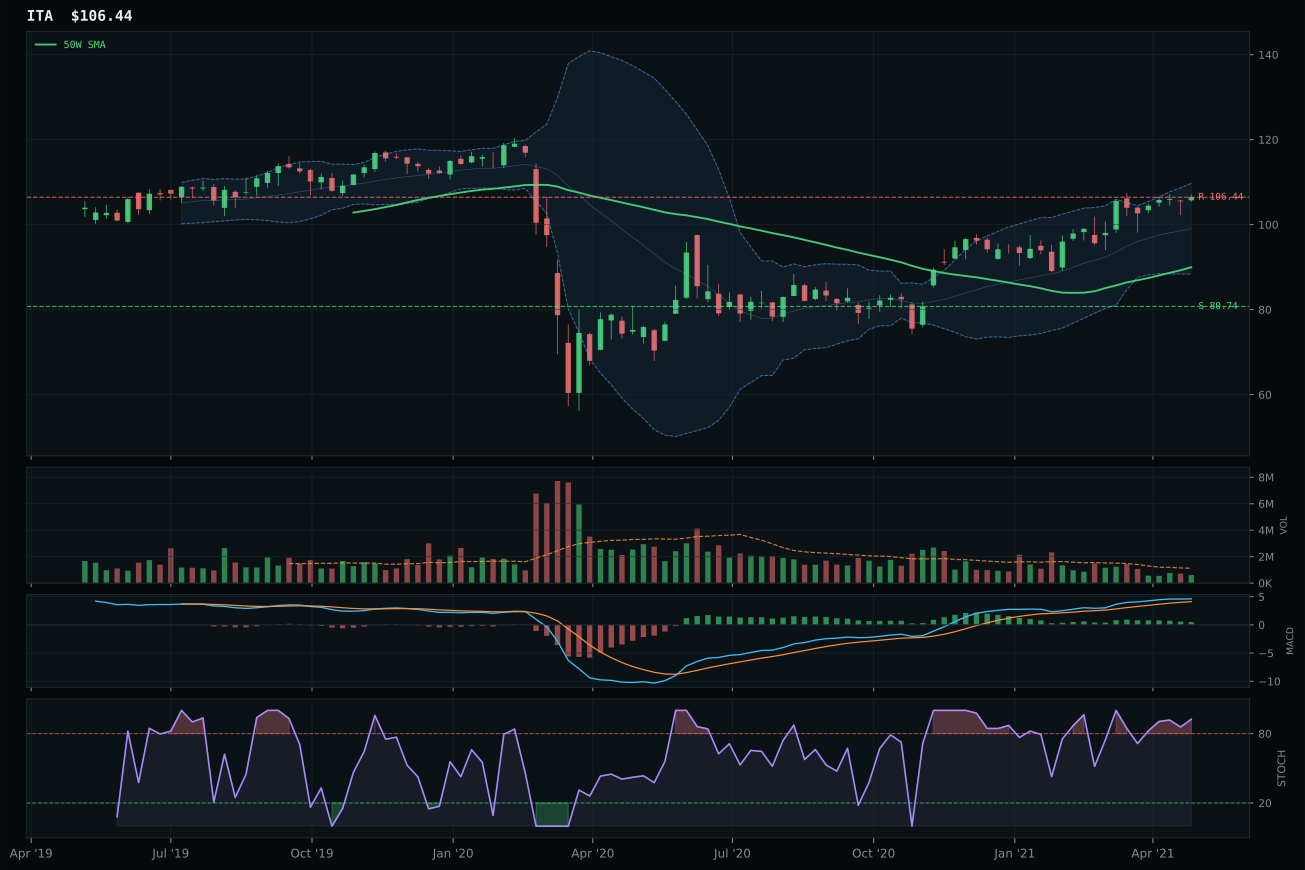
ITA has a vertical extension profile with 6.7% 13-week relative strength versus SPY.
A failed hold above support would weaken the setup.
Actionable but governed by invalidation levels.
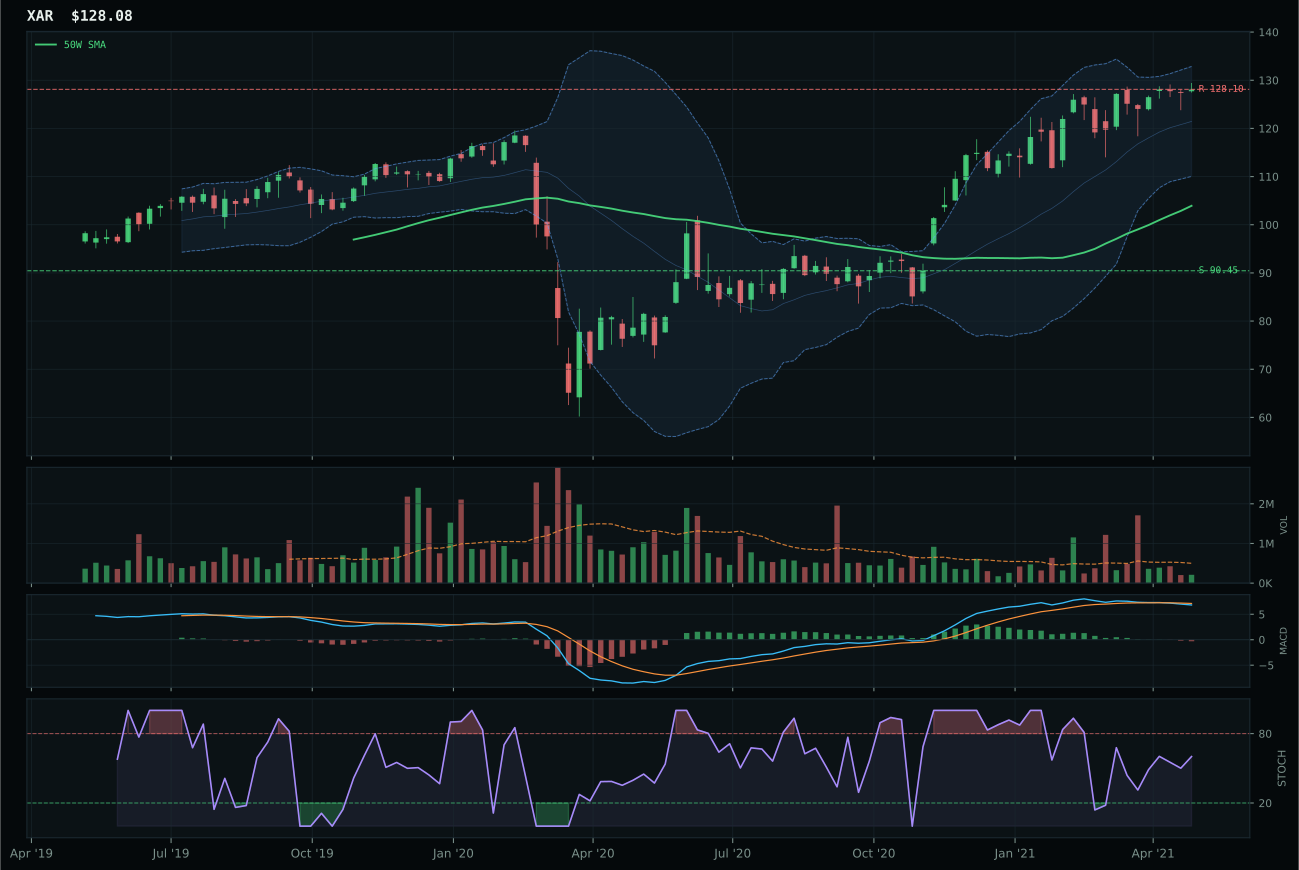
XAR has a vertical extension profile with 1.8% 13-week relative strength versus SPY.
A failed hold above support would weaken the setup.
Actionable but governed by invalidation levels.
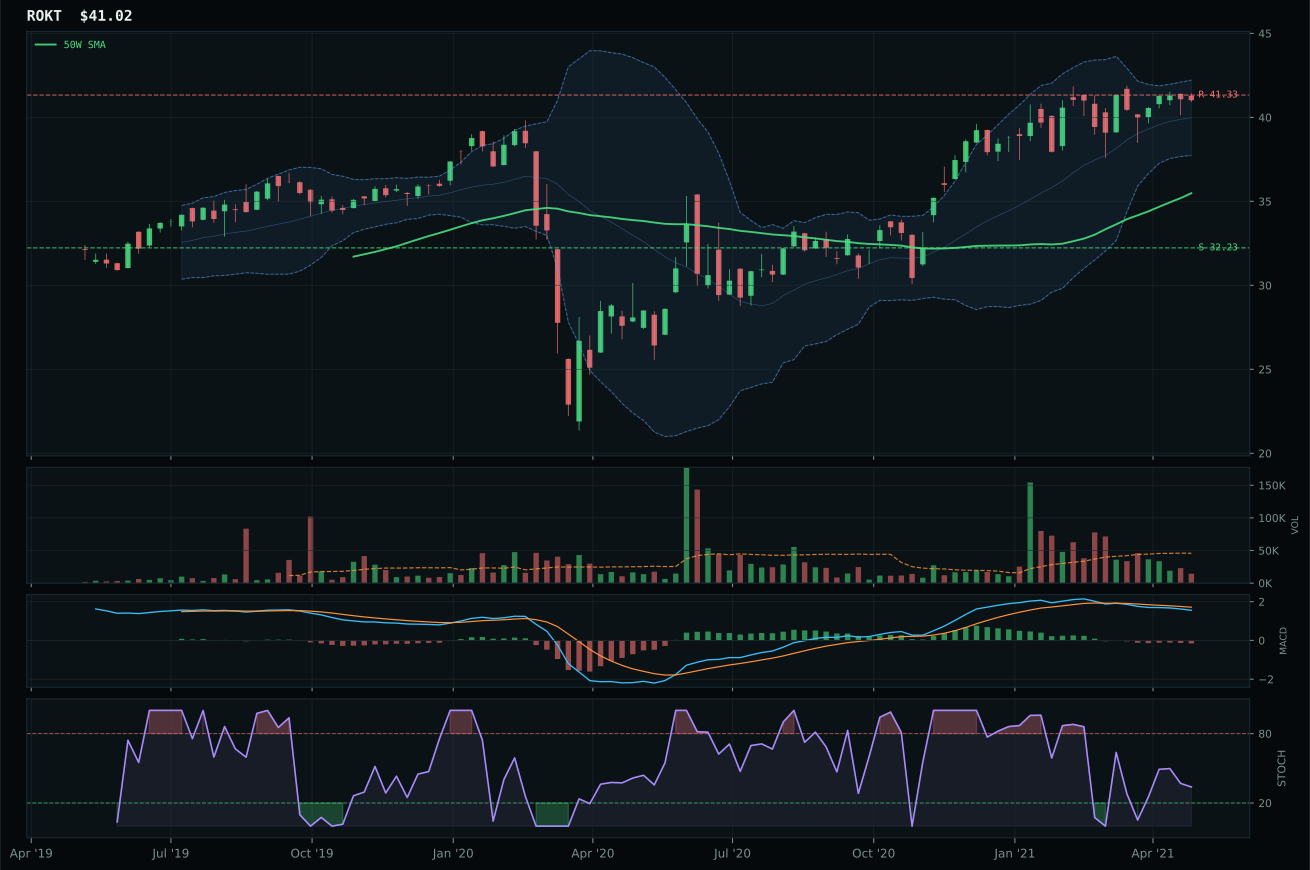
ROKT has a vertical extension profile with -4.7% 13-week relative strength versus SPY.
A failed hold above support would weaken the setup.
Tracked, but not top-2 eligible because: .
ITA dominates the category with a perfect 100.0 trend score—price sits above both the 50-week and 200-week moving averages with a 0.8% positive slope while posting 6.7% relative strength versus SPY, the only positive SPY-relative return in this portfolio snapshot. The vertical extension setup at 18.3% above the 50-week moving average normally punishes entry risk, but momentum confirmation of 91.8 and volume-price persistence of 82.5 prove this is accumulation rather than exhaustion. XAR lost the decision because its MACD deteriorated to bearish/weakening while stochastic RSI rolled into falling/neutral—a technical divergence that betrays momentum fade despite similar extension levels. The 13.6-point category score gap reflects XAR's structural weakness: category-relative strength of 0.0% versus ITA's 4.9% means ITA is the only candidate winning within its own three-ETF basket.
Defense & Aerospace holds 5% as a tier-2 allocation despite posting a solid 43.6 category score, subordinate only to the two top-2 categories by rank. The category macro fit of 55.0 benefits from Transition/Mixed regime helping the exposure (+3) and credit stress turning mildly supportive (+2)—a rational fit for duration and stability in an uncertain environment. Technical evidence of 65.9 for the representative carries weight but yields to higher-scoring categories; the setup's vertical extension penalizes fresh entry even as bullish fundamentals support the longer-term thesis. To advance to top-2, Defense & Aerospace would require either a pullback that resets extension levels or a decisive SPY-relative outperformance that lifts category-relative strength decisively positive. Current positioning reflects defensive merit: holding the allocation without pushing it into preferred capital deployment tiers.
Technology — CIBR
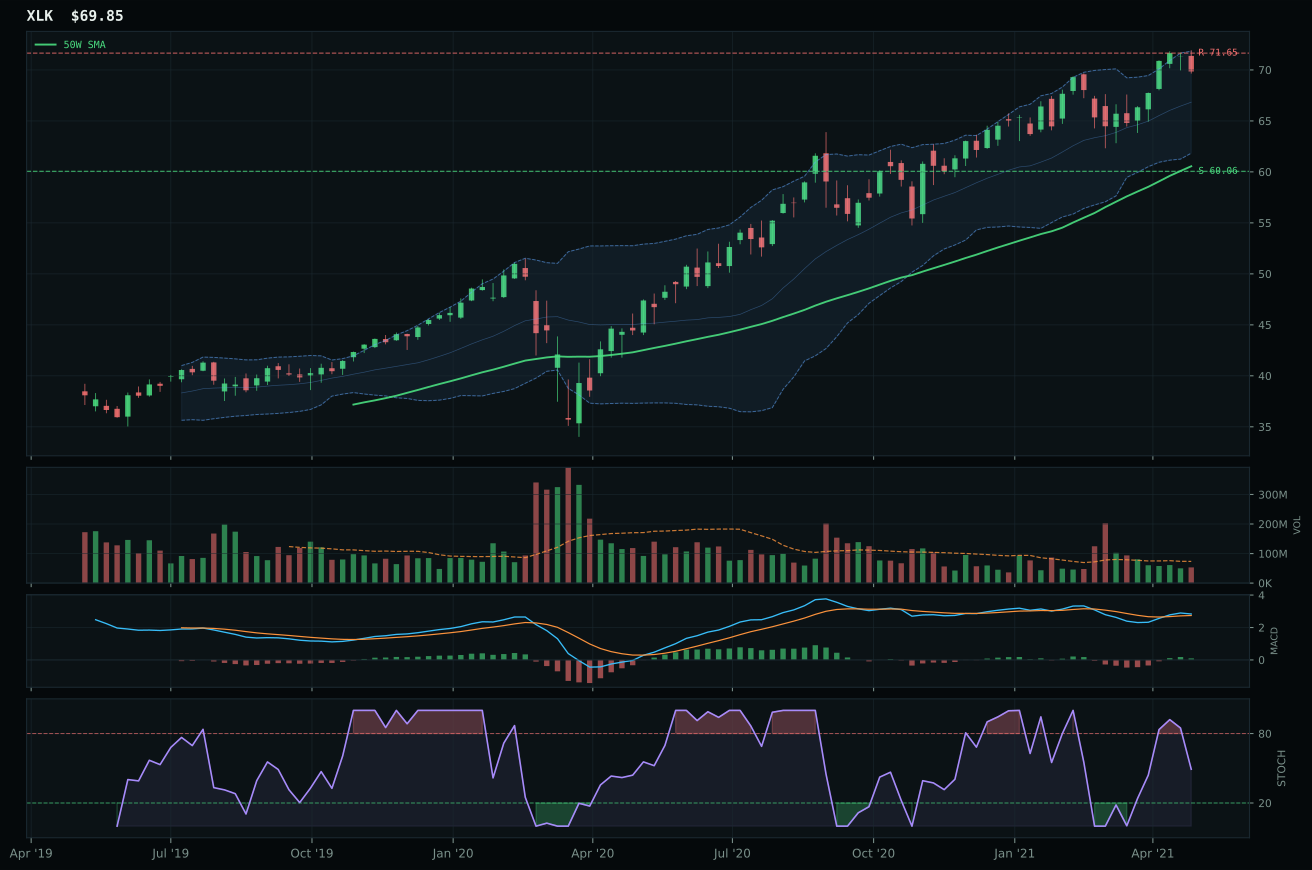
XLK has a vertical extension profile with -4.4% 13-week relative strength versus SPY.
A failed hold above support would weaken the setup.
Actionable but governed by invalidation levels.
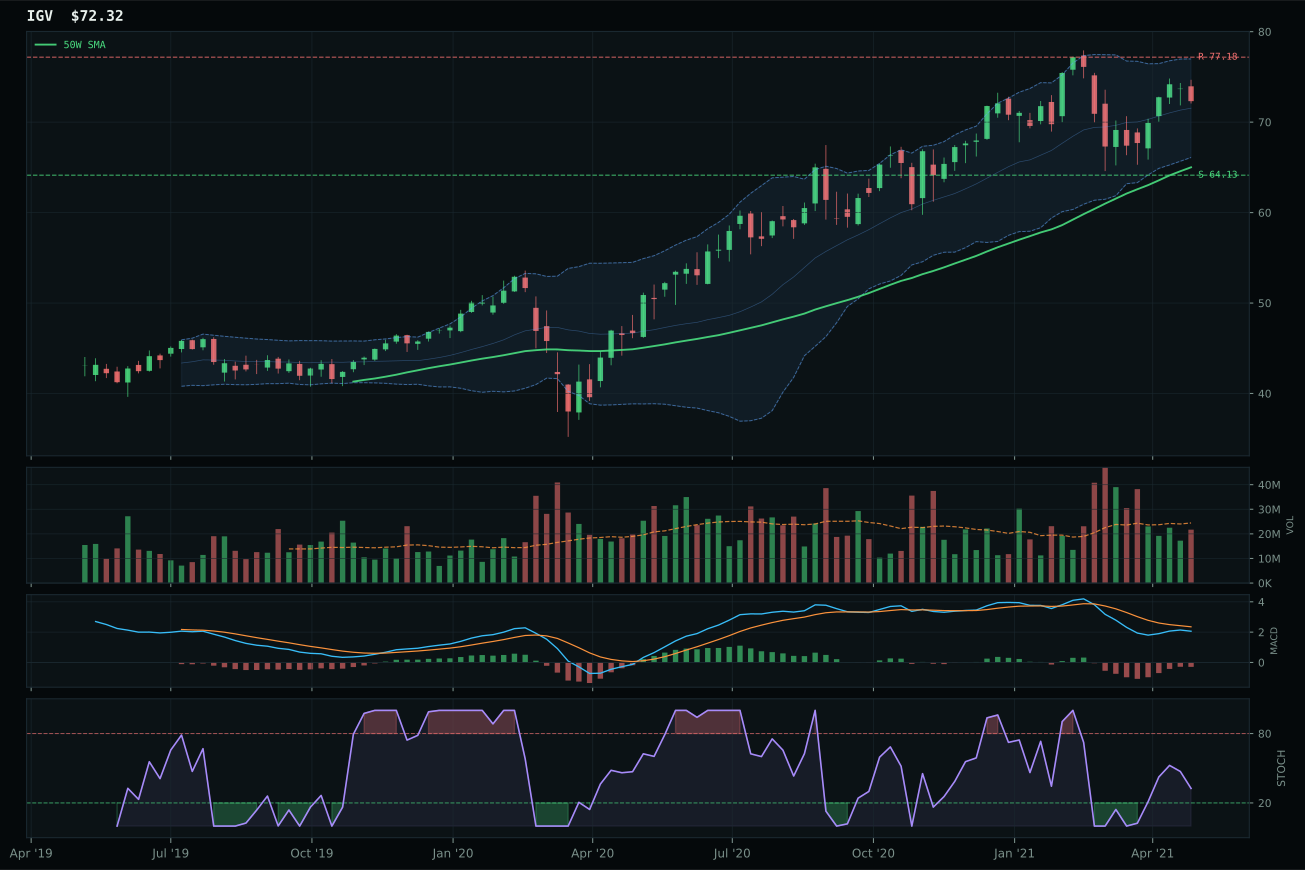
IGV has a neutral structure profile with -9.1% 13-week relative strength versus SPY.
A failed hold above support would weaken the setup.
Actionable but governed by invalidation levels.
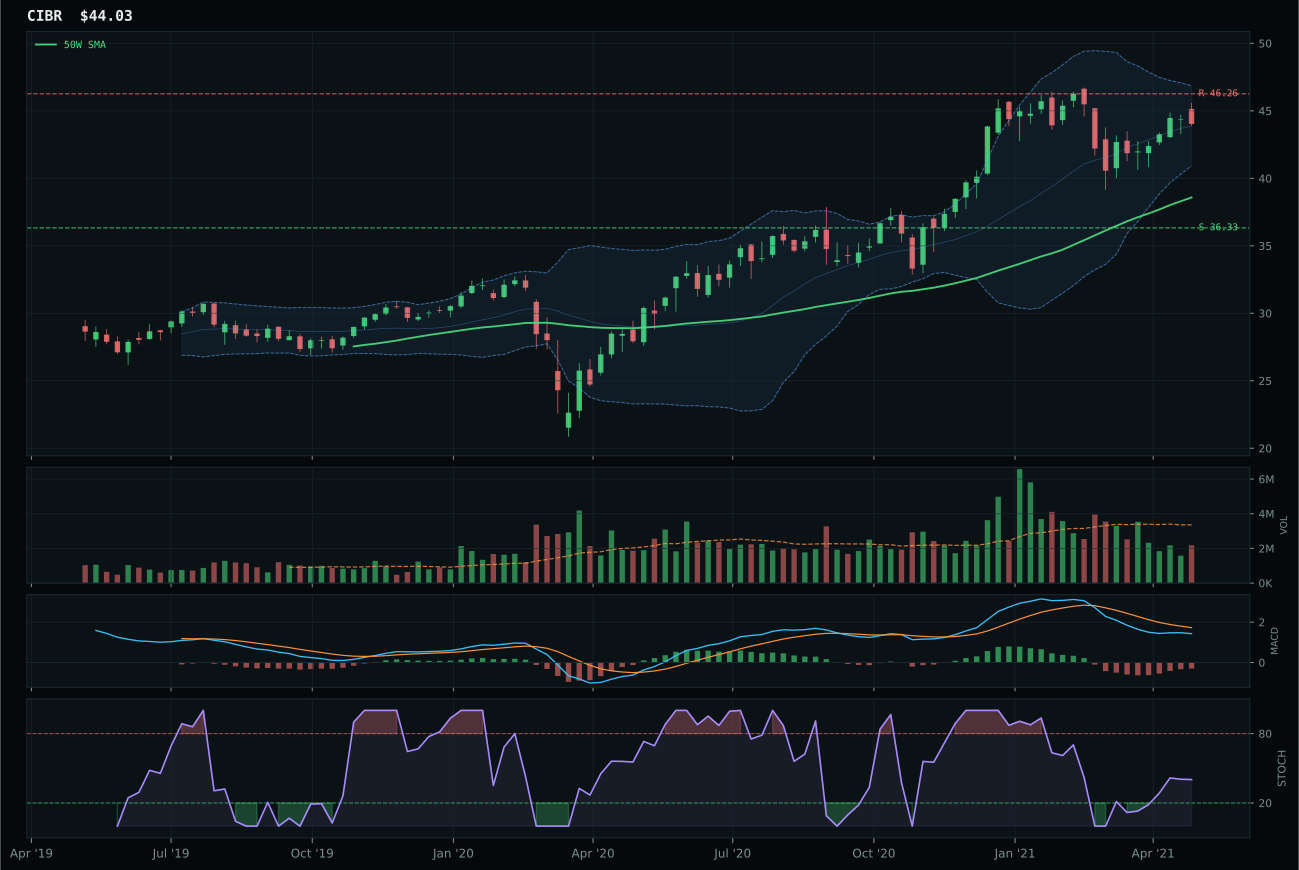
CIBR has a neutral structure profile with -12.5% 13-week relative strength versus SPY.
A failed hold above support would weaken the setup.
Actionable but governed by invalidation levels.
CIBR wins the category on a narrow technical edge over XLK, with a timing score of 83.0 versus XLK's 45.0 serving as the decisive separator. The cybersecurity ETF trades 14.1% above its 50-week moving average with neutral structure and stochastic RSI rising from the mid-zone, positioning it as a measured mean-reversion candidate rather than an extended momentum chase. XLK's vertical extension setup combined with falling/neutral stochastic RSI betrays late-stage buying despite its bullish MACD—a classic timing divergence where momentum strength cannot sustain price where every new buyer arrives stretched. The 2.7-point category score gap reflects a clean decision driven by CIBR's superior timing architecture and better risk-reward positioning at 49.1 versus XLK's 39.8.
Technology earned 5% allocation as a tier-2 category rank, reflecting its technical fragility in a Transition/Mixed macro regime where credit stress and inflation pressure actively penalize growth leverage. The category's 36.6 composite score sits squarely outside top-2 consideration, held back by persistent SPY-relative weakness across all three ETF candidates and thin participation volume that signals conviction skepticism. For Technology to justify elevation, timing scores would need to sustain above 70 across the dominant representative for multiple weeks while relative strength versus SPY turns meaningfully positive—currently the category is accepting defensive allocations on the margin rather than commanding capital. The allocation acknowledges cybersecurity's subtle technical merit without granting it capital priority in an environment where real assets and supply constraints dominate scoring.
AI — BOTZ
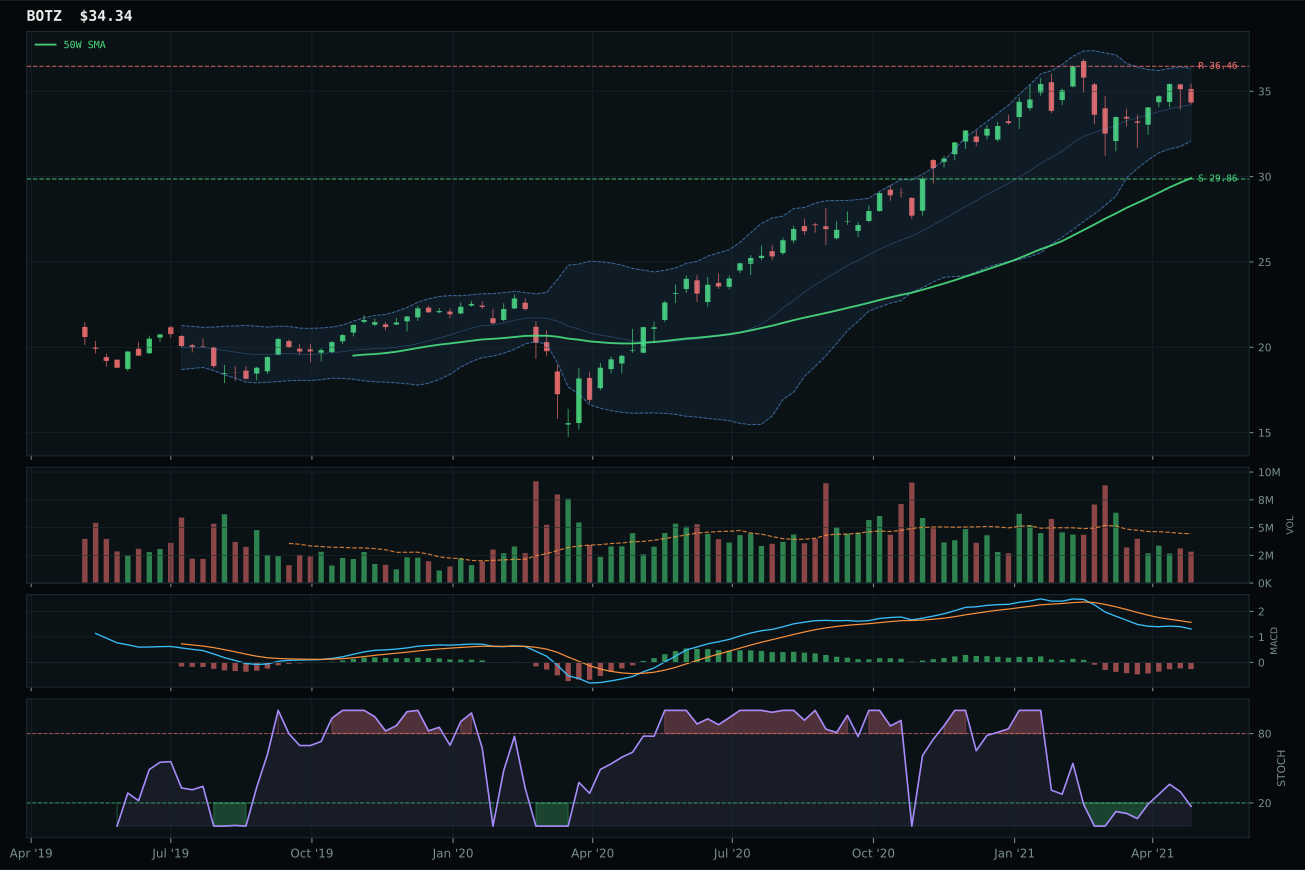
BOTZ has a neutral structure profile with -11.3% 13-week relative strength versus SPY.
A failed hold above support would weaken the setup.
Actionable but governed by invalidation levels.
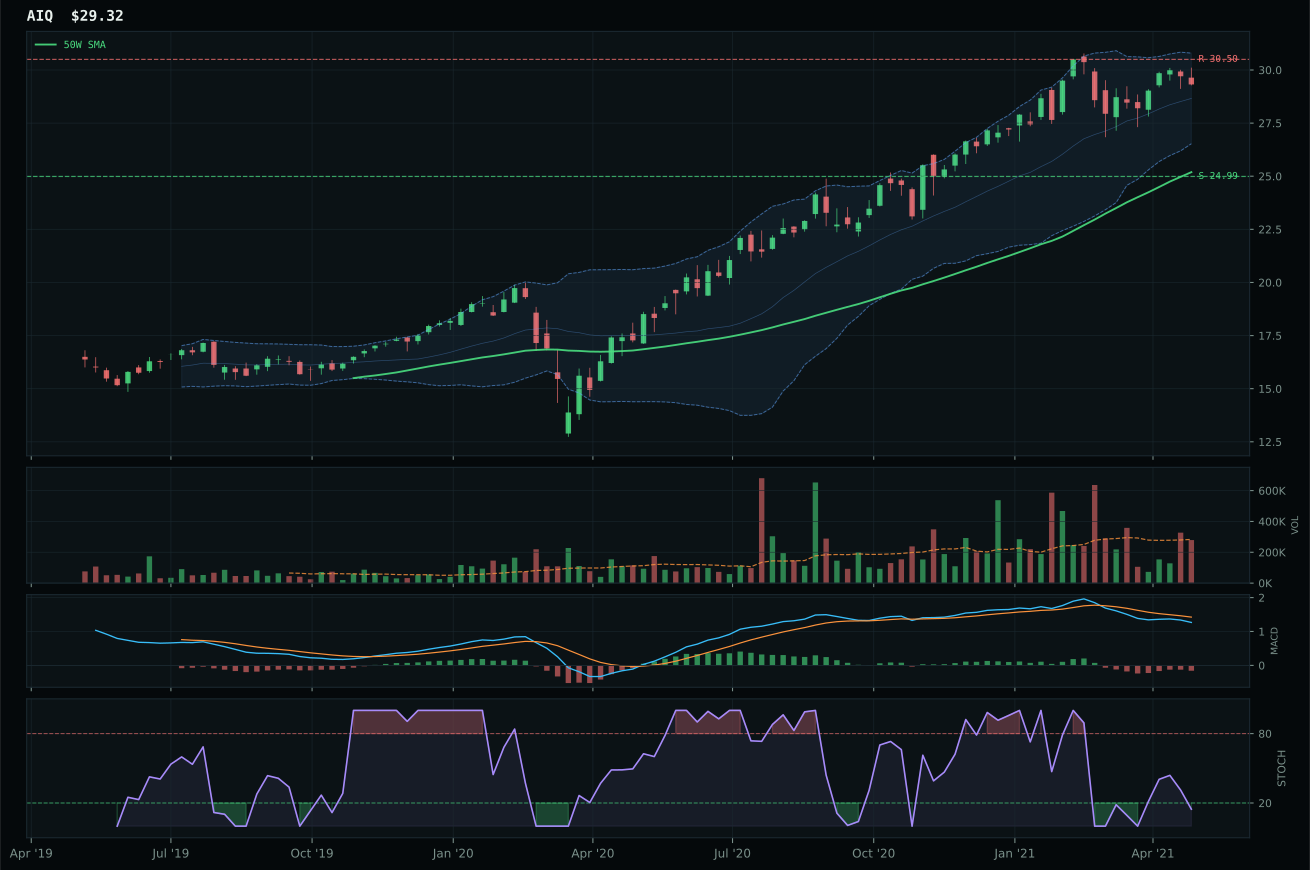
AIQ has a vertical extension profile with -6.7% 13-week relative strength versus SPY.
A failed hold above support would weaken the setup.
Tracked, but not top-2 eligible because: .
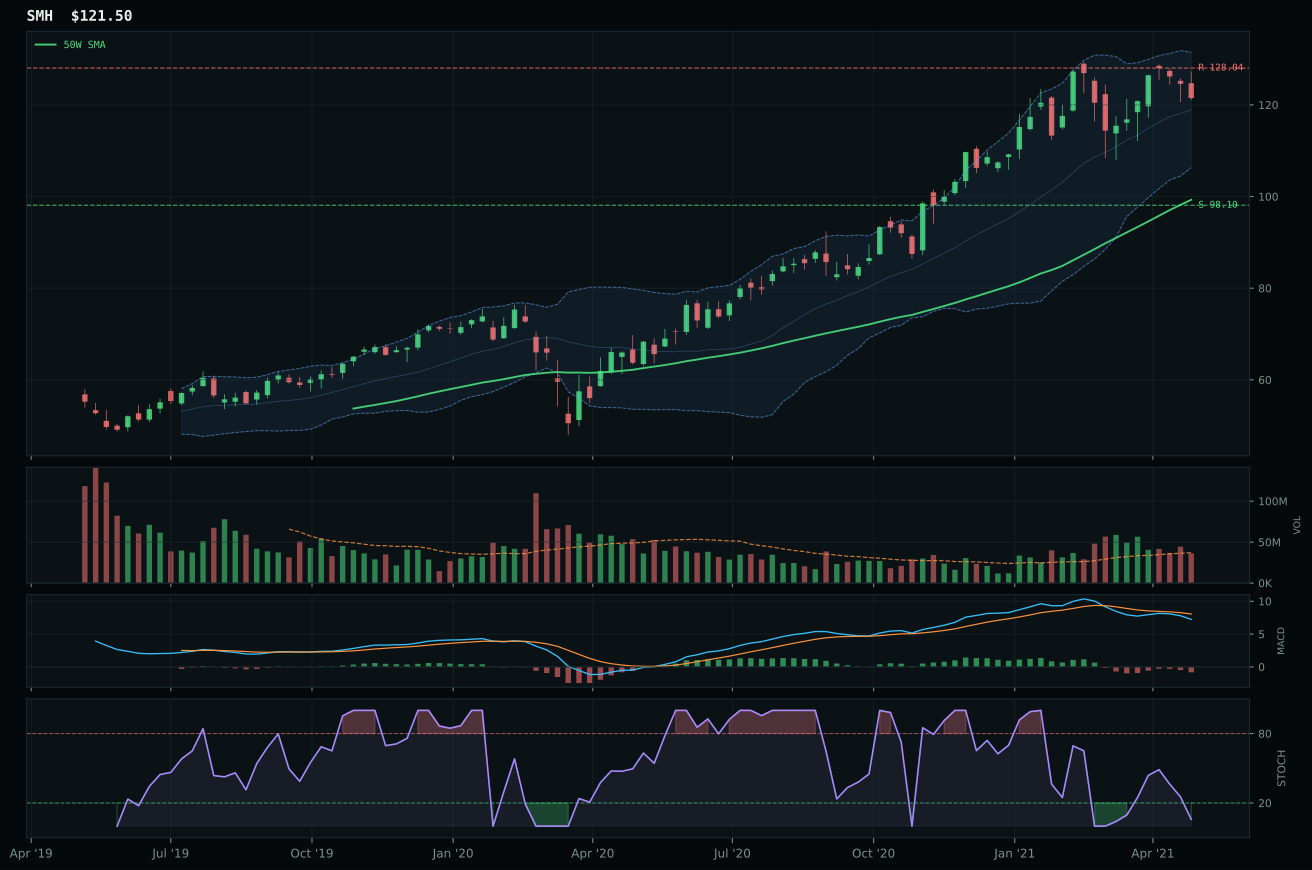
SMH has a vertical extension profile with -5.5% 13-week relative strength versus SPY.
A failed hold above support would weaken the setup.
Actionable but governed by invalidation levels.
BOTZ defeats AIQ on a 31.5-point score gap that translates to fundamental category weakness masquerading as a category decision—this is not a competition between two strong candidates but a choice between the less damaged option and structural collapse. BOTZ's timing score of 75.0 edges AIQ's 53.0, and its oversold stochastic RSI (0.17) offers slightly better technical footing than AIQ's equivalent position, yet both ETFs carry momentum confirmation scores in the low-20s, signaling that recent price action lacks volume conviction. Robotics robotics and physical AI face the same macro headwinds as the broader AI category: credit stress is active and penalizing all exposure, leaving BOTZ as merely the winner of a weak field. The setup is neutral structure across the board, but only because both candidates are treading water—neither has earned accumulation-phase volume or SPY-relative outperformance.
AI received 0% allocation this week, ranked 9th or 10th, and rightfully sits outside the portfolio. The category's 27.7 score reflects a systematic failure to build conviction in either technical setup or macro narrative fit—credit stress is actively depressing the category at -8 basis points, and no descriptor strongly favors AI in a transition regime. The 51.0 technical evidence score for BOTZ combined with 44.0 macro fit yields a composite that cannot compete against categories posting 60+ scores across both dimensions. For AI to earn a slot, either credit stress would need to turn neutral or technical representatives would need to demonstrate clean volume accumulation and SPY-relative breakouts sustained over multiple weeks. Until one of those conditions holds, the category remains allocation-ineligible despite BOTZ's marginal technical edges.
Emerging Markets — ILF
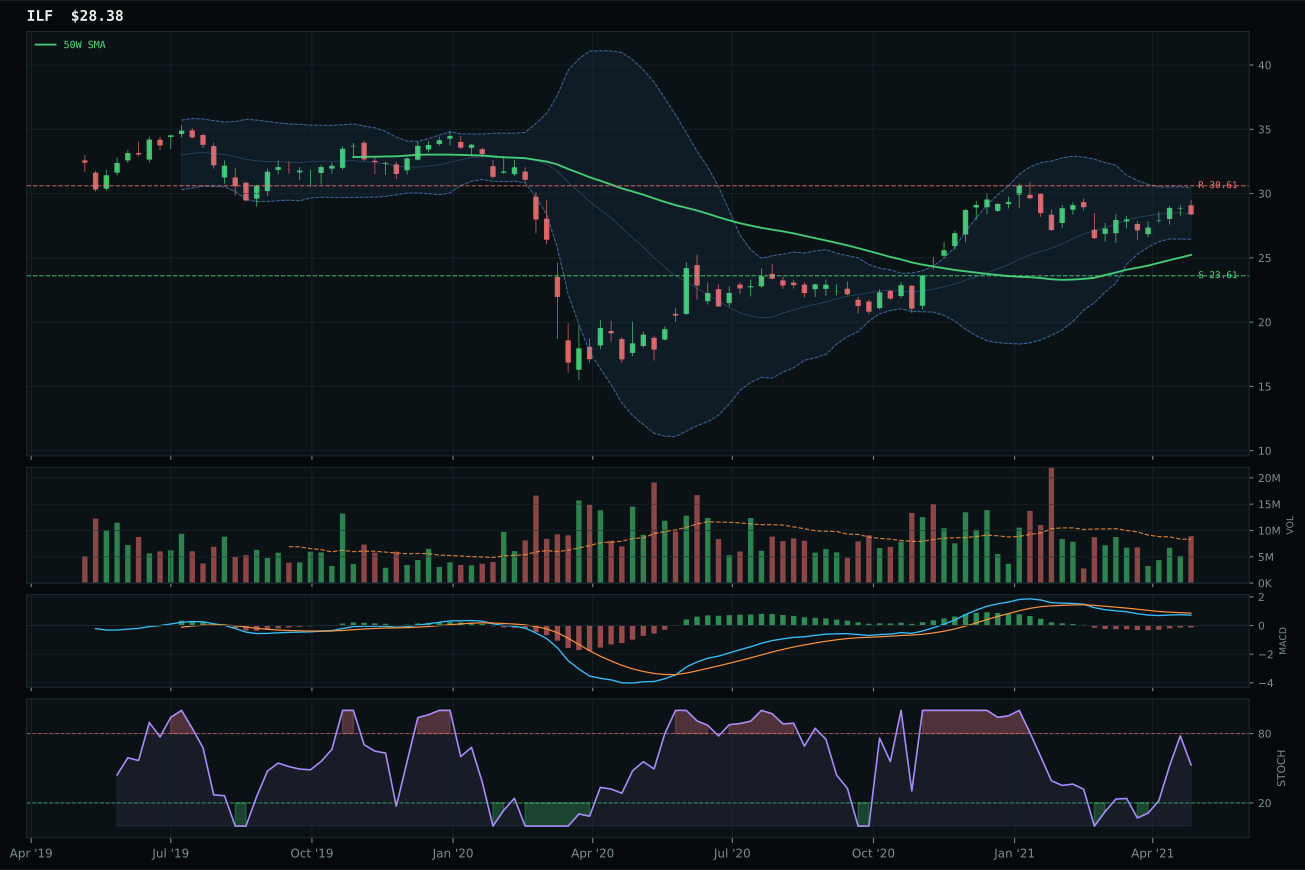
ILF has a neutral structure profile with -8.3% 13-week relative strength versus SPY.
A failed hold above support would weaken the setup.
Actionable but governed by invalidation levels.
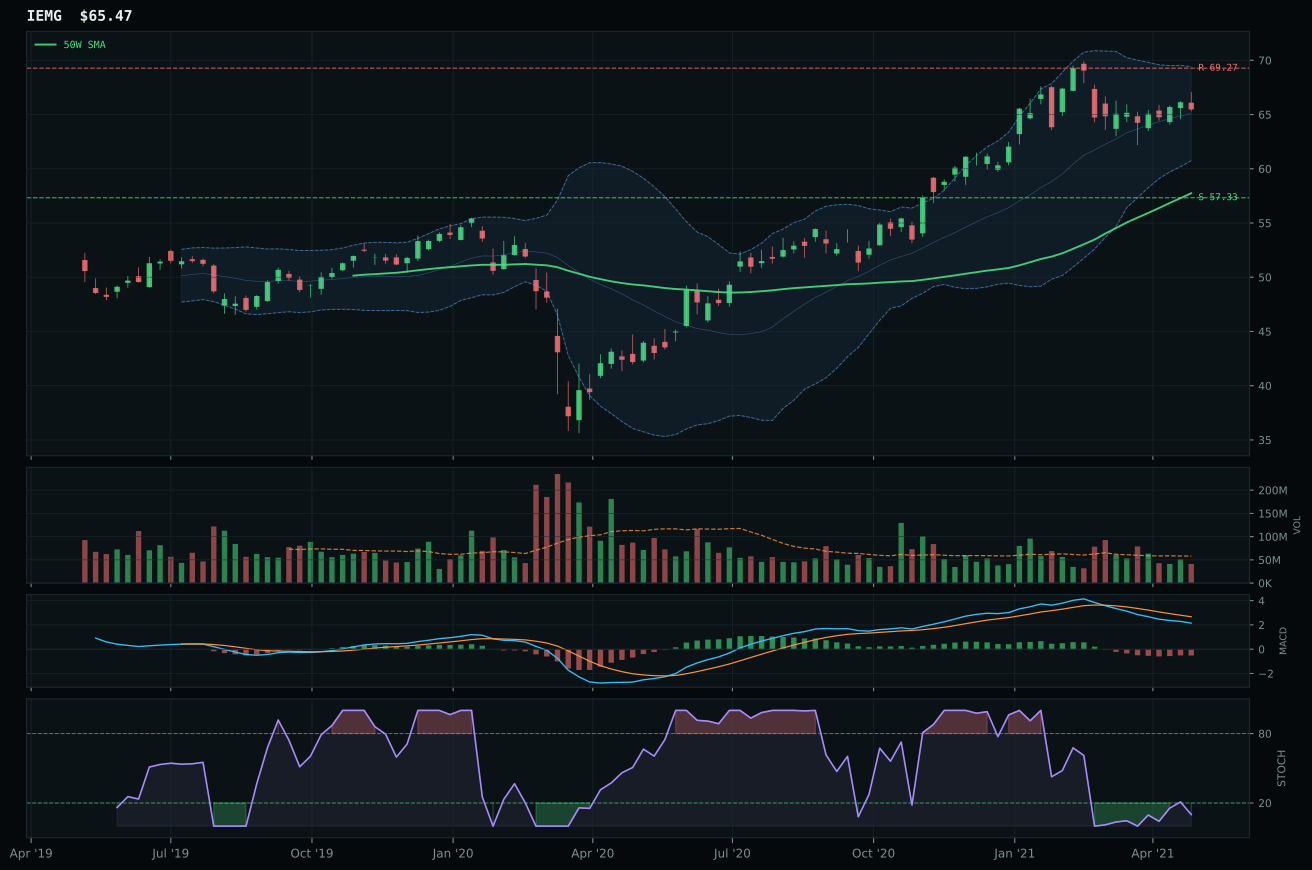
IEMG has a neutral structure profile with -10.2% 13-week relative strength versus SPY.
A failed hold above support would weaken the setup.
Actionable but governed by invalidation levels.
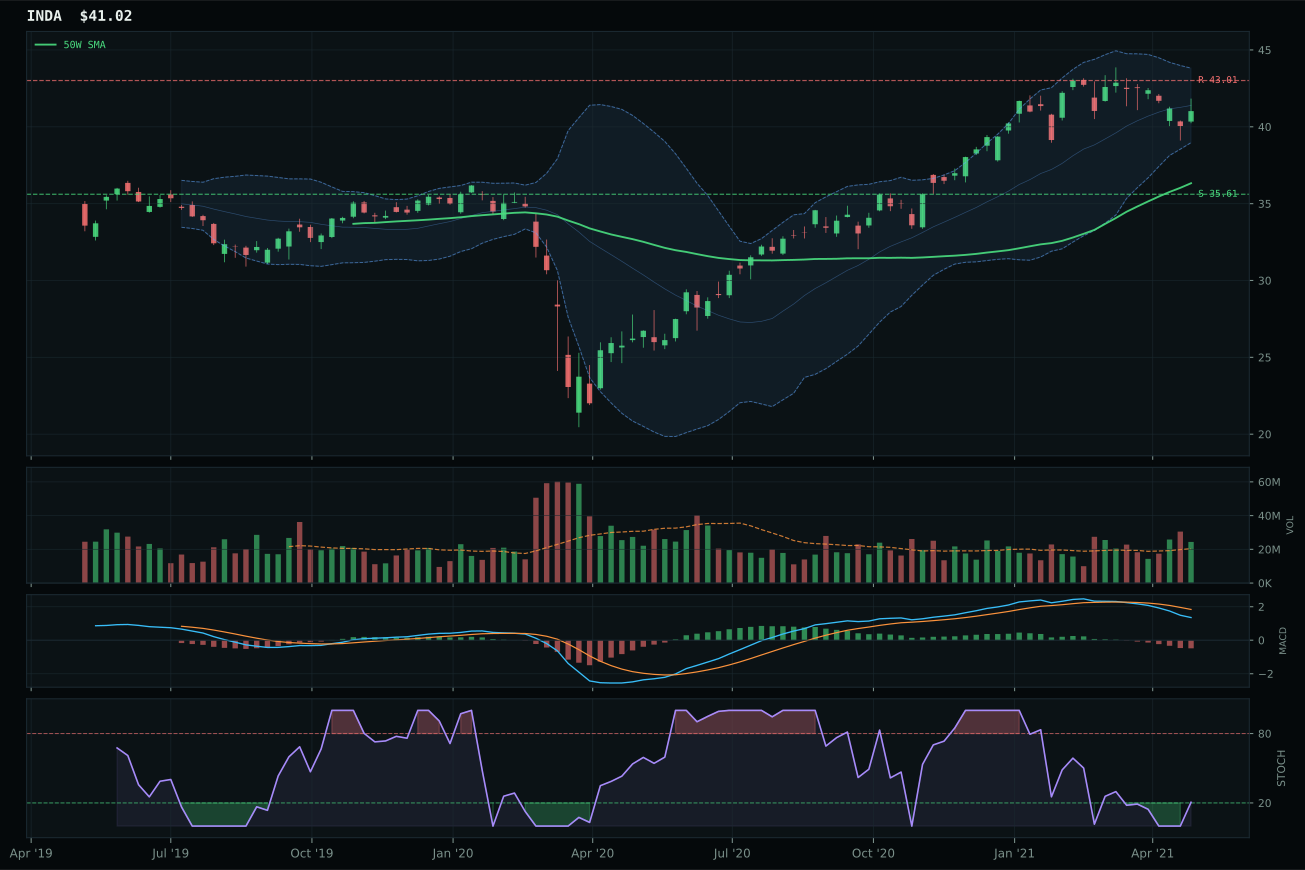
INDA has a neutral structure profile with -8.0% 13-week relative strength versus SPY.
A failed hold above support would weaken the setup.
Actionable but governed by invalidation levels.
ILF edges IEMG on cleaner structure (75.6 vs. 72.4) and superior stochastic RSI positioning (rising mid-zone at 0.53 vs. oversold turn-up), despite ILF's -3.9 point score gap placing it well outside top-2 consideration. Both Latin American and broad emerging-market exposure carry bearish but improving MACD with neutral volume, signaling recovery consolidation rather than active accumulation. ILF's momentum confirmation of 48.7 trails IEMG's 35.0, and category-relative strength of 0.0% versus IEMG's -1.9% awards the marginal edge to Latin America's commodity sensitivity. This category decision is entirely academic—the representative choice matters far less than the fact that Emerging Markets failed to build enough technical or macro conviction to earn portfolio allocation.
Emerging Markets received 0% allocation, ranked outside the portfolio on a 26.7 category score that reflects systematic weakness across all three technical candidates and damaging macro headwinds. Credit stress is active at -10 basis points, creating a direct headwind for risk assets in a transition regime where capital is consolidating toward real assets and rate-sensitive defensives. The technical evidence of 60.7 for ILF combined with 66.0 macro fit yields a composite too weak to compete against categories posting 60+ across both dimensions simultaneously. Broad emerging markets carry 13-week returns of only 2.6% for IEMG versus 40%+ in industrial metals, proving market breadth is not rotating toward EM risk. To earn allocation, Emerging Markets would require SPY-relative outperformance that proves institutional capital is seeking emerging-market beta, combined with MACD and volume confirmation across the representative ETF. Neither condition holds currently, justifying the 0% allocation.