
2021-04-23
Informational purposes only. The content in this report, including allocations, analysis, and commentary, is provided solely for informational and educational purposes. It does not constitute financial advice, investment advice, trading advice, or any other type of advice. Past performance does not guarantee future results. Always conduct your own research and consult a qualified financial professional before making investment decisions.
Weekly Allocation
| Ticker | Category | Weight | Role |
|---|---|---|---|
| FSOL | 50% | Overlay | |
| WEAT | Agriculture & Livestock | 10% | Top-2 (10%) |
| COPX | Industrial Metals | 10% | Top-2 (10%) |
| XLE | Traditional Energy | 5% | Tier-2 (5%) |
| XLU | Utilities & Infrastructure | 5% | Tier-2 (5%) |
| URA | Nuclear Energy | 5% | Tier-2 (5%) |
| SLV | Precious Metals | 5% | Tier-2 (5%) |
| ITA | Defense & Aerospace | 5% | Tier-2 (5%) |
| IGV | Technology | 5% | Tier-2 (5%) |
Trade Instructions — Monday Open
Sell the tranche from 2021-03-26 (completing its 4-week hold). Buy the new tranche. Instructions show net portfolio changes — same-asset positions cancel, weight changes show the delta.
| Action | Ticker | Instruction |
|---|---|---|
| SELL | XLE | Sell 12% of XLE position (reduce 10.00% → 8.75%) |
| SELL | PICK | Sell 67% of PICK position (reduce 3.75% → 1.25%) |
| SELL | PAVE | Sell entire PAVE position (1.25% of portfolio) |
| SELL | MOO | Sell 33% of MOO position (reduce 3.75% → 2.50%) |
| SELL | XLK | Sell 33% of XLK position (reduce 3.75% → 2.50%) |
| SELL | SMH | Sell 33% of SMH position (reduce 3.75% → 2.50%) |
| BUY | XLU | Buy XLU — 14.29% of freed cash (adds 1.25% to portfolio) |
| BUY | COPX | Buy COPX — 28.57% of freed cash (adds 2.50% to portfolio) |
| BUY | ITA | Buy ITA — 14.29% of freed cash (adds 1.25% to portfolio) |
| BUY | WEAT | Buy WEAT — 28.57% of freed cash (adds 2.50% to portfolio) |
| BUY | IGV | Buy IGV — 14.29% of freed cash (adds 1.25% to portfolio) |
Current Portfolio After Trade
Combined holdings across all 4 active tranches. Each tranche is 25% of the portfolio.
| Ticker | % of Portfolio | Weight Bar |
|---|---|---|
| FSOL | 50.00% | |
| XLE | 8.75% | |
| XLU | 6.25% | |
| URNM | 5.00% | |
| COPX | 5.00% | |
| SLV | 3.75% | |
| WEAT | 3.75% | |
| MOO | 2.50% | |
| XLK | 2.50% | |
| SMH | 2.50% | |
| URA | 2.50% | |
| ITA | 2.50% | |
| XAR | 2.50% | |
| PICK | 1.25% | |
| IGV | 1.25% |
Macro Regime — Transition / Mixed
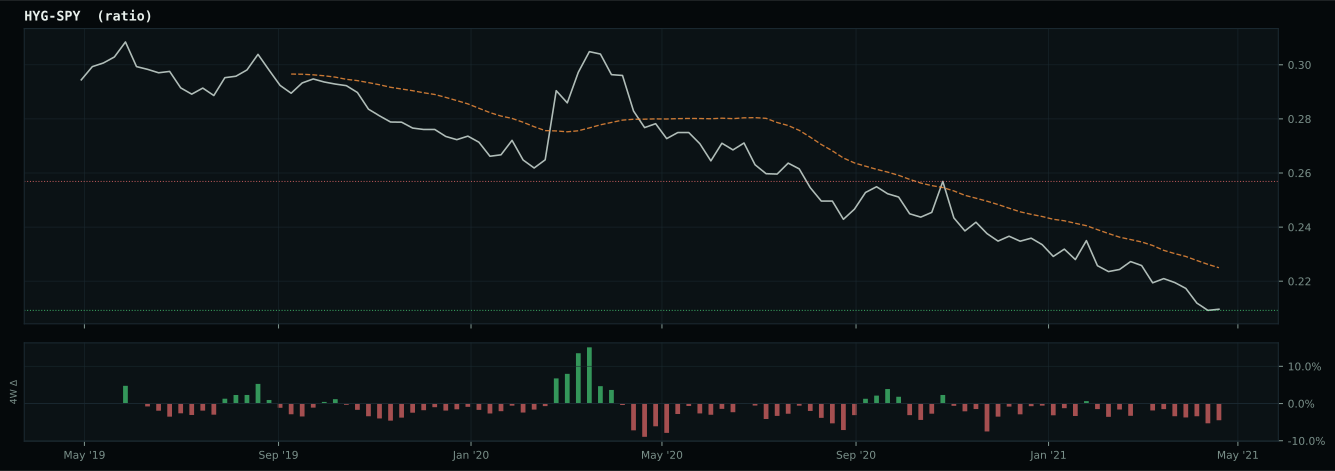
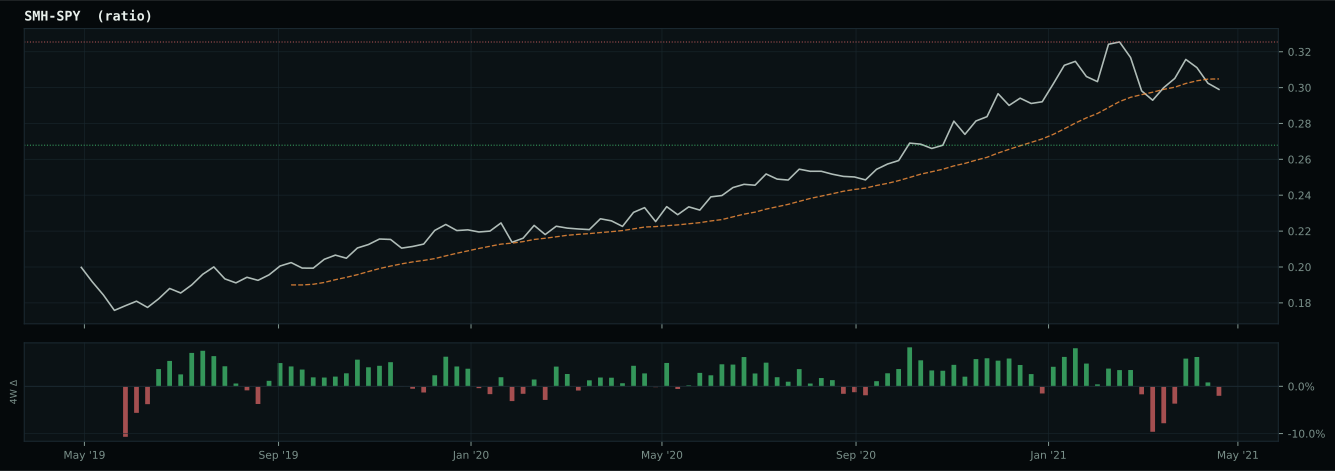
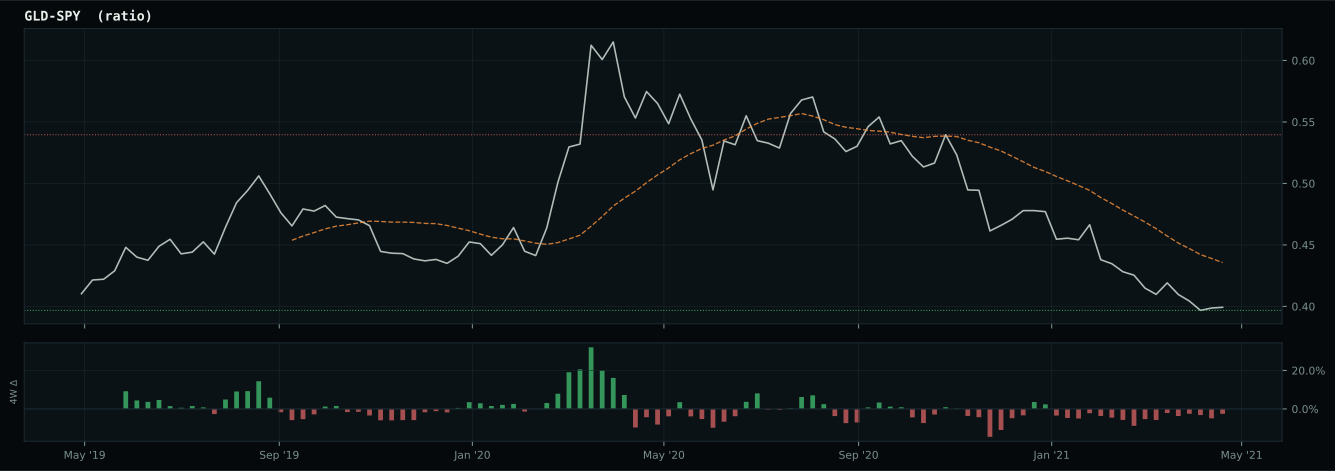
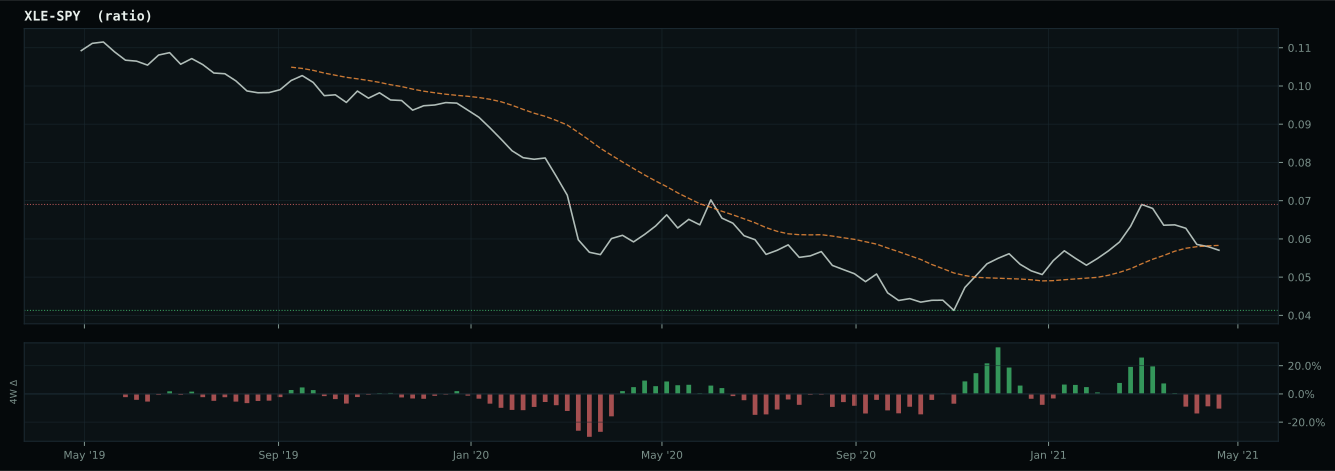
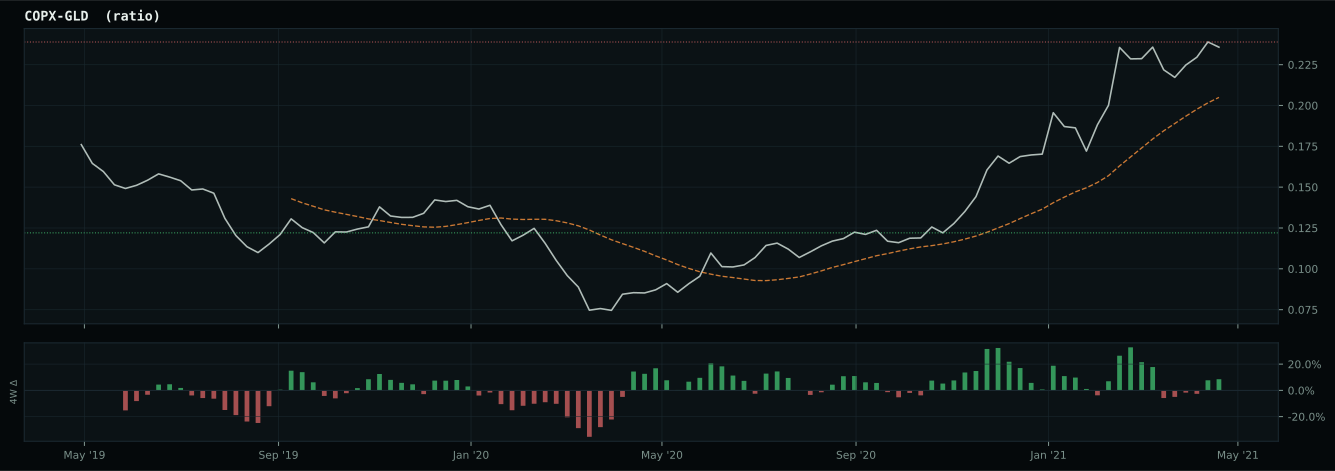
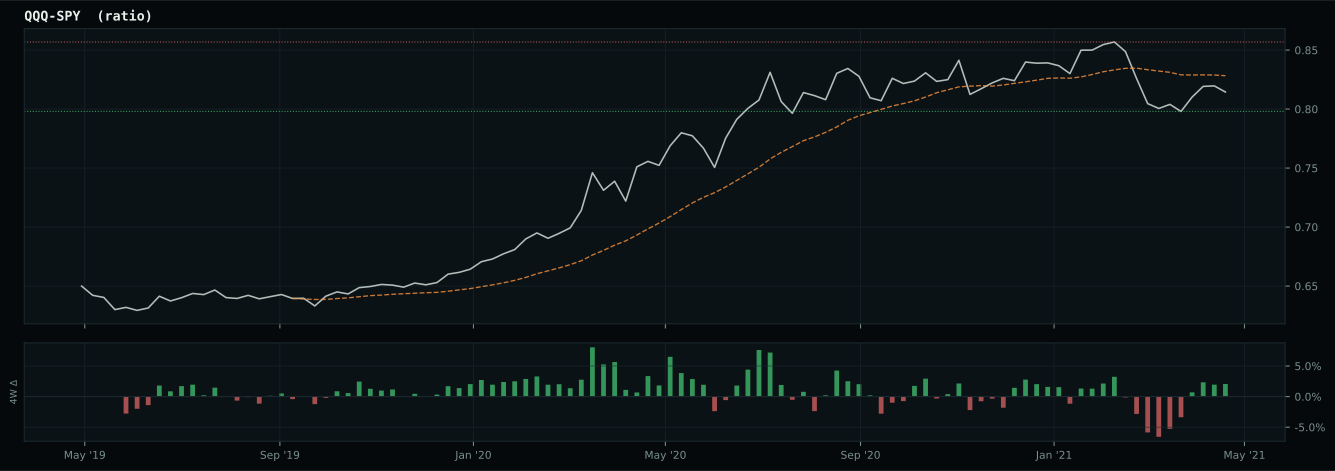
Macro Evidence Charts
Market-implied signals behind the macro regime scores. Each ratio compares two assets; the direction and slope of the ratio is what the macro engine reads.
Crypto Regime — AltSeason
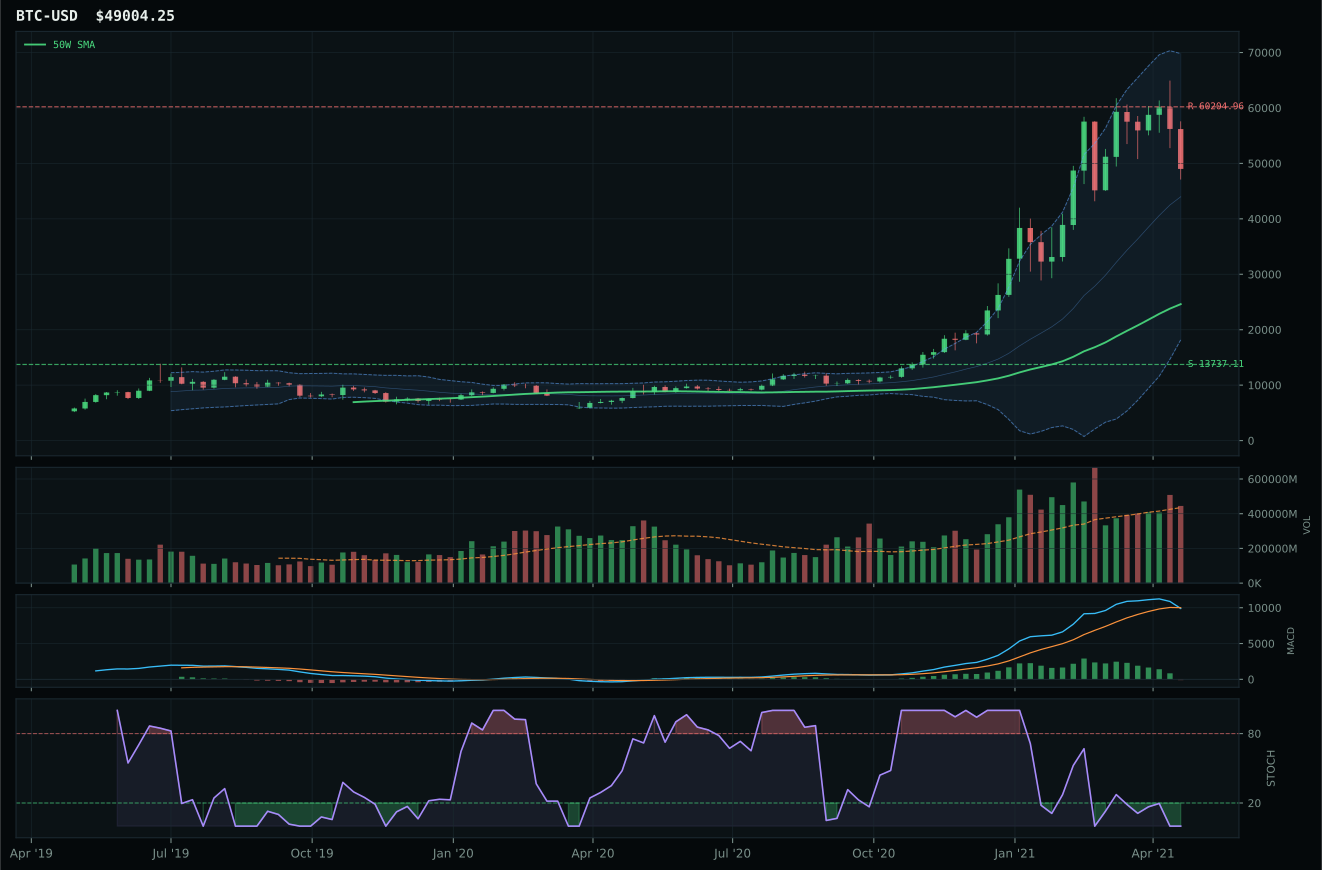
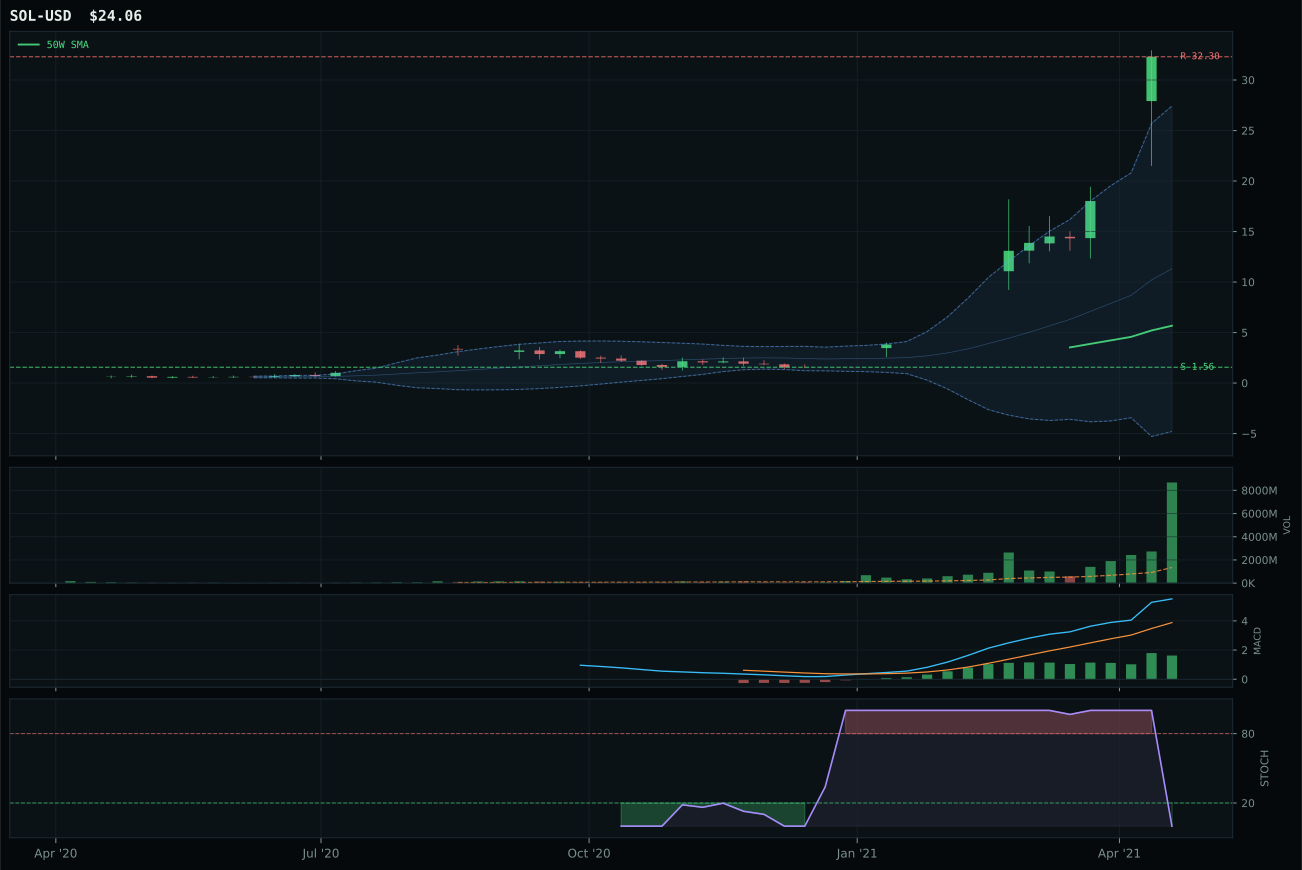
post-touch structure is too wide to count as a range; max/min close ratio is 11.16
TrendBTC confirmed: 2 consecutive closes above rising/flat 50W SMA
all available AltSeason conditions pass; missing optional confirmations skipped
Category Rankings
| Rank | Category | Winner | Score | Alloc | 4W Ret | Peers (4W) |
|---|---|---|---|---|---|---|
| 1 | Agriculture & Livestock | WEAT | 70.6 | 20% | -7.93% | MOO +1.1% · VEGI +0.7% |
| 2 | Industrial Metals | COPX | 66.6 | 20% | -0.25% | PICK +0.4% · REMX -2.7% |
| 3 | Traditional Energy | XLE | 57.5 | 10% | +10.90% | XOP +15.9% · FCG +18.3% |
| 4 | Utilities & Infrastructure | XLU | 57.4 | 10% | -0.20% | IGF +1.8% · PAVE +0.8% |
| 5 | Nuclear Energy | URA | 51.5 | 10% | +11.28% | NLR +2.3% · URNM +16.5% |
| 6 | Precious Metals | SLV | 51.1 | 10% | +5.75% | GDX +9.0% · GLD +5.7% |
| 7 | Defense & Aerospace | ITA | 43.7 | 10% | +0.68% | XAR -2.3% · ROKT -2.0% |
| 8 | Technology | IGV | 34.2 | 10% | -4.68% | XLK -3.8% · CIBR -2.7% |
| 9 | Emerging Markets | ILF | 33.2 | 0% | +1.86% | IEMG -1.9% · INDA +7.6% |
| 10 | AI | BOTZ | 30.0 | 0% | -5.21% | SMH -3.7% · AIQ -4.3% |
Agriculture & Livestock — WEAT
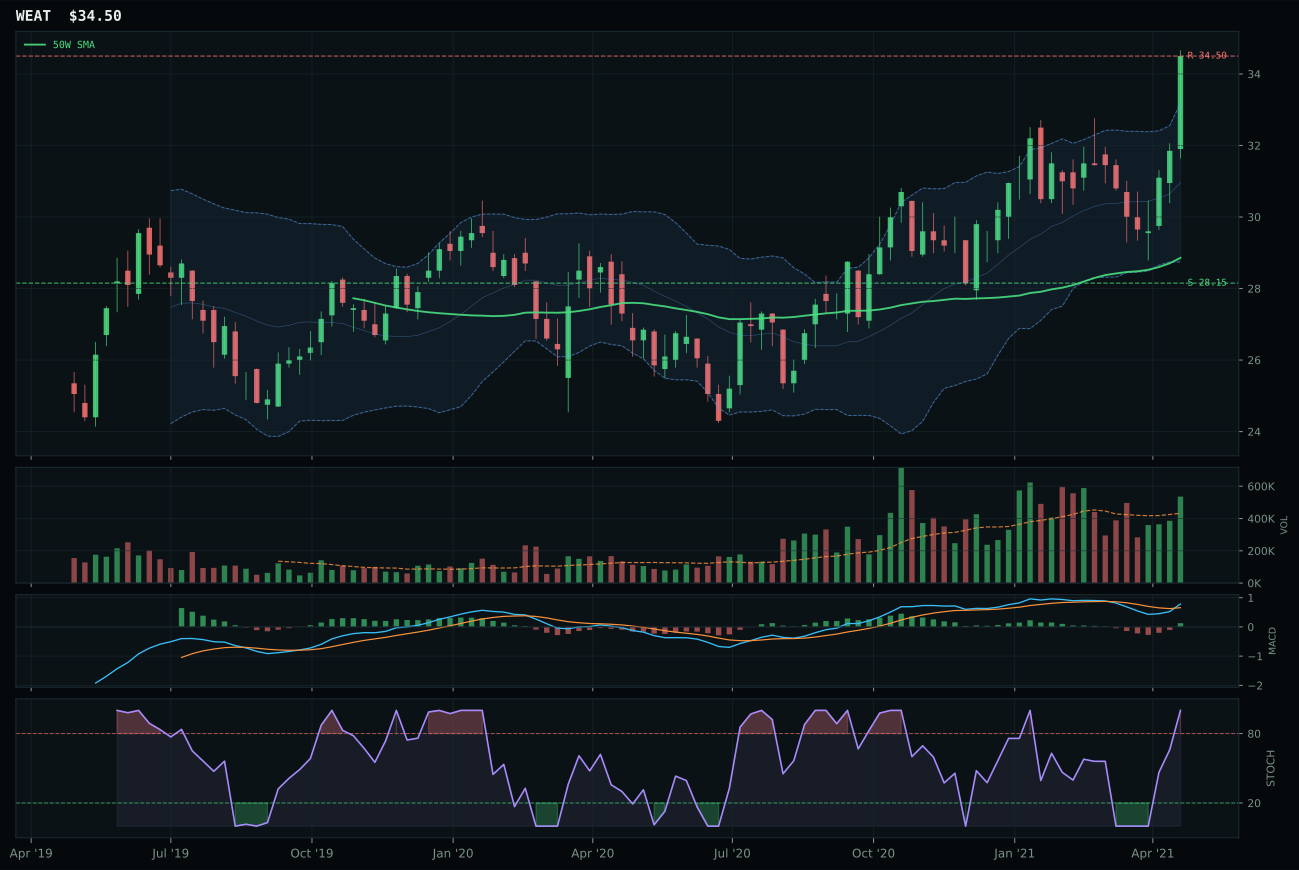
WEAT has a vertical extension profile with 4.3% 13-week relative strength versus SPY.
A failed hold above support would weaken the setup.
Actionable but governed by invalidation levels.
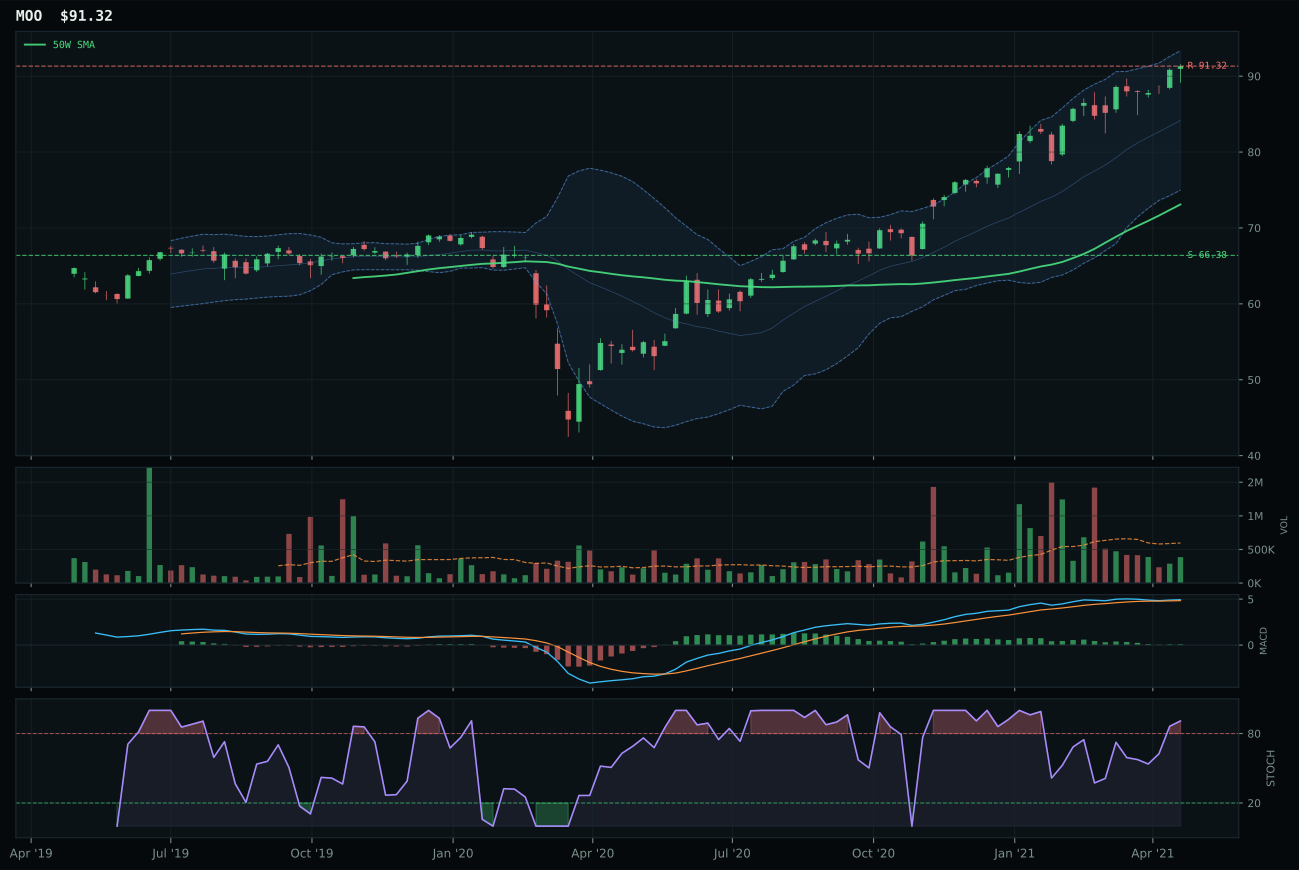
MOO has a vertical extension profile with 1.6% 13-week relative strength versus SPY.
A failed hold above support would weaken the setup.
Actionable but governed by invalidation levels.
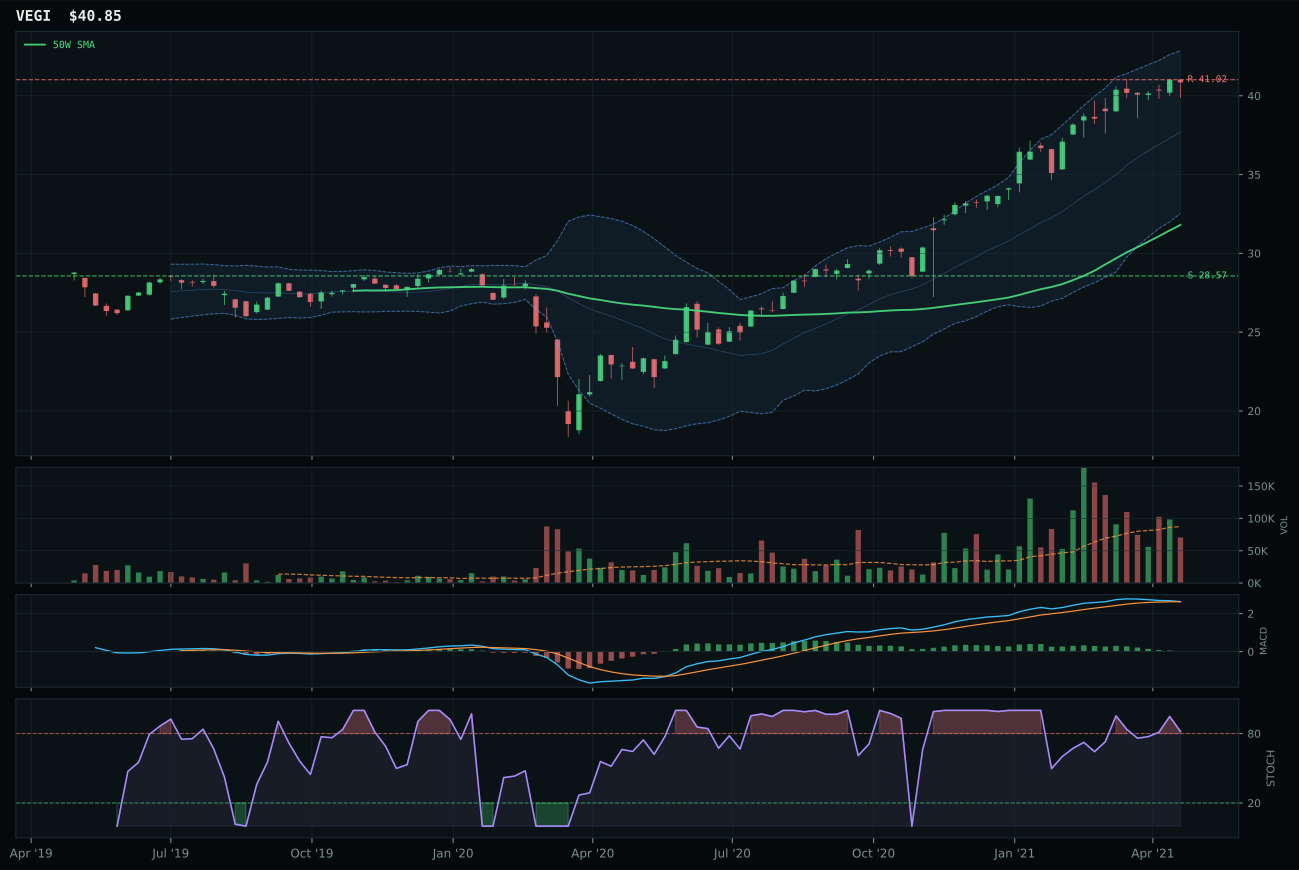
VEGI has a vertical extension profile with 2.5% 13-week relative strength versus SPY.
A failed hold above support would weaken the setup.
Tracked, but not top-2 eligible because: .
WEAT wins decisively on momentum confirmation (100.0/100) and volume sponsorship, with above-average participation at 1.24x the 20W average backing a 13.1% thirteen-week return and perfect overbought stochastic RSI at 1.00. Runner-up MOO shows bullish structure (trend 98.0) but fails on timing (32.0 vs 37.0), MACD confirmation (bullish but flattening vs bullish and improving), and volume (thin vs above-average), resulting in a 4.2-point score gap. WEAT's category-relative strength of 1.7% versus MOO's -0.9% indicates money is flowing into commodity grain futures specifically, not general agriculture. The near 52W high setup on WEAT means entry risk is substantial, but the volume and MACD sponsorship confirm accumulation rather than distribution.
Agriculture & Livestock earns 10% allocation as a top-2 category, driven by a category-level score of 70.6 backed by exceptional macro fit (86.0/100). Supply shortage, inflation pressure, real asset sponsorship, and commodity breadth positive are all active, giving this trade substantial tailwind support. WEAT's technical evidence (83.3/100) is strongest-in-class, and the 3/2/1 basket weighting produces a 67.9 starting score before final adjustments. This is the only category this week with both strong technical momentum and powerful macro narrative alignment—real inflation, real supply constraints, and real institutional rotation into hard assets. The extended price and overbought momentum are risk factors, but they are being actively accumulated, not liquidated.
Industrial Metals — COPX
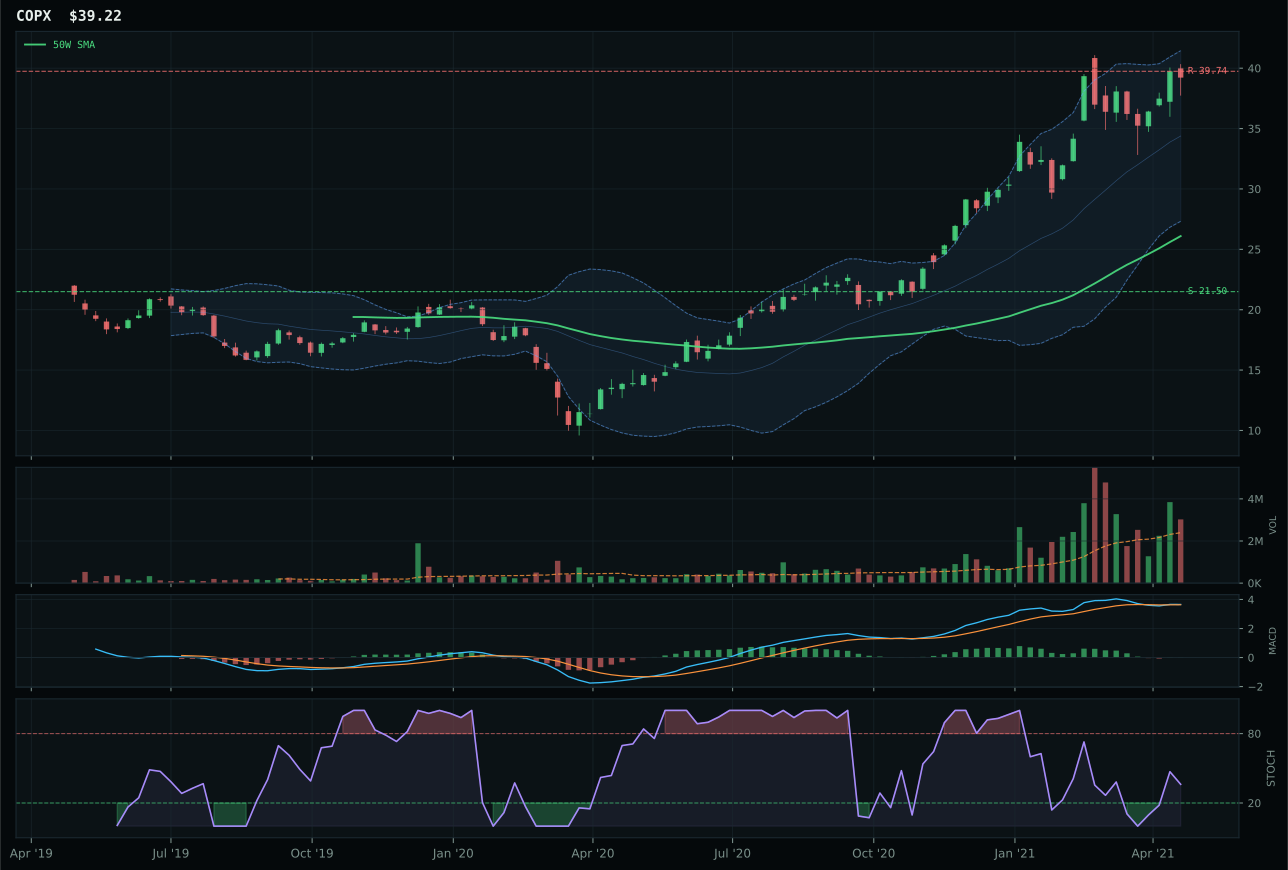
COPX has a vertical extension profile with 12.2% 13-week relative strength versus SPY.
A failed hold above support would weaken the setup.
Actionable but governed by invalidation levels.
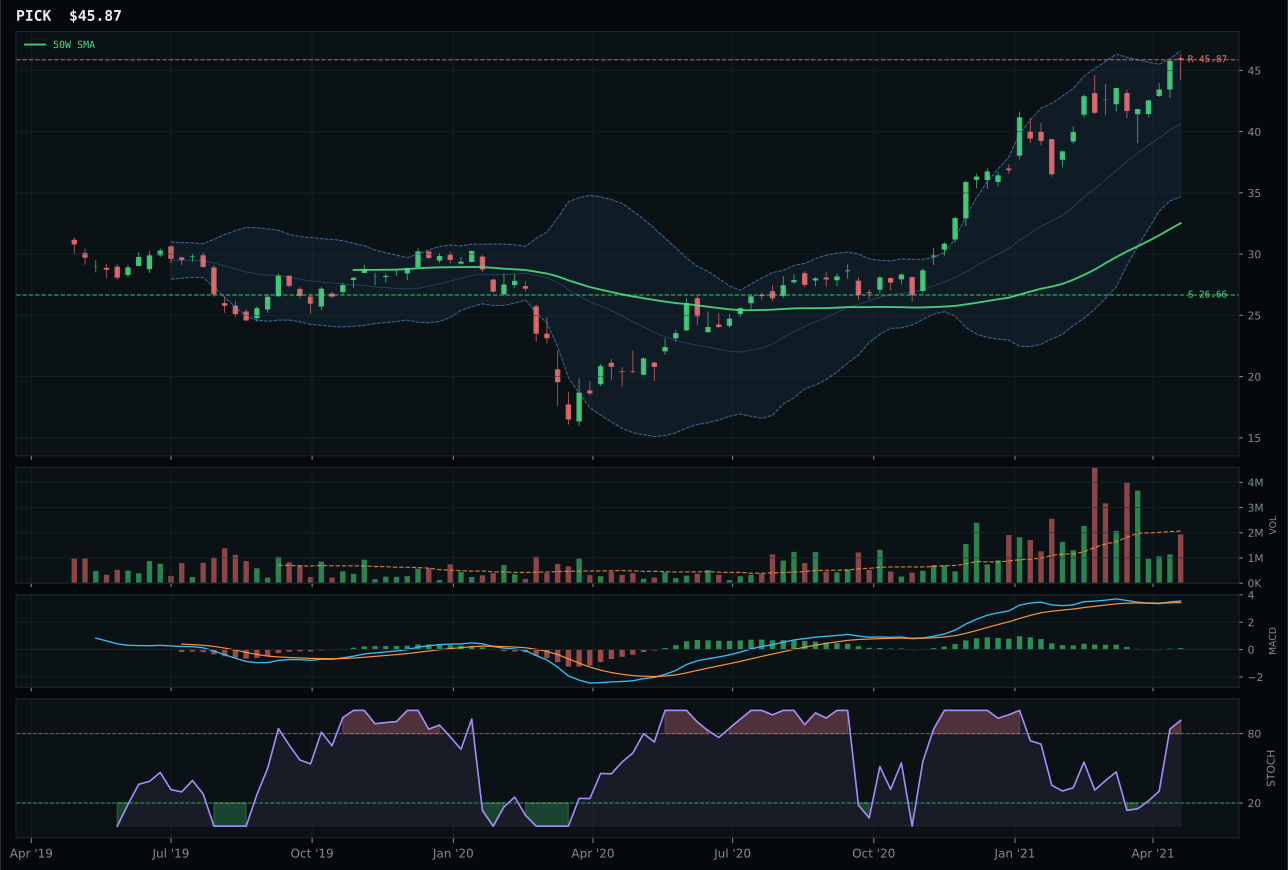
PICK has a vertical extension profile with 8.1% 13-week relative strength versus SPY.
A failed hold above support would weaken the setup.
Actionable but governed by invalidation levels.
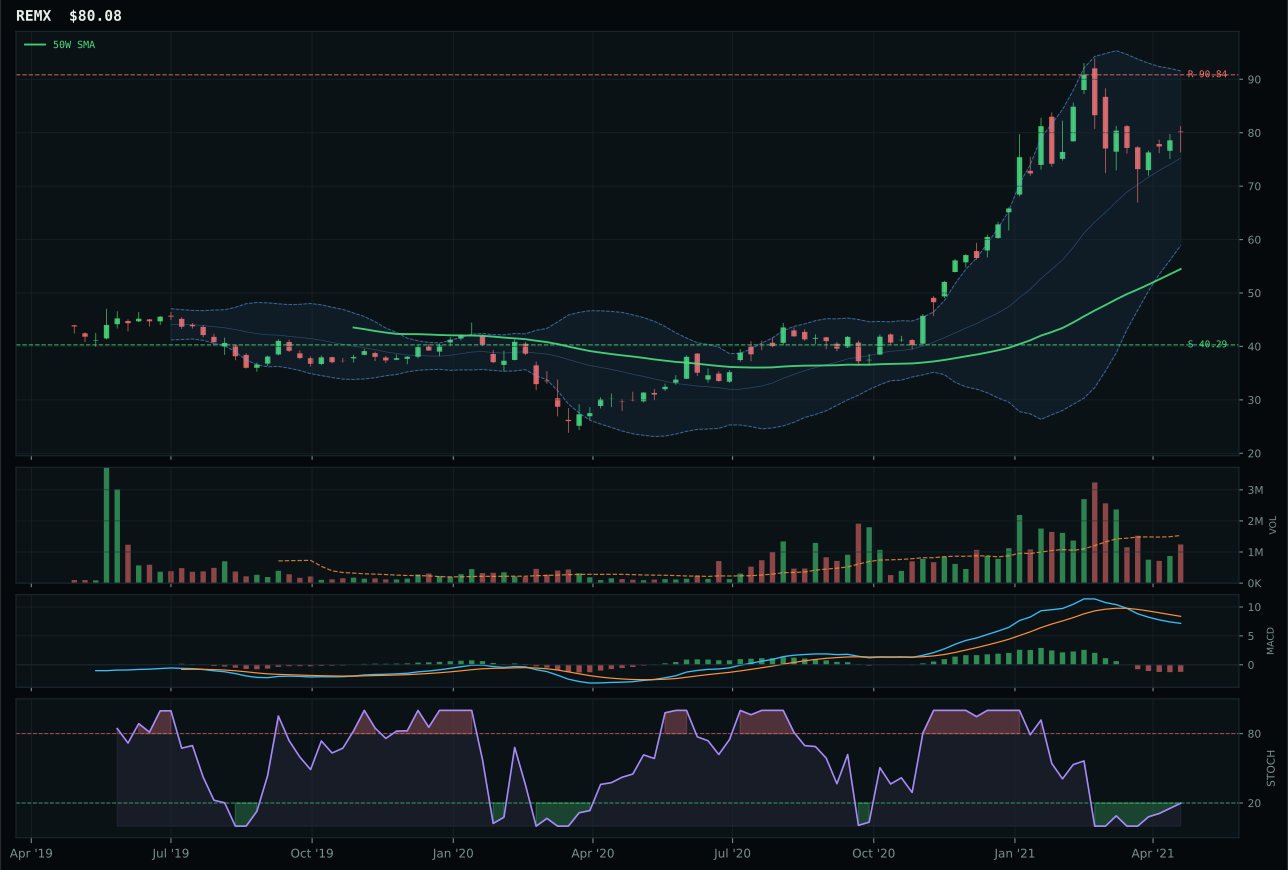
REMX has a vertical extension profile with -10.2% 13-week relative strength versus SPY.
A failed hold above support would weaken the setup.
Actionable but governed by invalidation levels.
COPX wins with perfect trend score (100.0) and explosive momentum confirmation (100.0/100), backed by 21.0% thirteen-week returns and above-average volume participation at 1.26x the 20W average. The setup is severely extended at 50.3% above the 50W, placing price near the 52W high, so timing is compressed to 48.0 despite bullish MACD confirmation. Runner-up PICK shows nearly equivalent trend (100.0) and momentum (100.0) but loses on timing (37.0 vs 48.0), MACD character (bullish and improving vs bullish but flattening), stochastic RSI (overbought momentum vs rising mid-zone), and volume (neutral vs above-average). The 1.3-point gap is remarkably tight—both trades are extended—but COPX's rising mid-zone stochastic and active accumulation volume demonstrate sponsor commitment.
Industrial Metals earns 10% allocation as a top-2 category, justified by a category-level score of 66.6 and exceptional macro support (73.0/100 category fit). Metals scarcity, commodity breadth positive, real asset sponsorship, and energy/supply constraints are all active, creating a multi-vector tailwind. COPX's 76.2 technical evidence is highest-in-class, with 21.0% thirteen-week returns and 12.2% relative strength versus SPY proving the trade is working. Price is dangerously extended, but unlike many overbought setups, the volume, MACD, and relative strength confirm institutional accumulation rather than retail distribution. The 82.4% downside-to-support creates downside risk, but the macro regime strongly rewards resource scarcity positioning, making COPX the portfolio's most leveraged real-asset play alongside WEAT.
Traditional Energy — XLE
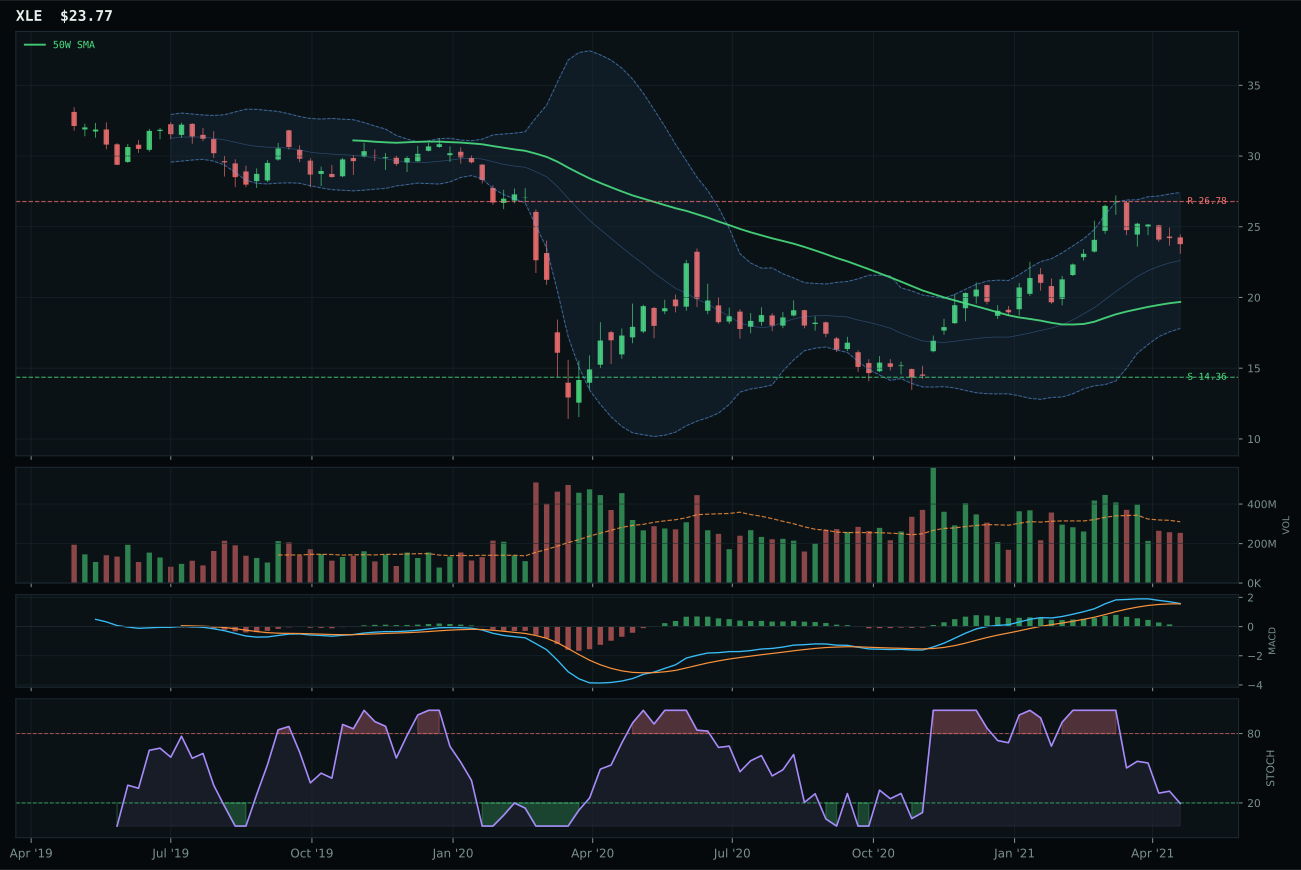
XLE has a vertical extension profile with 4.2% 13-week relative strength versus SPY.
A failed hold above support would weaken the setup.
Actionable but governed by invalidation levels.
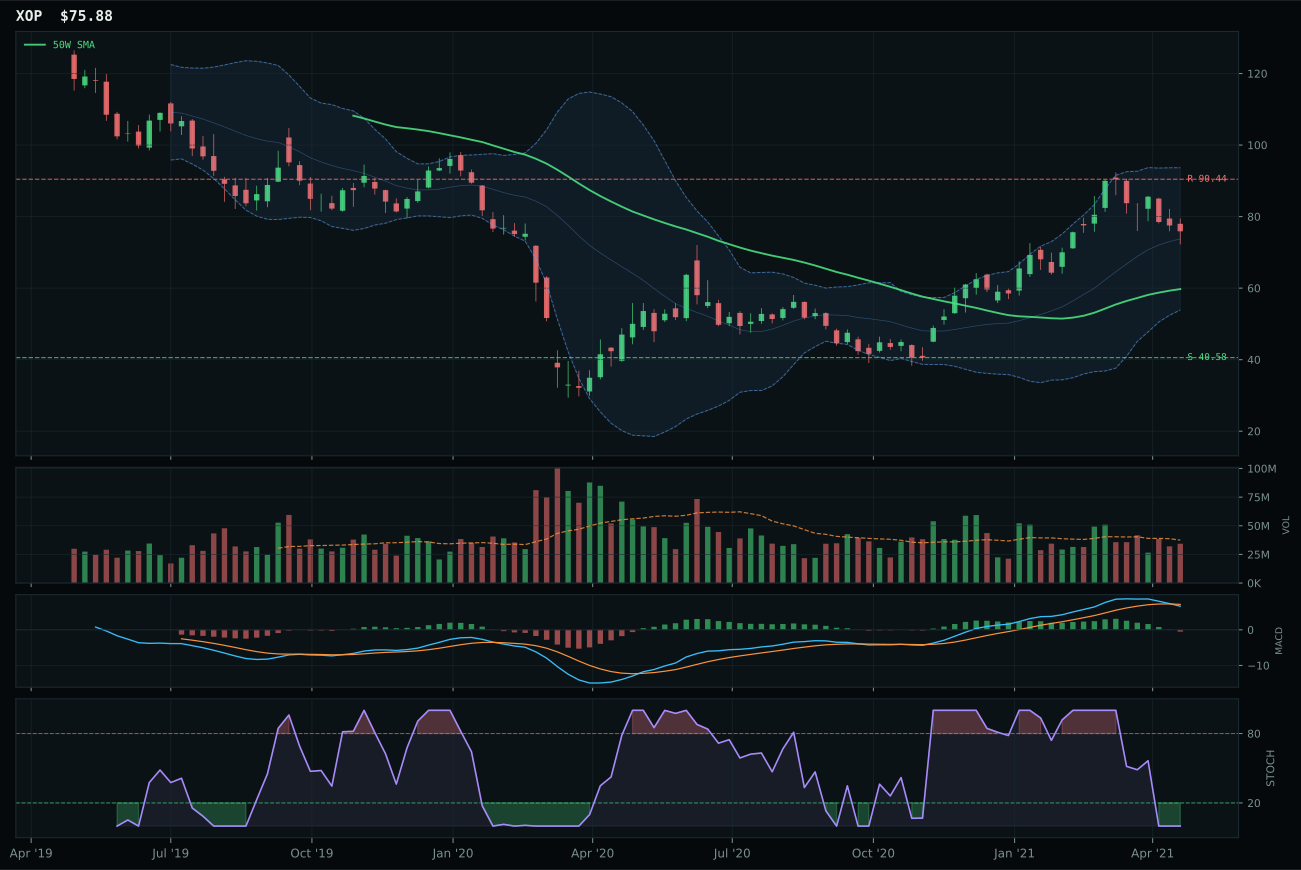
XOP has a vertical extension profile with 2.7% 13-week relative strength versus SPY.
A failed hold above support would weaken the setup.
Actionable but governed by invalidation levels.
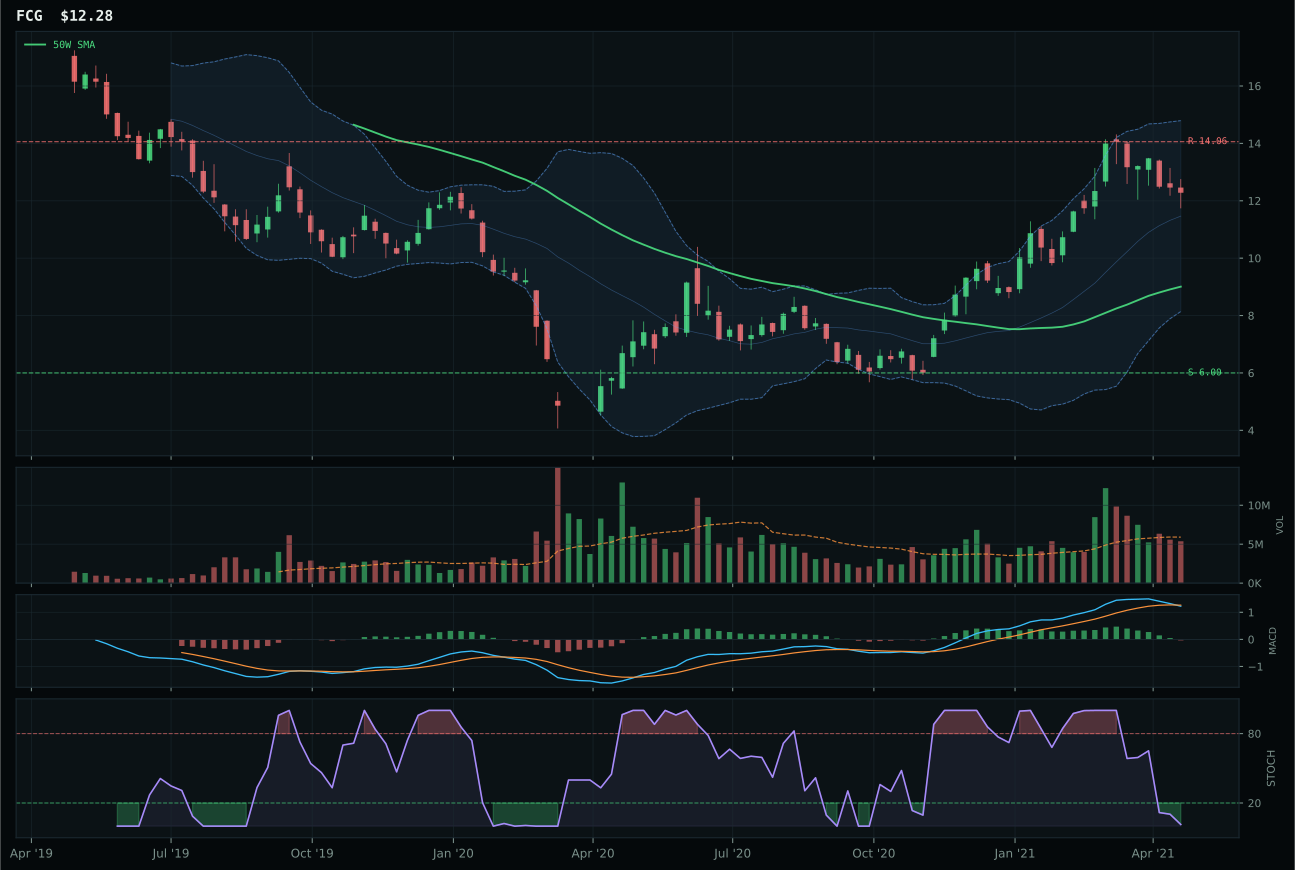
FCG has a vertical extension profile with 9.6% 13-week relative strength versus SPY.
A failed hold above support would weaken the setup.
Actionable but governed by invalidation levels.
XLE wins the category despite a subordinate technical ranking because it offers superior timing and structure relative to runner-up XOP. XLE sits above the 50W but below the 200W, with neutral stochastic RSI at oversold (0.20) and MACD bullish but flattening—a setup that suggests accumulation without requiring new highs. XOP is more severely extended at 27.0% from the 50W with bearish/weakening MACD and oversold stochastic, yielding timing of 48.0 versus XLE's equivalent 48.0, but XLE's bullish MACD confirmation and superior risk/reward (48.1 vs 33.3) prevail. The category-wide score gap of 20.3 points between XLE and XOP reflects XLE's integrated cash-flow defense thesis outweighing exploration leverage when credit stress and supply uncertainty are both active.
Traditional Energy receives 5% allocation as a tier-2 category, ranked below two higher-eligible scores despite powerful macro support (85.0/100 category fit). Energy scarcity, supply shortage, inflation pressure, real asset sponsorship, and blended credit relief all favor energy exposure. XLE's 54.3 technical evidence score is moderate—the setup is extended and structural support is below current price—but the macro narrative is one of the strongest on the board. The category ranked high enough to justify a position but not high enough to crack top-2 because the technical extension and XLE's price sitting below the 200W introduce structural questions. This is a conviction macro trade with limited near-term technical confirmation, appropriate for tier-2 sizing as a hedge against sustained inflation and supply constraints.
Utilities & Infrastructure — XLU
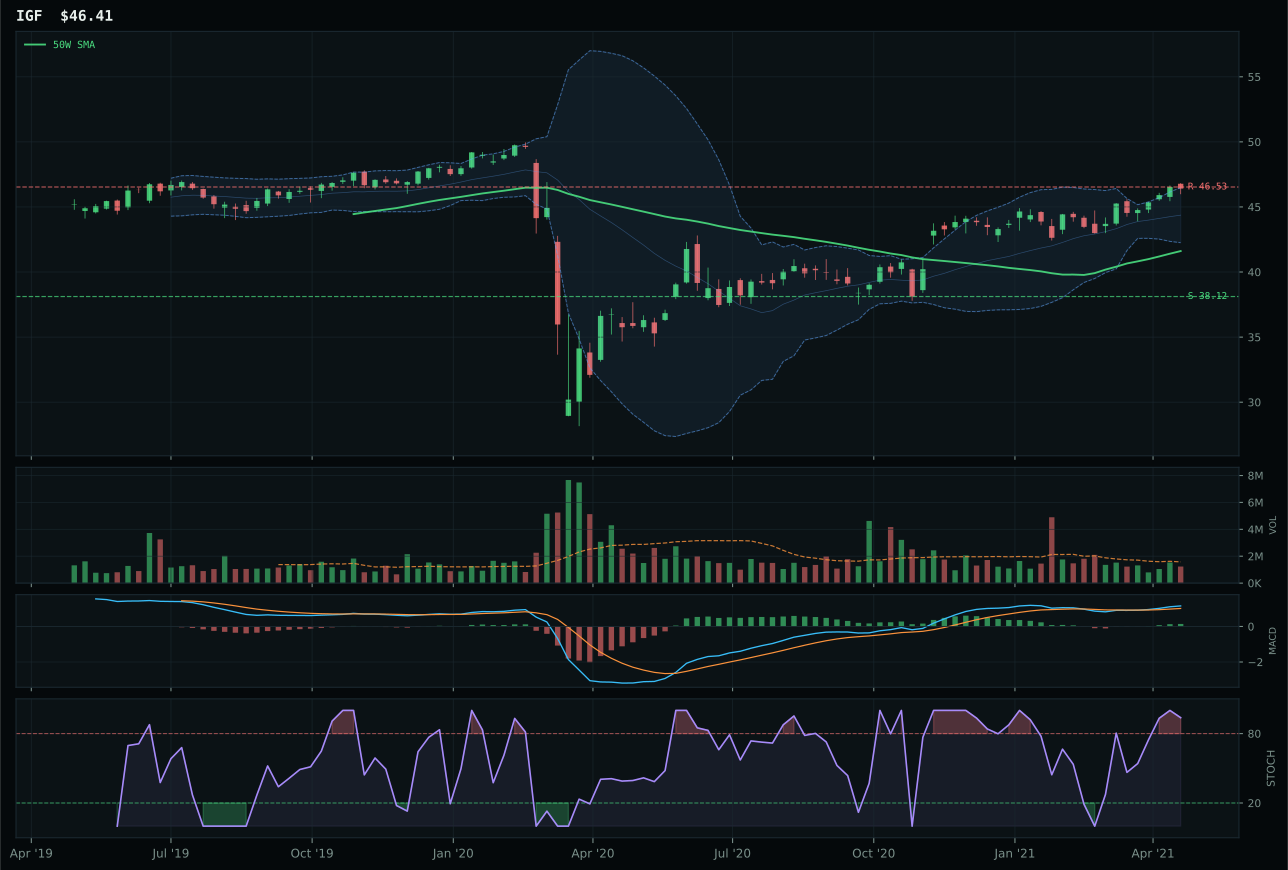
IGF has a neutral structure profile with -3.1% 13-week relative strength versus SPY.
A failed hold above support would weaken the setup.
Actionable but governed by invalidation levels.
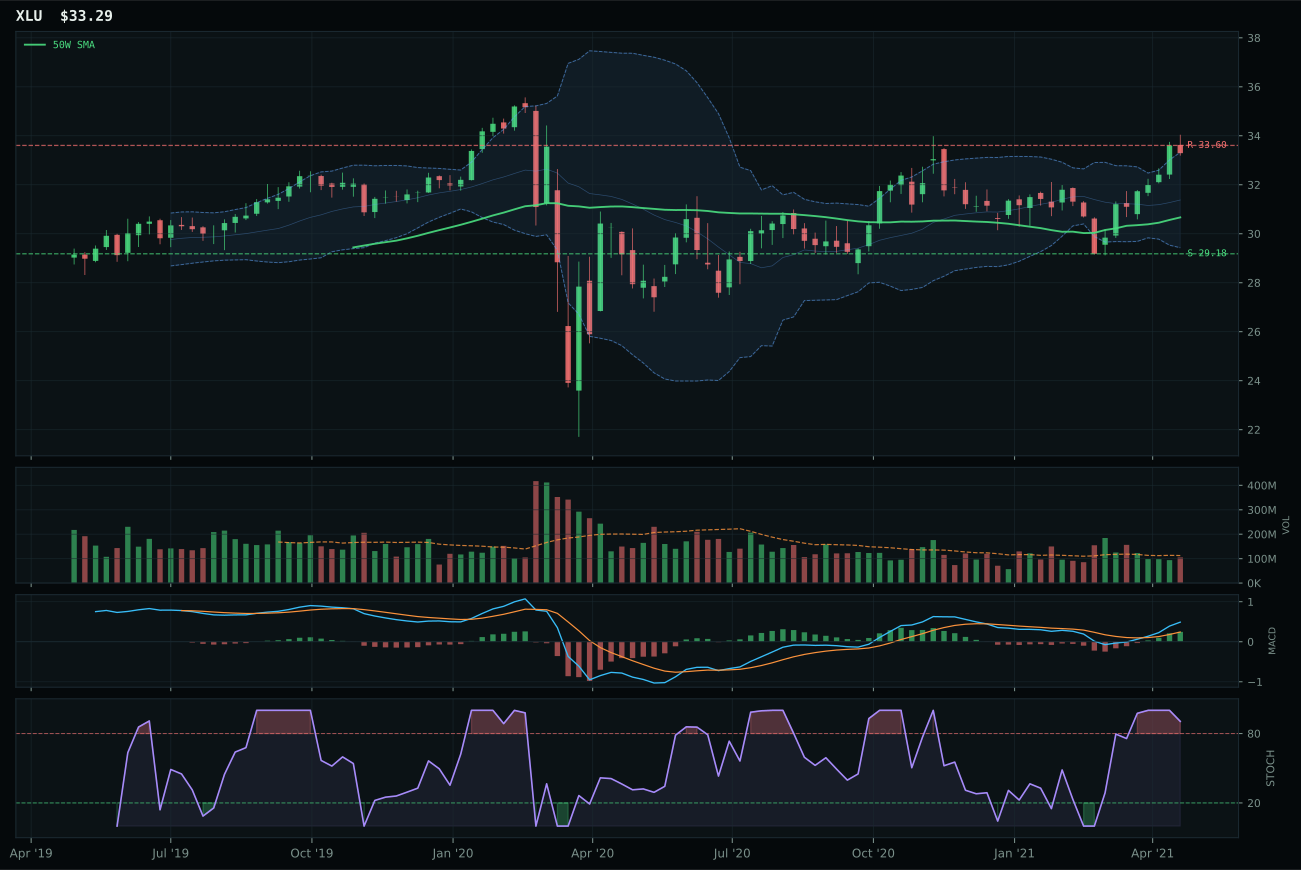
XLU has a neutral structure profile with -2.9% 13-week relative strength versus SPY.
A failed hold above support would weaken the setup.
Actionable but governed by invalidation levels.
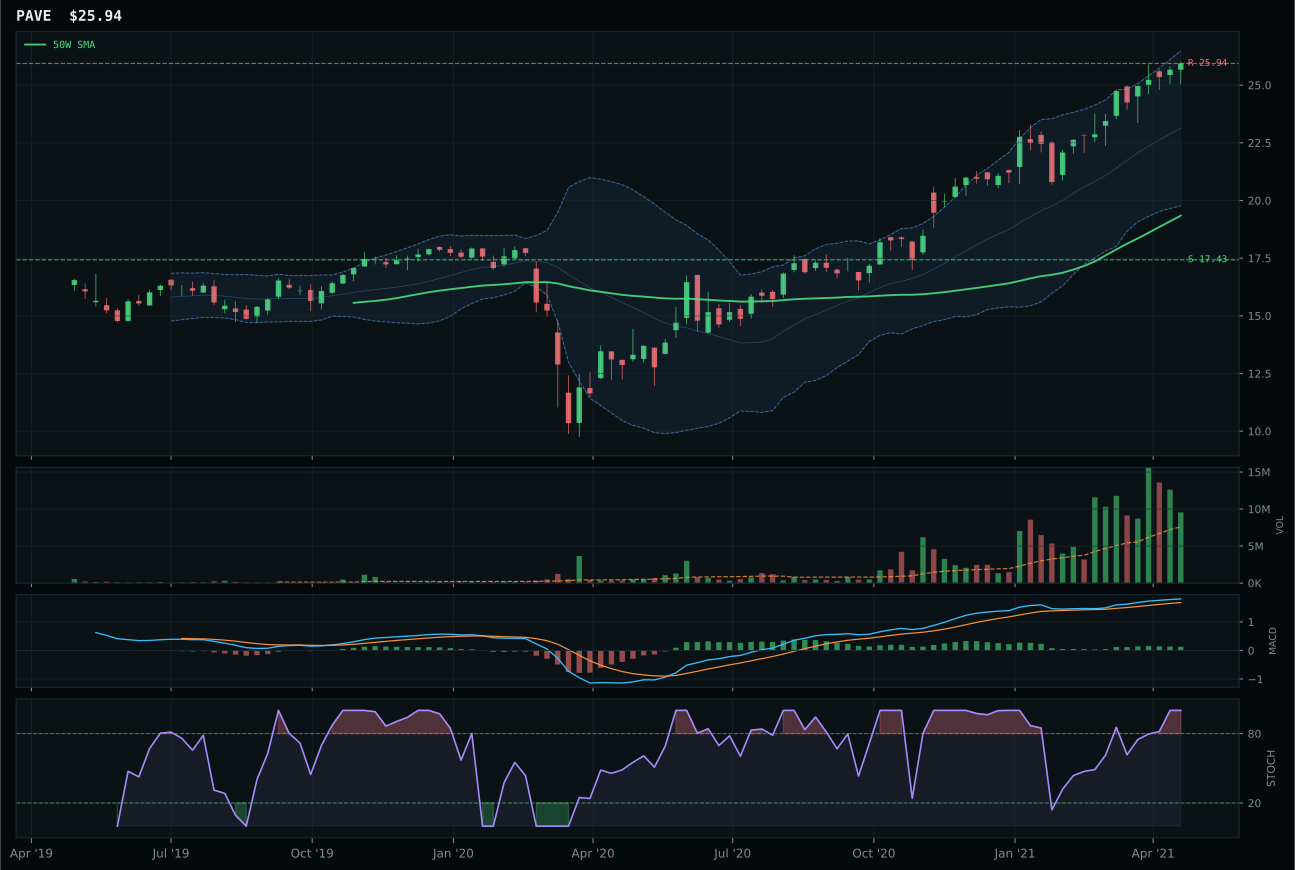
PAVE has a vertical extension profile with 6.7% 13-week relative strength versus SPY.
A failed hold above support would weaken the setup.
Actionable but governed by invalidation levels.
XLU edges runner-up IGF in an extremely close category decision (0.3-point gap) because timing is marginally better (57.0 vs 59.0 for IGF) despite identical neutral structures and bullish MACD improvement. XLU sits 8.6% above the 50W with stochastic RSI overbought rolling over at 0.90, offering a subtly superior reversion setup compared to IGF's overbought momentum at similar extension. Both trades carry weak upside-to-resistance (XLU -0.9%, IGF near extension) and neutral volume, but XLU's regulated utility defense character (trend 95.7, breadth 63.3) edges IGF's global infrastructure income profile when inflation pressure is active and compressed. The runner-up, IGF, actually ranked higher in the reasoned basket (65.2 vs 56.5), but XLU's tighter timing and slightly superior MACD character won the representative slot.
Utilities & Infrastructure receives 5% allocation as a tier-2 category, held despite a compressed 57.4 score and weak category macro fit (48.0/100). Inflation pressure is actively penalizing both regulated utilities and long-duration infrastructure assets, and the Transition / Mixed regime offers only +4 macro support. XLU's 61.0 technical evidence is respectable, supported by 95.7% trend and bullish MACD improvement, but the category's overall macro headwinds prevent top-2 elevation. This is a defensive positioning allocation rather than an offensive return opportunity: utilities function as interest-rate insurance and provide earnings stability, appropriate for 5% as a ballast position. Significant shifts in inflation narrative or explicit easing signals would be required to upgrade this category; as structured, it serves primarily as a hedge against real asset volatility.
Nuclear Energy — URA
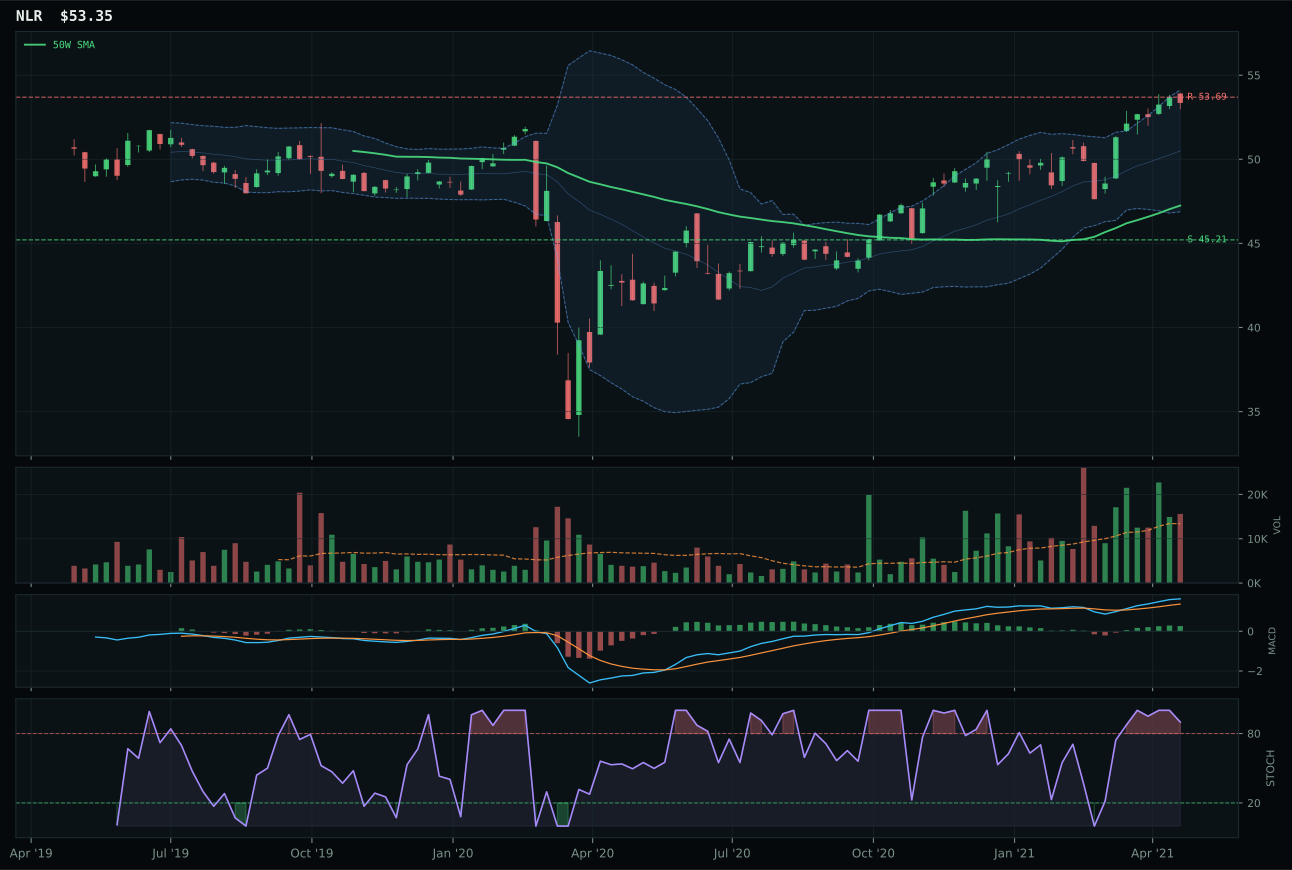
NLR has a neutral structure profile with -1.7% 13-week relative strength versus SPY.
A failed hold above support would weaken the setup.
Tracked, but not top-2 eligible because: .
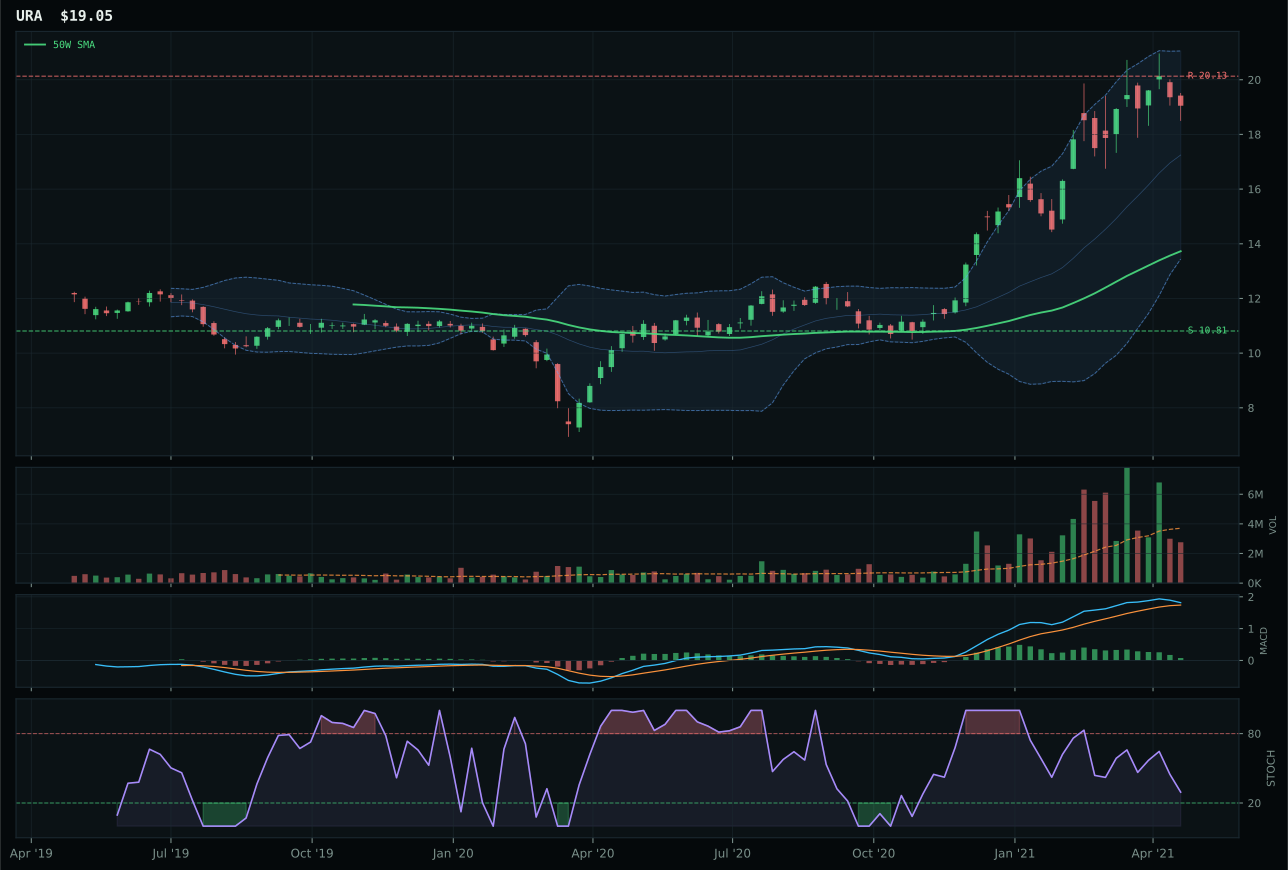
URA has a vertical extension profile with 17.2% 13-week relative strength versus SPY.
A failed hold above support would weaken the setup.
Actionable but governed by invalidation levels.
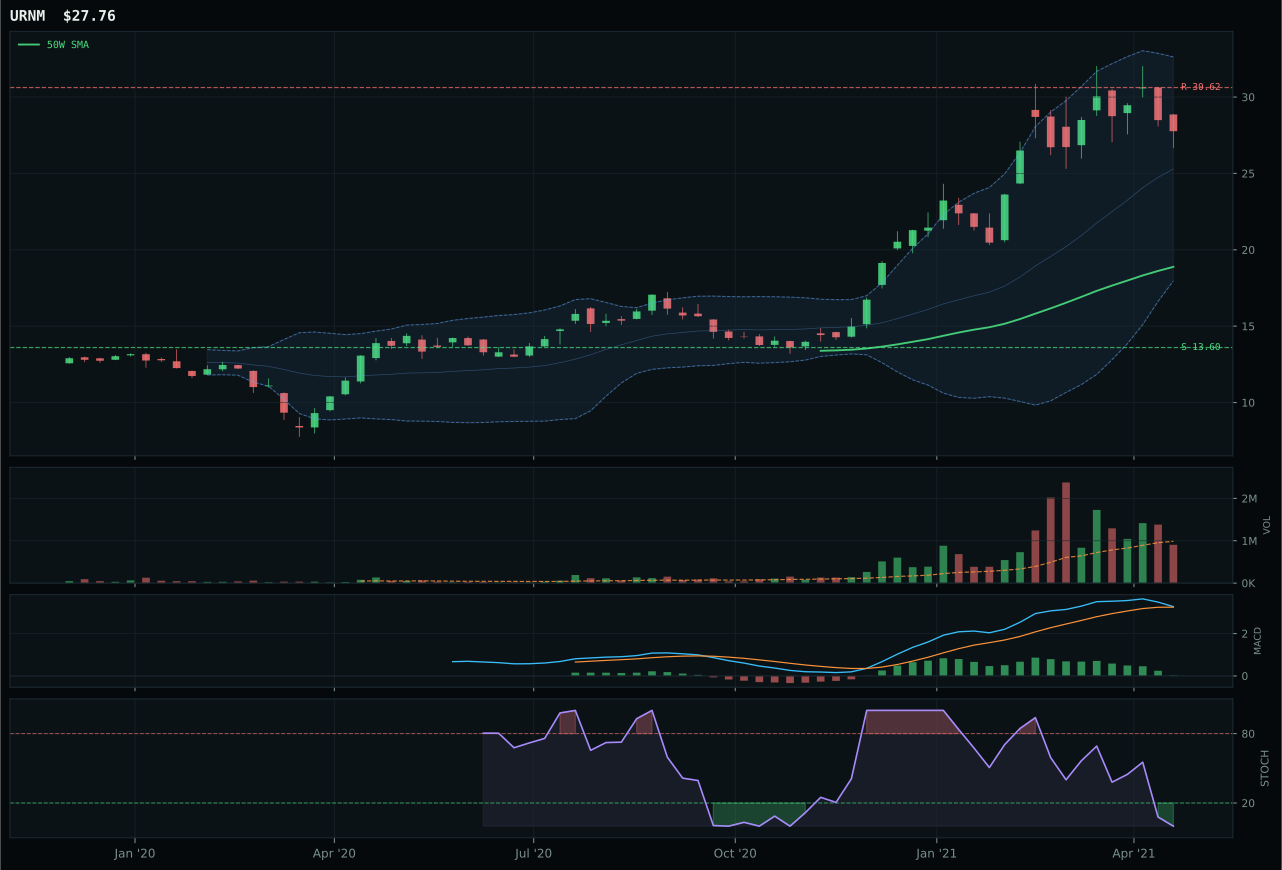
URNM has a vertical extension profile with 20.3% 13-week relative strength versus SPY.
A failed hold above support would weaken the setup.
Actionable but governed by invalidation levels.
URA wins decisively on relative strength (RS vs SPY of 17.2% and category median parity at 0.0%) and momentum confirmation (100.0/100), with a remarkable 26.1% thirteen-week return backed by 0.5% four-week return indicating sustained rather than speculative accumulation. Runner-up NLR shows superior MACD confirmation (bullish and improving vs bullish but flattening) but suffers from significantly worse category-relative strength (-18.9% vs 0.0%), indicating the nuclear-uranium complex is outperforming the nuclear-utilities complex. URA is severely extended 38.8% above the 50W with falling/neutral stochastic RSI at 0.29 and thin volume, creating timing risk of 48.0, but the 26.1% thirteen-week performance and relative strength dominance prove the move is institutional rather than speculative.
Nuclear Energy receives 5% allocation as a tier-2 category, held despite a moderate 51.5 category score because macro support (64.0/100 fit) is solid with energy scarcity, real asset sponsorship, and inflation pressure all active. URA's 61.6 technical evidence and 17.2% relative strength confirm sponsor accumulation, but the severe price extension and thin volume create execution risk. To reach top-2 would require either URNM's superior relative strength (20.3% vs SPY) to be reflected in broader category metrics, or NLR's steadier utility structure to gain technical confirmation. Nuclear occupies a niche role here—tactically compelling on energy scarcity fundamentals but constrained by price extension and micro-cap volume characteristics that limit institutional sizing.
Precious Metals — SLV
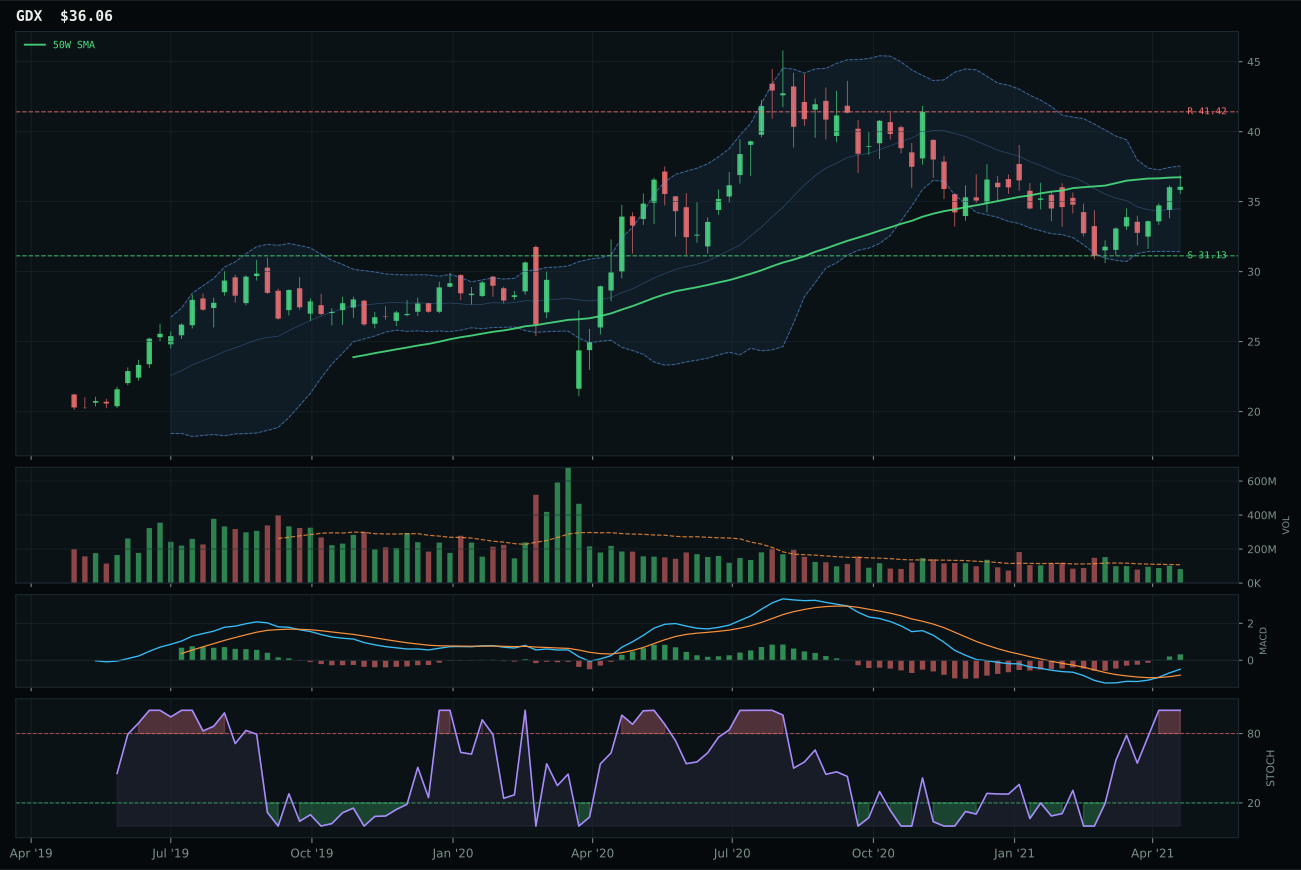
GDX has a compression near 50W profile with -6.5% 13-week relative strength versus SPY.
A failed hold above support would weaken the setup.
Actionable but governed by invalidation levels.
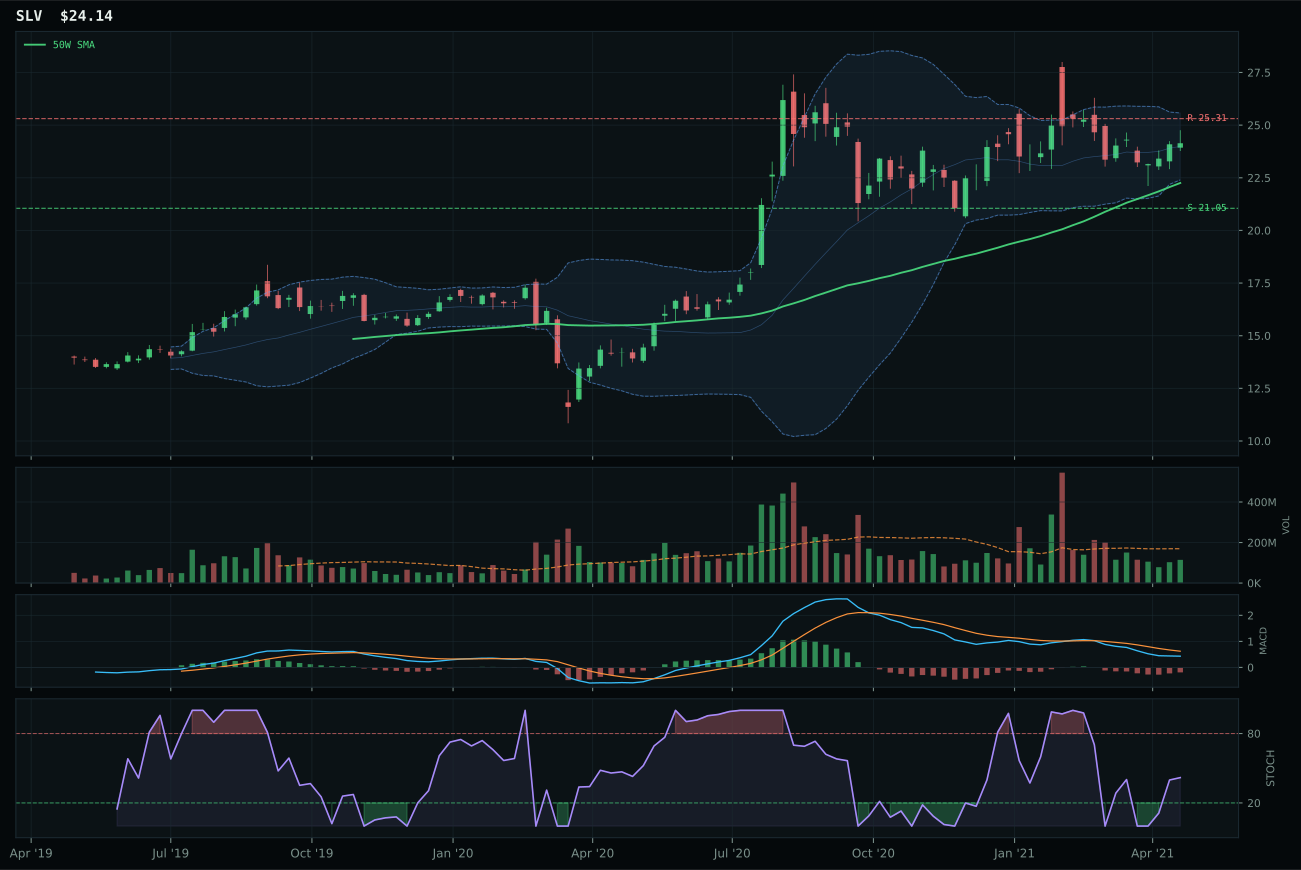
SLV has a neutral structure profile with -6.8% 13-week relative strength versus SPY.
A failed hold above support would weaken the setup.
Actionable but governed by invalidation levels.
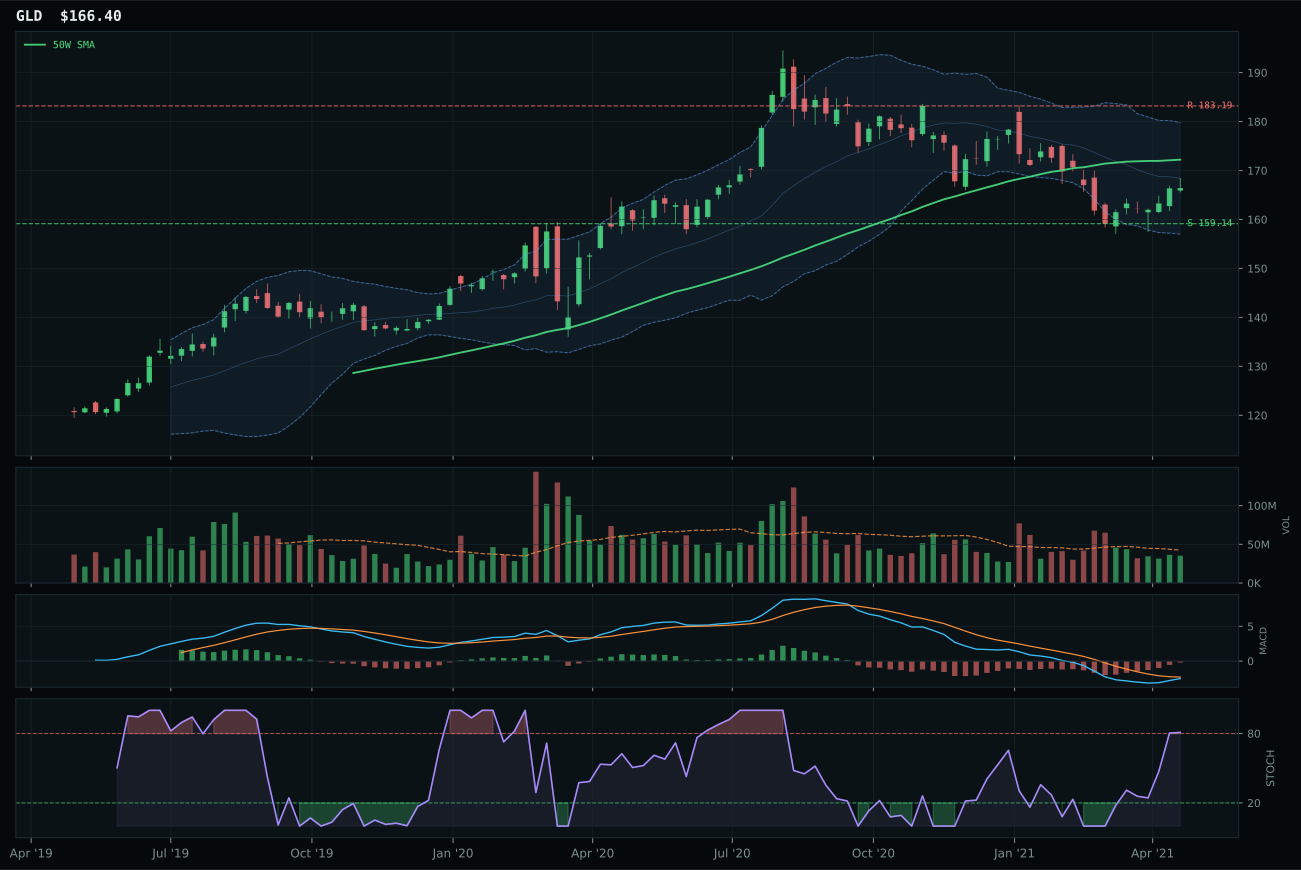
GLD has a pullback into support profile with -13.2% 13-week relative strength versus SPY.
A failed hold above support would weaken the setup.
Actionable but governed by invalidation levels.
SLV wins because its neutral structure and rising stochastic RSI at 0.42 offer cleaner entry geometry than runner-up GDX, which sits in compression near the 50W but carries overbought stochastic momentum at 0.86. SLV is only 8.5% extended with MACD bearish but improving, positioning it as a quieter accumulation setup compared to GDX's more momentum-stretched configuration. Both trade with thin volume, but SLV's category-relative strength at parity (0.0%) versus GDX's slight +0.3% tells a different story: silver's hybrid monetary-industrial character attracts steadier sponsorship than the leveraged miner beta of GDX when credit stress is active.
Precious Metals receives 5% as a tier-2 allocation, ranked below two higher-eligible categories despite solid 51.1 composite score. The category-level macro fit is neutral (50.0/100) because metals scarcity and inflation pressure are active but credit stress is simultaneously penalizing real assets. SLV's technical evidence (62.7/100) is respectable, but the category lacks the explosive momentum or macro narrative urgency that would justify top-2 seeding. GDX's reasoned ranking (69.0 vs SLV's 60.5) shows miners have stronger technical confirmation, yet GDX's overbought structure and the category's overall macro uncertainty prevent elevation. Precious metals function here as a real-asset hedge alongside energy and industrial metals, not as a primary growth engine.
Defense & Aerospace — ITA
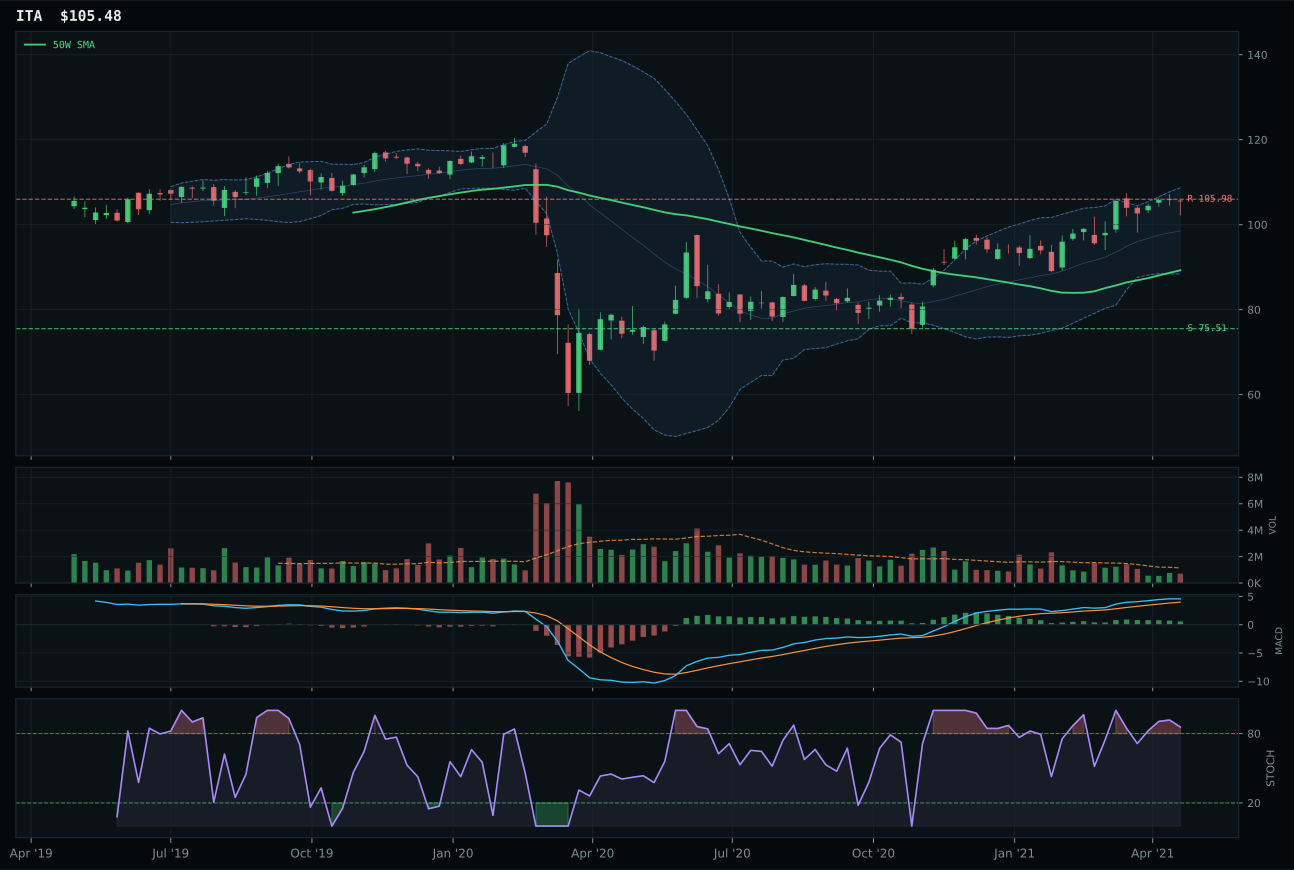
ITA has a vertical extension profile with 3.4% 13-week relative strength versus SPY.
A failed hold above support would weaken the setup.
Actionable but governed by invalidation levels.
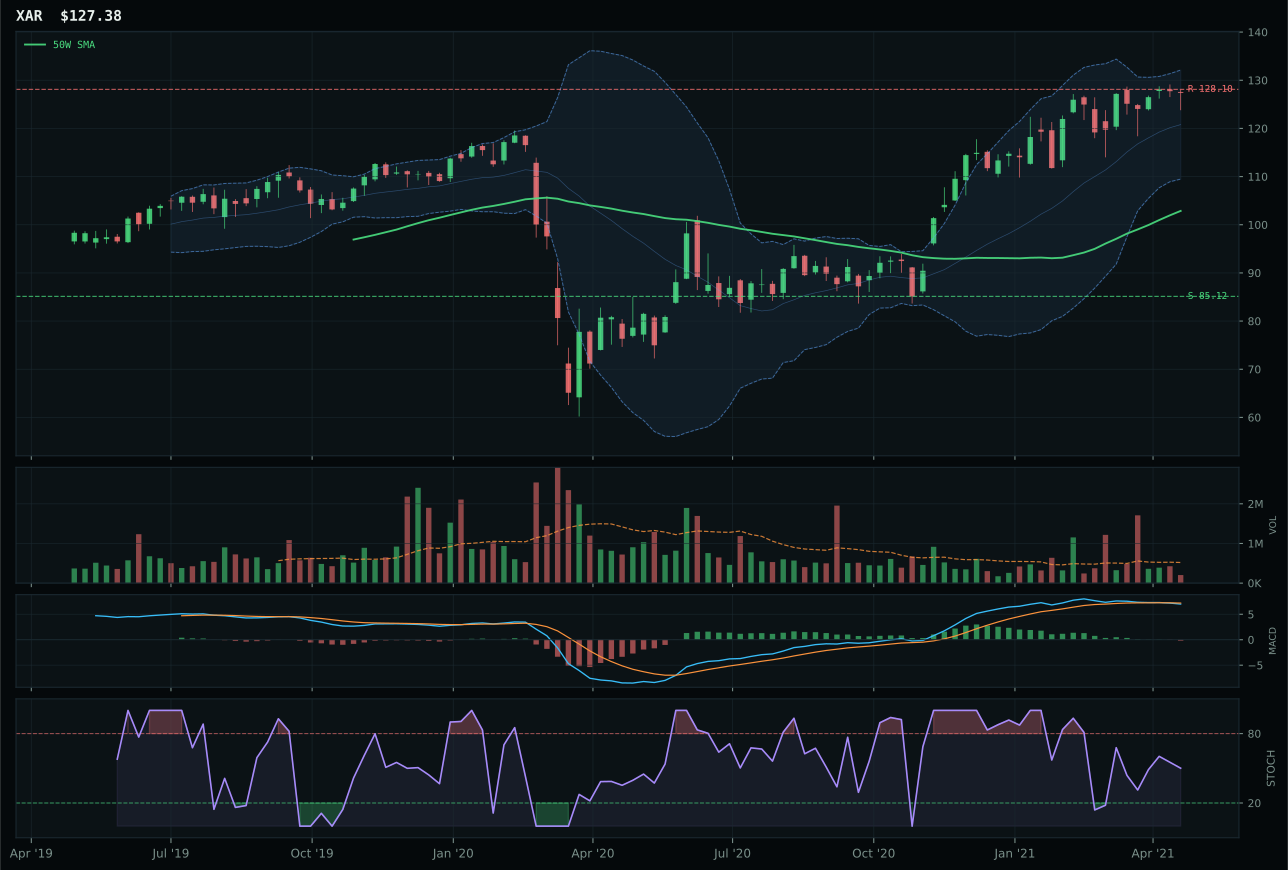
XAR has a vertical extension profile with -2.1% 13-week relative strength versus SPY.
A failed hold above support would weaken the setup.
Actionable but governed by invalidation levels.
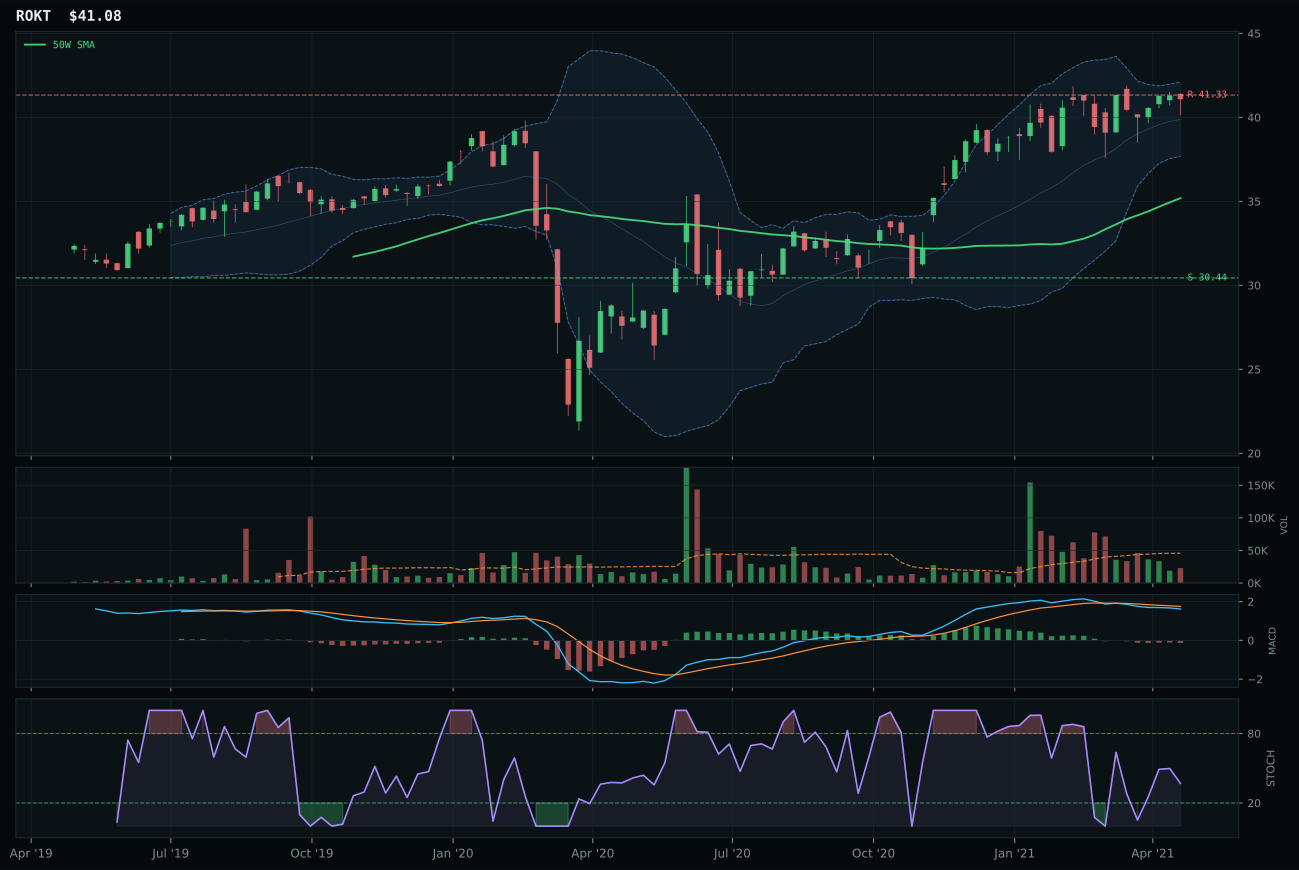
ROKT has a vertical extension profile with -5.3% 13-week relative strength versus SPY.
A failed hold above support would weaken the setup.
Tracked, but not top-2 eligible because: .
ITA wins the category with perfect trend score (100.0) and dominant momentum confirmation (82.1/100) because price sits above both the 50W and 200W with positive 50W slope and category-relative strength of 5.5%. However, timing is compressed to 32.0 because the setup is extended 18.2% above the 50W with MACD bullish but flattening and stochastic RSI overbought at 0.86—the classic late-cycle signal. Runner-up XAR suffers from weaker MACD (bearish/weakening vs bullish flattening), inferior category-relative strength (0.0%), and being stretched even further from the 50W at 23.8%, making ITA the clear winner despite both trades offering compressed upside-to-resistance ratios.
Defense & Aerospace receives 5% as a tier-2 category, ineligible for top-2 despite a respectable 43.7 score. The category benefits from neutral macro fit (55.0/100) because the current transition regime and modest credit stress relief actually favor stable cash-generative defense prime. ITA's 62.1 technical evidence score is solid, but the extended vertical structure and overbought stochastic RSI prevent category elevation. To reach top-2 would require either a clear near-term pullback that resets timing risk, or acceleration in defense-specific geopolitical/budget narrative. As is, this category offers defensive shelter with limited upside compression and serves as a hedge rather than an outright capital deployment opportunity.
Technology — IGV
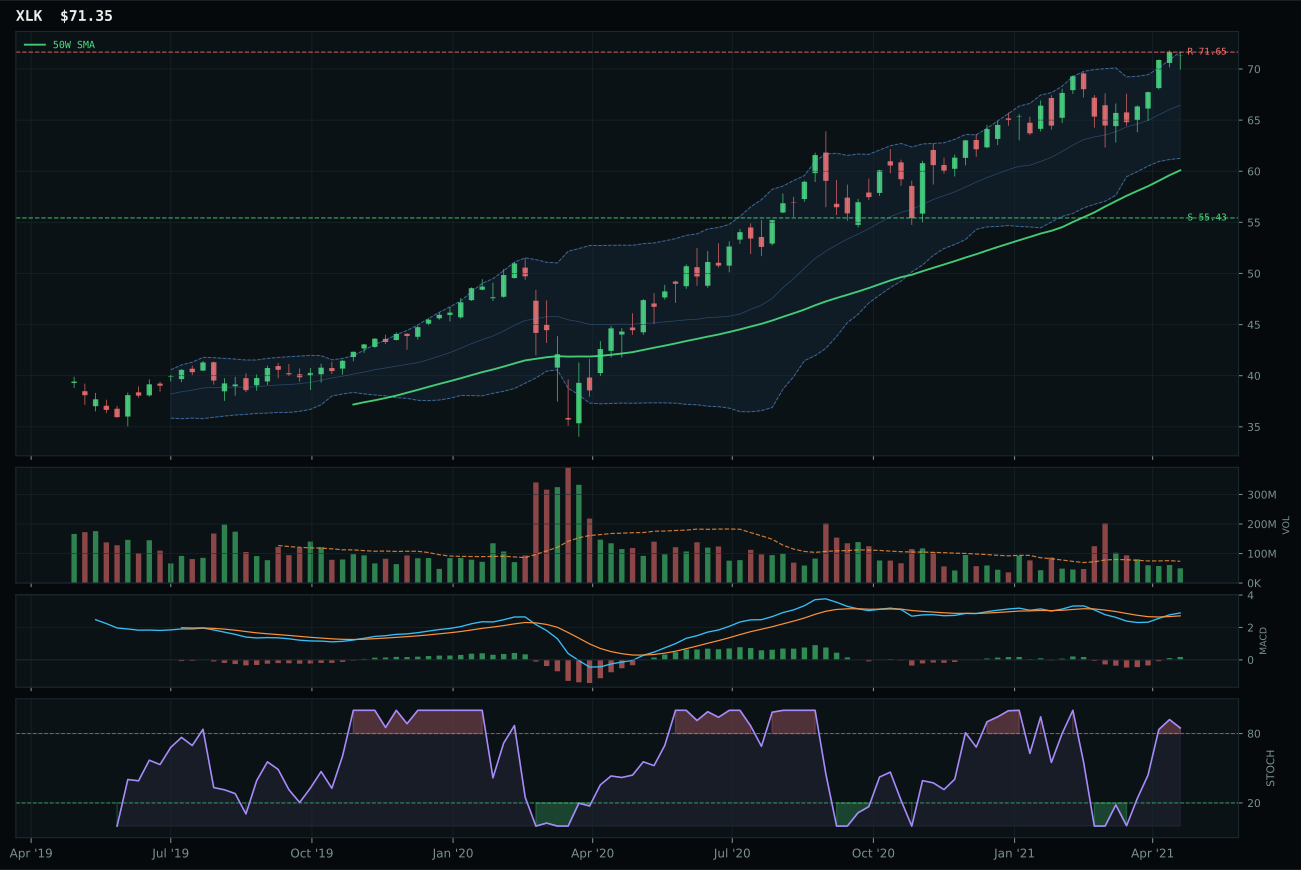
XLK has a vertical extension profile with -1.4% 13-week relative strength versus SPY.
A failed hold above support would weaken the setup.
Actionable but governed by invalidation levels.
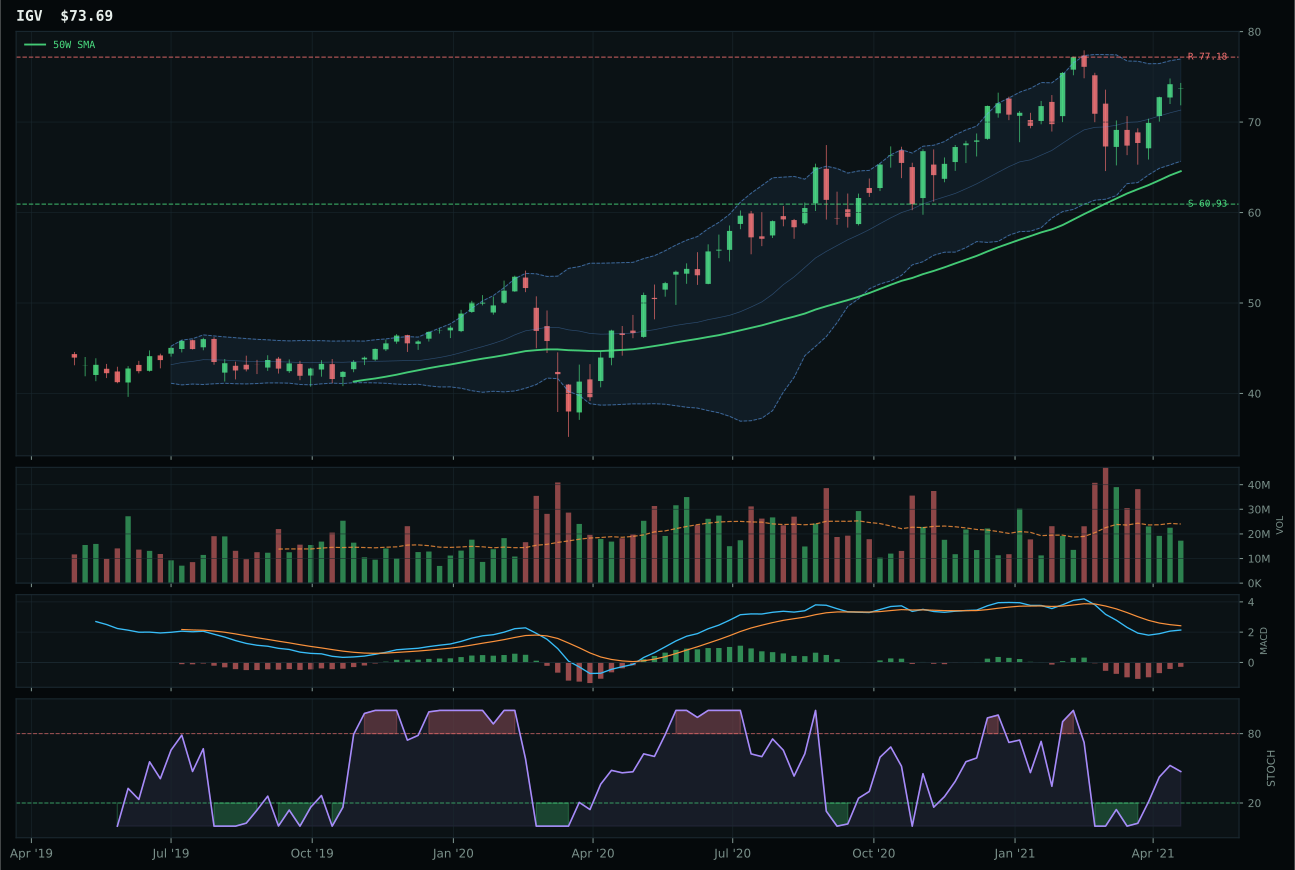
IGV has a neutral structure profile with -6.2% 13-week relative strength versus SPY.
A failed hold above support would weaken the setup.
Actionable but governed by invalidation levels.
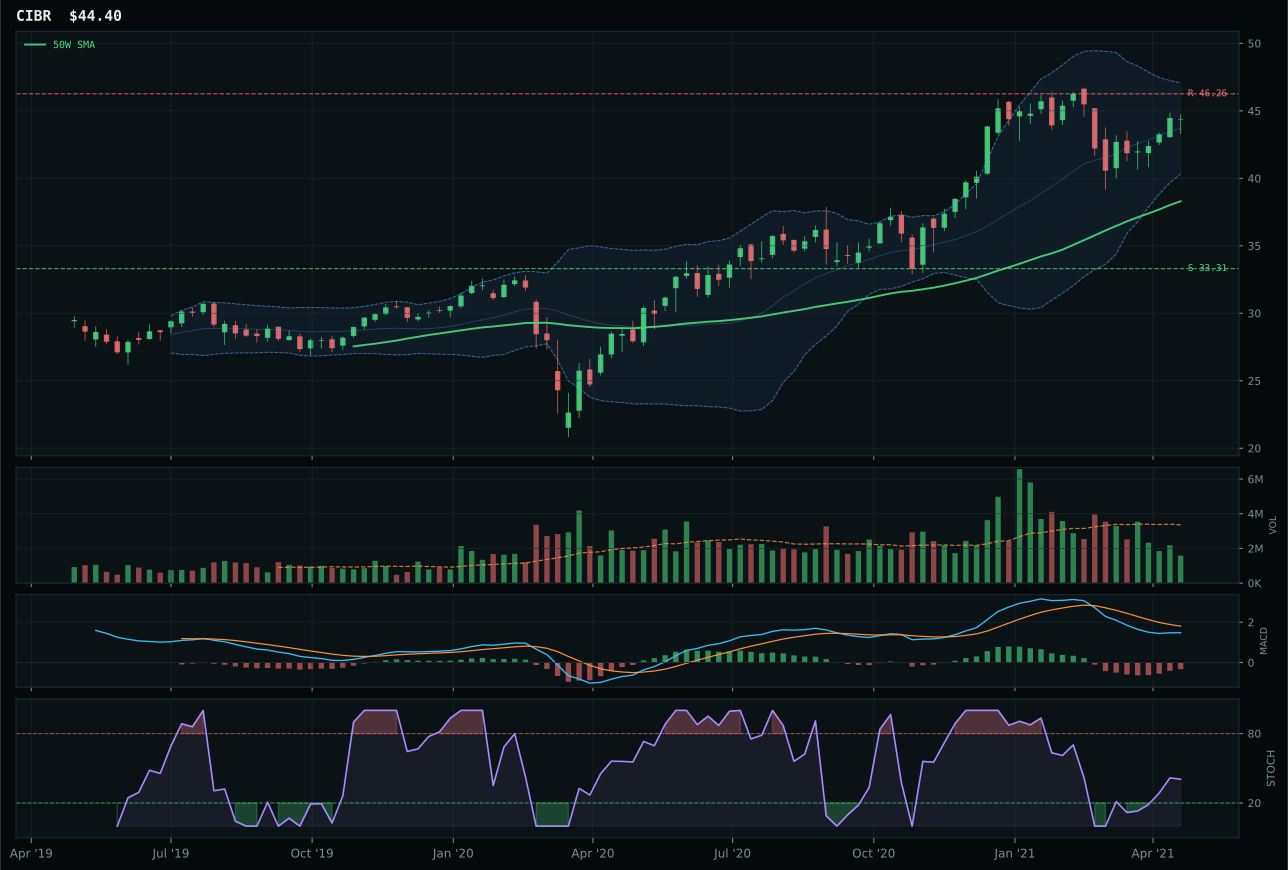
CIBR has a vertical extension profile with -11.7% 13-week relative strength versus SPY.
A failed hold above support would weaken the setup.
Actionable but governed by invalidation levels.
IGV wins the category because its timing setup offers superior entry risk management relative to the field. Price sits 14.1% above the 50W in neutral structure with stochastic RSI rising from the mid-zone at 0.47, whereas runner-up XLK is stretched 18.2% above its 50W in vertical extension with stochastic RSI overbought at 0.86—a setup that punishes new buyers. IGV's MACD is bearish but improving with category-relative strength at parity (0.0%), giving it a cleaner technical profile than XLK's more extended momentum situation. The score gap of 6.8 points reflects a decisive win in timing (83.0 vs 37.0) and risk/reward (48.9 vs 37.3), with volume thin across both but IGV's pullback structure offering better asymmetry for entry.
Technology earns 5% allocation as a tier-2 category, ranked below two higher-eligible final scores. The category's 34.2 score reflects a mixed technical-macro picture: credit stress and inflation pressure are both active headwinds, weighing on duration-sensitive software exposure. IGV's trend is crisp at 83.8/100 but timing at 83.0 cannot offset the category-level macro fit of just 39.0/100—the blended regime penalizes growth when real rates are rising and corporate credit stress is present. To graduate to top-2 would require either a macro regime shift toward lower rates or demonstrable breadth improvement inside the basket, neither of which is evident this week.
Emerging Markets — ILF
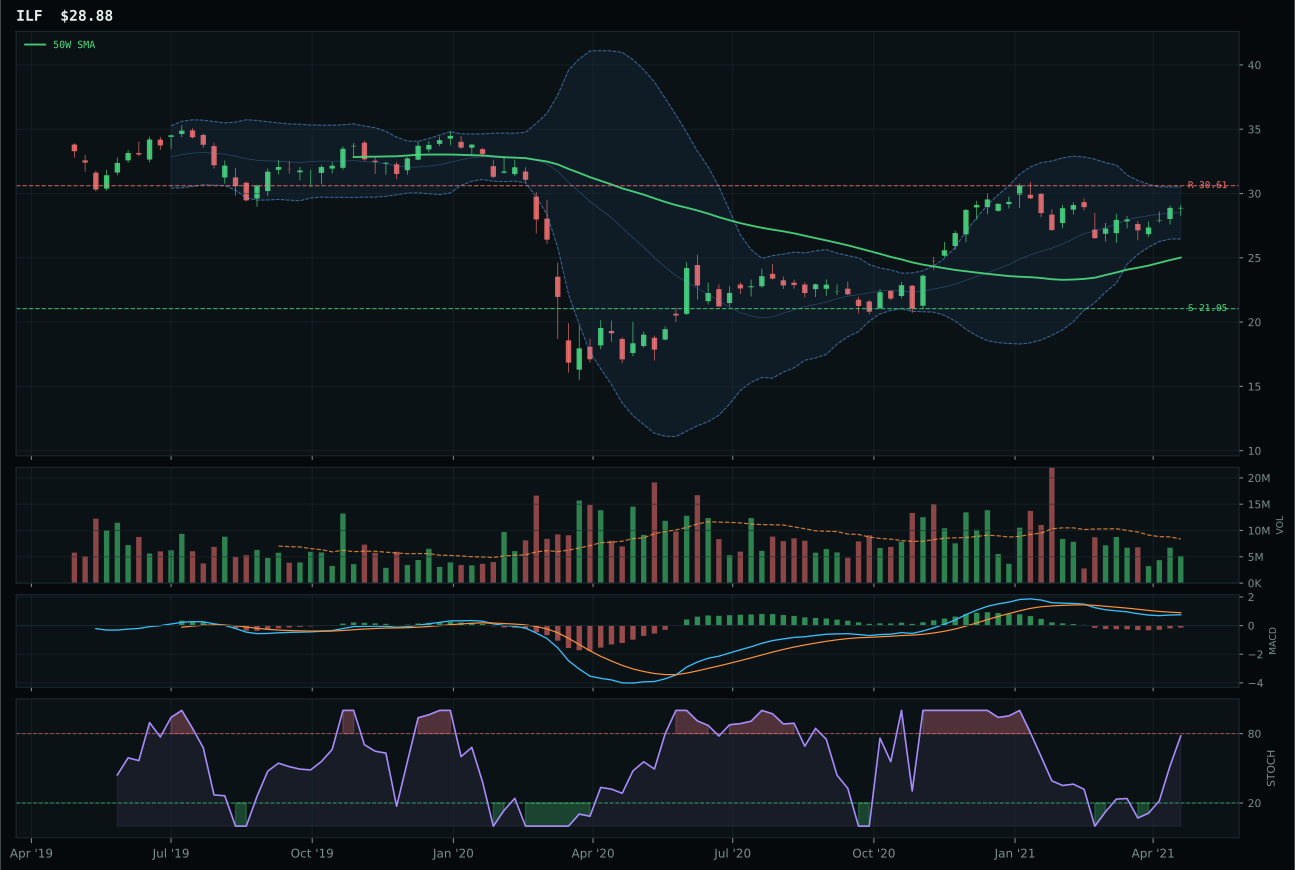
ILF has a vertical extension profile with -7.4% 13-week relative strength versus SPY.
A failed hold above support would weaken the setup.
Actionable but governed by invalidation levels.
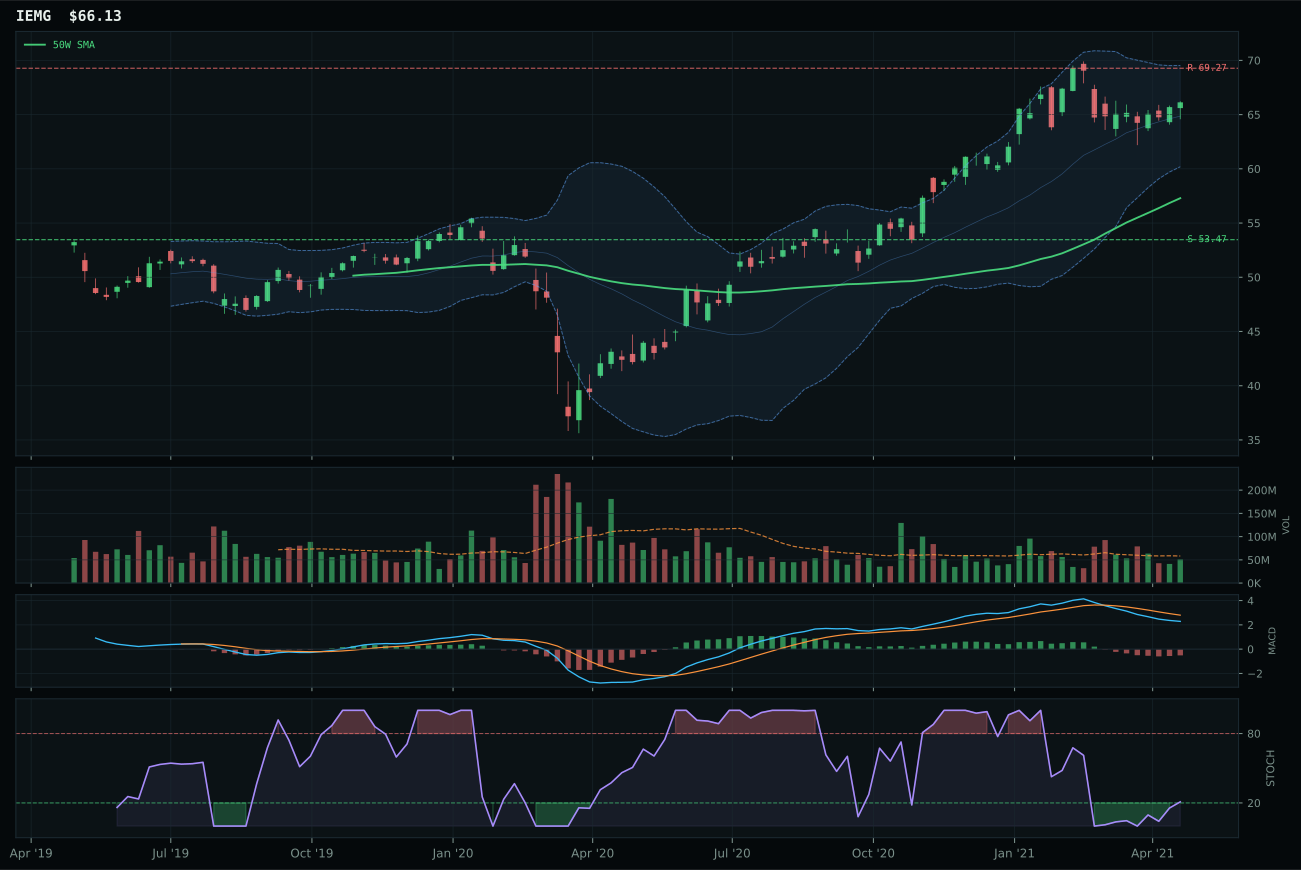
IEMG has a vertical extension profile with -9.9% 13-week relative strength versus SPY.
A failed hold above support would weaken the setup.
Actionable but governed by invalidation levels.
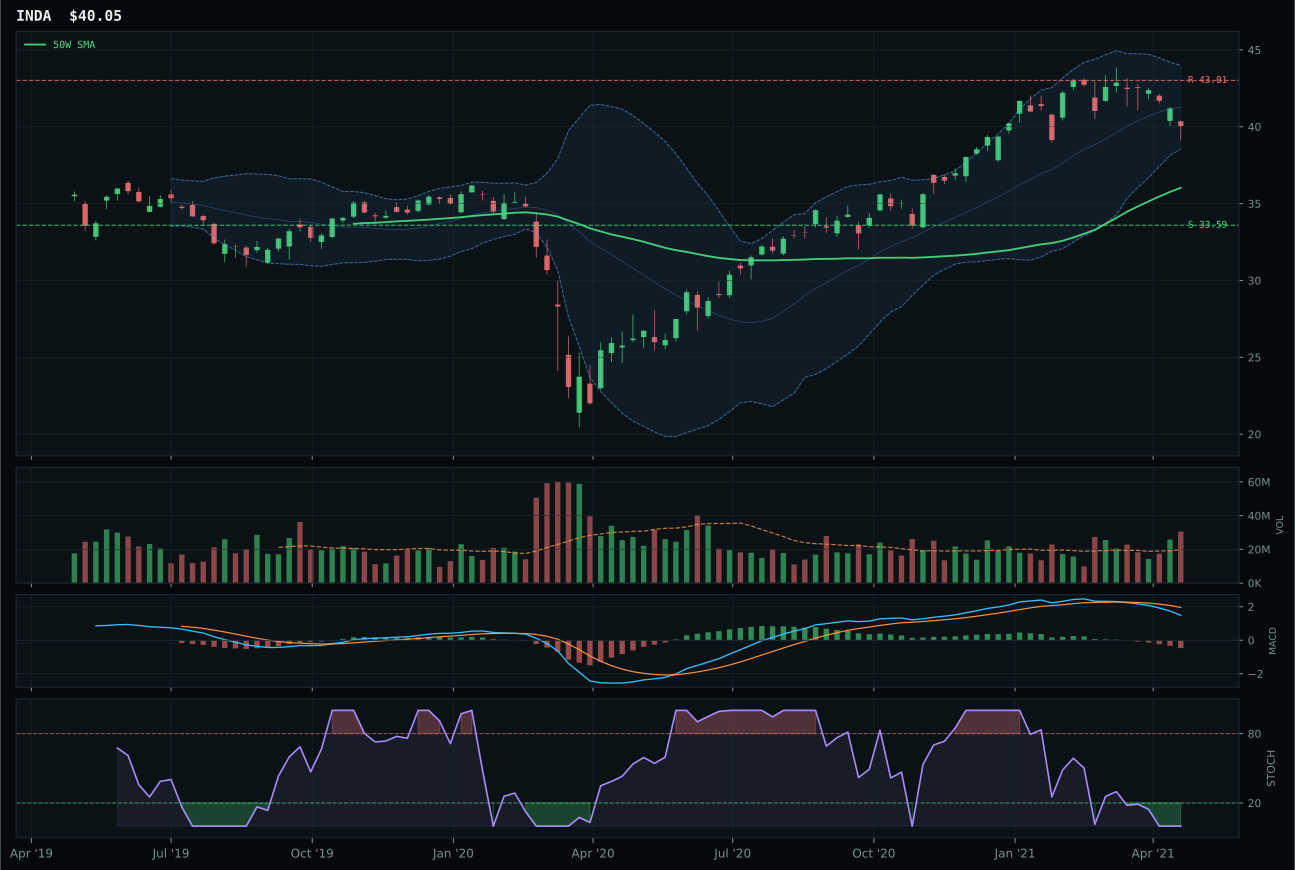
INDA has a neutral structure profile with -12.0% 13-week relative strength versus SPY.
A failed hold above support would weaken the setup.
Actionable but governed by invalidation levels.
ILF wins the category narrowly with 3.0-point margin over runner-up IEMG by offering better timing (61.0 vs 56.0) and category-relative strength (2.5% vs 0.0%), though both trades sit in extended vertical structures. ILF sits 15.4% above the 50W with bearish but improving MACD and rising stochastic RSI at 0.78, whereas IEMG is more extended and carries bearish/weakening MACD, making ILF's setup slightly less deteriorated. The category-relative strength differential is key: commodity-linked Latin America (ILF) is outperforming broad emerging market beta (IEMG) in this inflationary commodity-bullish regime, reflecting portfolio rotation toward real assets over EM carry.
Emerging Markets receives 0% allocation this week, ranking 9th or 10th with a category-level score of 33.2 that falls below portfolio minimum thresholds. Technical evidence is weak across the board (41.3/100 for the representative), with all three candidates showing extended price structures and deteriorating MACD—the category failed a basic validity test. Though macro fit is reasonable (54.0/100) with EM liquidity support active, the technical weakness is disqualifying when credit stress is simultaneously active. ILF's commodity leverage offers theoretical appeal in an inflation regime, but thin volume and below-200W price structure on the representative indicate insufficient institutional commitment. To earn even a minimal allocation, this category would need either cleaner technical setups at support levels or explicit reversal signals in the credit stress descriptor.
AI — BOTZ
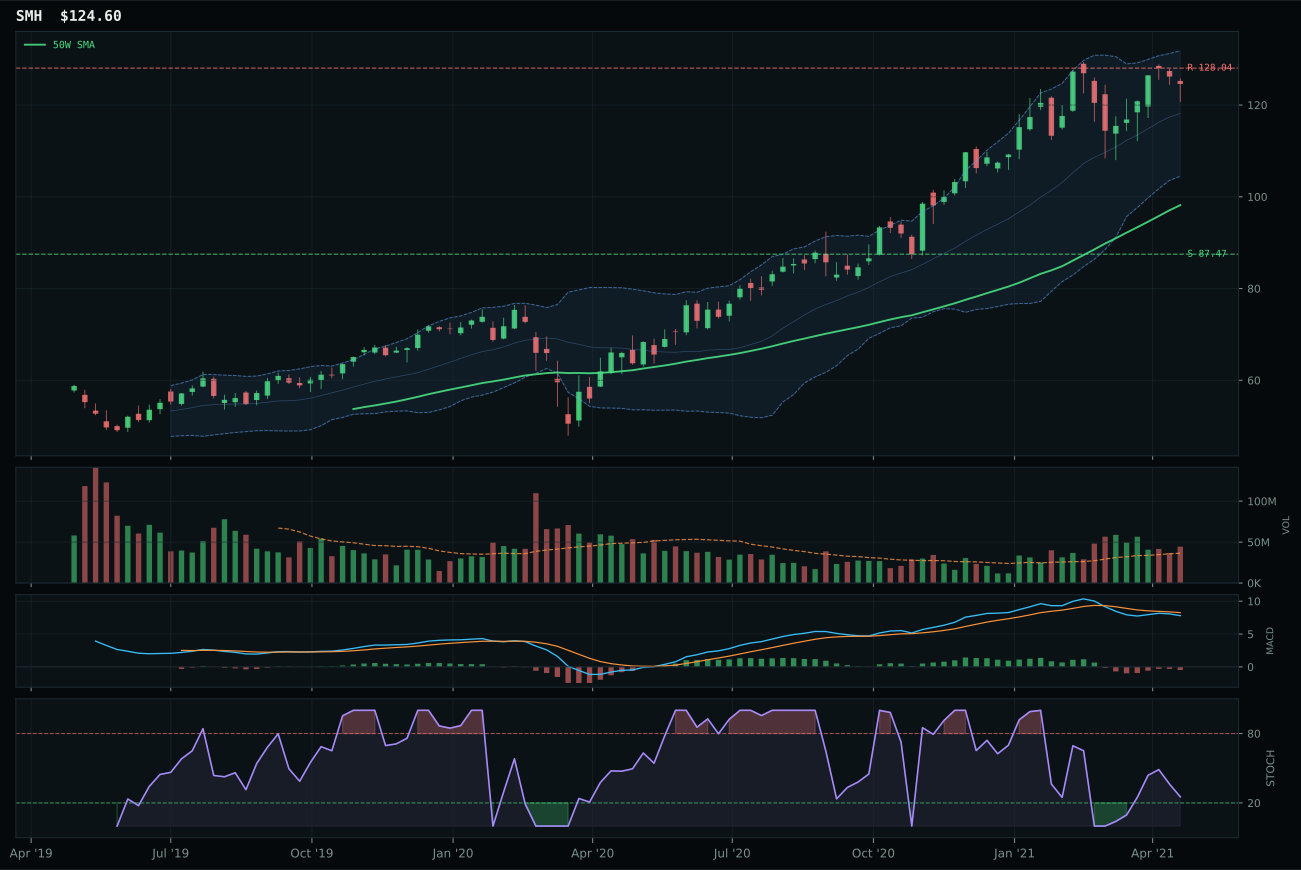
SMH has a vertical extension profile with -5.4% 13-week relative strength versus SPY.
A failed hold above support would weaken the setup.
Actionable but governed by invalidation levels.
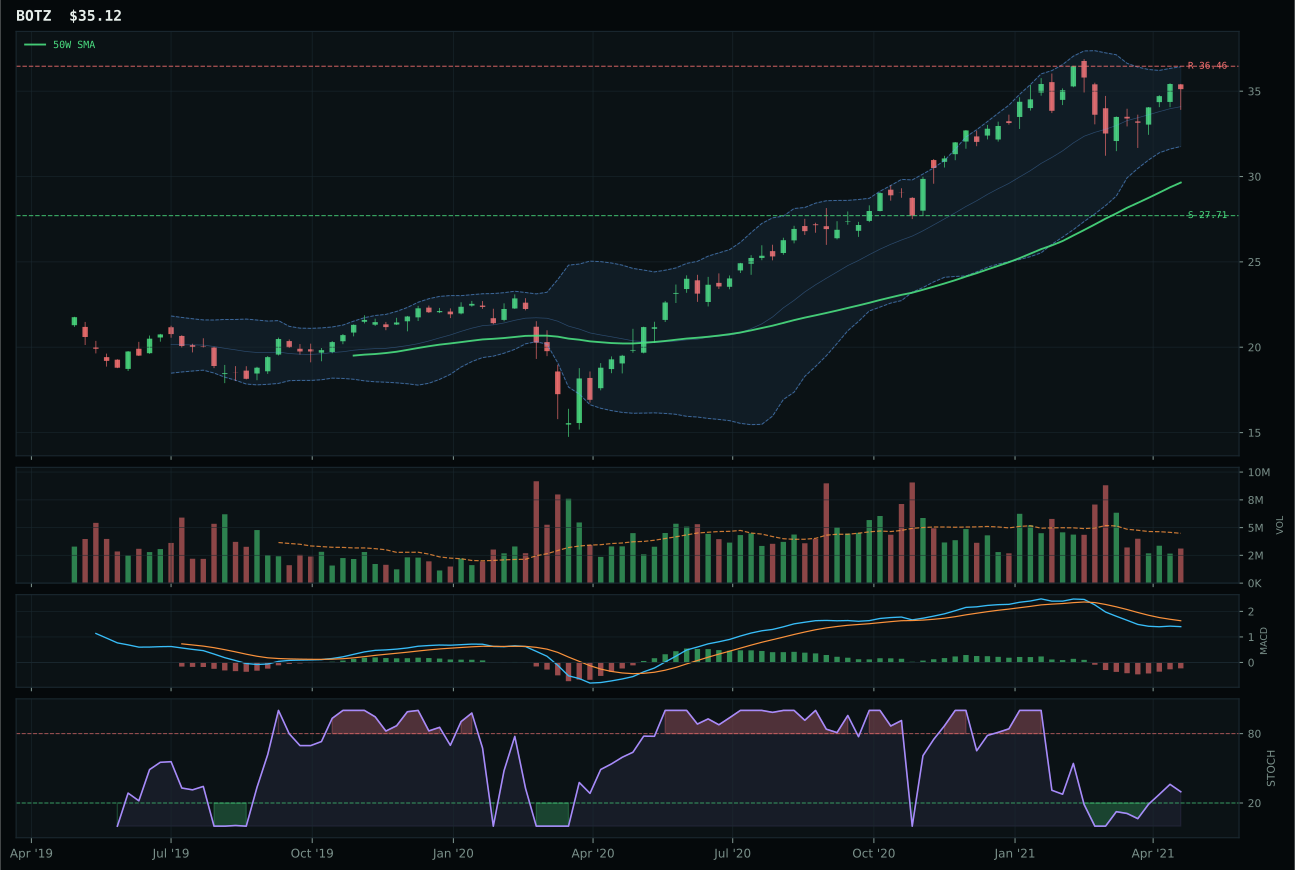
BOTZ has a vertical extension profile with -9.7% 13-week relative strength versus SPY.
A failed hold above support would weaken the setup.
Actionable but governed by invalidation levels.
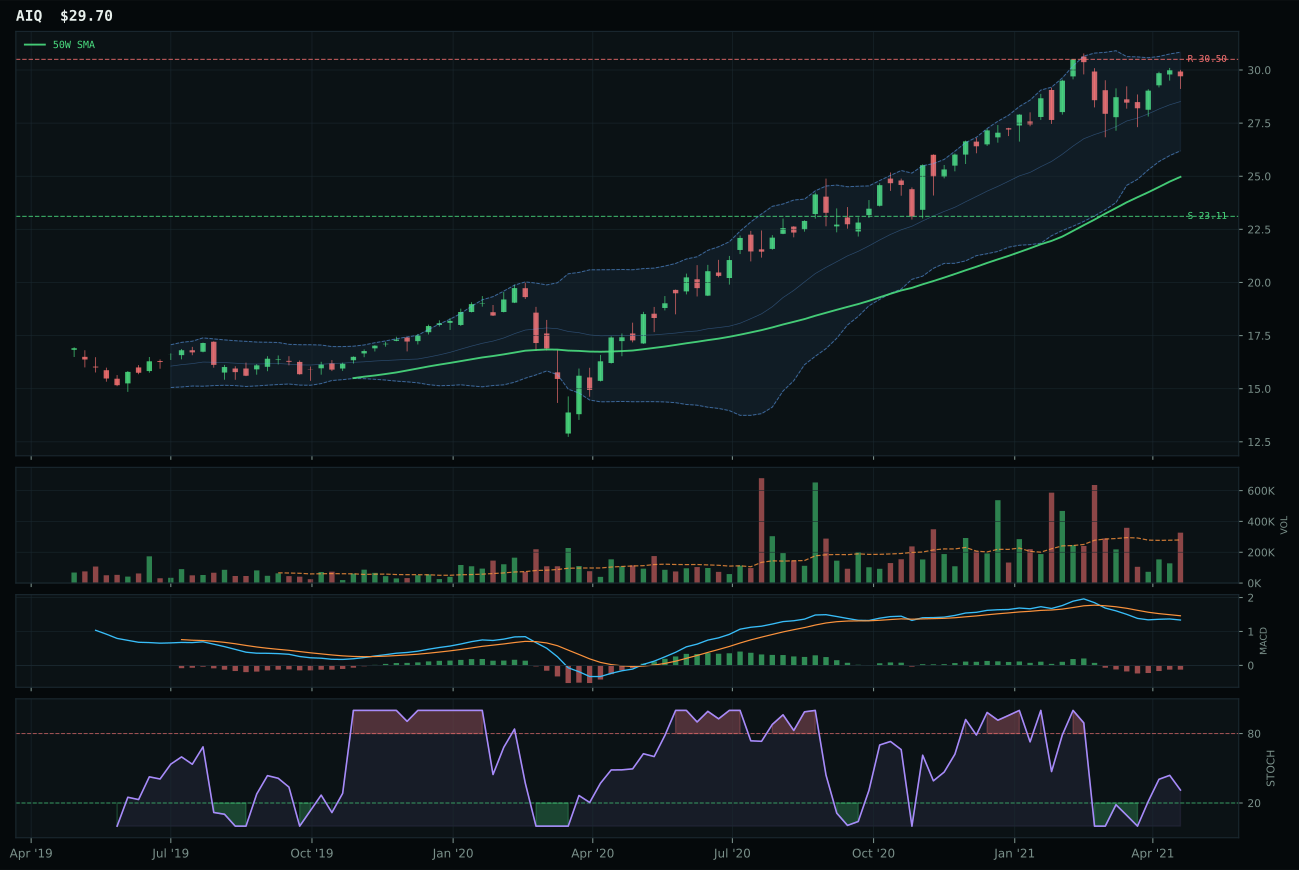
AIQ has a vertical extension profile with -5.2% 13-week relative strength versus SPY.
A failed hold above support would weaken the setup.
Tracked, but not top-2 eligible because: .
BOTZ captures category leadership despite a softer macro environment because its timing score (61.0) and stochastic RSI placement (rising mid-zone at 0.30) offer better entry geometry than runner-up SMH, which is stretched 26.9% from the 50W with stochastic RSI falling into neutral territory. BOTZ sits 18.5% extended with MACD bearish but improving, positioning itself for lower-risk accumulation than SMH's more extended and momentum-divergent setup. Risk/reward is 47.5 for BOTZ versus 38.1 for SMH, and though both face headwinds from credit stress, BOTZ's lower momentum confirmation (34.0 vs 56.0) actually reflects a more honest entry point when category breadth is deteriorating.
AI receives 0% allocation this week, ranking 9th or 10th among eligible categories. The final category score of 30.0 reflects weak technical evidence (38.3/100 for the representative) combined with neutral macro fit (42.0/100 category-level) in a credit-stressed transition regime. SMH's superior reasoned ranking (49.0 vs BOTZ's 39.7) based on compute and semi strength could not overcome the category's overall weakness; even with bullish MACD and above-average volume, the setup is too extended and the macro backdrop too hostile. This category would need either a clear rotation into AI-specific demand signals or a marked improvement in the credit stress indicator before earning even a minimal 5% position.