
2021-04-16
Informational purposes only. The content in this report, including allocations, analysis, and commentary, is provided solely for informational and educational purposes. It does not constitute financial advice, investment advice, trading advice, or any other type of advice. Past performance does not guarantee future results. Always conduct your own research and consult a qualified financial professional before making investment decisions.
Weekly Allocation
| Ticker | Category | Weight | Role |
|---|---|---|---|
| FSOL | 50% | Overlay | |
| XLE | Traditional Energy | 10% | Top-2 (10%) |
| XLU | Utilities & Infrastructure | 10% | Top-2 (10%) |
| WEAT | Agriculture & Livestock | 5% | Tier-2 (5%) |
| COPX | Industrial Metals | 5% | Tier-2 (5%) |
| URA | Nuclear Energy | 5% | Tier-2 (5%) |
| SLV | Precious Metals | 5% | Tier-2 (5%) |
| XAR | Defense & Aerospace | 5% | Tier-2 (5%) |
| XLK | Technology | 5% | Tier-2 (5%) |
Trade Instructions — Monday Open
Sell the tranche from 2021-03-19 (completing its 4-week hold). Buy the new tranche. Instructions show net portfolio changes — same-asset positions cancel, weight changes show the delta.
| Action | Ticker | Instruction |
|---|---|---|
| SELL | FCG | Sell entire FCG position (2.50% of portfolio) |
| SELL | URA | Sell 33% of URA position (reduce 3.75% → 2.50%) |
| SELL | MOO | Sell 25% of MOO position (reduce 5.00% → 3.75%) |
| SELL | ITA | Sell 50% of ITA position (reduce 2.50% → 1.25%) |
| SELL | PICK | Sell 25% of PICK position (reduce 5.00% → 3.75%) |
| SELL | PAVE | Sell 50% of PAVE position (reduce 2.50% → 1.25%) |
| BUY | XLE | Buy XLE — 28.57% of freed cash (adds 2.50% to portfolio) |
| BUY | XLU | Buy XLU — 28.57% of freed cash (adds 2.50% to portfolio) |
| BUY | COPX | Buy COPX — 14.29% of freed cash (adds 1.25% to portfolio) |
| BUY | XAR | Buy XAR — 14.29% of freed cash (adds 1.25% to portfolio) |
| BUY | WEAT | Buy WEAT — 14.29% of freed cash (adds 1.25% to portfolio) |
Current Portfolio After Trade
Combined holdings across all 4 active tranches. Each tranche is 25% of the portfolio.
| Ticker | % of Portfolio | Weight Bar |
|---|---|---|
| FSOL | 50.00% | |
| XLE | 10.00% | |
| URNM | 5.00% | |
| XLU | 5.00% | |
| MOO | 3.75% | |
| PICK | 3.75% | |
| SLV | 3.75% | |
| XLK | 3.75% | |
| SMH | 3.75% | |
| URA | 2.50% | |
| COPX | 2.50% | |
| XAR | 2.50% | |
| ITA | 1.25% | |
| PAVE | 1.25% | |
| WEAT | 1.25% |
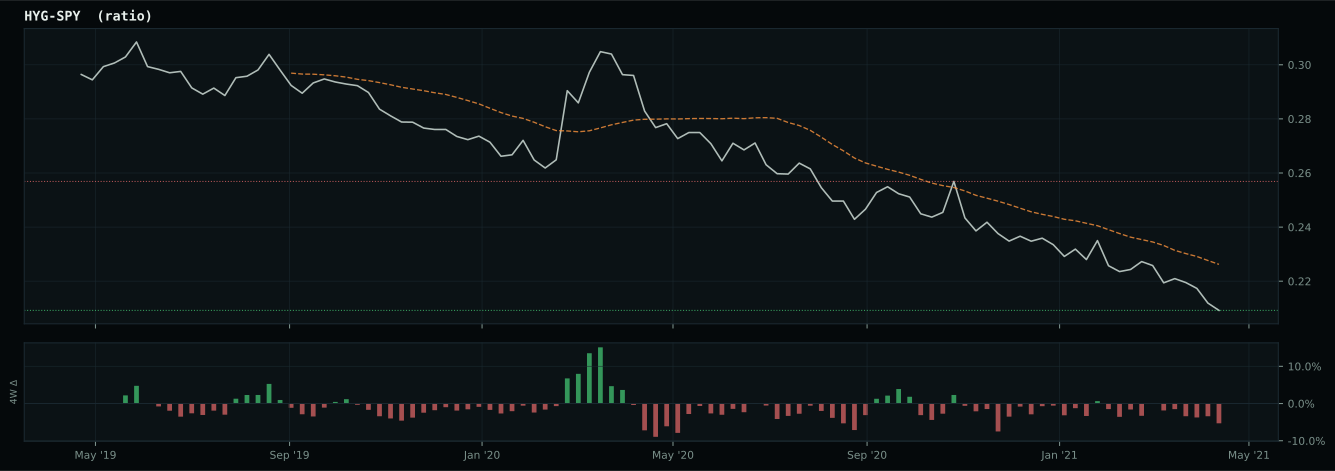
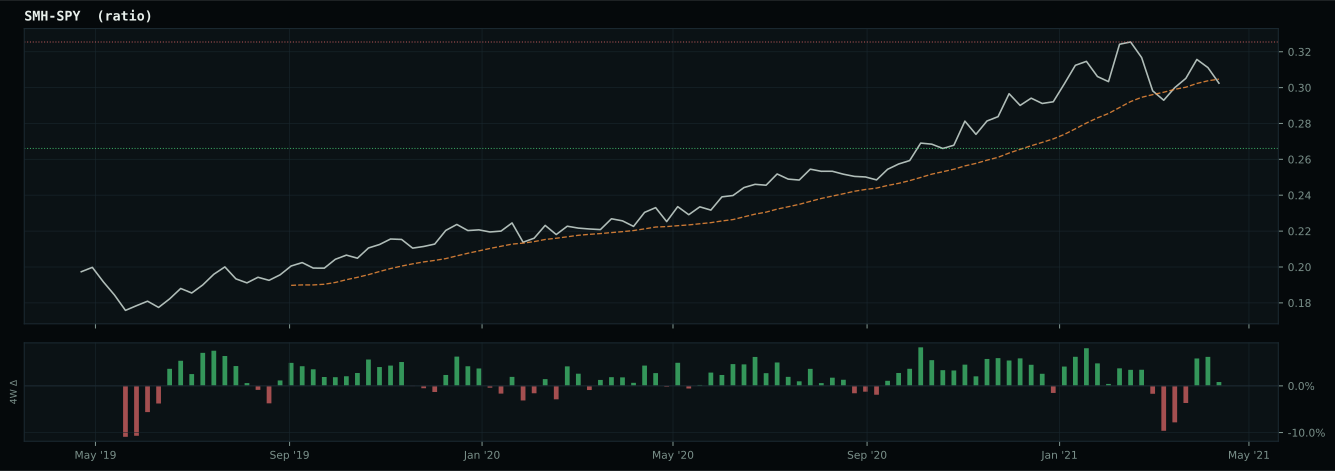
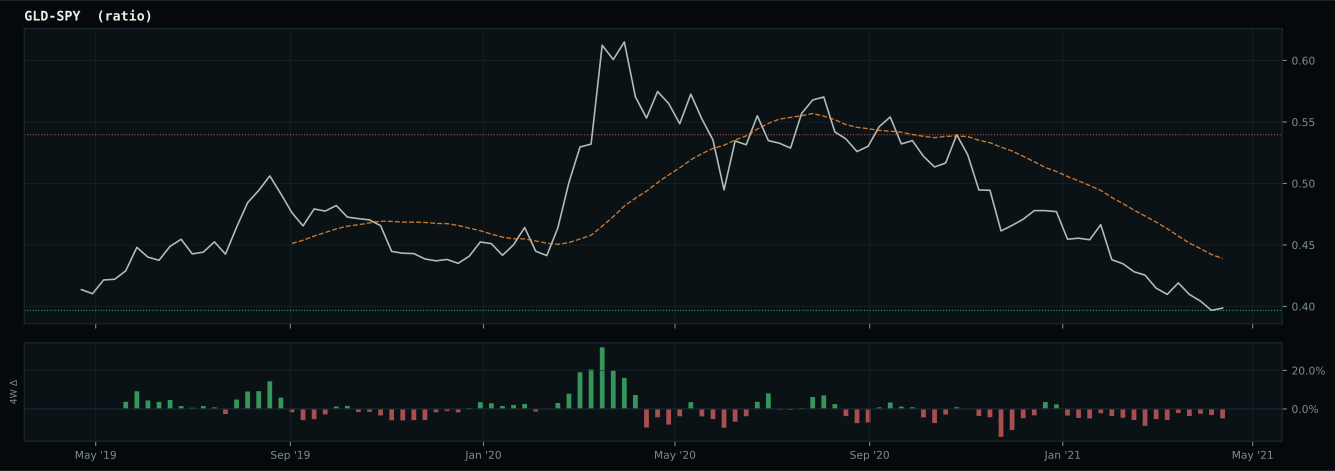
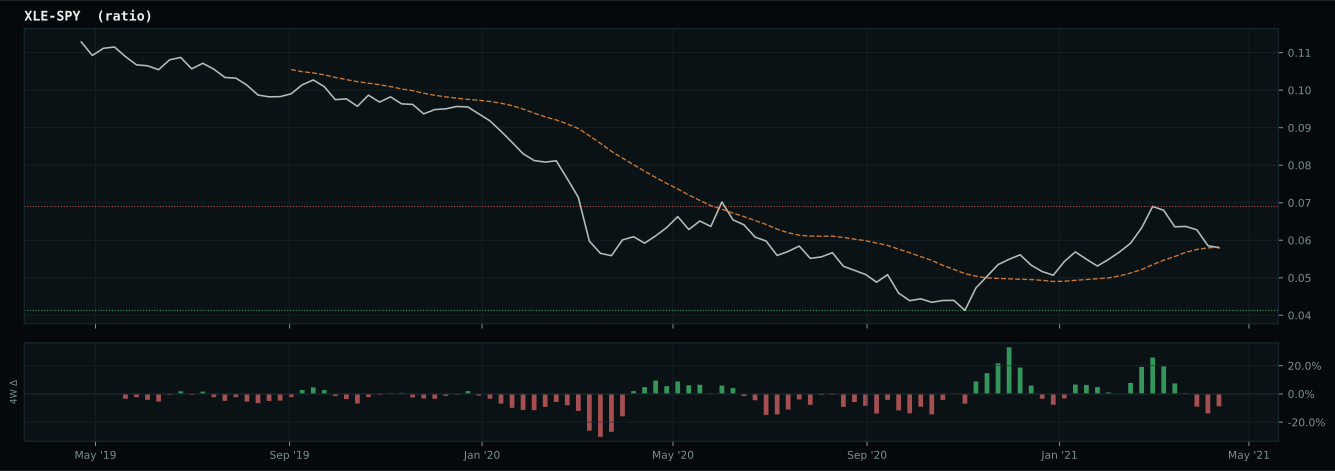
Macro Regime — Transition / Mixed
liquidity is improving but credit stress remains elevated
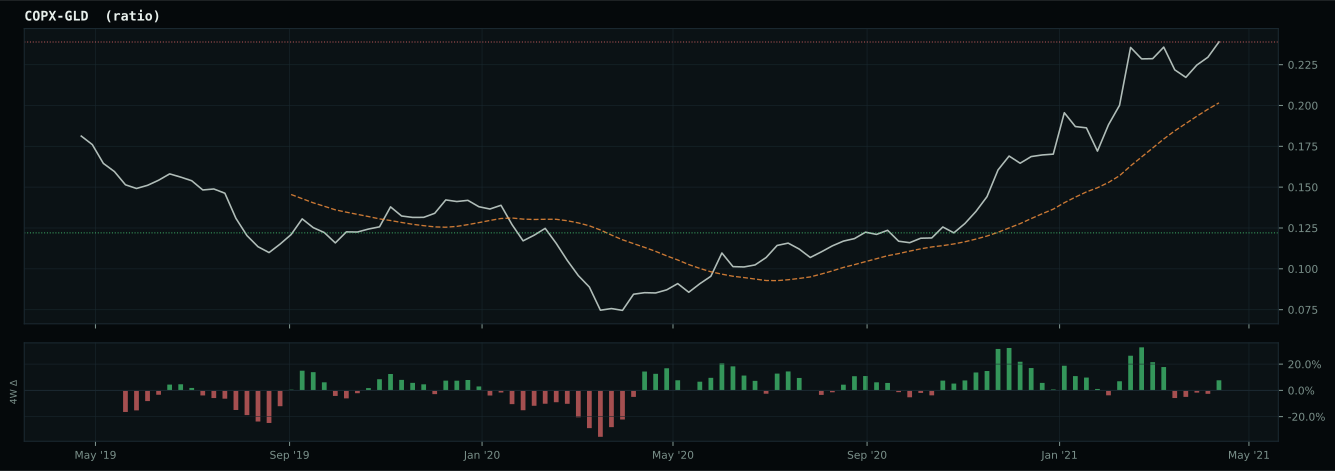
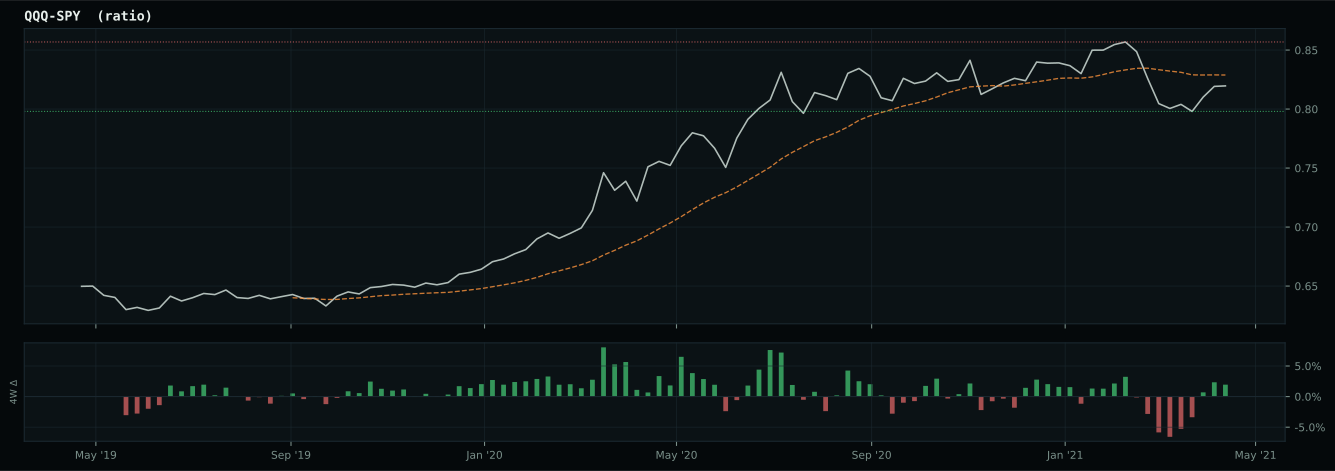
Macro Evidence Charts
Market-implied signals behind the macro regime scores. Each ratio compares two assets; the direction and slope of the ratio is what the macro engine reads.
Crypto Regime — AltSeason
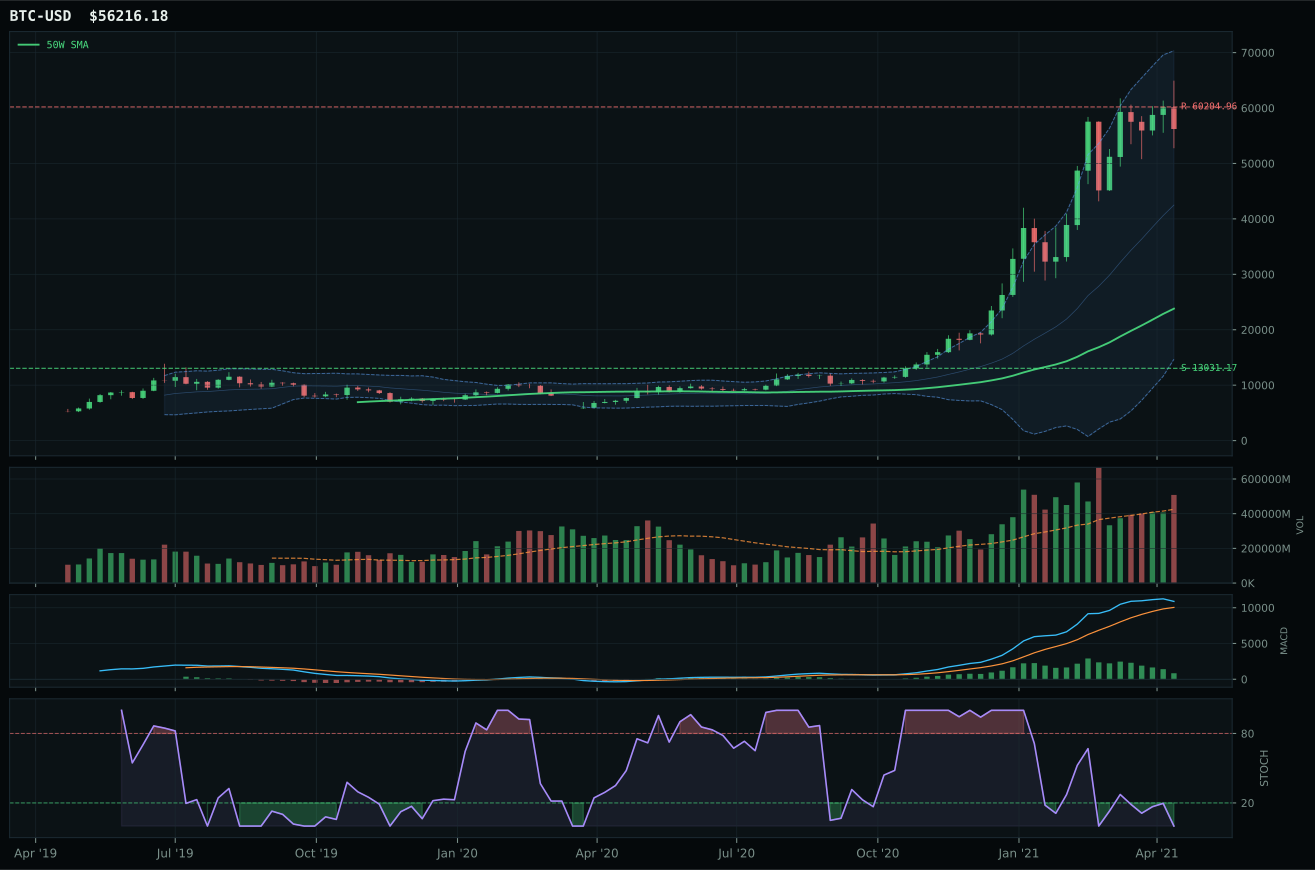
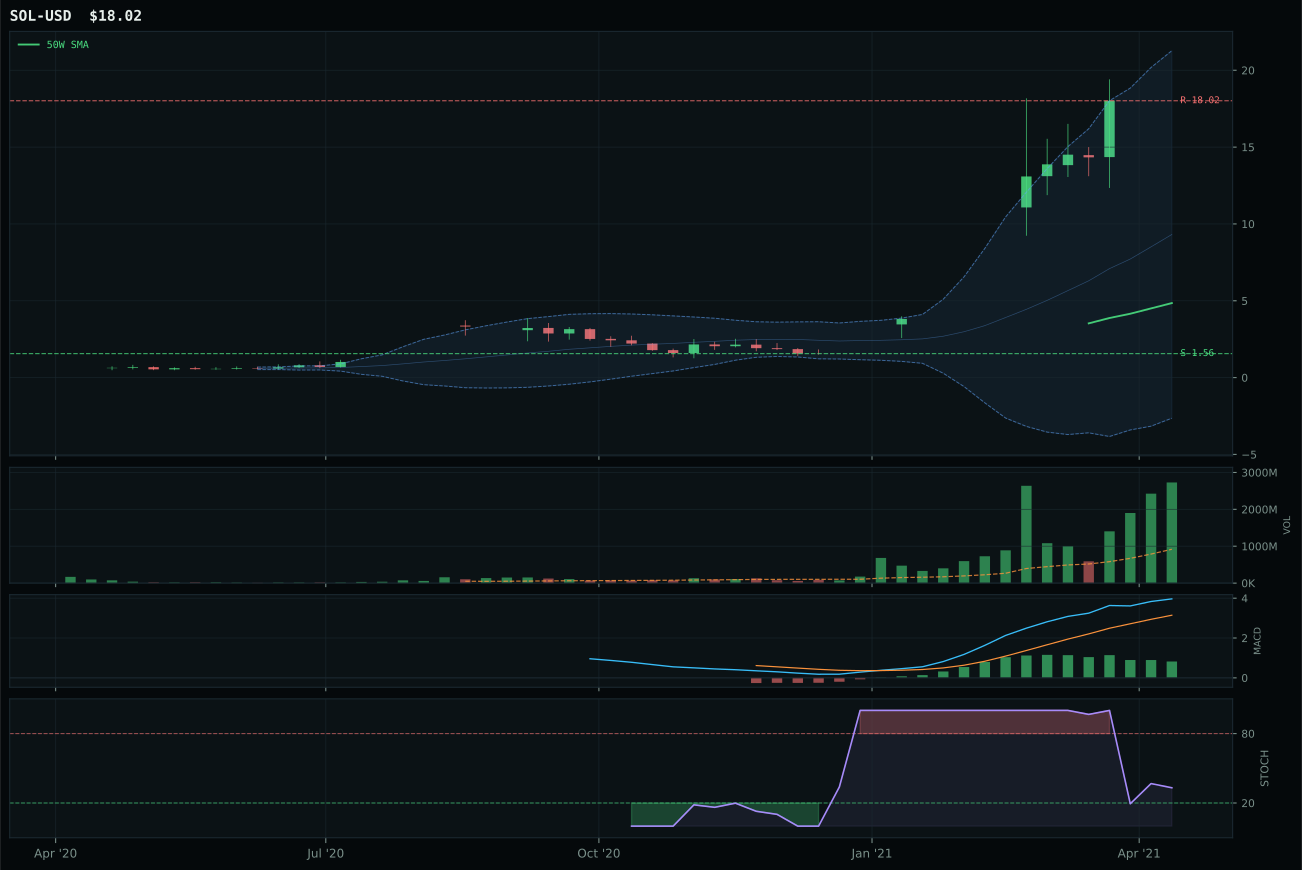
post-touch structure is too wide to count as a range; max/min close ratio is 11.16
TrendBTC confirmed: 2 consecutive closes above rising/flat 50W SMA
all available AltSeason conditions pass; missing optional confirmations skipped
Category Rankings
| Rank | Category | Winner | Score | Alloc | 4W Ret | Peers (4W) |
|---|---|---|---|---|---|---|
| 1 | Traditional Energy | XLE | 62.5 | 20% | +9.90% | FCG +14.6% · XOP +10.5% |
| 2 | Utilities & Infrastructure | XLU | 60.0 | 20% | -2.04% | PAVE +4.5% · IGF +0.6% |
| 3 | Agriculture & Livestock | WEAT | 56.1 | 10% | +6.11% | MOO +2.8% · VEGI +2.5% |
| 4 | Industrial Metals | COPX | 53.5 | 10% | +4.95% | PICK +4.6% · REMX -1.5% |
| 5 | Nuclear Energy | URA | 52.0 | 10% | +10.30% | NLR +1.6% · URNM +13.9% |
| 6 | Precious Metals | SLV | 47.3 | 10% | +6.81% | GDX +6.8% · GLD +4.5% |
| 7 | Defense & Aerospace | XAR | 41.2 | 10% | -2.79% | ITA -0.1% · ROKT -3.3% |
| 8 | Technology | XLK | 36.4 | 10% | -5.24% | IGV -7.7% · CIBR -3.5% |
| 9 | AI | SMH | 29.8 | 0% | -8.22% | BOTZ -8.4% · AIQ -7.1% |
| 10 | Emerging Markets | IEMG | 18.7 | 0% | -2.82% | ILF +3.0% · INDA +5.8% |
Traditional Energy — XLE
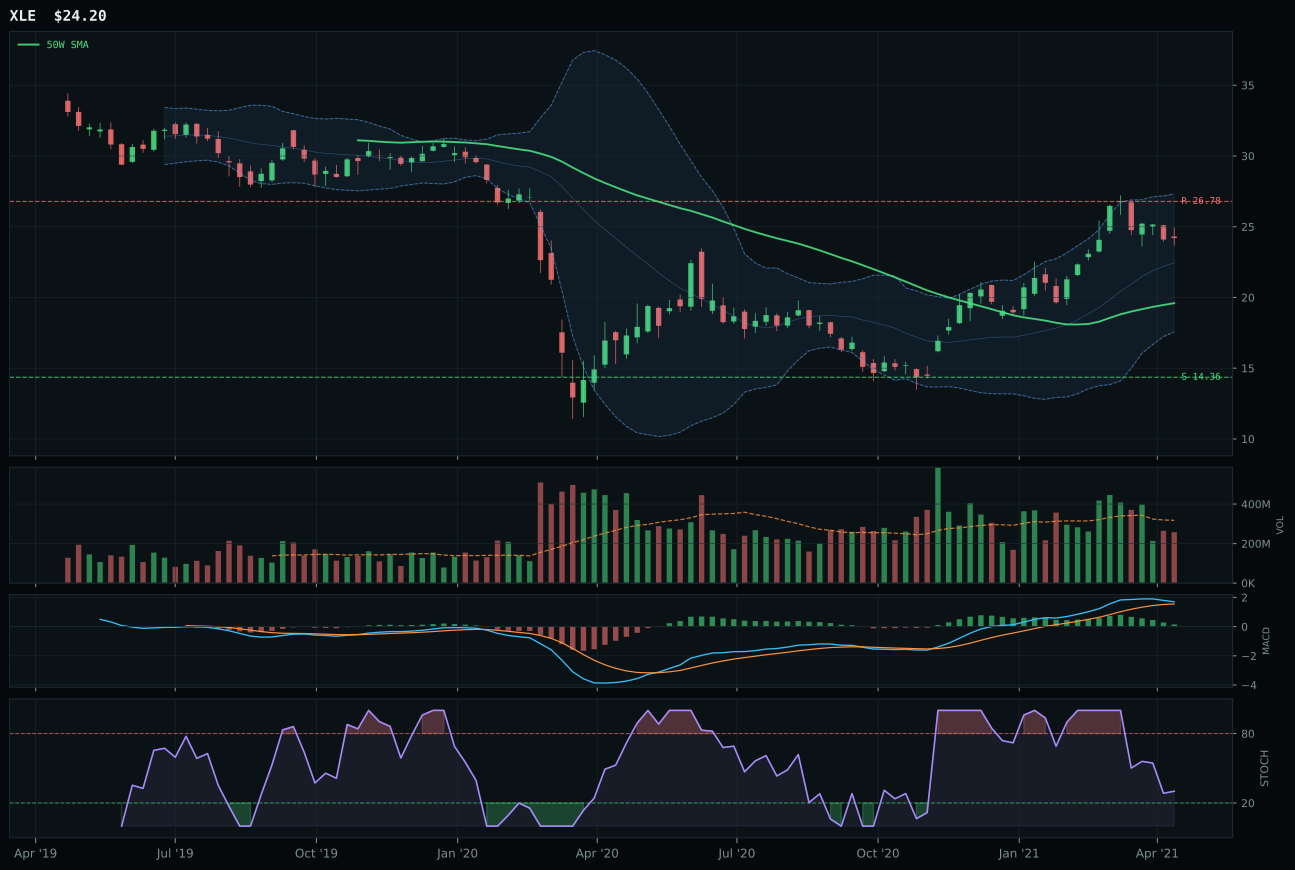
XLE has a vertical extension profile with 2.2% 13-week relative strength versus SPY.
A failed hold above support would weaken the setup.
Actionable but governed by invalidation levels.
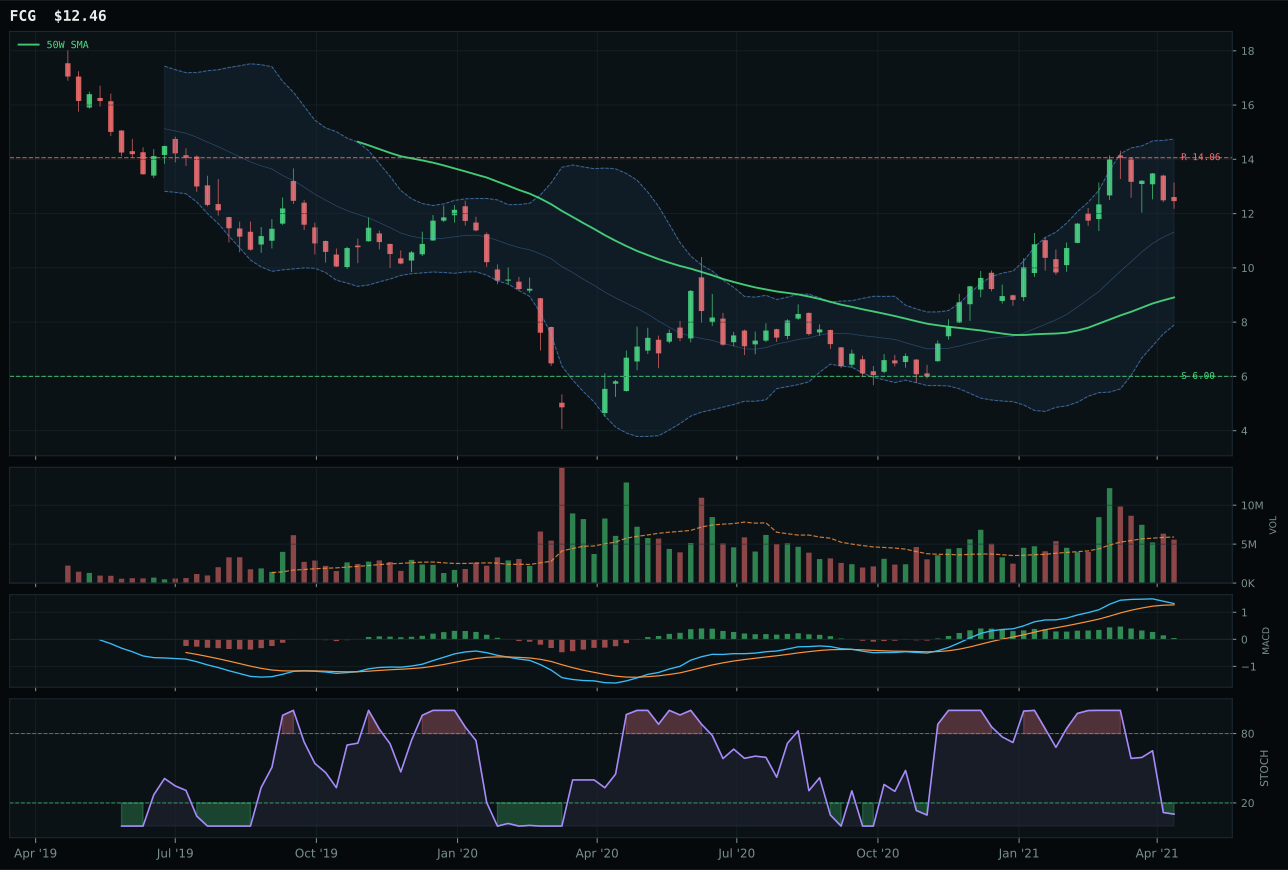
FCG has a vertical extension profile with 3.6% 13-week relative strength versus SPY.
A failed hold above support would weaken the setup.
Actionable but governed by invalidation levels.
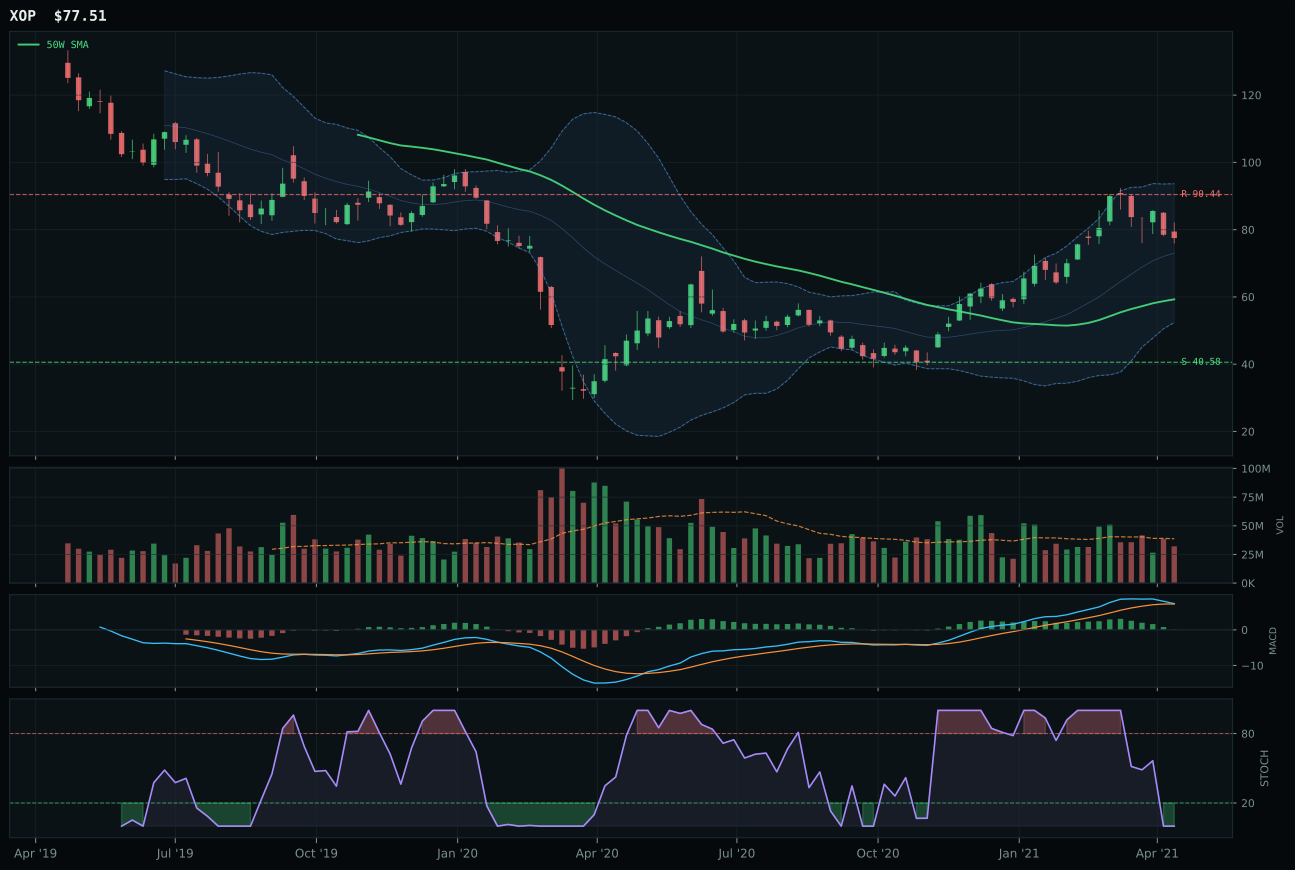
XOP has a vertical extension profile with 0.8% 13-week relative strength versus SPY.
A failed hold above support would weaken the setup.
Actionable but governed by invalidation levels.
XLE won the category and secured top-2 overweight status by delivering the cleanest risk-adjusted entry among energy plays, despite a below-200W price structure that demands support discipline. At 23.5% above the 50W with neutral 0.81x volume and a falling/neutral stochastic RSI (0.30), XLE exhibits healthier entry geometry than the extended alternatives; more critically, its 13.2% 13-week return and 2.2% SPY outperformance establish baseline momentum without the overbought extremes seen in peers. FCG's higher 13-week return (14.6%) and strong stochastic setup (oversold) couldn't overcome a 39.8% extension from the 50W and weak risk/reward (31.9 vs 47.5), making it a stretched alternative. XLE's bullish-but-flattening MACD mirrors FCG's signal, but the former's positioning relative to key moving averages—above the 50W but below the 200W—creates a tighter stop-loss framework (68.5% downside to support versus open-ended extension risk). Category leadership and macro dominance aligned here: XLE captured the highest combined score by offering entry risk discipline alongside genuine energy scarcity sponsorship.
Traditional Energy claimed a top-2 overweight slot at 10% allocation, ranking 1st or 2nd among all ten categories with a 62.5 score supported by an outstanding 85.0 macro fit. Energy scarcity (+16), inflation pressure (+10), supply shortage (+9), and real asset sponsorship (+7) create a powerful tailwind in this transitional market regime, with only credit stress (-7) offering headwind. XLE's technical evidence of 54.8 is pedestrian relative to other category winners (COPX scores 91.0, PAVE scores 89.6), yet the category macro fit tilts the overall decision decisively into top-2. This is a macro-driven allocation: you're not buying XLE because the technicals are pristine, but because energy economics have structurally shifted, inflation pressure is real, and an overlay regime favoring real assets makes commodity-linked cash-flow plays portfolio ballast. XLE's placement below the 200W does introduce support-discipline risk—a break below 14.36 would force quick reassessment—but the risk/reward at 47.5 (68.5% downside, only -9.7% upside) tells you the market is already pricing caution. Top-2 status reflects portfolio-level rebalancing toward inflation hedges, not short-term bullish conviction on oil prices.
Utilities & Infrastructure — XLU
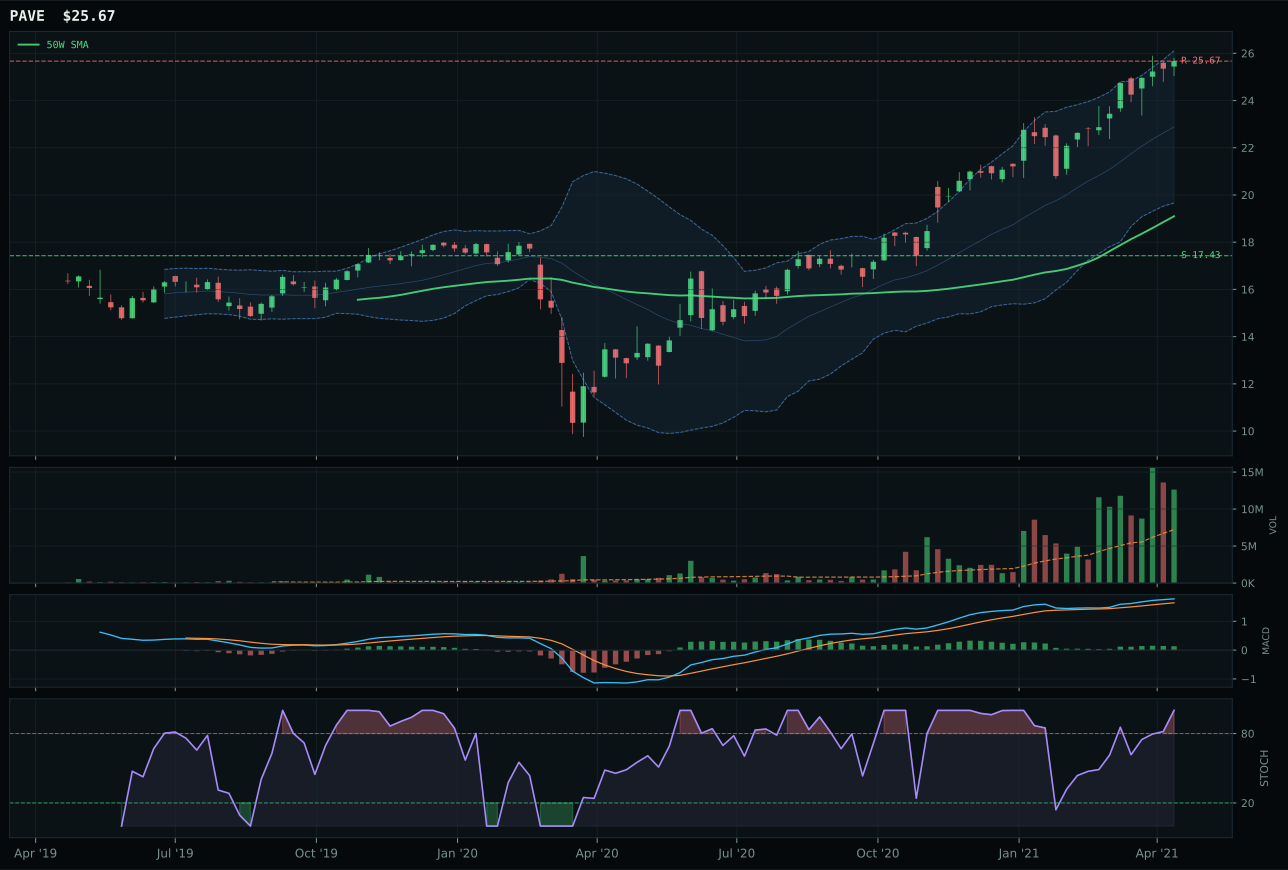
PAVE has a vertical extension profile with 3.1% 13-week relative strength versus SPY.
A failed hold above support would weaken the setup.
Actionable but governed by invalidation levels.
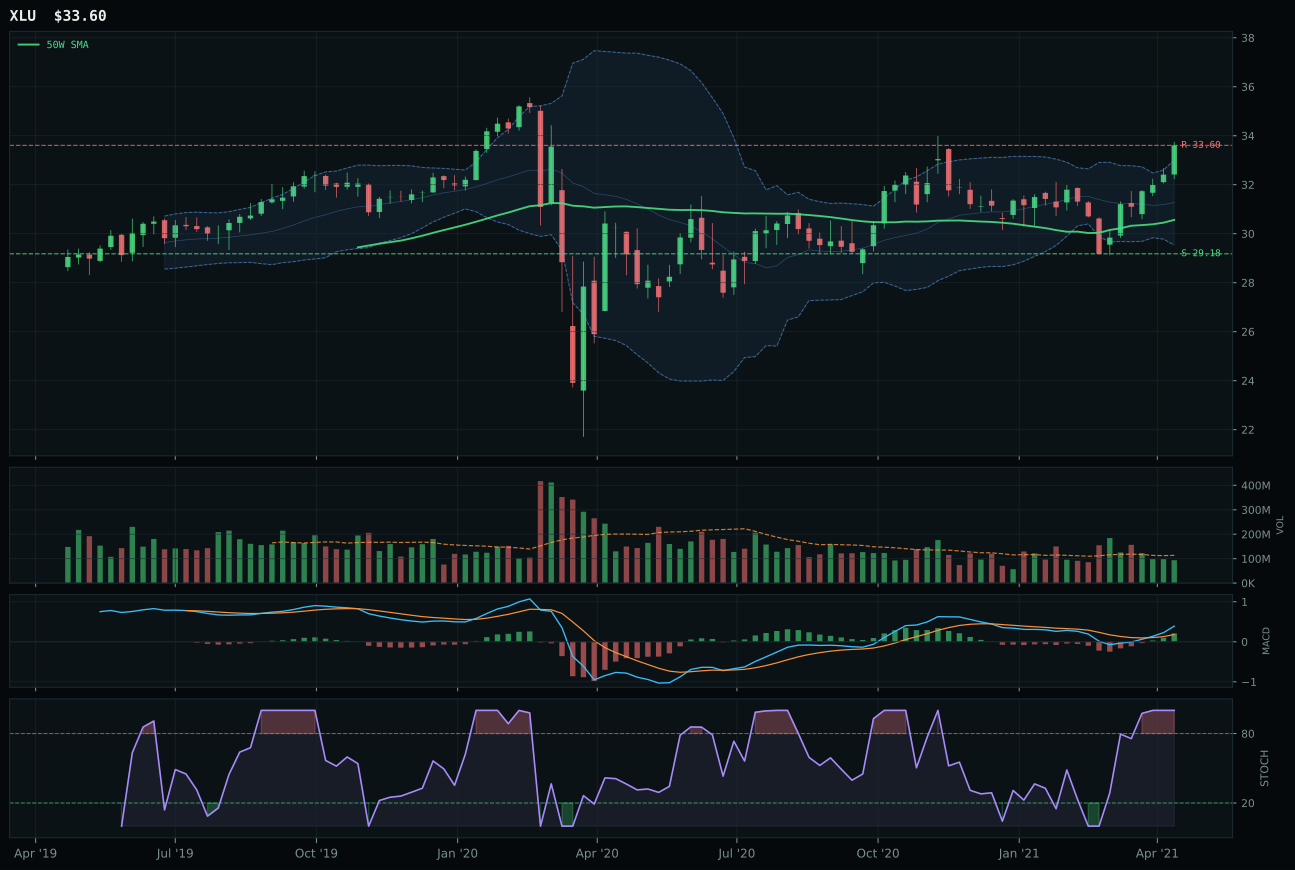
XLU has a neutral structure profile with -4.4% 13-week relative strength versus SPY.
A failed hold above support would weaken the setup.
Actionable but governed by invalidation levels.
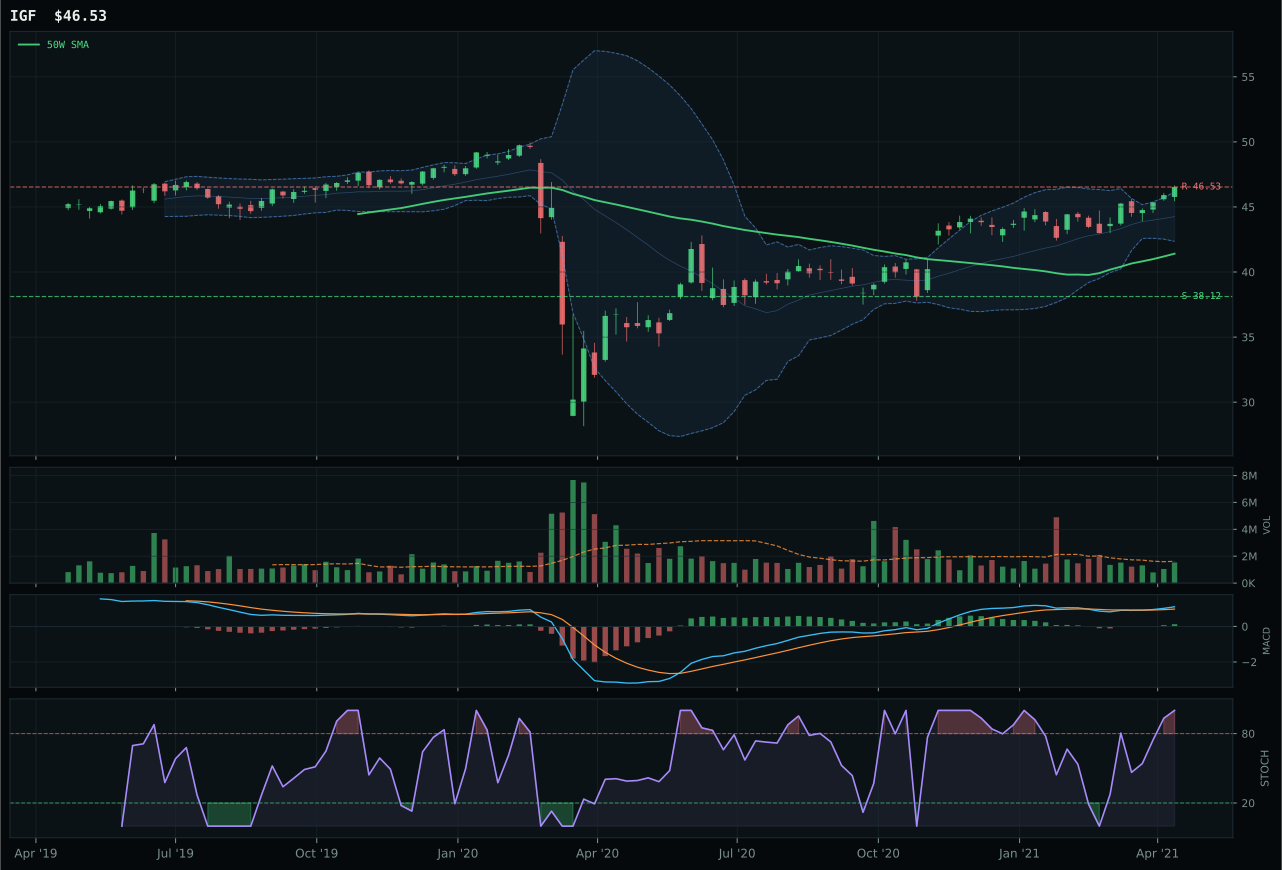
IGF has a neutral structure profile with -6.2% 13-week relative strength versus SPY.
A failed hold above support would weaken the setup.
Actionable but governed by invalidation levels.
XLU captured the category and top-2 overweight status through superior balance sheet positioning despite PAVE's stronger absolute trend and volume profile. PAVE's 100.0 trend score and 89.6 technical evidence—along with 1.79x accumulation volume—painted a compelling cyclical infrastructure narrative, yet its 34.4% extension from the 50W and 37.0 timing score (versus XLU's 10.0% distance and 75.0 timing) revealed late-stage entry geometry. XLU's neutral structure with 75.1 structure score and matching 75.0 timing score generated a 60.0 category composite that edged PAVE's technical superiority through discipline. Both scored overbought stochastic RSI (1.00), but XLU's neutral volume (0.83x) versus PAVE's accumulation (1.79x) created an interesting inversion: PAVE showed fresh money flowing in at extended levels, while XLU's steadier volume participation reflected defensive rotation rather than cyclical capitulation. The category winner is the tighter setup even though PAVE has stronger momentum—this is a case where technical prudence and mean-reversion discipline beat raw bullish commitment.
Utilities & Infrastructure earned top-2 overweight status at 10% allocation with a 60.0 category score that ranks 2nd among all categories alongside Traditional Energy. The 48.0 macro fit is modest—Transition/Mixed regime support (+4) offset by inflation pressure (-6)—yet the 75.2 technical evidence for XLU carries the decision across the finish line. This top-2 slot reflects defensive rotation logic: in a Transition/Mixed regime where macro clarity is absent and credit stress remains active, defensive dividend-paying equities with improving MACD and bullish momentum become portfolio anchors. XLU's 6.7% 13-week return lags PAVE's 14.1%, yet the lower extension risk and neutral volume flow suggest more sustainable positioning. The allocation is justified by the marriage of technical resilience (93.5 trend, 75.1 structure) with defensive sector rotation; you're not expecting utilities to outrun equities, but holding them as a crisis stabilizer within an otherwise offensive (energy/metals) tilt. For this slot to maintain conviction, XLU needs to respect support near 29.18 and show continued MACD improvement—breakdown would warrant reassessment toward more cyclical alternatives like PAVE, which sports superior technical evidence but worse entry timing.
Agriculture & Livestock — WEAT
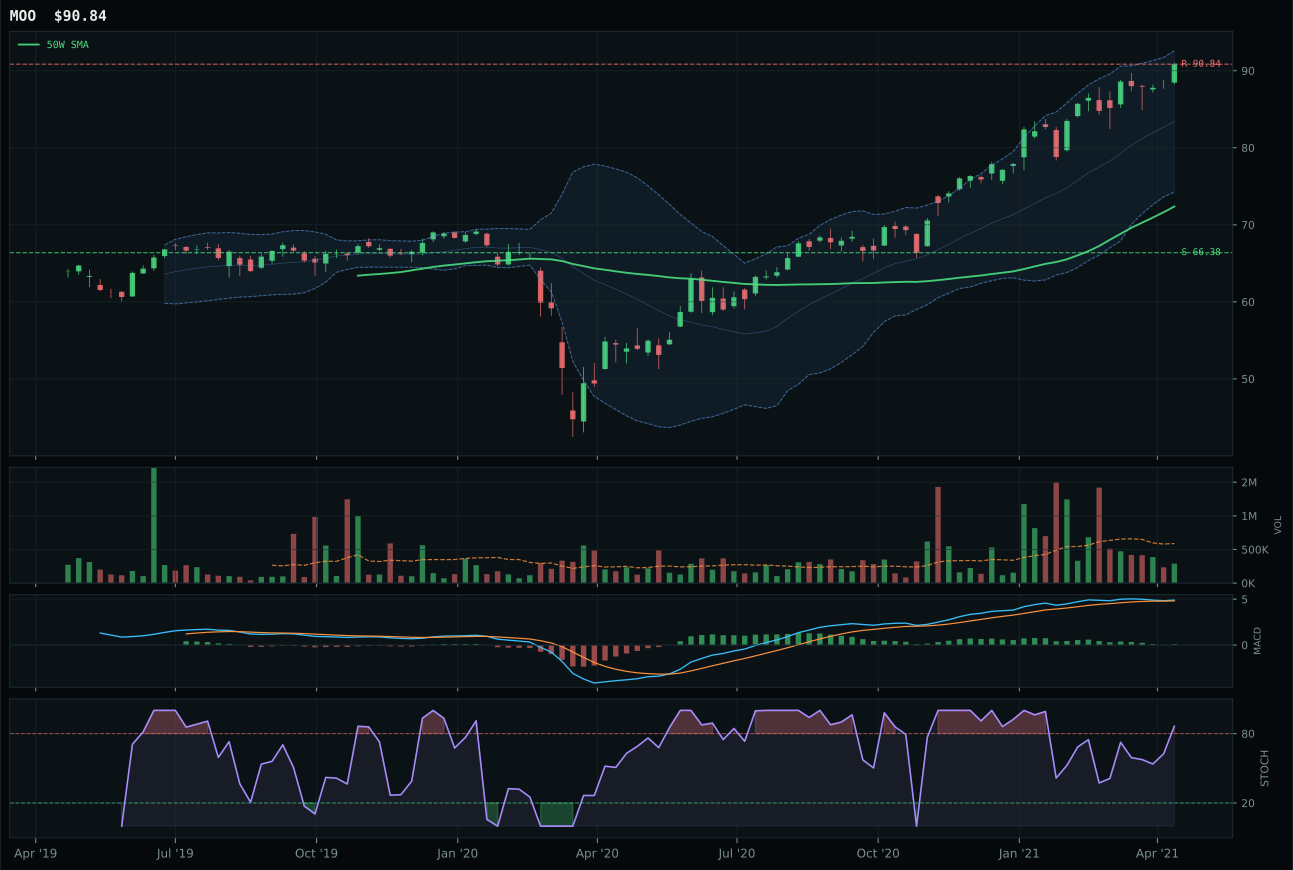
MOO has a vertical extension profile with -0.5% 13-week relative strength versus SPY.
A failed hold above support would weaken the setup.
Actionable but governed by invalidation levels.
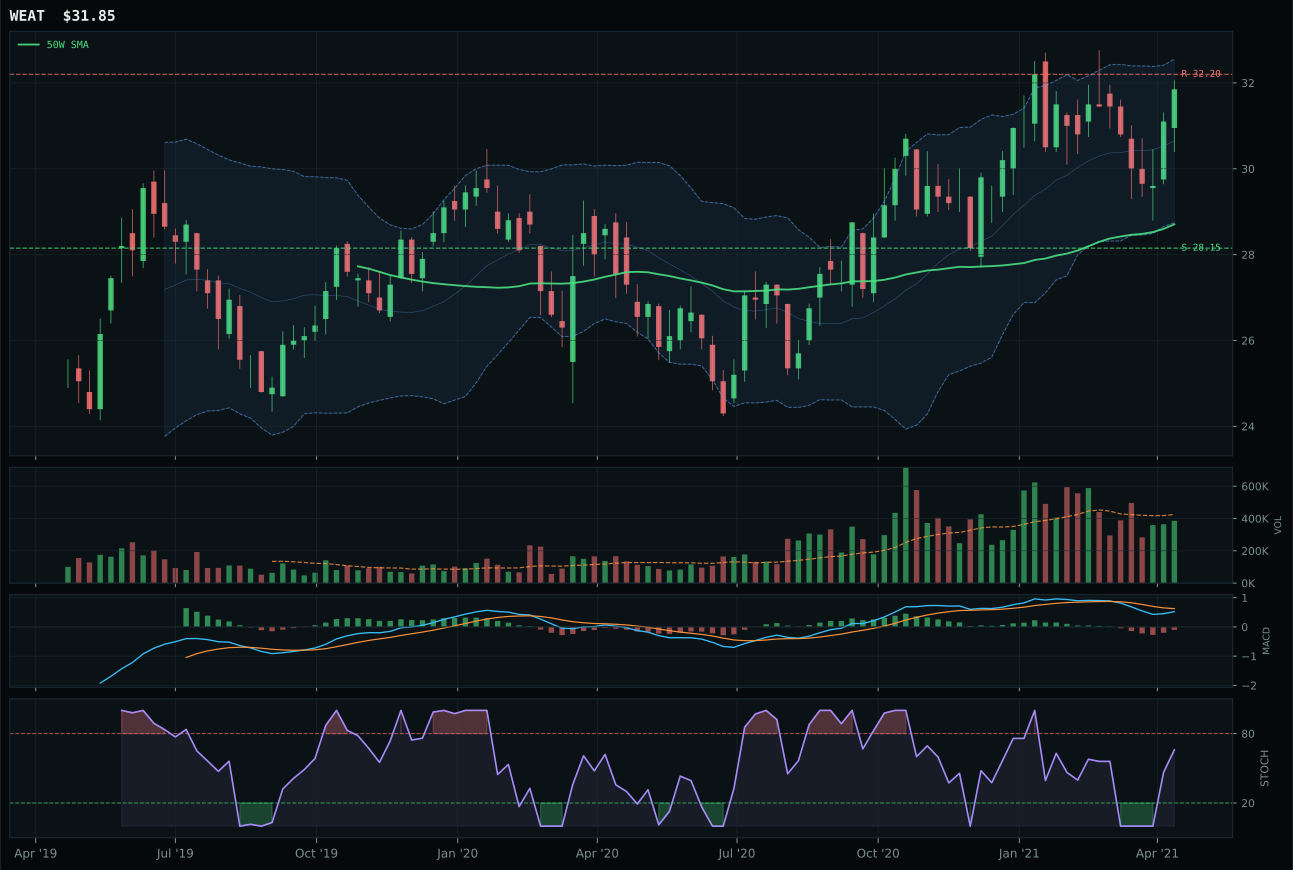
WEAT has a neutral structure profile with -12.1% 13-week relative strength versus SPY.
A failed hold above support would weaken the setup.
Actionable but governed by invalidation levels.
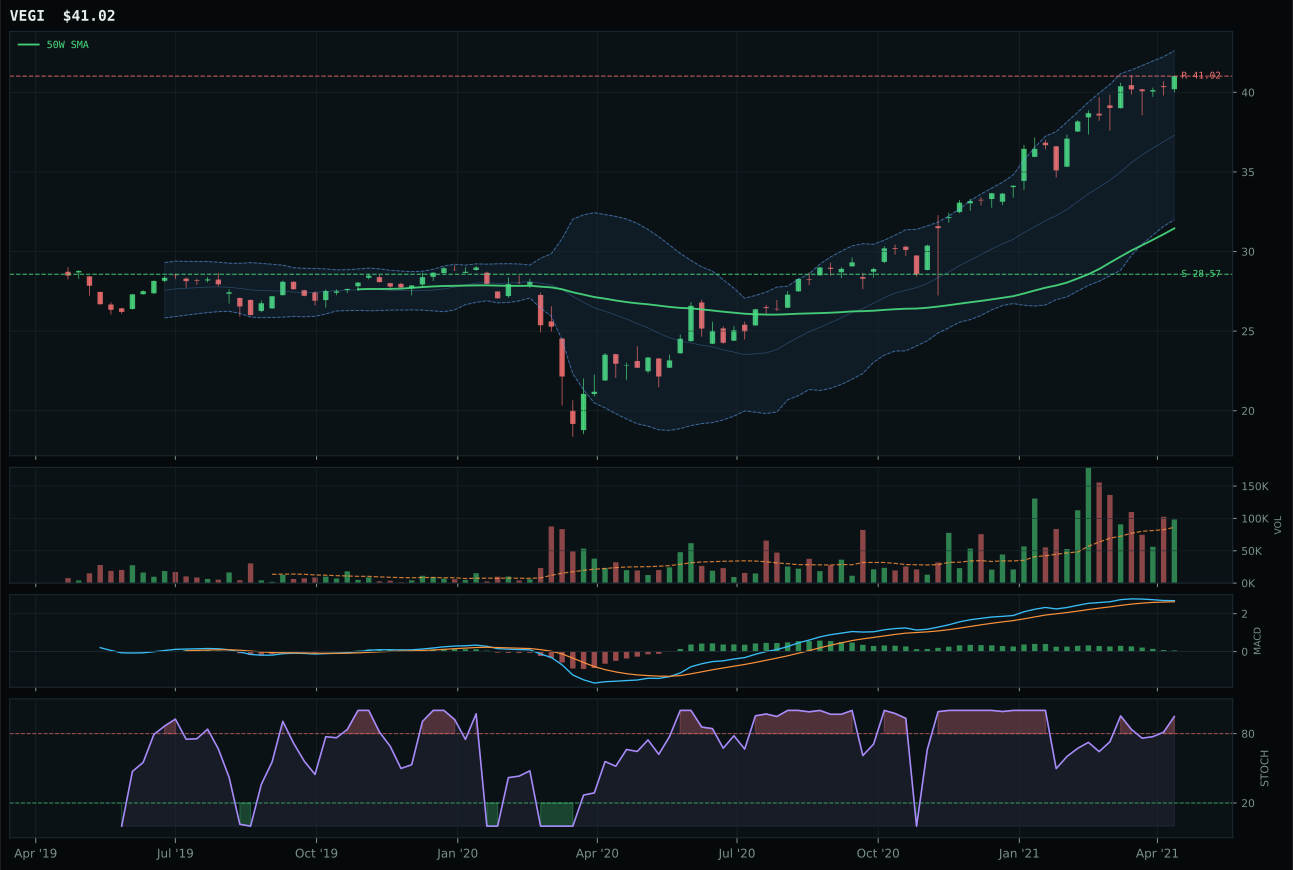
VEGI has a vertical extension profile with 1.5% 13-week relative strength versus SPY.
A failed hold above support would weaken the setup.
Tracked, but not top-2 eligible because: .
WEAT beat MOO on superior timing and risk-adjusted entry, not on absolute trend strength or near-term momentum. MOO's vertical extension at 25.5% above the 50W, bullish-but-flattening MACD, and 10.6% 13-week return should have won on raw power, yet its overbought stochastic (1.00), thin volume (0.56x 20W), and -0.5% SPY-relative weakness revealed a move running out of steam. WEAT, by contrast, sat only 11.0% above the 50W with rising mid-zone stochastic (0.66) and neutral 0.91x volume, generating an 83.0 timing score that reflected genuine pullback-and-accumulation setup versus late-cycle extension. MOO's macro narrative—supply shortage (+8), inflation (+7), real asset sponsorship (+6)—scored 70.0 on category descriptors versus WEAT's neutral 50.0, yet the technical edge proved decisive when both faced identical macro conditions. The winner captured a healthier entry point despite weaker headline momentum; this is mean-reversion logic embedded in a real asset cycle.
Agriculture & Livestock earned 5% tier-3 allocation backed by outstanding 86.0 category-level macro fit, where supply shortage (+13), inflation (+10), real asset sponsorship (+8), and commodity breadth positive (+5) create portfolio ballast. Yet the 56.1 category score ranks 3rd behind Energy and Utilities, preventing a top-2 upgrade despite superior macro support. The tension is real: WEAT's technical evidence (49.5) is mediocre, with momentum confirmation scoring just 23.9 due to -1.1% 13W return, -11.7% category underperformance, and bearish-but-improving MACD. MOO scored higher on technical (47.9) and vastly higher on macro fit (70.0), but timing penalties and volume weakness knocked it into runner-up. The category slot is justified by macro tailwinds and the thesis that real asset inflation will persist, but conviction remains tempered by weak technical follow-through and relative underperformance versus SPY. For promotion to tier-2, WEAT (or the category representative) would need to demonstrate accelerating price action with improving relative strength, signaling that accumulation is indeed taking hold rather than just macro optionality.
Industrial Metals — COPX
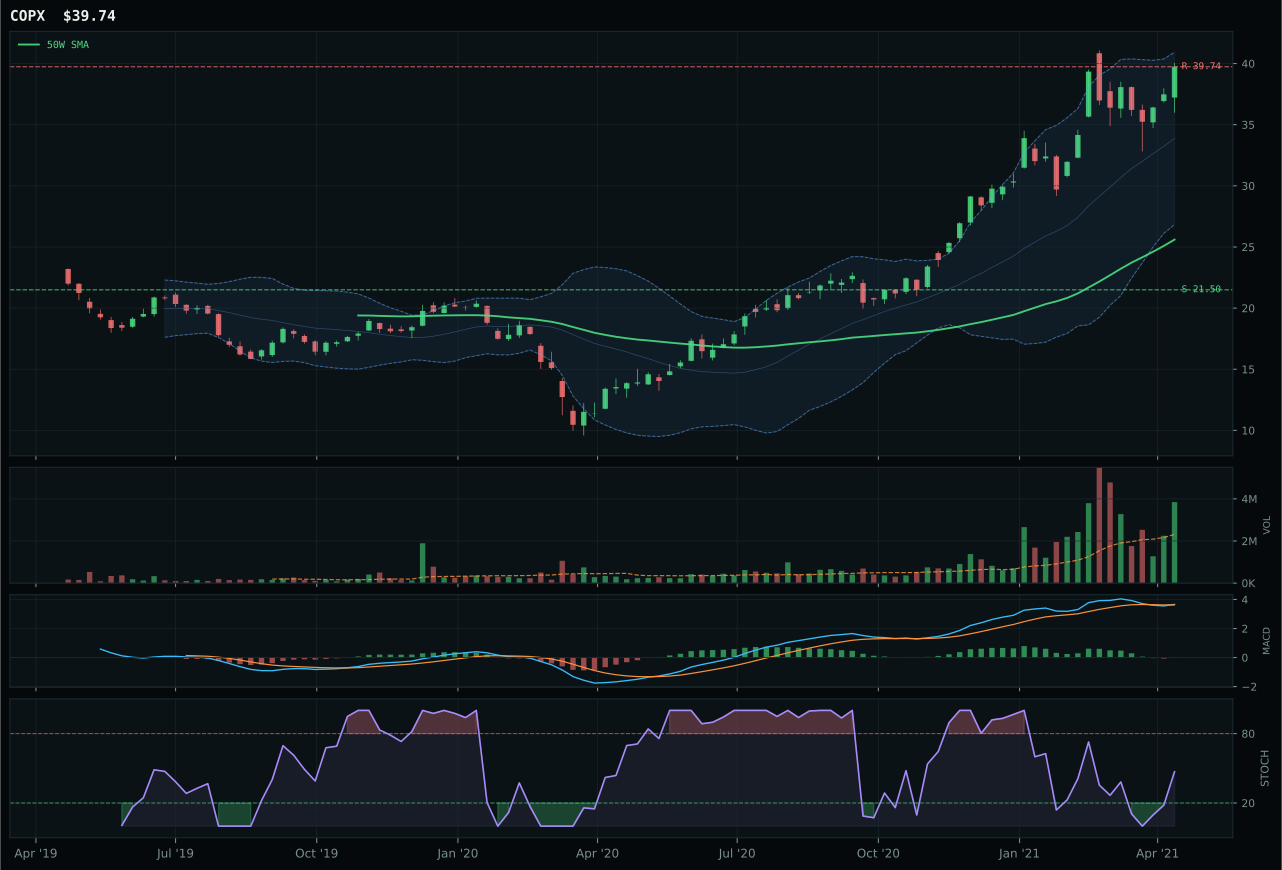
COPX has a vertical extension profile with 13.0% 13-week relative strength versus SPY.
A failed hold above support would weaken the setup.
Actionable but governed by invalidation levels.
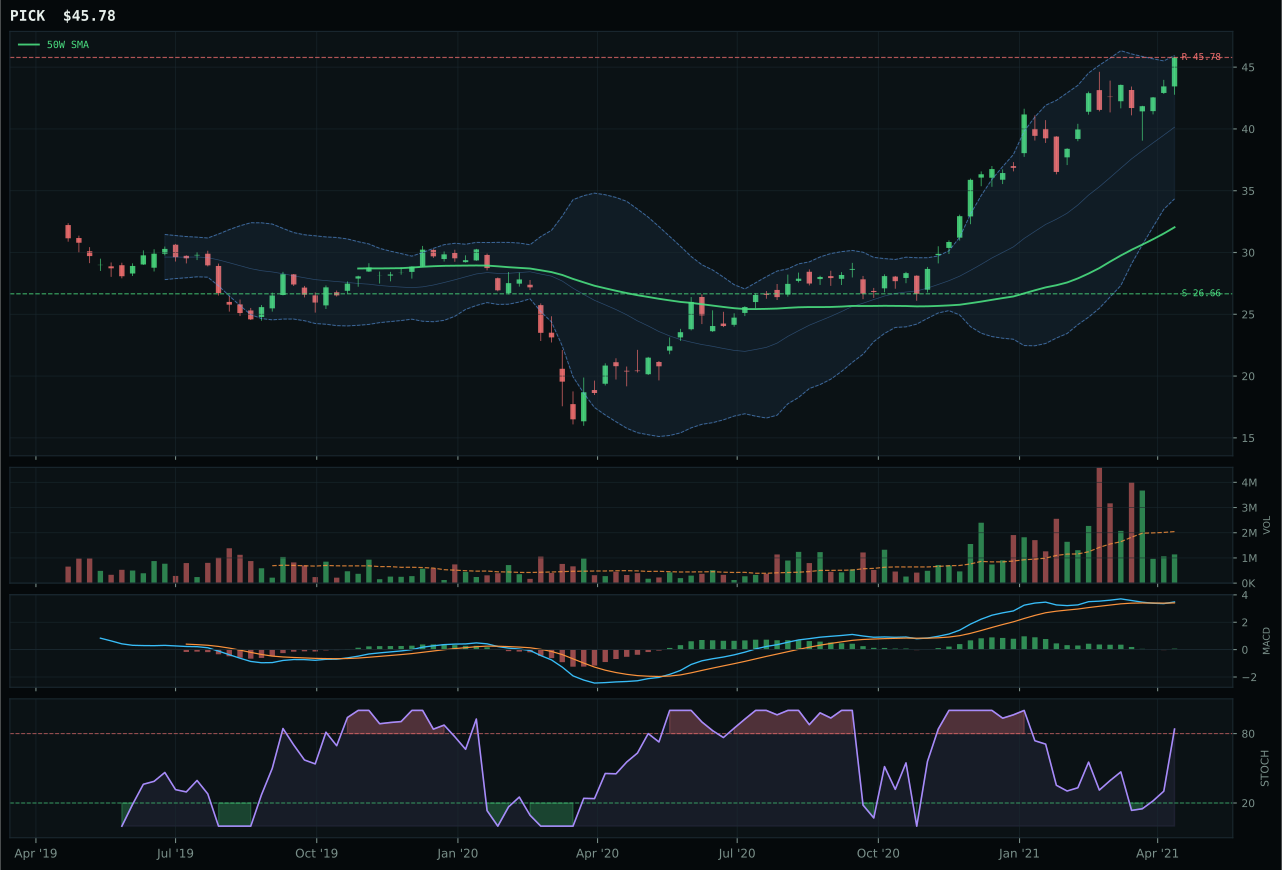
PICK has a vertical extension profile with 5.0% 13-week relative strength versus SPY.
A failed hold above support would weaken the setup.
Actionable but governed by invalidation levels.
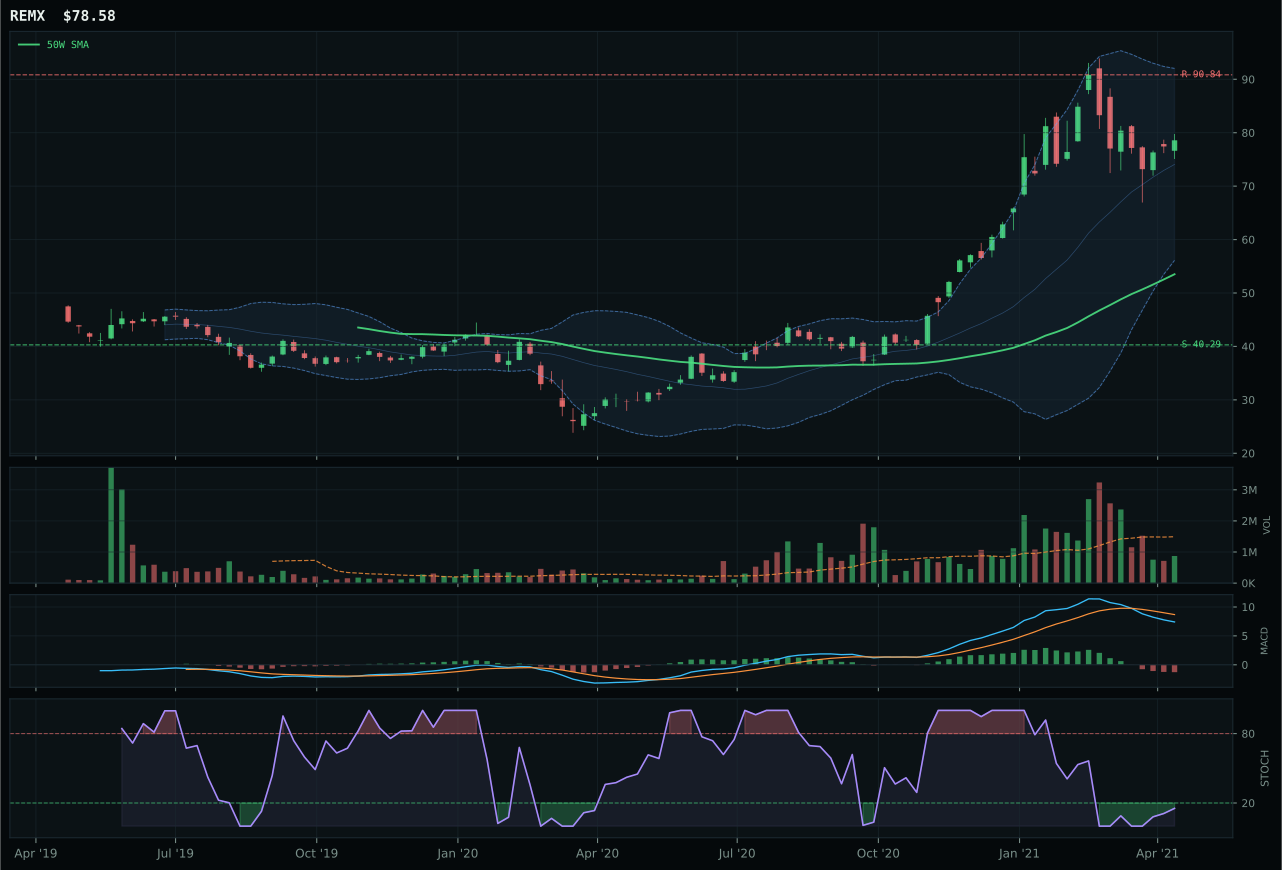
REMX has a vertical extension profile with -2.5% 13-week relative strength versus SPY.
A failed hold above support would weaken the setup.
Actionable but governed by invalidation levels.
COPX dominated the category by combining trend and momentum excellence with genuine accumulation volume that separated it decisively from peers. The 55.2% extension above the 50W would normally trigger entry caution, yet 1.66x average volume—actual accumulation/confirmation—tells you institutional buyers are willing to chase this setup, not churn it. COPX's 100.0 trend score (price well above 50W and 200W, 2.1% slope, 13.0% SPY outperformance) and 100.0 momentum confirmation (24.1% 13-week return, 8.0% category outperformance, bullish-but-flattening MACD) establish lead positioning. PICK's runner-up status collapsed on execution: it scored 0.0% category-relative strength versus COPX's 8.0%, showed overbought stochastic (1.00) versus rising mid-zone (0.47), and suffered thin participation (0.56x) that screamed distribution, not accumulation. The 5.1-point gap reflects a clean category decision where volume-price confirmation (90.8 vs 61) proves the differentiator—copper scarcity is real, but COPX is the only vehicle showing you institutional money flowing through the door.
Industrial Metals earned 5% tier-3 allocation backed by a robust 53.5 category score and 73.0 macro fit where metals scarcity (+14), commodity breadth positive (+10), real asset sponsorship (+6), and inflation pressure all support positioning. Yet the category ranks 3rd behind Energy and Utilities, preventing top-2 promotion. COPX's technical evidence shines at 91.0 (among the highest in the portfolio), driven by perfect trend, momentum, and volume-price confirmation, yet its 48.0 timing score reflects the 55.2% extension penalty—late-stage entry risk even with fresh volume. The macro tailwind is substantial: industrial demand recovery and supply-side disruptions in copper create a genuine scarcity narrative that justifies tier-3 holding. What caps tier-2 ambition is that COPX's risk/reward only scores 43.7, meaning downside to support (84.8%) dwarfs upside to resistance (0.0%), making this a crowded-trade feel despite fresh accumulation. For promotion, COPX would need to hold above support and trigger a fresh breakout on even higher volume—currently it's running hot, not setting up for the next leg. This is a ride-the-momentum slot, not a conviction accumulation setup.
Nuclear Energy — URA
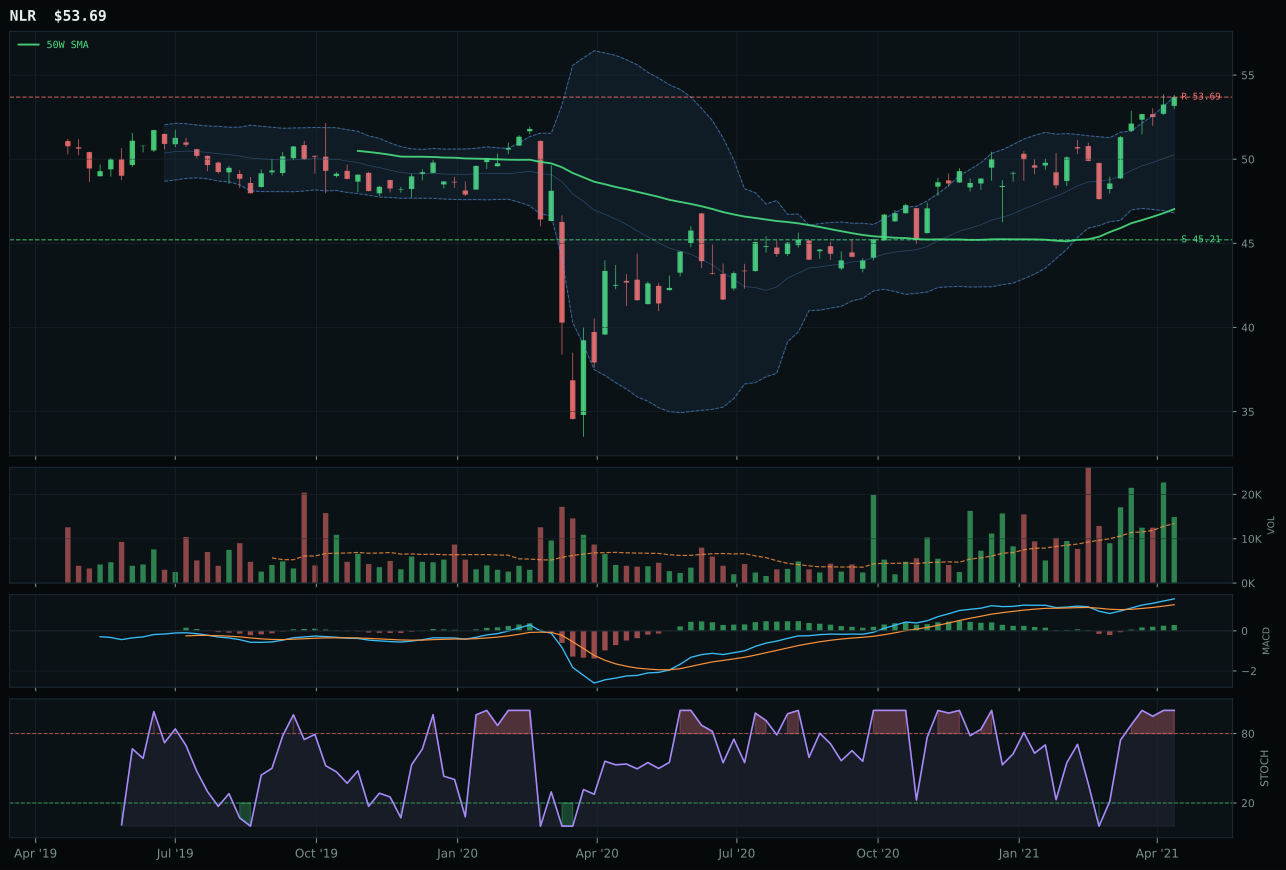
NLR has a neutral structure profile with -2.6% 13-week relative strength versus SPY.
A failed hold above support would weaken the setup.
Tracked, but not top-2 eligible because: .
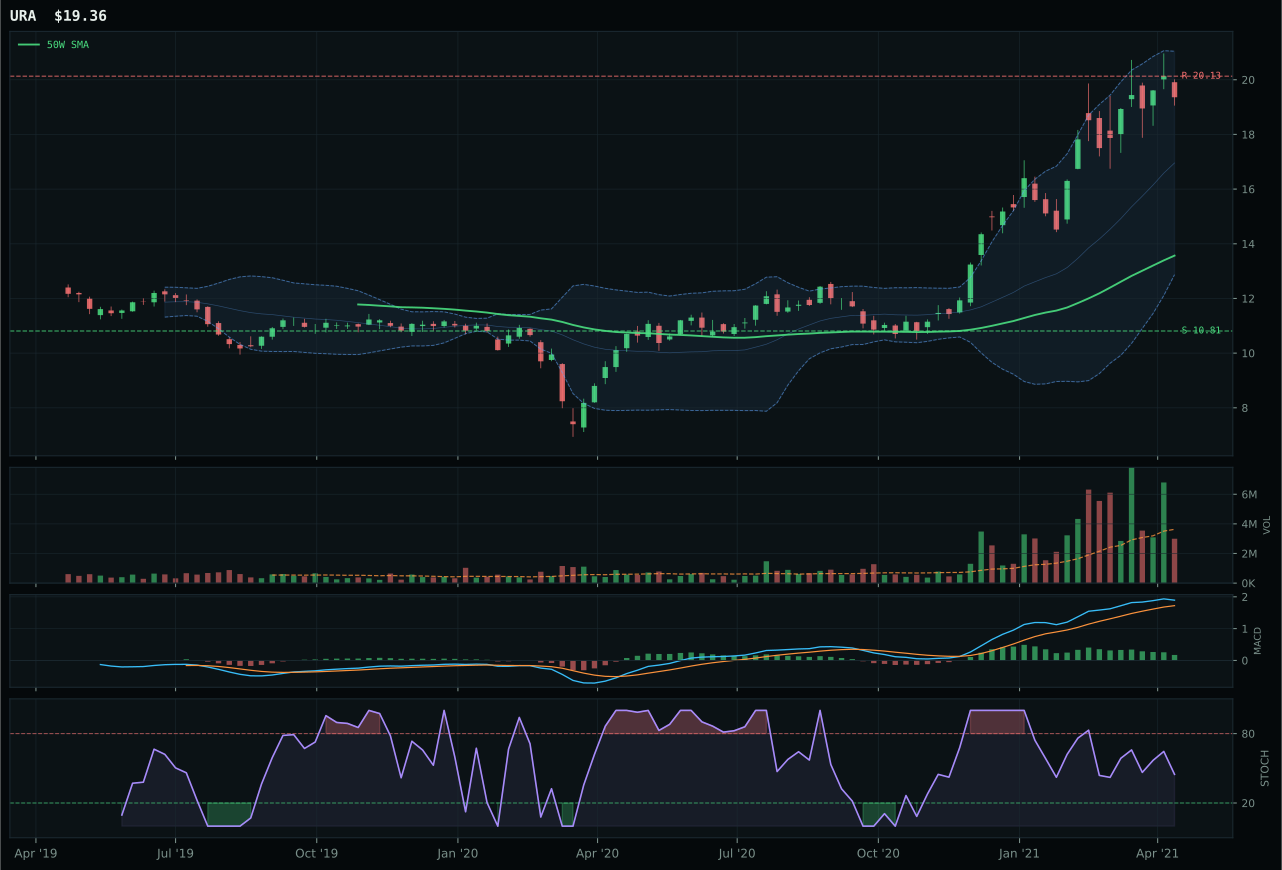
URA has a vertical extension profile with 13.0% 13-week relative strength versus SPY.
A failed hold above support would weaken the setup.
Actionable but governed by invalidation levels.
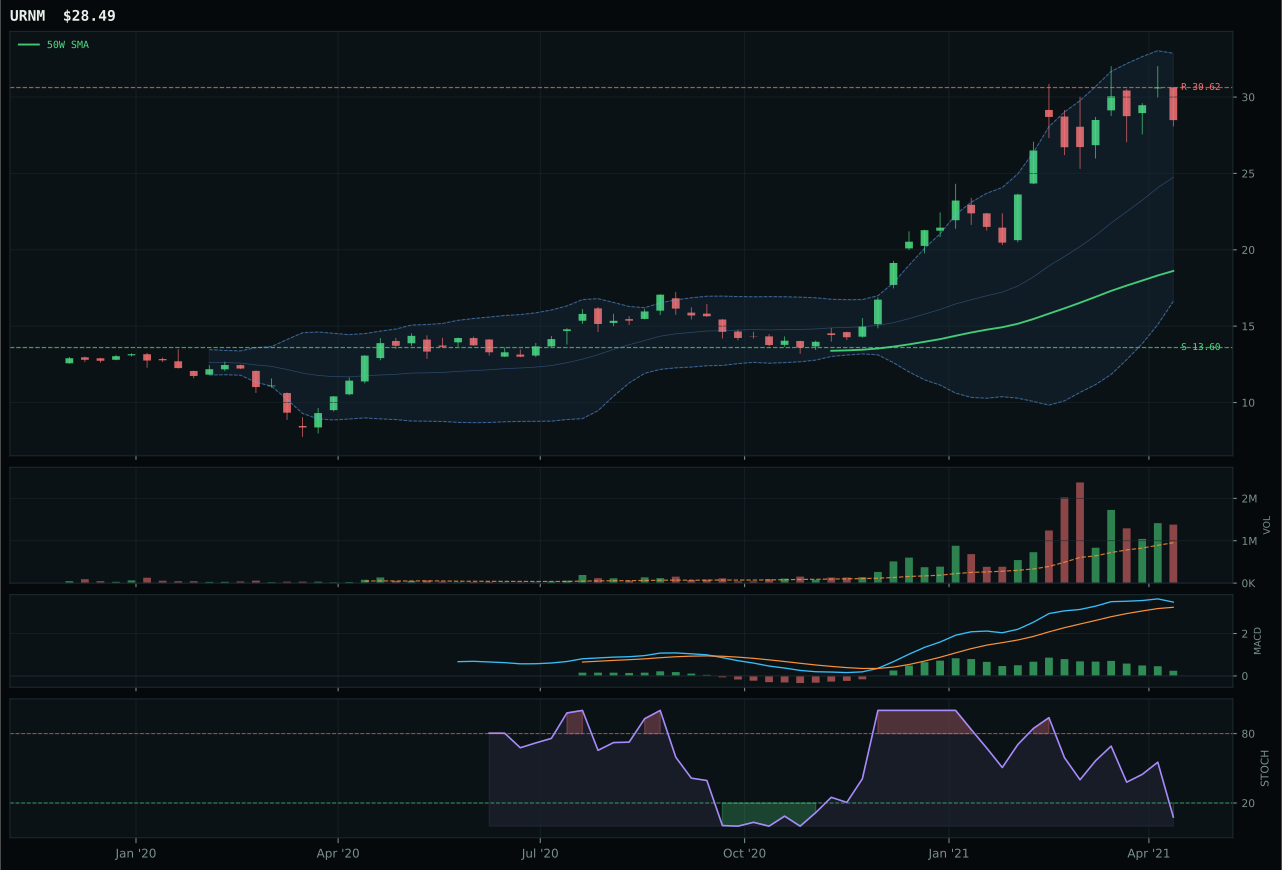
URNM has a vertical extension profile with 16.2% 13-week relative strength versus SPY.
A failed hold above support would weaken the setup.
Actionable but governed by invalidation levels.
URA won the category decisively through perfect trend execution (100.0) and category-leading momentum confirmation (100.0), though the victory came with an entry-risk price tag that tempered overall scoring. The 42.7% extension above the 50W and a bullish-but-flattening MACD generated only 48.0 timing, yet 24.1% 13-week return and 13.0% SPY outperformance established zero doubt about institutional sponsorship in this uranium cycle. NLR's runner-up status collapsed despite superior MACD (bullish and improving versus bullish but flattening) and the highest structural cleanliness: its -15.6% category underperformance and -2.6% SPY relative weakness exposed the nuclear utilities narrative as lagging. URA's neutral 0.83x volume and rising-then-falling stochastic (0.45) reveal accumulation rather than climactic exhaustion, a critical distinction when price sits 42.7% extended. The 11.2-point gap versus the runner-up reflects categorical dominance: URA is the pure-play uranium demand thesis winning decisively against the defensive nuclear utility alternative.
Nuclear Energy earned 5% tier-3 allocation on a 52.0 category score backed by 64.0 macro fit where energy scarcity (+9), real asset sponsorship (+7), and inflation pressure (+3) align with the uranium supply-and-demand thesis. Yet URA's 30.9 risk/reward score—lowest in the portfolio—caps tier-2 ambition: the 42.7% extension leaves 79.1% downside to support versus only -3.8% upside to resistance, a geometry that screams crowded trade despite perfect trend and momentum metrics. The tier-3 slot is justified by macro tailwinds and the recognition that uranium could outrun equities in an inflation cycle, but conviction is constrained by technical fragility. URA's positioning above both key moving averages with neutral volume initially suggests accumulation strength, yet the -3.8% upside-to-resistance reading betrays that the move is mature. For promotion into tier-2, URA would require a pullback-and-accumulation setup on fresh volume, resetting the risk/reward asymmetry—currently it's extended enough to justify a hold for macro-hedging reasons but not aggressive enough for capital reallocation. The allocation reflects a real-asset tilt rather than short-term uranium enthusiasm.
Precious Metals — SLV
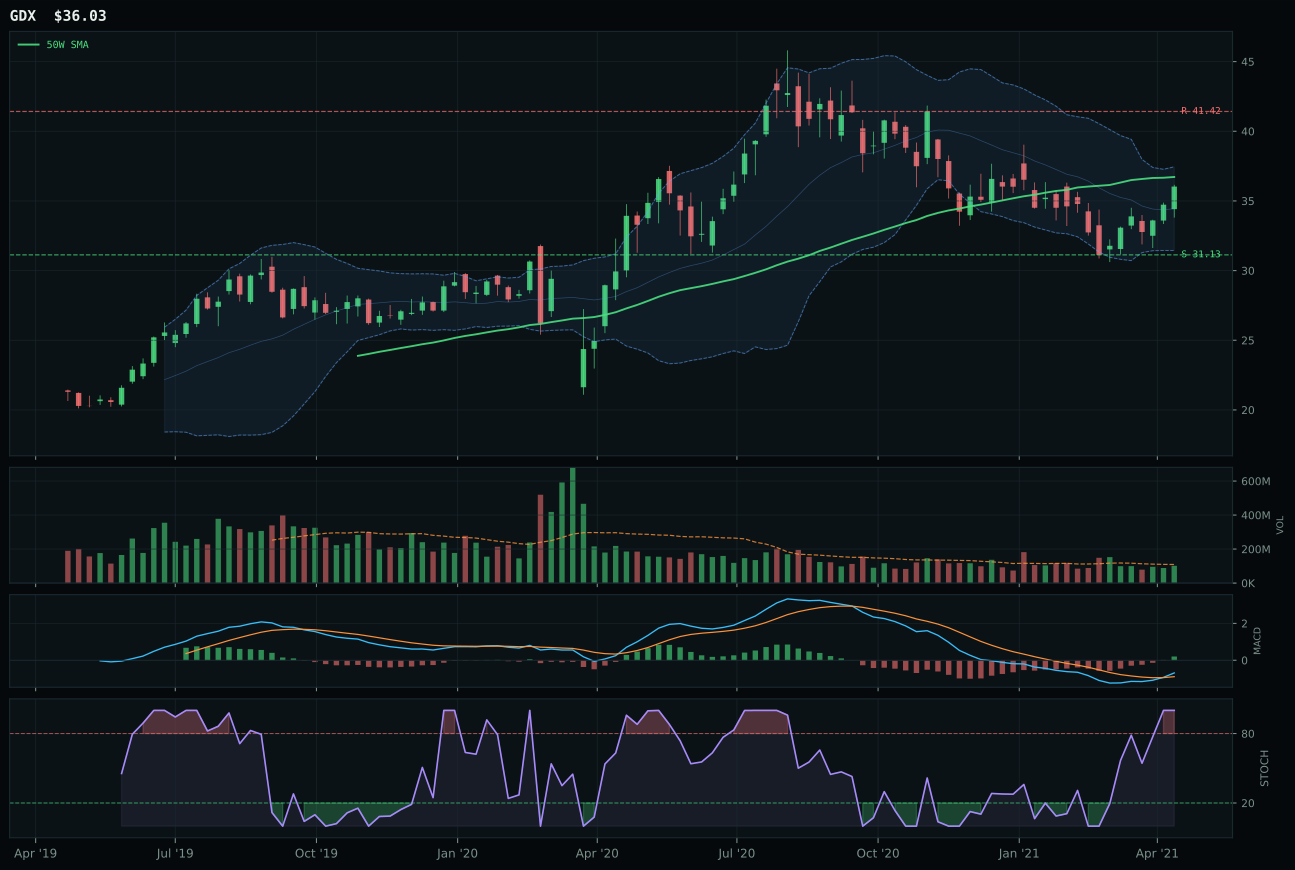
GDX has a compression near 50W profile with -6.7% 13-week relative strength versus SPY.
A failed hold above support would weaken the setup.
Actionable but governed by invalidation levels.
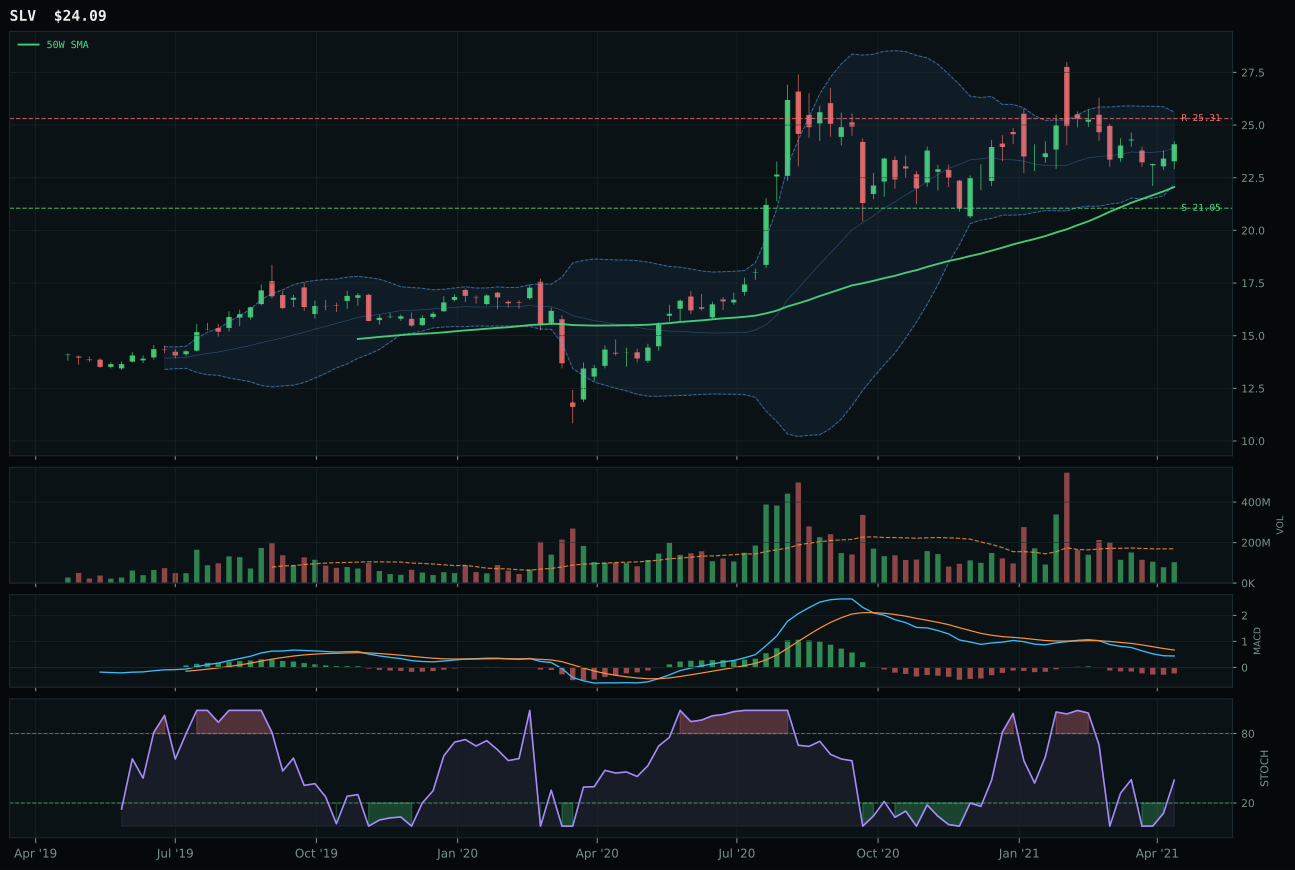
SLV has a neutral structure profile with -6.1% 13-week relative strength versus SPY.
A failed hold above support would weaken the setup.
Actionable but governed by invalidation levels.
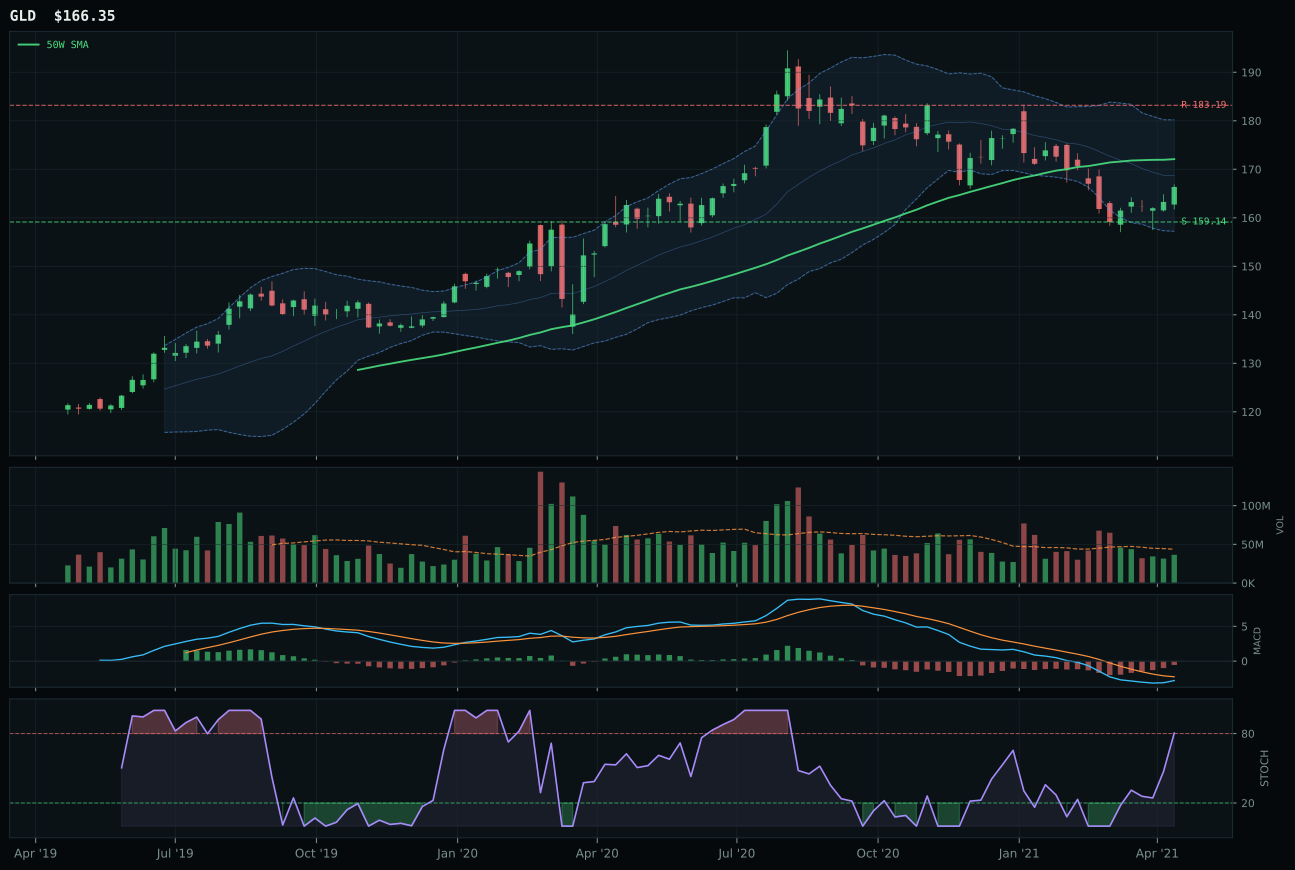
GLD has a pullback into support profile with -13.9% 13-week relative strength versus SPY.
A failed hold above support would weaken the setup.
Actionable but governed by invalidation levels.
SLV prevailed despite GDX's superior technical evidence (72.2 vs 42.5) by capturing the tighter entry setup and better category-relative positioning. GDX's compression near the 50W and bullish, improving MACD generated optimal timing (100.0), yet its overbought stochastic RSI (1.00) and flat 0.0% category-relative strength revealed that gold miners had already priced in the monetary expansion narrative. SLV's upper retracement positioning with 78.0 timing, rising mid-zone stochastic (0.40), and +0.6% category outperformance revealed healthier accumulation despite lower absolute trend (72.9 vs 75). The structure difference tells the story: GDX's compression is a known pattern with limited upside surprise, whereas SLV's neutral structure offers more path-agnostic exposure. Both faced metallic scarcity tailwinds, but SLV's macro fit (62.0) leaned on inflation and metals scarcity descriptors more cleanly than GDX's 43.0, where credit stress (-7) dragged the composite down.
Precious Metals claimed 5% tier-3 allocation despite a 47.2 category score and a 50.0 category-level macro fit reading that betrays the tension between headline scarcity narratives and actual technical momentum. The macro support is real but modest: metals scarcity (+7) and inflation pressure (+5) provide tailwinds, yet no descriptor strongly favors this exposure in a Transition/Mixed regime. SLV's technical evidence (42.5) limps along with thin 0.61x volume participation and a 24.3 momentum confirmation score—the 13-week return of 5.0% is respectable but spread across a -6.1% SPY underperformance that undermines conviction. GDX's runner-up status despite superior technical metrics highlights a recurring theme this week: extended setups face timing penalties that override raw strength. The allocation holds because real asset inflation is a live macro theme and precious metals remain a diversification hedge, but this is a low-conviction slot. SLV would need to demonstrate volume acceleration and category relative strength improvement—currently the group is outpacing SPY but showing thin participation, a combination that limits staying power.
Defense & Aerospace — XAR
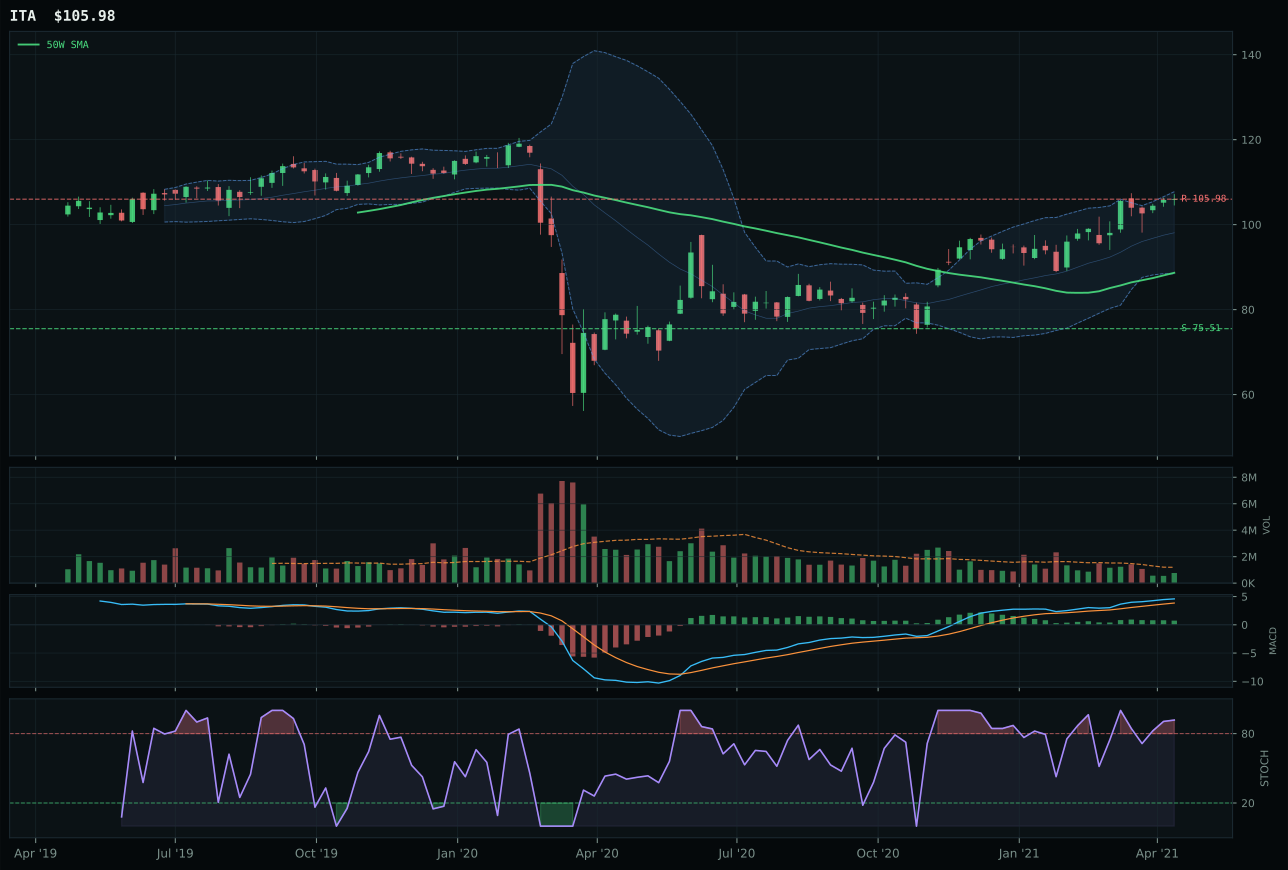
ITA has a vertical extension profile with 1.3% 13-week relative strength versus SPY.
A failed hold above support would weaken the setup.
Actionable but governed by invalidation levels.
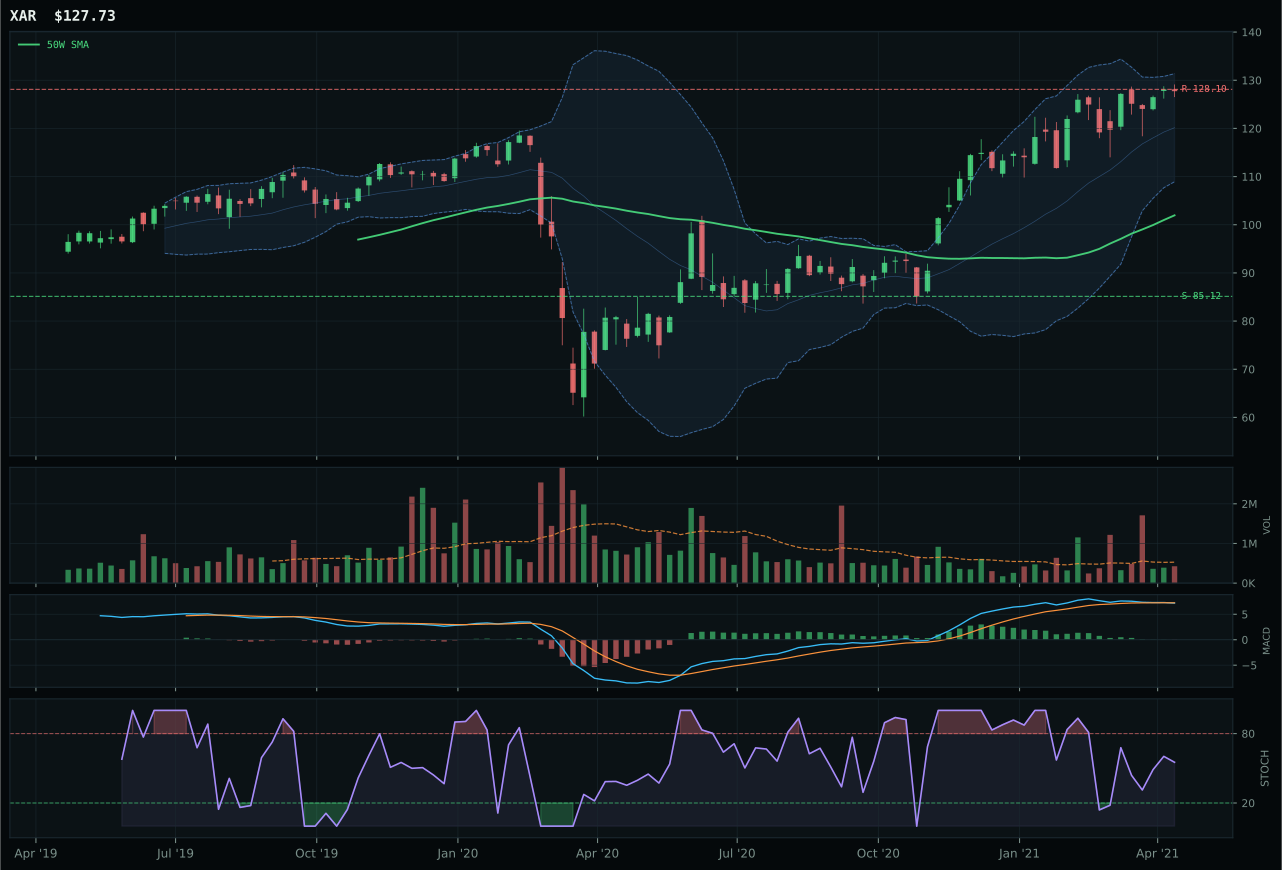
XAR has a vertical extension profile with -3.0% 13-week relative strength versus SPY.
A failed hold above support would weaken the setup.
Actionable but governed by invalidation levels.
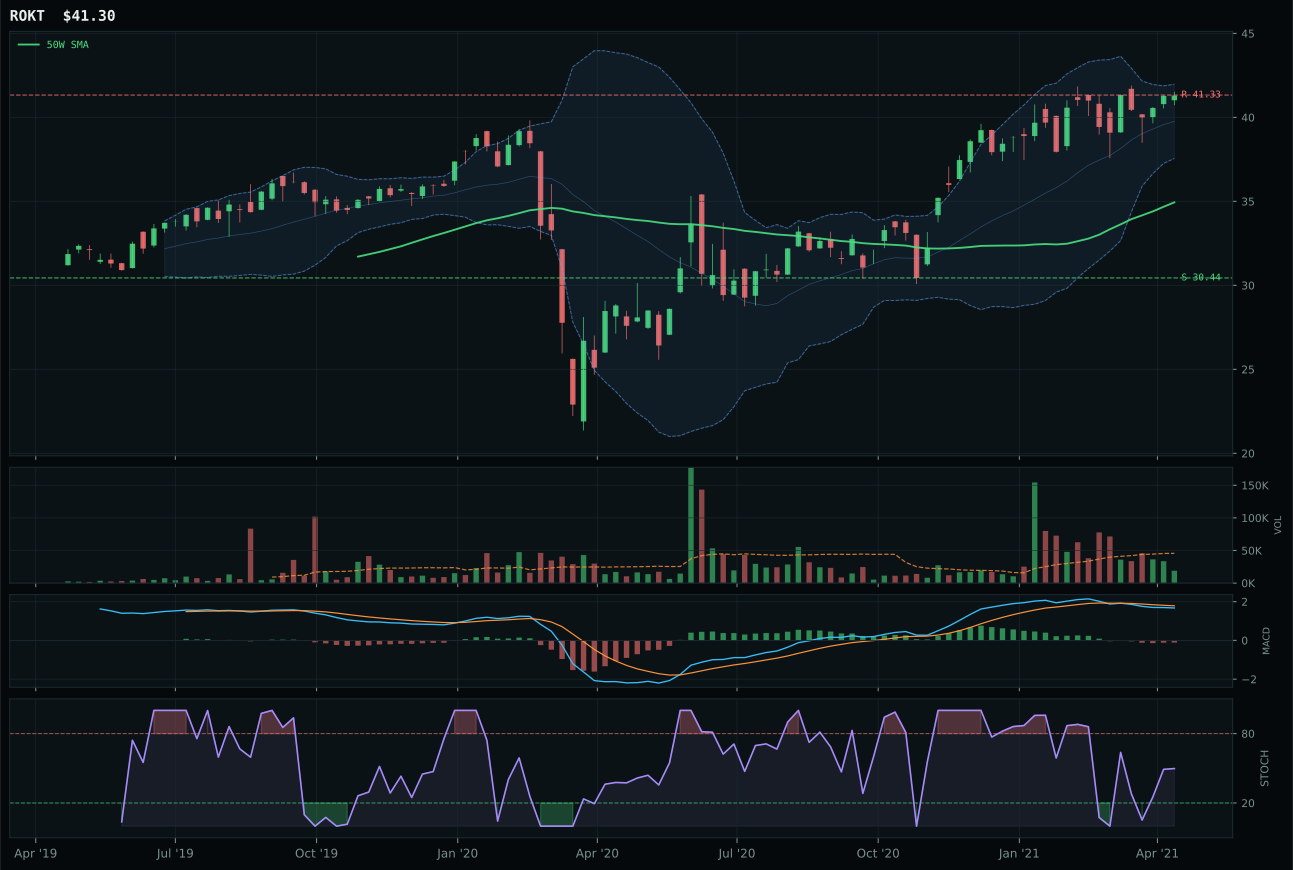
ROKT has a vertical extension profile with -7.0% 13-week relative strength versus SPY.
A failed hold above support would weaken the setup.
Tracked, but not top-2 eligible because: .
XAR won despite a significant technical disadvantage to ITA, flipping the decision entirely on timing and technical setup quality. ITA led in raw trend (98 vs 77) and owned a stronger MACD (bullish but flattening), yet its overbought stochastic RSI (1.00) and thin volume participation (0.62x) signaled late-stage momentum rather than accumulation, generating only a 32.0 timing score. XAR's rising mid-zone stochastic RSI at 0.55, coupled with neutral 0.80x volume, produced a 48.0 timing score that reflected healthier entry conditions despite lower absolute trend strength. The structural picture matters equally: XAR's neutral-leaning structure (70.4) versus ITA's vertical extension positioned the winner as a better risk-reward proposition when both were already 25%+ above their respective 50-week averages. This is a textbook case of technical quality trumping raw momentum—ITA's extended setup with deteriorating volume confirmation handed the category win to the less stretched alternative.
Defense & Aerospace claimed 5% as a tier-3 holding despite a 41.2 category score that ranked below both overweight categories. The category-level macro fit stands at 55.0, supported modestly by Transition/Mixed regime tailwinds (+3) and credit stress helping defensives (+2), but this isn't enough to push it into top-2 territory when other categories (Traditional Energy at 62.5, Utilities at 60.0) score higher on both technical and macro dimensions. XAR's technical evidence of only 28.7 reflects widespread weakness across trend, volume-price sponsorship, and risk/reward, held up primarily by a neutral 50.0 macro fit where no category-specific descriptors apply. The case for holding tier-3 exposure rests on defensive rotation logic—should equities face stress, aerospace/defense durability could outperform—but momentum clearly favors real assets and energy right now. XAR would need either sharper price action with confirmed accumulation or a macro pivot toward recession concerns to upgrade into a higher tier.
Technology — XLK
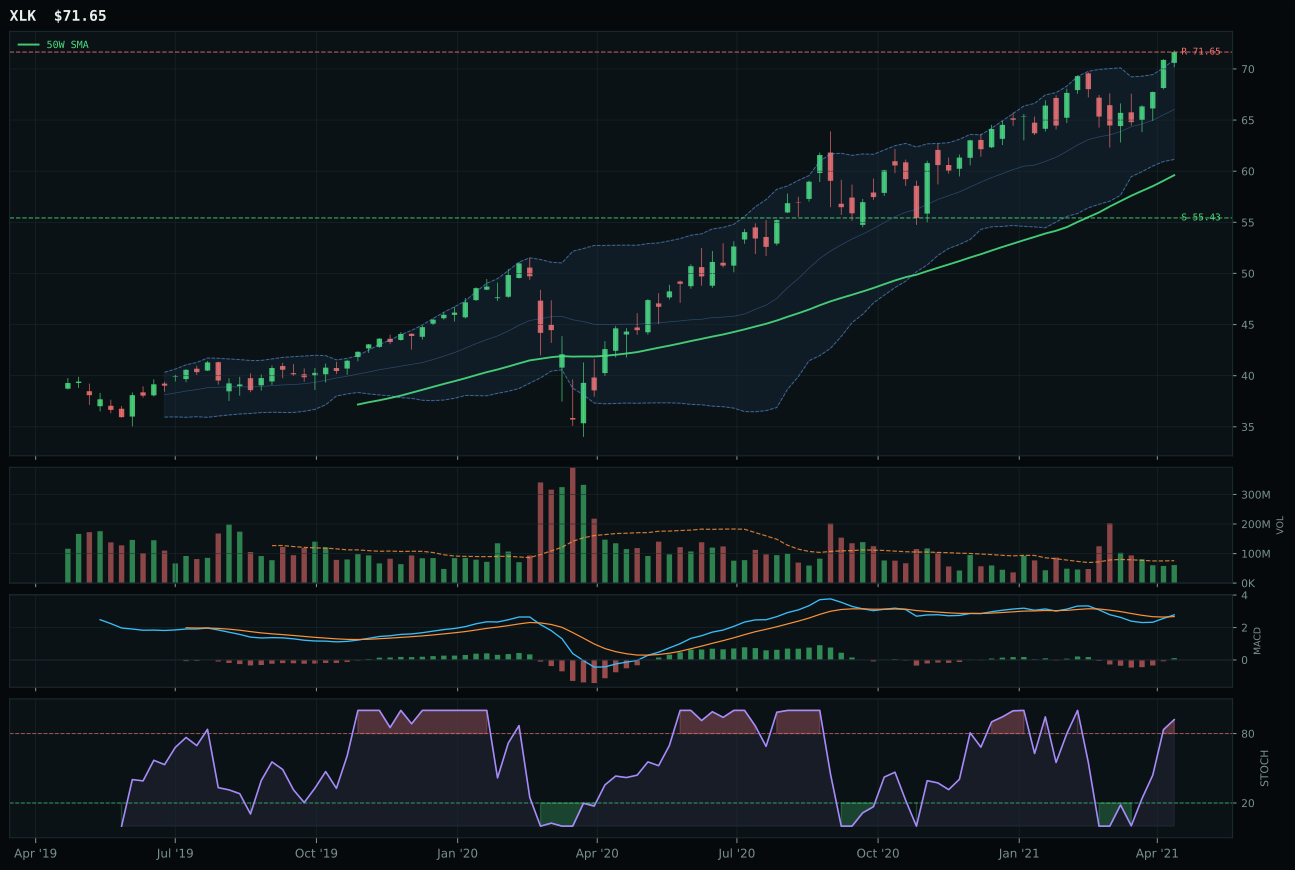
XLK has a vertical extension profile with 1.4% 13-week relative strength versus SPY.
A failed hold above support would weaken the setup.
Actionable but governed by invalidation levels.
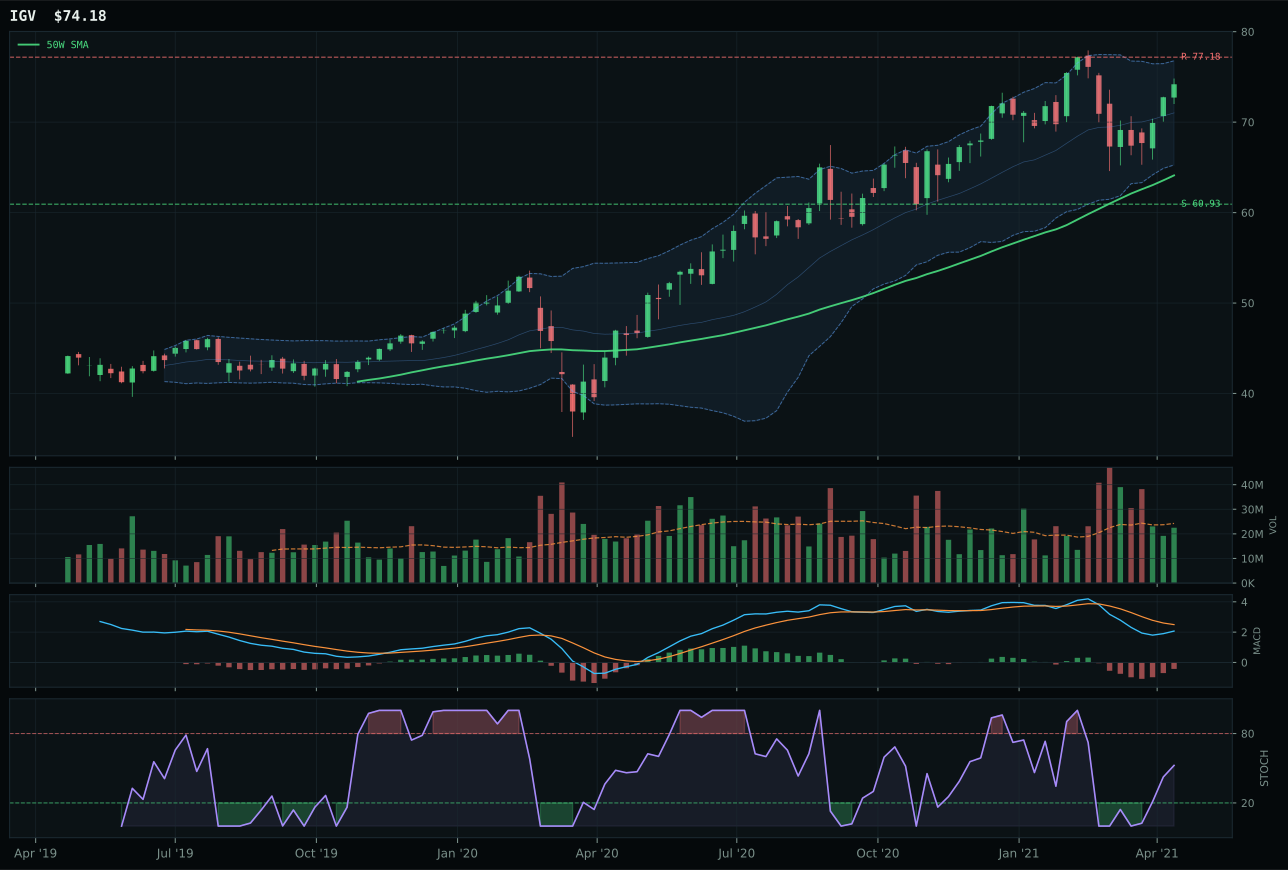
IGV has a vertical extension profile with -4.4% 13-week relative strength versus SPY.
A failed hold above support would weaken the setup.
Actionable but governed by invalidation levels.
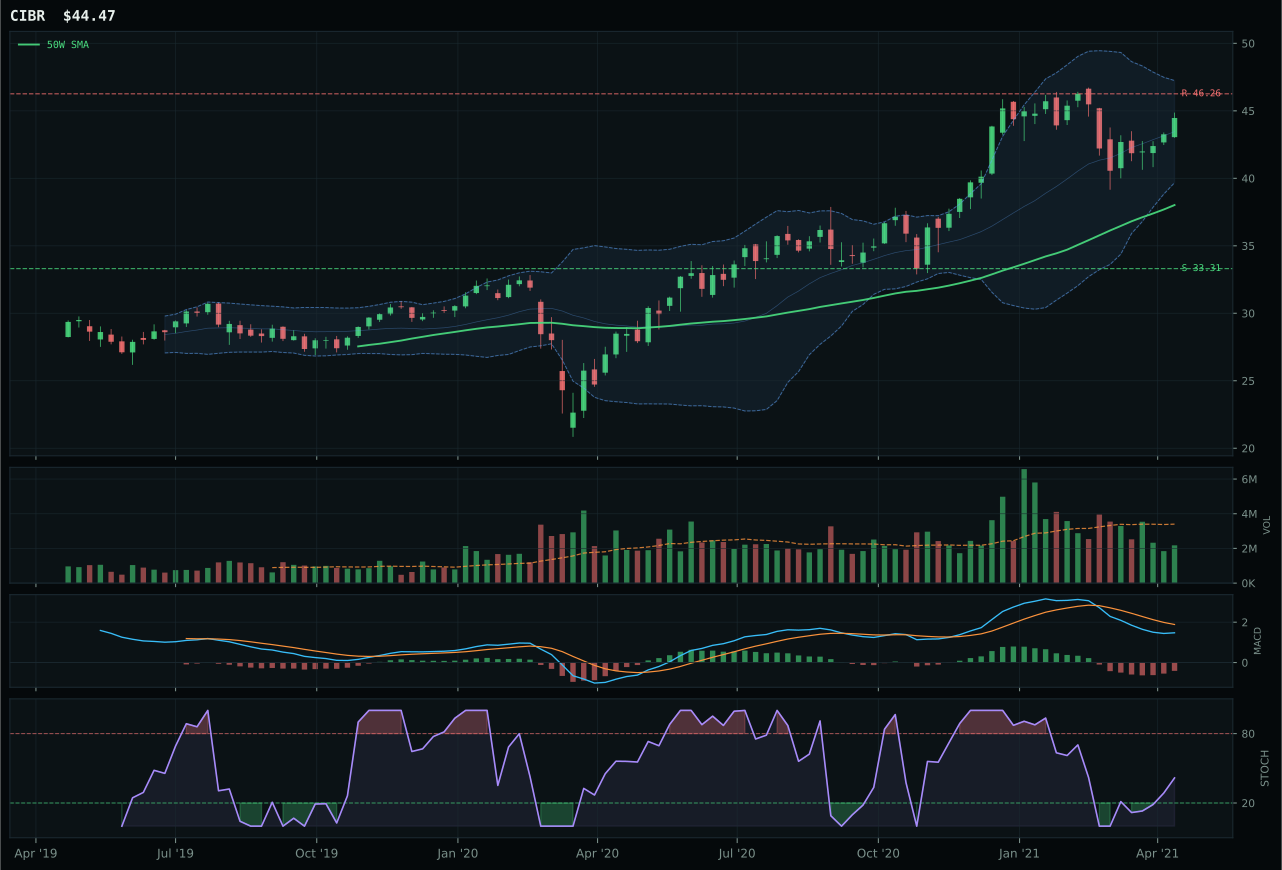
CIBR has a vertical extension profile with -11.8% 13-week relative strength versus SPY.
A failed hold above support would weaken the setup.
Actionable but governed by invalidation levels.
XLK claimed the category by combining clean upside momentum with category-relative dominance that IGV simply couldn't match. Price sits 20.2% above the 50-week moving average in what appears to be a vertical extension, but the 5.8% outperformance versus the category median and a bullish, improving MACD separate accumulation from mere bounce. The risk asymmetry is stark: XLK's 13-week return of 12.5% and 1.4% outperformance versus SPY show real breadth, while IGV's -4.4% relative weakness and bearish MACD (though improving) reveal deteriorating sponsorship inside the basket. Volume at 0.81x the 20-week average is neutral, confirming the move isn't being rejected even as price tests extension levels. The 5.5-point scoring gap versus the runner-up reflects a material technical edge, not a marginal call.
Technology earned 5% allocation as a tier-2 holding despite a 36.4 category score that ranked outside the top two. The Transition/Mixed macro regime and active credit stress descriptor penalize duration-sensitive growth equities, dragging the category-level macro fit to just 39.0, which proved the binding constraint on a technically sound setup. XLK's own macro/narrative fit registered only 40.0 due to credit headwinds, creating a friction point between its clean 100.0 trend score and a 37.0 timing score that reflects late-cycle entry risk. What justifies holding tier-2 exposure is the category's technical evidence (62% of the score), which remains robust, and the recognition that technology can outrun macro if volume-price sponsorship persists. For this allocation slot to upgrade, credit conditions would need to ease materially or the basket would need to demonstrate fresh accumulation after a pullback—currently neither is present.
AI — SMH
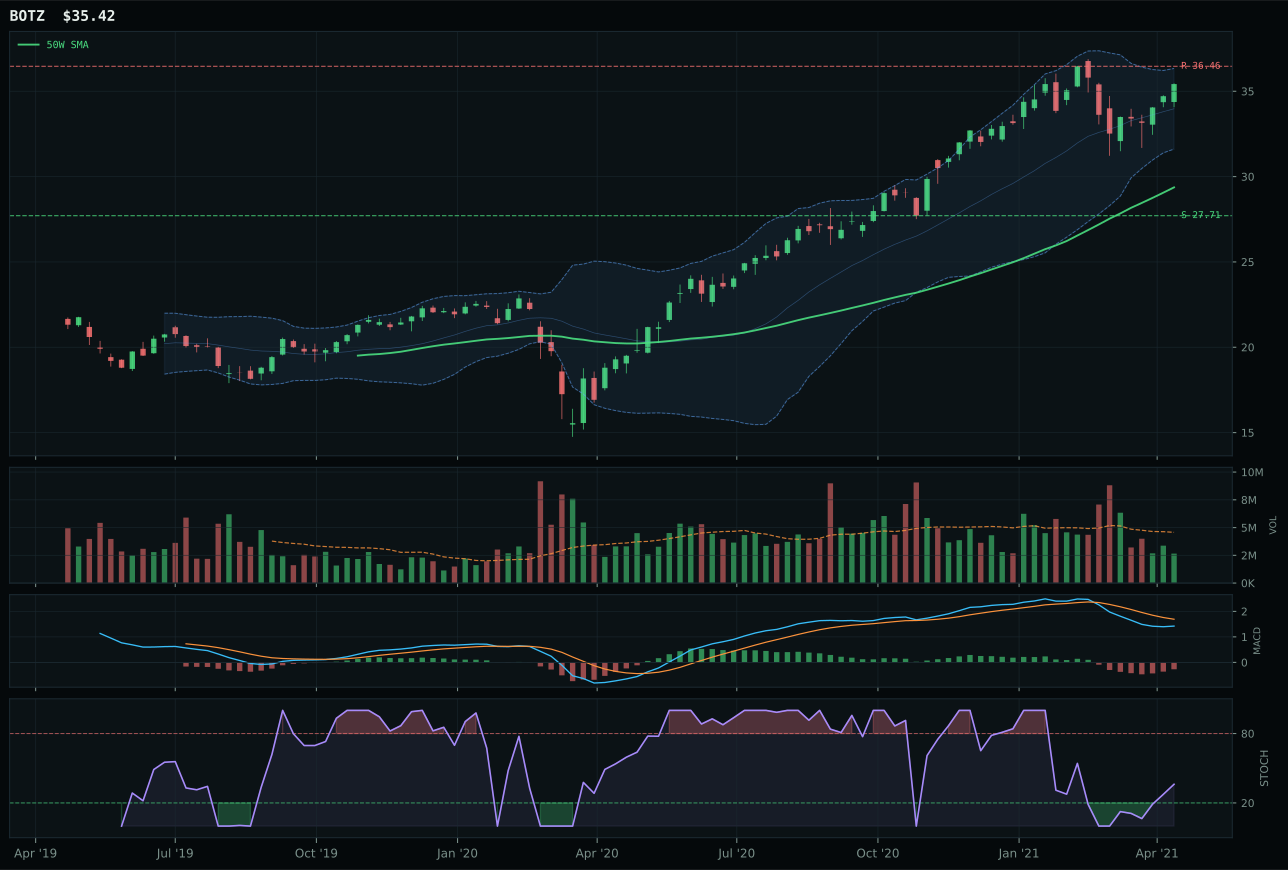
BOTZ has a vertical extension profile with -8.5% 13-week relative strength versus SPY.
A failed hold above support would weaken the setup.
Actionable but governed by invalidation levels.
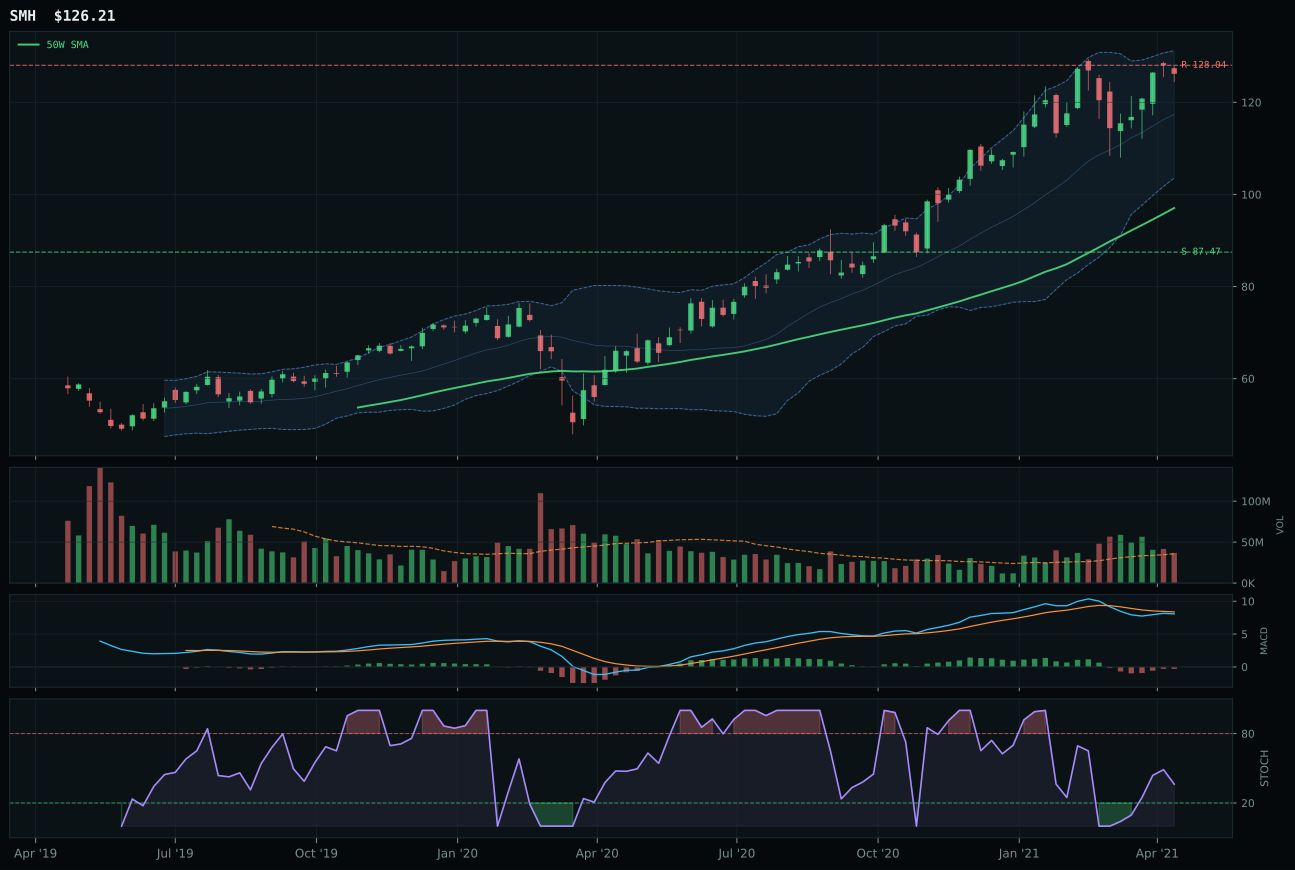
SMH has a vertical extension profile with -3.5% 13-week relative strength versus SPY.
A failed hold above support would weaken the setup.
Actionable but governed by invalidation levels.
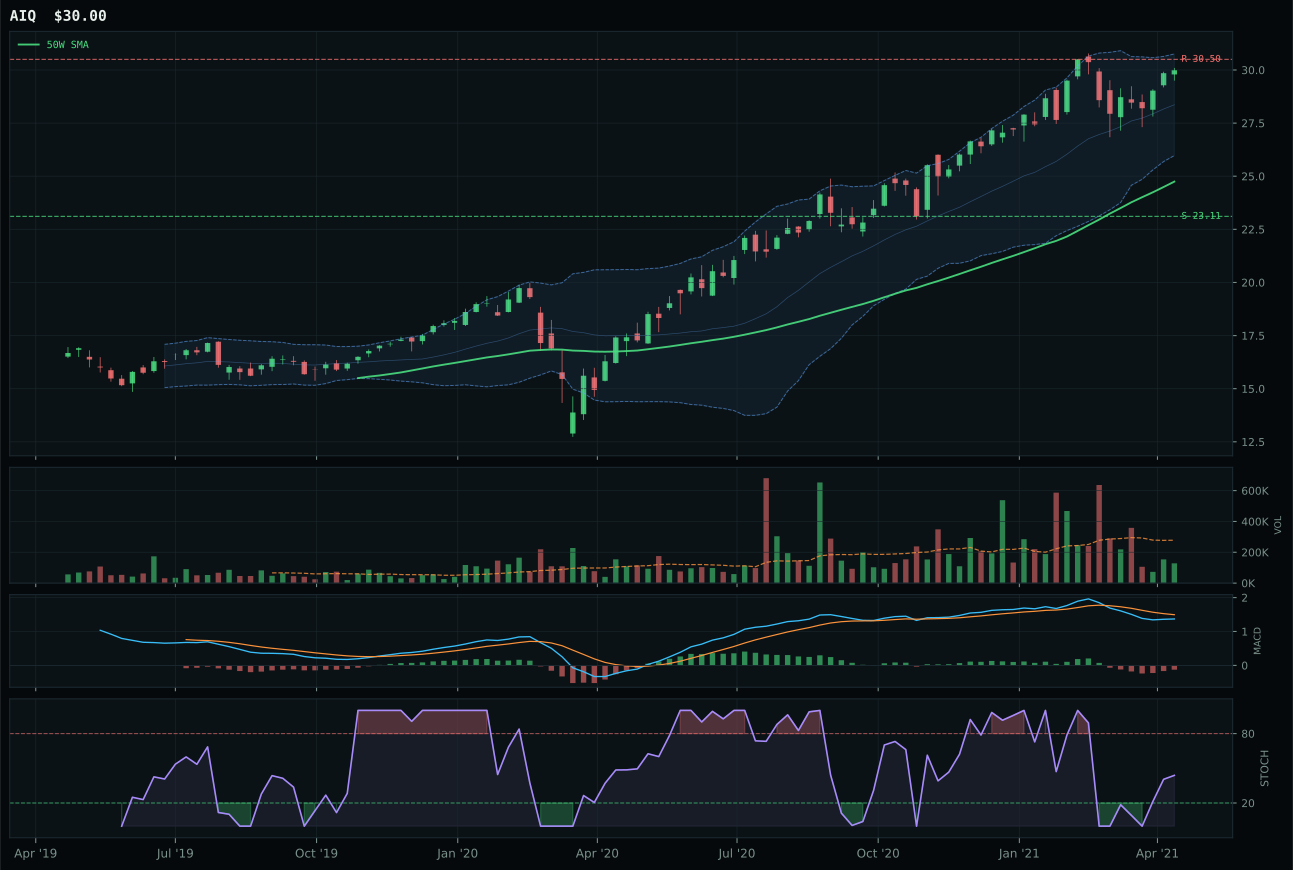
AIQ has a vertical extension profile with -1.7% 13-week relative strength versus SPY.
A failed hold above support would weaken the setup.
Tracked, but not top-2 eligible because: .
SMH won a near-tie against BOTZ (score gap of essentially zero) by virtue of better structure quality and neutral volume participation where its rival showed thin liquidity. Both faced identical headwinds—a 30% extension above the 50W, bearish-but-improving MACD, and rising mid-zone stochastic RSI—but SMH's 71.5 structure score edged BOTZ's 68.8, and its neutral 1.03x volume ratio outweighed the competitor's thin participation. The critical difference lies in what that volume tells you: SMH's 7.5% 13-week return and flat category-relative strength (0.0%) landed cleaner than BOTZ's 2.6% return and -4.9% underperformance, suggesting the semiconductor compute thesis has more institutional backing than pure robotics plays. Both ETFs are technically extended and face timing penalties, but SMH's slightly better volume sponsorship broke the tie.
AI received 0% allocation this week, ranked 9th or 10th and entirely excluded from the portfolio. The 29.8 final category score collapsed under a 42.0 macro fit reading where credit stress active descriptor carries -8 weight, leaving technical evidence (50.5 for the representative) insufficient to justify a slot. In an AltSeason crypto regime with a 50% overlay halving category sleeves, tier-3 allocations disappear entirely—only top-2 at 10% each and tiers 3-8 at 5% survive. AI's technical setup is credible (87.7 trend for SMH, 67.2 momentum confirmation), but the macro regime is actively hostile to high-growth cyclical exposure, and volume-price confirmation scores of only 56.3 suggest accumulation is hesitant, not conviction-driven. For AI to earn a 5% tier-3 slot, either credit stress would need to deactivate or the category would require a fresh breakout on accelerating volume after a meaningful pullback—neither condition holds today.
Emerging Markets — IEMG
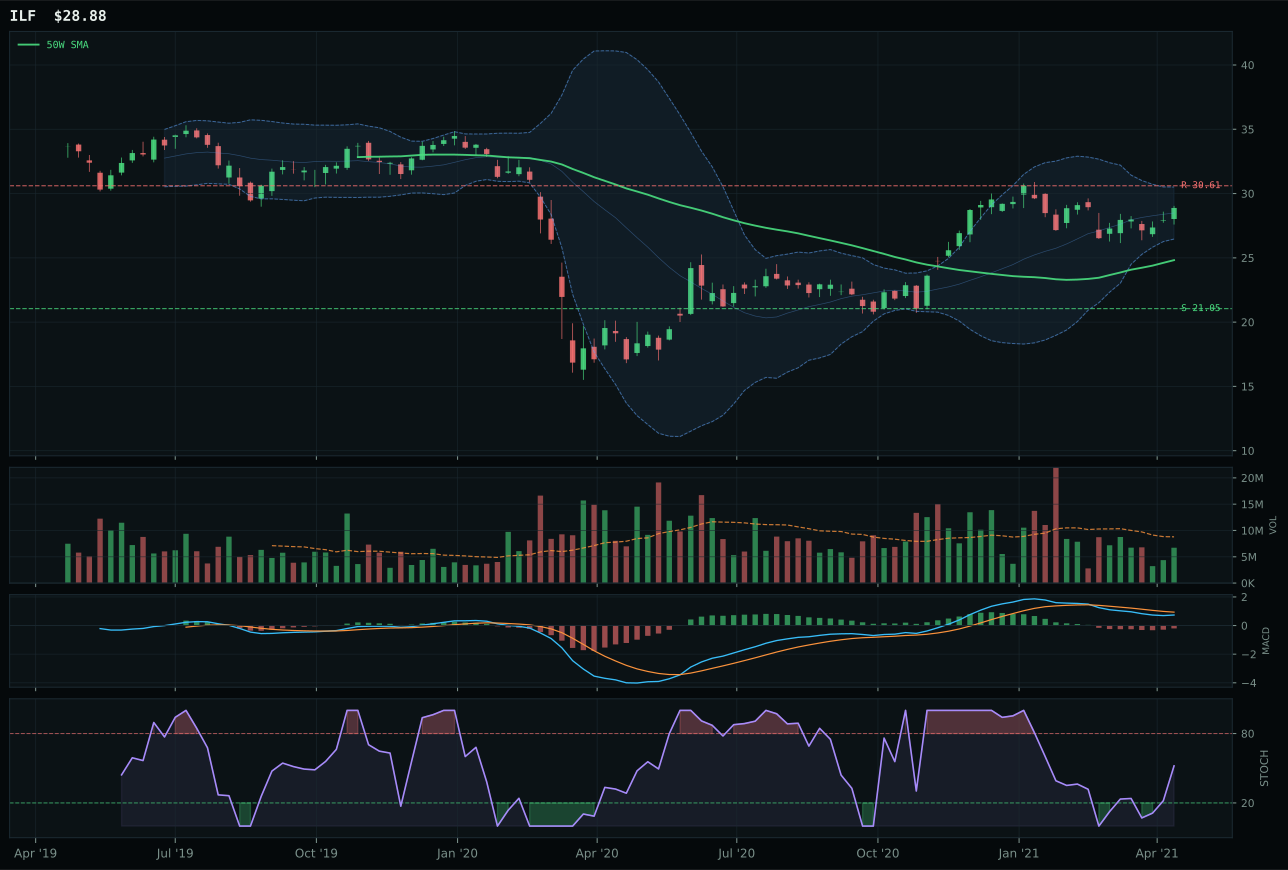
ILF has a vertical extension profile with -13.6% 13-week relative strength versus SPY.
A failed hold above support would weaken the setup.
Actionable but governed by invalidation levels.
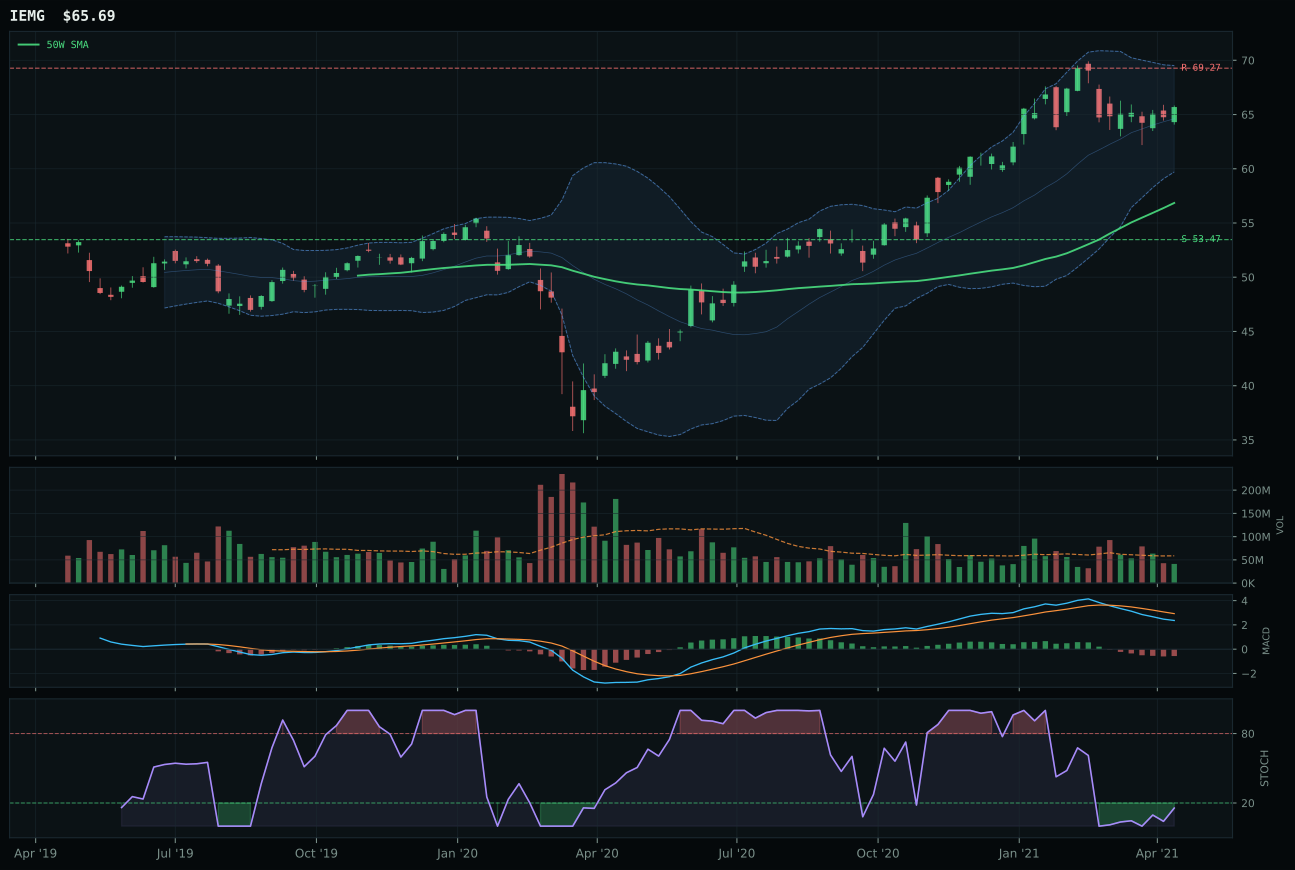
IEMG has a vertical extension profile with -10.2% 13-week relative strength versus SPY.
A failed hold above support would weaken the setup.
Actionable but governed by invalidation levels.
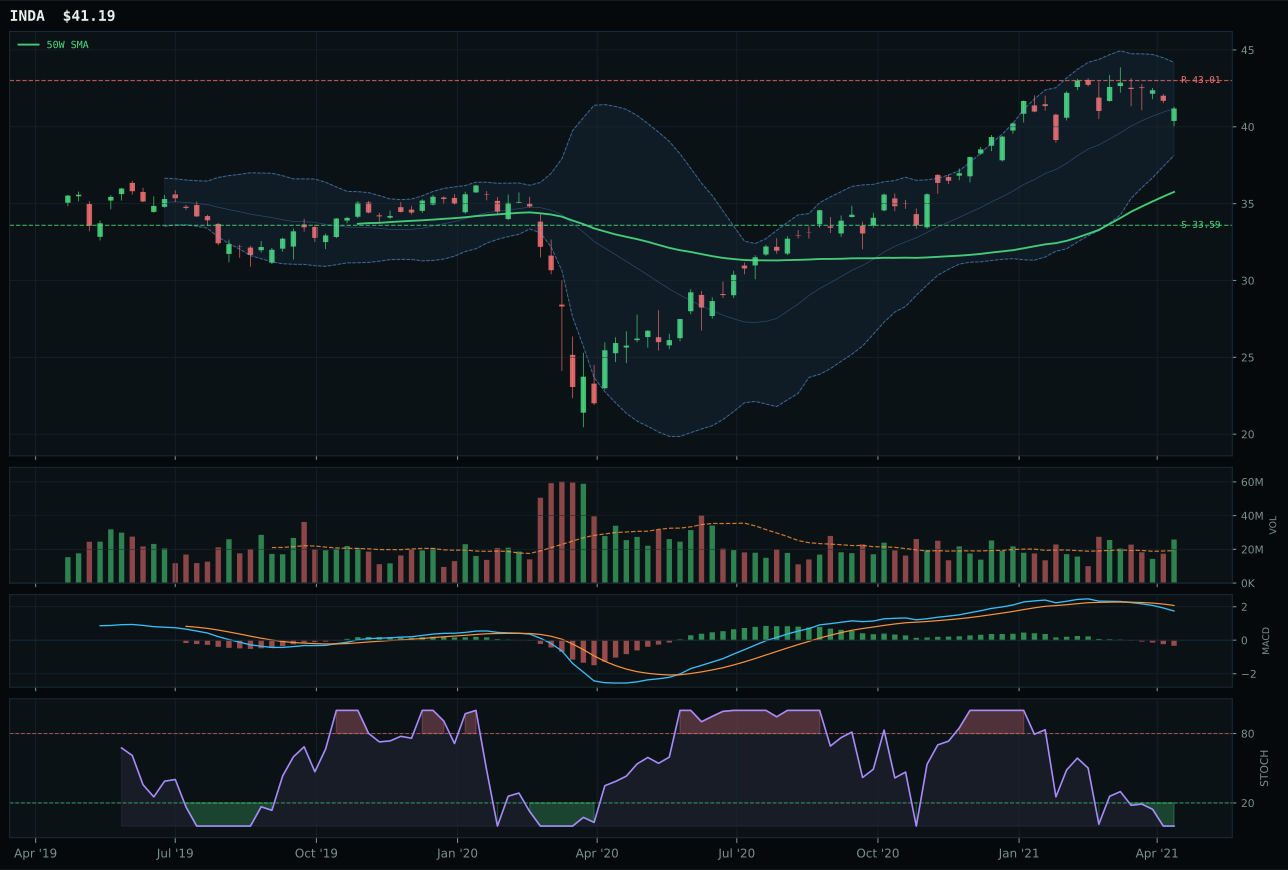
INDA has a vertical extension profile with -10.6% 13-week relative strength versus SPY.
A failed hold above support would weaken the setup.
Actionable but governed by invalidation levels.
IEMG narrowly beat ILF in an unconvincing matchup where both portfolios faced identical macro headwinds and weak technical footing. IEMG's winning margin came from marginally tighter timing (62.0 vs 61.0) and stochastic RSI positioning (oversold turn up at 0.16 versus rising mid-zone), along with +0.4% category-relative strength that edged ILF's -3.0%. The victory is technical and shallow: IEMG's 0.9% 13-week return and -10.2% SPY underperformance reveal an asset class in genuine malaise, not transition. ILF's superior macro fit (66.0 versus 42.0), driven by commodity breadth, metals scarcity, and inflation support, couldn't overcome thinner technical evidence and rising mid-zone stochastic (suggesting further upside skepticism). Both ETFs show thin volume participation (0.70x and neutral, respectively), signaling institutional disengagement. The category winner is the least-bad option in a declining market, not a compelling entry point—this is survival-of-the-fittest among losers.
Emerging Markets received 0% allocation, ranked 9th or 10th and entirely excluded despite scoring 18.7, the lowest among all ten categories. Credit stress (-10) at the macro level and -10.2% SPY-relative weakness on the technical side establish a categorical repudiation: emerging-market equities are underperforming in a regime that favors real assets and energy, and credit stress is actively punishing EM credit cycles. IEMG's technical evidence (25.3) and macro fit (42.0) are both well below portfolio minimums—thin volume participation and bearish/weakening MACD reveal forced selling, not accumulation. In an AltSeason regime with 50% overlay compression, tier-3 allocations vanish entirely; only top-2 at 10% and tiers 3-8 at 5% slots exist. For Emerging Markets to reclaim even a 5% slot, the category would require either a multi-week reversal rally on accelerating volume or a macro pivot where credit stress deactivates—neither is visible on the horizon. This is a cyclical exclusion: when commodity inflation and real asset cycles dominate, emerging-market equity beta loses appeal, and this portfolio follows that regime faithfully.