
2021-04-09
Informational purposes only. The content in this report, including allocations, analysis, and commentary, is provided solely for informational and educational purposes. It does not constitute financial advice, investment advice, trading advice, or any other type of advice. Past performance does not guarantee future results. Always conduct your own research and consult a qualified financial professional before making investment decisions.
Weekly Allocation
| Ticker | Category | Weight | Role |
|---|---|---|---|
| FSOL | 50% | Overlay | |
| XLE | Traditional Energy | 10% | Top-2 (10%) |
| URNM | Nuclear Energy | 10% | Top-2 (10%) |
| XLU | Utilities & Infrastructure | 5% | Tier-2 (5%) |
| MOO | Agriculture & Livestock | 5% | Tier-2 (5%) |
| XAR | Defense & Aerospace | 5% | Tier-2 (5%) |
| SLV | Precious Metals | 5% | Tier-2 (5%) |
| PICK | Industrial Metals | 5% | Tier-2 (5%) |
| SMH | AI | 5% | Tier-2 (5%) |
Trade Instructions — Monday Open
Sell the tranche from 2021-03-12 (completing its 4-week hold). Buy the new tranche. Instructions show net portfolio changes — same-asset positions cancel, weight changes show the delta.
| Action | Ticker | Instruction |
|---|---|---|
| SELL | COPX | Sell 67% of COPX position (reduce 3.75% → 1.25%) |
| SELL | ITA | Sell 33% of ITA position (reduce 3.75% → 2.50%) |
| SELL | PAVE | Sell 33% of PAVE position (reduce 3.75% → 2.50%) |
| SELL | INDA | Sell entire INDA position (1.25% of portfolio) |
| BUY | URNM | Buy URNM — 20.00% of freed cash (adds 1.25% to portfolio) |
| BUY | PICK | Buy PICK — 20.00% of freed cash (adds 1.25% to portfolio) |
| BUY | SMH | Buy SMH — 20.00% of freed cash (adds 1.25% to portfolio) |
| BUY | XLU | Buy XLU — 20.00% of freed cash (adds 1.25% to portfolio) |
| BUY | XAR | Buy XAR — 20.00% of freed cash (adds 1.25% to portfolio) |
Current Portfolio After Trade
Combined holdings across all 4 active tranches. Each tranche is 25% of the portfolio.
| Ticker | % of Portfolio | Weight Bar |
|---|---|---|
| FSOL | 50.00% | |
| XLE | 7.50% | |
| URNM | 5.00% | |
| MOO | 5.00% | |
| PICK | 5.00% | |
| SLV | 3.75% | |
| URA | 3.75% | |
| XLK | 3.75% | |
| SMH | 3.75% | |
| ITA | 2.50% | |
| PAVE | 2.50% | |
| FCG | 2.50% | |
| XLU | 2.50% | |
| COPX | 1.25% | |
| XAR | 1.25% |
Macro Regime — Transition / Mixed
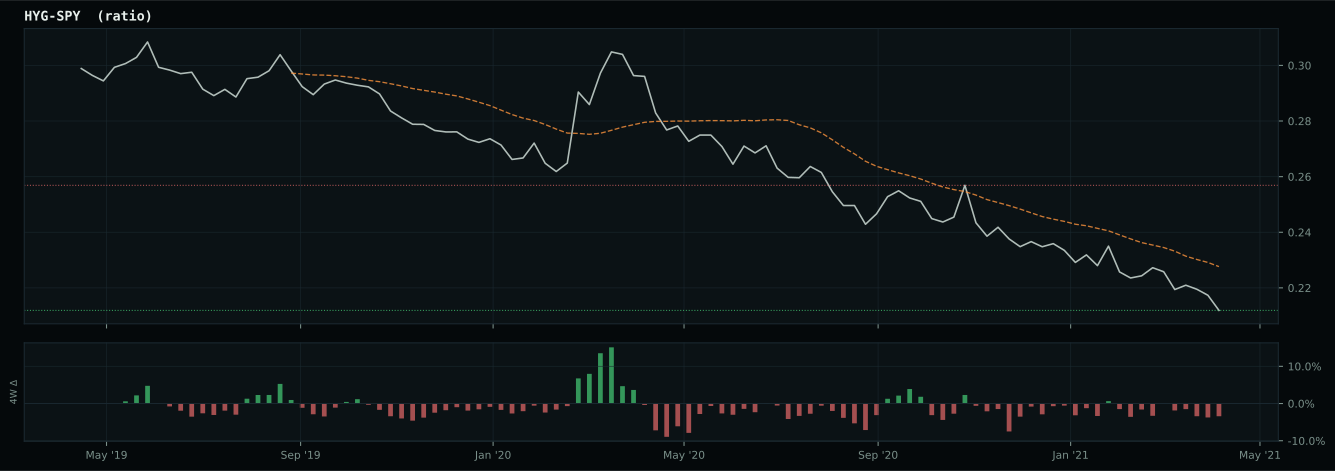
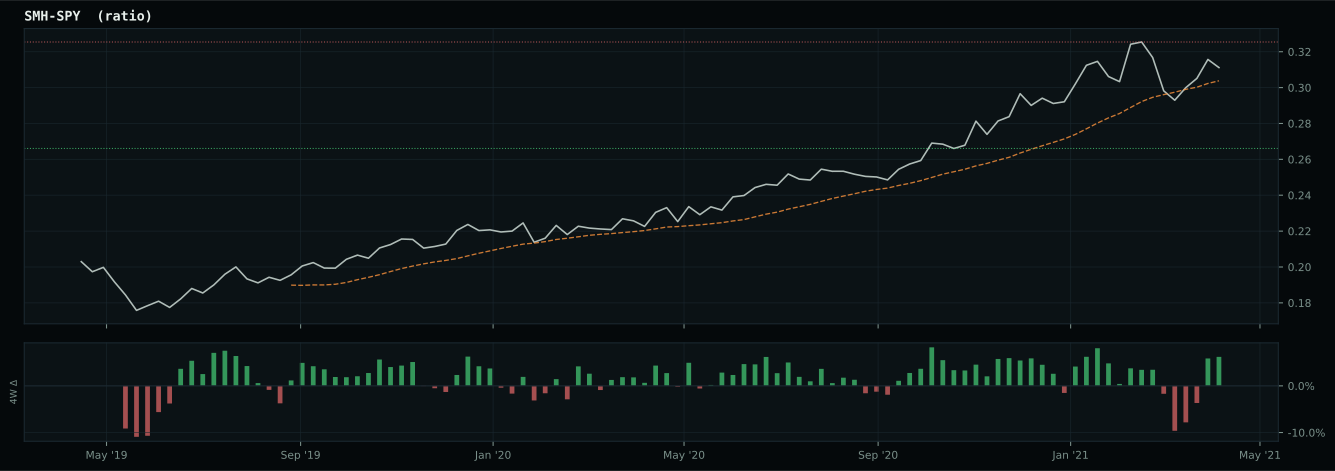
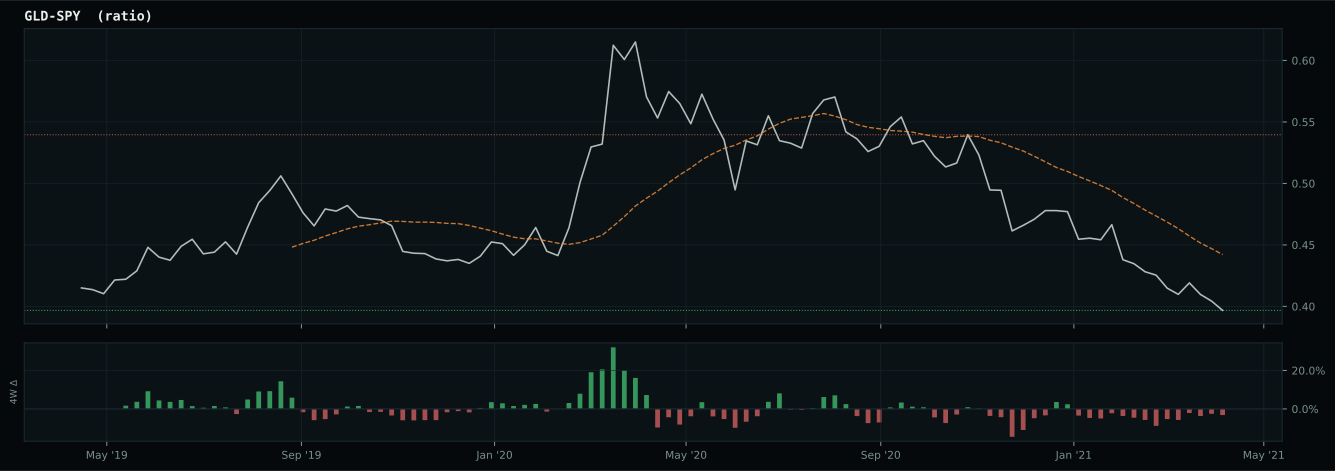
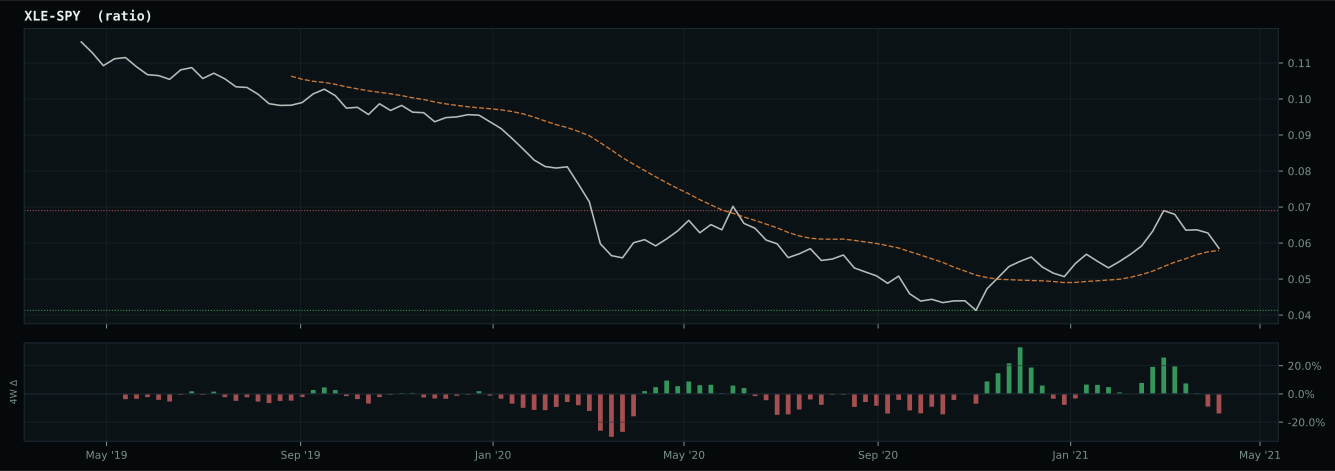
Macro Evidence Charts
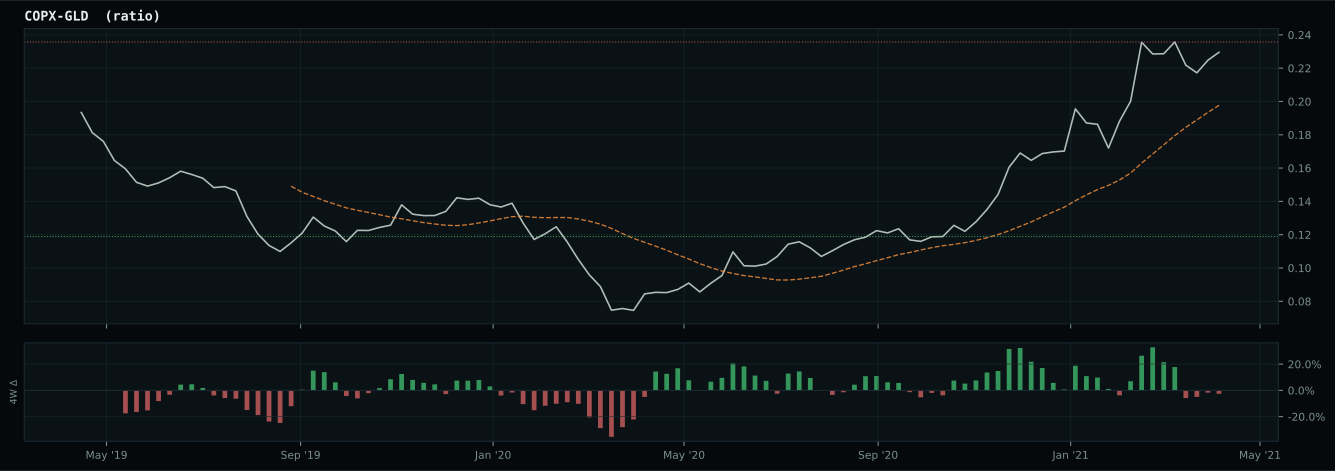
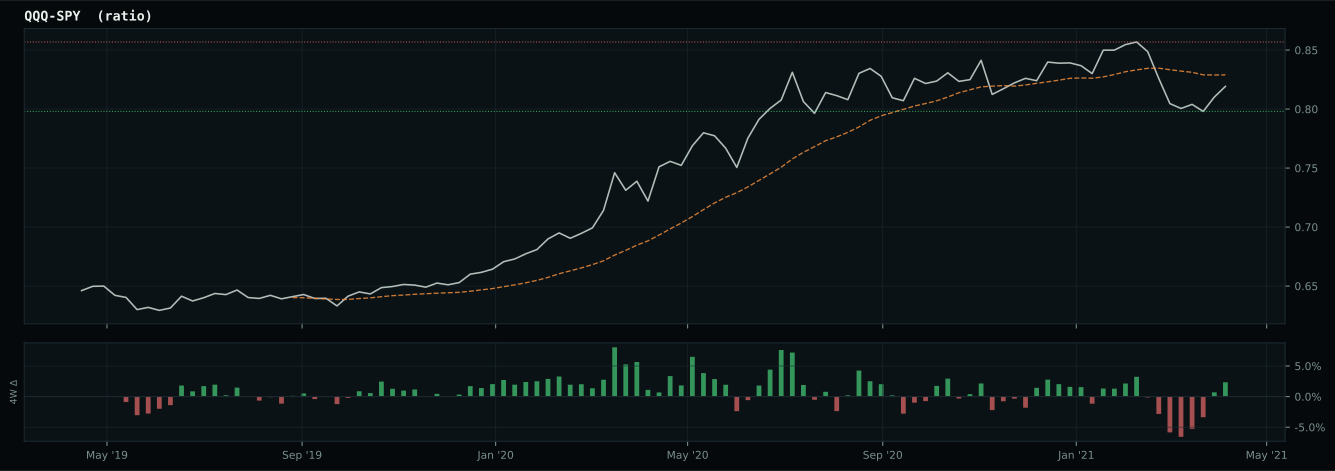
Market-implied signals behind the macro regime scores. Each ratio compares two assets; the direction and slope of the ratio is what the macro engine reads.
Crypto Regime — AltSeason
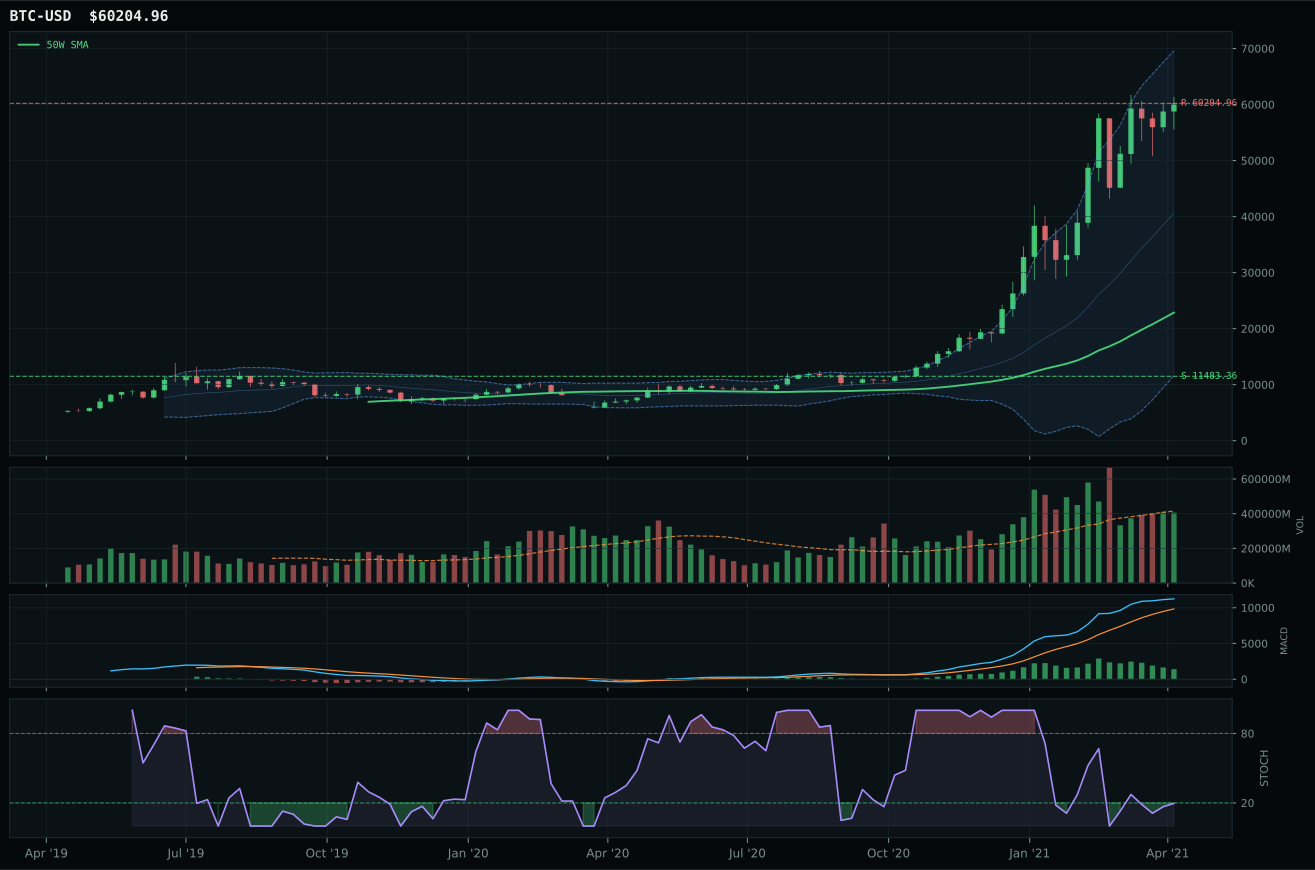
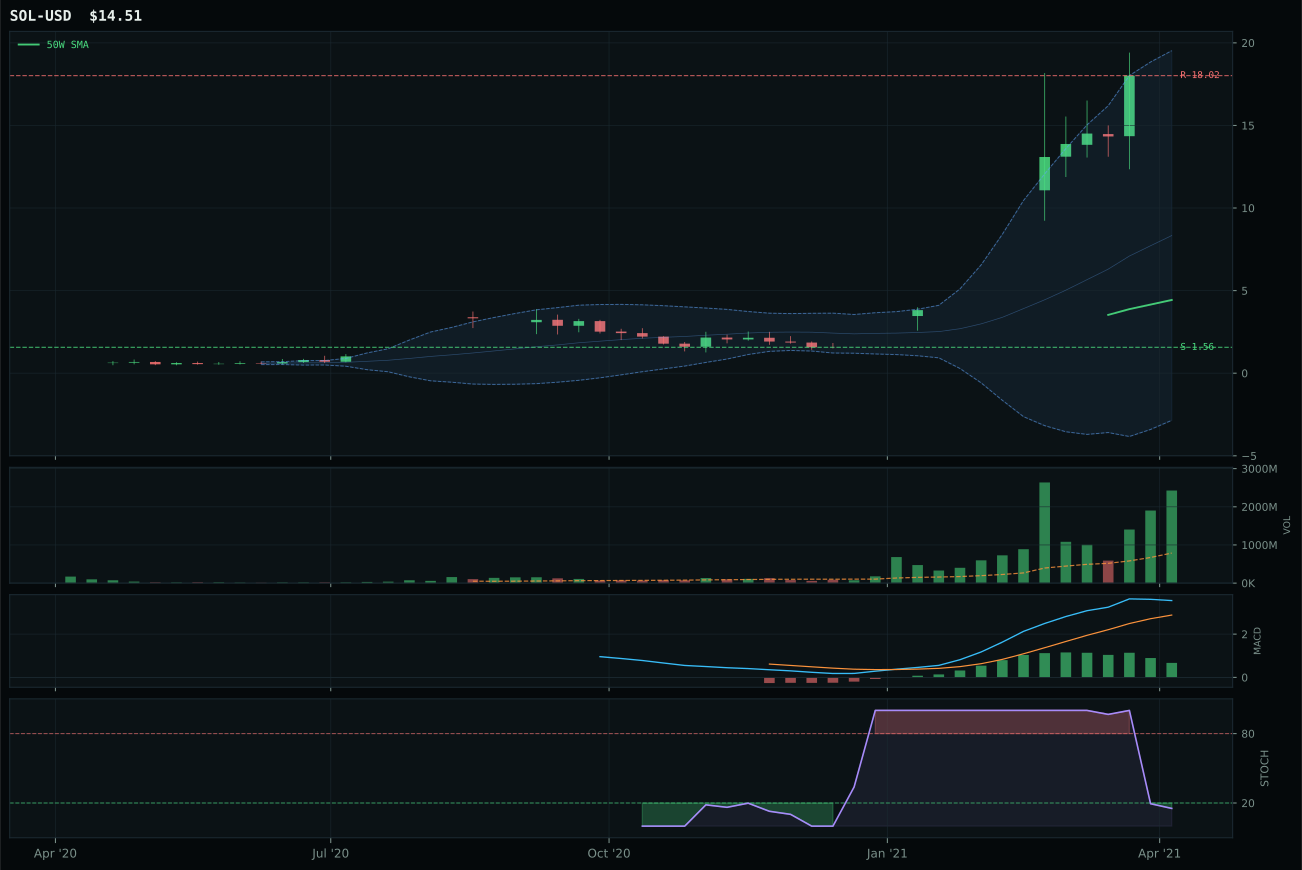
post-touch structure is too wide to count as a range; max/min close ratio is 11.00
TrendBTC confirmed: 2 consecutive closes above rising/flat 50W SMA
all available AltSeason conditions pass; missing optional confirmations skipped
Category Rankings
| Rank | Category | Winner | Score | Alloc | 4W Ret | Peers (4W) |
|---|---|---|---|---|---|---|
| 1 | Traditional Energy | XLE | 72.2 | 20% | +11.71% | FCG +14.0% · XOP +10.2% |
| 2 | Nuclear Energy | URNM | 69.2 | 20% | +13.88% | URA +14.3% · NLR +4.4% |
| 3 | Utilities & Infrastructure | XLU | 61.2 | 10% | +2.08% | PAVE +7.7% · IGF +3.9% |
| 4 | Agriculture & Livestock | MOO | 53.6 | 10% | +7.25% | WEAT +16.8% · VEGI +7.0% |
| 5 | Defense & Aerospace | XAR | 47.5 | 10% | -0.78% | ITA +2.4% · ROKT +0.3% |
| 6 | Precious Metals | SLV | 46.6 | 10% | +10.82% | GDX +10.4% · GLD +6.2% |
| 7 | Industrial Metals | PICK | 43.9 | 10% | +19.71% | COPX +23.7% · REMX +12.8% |
| 8 | AI | SMH | 43.6 | 10% | -5.39% | BOTZ -0.3% · AIQ -3.9% |
| 9 | Technology | XLK | 35.2 | 0% | -2.00% | IGV -4.7% · CIBR +0.0% |
| 10 | Emerging Markets | IEMG | 5.9 | 0% | +2.80% | INDA +5.8% · ILF +7.8% |
Traditional Energy — XLE
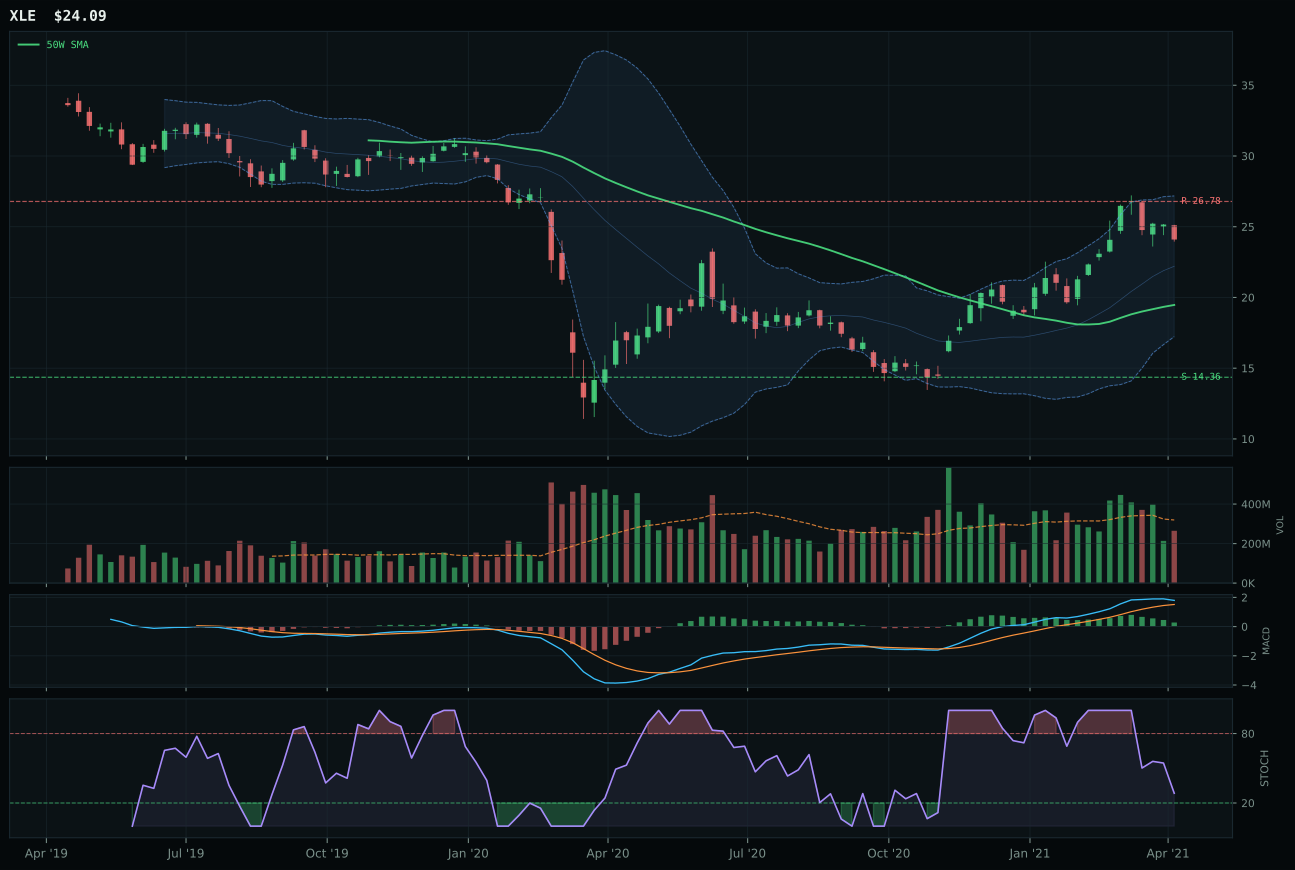
XLE has a vertical extension profile with 8.4% 13-week relative strength versus SPY.
A failed hold above support would weaken the setup.
Actionable but governed by invalidation levels.
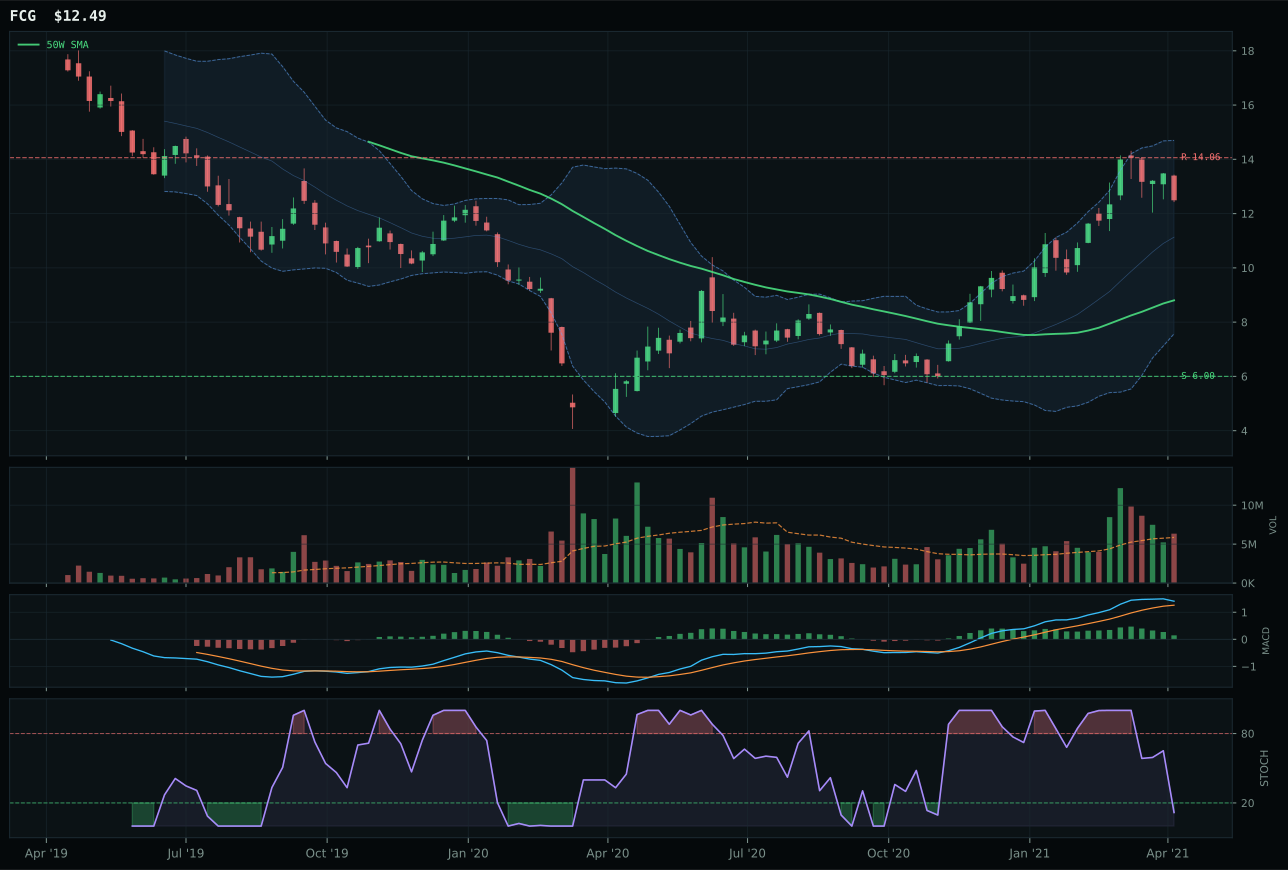
FCG has a vertical extension profile with 16.6% 13-week relative strength versus SPY.
A failed hold above support would weaken the setup.
Actionable but governed by invalidation levels.
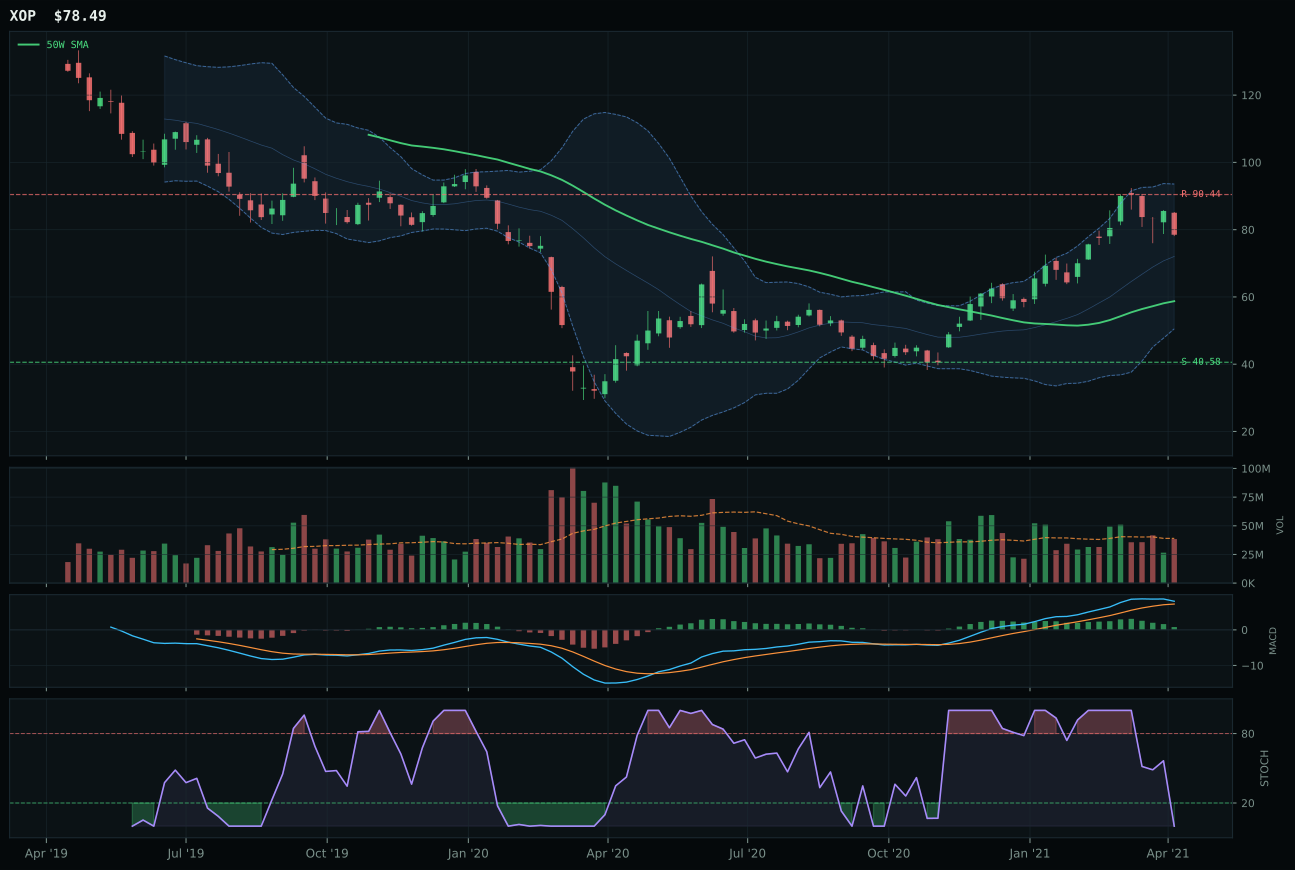
XOP has a vertical extension profile with 11.9% 13-week relative strength versus SPY.
A failed hold above support would weaken the setup.
Actionable but governed by invalidation levels.
XLE wins with a 63.4 reasoned ETF proof order score versus FCG's 62.3, a thin margin that hinges on XLE's superior 47.7 risk-reward versus FCG's 31.9—even though FCG posted a stronger 16.6% thirteen-week return. XLE's 8.4% SPY-relative strength and -3.5% category-relative strength tell a careful story: integrated cash-flow defense is leading within energy, not the pure-play natural gas bet that FCG represents. FCG is stretched 41.9% from its 50W and already priced for perfection with stochastic RSI at oversold, leaving little room for new buyers; XLE at 23.8% extension still has breathing room. Both show bullish but flattening MACD and neutral volume, but XLE's 0.7% 50W slope versus FCG's higher momentum creates a cleaner technical setup. The category-relative leadership is driving XLE: FCG's +4.7% category advantage over XLE is noise compared to XLE's defensive structure in a mixed macro regime.
Traditional Energy earns 10% allocation as a top-2 overweight category with a 72.2 score, the highest of all 10 categories and earning its position through sustained macro conviction plus adequate technical sponsorship. The category-level macro fit of 85.0 is exceptional: energy scarcity (+16), inflation pressure (+10), supply shortage (+9), and real asset sponsorship (+7) create a structural bid that persists regardless of short-term technicals. XLE's 86.0 trend score and 54.0 technical evidence combine with 86.0 macro/narrative fit, producing the portfolio's clearest overweight case. Entry timing is fair at 48.0 because XLE sits 23.8% above its 50W with risk-reward slightly negative; the 10% allocation reflects macro opportunity weighted against entry risk. This allocation holds unless crude prices break below the 14.36 support or credit stress signals accelerate sharply.
Nuclear Energy — URNM
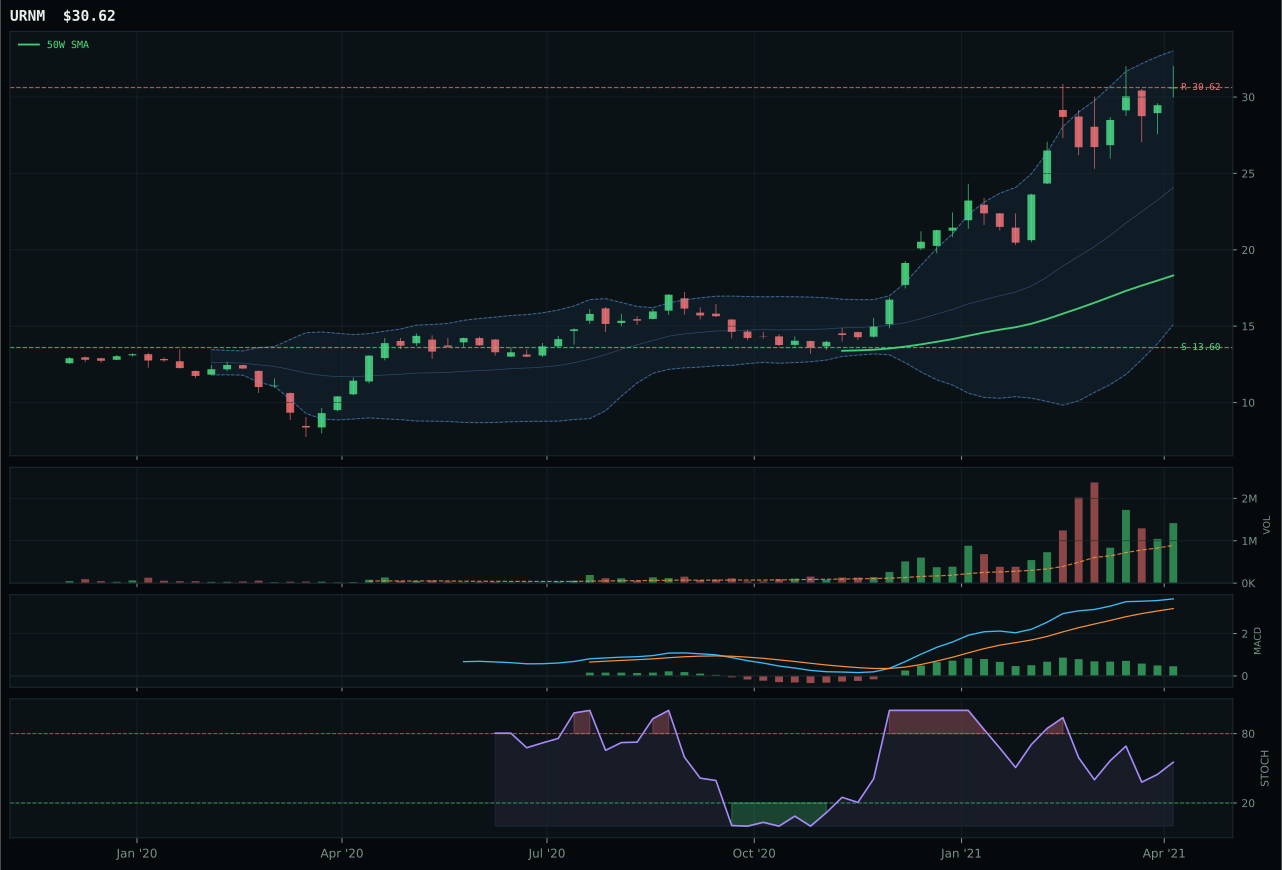
URNM has a vertical extension profile with 23.9% 13-week relative strength versus SPY.
A failed hold above support would weaken the setup.
Actionable but governed by invalidation levels.
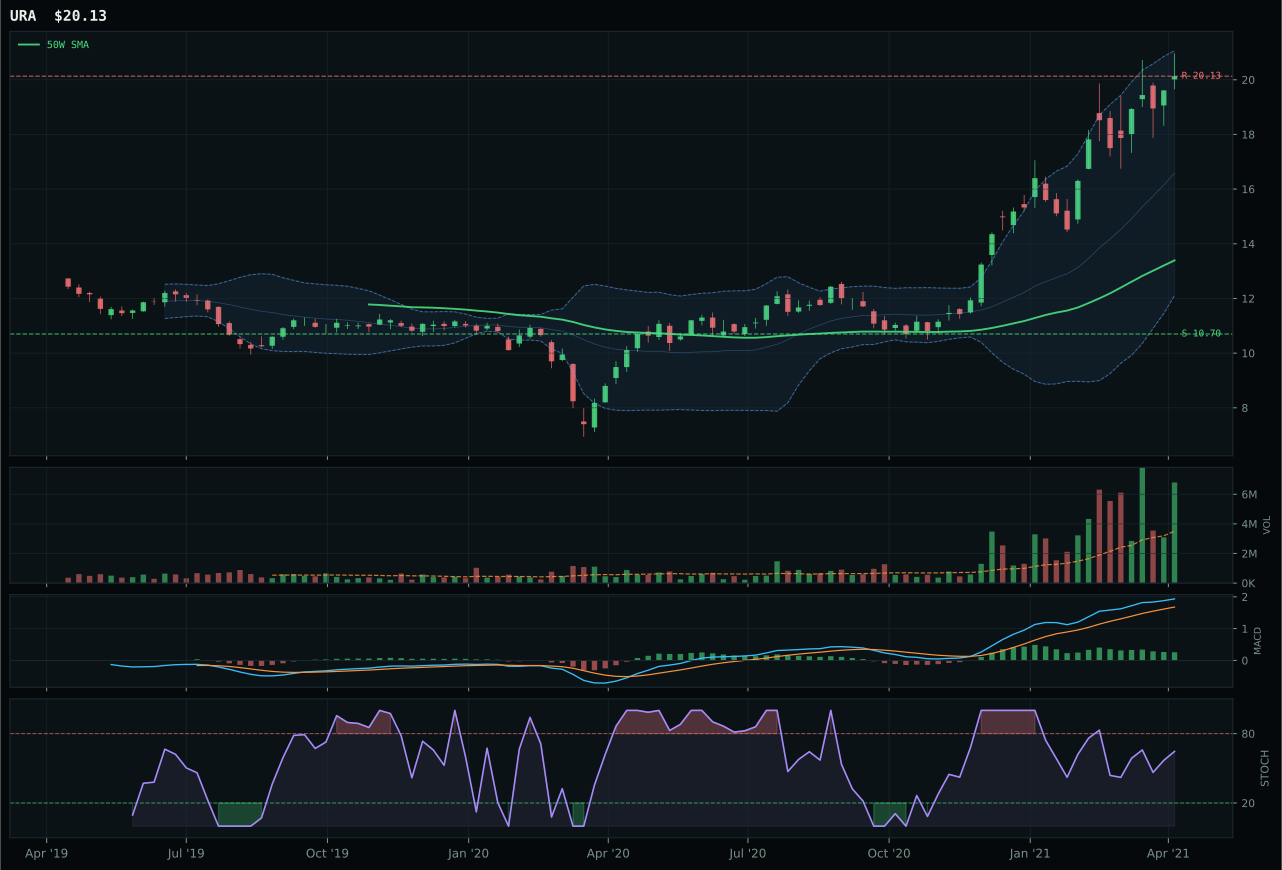
URA has a vertical extension profile with 14.8% 13-week relative strength versus SPY.
A failed hold above support would weaken the setup.
Actionable but governed by invalidation levels.
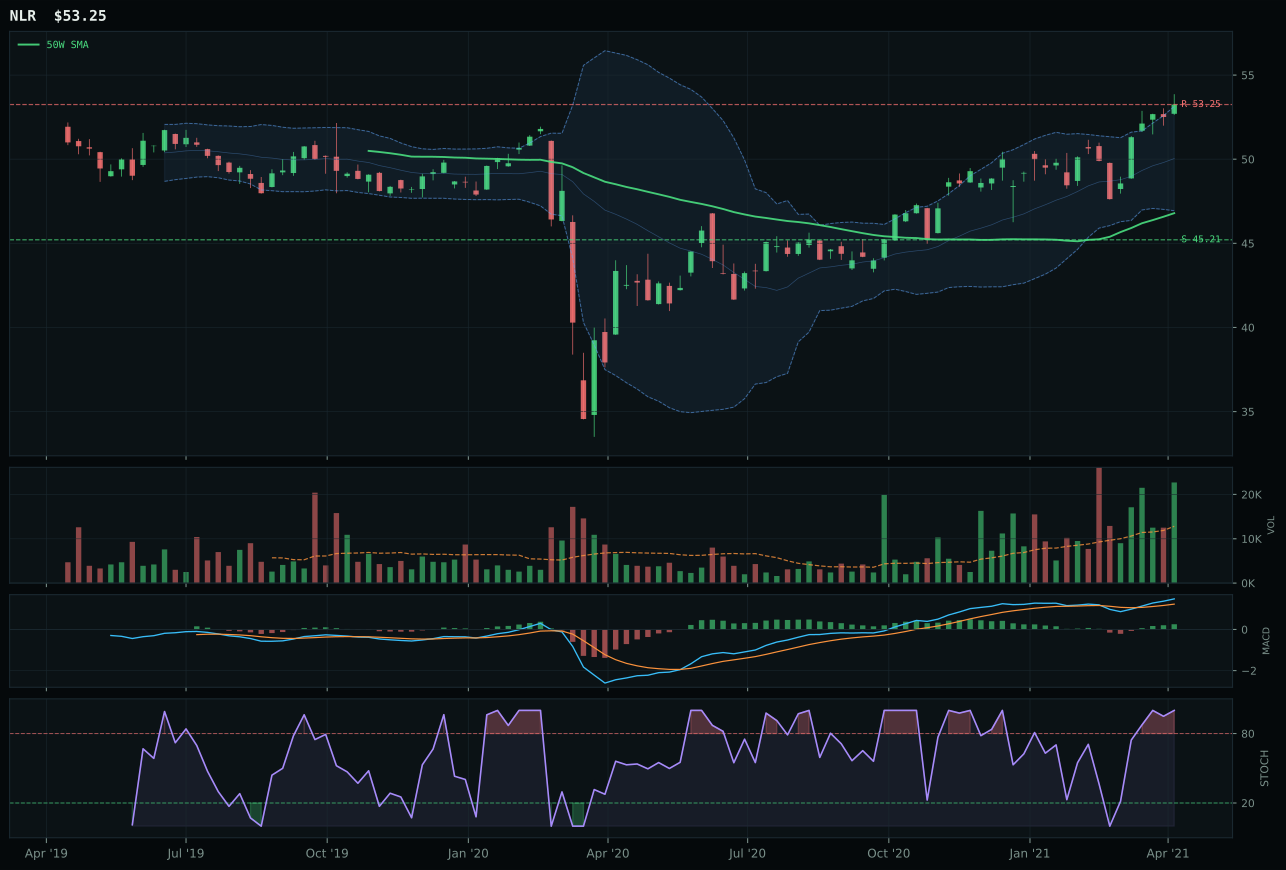
NLR has a neutral structure profile with -1.4% 13-week relative strength versus SPY.
A failed hold above support would weaken the setup.
Tracked, but not top-2 eligible because: .
URNM wins the nuclear category decisively with 100.0 persistence and 100.0 momentum confirmation scores that far exceed URA's comparable metrics, despite URA's superior 100.0 trend score. URNM's 31.9% thirteen-week return and 23.9% SPY-relative strength are the strongest in the portfolio, reflecting uranium-specific demand that transcends broad market moves. Volume at 1.59x the 20W average shows accumulation confirmation rather than distribution, the key differentiator when both setups are vertical extensions near Fibonacci 0.236. URA's 14.8% SPY-relative strength and 22.7% thirteen-week return are respectable but pale against URNM's outperformance; category-relative strength of 9.1% versus 0.0% signals that specialized uranium-miner leverage is winning the capital race. The 86.0 volume-price confirmation for URNM versus URA's comparable score obscures the fact that URNM's volume is 1.59x versus URA's accumulation at similar levels—URNM is still accumulating while URA is rolling over.
Nuclear Energy earns 10% allocation as a top-2 overweight category with a 69.2 score, tied with Traditional Energy as the portfolio's most favored sleeve. The macro fit of 69.0 supports this: energy scarcity (+9), real asset sponsorship (+7), and AI growth sponsorship (+5) all bid for nuclear positioning. URNM's 82.5 technical evidence is strong, though the 40.0 timing score reflects severe extension at 67.2% above the 50W and only 0.0% upside to resistance (28.1 risk-reward). This is a conviction macro allocation despite stretched entry technicals—the 100.0 momentum confirmation and 100.0 persistence scores indicate this is structural uranium scarcity flowing through the highest-leverage vehicle. The risk is obvious: URNM is priced for a perfect energy transition narrative, and any setback in uranium demand would create violent deleveraging. Maintain 10% unless price closes below 13.60 support or volume participation collapses below 1.0x the 20W average.
Utilities & Infrastructure — XLU
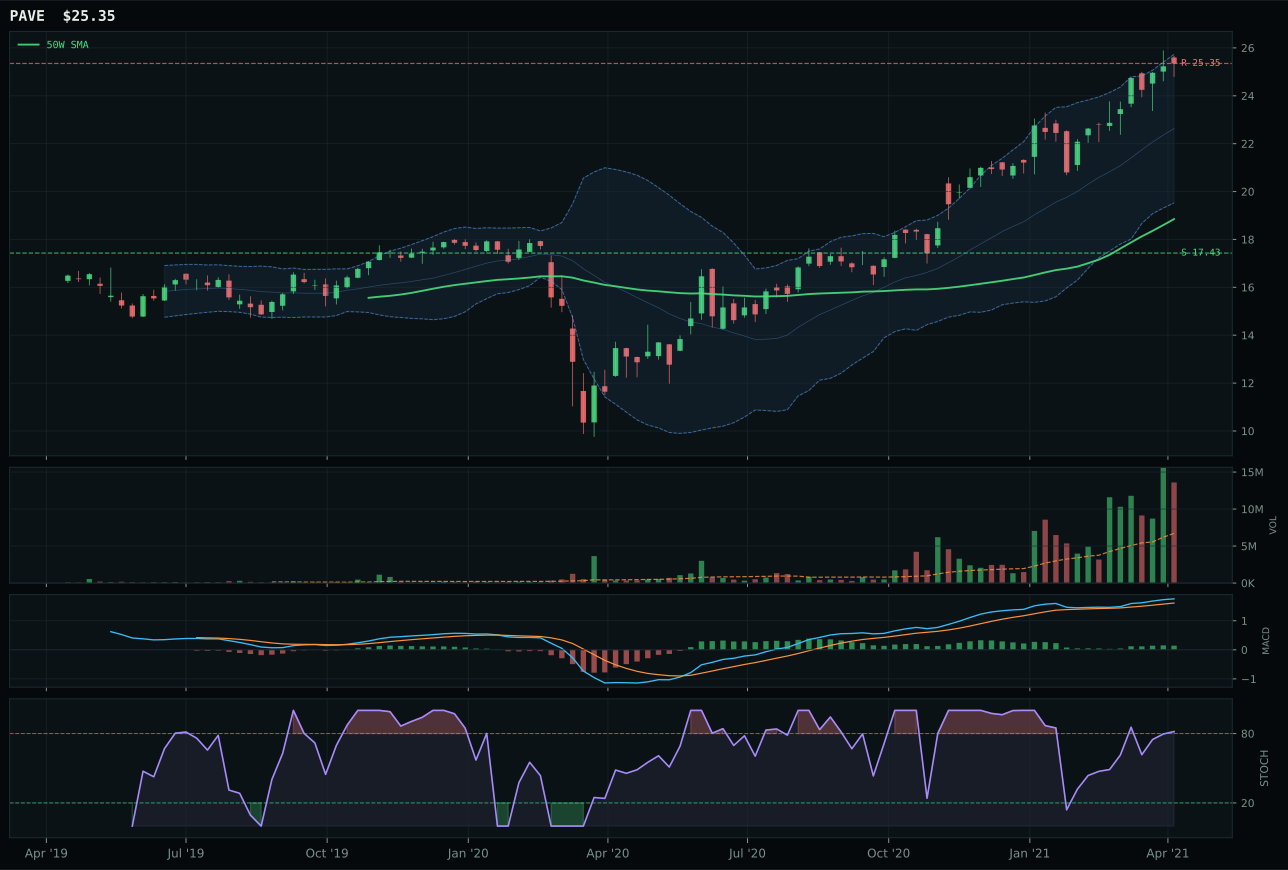
PAVE has a vertical extension profile with 3.5% 13-week relative strength versus SPY.
A failed hold above support would weaken the setup.
Actionable but governed by invalidation levels.
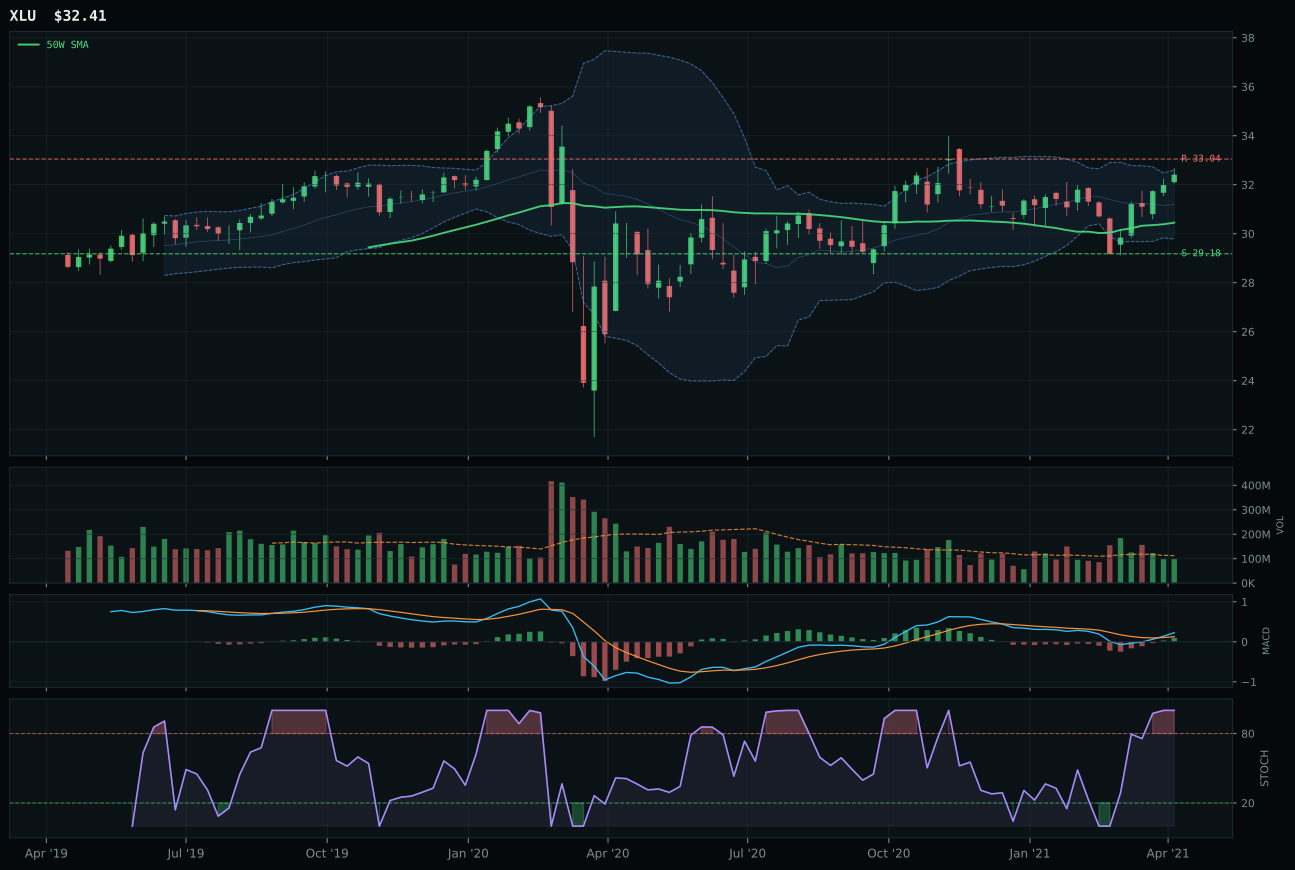
XLU has a neutral structure profile with -3.9% 13-week relative strength versus SPY.
A failed hold above support would weaken the setup.
Actionable but governed by invalidation levels.
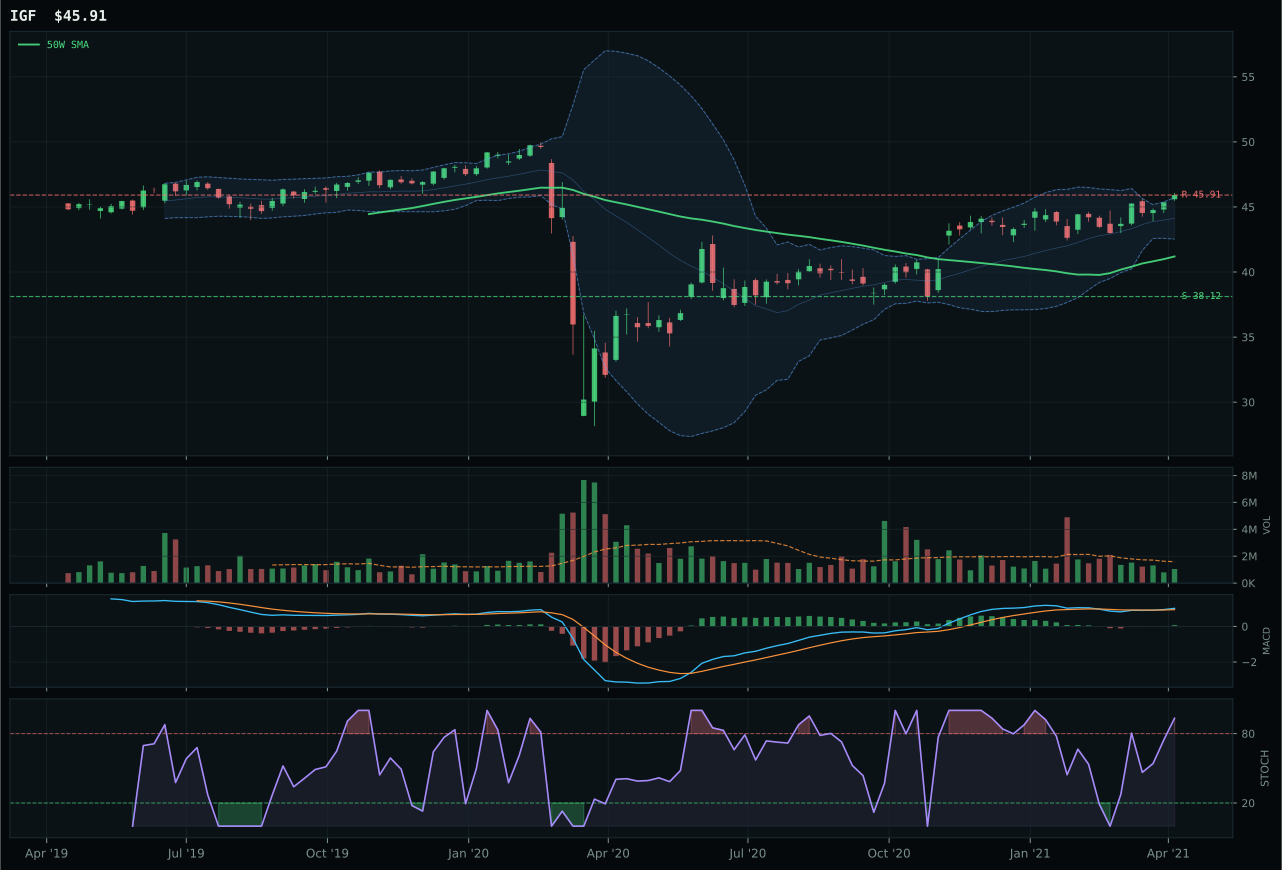
IGF has a neutral structure profile with -5.1% 13-week relative strength versus SPY.
A failed hold above support would weaken the setup.
Actionable but governed by invalidation levels.
XLU wins the utilities category with cleaner timing mechanics than runner-up PAVE, delivering a 75.0 timing score versus PAVE's 37.0 despite PAVE's superior 89.2 technical evidence and above-average volume sponsorship. XLU's advantage is simple: it sits only 6.4% above its 50W with bullish and improving MACD, while PAVE is extended 34.5% above its 50W and already at overbought stochastic RSI momentum. Both setups are structurally sound (72.5 for XLU, 65 for PAVE composite), but PAVE's extended technicals mean new institutional buyers face punishing entry risk despite the higher absolute technical score. XLU's 94.1 trend score reflects perfect trend structure with only -3.9% SPY-relative weakness, indicating utilities are not leading but are holding their defensive ground. PAVE's 11.4% thirteen-week return is compelling, yet the deteriorating risk-reward from current prices (45.2 versus XLU's 48.1) makes XLU the better allocation.
Utilities & Infrastructure earns 5% allocation as a tier-2 holding with a 61.2 category score, reflecting its defensive utility in a Transition/Mixed regime but insufficient technical strength to justify top-2 status. The 52.0 macro fit is moderate; broad market bear (+4) and Transition regime help (+4) provide slight tailwinds, but inflation pressure (-6) is a headwind that limits conviction. XLU's 73.5 technical evidence is solid with a clean 75.0 timing score reflecting pullback entry mechanics, yet 4.0% thirteen-week returns show this category is sleep-walking through the rally. The 5% allocation is valid as a defensive hedge—infrastructure capex spending is real and credit stress hasn't broken the utility moat—but the category would need either a technical reset below 29.18 support or a material shift toward outright risk-off to escalate to top-2 status. Hold 5% as insurance; do not chase on strength.
Agriculture & Livestock — MOO
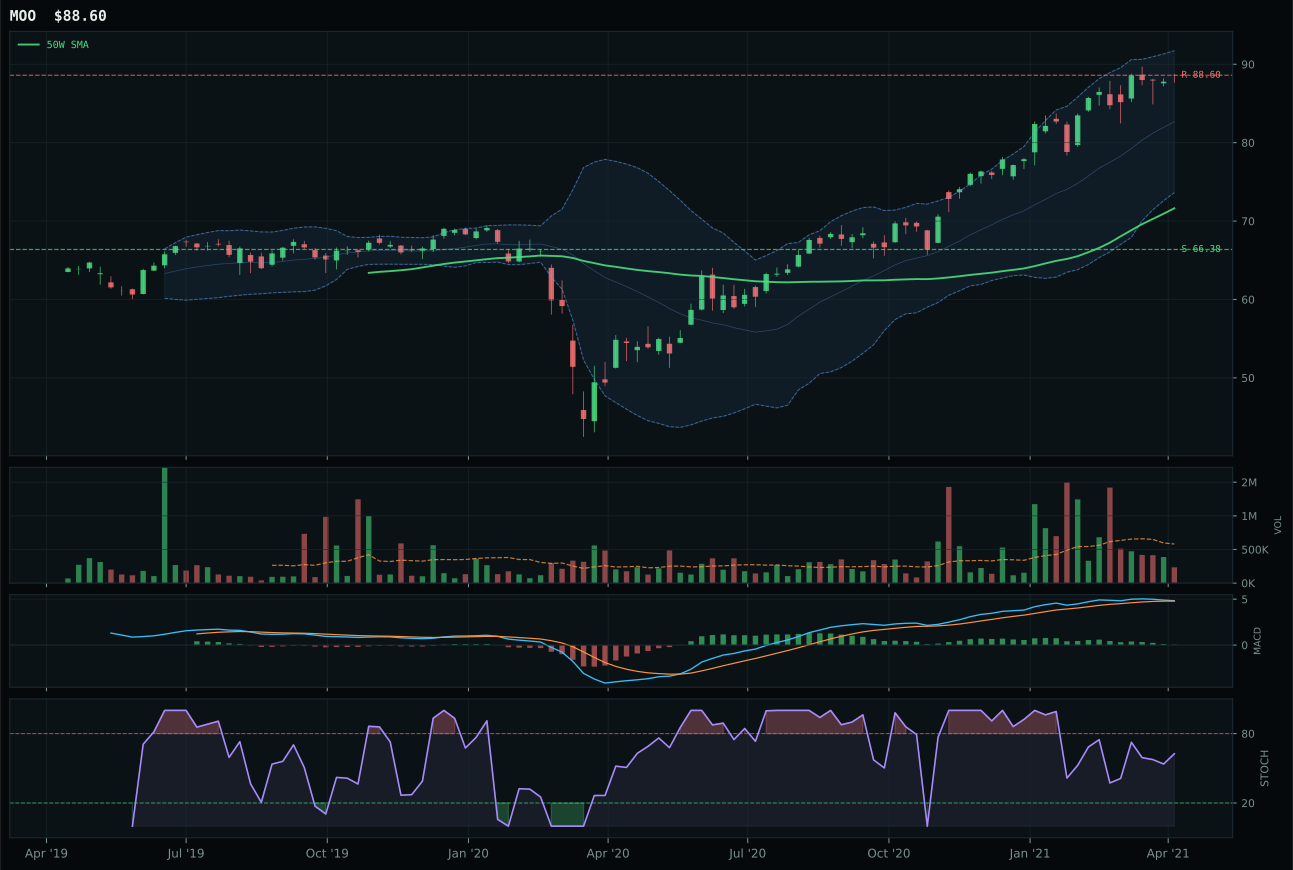
MOO has a vertical extension profile with -0.4% 13-week relative strength versus SPY.
A failed hold above support would weaken the setup.
Actionable but governed by invalidation levels.
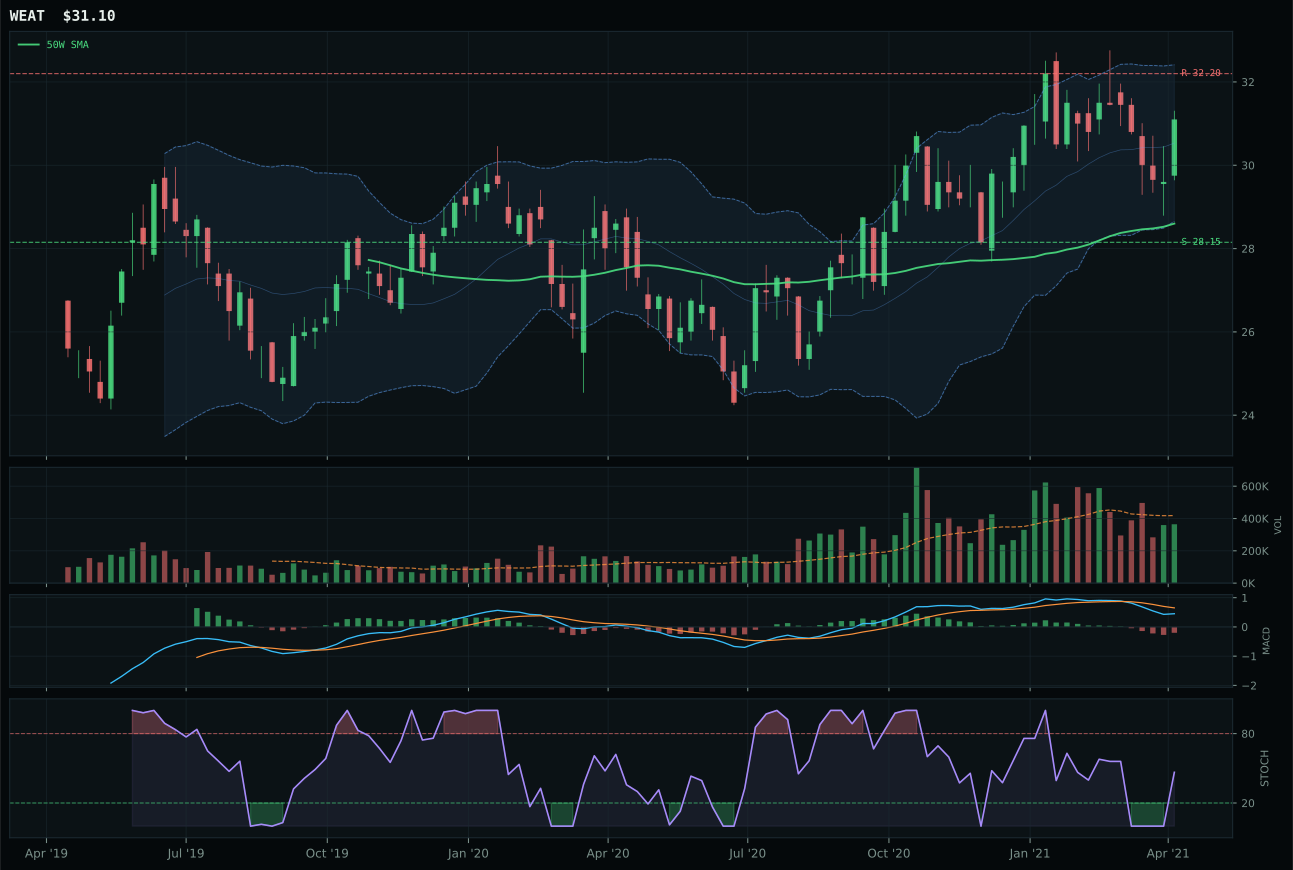
WEAT has a neutral structure profile with -7.4% 13-week relative strength versus SPY.
A failed hold above support would weaken the setup.
Actionable but governed by invalidation levels.
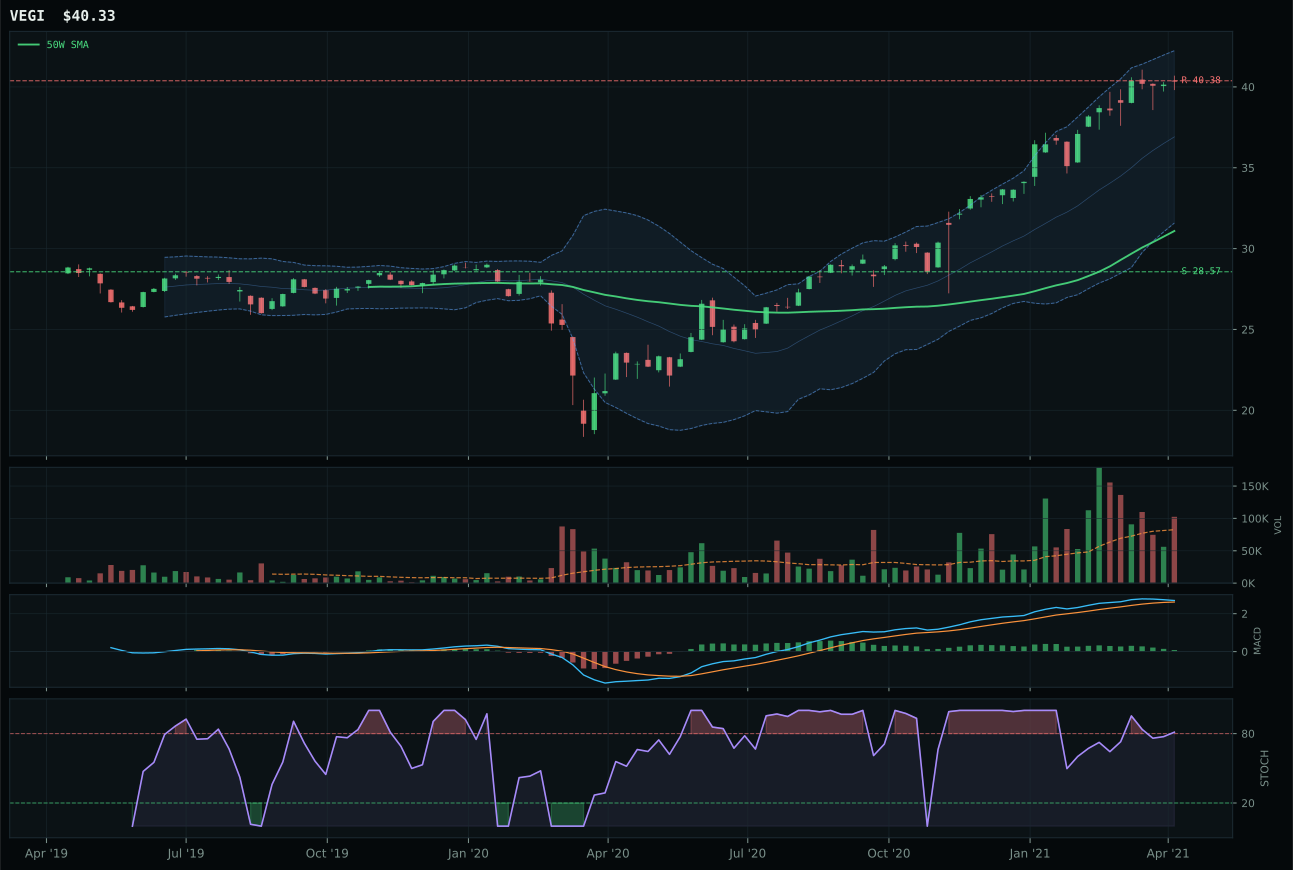
VEGI has a vertical extension profile with 2.7% 13-week relative strength versus SPY.
A failed hold above support would weaken the setup.
Tracked, but not top-2 eligible because: .
MOO wins with a 73.0 structure score and 95.4 trend that handily beats WEAT's 61 trend and 65.9 structure, a gap driven by WEAT's bearish and weakening MACD versus MOO's bullish but flattening state. MOO's zero category-relative strength (0.0%) versus WEAT's -7.1% is decisive; when a commodity category is bidding, you own the one with positive peer momentum. Both are extended at 23.7% and 41.9% above their respective 50Ws, but MOO's 0.40x thin volume combined with a 0.0% four-week return shows quiet accumulation into strength, not retail chasing. WEAT's -7.4% SPY-relative weakness is the critical tell—it's fighting the broader tape, while MOO trades with technical purity despite micro volume.
Agriculture & Livestock earns 5% allocation with a 53.6 category score that justifies tier-2 status in an alt-season environment. The macro case here is the strongest in the portfolio at 86.0 category-level macro fit: supply shortage (+13), inflation pressure (+10), real asset sponsorship (+8), and commodity breadth positive (+5) all reinforce the technical bid. MOO's 57.4 technical evidence score is modest relative to its macro context, yet the category deserves 5% because it's one of the few places where real asset scarcity themes can be expressed cleanly. The 48.0 timing score reflects fair entry risk, but the 70.0 macro narrative fit suggests the structural commodity setup is early enough that current prices do not yet reflect the full supply-constraint story. Pushing to 10% would require either a technical reset or MOO breaking above the 88.60 resistance.
Defense & Aerospace — XAR
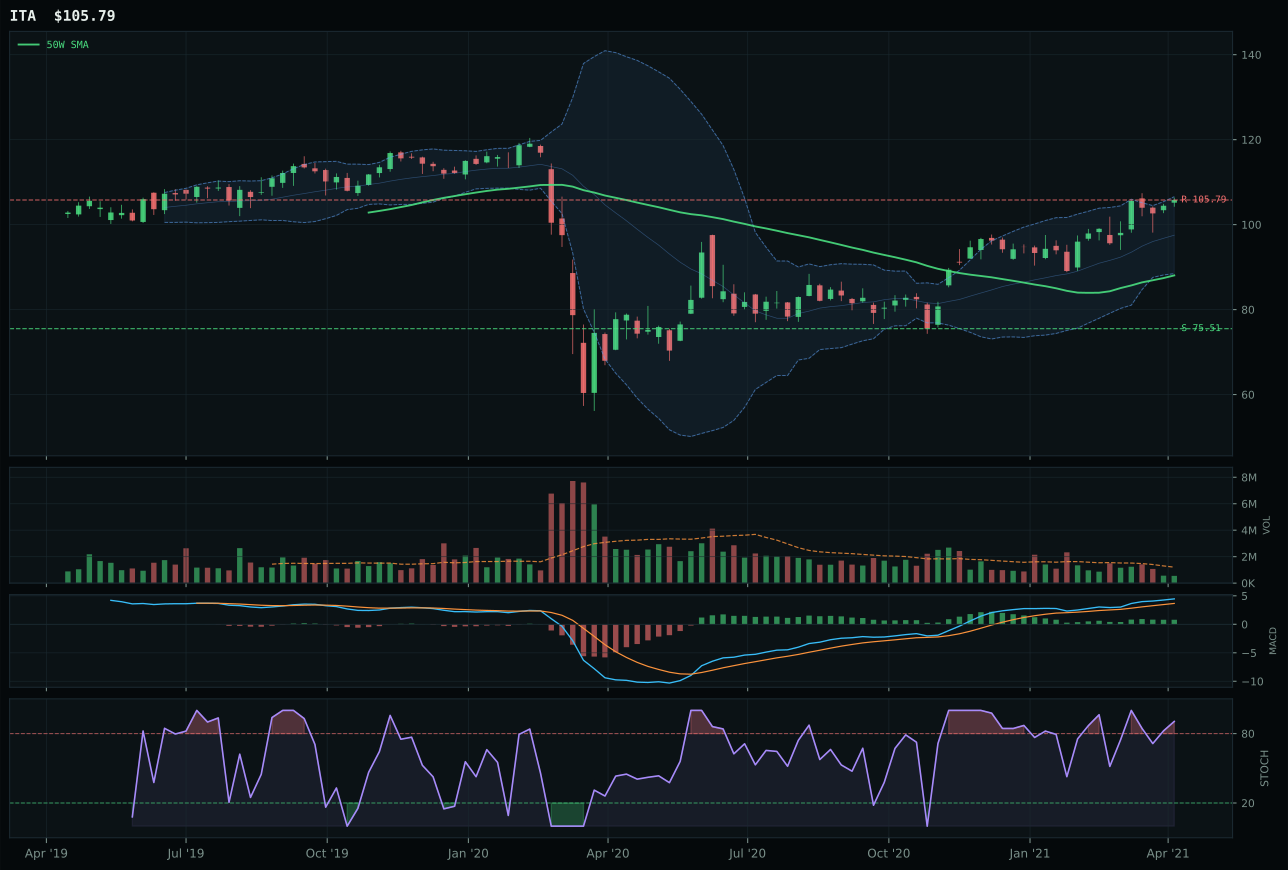
ITA has a vertical extension profile with 5.4% 13-week relative strength versus SPY.
A failed hold above support would weaken the setup.
Actionable but governed by invalidation levels.
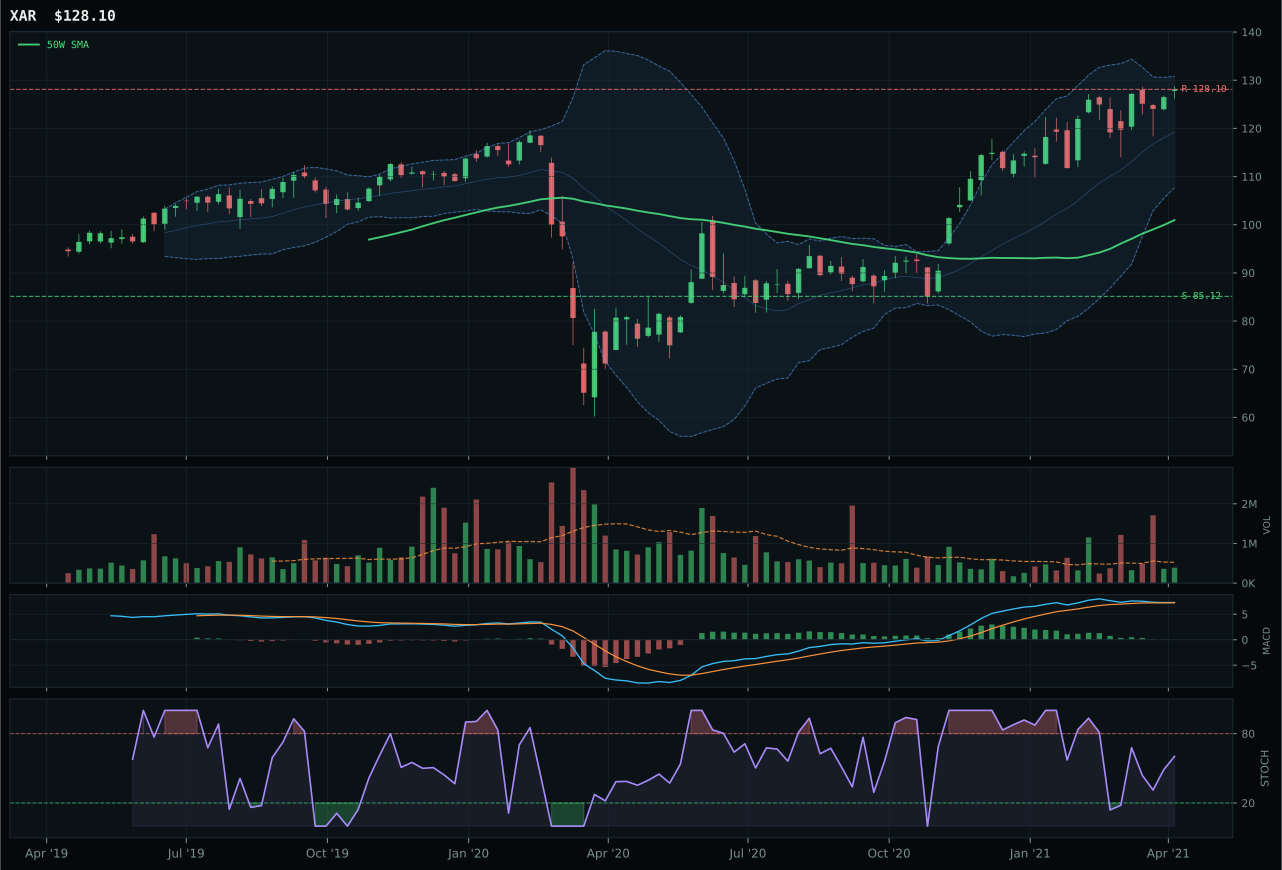
XAR has a vertical extension profile with 4.4% 13-week relative strength versus SPY.
A failed hold above support would weaken the setup.
Actionable but governed by invalidation levels.
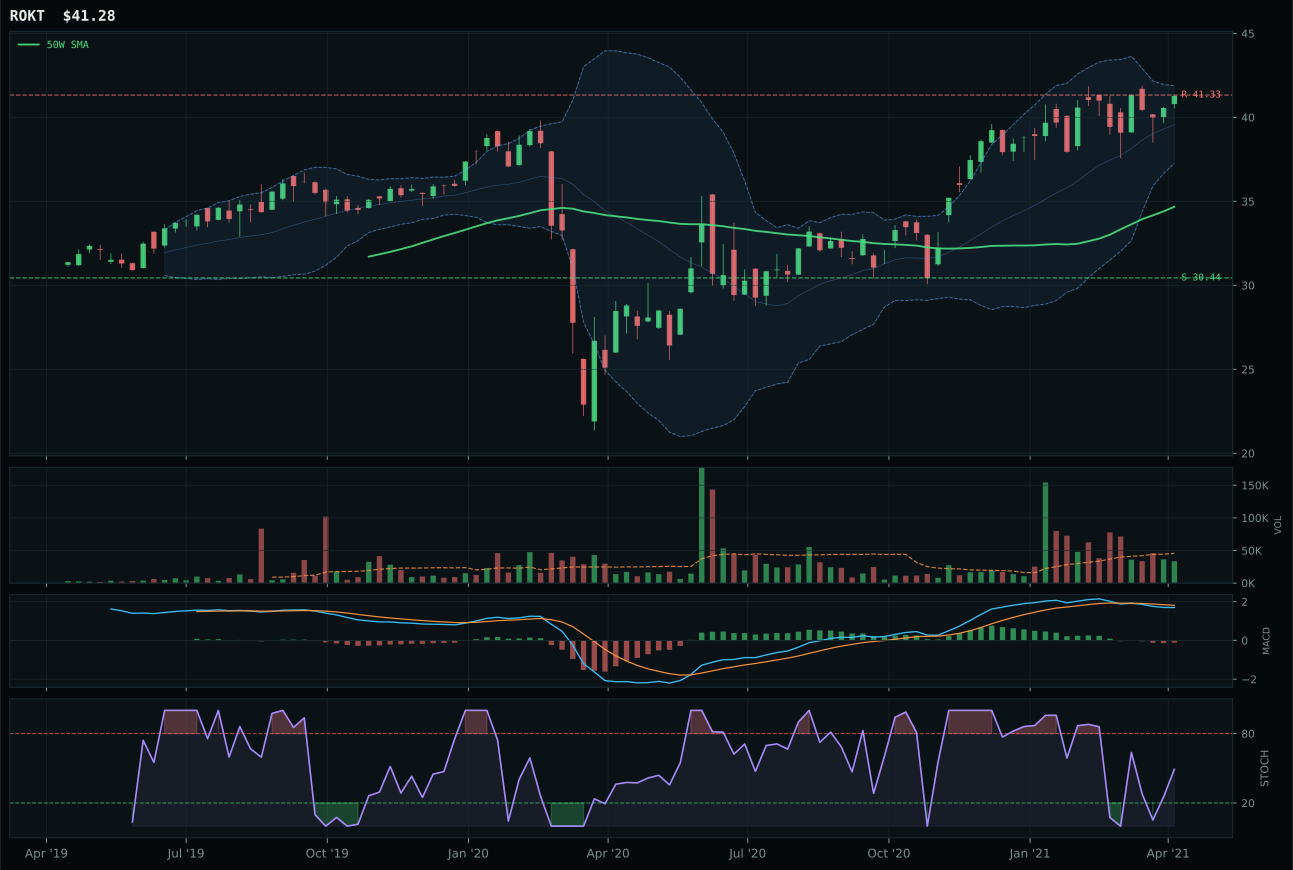
ROKT has a vertical extension profile with -1.8% 13-week relative strength versus SPY.
A failed hold above support would weaken the setup.
Tracked, but not top-2 eligible because: .
XAR wins the category despite ITA's stronger technical score of 64 versus XAR's 58, because stochastic RSI timing favors XAR's rising mid-zone at 0.60 over ITA's overbought momentum at elevated levels. Both names have perfect 100.0 trend scores with price above both moving averages and strong SPY-relative strength (4.4% for XAR, 5.4% for ITA), but XAR's cleaner 48.0 timing score versus ITA's 32.0 is the deciding factor when setups are otherwise similar vertical extensions. Volume is thin at 0.74x across the category, so the allocation decision hinges on technical purity rather than conviction sponsorship. ITA's MACD is bullish but flattening and stochastic already overbought, signaling potential momentum rollover; XAR's MACD in the same state but with stochastic still rising mid-zone preserves optionality for a continuation move.
Defense & Aerospace receives 5% allocation as a tier-2 holding, earning that slot despite a 47.5 category score that ranks it middle of the pack. The category-level macro fit of 64.0 is strong—broad market bear (+6), dollar pressure (+3), and transition regime effects (+3) all support defensive posturing—but technical evidence is only 56.5 across the representative, keeping it out of the top-2 overweight tier. XAR's 12.4% thirteen-week return and 100.0 trend score are legitimate, yet the -0.3% upside to resistance combined with 50.5% downside to support inverts the risk asymmetry sharply. A break above the resistance level at 128.10 or a macro shift toward outright risk-off would push this category higher; for now, it's a hedge rather than a core conviction.
Precious Metals — SLV
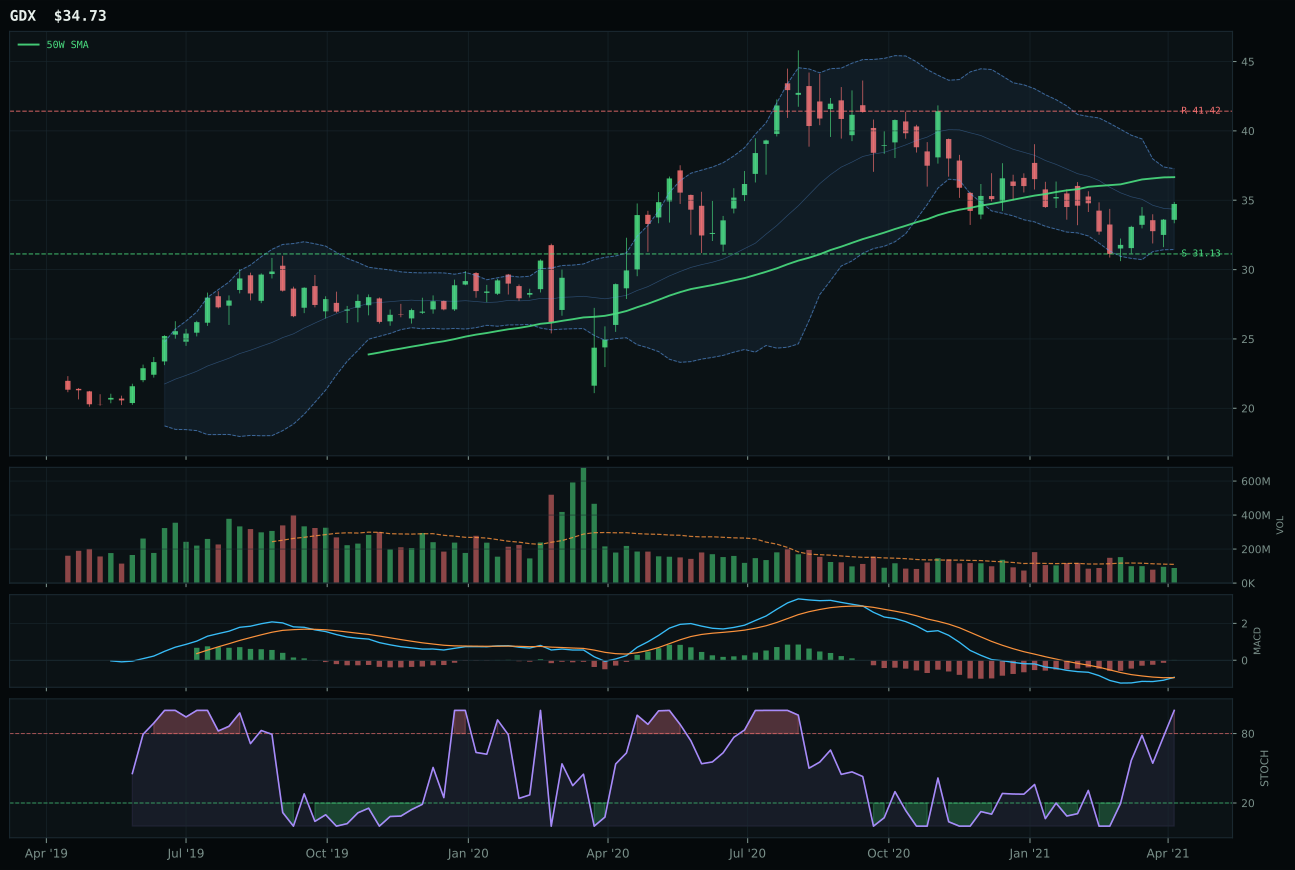
GDX has a neutral structure profile with -12.8% 13-week relative strength versus SPY.
A failed hold above support would weaken the setup.
Actionable but governed by invalidation levels.
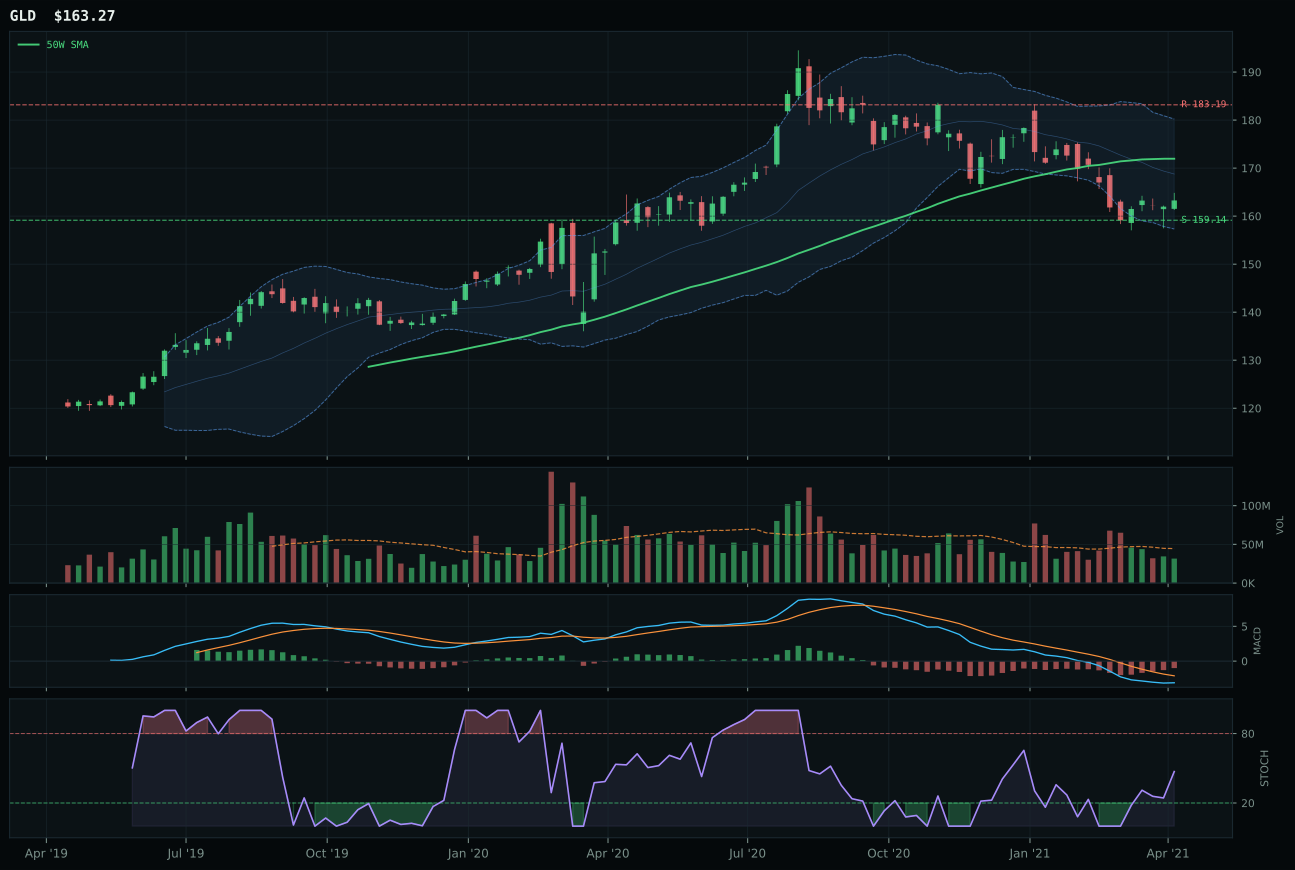
GLD has a pullback into support profile with -13.7% 13-week relative strength versus SPY.
A failed hold above support would weaken the setup.
Actionable but governed by invalidation levels.
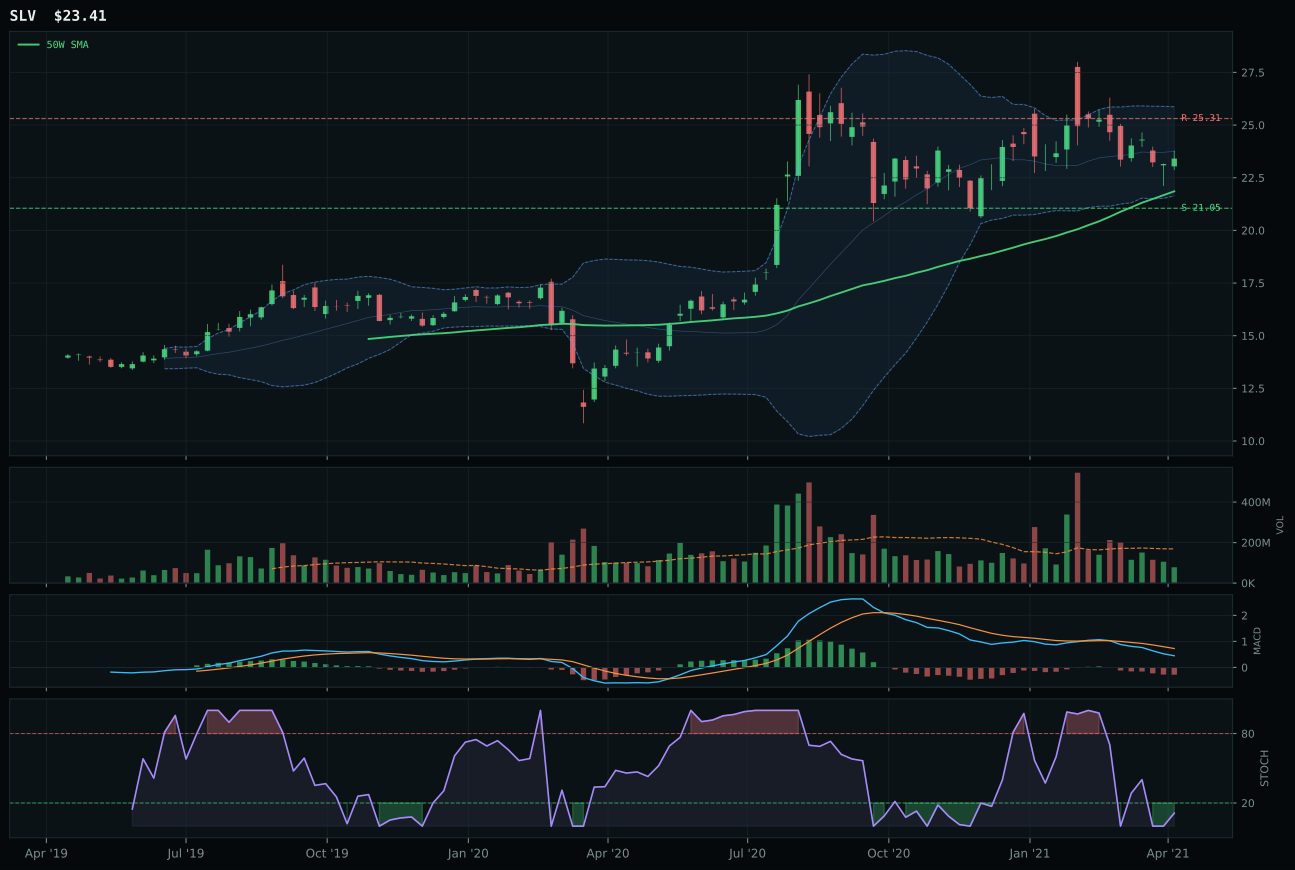
SLV has a neutral structure profile with -8.4% 13-week relative strength versus SPY.
A failed hold above support would weaken the setup.
Actionable but governed by invalidation levels.
SLV wins the precious metals category with 4.5% category-relative strength versus GDX's 0.0%, a narrow but definitive advantage that reflects silver's better participation in the inflation-scarcity narrative versus gold miners' overbought momentum rejection. Both setups are neutral structure, but SLV's stochastic RSI at 0.11 (oversold) offers technical optionality that GDX's overbought reading at high levels does not; SLV is closer to a washout setup where institutional accumulation becomes visible. GDX's MACD is bullish and improving, which normally wins, but the -12.8% SPY-relative weakness is a warning that gold mining leverage is failing even within a macro bid for precious metals. SLV's 57.0 risk-reward score is superior because upside to resistance is already priced (-7.5%), making downside risk to support at 11.2% the only real vector; this asymmetry favors the contrarian entry point.
Precious Metals receives 5% allocation as a tier-2 holding despite a 46.6 category score that trails agriculture and AI. The macro fit of 53.0 is solid—dollar pressure (+3) and metals scarcity themes provide structural support—but SLV's weak 37.1 technical evidence score reflects the category's struggle for conviction. The 18.5 momentum confirmation and 41.5 persistence are particularly weak, showing no near-term price sponsorship despite solid conceptual tailwinds. What justifies the 5% allocation is the 70.0 timing score, which reflects oversold technical structure near Fibonacci support—this is a positioning trade into a reset, not a trend continuation. The category would need either volume sponsorship to meaningfully improve (currently 0.46x thin) or a break below 21.05 support to signal capitulation before tier-2 status could escalate.
Industrial Metals — PICK
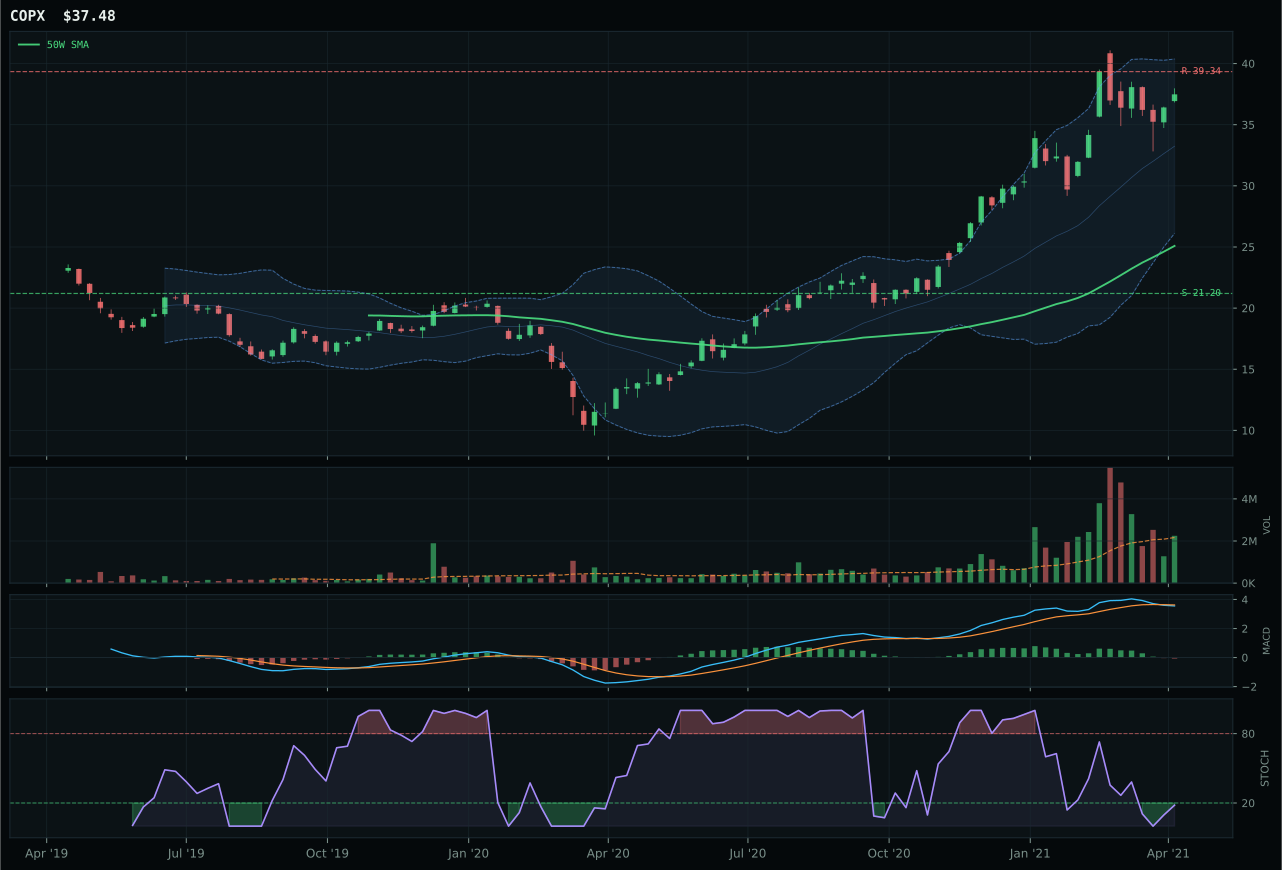
COPX has a vertical extension profile with 2.6% 13-week relative strength versus SPY.
A failed hold above support would weaken the setup.
Actionable but governed by invalidation levels.
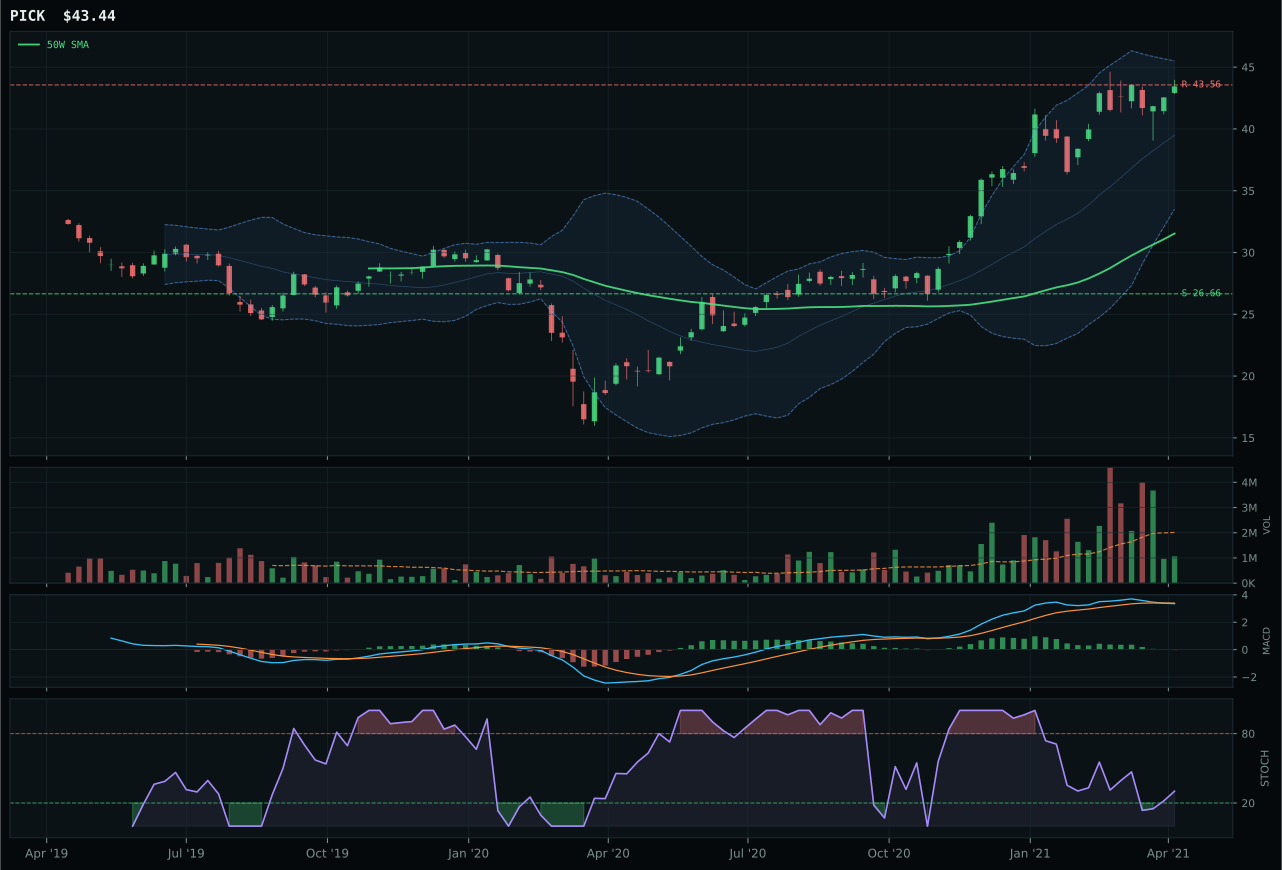
PICK has a vertical extension profile with -2.4% 13-week relative strength versus SPY.
A failed hold above support would weaken the setup.
Actionable but governed by invalidation levels.
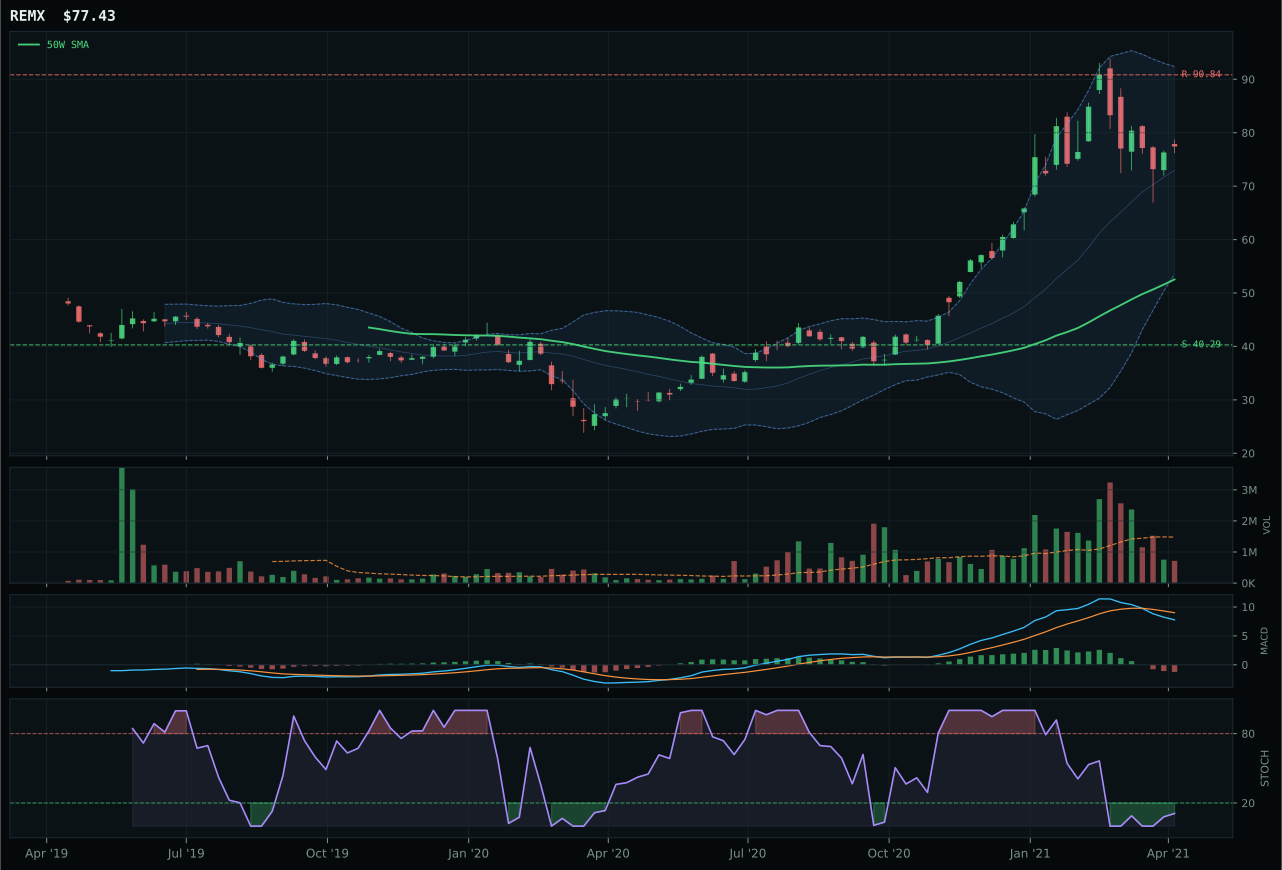
REMX has a vertical extension profile with -5.3% 13-week relative strength versus SPY.
A failed hold above support would weaken the setup.
Actionable but governed by invalidation levels.
PICK wins the industrial metals category with a 73.1 structure score and zero category-relative strength (0.0%) versus COPX's superior 76.4 technical composite but -6.0% category-relative weakness. PICK's advantage lies in COPX being stretched 49.4% from the 50W versus PICK at 37.8%, combined with COPX's stochastic RSI at oversold turn-up versus PICK's rising mid-zone—PICK has better technicals from this price level despite weaker absolute setup quality. Both face MACD bearish and weakening, so momentum is decelerating, but the category-relative weakness gap drives the decision. COPX's 10.6% thirteen-week return and 2.6% SPY-relative strength would normally dominate, yet the thin 0.53x volume on PICK and its zero peer momentum suggest this is the setup that will catch institutional bids first in a reset.
Industrial Metals earns 5% allocation with a 43.9 category score, the lowest among the tier-2 holdings. The macro narrative is strong at 66.0 category-level fit—metals scarcity (+14), commodity breadth positive (+10), real asset sponsorship (+6)—but technical evidence is only 27.2 on the PICK representative, the weakest technical score in the portfolio. The 31.4 momentum confirmation and 46.9 persistence indicate the category is technically exhausted even though structural scarcity is real. This is a bottom-fishing 5% allocation, not a conviction view; PICK would need to close above 39.56 resistance or show volume participation above 0.80x the 20W average to justify escalation. For now, industrial metals are held as a macro structural play despite deteriorating technicals.
AI — SMH
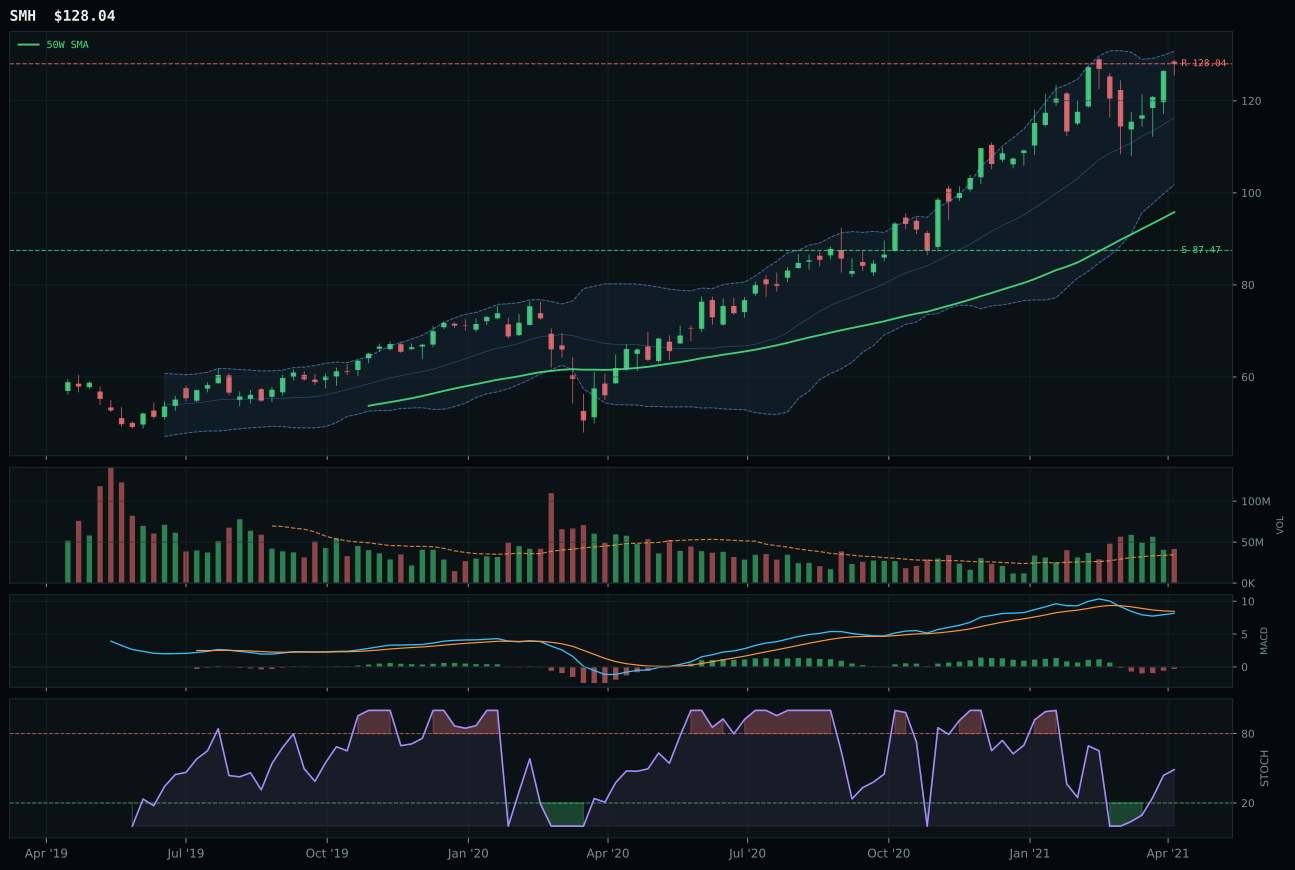
SMH has a vertical extension profile with 3.2% 13-week relative strength versus SPY.
A failed hold above support would weaken the setup.
Actionable but governed by invalidation levels.
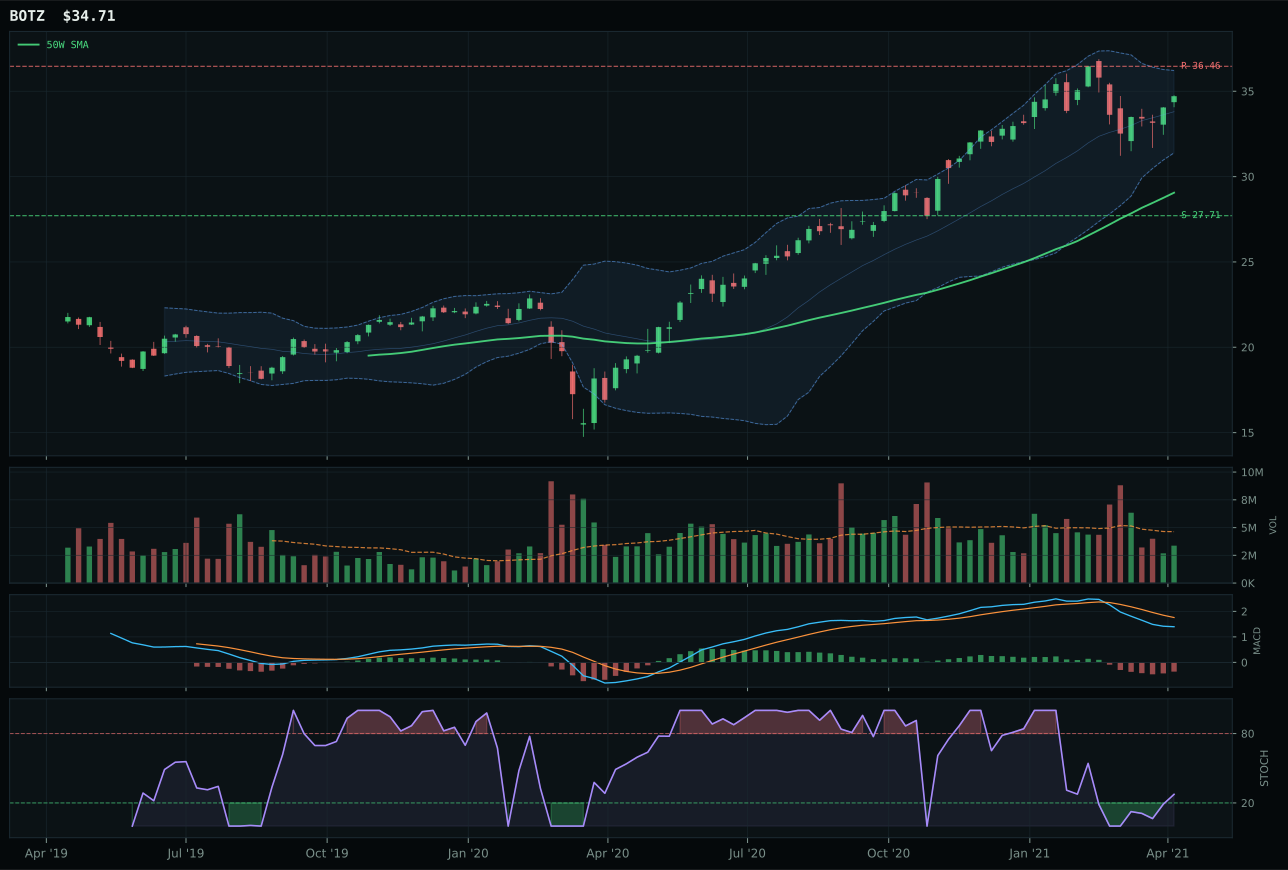
BOTZ has a vertical extension profile with -7.0% 13-week relative strength versus SPY.
A failed hold above support would weaken the setup.
Actionable but governed by invalidation levels.
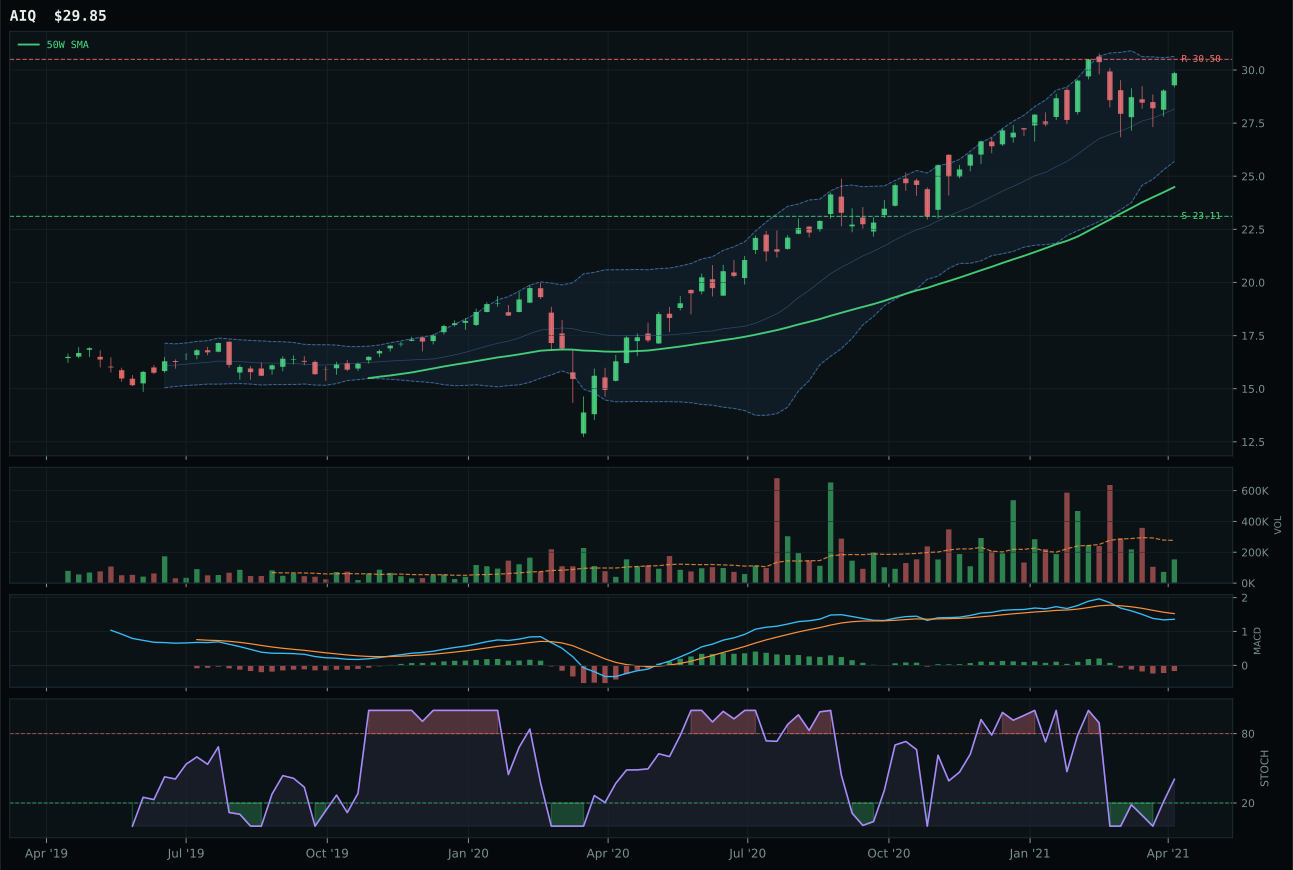
AIQ has a vertical extension profile with -0.9% 13-week relative strength versus SPY.
A failed hold above support would weaken the setup.
Tracked, but not top-2 eligible because: .
SMH secures the category win with 4.2% category-relative strength versus BOTZ's -6.0%, a 10.2-point spread that signals semiconductor compute is the only AI proxy buyers are accumulating rather than distributing. The setup is extended at 33.6% above the 50W with above-average volume at 1.20x the 20W average—the volume confirmation is critical here, as it shows money is still entering despite the stretched technicals, not abandoning the trade. BOTZ's thin participation combined with its -7.0% SPY-relative weakness confirms rotation away from robotics cyclicality into pure semiconductor leverage. SMH's 97.5% momentum confirmation score reflects 11.2% thirteen-week returns and 3.2% SPY-relative strength, a combination that overcomes the 40.1 risk-reward score by demonstrating sustained institutional demand.
AI earns 5% allocation as a tier-2 holding, reflecting its 43.6 category score—strong enough to rank above defensive and agriculture alternatives but subordinate to energy's macro tailwind. The +14 boost from active AI growth sponsorship is real, but credit stress (-6 to -8) and broad market bear (-8 on the category reasoner) are cutting into upside. SMH's above-average volume sponsorship and 100% persistence score suggest this move has legs, but the 40.0 timing penalty for being extended 33.6% from the 50W means entry risk is material. The category macro fit of 44.0 is adequate for a tier-2 sleeve; what would elevate AI to top-2 is either a reset lower in price or a credit relief signal that allows the AI growth thesis to re-rate without fear of margin pressure.
Technology — XLK
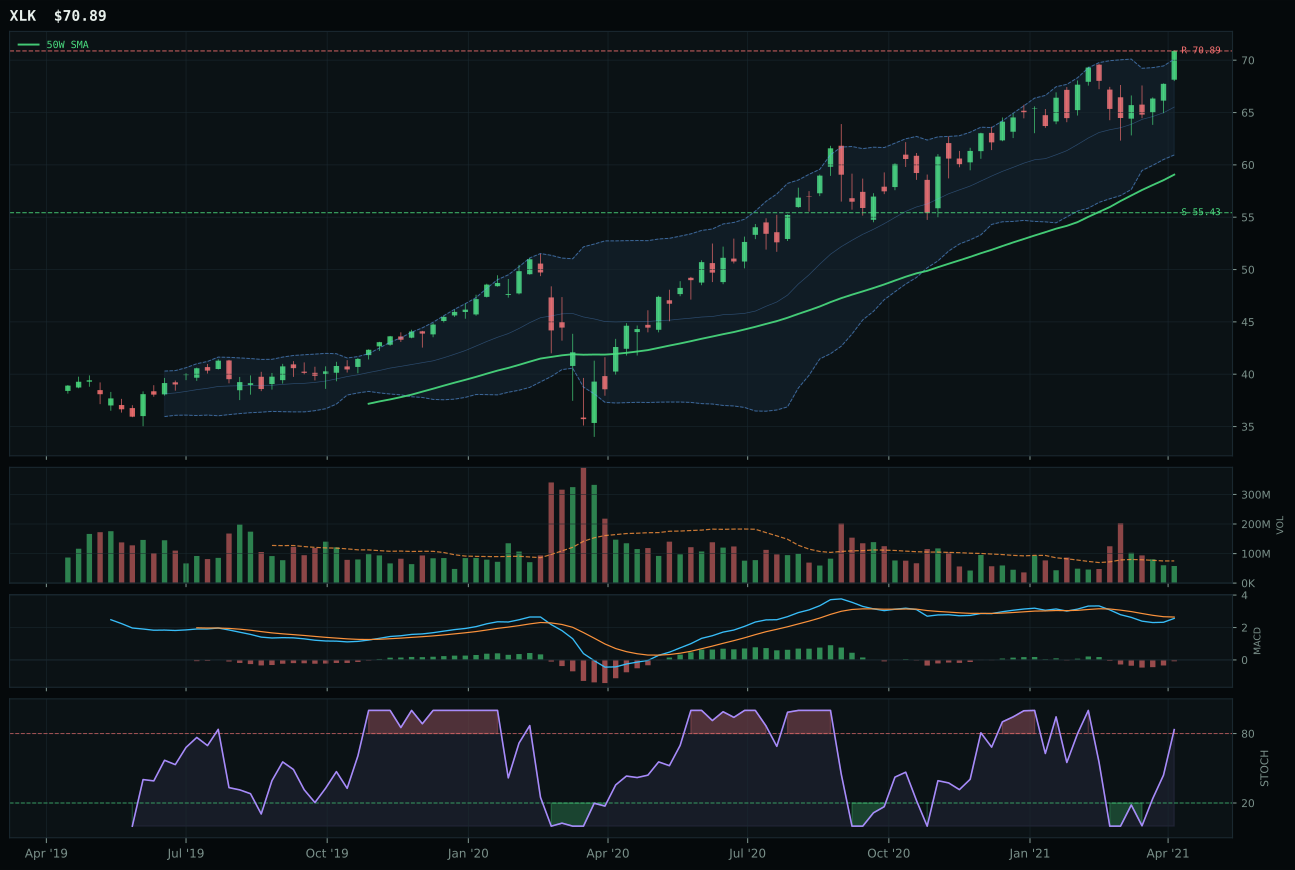
XLK has a vertical extension profile with 0.5% 13-week relative strength versus SPY.
A failed hold above support would weaken the setup.
Actionable but governed by invalidation levels.
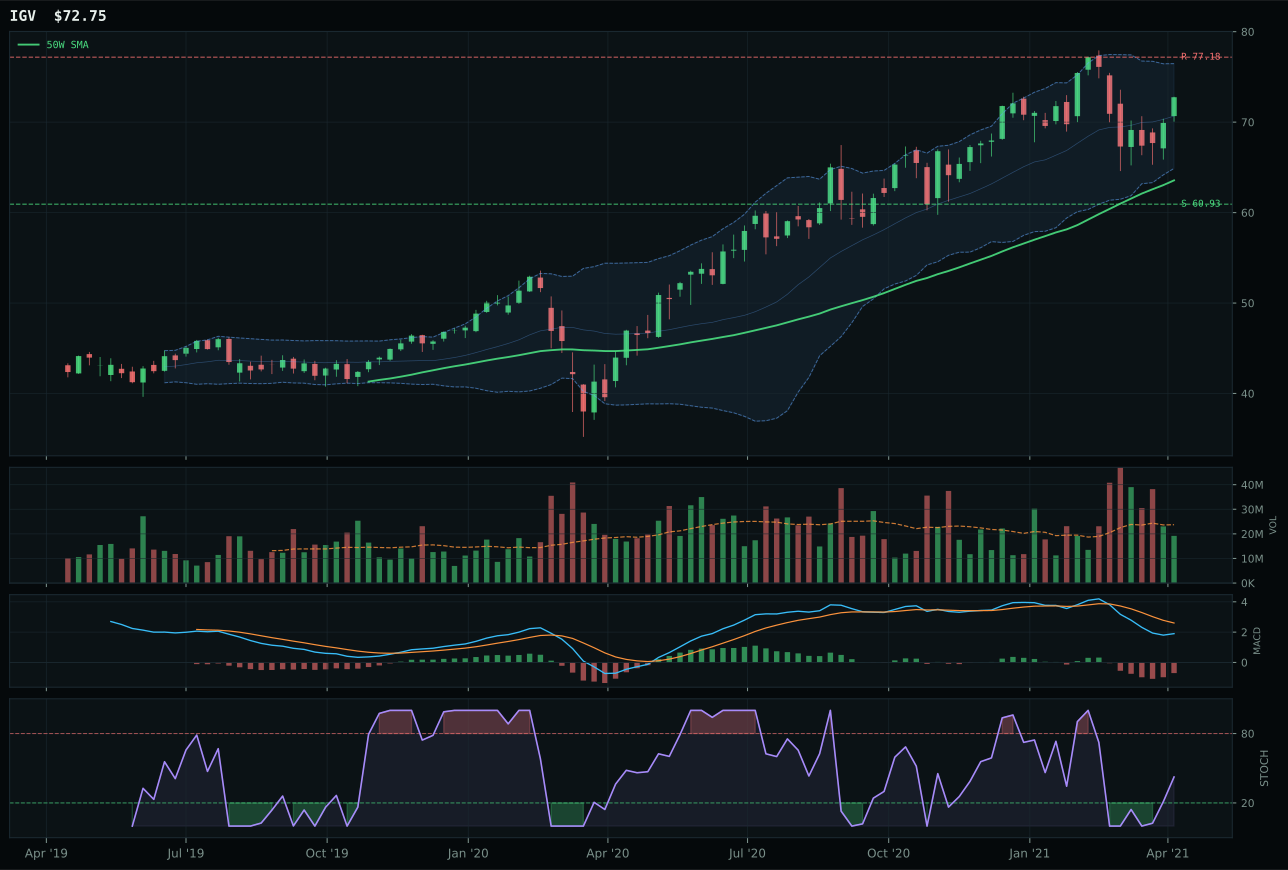
IGV has a neutral structure profile with -5.5% 13-week relative strength versus SPY.
A failed hold above support would weaken the setup.
Actionable but governed by invalidation levels.
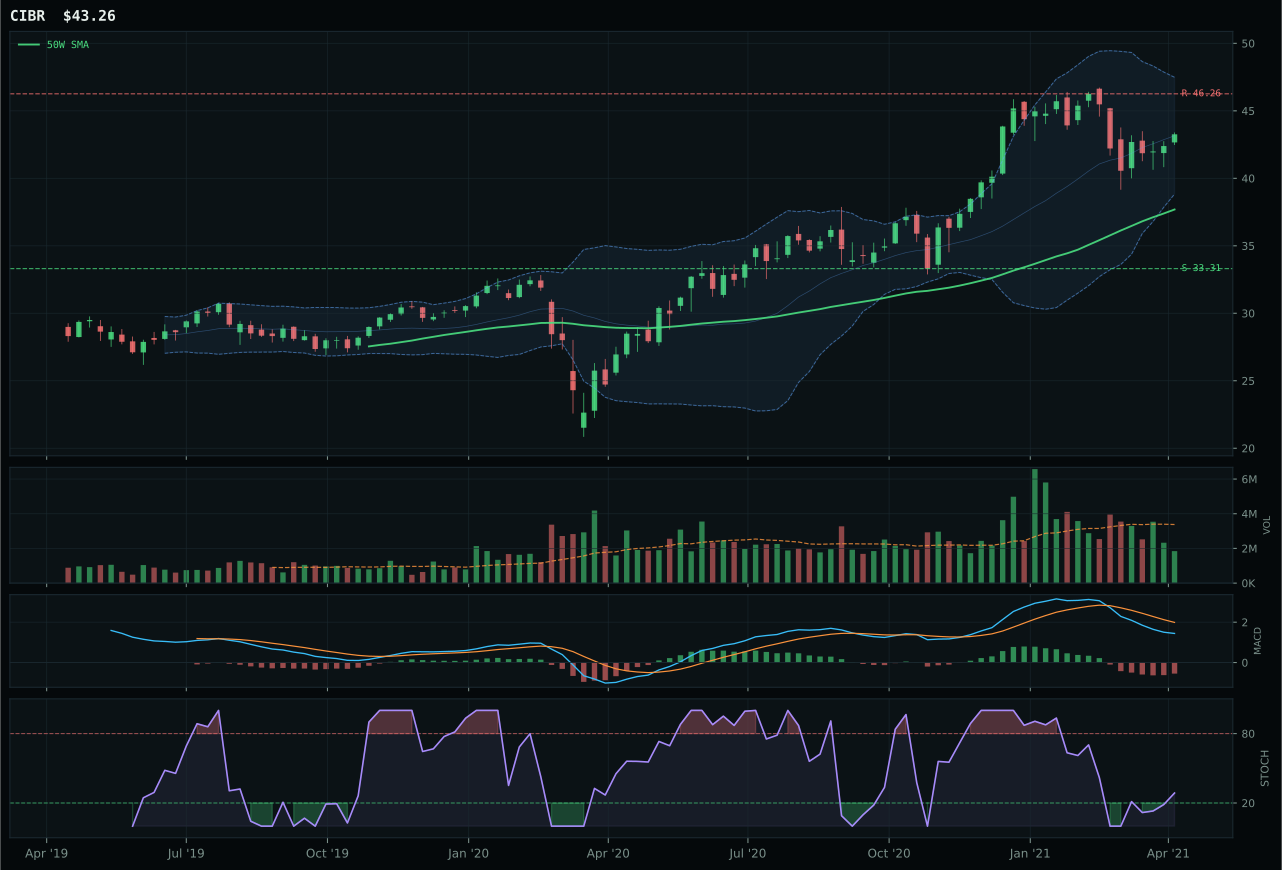
CIBR has a neutral structure profile with -11.7% 13-week relative strength versus SPY.
A failed hold above support would weaken the setup.
Actionable but governed by invalidation levels.
XLK wins the category by capturing 6.0% of relative strength within its own three-ETF basket while IGV lags at 0.0%, a decisive gap that reflects where institutional buyers are actually positioning. The setup is vertical extension at 20.0% above the 50W, which normally signals entry risk, but XLK's 8.4% thirteen-week return combined with neutral 0.77x volume participation suggests this move has breadth rather than pure momentum rejection. IGV's structural cleanliness score of 72.3 trails XLK's 73.8, and more critically, its -5.5% relative strength versus SPY indicates duration-sensitive software is facing headwinds that XLK's diversified tech exposure avoids. MACD is bearish but improving across both names, leaving timing as the differentiator—XLK's 37.0 timing score reflects the extended position, but the category-relative leadership more than compensates.
Technology receives 0% allocation this week and ranks outside the portfolio entirely. The 35.2 category score reflects a macro environment where credit stress (-6 to -9 across the reasoned ETF lineup) and inflation pressure (-4 to -5) are actively penalizing growth duration, overwhelming the +4 to +6 boost from AI sponsorship. XLK's trend score of 93.7 is clean, but the category-level macro fit of 40.0 combined with poor timing across the representative at 37.0 left the entire Technology sleeve unable to compete with real asset categories earning energy scarcity and supply shortage premiums. A break below the 50W or a material shift in credit stress would be required to re-enter the rotation.
Emerging Markets — IEMG
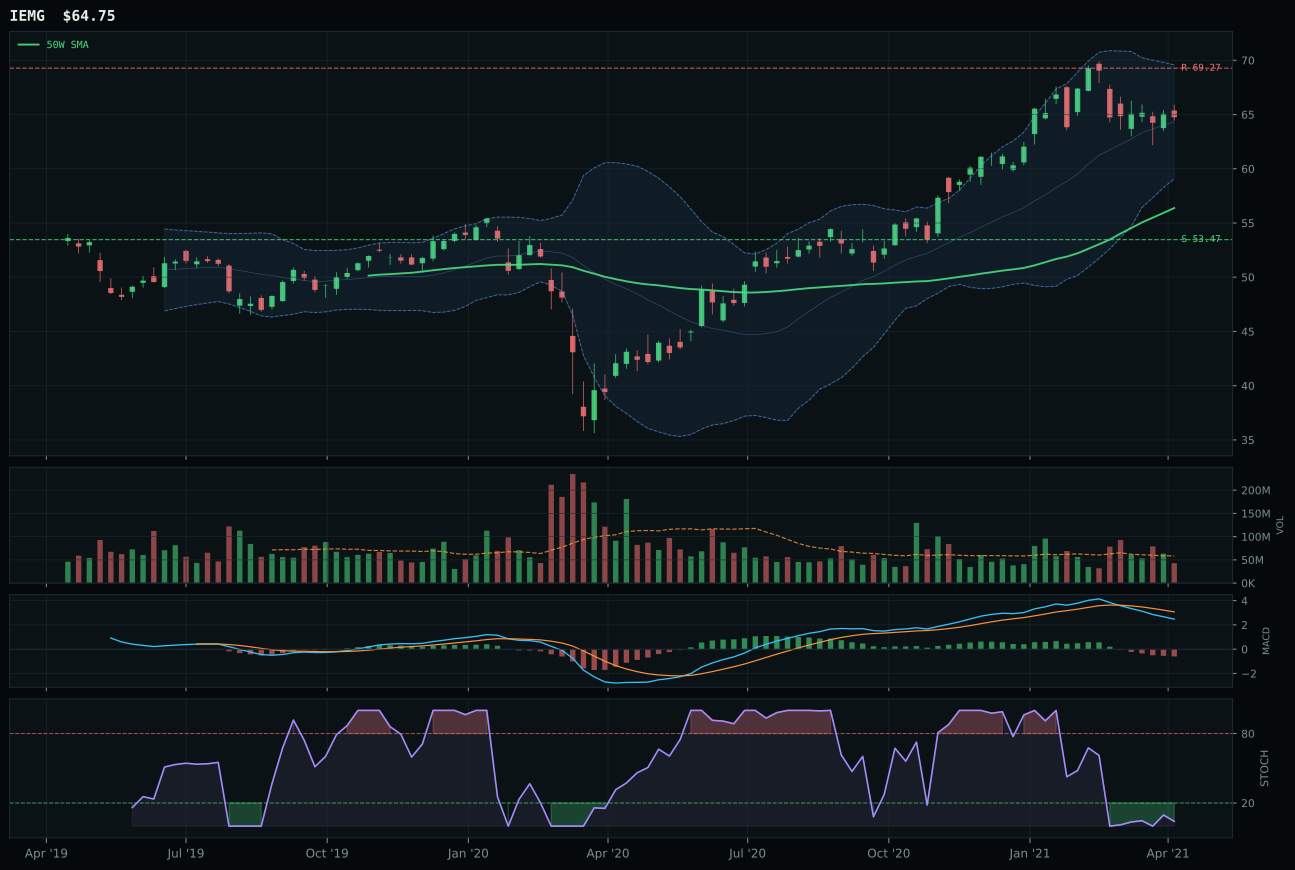
IEMG has a neutral structure profile with -9.1% 13-week relative strength versus SPY.
A failed hold above support would weaken the setup.
Actionable but governed by invalidation levels.
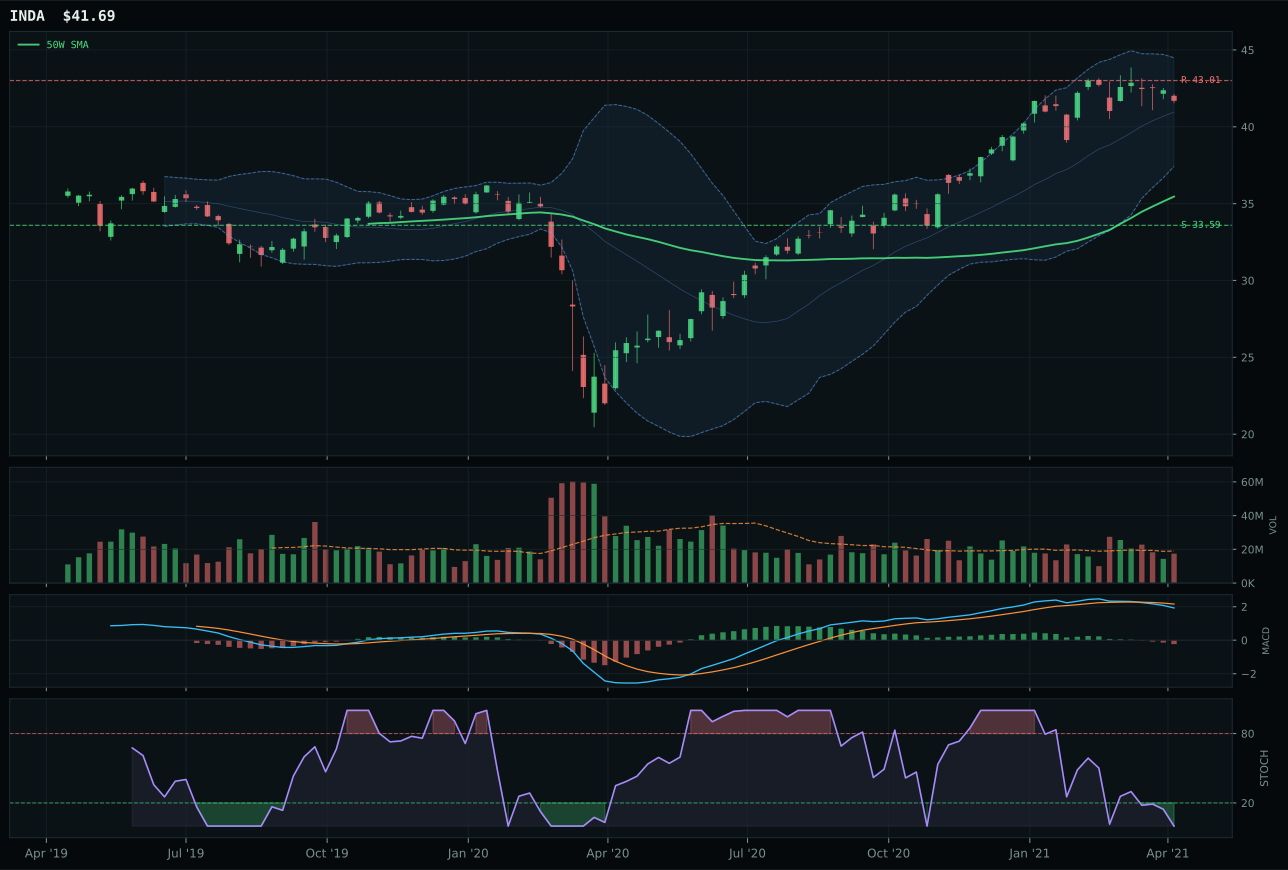
INDA has a vertical extension profile with -7.9% 13-week relative strength versus SPY.
A failed hold above support would weaken the setup.
Actionable but governed by invalidation levels.
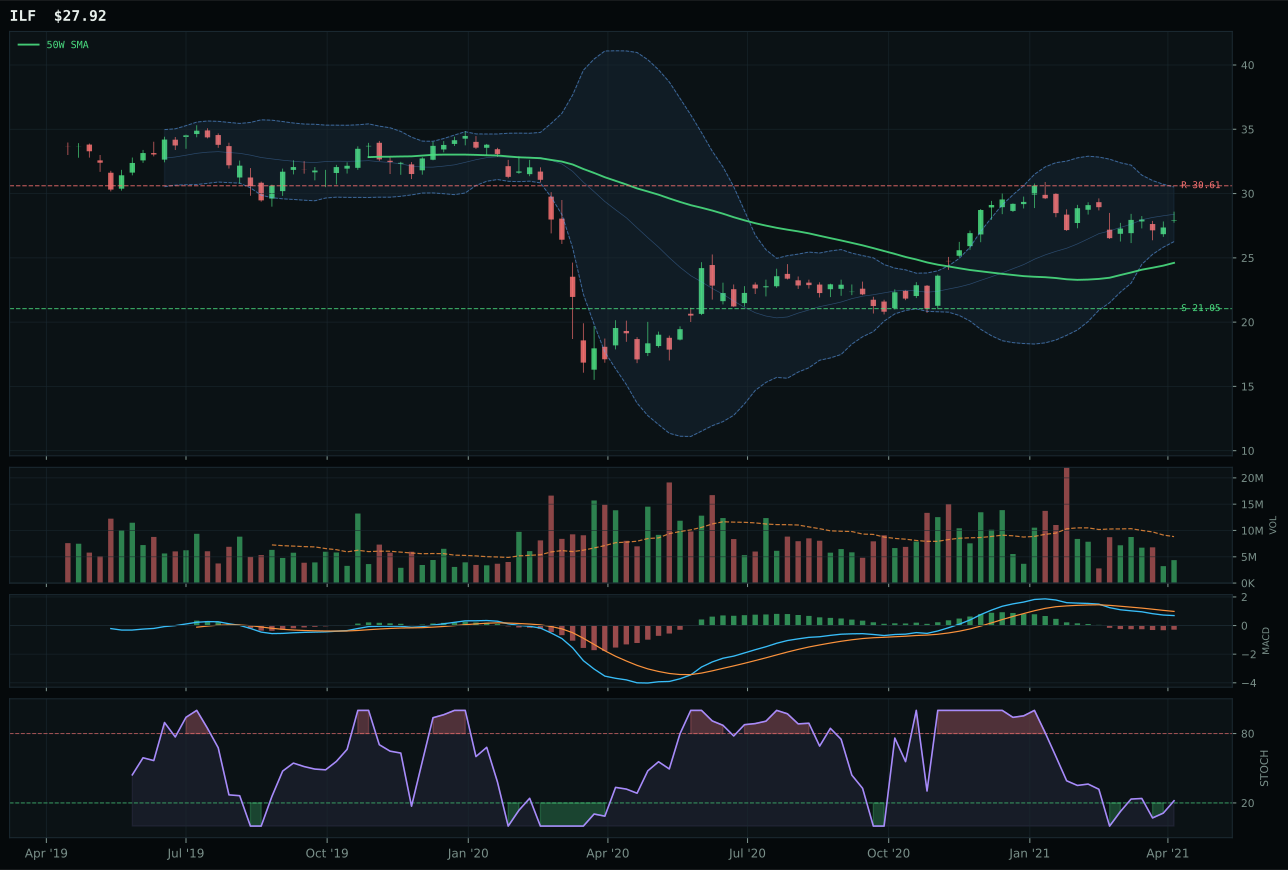
ILF has a neutral structure profile with -16.7% 13-week relative strength versus SPY.
A failed hold above support would weaken the setup.
Actionable but governed by invalidation levels.
IEMG wins the emerging markets category despite the lowest category score in the portfolio at 5.9, beating INDA with a 9.3-point margin powered by superior 70.0 timing versus INDA's 48.0. Both names show bearish and weakening MACD with oversold stochastic RSI, but IEMG's neutral 14.8% distance from the 50W offers better technical optionality than INDA's extended 41.9% position. IEMG's -9.1% SPY-relative weakness is a reflection of broad emerging market pressure, not idiosyncratic weakness; in fact, category-relative strength at 0.0% shows IEMG is the only name keeping pace with peer degradation. INDA's vertical extension setup should normally command premium entry, but the bearish MACD combined with oversold stochastic already rolling over suggests INDA is caught in a capitulation trap. Structure cleanliness at 72.0 for IEMG versus 71.9 for INDA is a wash—the timing differential is everything.
Emerging Markets receives 0% allocation this week, receiving no portfolio representation at ranks 9–10. The 5.9 category score reflects a macro environment where dollar pressure (-14), credit stress (-10), and broad market bear (-9) are actively destructive to EM exposure; these headwinds are not temporary positioning flows but structural regime shifts. IEMG's 34.2 technical evidence is poor—the 13.5 momentum confirmation and 41.4 persistence show no sponsorship whatsoever—and this weakness is being ratified by macro. Even though IEMG shows 70.0 timing (oversold entry), the 32.0 macro/narrative fit leaves no room for conviction. Emerging markets would need a meaningful dollar reversal signal or a break of the 53.47 support floor to even warrant discussion for a 5% tier-2 slot. For now, this category is entirely outside the allocation and should remain that way until credit stress signals improve.