
2021-04-02
Informational purposes only. The content in this report, including allocations, analysis, and commentary, is provided solely for informational and educational purposes. It does not constitute financial advice, investment advice, trading advice, or any other type of advice. Past performance does not guarantee future results. Always conduct your own research and consult a qualified financial professional before making investment decisions.
Weekly Allocation
| Ticker | Category | Weight | Role |
|---|---|---|---|
| FSOL | 50% | Overlay | |
| XLE | Traditional Energy | 10% | Top-2 (10%) |
| URNM | Nuclear Energy | 10% | Top-2 (10%) |
| XLU | Utilities & Infrastructure | 5% | Tier-2 (5%) |
| MOO | Agriculture & Livestock | 5% | Tier-2 (5%) |
| COPX | Industrial Metals | 5% | Tier-2 (5%) |
| SMH | AI | 5% | Tier-2 (5%) |
| ITA | Defense & Aerospace | 5% | Tier-2 (5%) |
| XLK | Technology | 5% | Tier-2 (5%) |
Trade Instructions — Monday Open
Sell the tranche from 2021-03-05 (completing its 4-week hold). Buy the new tranche. Instructions show net portfolio changes — same-asset positions cancel, weight changes show the delta.
| Action | Ticker | Instruction |
|---|---|---|
| SELL | MOO | Sell 20% of MOO position (reduce 6.25% → 5.00%) |
| SELL | ILF | Sell entire ILF position (1.25% of portfolio) |
| SELL | PAVE | Sell 25% of PAVE position (reduce 5.00% → 3.75%) |
| SELL | SLV | Sell 25% of SLV position (reduce 5.00% → 3.75%) |
| BUY | URNM | Buy URNM — 25.00% of freed cash (adds 1.25% to portfolio) |
| BUY | XLK | Buy XLK — 25.00% of freed cash (adds 1.25% to portfolio) |
| BUY | SMH | Buy SMH — 25.00% of freed cash (adds 1.25% to portfolio) |
| BUY | XLU | Buy XLU — 25.00% of freed cash (adds 1.25% to portfolio) |
Current Portfolio After Trade
Combined holdings across all 4 active tranches. Each tranche is 25% of the portfolio.
| Ticker | % of Portfolio | Weight Bar |
|---|---|---|
| FSOL | 50.00% | |
| XLE | 7.50% | |
| MOO | 5.00% | |
| URNM | 3.75% | |
| COPX | 3.75% | |
| ITA | 3.75% | |
| PAVE | 3.75% | |
| SLV | 3.75% | |
| URA | 3.75% | |
| PICK | 3.75% | |
| XLK | 3.75% | |
| FCG | 2.50% | |
| SMH | 2.50% | |
| INDA | 1.25% | |
| XLU | 1.25% |
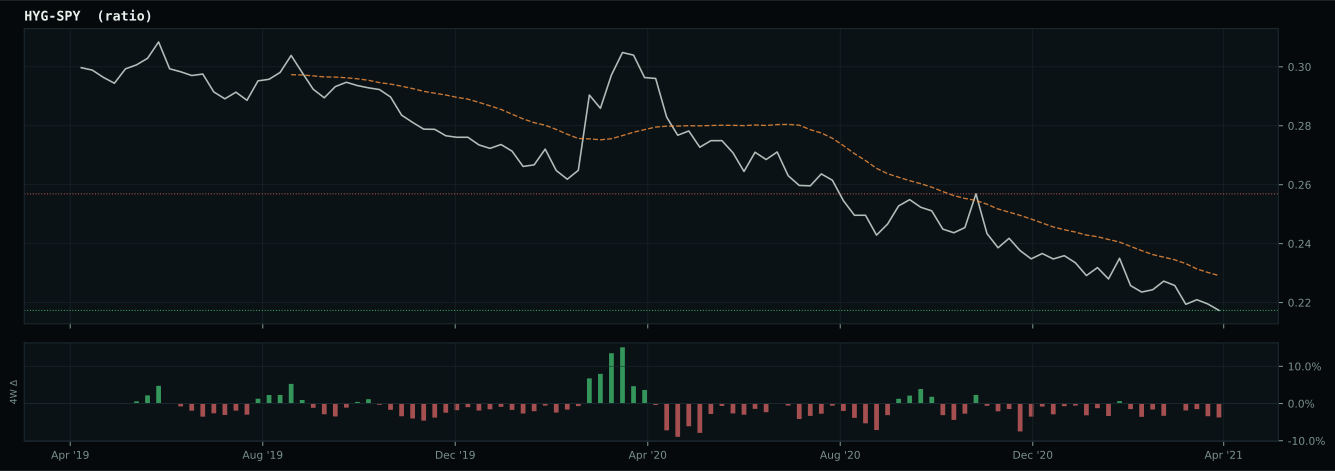
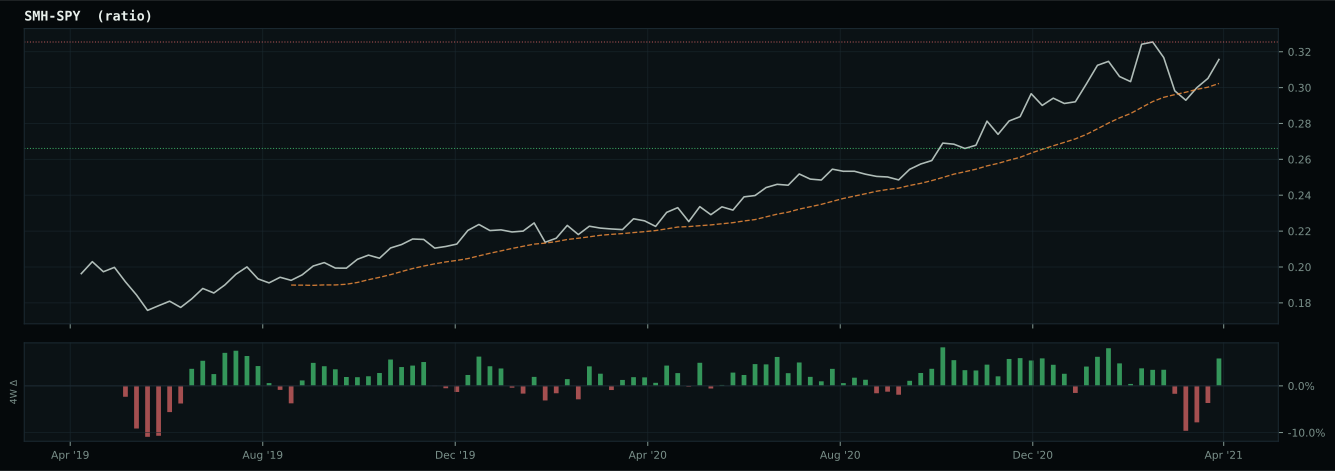
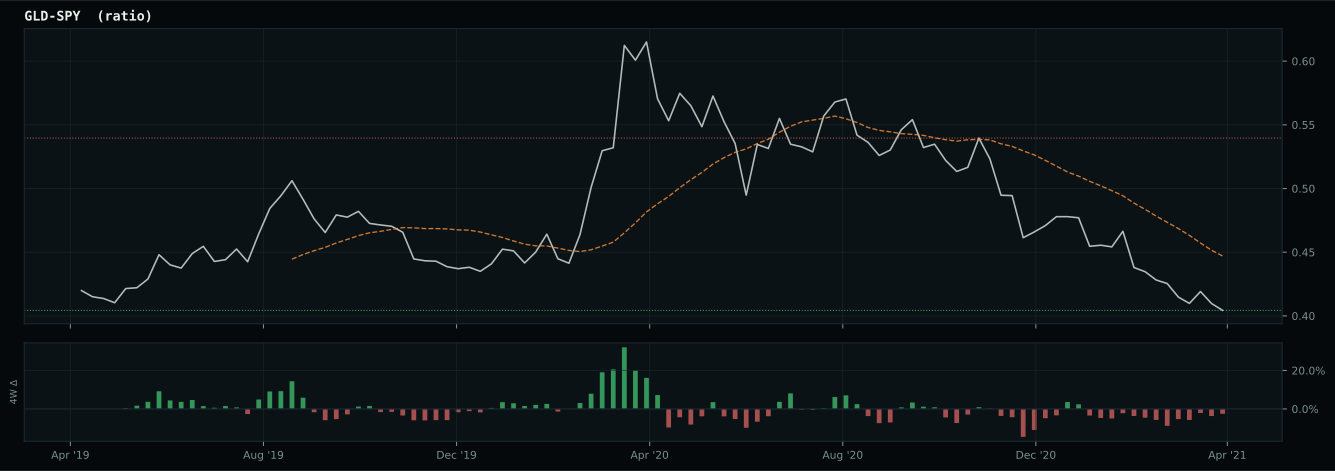
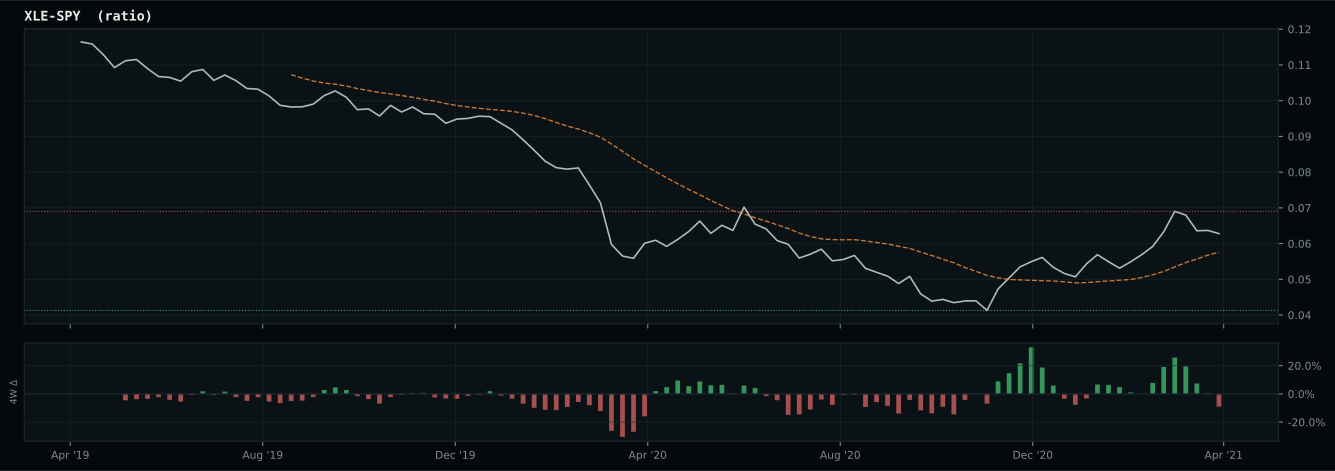
Macro Regime — Transition / Mixed
Macro Evidence Charts
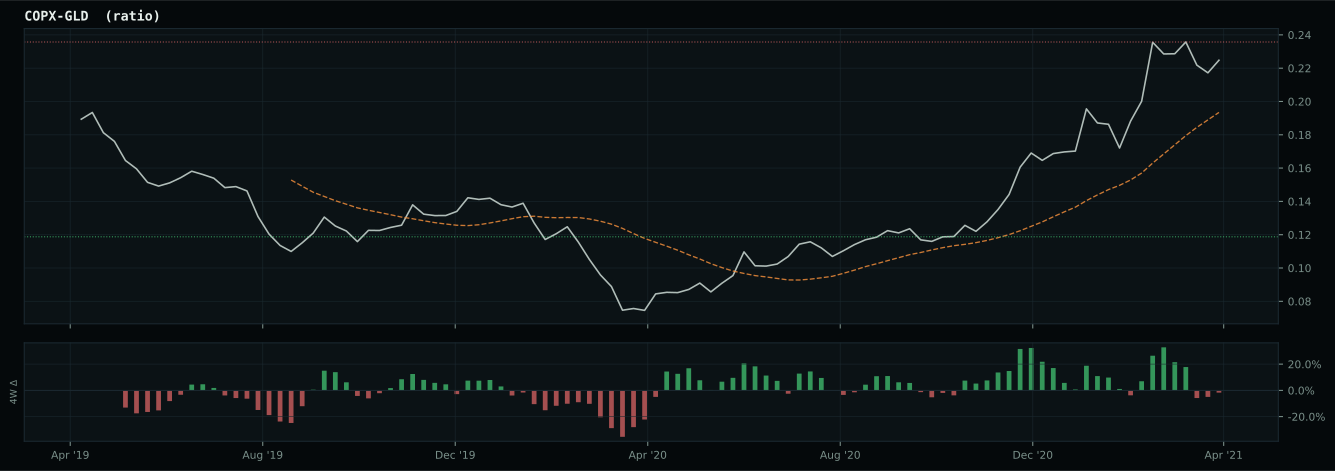
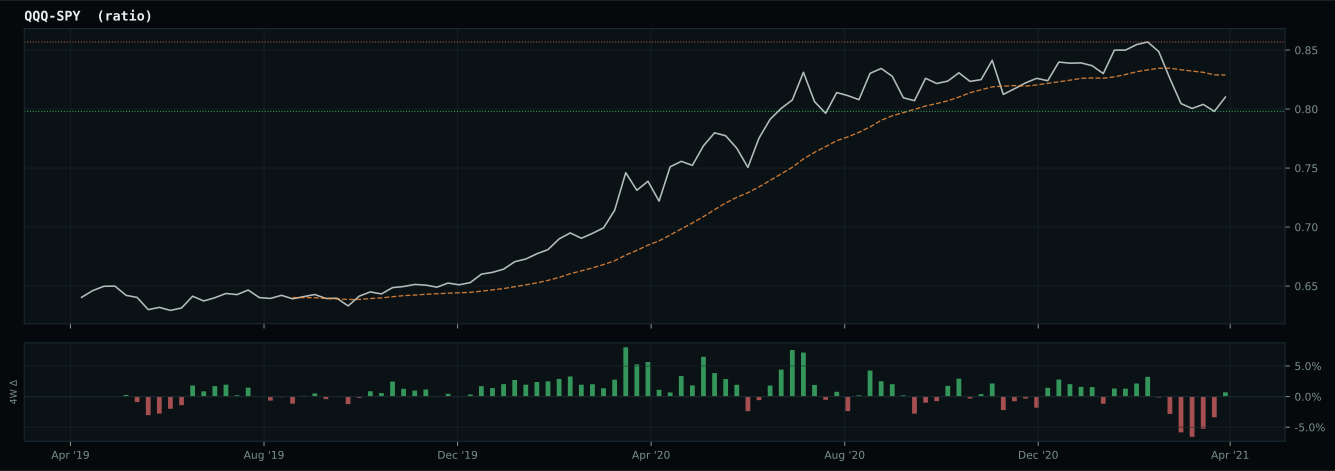
Market-implied signals behind the macro regime scores. Each ratio compares two assets; the direction and slope of the ratio is what the macro engine reads.
Crypto Regime — AltSeason
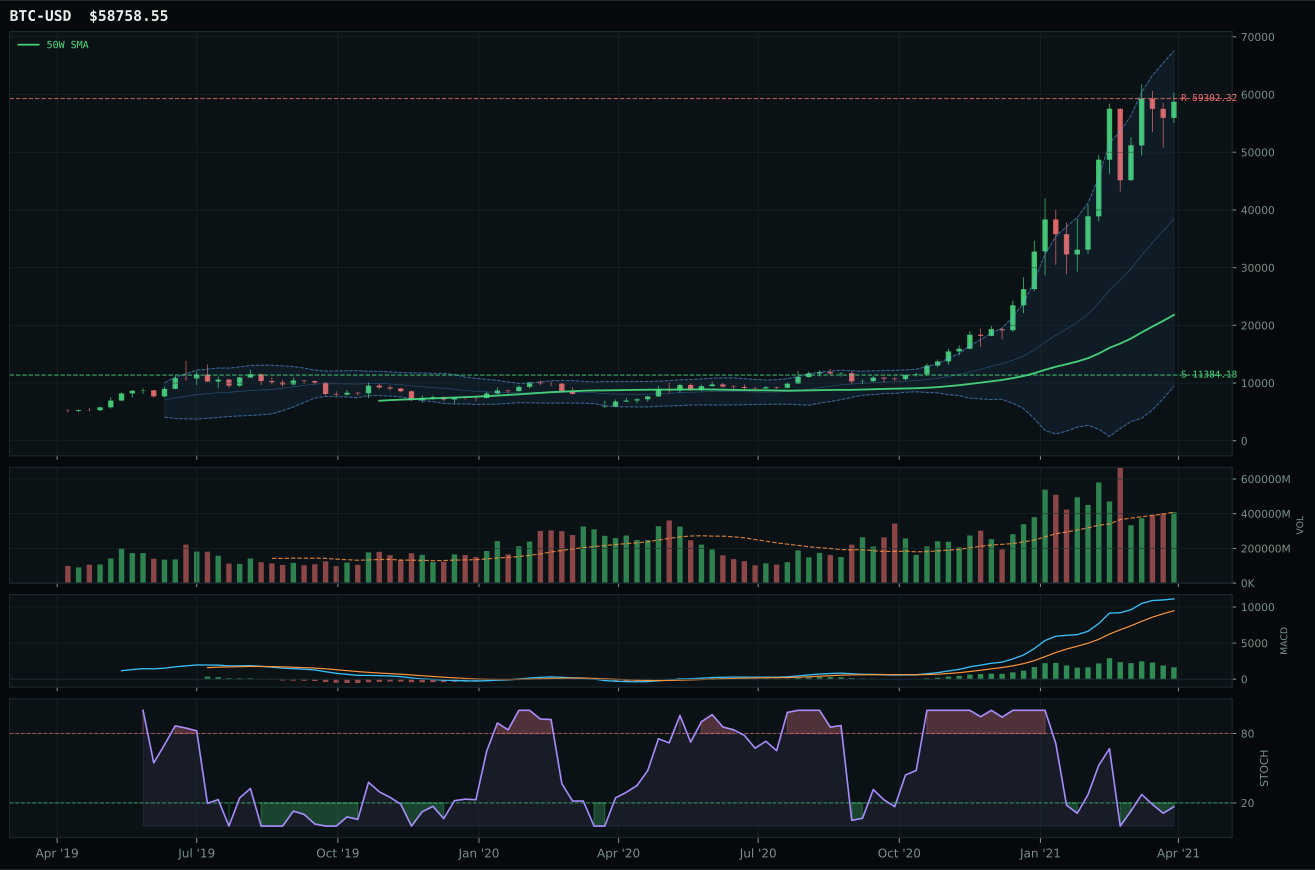
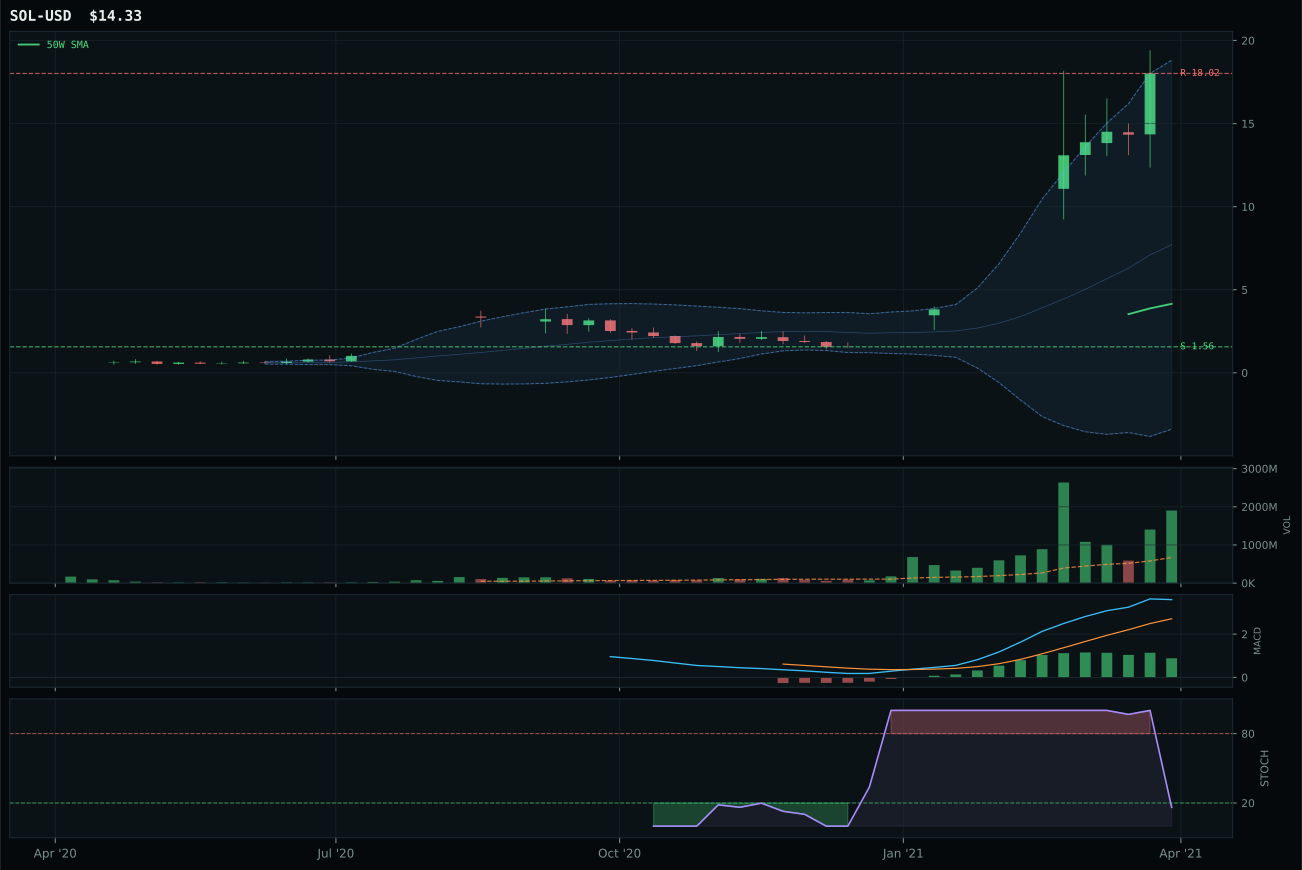
post-touch structure is too wide to count as a range; max/min close ratio is 11.00
TrendBTC confirmed: 2 consecutive closes above rising/flat 50W SMA
all available AltSeason conditions pass; missing optional confirmations skipped
Category Rankings
| Rank | Category | Winner | Score | Alloc | 4W Ret | Peers (4W) |
|---|---|---|---|---|---|---|
| 1 | Traditional Energy | XLE | 76.6 | 20% | -0.50% | FCG -1.1% · XOP -4.4% |
| 2 | Nuclear Energy | URNM | 65.3 | 20% | -1.55% | URA -0.7% · NLR +2.3% |
| 3 | Utilities & Infrastructure | XLU | 61.9 | 10% | +4.14% | PAVE +1.6% · IGF +2.7% |
| 4 | Agriculture & Livestock | MOO | 53.4 | 10% | +3.78% | VEGI +1.8% · WEAT +21.0% |
| 5 | Industrial Metals | COPX | 49.5 | 10% | +7.85% | PICK +7.3% · REMX +2.6% |
| 6 | AI | SMH | 44.7 | 10% | -4.85% | BOTZ +0.7% · AIQ +0.5% |
| 7 | Defense & Aerospace | ITA | 44.0 | 10% | +1.45% | XAR +0.8% · ROKT +0.9% |
| 8 | Technology | XLK | 42.9 | 10% | +3.07% | IGV +2.0% · CIBR +3.6% |
| 9 | Precious Metals | SLV | 42.5 | 0% | +6.81% | GDX +4.1% · GLD +3.8% |
| 10 | Emerging Markets | IEMG | 11.4 | 0% | +0.00% | INDA -1.5% · ILF +2.2% |
Traditional Energy — XLE
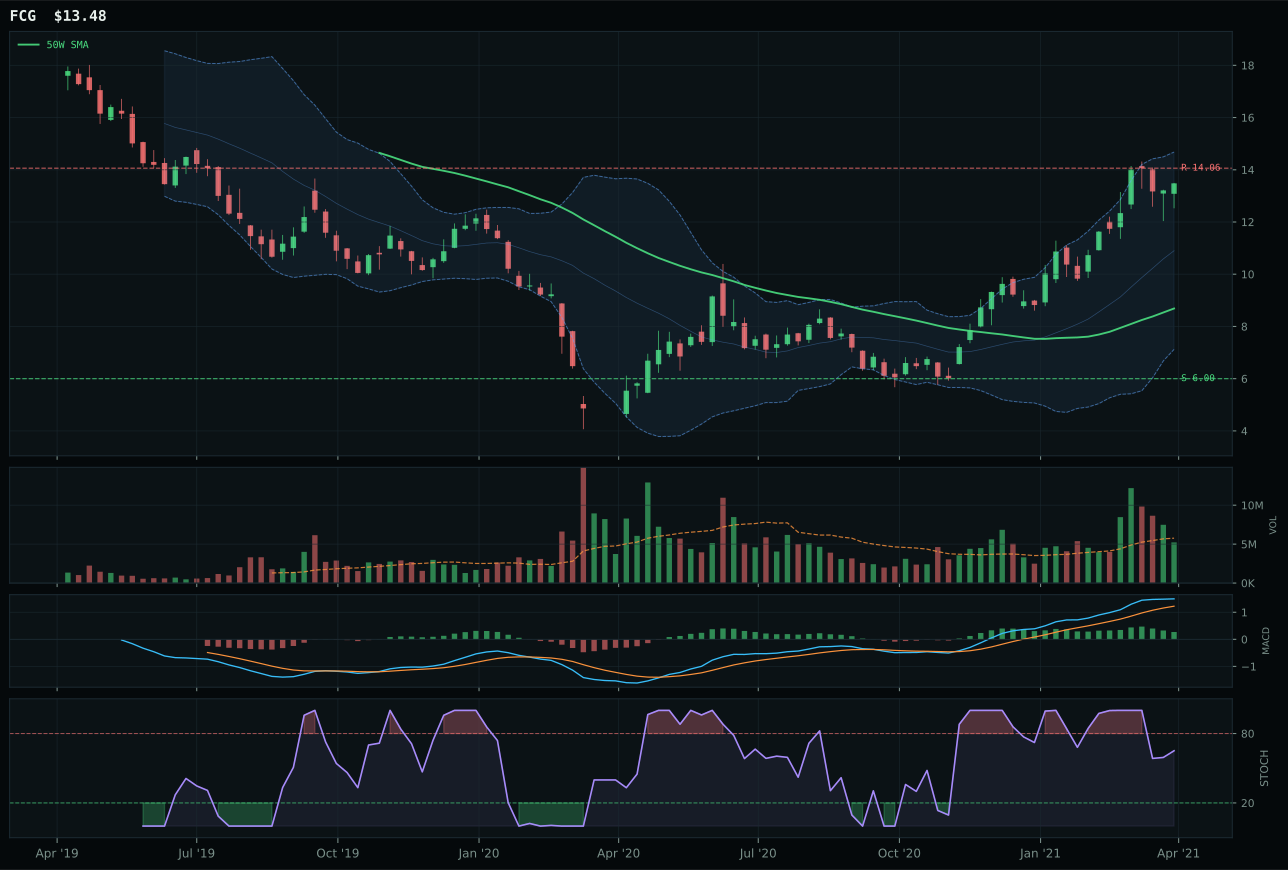
FCG has a vertical extension profile with 45.7% 13-week relative strength versus SPY.
A failed hold above support would weaken the setup.
Actionable but governed by invalidation levels.
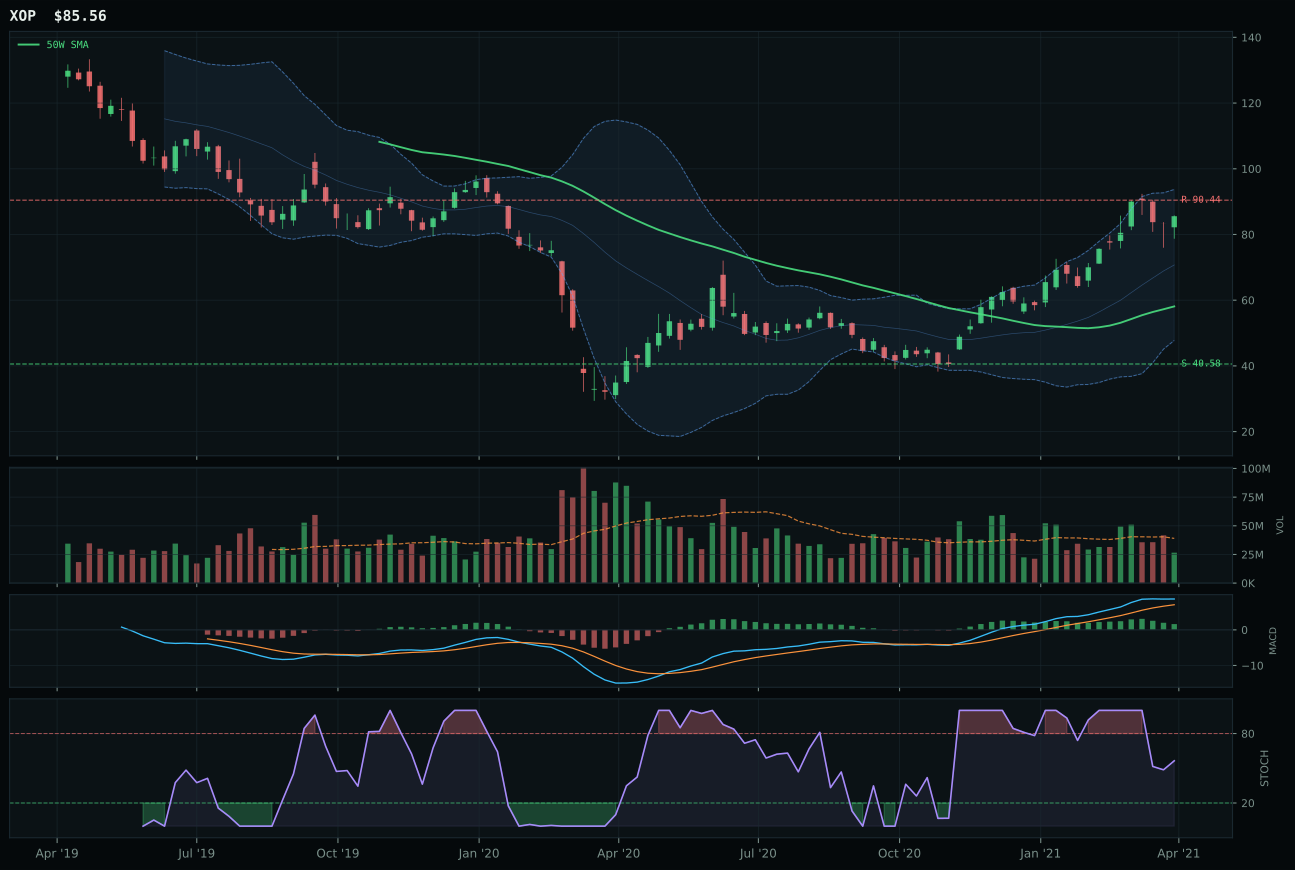
XOP has a vertical extension profile with 39.1% 13-week relative strength versus SPY.
A failed hold above support would weaken the setup.
Actionable but governed by invalidation levels.
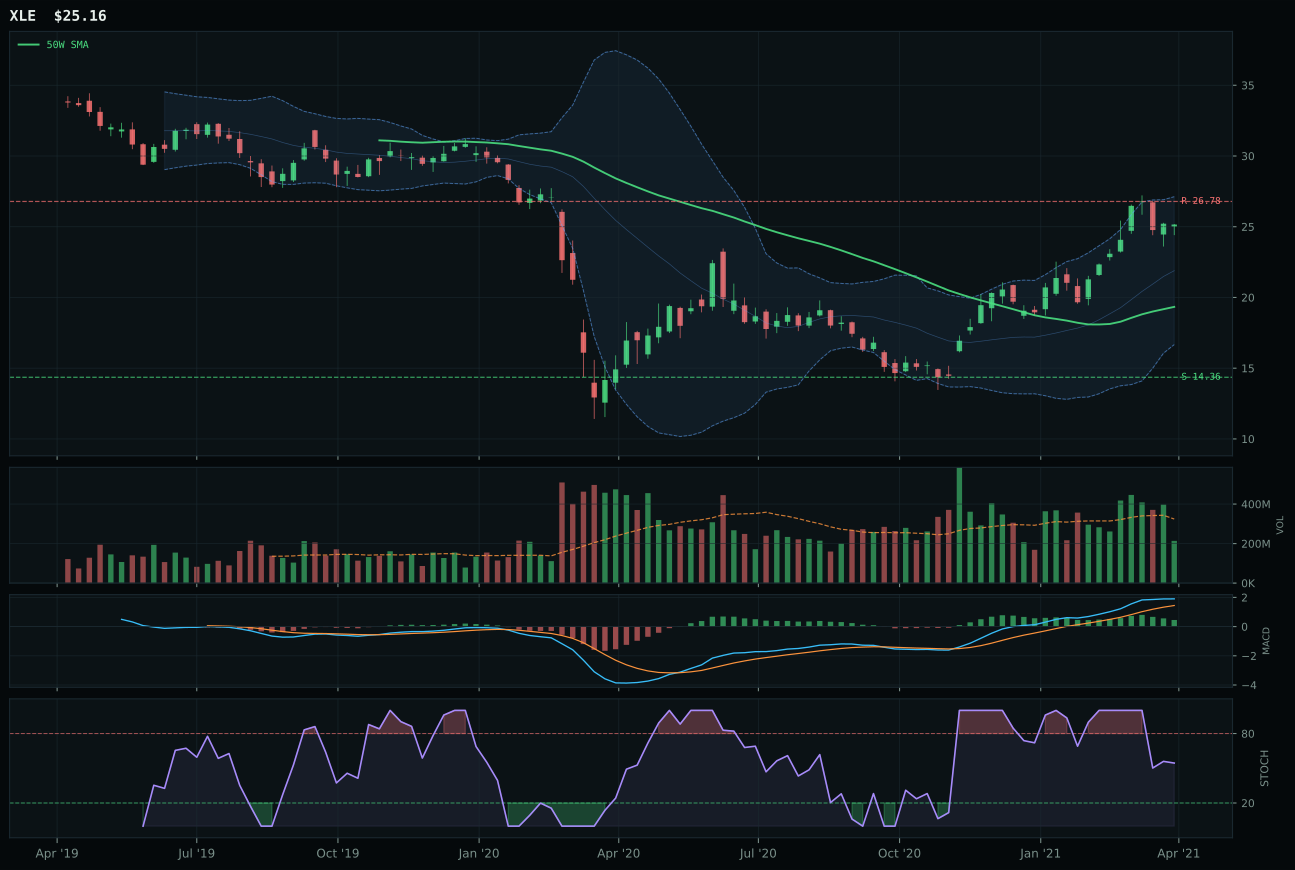
XLE has a vertical extension profile with 25.6% 13-week relative strength versus SPY.
A failed hold above support would weaken the setup.
Actionable but governed by invalidation levels.
XLE wins the top-2 slot with a 76.6 category score and exceptional macro-driven momentum. The 32.7% 13W return and 25.6% SPY-relative outperformance (best in basket) beat FCG despite FCG's stronger absolute 13W of 52.8%. XLE's advantage: cleaner risk/reward (46.5 vs 22.6), better timing alignment (48.0 vs 40.0), and category-relative strength at -13.5% versus FCG's category-relative +6.6%—a paradox explained by FCG's extreme 55.2% extension above the 50W making it a late-stage melt-up, while XLE's 30.1% extension is manageable. The momentum confirmation at 95.7/100 and persistence at 71.6/100 show sustainable accumulation in integrated names over pure-play upstream chaos.
Traditional Energy ranked 1st or 2nd among all categories at 76.6, earning 10% top-2 allocation on overwhelming macro support. Energy scarcity is active (+16), inflation pressure (+10), supply shortage (+9), and real asset sponsorship (+7)—a four-part bull case that overwhelms technical concerns about extension and thin volume. The category macro fit of 85.0/100 is exceptional; in a transition regime where inflation is active and dollar pressure applies, energy equities function as both growth and inflation hedge. The technical evidence of 54.0/100 reflects overextension and MACD rolling over, true concerns, but the allocation weight of 62% technical versus 38% macro means macro headroom is built in. At 10%, this is a conviction portfolio position, not a trade. The risk is a sharp deterioration in energy scarcity signals or a risk-off liquidation; currently neither is on the table.
Nuclear Energy — URNM
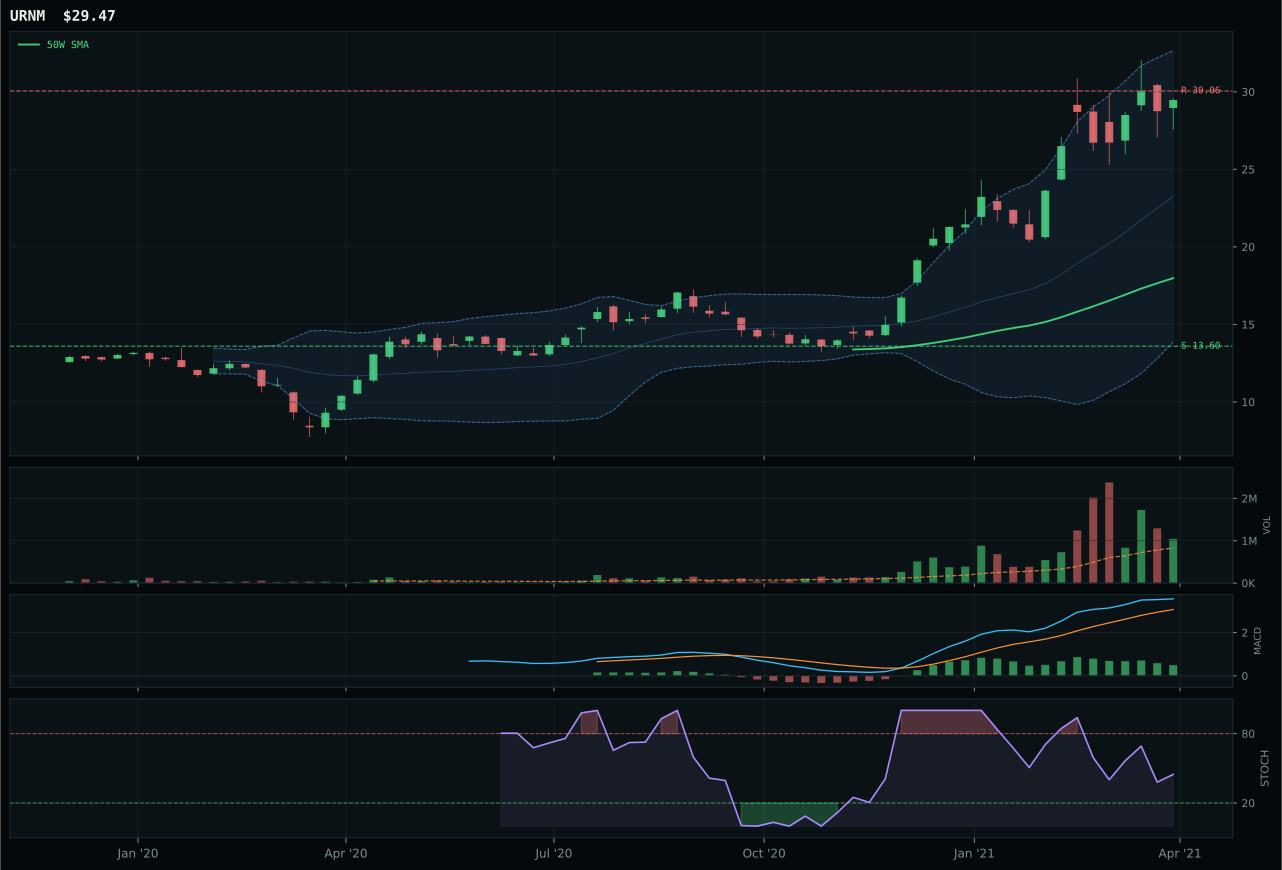
URNM has a vertical extension profile with 30.2% 13-week relative strength versus SPY.
A failed hold above support would weaken the setup.
Actionable but governed by invalidation levels.
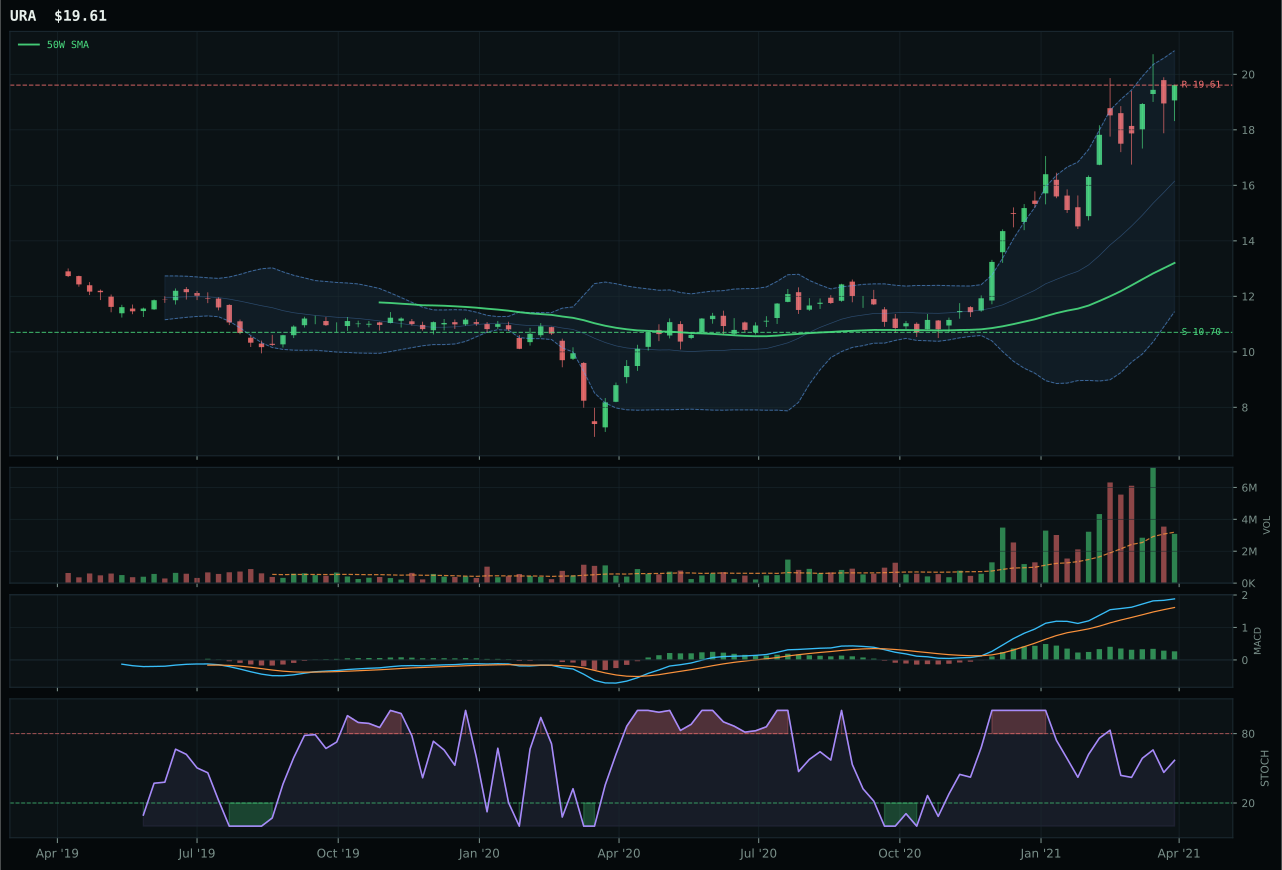
URA has a vertical extension profile with 20.8% 13-week relative strength versus SPY.
A failed hold above support would weaken the setup.
Actionable but governed by invalidation levels.
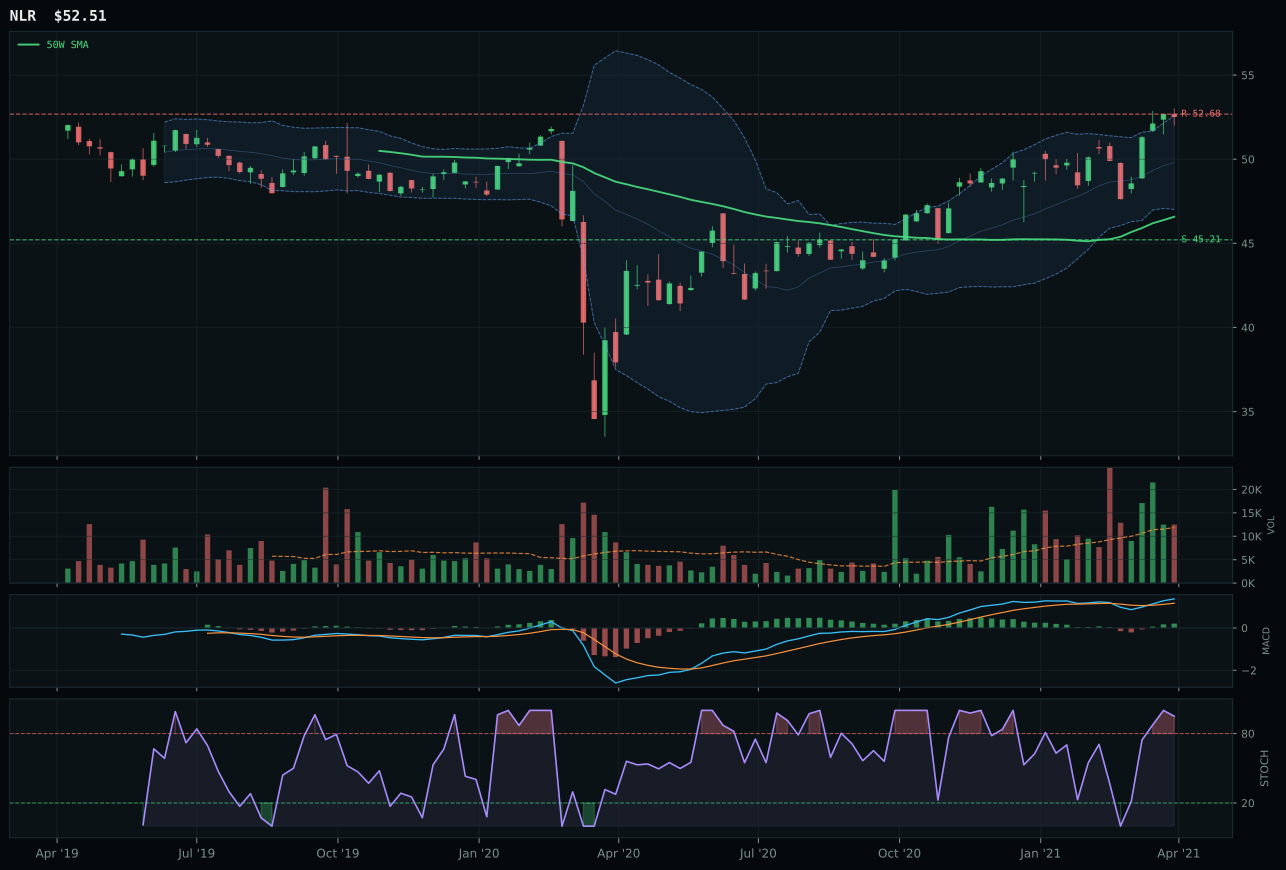
NLR has a neutral structure profile with -0.4% 13-week relative strength versus SPY.
A failed hold above support would weaken the setup.
Tracked, but not top-2 eligible because: .
URNM wins the nuclear basket decisively at 65.3 category score and ranks 2nd overall for top-2 allocation. The 37.4% 13W return and 30.2% SPY-relative outperformance are extraordinary, backed by perfect momentum confirmation (100.0/100) and above-average participation at 1.26x the 20W average—rare strength. URA is stronger on raw trend (100.0 vs URNM's 76.0) and structure cleanliness (69.7 vs 70.7), but URA's neutral volume and 0.0% category-relative strength reveal passive holding rather than active accumulation. URNM's extended 63.8% above the 50W is steep, yet volume confirmation and 100.0 persistence show real money following the uranium-miner beta into renewable energy thesis.
Nuclear Energy earned 10% top-2 allocation on a 65.3 score with macro fit of 69.0/100 and exceptional technical evidence of 73.9/100. Energy scarcity is active (+9), real asset sponsorship (+7), and AI growth sponsorship (+5), a three-pillar setup supporting both clean energy transition and data center power demand. The technical evidence is the second-strongest in the portfolio: URNM's 76.0 trend score, 100.0 momentum confirmation, and 100.0 persistence signal sustained institutional accumulation. The risk is real—63.8% extension above the 50W means every new buyer is late—but volume confirmation (75.0/100) and the breadth of macro tailwinds justify the 10% commitment. To stay at tier-1, the setup needs to hold the 50W support on any flush; a break would knock it back to 5% pending a retest.
Utilities & Infrastructure — XLU
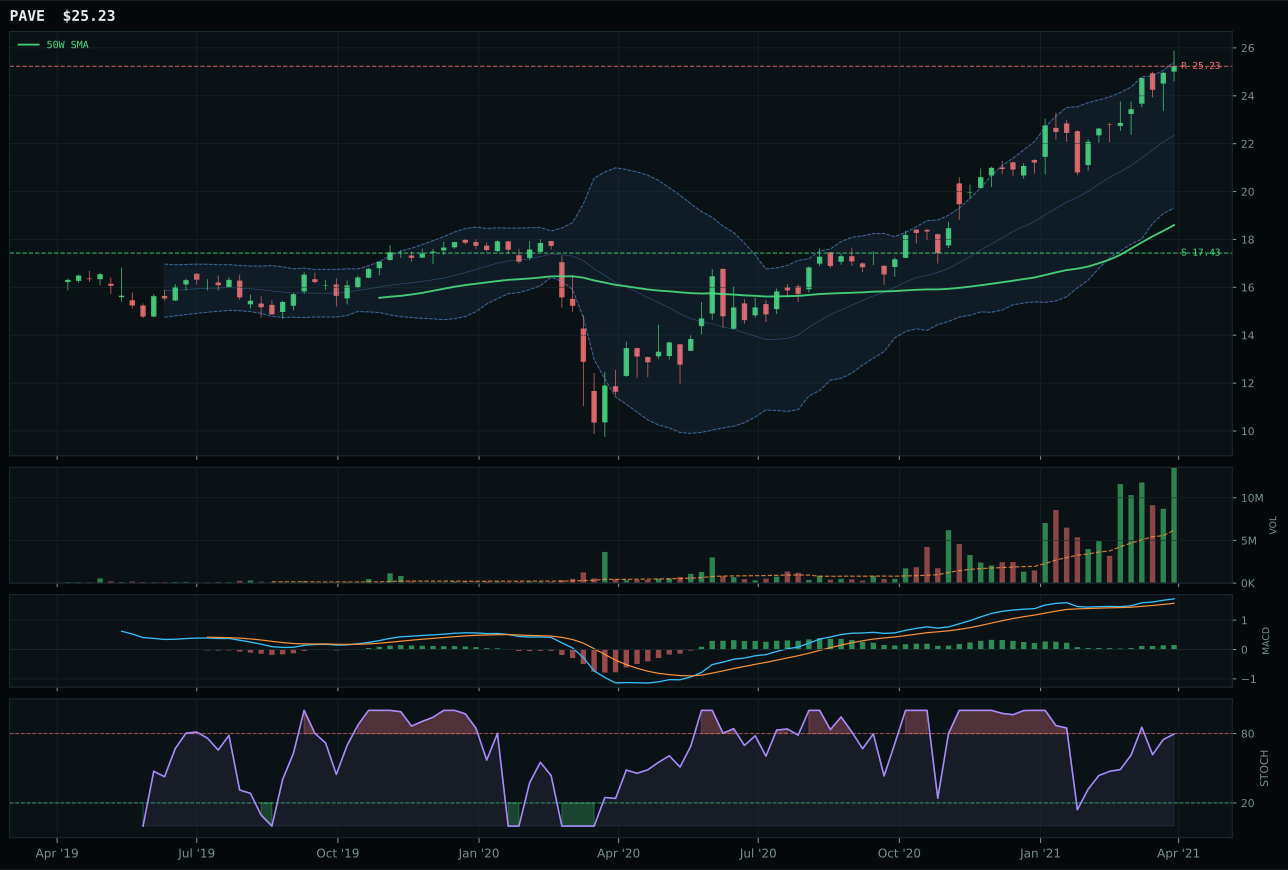
PAVE has a vertical extension profile with 11.8% 13-week relative strength versus SPY.
A failed hold above support would weaken the setup.
Actionable but governed by invalidation levels.
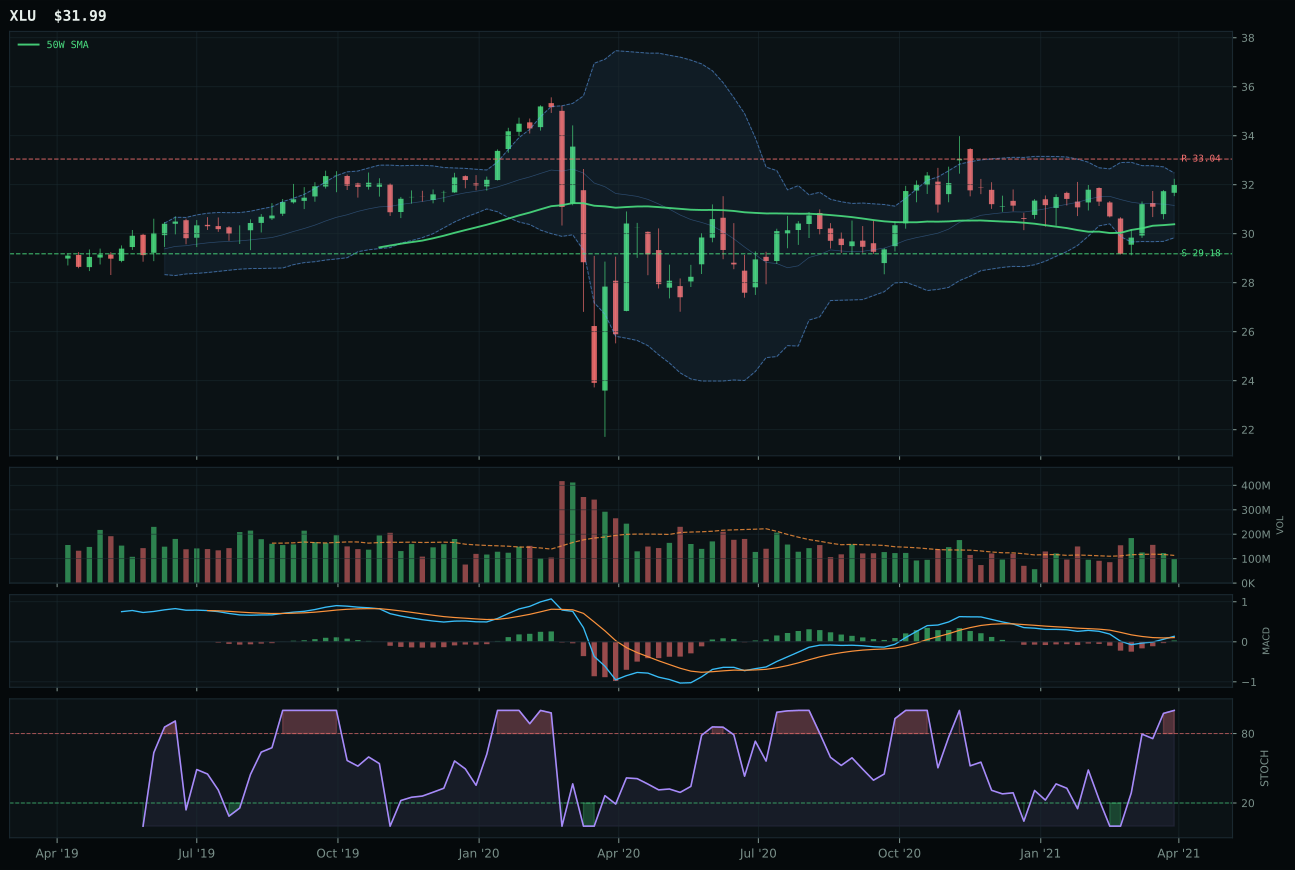
XLU has a neutral structure profile with -5.1% 13-week relative strength versus SPY.
A failed hold above support would weaken the setup.
Actionable but governed by invalidation levels.
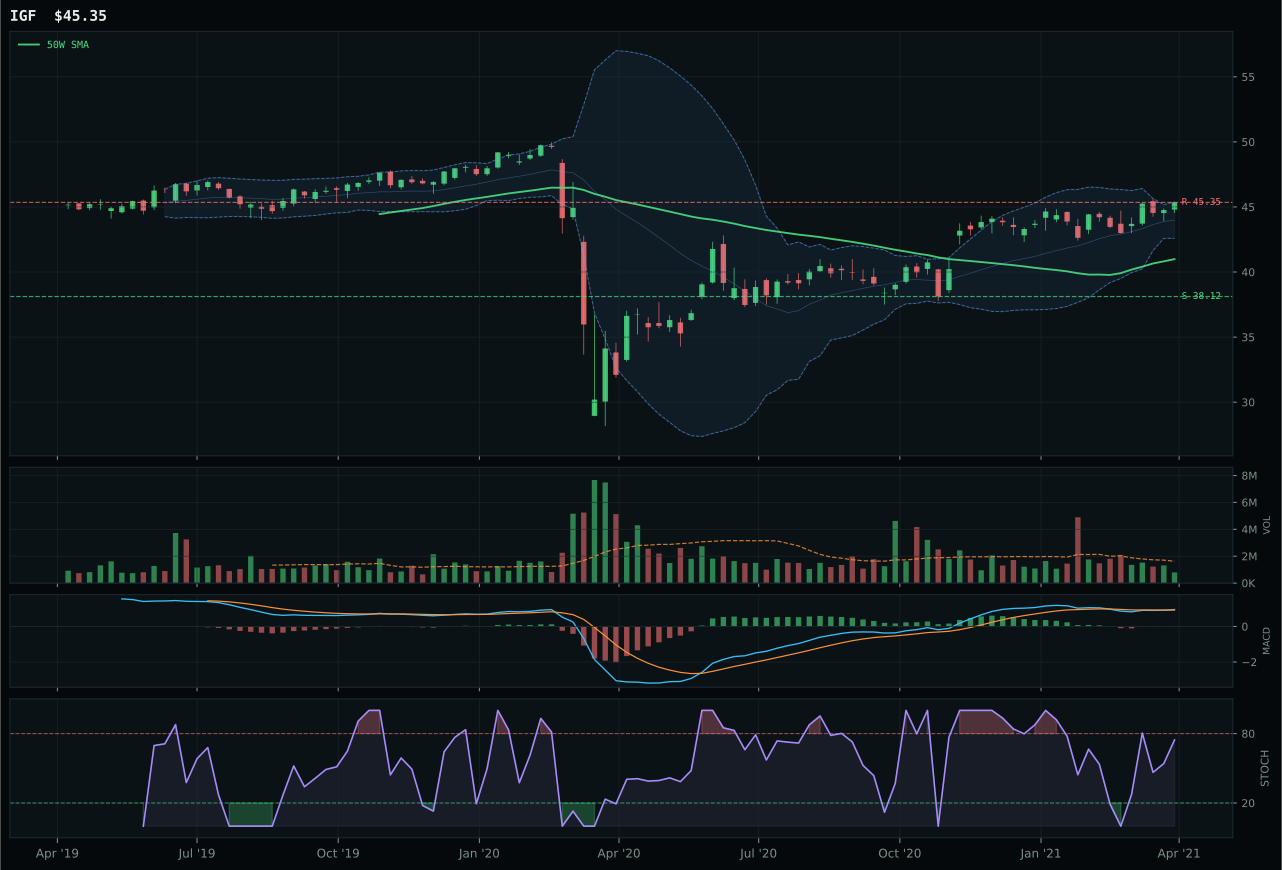
IGF has a neutral structure profile with -3.4% 13-week relative strength versus SPY.
A failed hold above support would weaken the setup.
Actionable but governed by invalidation levels.
XLU wins the utilities basket with 6.8-point margin over PAVE on cleaner technical timing and lower entry risk. XLU's neutral structure at 5.3% above the 50W beats PAVE's vertical extension at 35.6% by a mile; XLU's 75.0 timing score (MACD bullish and improving, overbought momentum) tops PAVE's 45.0 on the same indicators. Both show bullish MACD and improving persistence, but XLU's compressed entry risk and overbought stochastic offer a higher-probability setup than PAVE's extended, momentum-dependent structure. XLU's 13W return is modest at 2.0% versus PAVE's 19.0%, but in a defensive category, lower entry risk and better timing synchronization matter more than absolute return chase.
Utilities & Infrastructure earned 5% as tier-2 with a 61.9 score, held back from top-2 by weak macro fit of 50.0/100 and technical evidence of 72.1/100 (solid but not dominant). Broad market bear is active (+4) and inflation pressure is active (-6), creating a cross-current: defensive names rally in bear markets but suffer under rising rates and inflation. The technical setup is strong in XLU—92.3 trend, 75.0 timing, 63.2 volume-price—but the absolute price extension remains modest at 5.3%, leaving upside room constrained by the 3.2% downside to resistance. At 5%, Utilities fills a portfolio role as a ballast against equity volatility; to earn top-2 status, inflation pressure would need to roll off or XLU would need to consolidate and form a fresh upside breakout. Currently it sits in the tactical defensive tier.
Agriculture & Livestock — MOO
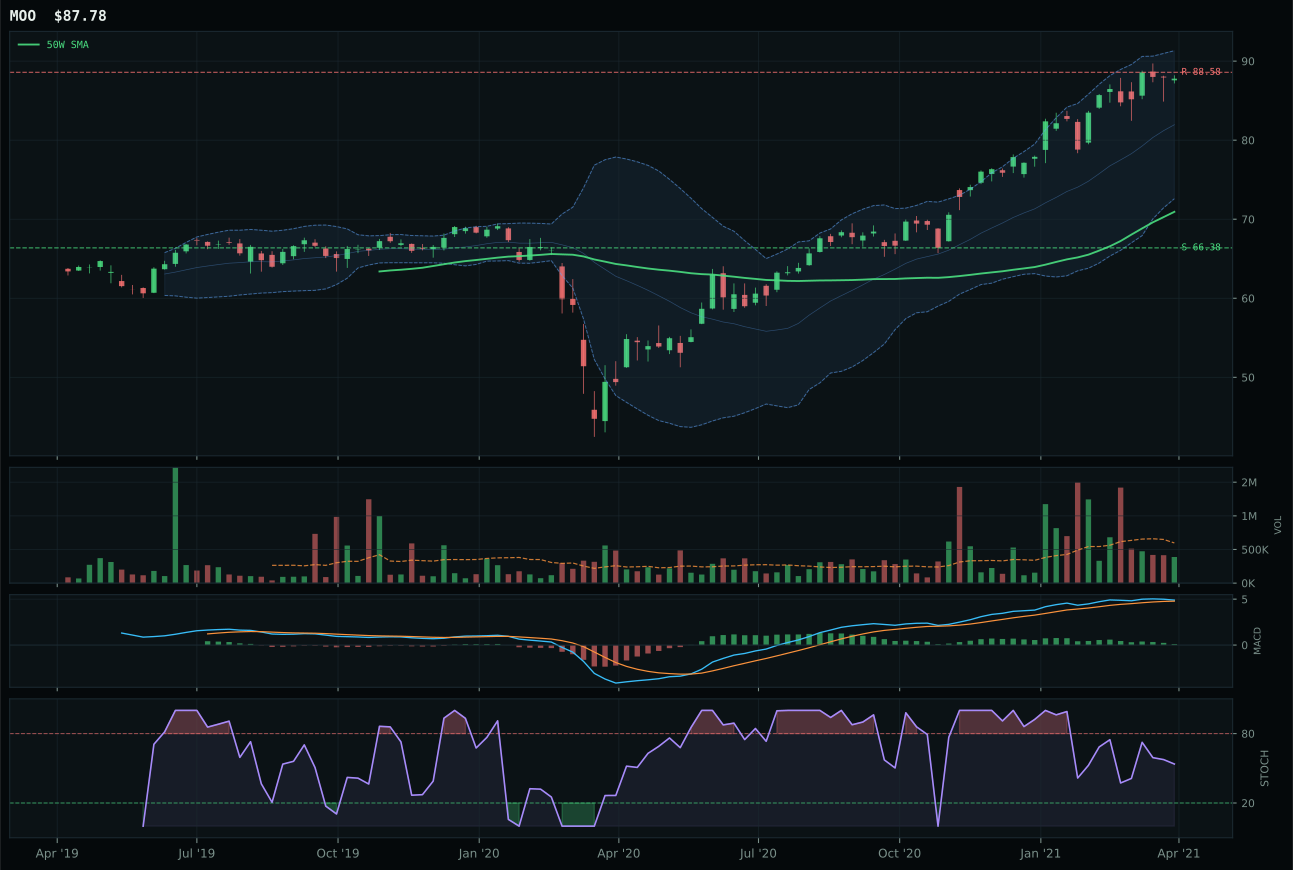
MOO has a vertical extension profile with 5.5% 13-week relative strength versus SPY.
A failed hold above support would weaken the setup.
Actionable but governed by invalidation levels.
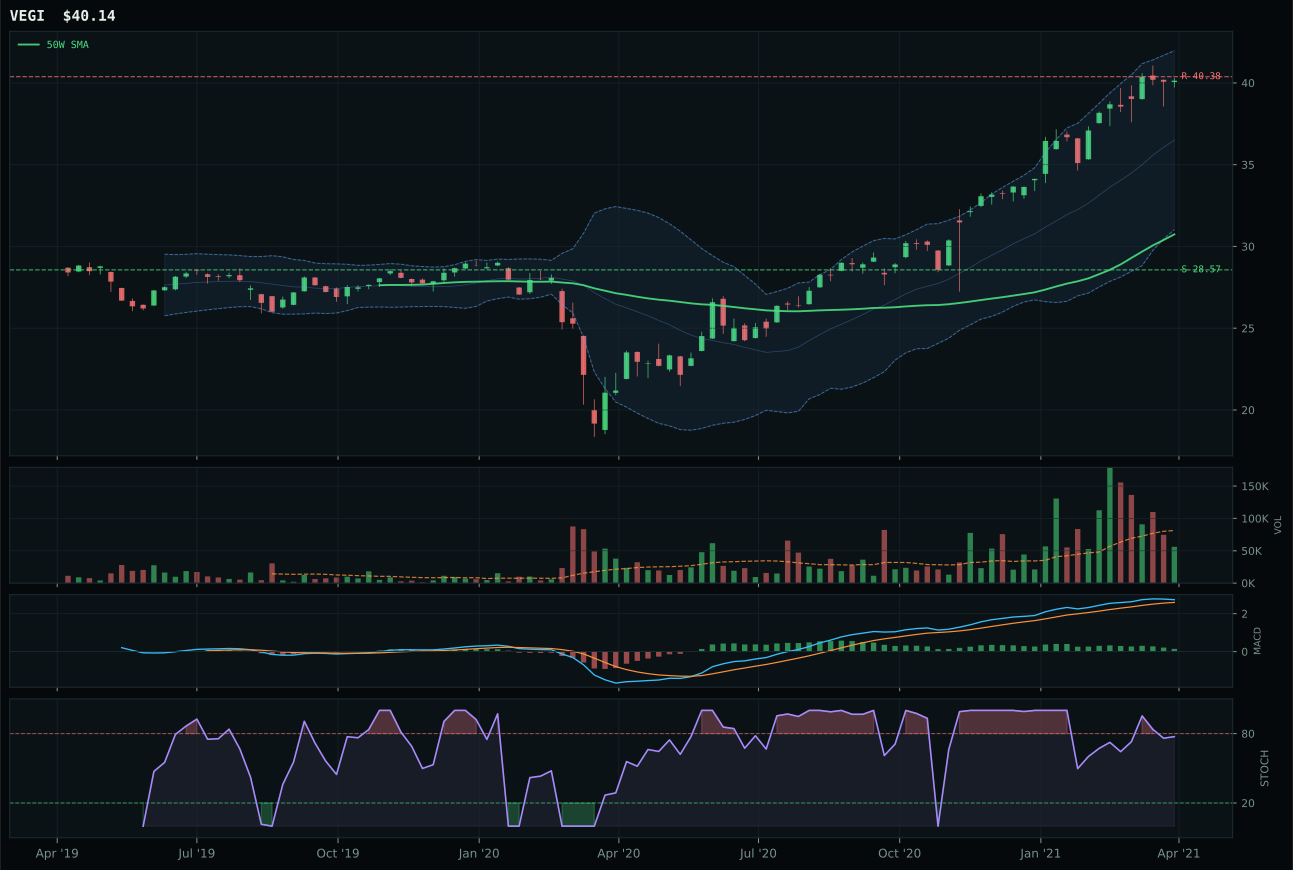
VEGI has a vertical extension profile with 10.5% 13-week relative strength versus SPY.
A failed hold above support would weaken the setup.
Tracked, but not top-2 eligible because: .
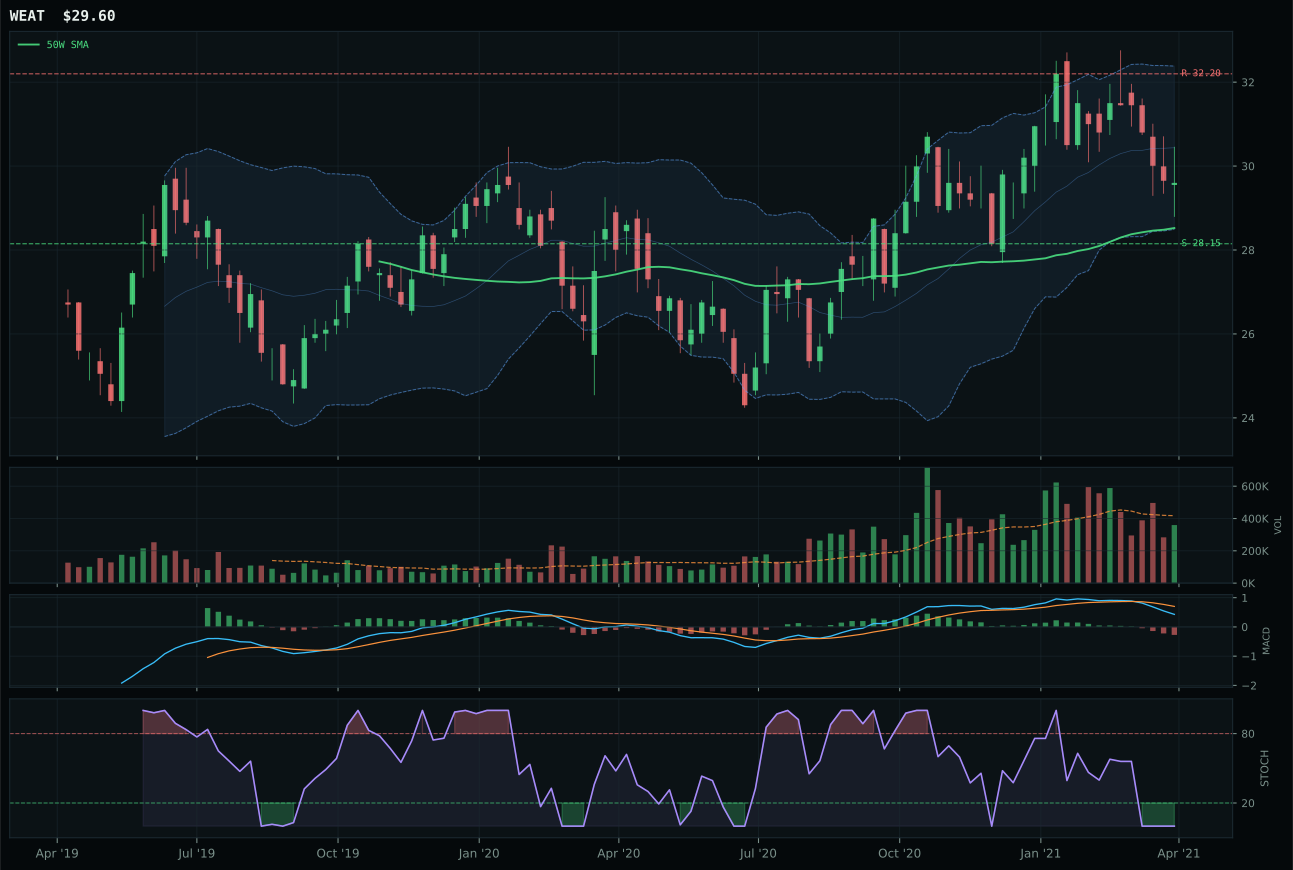
WEAT has a neutral structure profile with -11.5% 13-week relative strength versus SPY.
A failed hold above support would weaken the setup.
Actionable but governed by invalidation levels.
MOO wins with a perfect 100.0 trend score and 12.7% 13W return, beating VEGI's 22.7-point gap through better structure (70.4 vs lower) and category-relative strength (0.0% vs 0.0% on the relative metric, but MOO leads on breadth). Both face 23.7% to 30.6% extension above the 50W; MOO's edge lies in its 1.3 margin of category leadership and bullish-but-flattening MACD that remains intact. VEGI is the faster absolute performer (17.6% 13W), but that doesn't matter when RS is flat; MOO's steadier accumulation and superior technical setup (compression 82.8 vs lower ranges) make it the lower-risk expression of the agriculture macro thesis.
Agriculture & Livestock earned 5% as a tier-2 position with a 53.4 final score, the highest in that allocation tier. The macro fit of 86.0/100 is exceptional—supply shortage (+13), inflation pressure (+10), real asset sponsorship (+8), and commodity breadth all stack in favor of agribusiness. The technical evidence of 58.8/100 is solid, not exceptional, as both MOO and VEGI face extended setups with thin volume. But macro fit dominates the weighting at 38% of the composite, and the category wins decisively on narrative. To earn top-2, MOO would need volume to confirm the breakout from thin to neutral or better, or for the technical setup to reset into a cleaner support-flush pattern. Right now the macro case is so strong that allocation defaults to 5%; the question is not whether to own it, but whether extended technicals deserve a bigger slice given the scarcity backdrop.
Industrial Metals — COPX
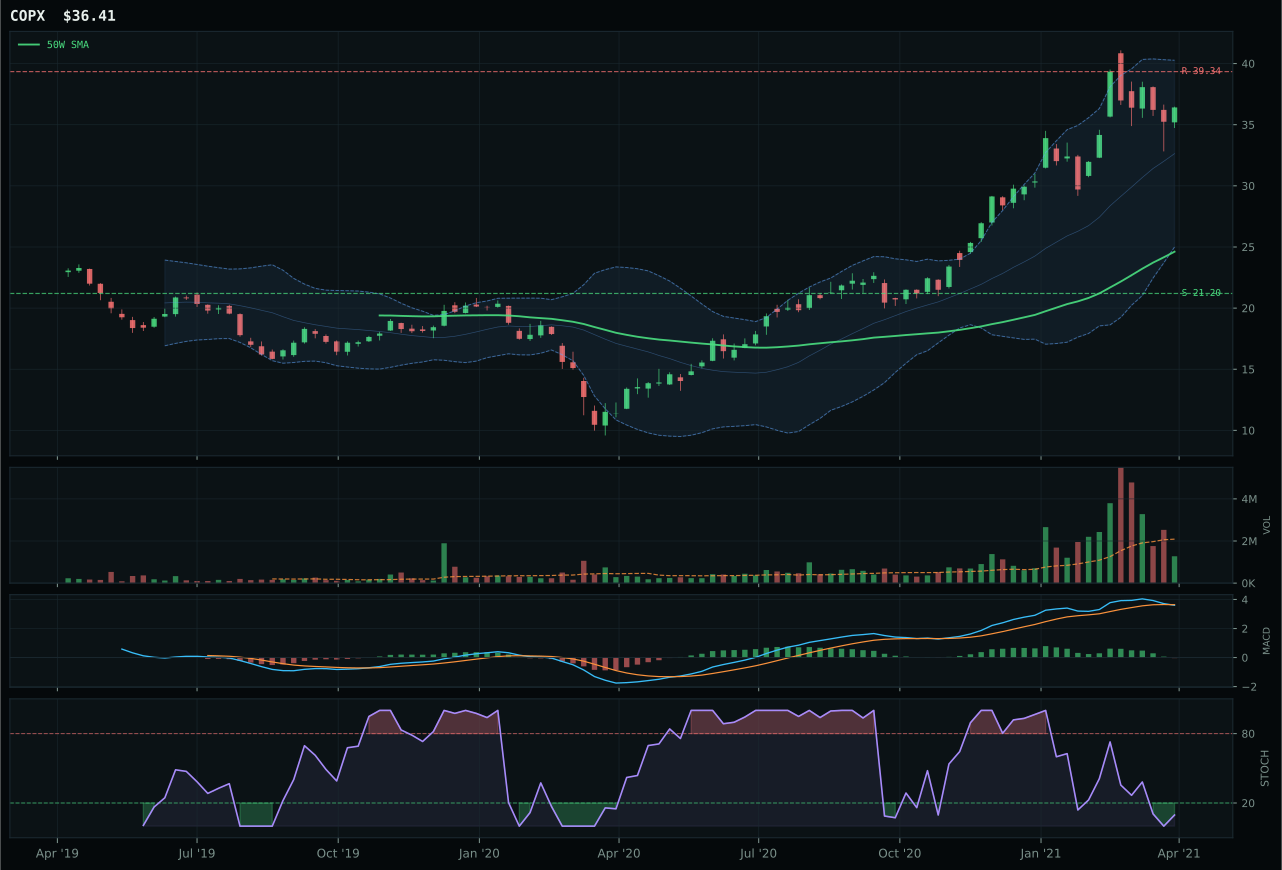
COPX has a vertical extension profile with 12.8% 13-week relative strength versus SPY.
A failed hold above support would weaken the setup.
Actionable but governed by invalidation levels.
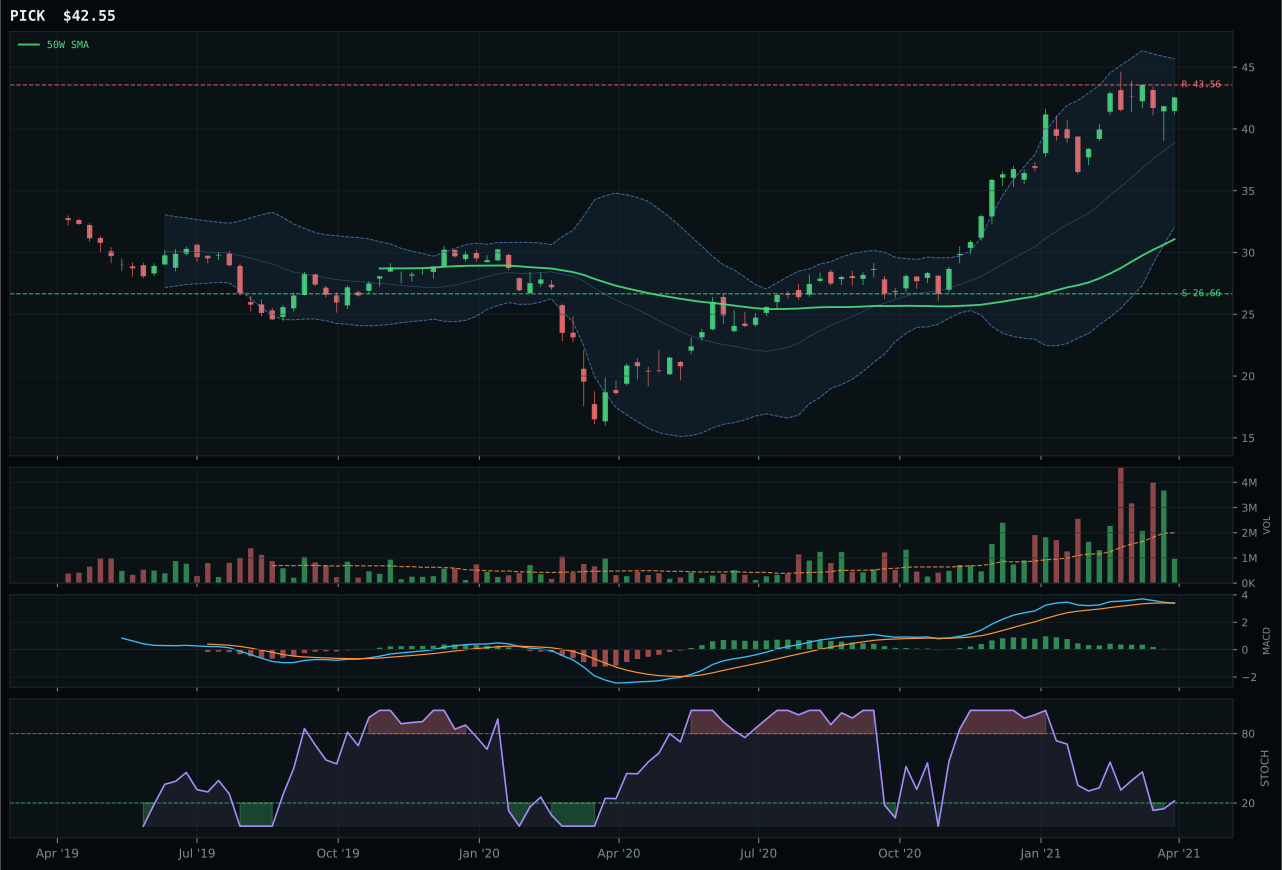
PICK has a vertical extension profile with 8.3% 13-week relative strength versus SPY.
A failed hold above support would weaken the setup.
Actionable but governed by invalidation levels.
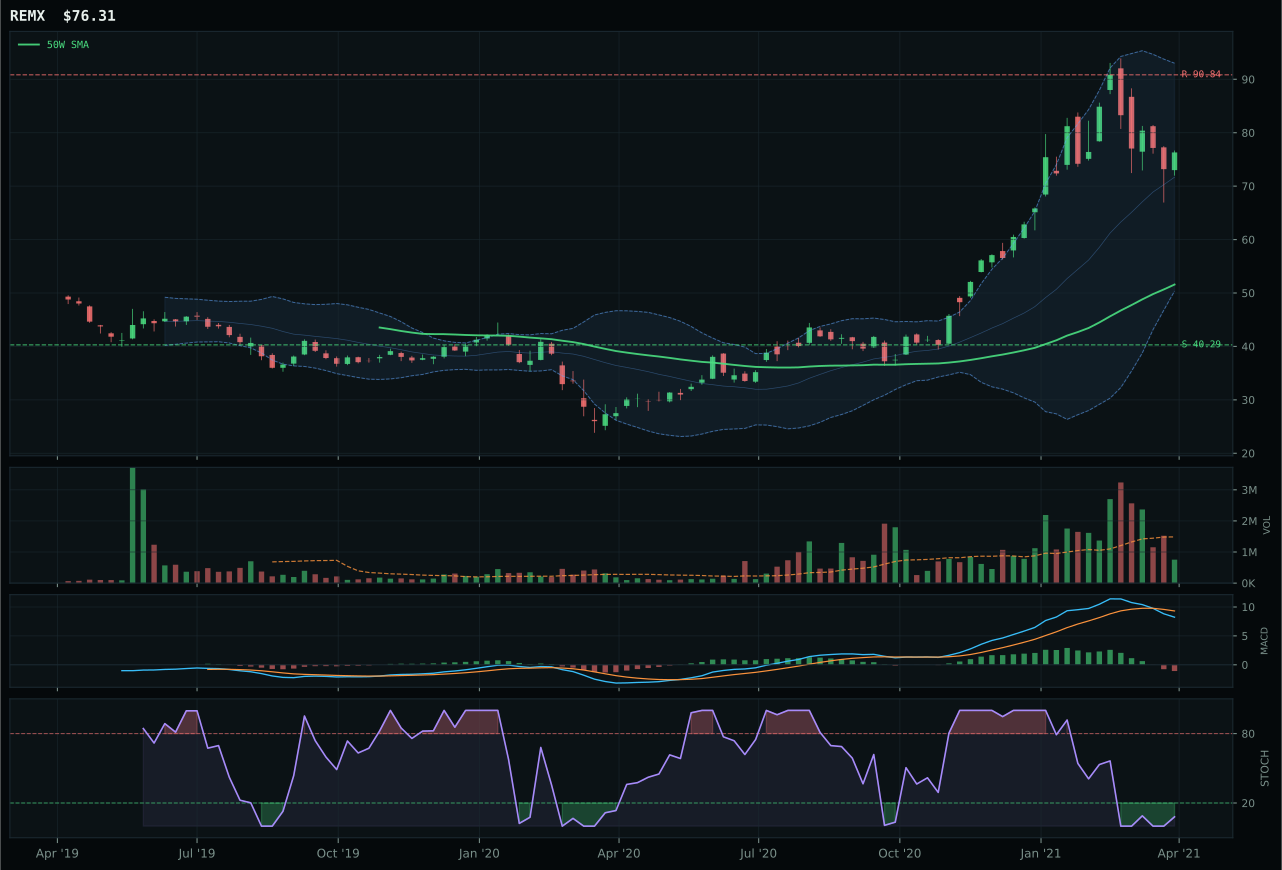
REMX has a vertical extension profile with 8.8% 13-week relative strength versus SPY.
A failed hold above support would weaken the setup.
Actionable but governed by invalidation levels.
COPX wins with exceptional relative strength within the basket: 4.0% category-relative outperformance versus PICK's -0.5%, and its 19.9% 13W return crushes the field on absolute performance. The 92.0 trend score and 12.8% SPY-relative return (strongest in the category) back the technical leadership. PICK's timing was weaker (40.0 vs 48.0), and despite thin participation across the field, COPX's superior trend persistence (66.2/100) and stronger momentum confirmation (76.7/100) show conviction. The 2.2-point gap is narrow but clean: copper scarcity beta is outperforming diversified miners in a supply-squeeze regime, and the charts agree.
Industrial Metals earned 5% as a tier-2 category with a 49.5 score, riding a macro tailwind of 66.0/100 from metals scarcity (+14), commodity breadth (+10), and real asset sponsorship (+6). The technical evidence of 39.9/100 is the weakness—extended charts, thin volume, oversold stochastic—but macro fit of 63.0/100 on COPX itself compensates. The category sits in the 5% band because two stronger categories ranked ahead, yet the macro case for copper scarcity and industrial demand is textbook solid. COPX's extreme extension at 47.9% above the 50W and -7.4% upside to resistance are the brakes on a bigger allocation; a pullback into the 50W or reset below compression would unlock tier-1 status. For now it holds 5% on macro merit despite technical exhaustion.
AI — SMH
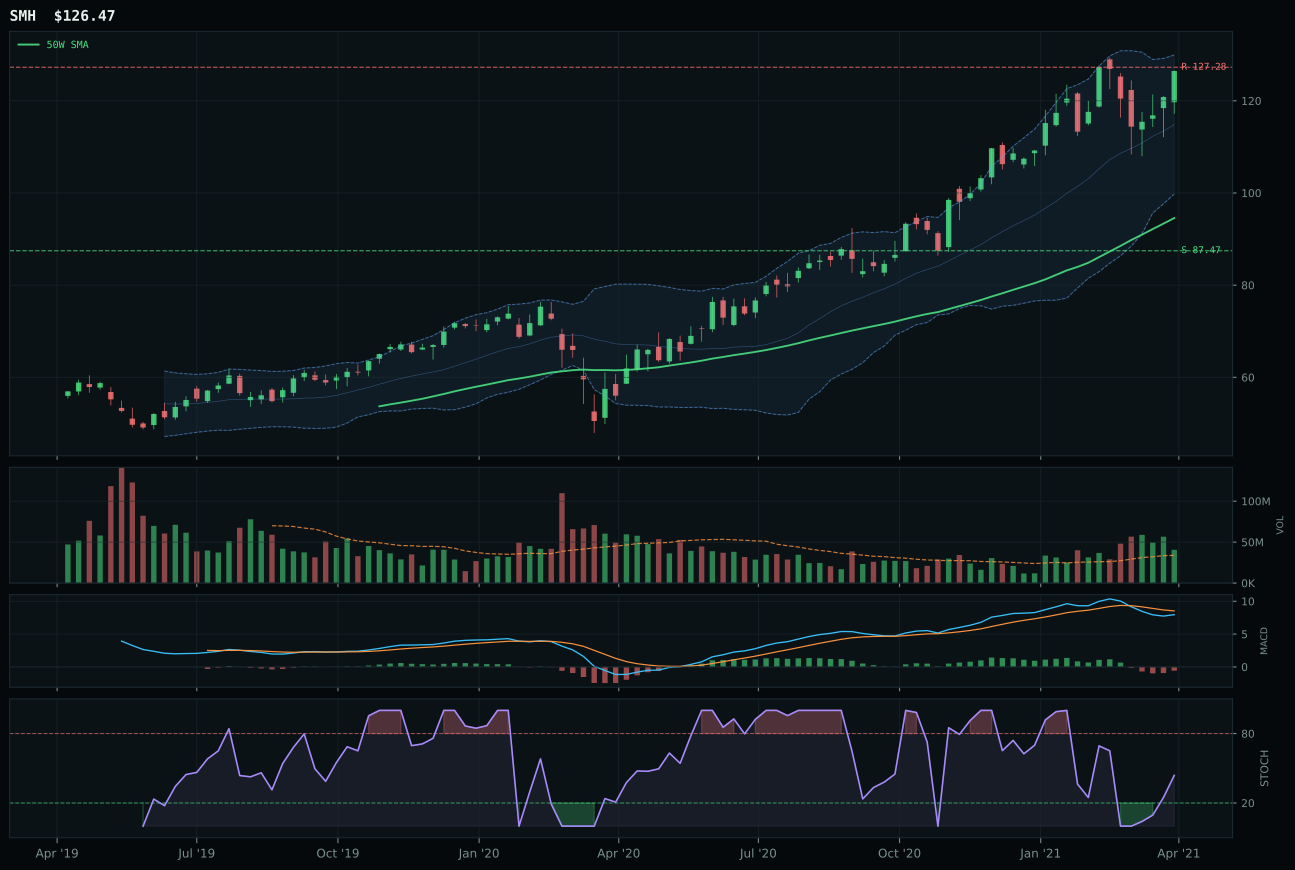
SMH has a vertical extension profile with 8.7% 13-week relative strength versus SPY.
A failed hold above support would weaken the setup.
Actionable but governed by invalidation levels.
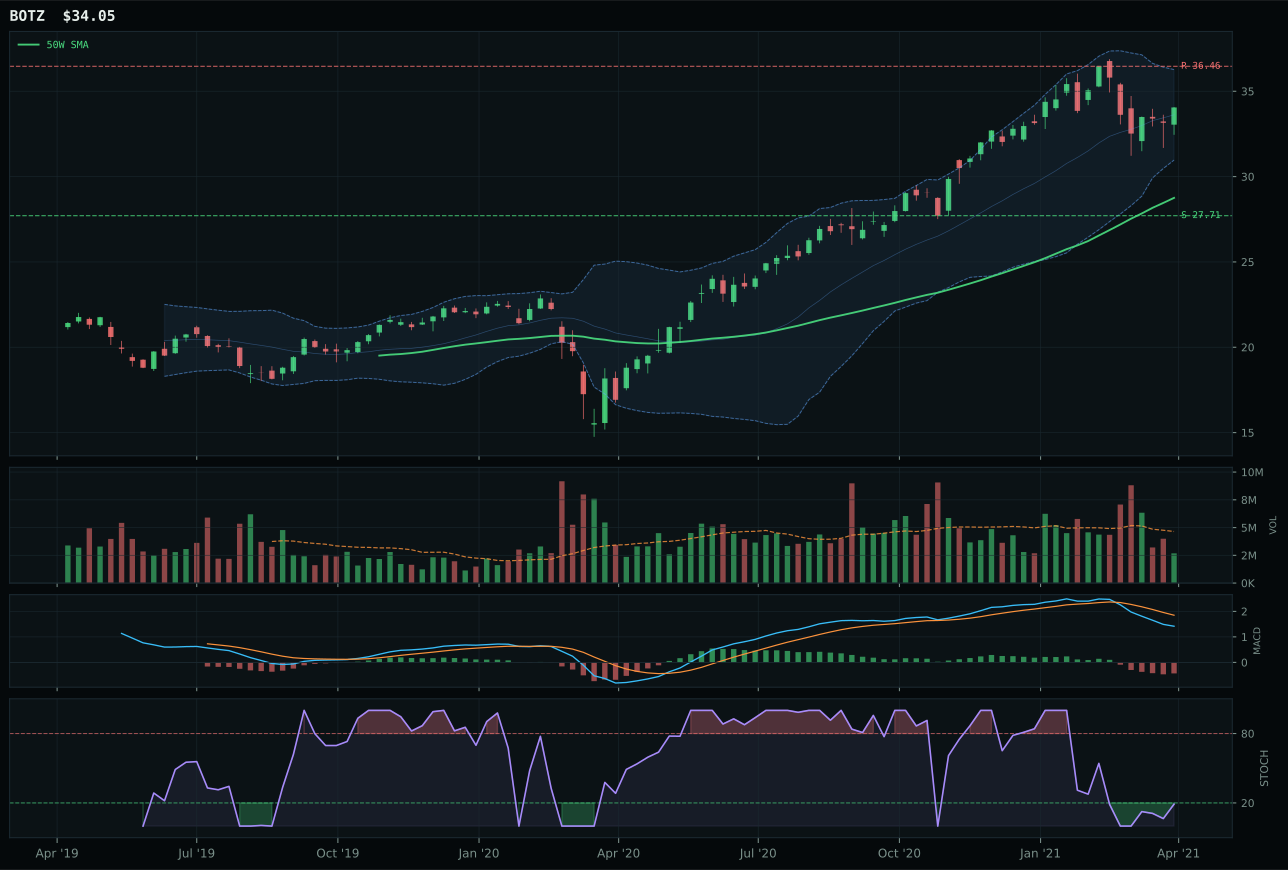
BOTZ has a vertical extension profile with -4.4% 13-week relative strength versus SPY.
A failed hold above support would weaken the setup.
Actionable but governed by invalidation levels.
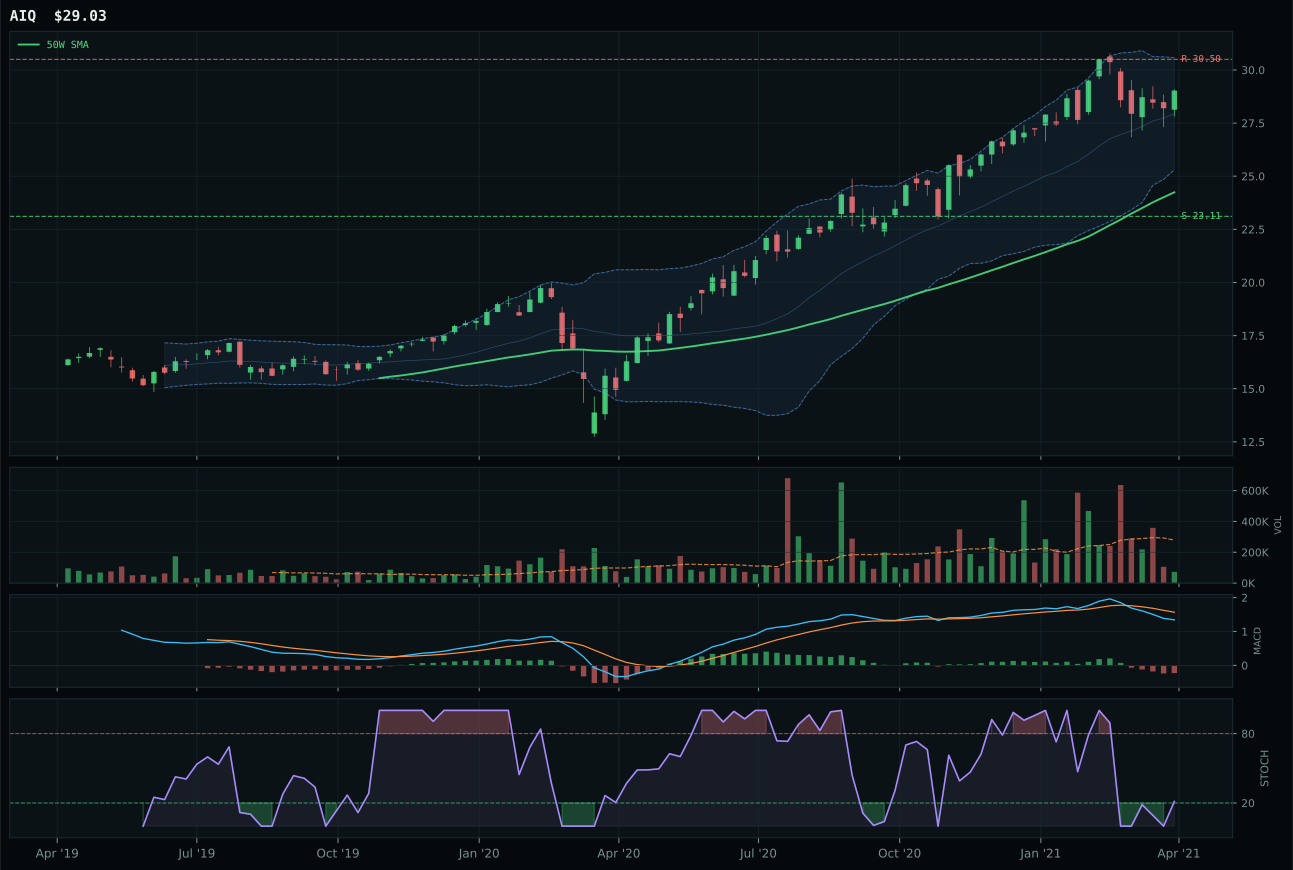
AIQ has a vertical extension profile with -0.4% 13-week relative strength versus SPY.
A failed hold above support would weaken the setup.
Tracked, but not top-2 eligible because: .
SMH dominates because it combines the strongest momentum confirmation in the category (100.0/100) with above-average volume participation at 1.20x the 20W average. The 15.8% 13W return and 9.1% category-relative strength beat BOTZ by 5.6 points, while BOTZ carried oversold stochastic timing and only thin participation—a classic mismatch of high price extension and weak accumulation. SMH's 92.0 trend score and perfect momentum reading show money following the compute-and-semiconductor complex, not the robotics cycle. Persistence and volume-price confirmation both favor SMH at 63.1 and 67.0 respectively, indicating sustained accumulation rather than a one-week spike.
AI holds 5% as a tier-2 position despite a respectable 44.7 category score. The macro fit of 54.0/100 gets good marks from AI growth sponsorship (+14) and risk appetite (+10), but broad market bear and credit stress drag it down. The technical evidence of 58.6/100 sits below the top-2 threshold, meaning even with favorable narrative, SMH's extreme extension at 33.7% above the 50W penalizes upside capture for entry risk. The category's score was higher than some peers at allocation time, but two stronger categories ranked above it; to earn top-2 tier, AI would need either a cleaner 50W structure (less extended) or confirmation that the broad market bear descriptor is turning off. At 5%, it remains a tactical position in AltSeason, not a portfolio core.
Defense & Aerospace — ITA
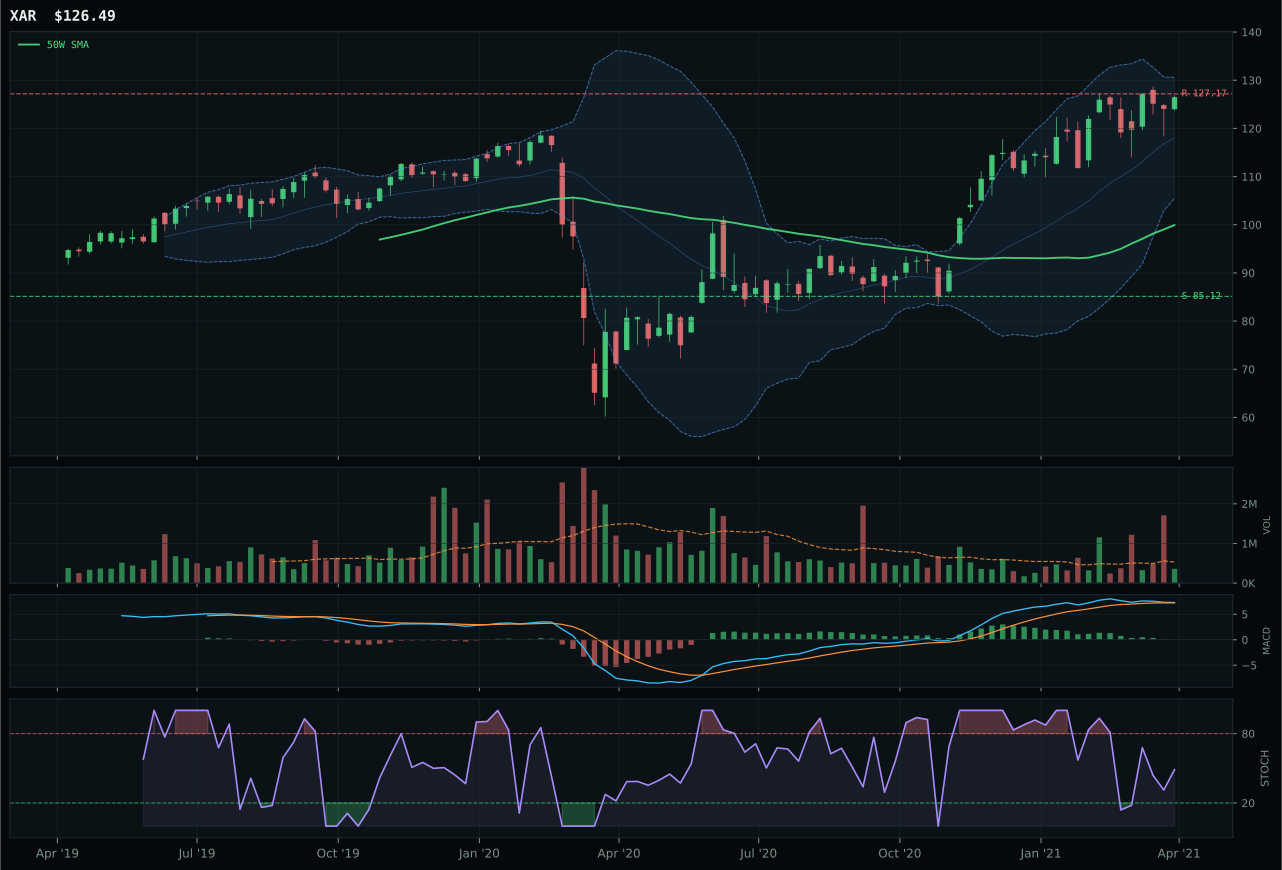
XAR has a vertical extension profile with 3.1% 13-week relative strength versus SPY.
A failed hold above support would weaken the setup.
Actionable but governed by invalidation levels.
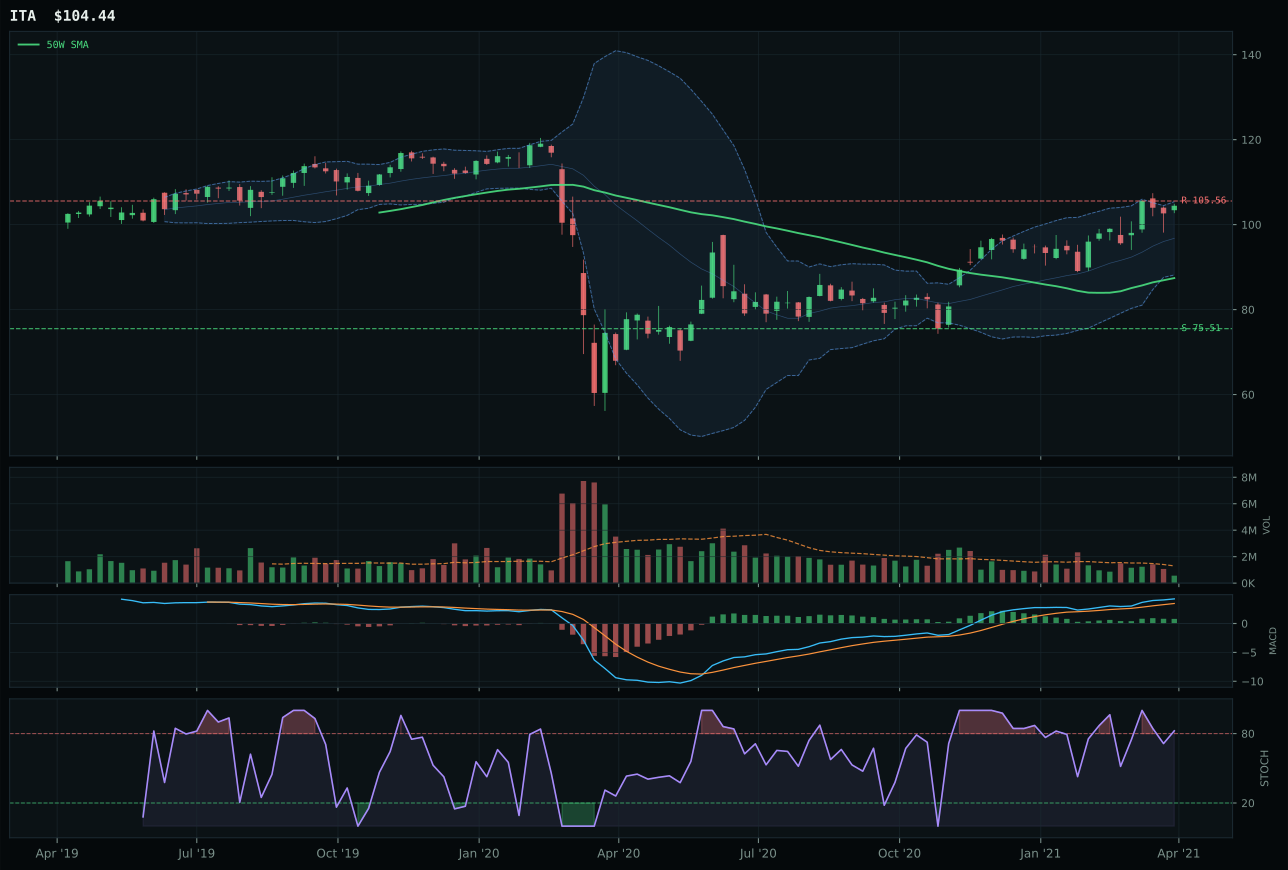
ITA has a vertical extension profile with 3.1% 13-week relative strength versus SPY.
A failed hold above support would weaken the setup.
Actionable but governed by invalidation levels.
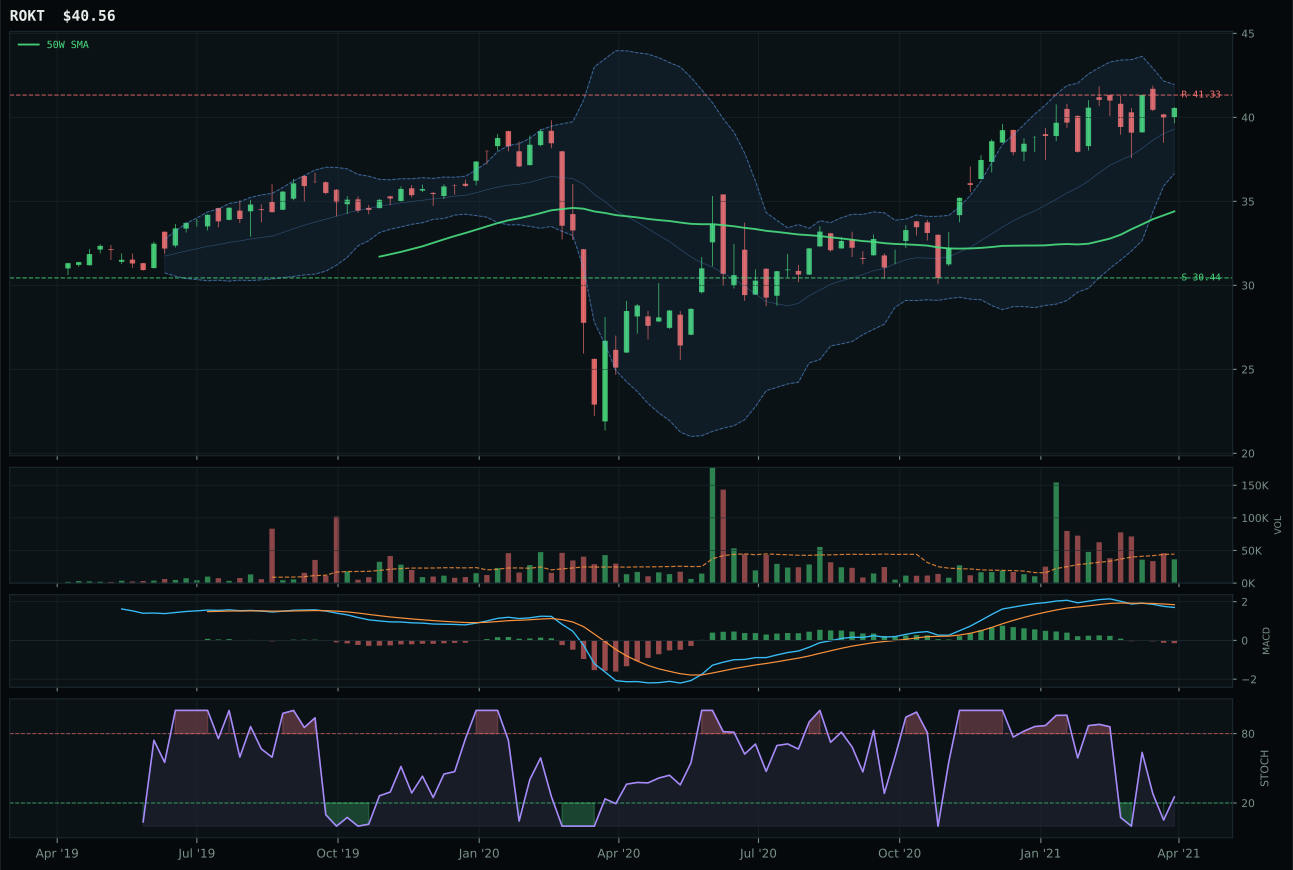
ROKT has a vertical extension profile with -2.6% 13-week relative strength versus SPY.
A failed hold above support would weaken the setup.
Tracked, but not top-2 eligible because: .
ITA wins on perfect trend scoring (100.0/100) and bullish-improving MACD confirmation, beating XAR despite nearly identical SPY-relative returns (both 3.1%). The edge comes from ITA's superior MACD signal—bullish and improving versus XAR's bullish but flattening—plus cleaner structure (71.5 vs 70.8) and a 6.3-point score gap. Both face the same entry-risk penalty: extended 19.5% to 26.6% above the 50W with thin participation. But ITA's improving momentum indicator and slightly better structural cleanliness suggest conviction is building, not fading. The category-relative strength tie at 0.0% means neither has peer leadership; ITA simply has better technical timing.
Defense & Aerospace earned 5% as a tier-2 category with a 44.0 final score, helped substantially by macro tailwinds. The category macro fit of 64.0/100 reflects broad market bear (+6), dollar pressure (+3), and credit stress (+2), which all favor defensive hardware spending and durability names. Transition / Mixed regime adds +3 points because defensive names tend to hold value when risk appetite oscillates. The technical evidence of 44.5/100 is middling, anchored by thin participation and extended valuations, but macro fit of 59.0/100 on ITA itself compensates. To reach top-2 tier, the category would need either volume to normalize from thin participation to neutral, or a sharper deterioration in risk appetite to push more capital into prime contractors. For now it sits in the 5% band—a justified hold for portfolio balance, not a conviction call.
Technology — XLK
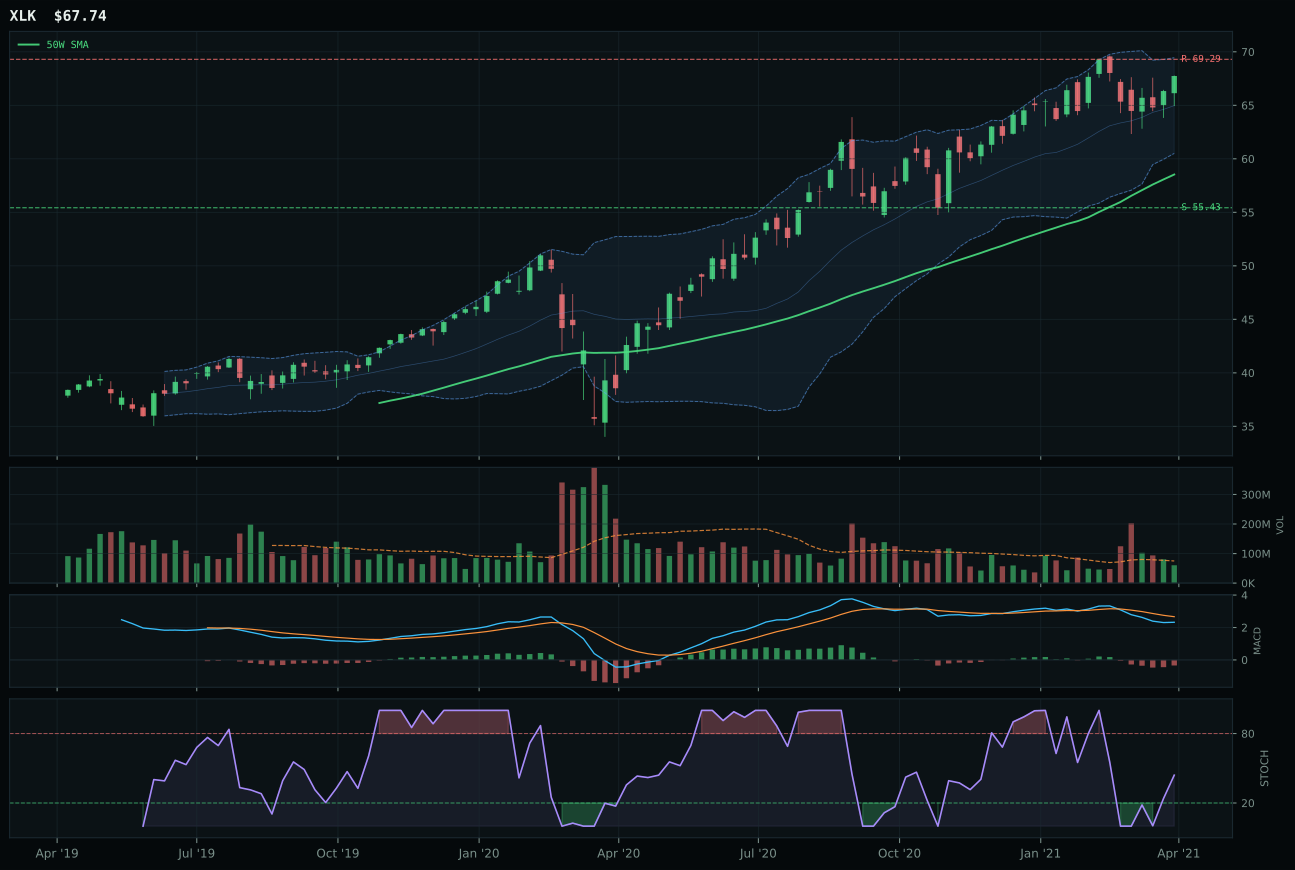
XLK has a vertical extension profile with -3.0% 13-week relative strength versus SPY.
A failed hold above support would weaken the setup.
Actionable but governed by invalidation levels.
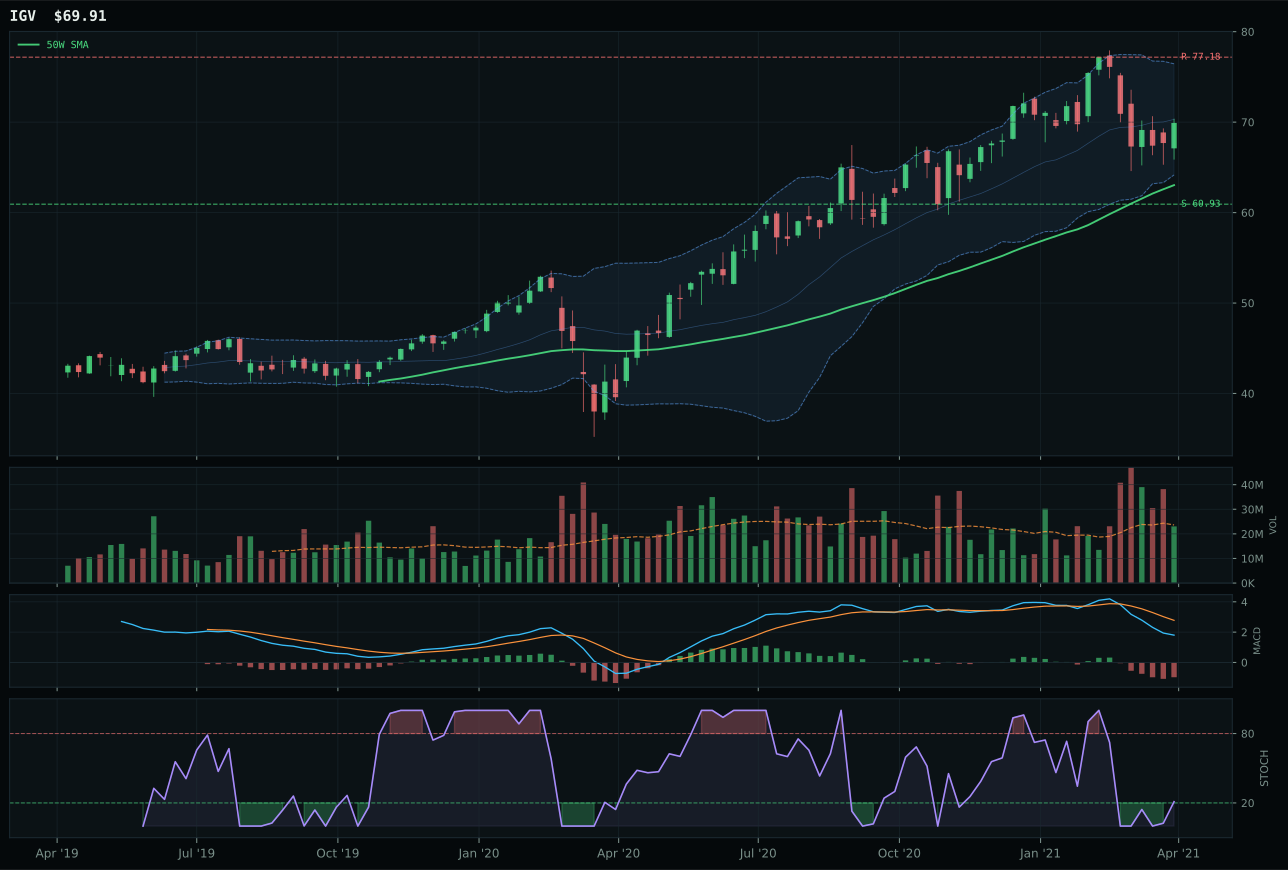
IGV has a neutral structure profile with -8.4% 13-week relative strength versus SPY.
A failed hold above support would weaken the setup.
Actionable but governed by invalidation levels.
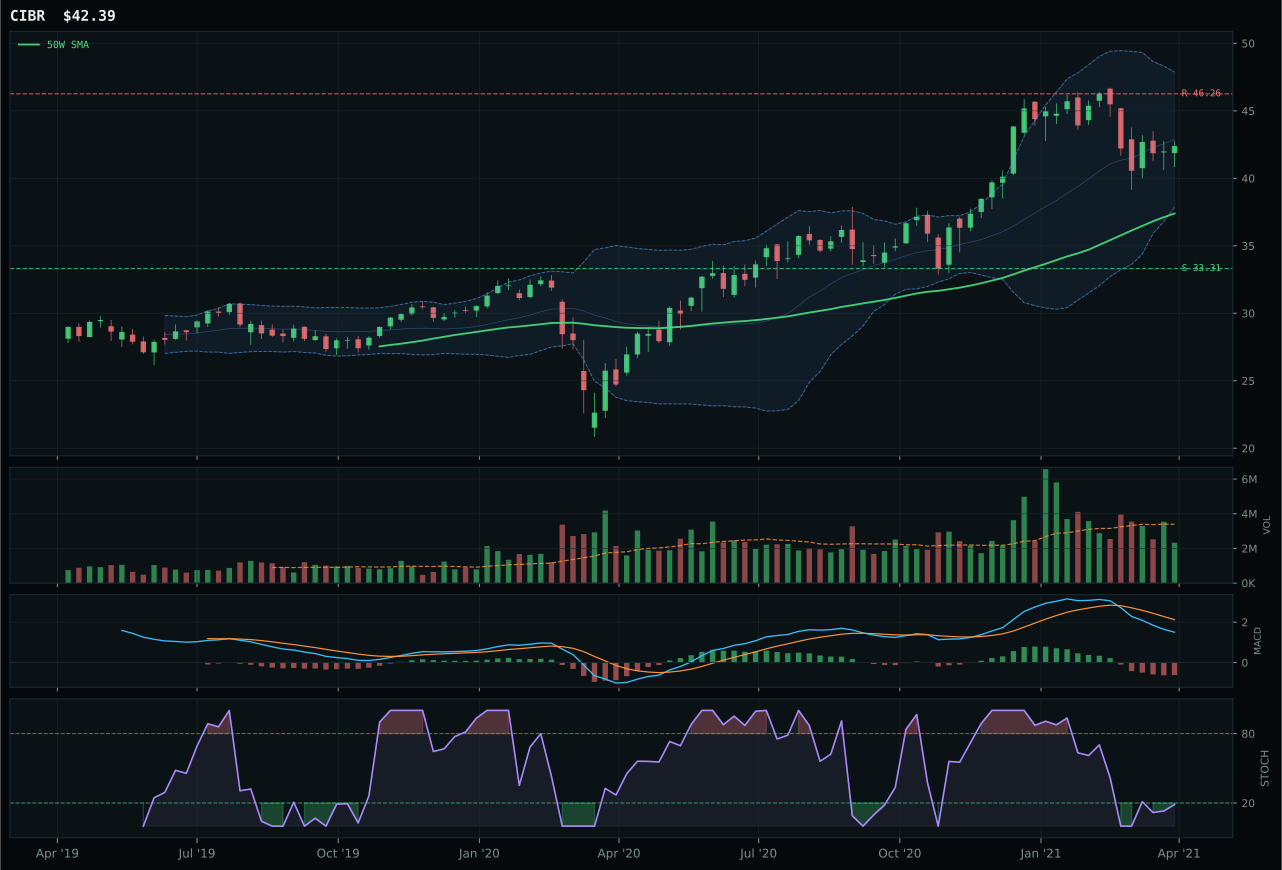
CIBR has a neutral structure profile with -11.6% 13-week relative strength versus SPY.
A failed hold above support would weaken the setup.
Actionable but governed by invalidation levels.
XLK wins the category on relative strength inside its basket, posting 5.5% outperformance versus the category median while IGV flatlined at 0.0%. The setup is vertical extension 15.7% above the 50W—expensive entry ground—but XLK's 13W return of 4.2% and category-relative leadership justify the allocated slot. IGV's structure weakness (69.6 vs 71.3) and -8.4% SPY-relative return tell the story of duration-sensitive software lagging broad profitable tech through a volatile macro regime. The score gap of 7.5 points is clean; this is not a coin flip but a decisive technical win backed by sponsorship.
Technology earned 5% allocation as a tier-2 category, sitting outside the top-2 overweights at 42.9 final score. The category macro fit of 49.0/100 reflects active headwinds—credit stress and dollar pressure both penalize growth—that offset AI growth sponsorship and positive risk appetite. A transition regime favors tangible assets and energy scarcity over duration bets, and the technical evidence of 62% weighting could not overcome macro fit scoring only 38% of the final composite. For Technology to earn top-2 status, either SPY-relative strength needs to inflect sharply positive or credit stress would need to roll off; right now it sits in the penalty box, held at 5% for portfolio balance but not favored relative to real assets and energy plays.
Precious Metals — SLV
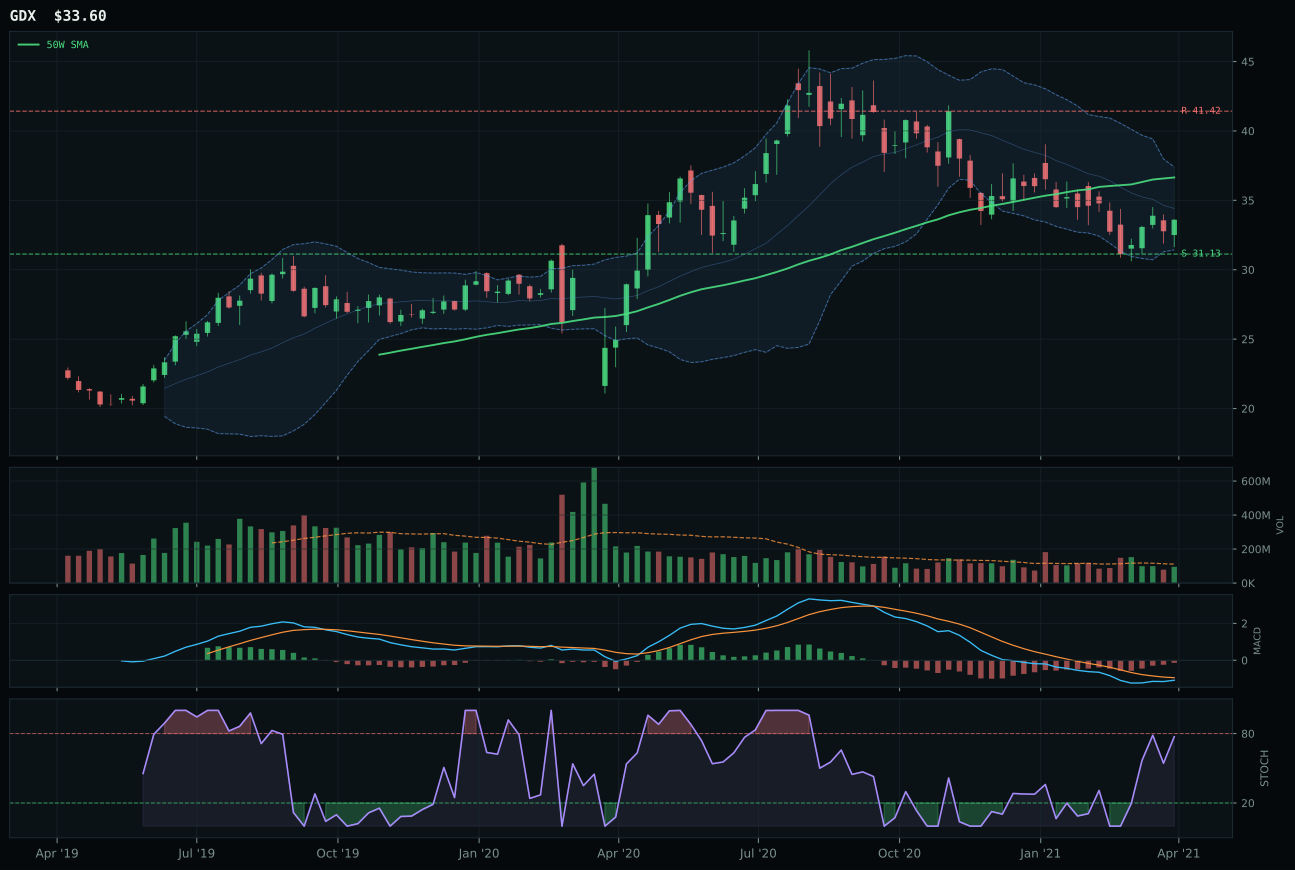
GDX has a neutral structure profile with -13.9% 13-week relative strength versus SPY.
A failed hold above support would weaken the setup.
Actionable but governed by invalidation levels.
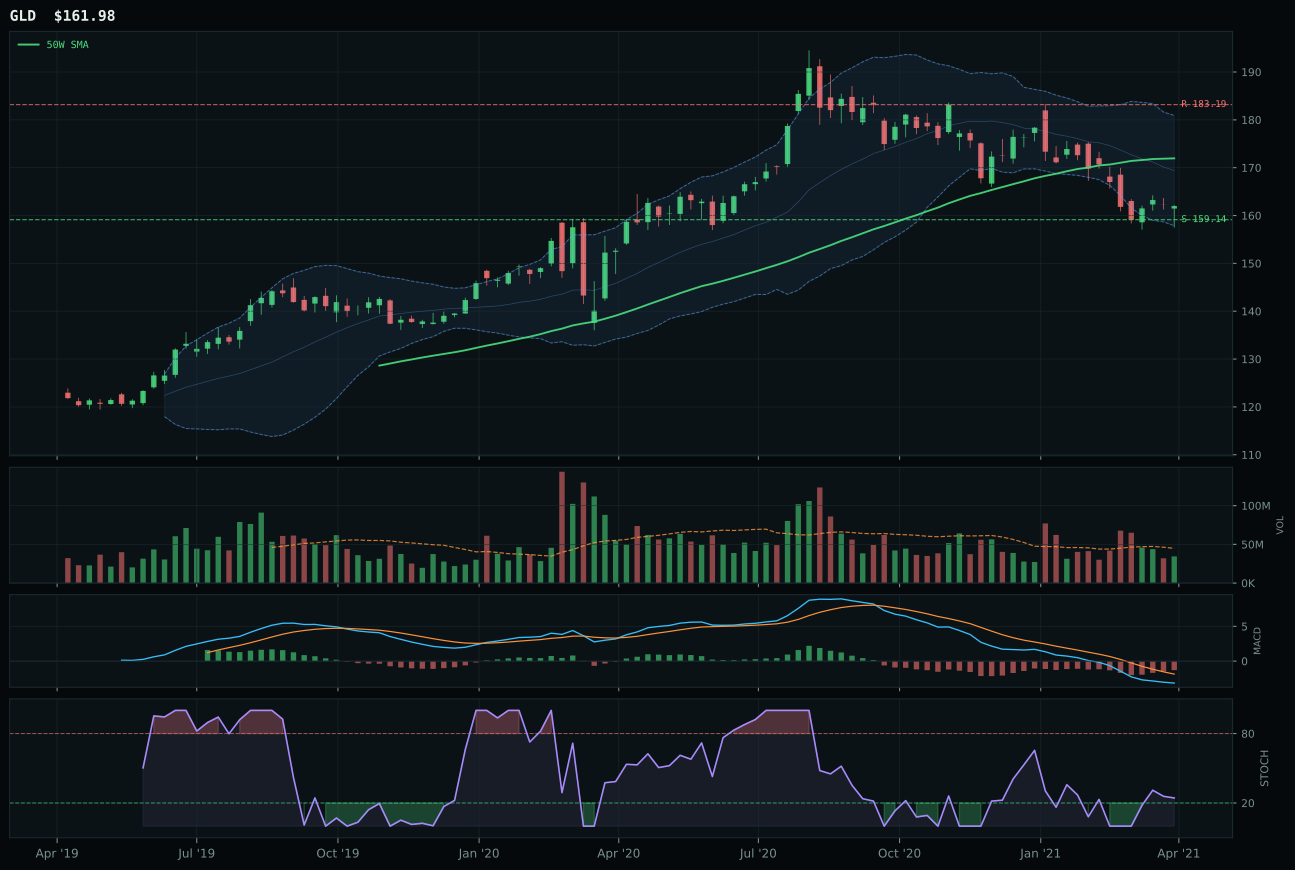
GLD has a pullback into support profile with -16.3% 13-week relative strength versus SPY.
A failed hold above support would weaken the setup.
Actionable but governed by invalidation levels.
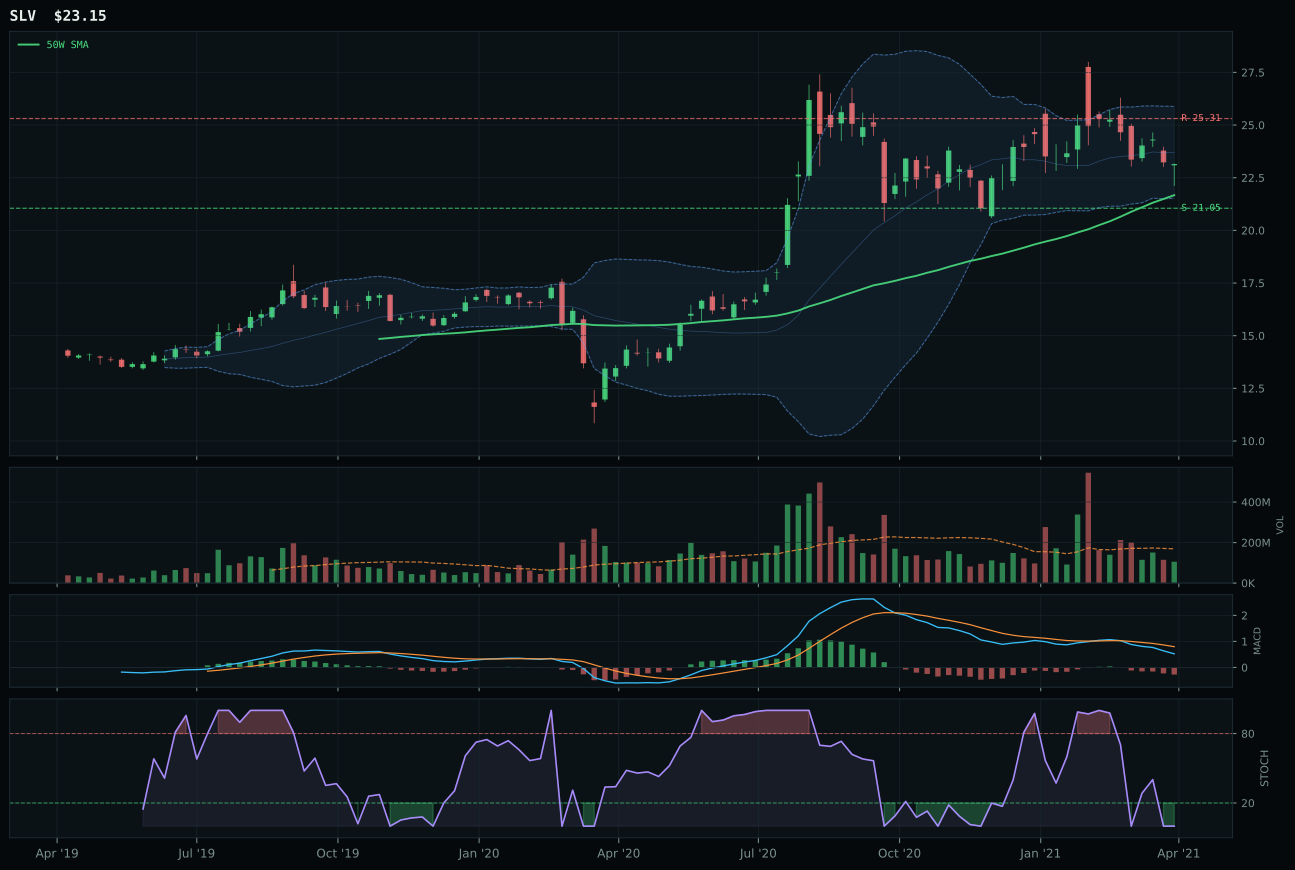
SLV has a neutral structure profile with -12.9% 13-week relative strength versus SPY.
A failed hold above support would weaken the setup.
Actionable but governed by invalidation levels.
SLV wins the category basket with 0.9% category-relative strength versus GDX's 0.0%, but this is a pyrrhic victory: both ETFs are deeply underwater on momentum (SLV at 3.6/100, GDX at an undefined low). SLV's edge is marginal—GDX actually has stronger trend (63) and technical evidence (58.5), with improving MACD that SLV lacks (bearish/weakening). The real story is that neither ETF warrants allocation. SLV's 13W return is -5.8% with -12.9% SPY-relative underperformance; GDX is similarly broken at -6.7% 13W with -13.9% SPY-relative. The 12.7-point gap in the reasoned ETF proof order (GDX 55.4 vs SLV 38.3) suggests GDX was technically superior on raw metrics, yet SLV wins the representative role through category-relative technicality, not conviction.
Precious Metals is excluded from allocation entirely at 0%, ranked 9th or 10th in the portfolio. The category score of 42.5 is deeply subpar, dragged down by catastrophic momentum and macro fit of only 49.0/100. Dollar pressure is active (-5 after inversion), and risk appetite positive is active (-4), meaning both tailwinds for metals are currently offline. The technical evidence of 31.2/100 for SLV (the representative) is nearly unrecoverable; momentum confirmation at 3.6/100 screams capitulation, and thin participation at 0.62x average suggests no smart money is accumulating. Even metals scarcity (+7) and inflation pressure (+5) cannot overcome the macro regime. For Precious Metals to earn a 5% tier-2 slot, dollar pressure would need to turn negative (USD weakness) and risk appetite would need to reverse to favor safe havens; neither is visible yet. It remains on the bench.
Emerging Markets — IEMG
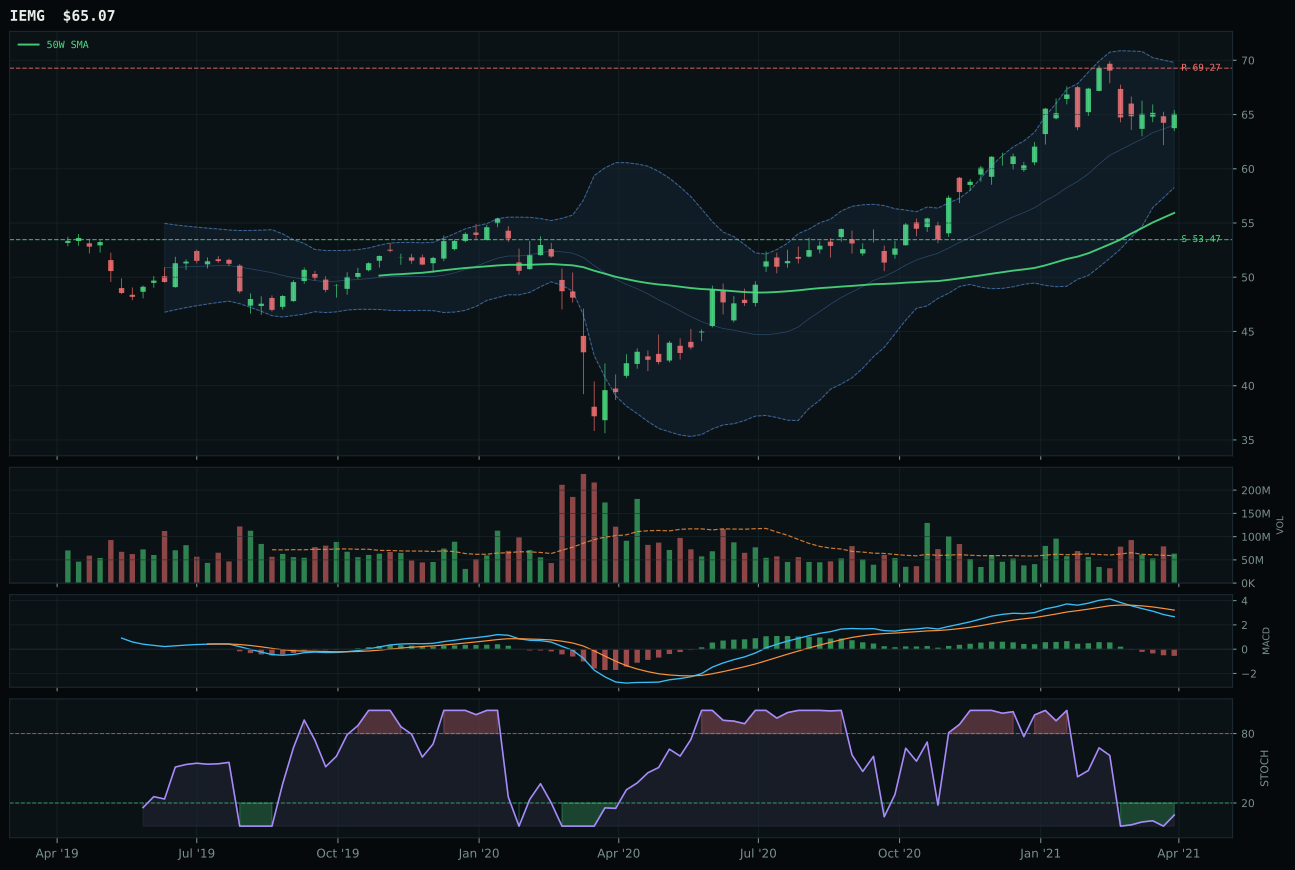
IEMG has a vertical extension profile with -2.3% 13-week relative strength versus SPY.
A failed hold above support would weaken the setup.
Actionable but governed by invalidation levels.
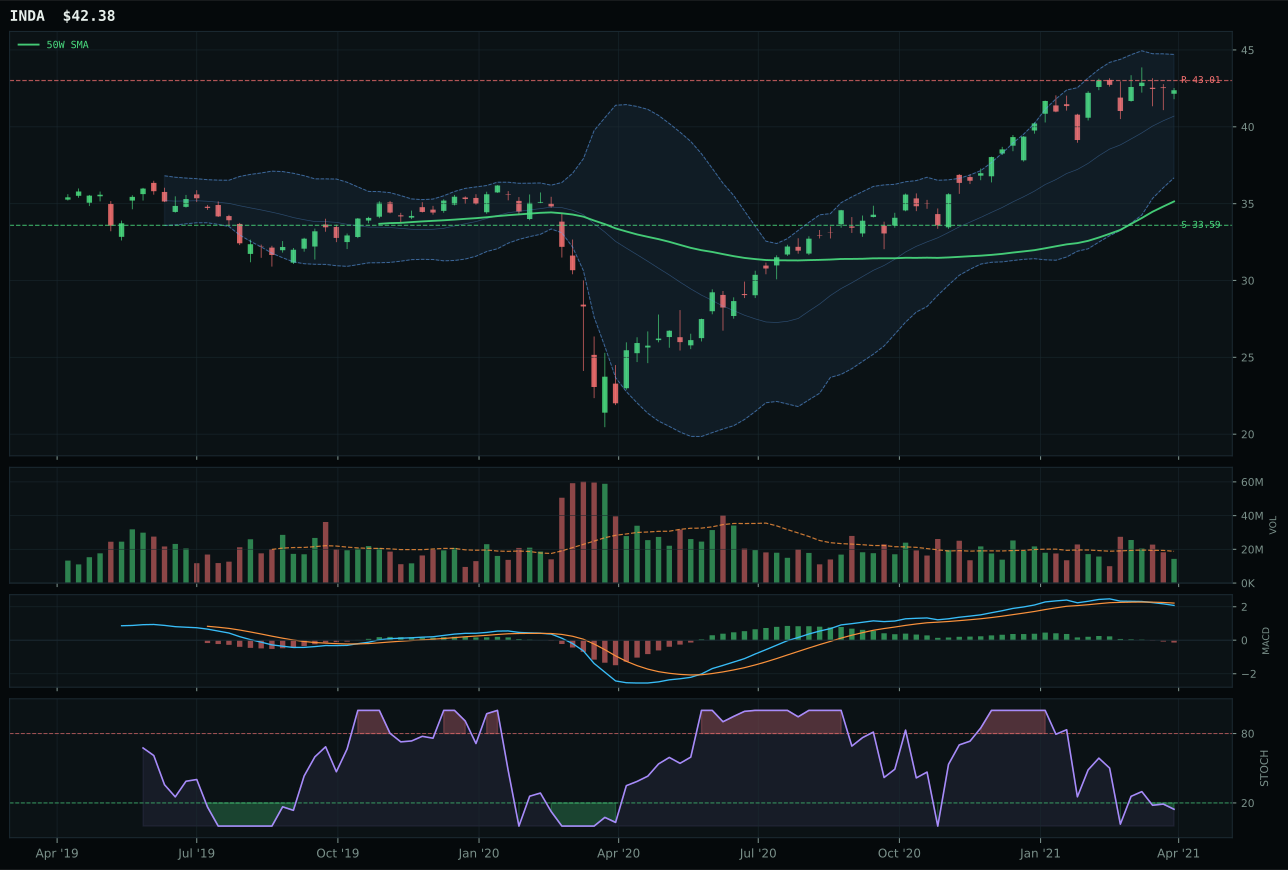
INDA has a vertical extension profile with -1.8% 13-week relative strength versus SPY.
A failed hold above support would weaken the setup.
Actionable but governed by invalidation levels.
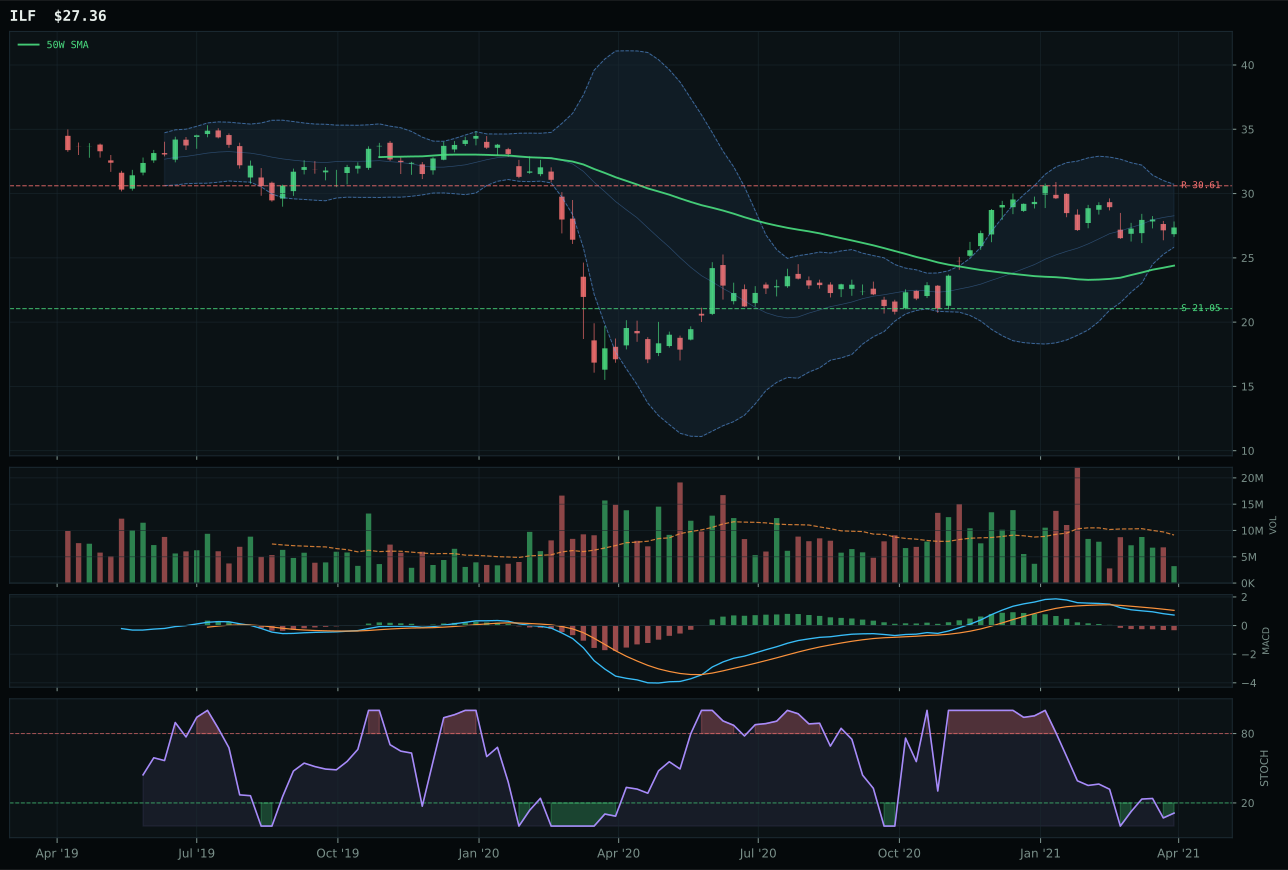
ILF has a neutral structure profile with -13.9% 13-week relative strength versus SPY.
A failed hold above support would weaken the setup.
Actionable but governed by invalidation levels.
IEMG wins the emerging-market basket on timing superiority: 62.0 timing score versus INDA's 40.0, reflecting IEMG's oversold-turn-up stochastic setup versus INDA's flat oversold reading. The structure is nearly identical (73.8 vs 72.0), but IEMG's 4.9% 13W and neutral category-relative strength at 0.0% edge INDA by 5.9 points on technical merit. Neither has momentum; IEMG's 42.2 confirmation and INDA's 38.0 are both weak, meaning this is a value-reversion play, not a trend continuation. IEMG's setup suggests a higher-probability bounce from oversold extremes, which justifies the representative role despite both ETFs carrying negative SPY-relative returns of -2.3% and -1.8%.
Emerging Markets is excluded from allocation entirely at 0%, ranked outside the portfolio with an 11.4 category score. The macro fit is disastrous at 25.0/100: dollar pressure is active (-14), credit stress is active (-10), and broad market bear is active (-9), all of which crush EM valuations and flows. Risk appetite positive (+8) and commodity breadth provide minimal offset. The technical evidence of 34.1/100 on IEMG is middling—oversold timing is not enough when macro winds are this negative. For Emerging Markets to earn even a 5% tier-3 slot, the dollar would need to weaken materially, credit stress would need to recede, and broad market bear would need to flip. Currently none of those conditions hold; EM is a tactical contrarian opportunity, not an allocation-worthy position. It will move back onto the board when the regime shifts toward dollar weakness and risk appetite normalization.