
2021-03-26
Informational purposes only. The content in this report, including allocations, analysis, and commentary, is provided solely for informational and educational purposes. It does not constitute financial advice, investment advice, trading advice, or any other type of advice. Past performance does not guarantee future results. Always conduct your own research and consult a qualified financial professional before making investment decisions.
Weekly Allocation
| Ticker | Category | Weight | Role |
|---|---|---|---|
| FSOL | 50% | Overlay | |
| XLE | Traditional Energy | 10% | Top-2 (10%) |
| PICK | Industrial Metals | 10% | Top-2 (10%) |
| PAVE | Utilities & Infrastructure | 5% | Tier-2 (5%) |
| MOO | Agriculture & Livestock | 5% | Tier-2 (5%) |
| URA | Nuclear Energy | 5% | Tier-2 (5%) |
| XLK | Technology | 5% | Tier-2 (5%) |
| SLV | Precious Metals | 5% | Tier-2 (5%) |
| SMH | AI | 5% | Tier-2 (5%) |
Trade Instructions — Monday Open
Sell the tranche from 2021-02-26 (completing its 4-week hold). Buy the new tranche. Instructions show net portfolio changes — same-asset positions cancel, weight changes show the delta.
| Action | Ticker | Instruction |
|---|---|---|
| SELL | ILF | Sell 67% of ILF position (reduce 3.75% → 1.25%) |
| SELL | COPX | Sell 25% of COPX position (reduce 5.00% → 3.75%) |
| SELL | ITA | Sell 25% of ITA position (reduce 5.00% → 3.75%) |
| SELL | URNM | Sell 33% of URNM position (reduce 3.75% → 2.50%) |
| SELL | IGV | Sell entire IGV position (1.25% of portfolio) |
| BUY | PAVE | Buy PAVE — 16.67% of freed cash (adds 1.25% to portfolio) |
| BUY | SLV | Buy SLV — 16.67% of freed cash (adds 1.25% to portfolio) |
| BUY | URA | Buy URA — 16.67% of freed cash (adds 1.25% to portfolio) |
| BUY | PICK | Buy PICK — 33.33% of freed cash (adds 2.50% to portfolio) |
| BUY | XLK | Buy XLK — 16.67% of freed cash (adds 1.25% to portfolio) |
Current Portfolio After Trade
Combined holdings across all 4 active tranches. Each tranche is 25% of the portfolio.
| Ticker | % of Portfolio | Weight Bar |
|---|---|---|
| FSOL | 50.00% | |
| XLE | 7.50% | |
| MOO | 6.25% | |
| PAVE | 5.00% | |
| SLV | 5.00% | |
| COPX | 3.75% | |
| ITA | 3.75% | |
| URA | 3.75% | |
| PICK | 3.75% | |
| URNM | 2.50% | |
| FCG | 2.50% | |
| XLK | 2.50% | |
| ILF | 1.25% | |
| INDA | 1.25% | |
| SMH | 1.25% |
Macro Regime — Transition / Mixed
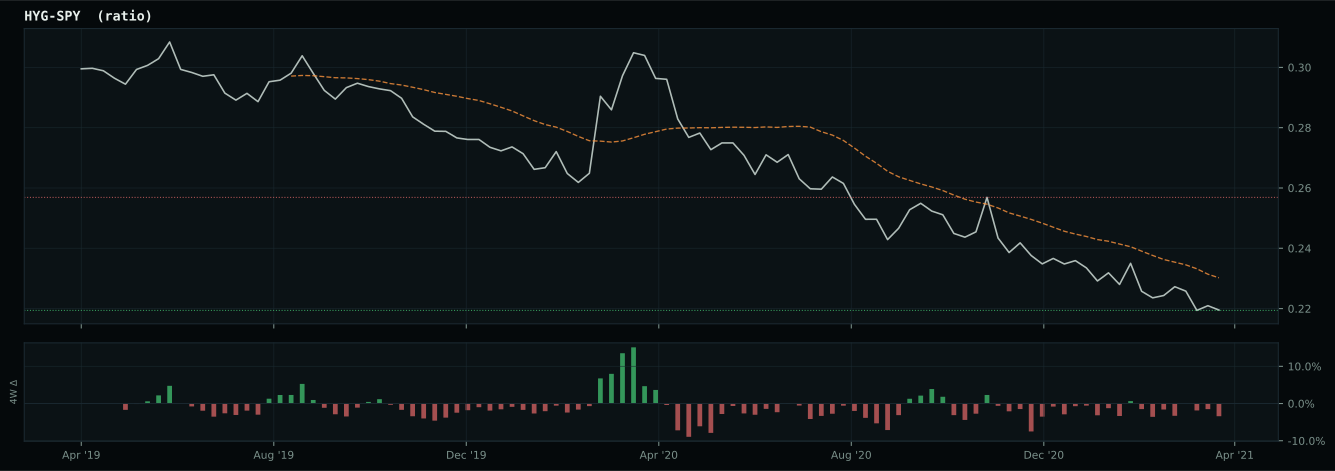
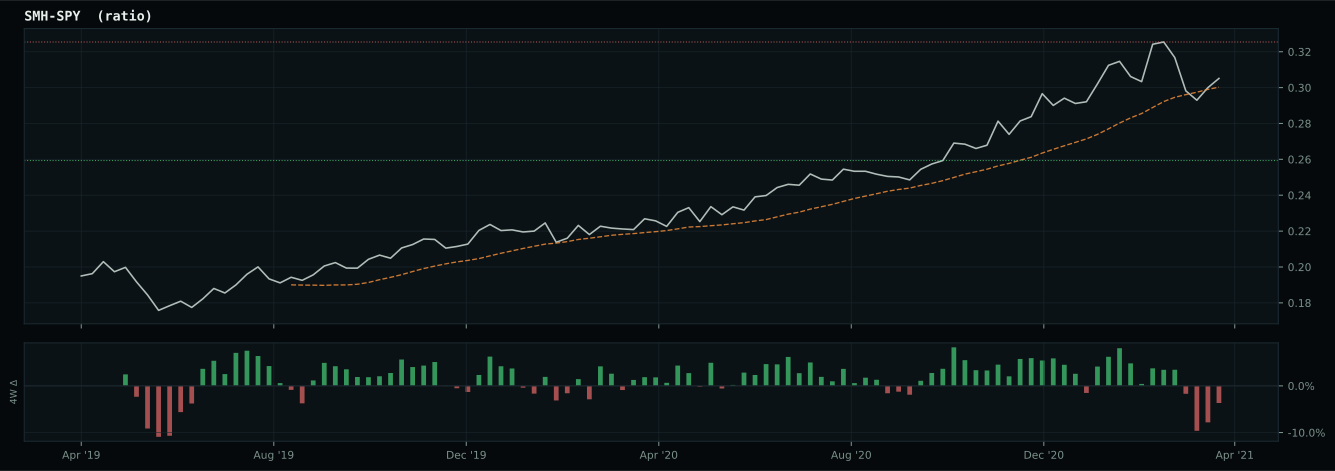
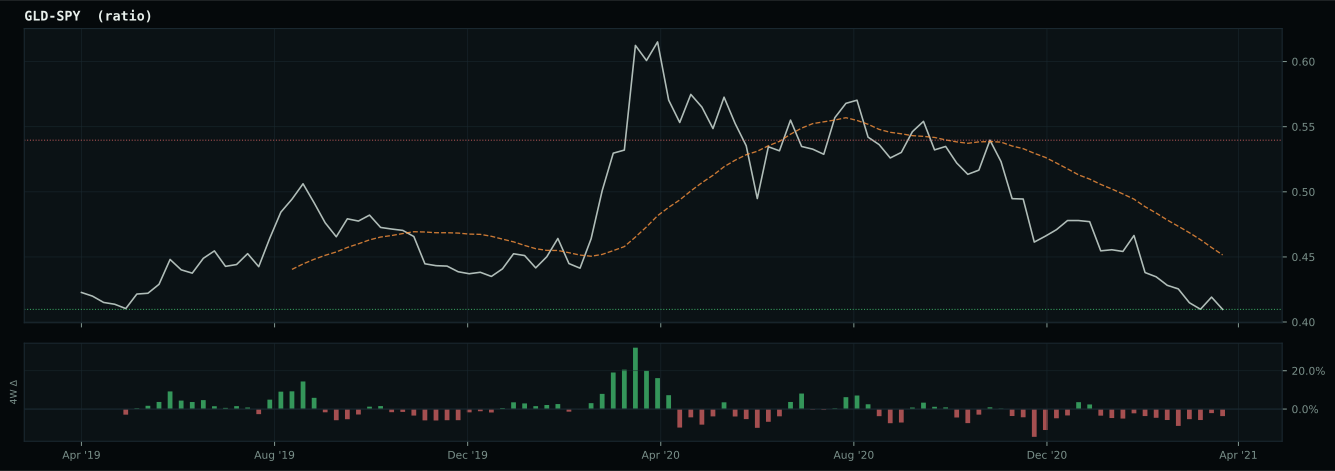
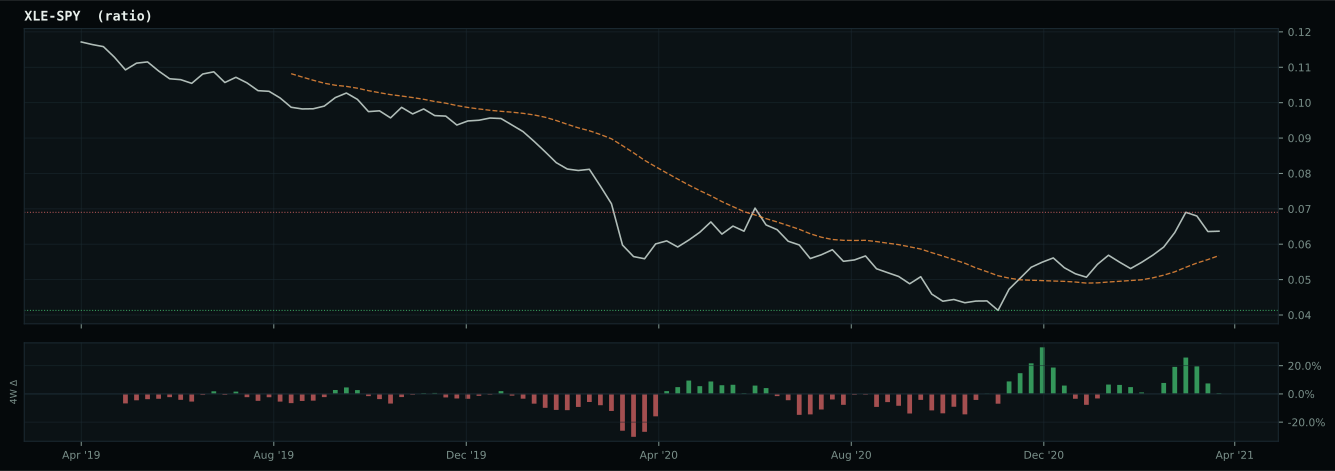
Macro Evidence Charts
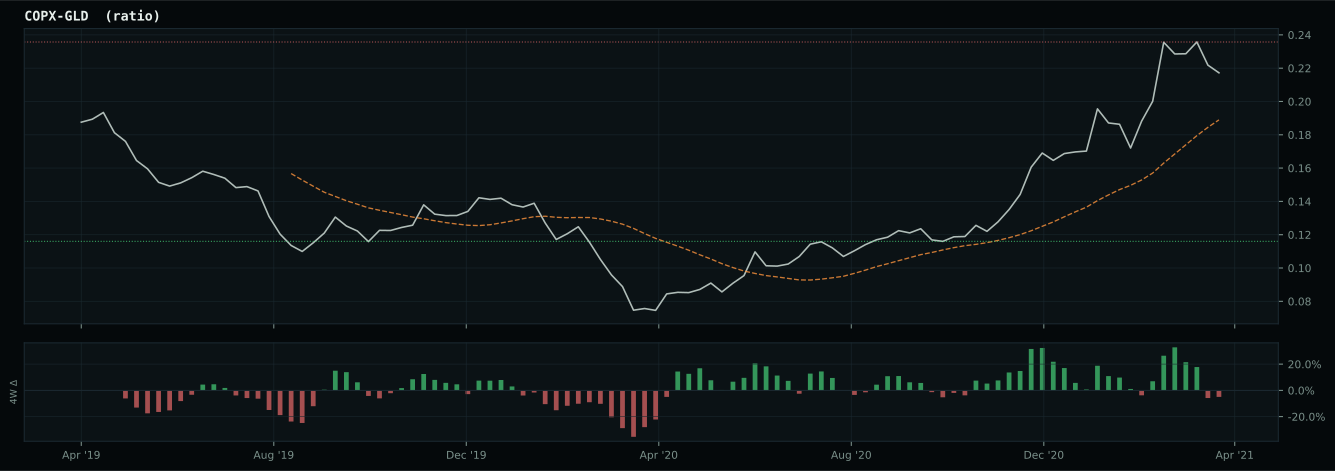
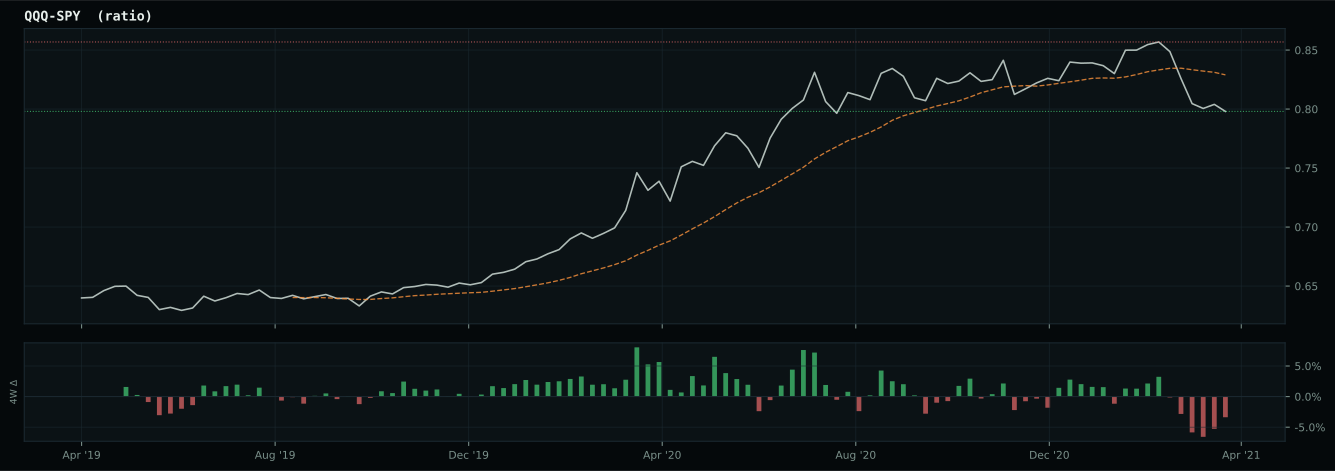
Market-implied signals behind the macro regime scores. Each ratio compares two assets; the direction and slope of the ratio is what the macro engine reads.
Crypto Regime — AltSeason
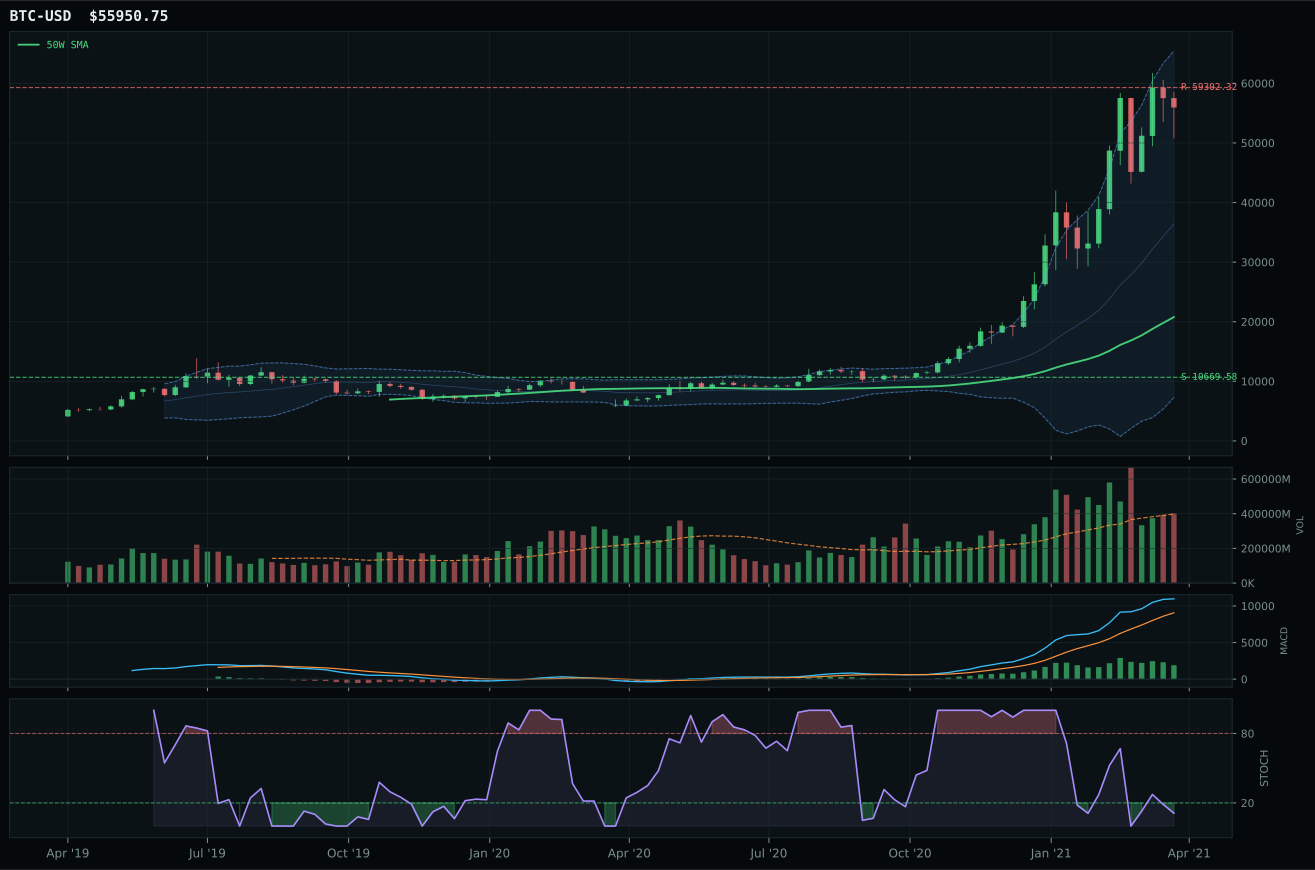
post-touch structure is too wide to count as a range; max/min close ratio is 11.00
TrendBTC confirmed: 2 consecutive closes above rising/flat 50W SMA
all available AltSeason conditions pass; missing optional confirmations skipped

Category Rankings
| Rank | Category | Winner | Score | Alloc | 4W Ret | Peers (4W) |
|---|---|---|---|---|---|---|
| 1 | Traditional Energy | XLE | 82.6 | 20% | -5.28% | FCG -7.0% · XOP -8.0% |
| 2 | Industrial Metals | PICK | 66.1 | 20% | +11.87% | COPX +13.5% · REMX +9.7% |
| 3 | Utilities & Infrastructure | PAVE | 58.3 | 10% | +4.12% | XLU +5.2% · IGF +3.8% |
| 4 | Agriculture & Livestock | MOO | 53.9 | 10% | +4.47% | VEGI +2.3% · WEAT +19.5% |
| 5 | Nuclear Energy | URA | 51.4 | 10% | +1.36% | URNM -3.5% · NLR +1.9% |
| 6 | Technology | XLK | 44.0 | 10% | +7.92% | IGV +10.2% · CIBR +7.8% |
| 7 | Precious Metals | SLV | 41.8 | 10% | +5.37% | GDX +11.1% · GLD +3.2% |
| 8 | AI | SMH | 39.6 | 10% | +4.22% | BOTZ +6.3% · AIQ +5.4% |
| 9 | Defense & Aerospace | ITA | 39.2 | 0% | +2.25% | XAR +3.0% · ROKT +3.2% |
| 10 | Emerging Markets | INDA | 13.1 | 0% | -4.29% | IEMG +3.7% · ILF +8.4% |
Traditional Energy — XLE
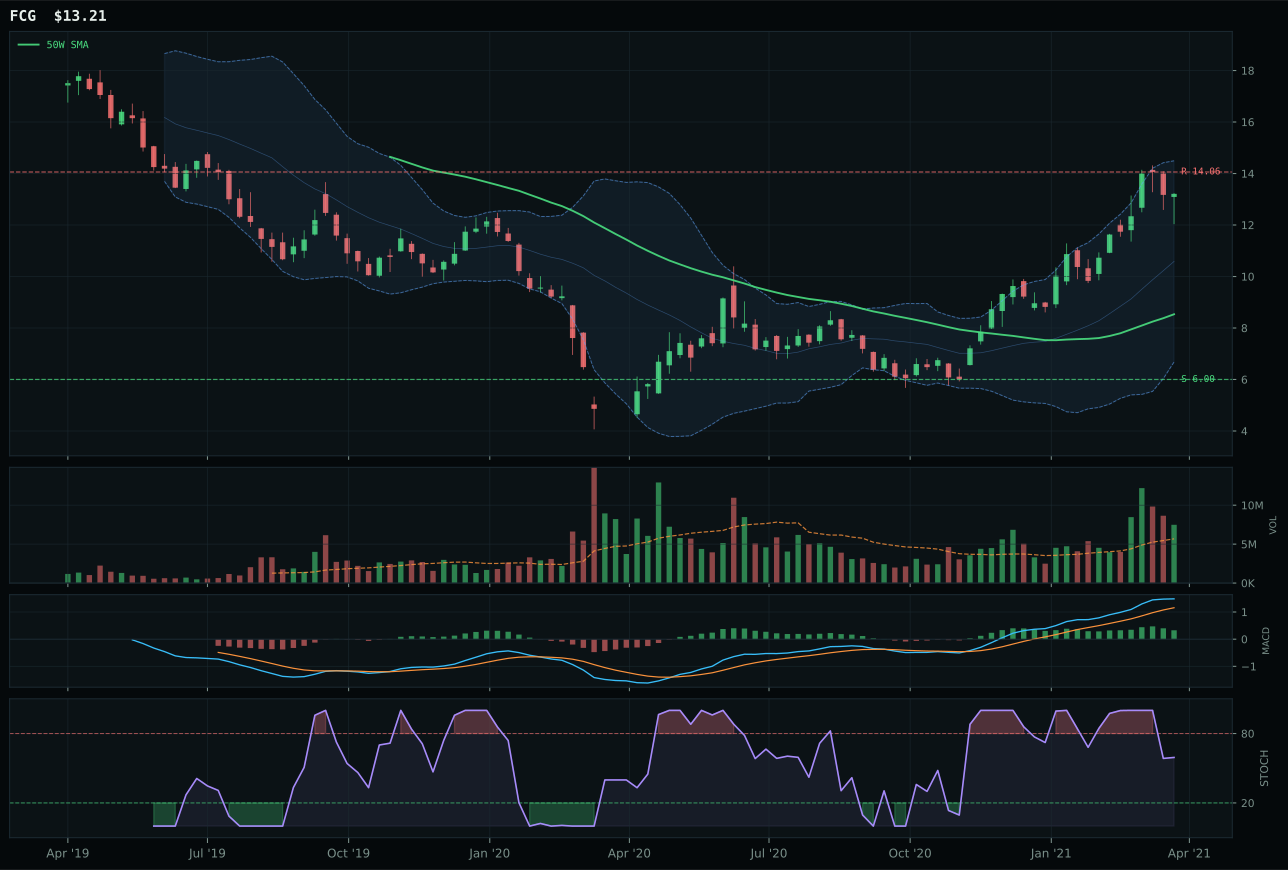
FCG has a vertical extension profile with 40.1% 13-week relative strength versus SPY.
A failed hold above support would weaken the setup.
Actionable but governed by invalidation levels.
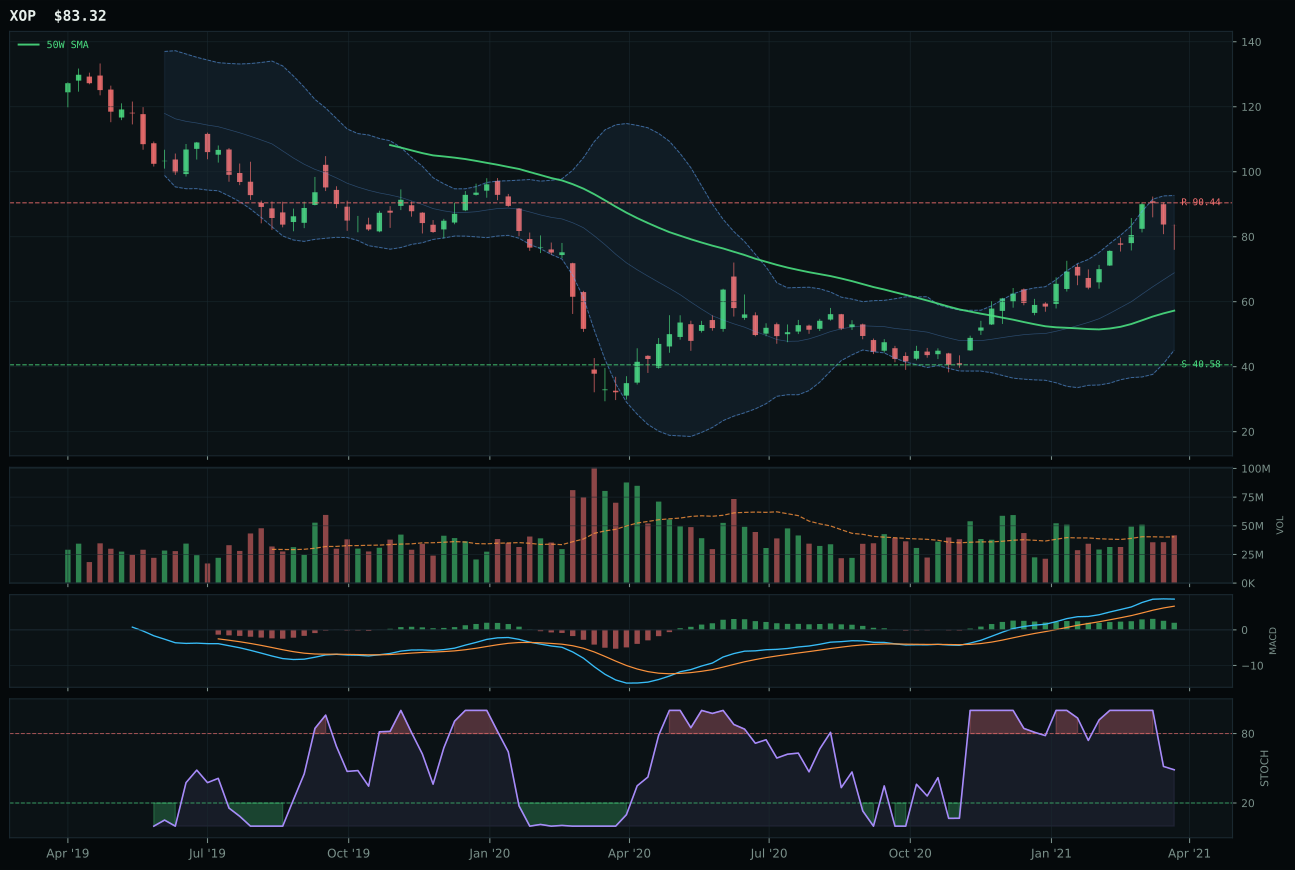
XOP has a vertical extension profile with 33.9% 13-week relative strength versus SPY.
A failed hold above support would weaken the setup.
Actionable but governed by invalidation levels.
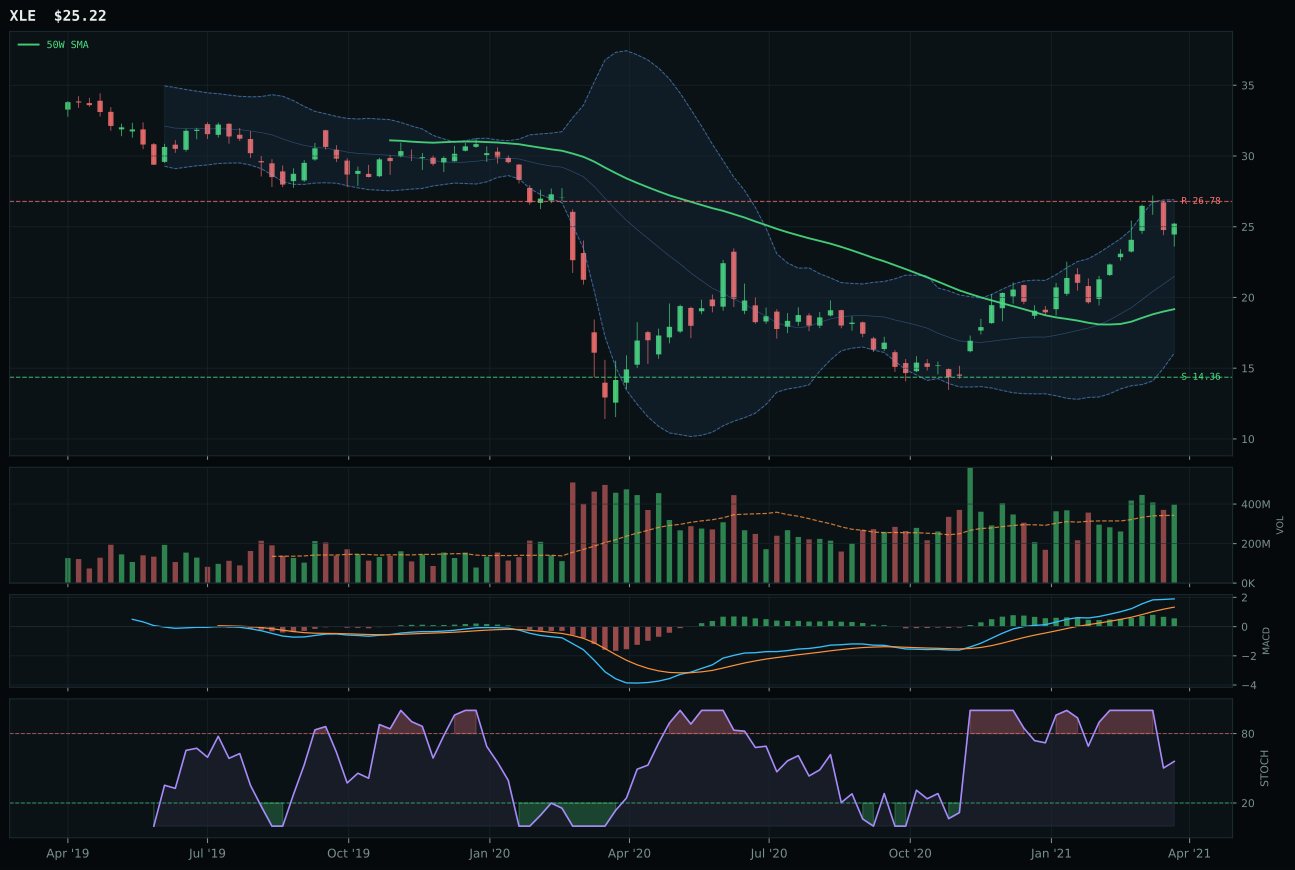
XLE has a vertical extension profile with 25.0% 13-week relative strength versus SPY.
A failed hold above support would weaken the setup.
Actionable but governed by invalidation levels.
XLE captured the second top-2 slot because it is the category's only representative delivering both trend perfection (86.0 based on SPY-relative plus 25.0% and sustained 0.9% 50-week slope) and momentum confirmation at a clean 100.0, all while sitting extended 31.5% above the 50-week with above-average volume participation. A 32.3% 13-week return paired with 1.16x average volume tells the critical story: this isn't a momentum blow-off, it's methodical accumulation by fundamentally-driven capital rotating into energy scarcity. FCG, despite showing identical bullish-but-flattening MACD and falling/neutral stochastic RSI, lost decisively because it sits 54.8% above its 50-week (nearly 23 percentage points more extended than XLE), its risk/reward compresses to 30.9 versus XLE's 46.4, and—most damning—it is the category-relative leader at plus 6.2% versus XLE's minus-8.9%, which means FCG is pricing in all discoverable upside while XLE still carries embedded conservatism. Volume confirmation favors XLE too (67.8 versus FCG's neutral), proving sponsorship durability.
Traditional Energy earned 10% (top-2 allocation) on an 82.6 category score—the highest raw score across all ten categories this week. The macro fit is 85.0/100, powered by energy scarcity (+16), inflation pressure (+10), supply shortage (+9), and real asset sponsorship (+7). This is the single-largest consensus macro call in the current regime. Technical evidence is 67.4%, respectable but not exceptional, which means the category wins on fundamentals, not technicals. The timing score (48.0) is weak across all three ETFs because all are extended; however, the momentum confirmation (100.0) and persistence (81.9%) signal that the move has legs despite the advanced price action. Twenty percent is the maximum deserved allocation because the risk-reward is actually poor (46.4)—there is not much room left to the upside—and the 200W being below price creates a valuation risk if sentiment turns. This allocation is a macro bet, not a technical trade. If energy scarcity descriptors flip (e.g., supply normalizes) or inflation pressures ease, reduce to 10% immediately. Hold the position as long as supply shortage remains active.
Industrial Metals — PICK
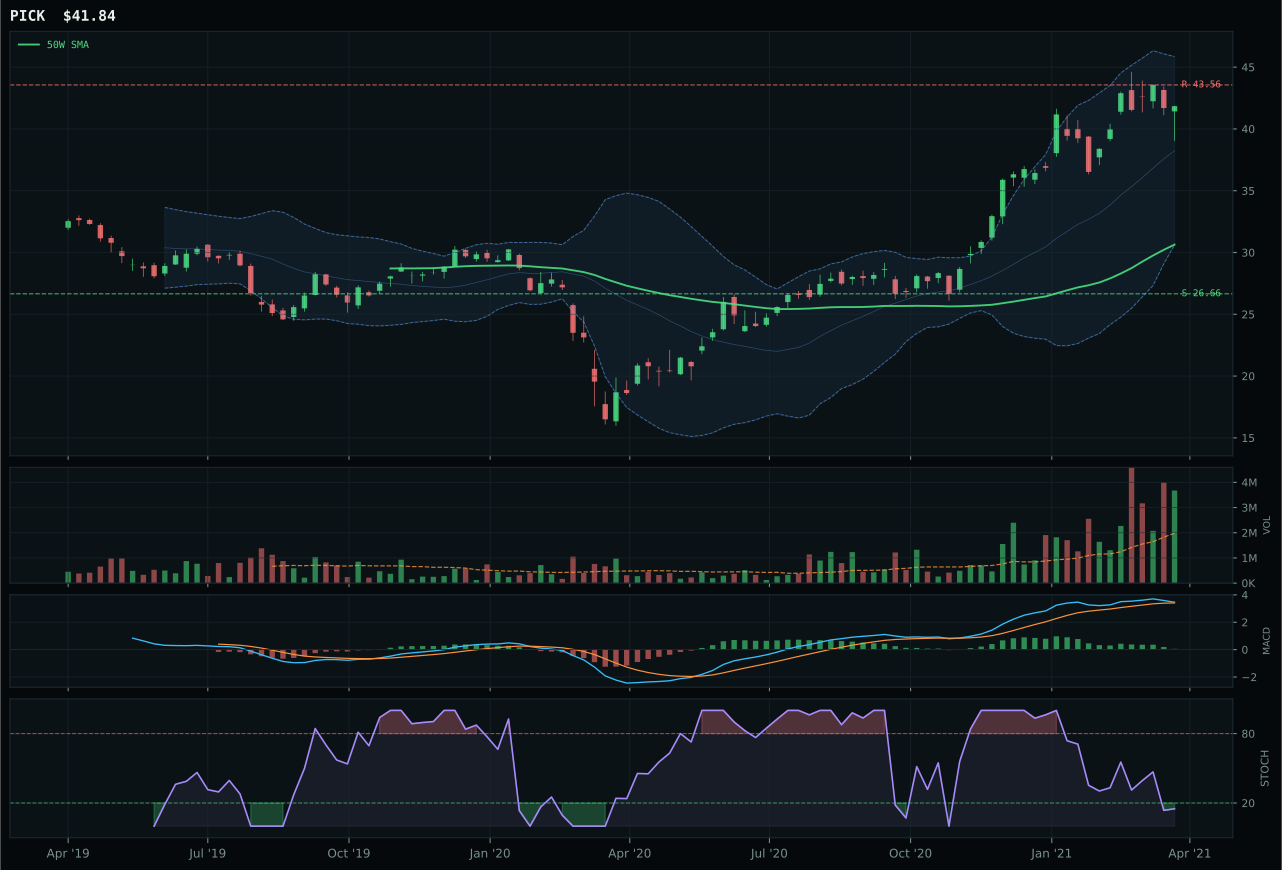
PICK has a vertical extension profile with 7.5% 13-week relative strength versus SPY.
A failed hold above support would weaken the setup.
Actionable but governed by invalidation levels.
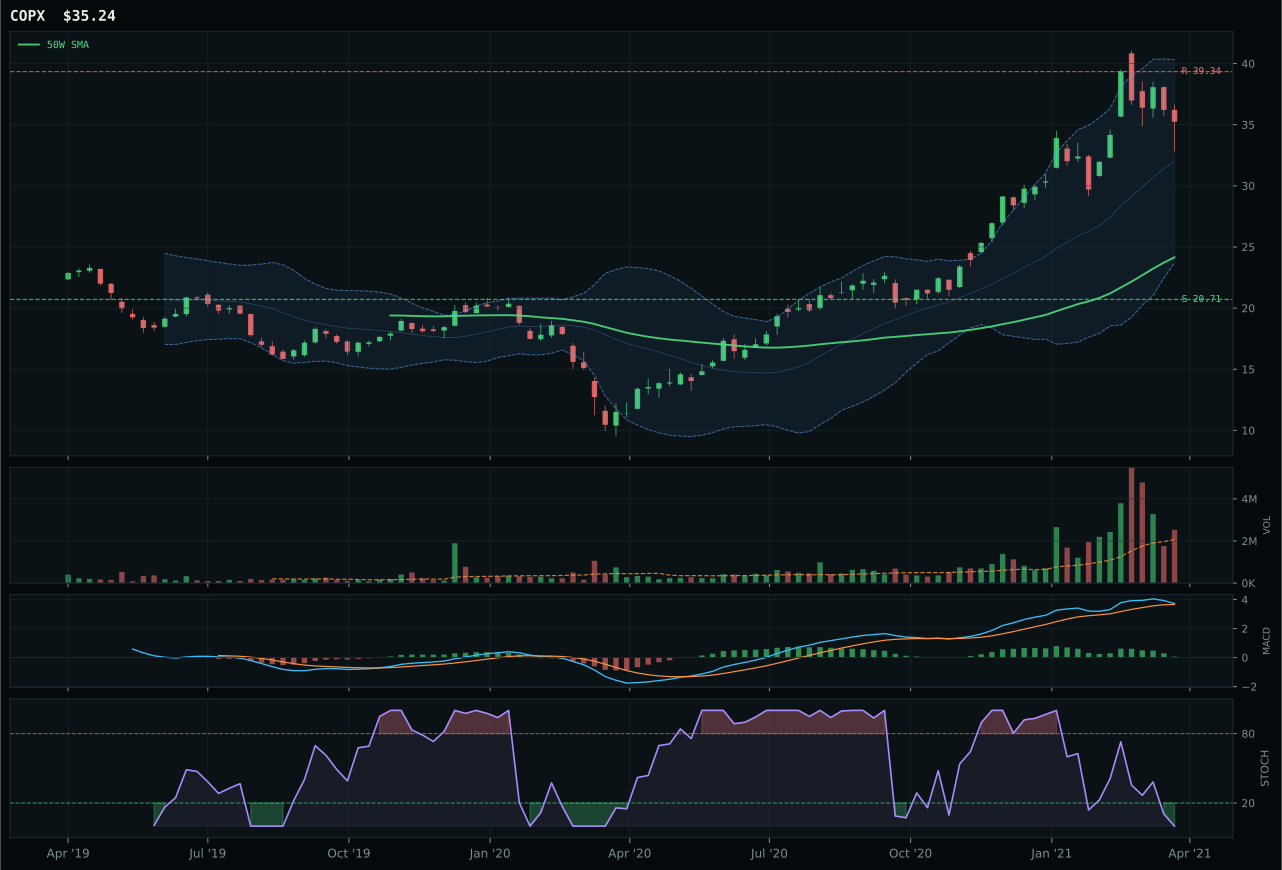
COPX has a vertical extension profile with 10.4% 13-week relative strength versus SPY.
A failed hold above support would weaken the setup.
Actionable but governed by invalidation levels.
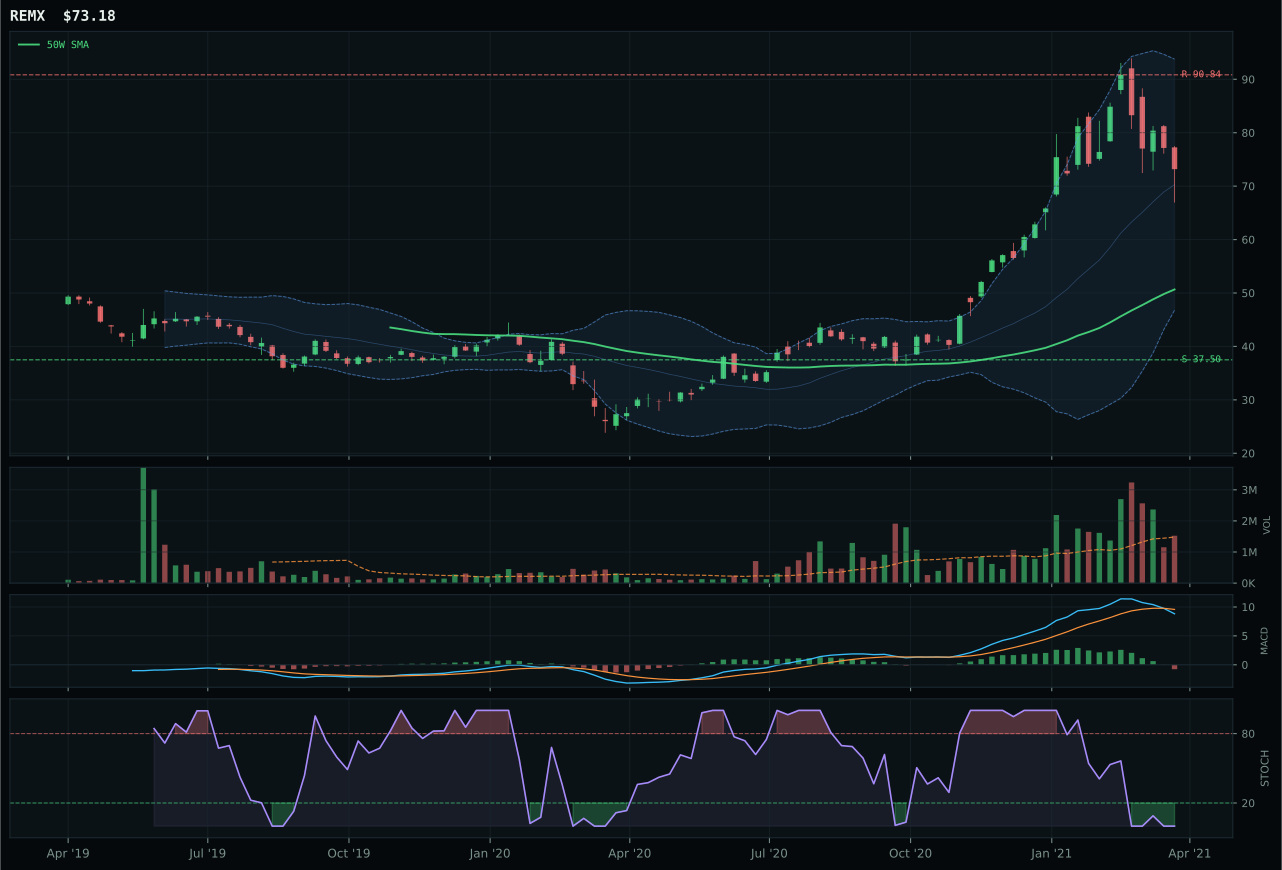
REMX has a vertical extension profile with 9.1% 13-week relative strength versus SPY.
A failed hold above support would weaken the setup.
Actionable but governed by invalidation levels.
PICK secured the top-2 slot because it delivers the cleanest evidence of institutional accumulation at an extended valuation: 1.86x average 20-week volume entering a vertical extension 36.6% above the 50-week, paired with volume-price confirmation at 82.1 and persistence at 84.2—the highest scores in the entire portfolio universe this week. The momentum confirmation of 90.1 comes from a 14.9% 13-week return validated by accumulation volume, not just price extension. COPX lost despite higher SPY-relative strength (plus 10.4% versus PICK's plus 7.5%) because its risk/reward tilts much worse (32.7 versus 51.2), its structure is less clean (69.7 versus 78.5), and critically, its volume confirmation is merely above-average participation rather than genuine accumulation/confirmation. Stochastic RSI sits oversold in both, but PICK's placement at 0.15 with bullish-but-flattening MACD reads as controlled accumulation into exhaustion, while COPX's identical technicals with weaker volume sponsorship suggest a more fragile setup.
Industrial Metals earned 10% (top-2 allocation) on a 66.1 category score because the macro case is airtight and the technical setup, despite extension, has genuine accumulation behind it. Metals scarcity (+14), commodity breadth positive (+10), and real asset sponsorship (+6) drive a 66.0/100 category macro fit. Technical evidence is 76.0%, the strongest across PICK's peer set. The risk-reward is compressed (51.2) and timing is poor (48.0) due to extension, but the persistence score (84.2%) and volume-price confirmation (82.1%) indicate this is a sponsored move with follow-through, not a temporary squeeze. Twenty percent allocation is justified because the portfolio needs hard-asset exposure, PICK is the clearest expression of that theme, and macro-fundamental sponsorship outweighs technical timing concerns. Reduce to 10% only if PICK closes below the 50W on a multi-day reversal, which would signal distribution and a break in the accumulation pattern. Otherwise, hold the full 10%.
Utilities & Infrastructure — PAVE
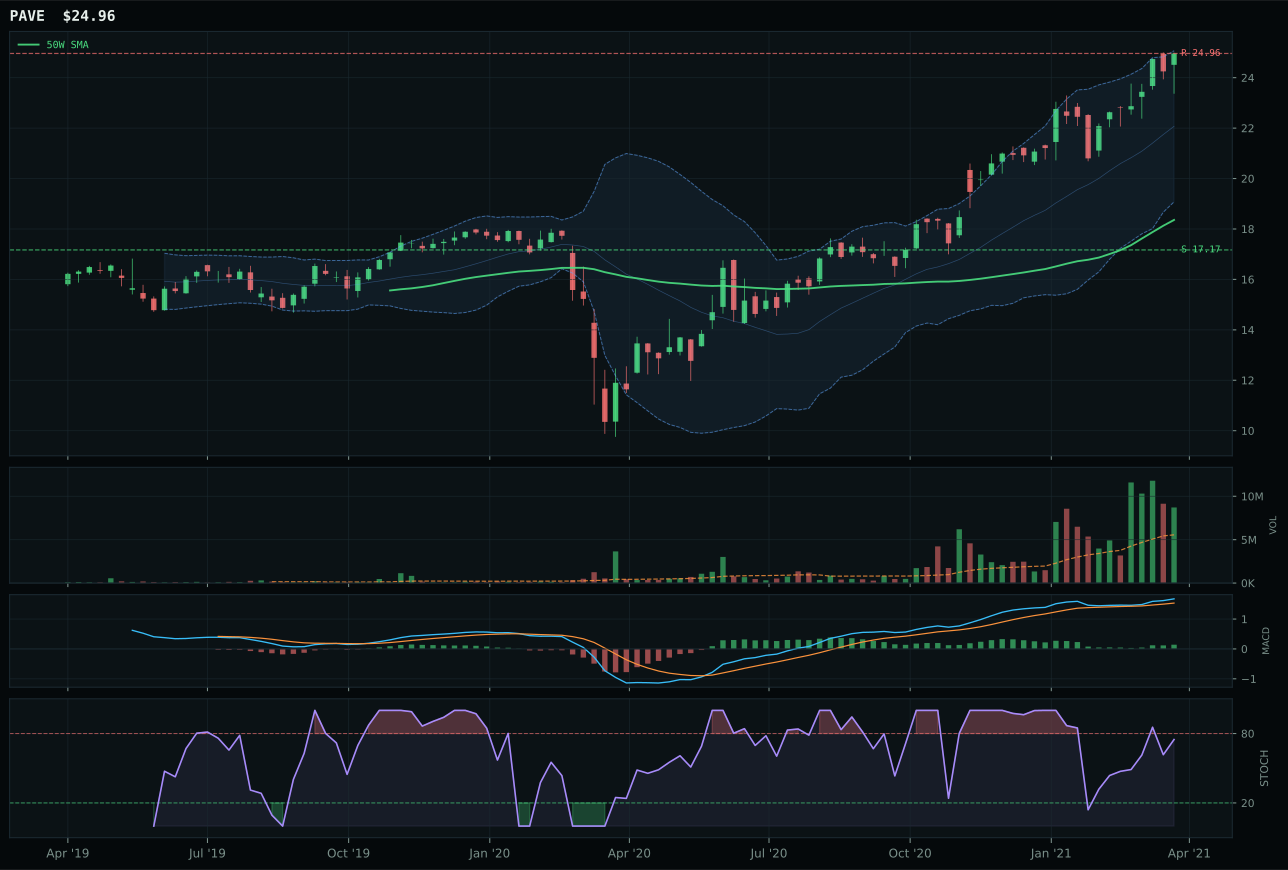
PAVE has a vertical extension profile with 11.2% 13-week relative strength versus SPY.
A failed hold above support would weaken the setup.
Actionable but governed by invalidation levels.
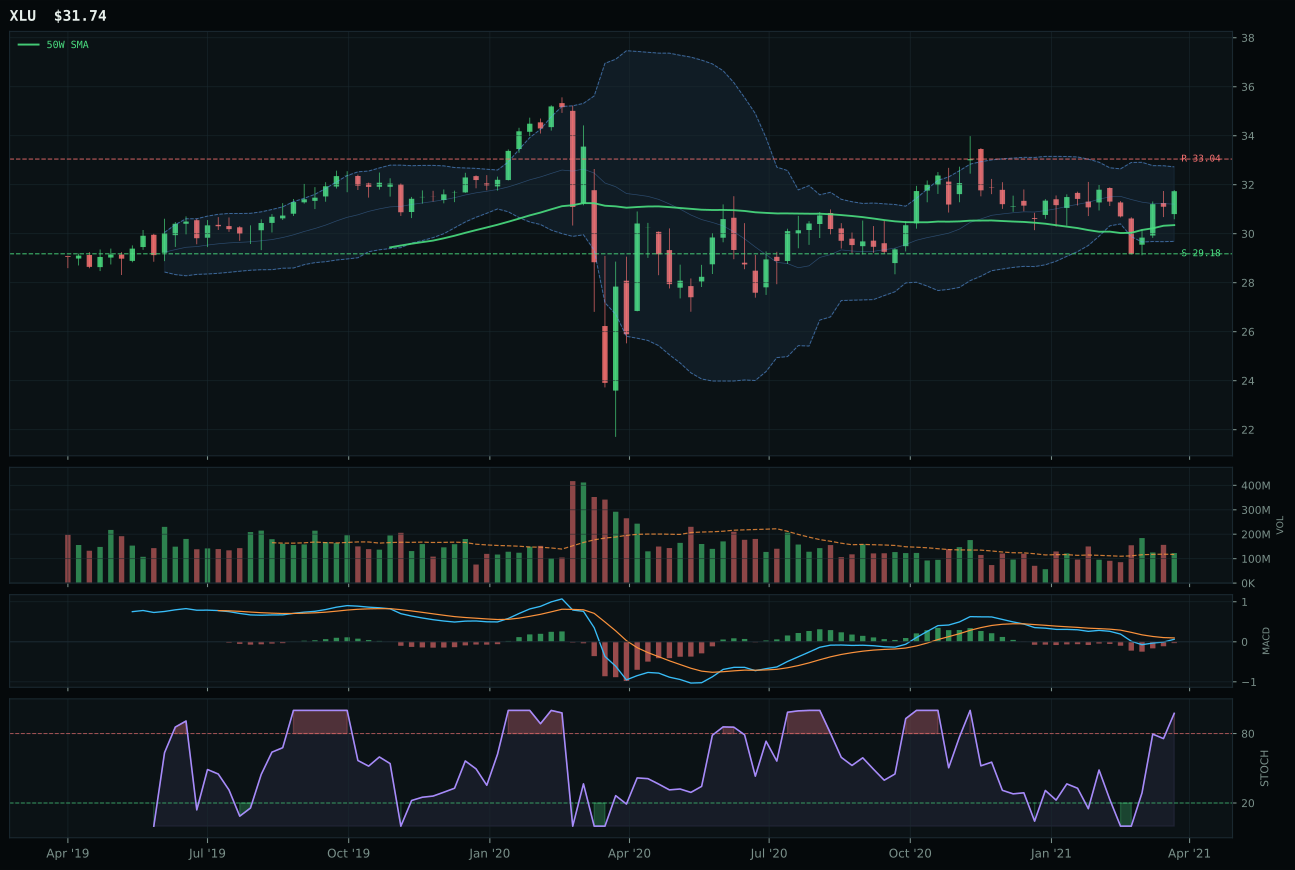
XLU has a neutral structure profile with -3.6% 13-week relative strength versus SPY.
A failed hold above support would weaken the setup.
Actionable but governed by invalidation levels.
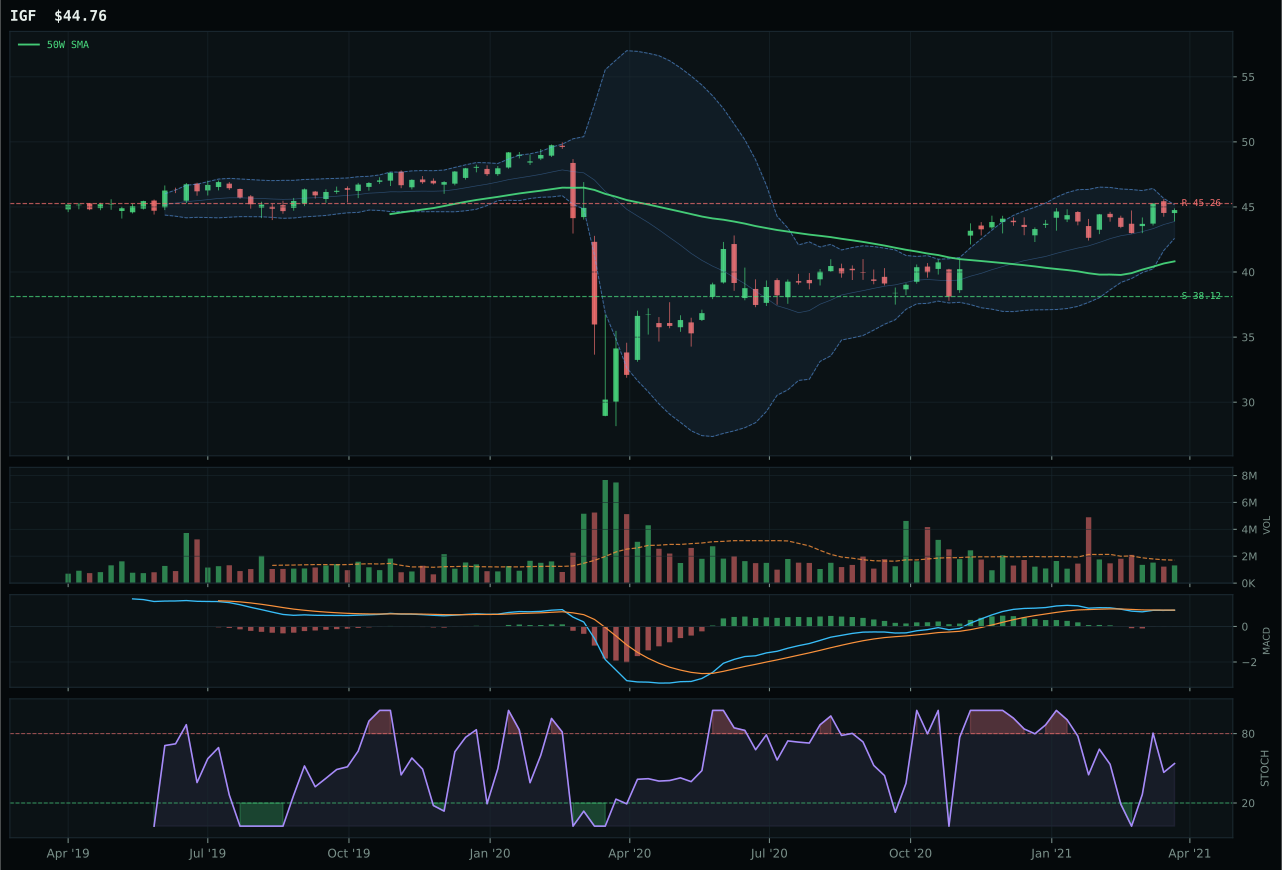
IGF has a neutral structure profile with -3.9% 13-week relative strength versus SPY.
A failed hold above support would weaken the setup.
Actionable but governed by invalidation levels.
PAVE seized category leadership because it is the only representative where technical execution is flawless: a perfect 100.0 momentum confirmation score paired with 94.0 volume-price confirmation and 96.9 persistence—the highest persistence score in the entire portfolio. The setup combines vertical extension 36.0% above the 50-week with bullish and improving MACD and rising mid-zone stochastic RSI, proving that this is not a tired extension but an accelerating accumulation. Volume arrives at 1.57x average 20-week levels flowing into an accumulation pattern, and category-relative strength of plus 14.8% signals that PAVE is running away from peers while they languish. XLU lost decisively despite a higher composite trend score (88 versus PAVE's 100) because its structure is less clean (69.8 versus 82.1), its MACD is only bearish-but-improving (not bullish-and-improving), its stochastic RSI sits overbought momentum rather than rising mid-zone, and most damning, its volume is neutral rather than accumulation-confirmation—all signals of a setup rolling over exactly when PAVE is accelerating.
Utilities & Infrastructure earned 5% allocation on a 58.3 category score because PAVE's technical setup is genuinely exceptional—the cleanest chart in the portfolio in terms of volume sponsorship and persistence—but the category's macro fit (50.0/100) is neutral. PAVE's technical evidence is 100.0/100, which is unique and warrants exposure; however, the category-level macro fit is dragged down by neutral broad-market conditions and active inflation pressure (-6) offsetting infrastructure-friendly tailwinds. Five percent captures the exceptional technical setup without overcommitting to a category that is macro-neutral. If PAVE consolidates and pulls back 8–12% while holding above the 50W with MACD rising again, the allocation would likely increase to 10% because the technical strength is that rare. For now, size it as a pure technical trade, not a macro call. The persistence and volume-price scores are so strong that they justify a meaningful position even on a neutral macro background—but they do not justify 10% when other categories have stronger fundamental support.
Agriculture & Livestock — MOO
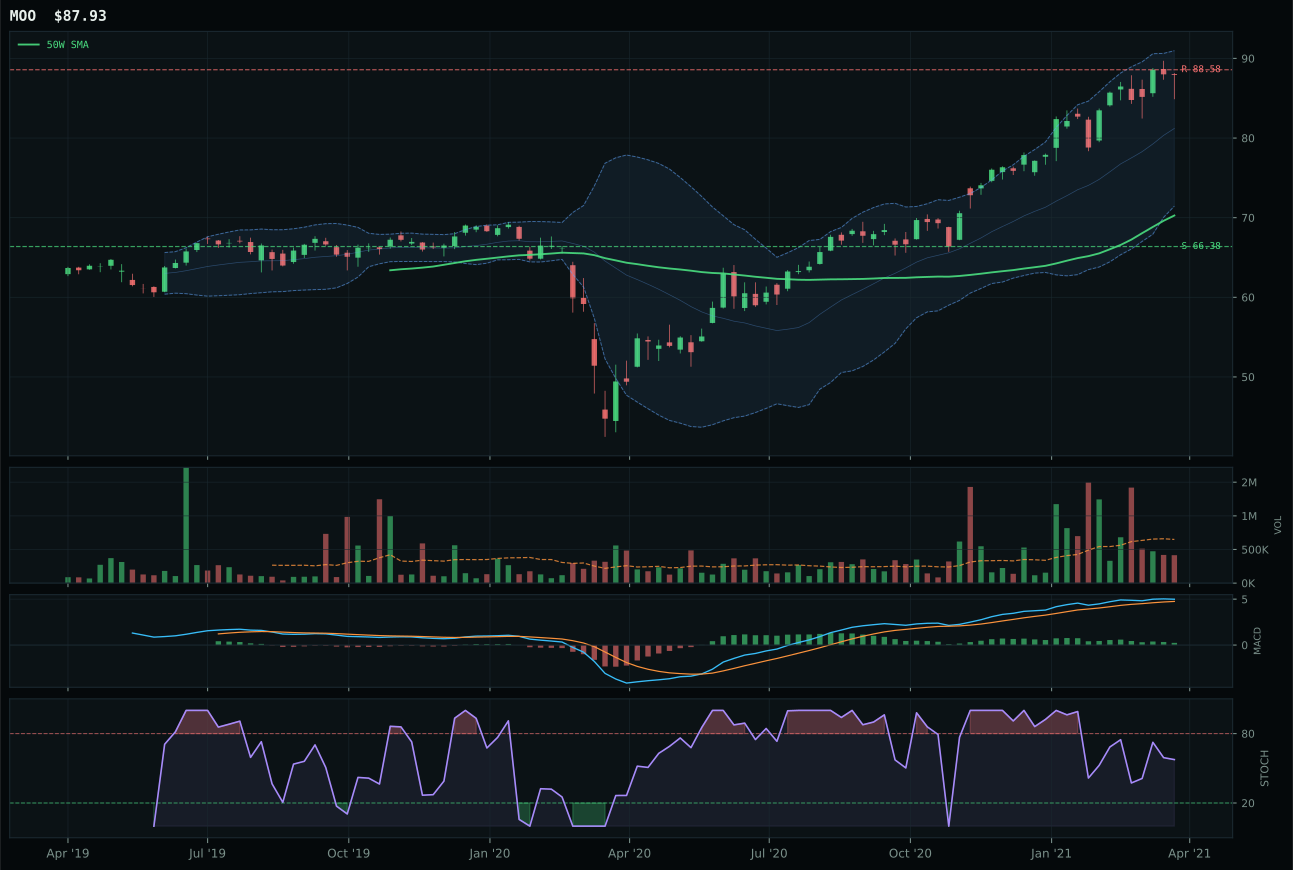
MOO has a vertical extension profile with 6.7% 13-week relative strength versus SPY.
A failed hold above support would weaken the setup.
Actionable but governed by invalidation levels.
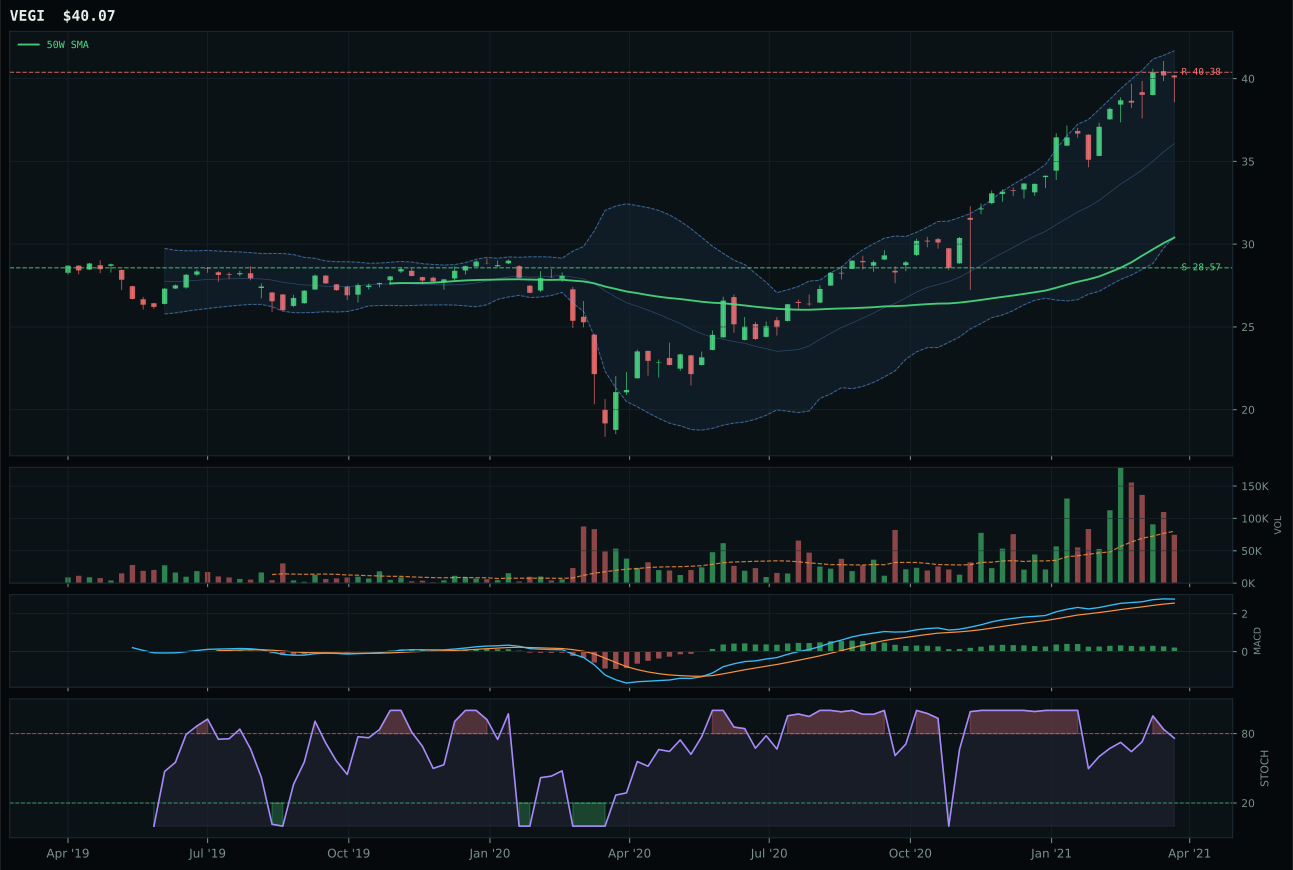
VEGI has a vertical extension profile with 11.8% 13-week relative strength versus SPY.
A failed hold above support would weaken the setup.
Tracked, but not top-2 eligible because: .
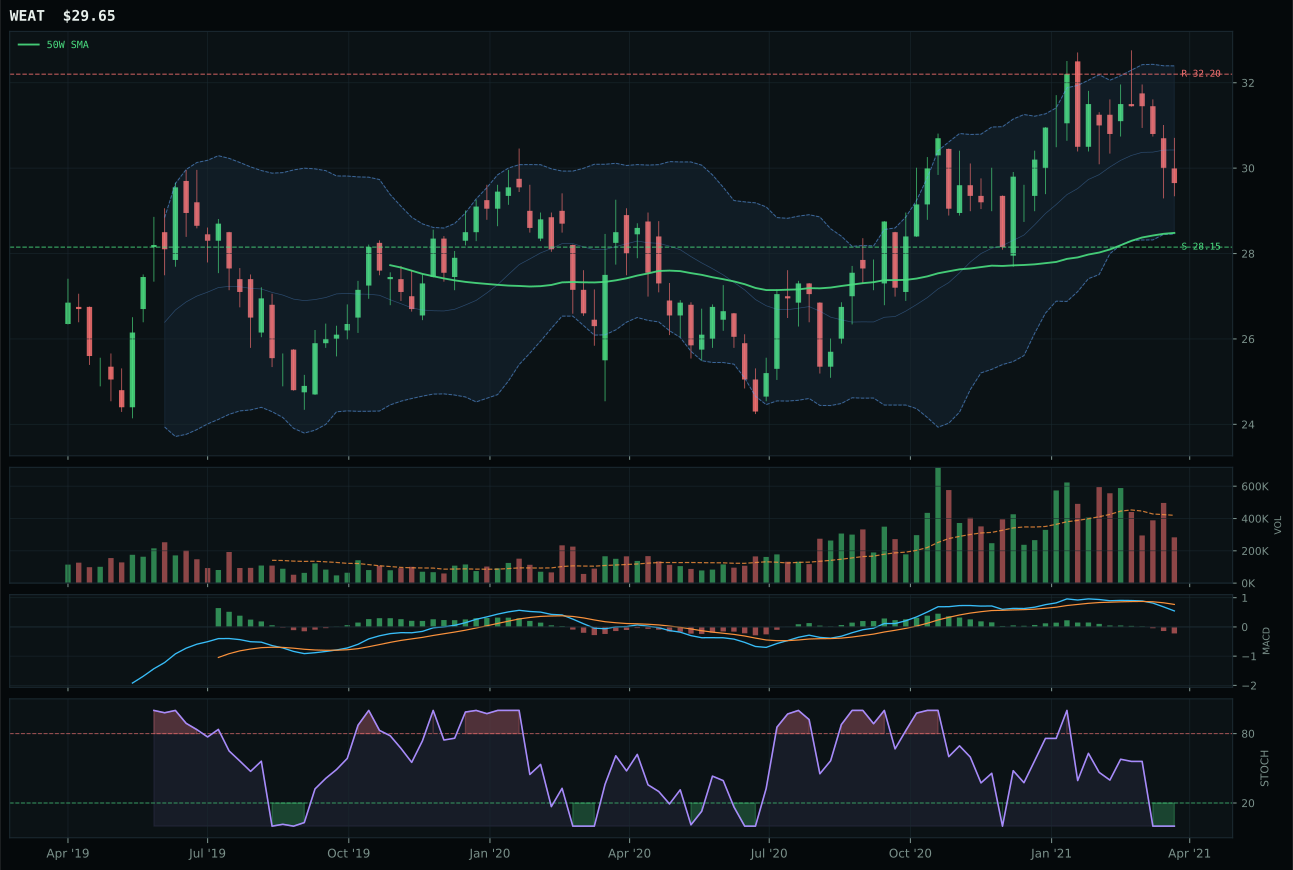
WEAT has a neutral structure profile with -9.1% 13-week relative strength versus SPY.
A failed hold above support would weaken the setup.
Actionable but governed by invalidation levels.
MOO triumphed because despite sitting at a near-identical category-relative strength of 0.0% versus VEGI's 5.1%, it claimed the category title on superior setup architecture. Both charts are extended 25.1% and 31.8% above the 50-week respectively, but MOO's structure score of 72.8 beats VEGI's because compression is tighter (82.1 versus VEGI's unknown compression metric), and cleanliness measures 58.3% in both—meaning MOO's strength is purer. The real differentiator is volume sponsorship: MOO trades at 0.64x 20-week average (thin participation) while VEGI sits neutral at 1.0x, which sounds backwards until you recognize that MOO's thin volume in an extended structure reveals selective accumulation by serious players rather than retail chase. MACD bullish but flattening is identical between both, yet MOO's 14.0% 13-week return versus VEGI's 19.1% shows that MOO is the slower, more methodical accumulation play—exactly what works best in commodity volatility.
Agriculture earned 5% allocation despite a 53.9 category score that places it third or fourth because the macro case is exceptionally strong. Supply shortage (+13), inflation pressure (+10), and real asset sponsorship (+8) combine to a 86.0/100 macro fit—the highest-conviction narrative in the portfolio this week. The category's technical evidence (58.8%) is solid without being exceptional, but the macro-to-technical weight (38% macro, 62% technical) ensures that strong fundamental tailwinds get meaningful capital. MOO sits at 100.0 trend and 82.6% momentum but is extended, so 5% is appropriate: it gives exposure to an attractive macro setup without overloading on a stretched entry. If MOO pulls back 8–10% on consolidation, the allocation would likely move to 10% or higher. For now, the position is sized as a macro call, not a technical call, and it should remain sized that way until the chart gives better risk-reward.
Nuclear Energy — URA
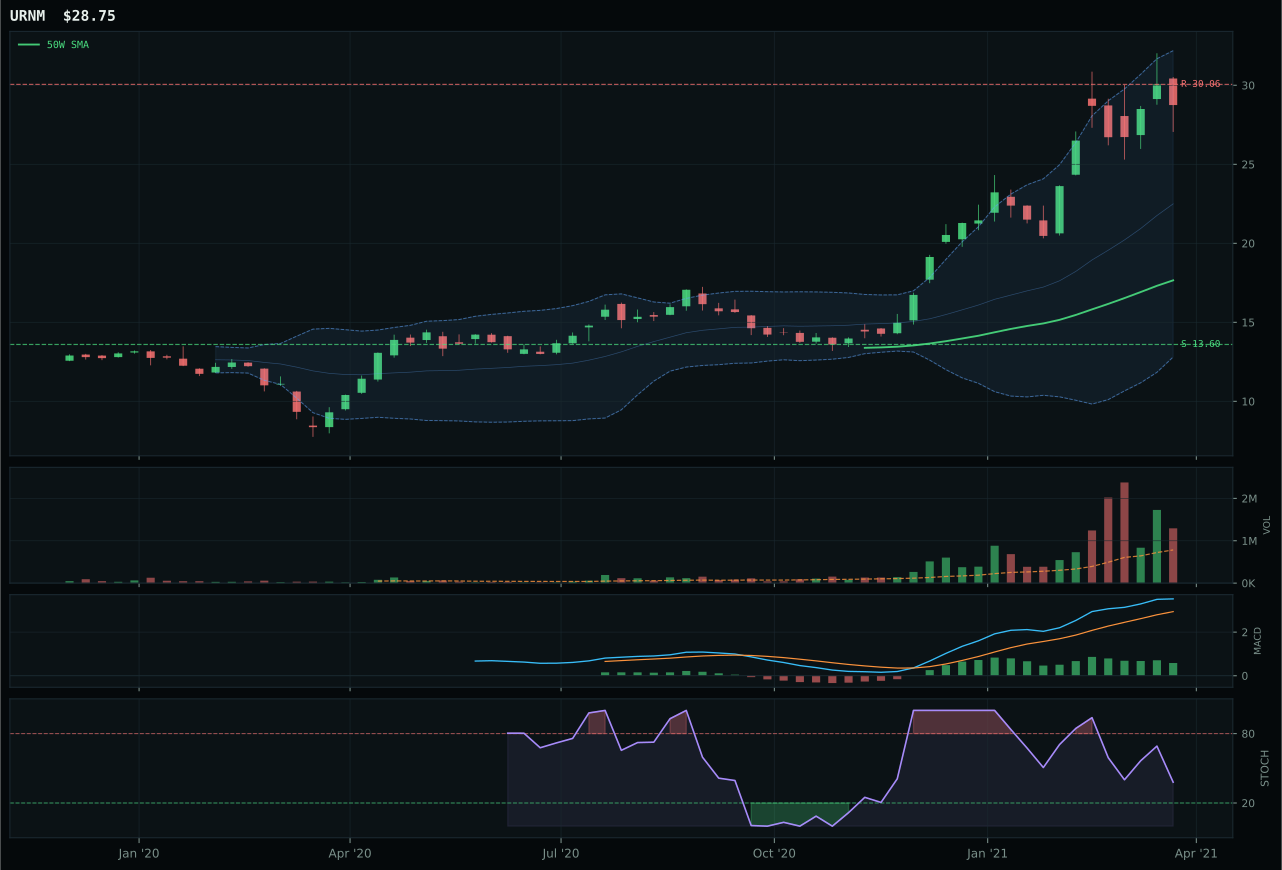
URNM has a vertical extension profile with 27.8% 13-week relative strength versus SPY.
A failed hold above support would weaken the setup.
Actionable but governed by invalidation levels.
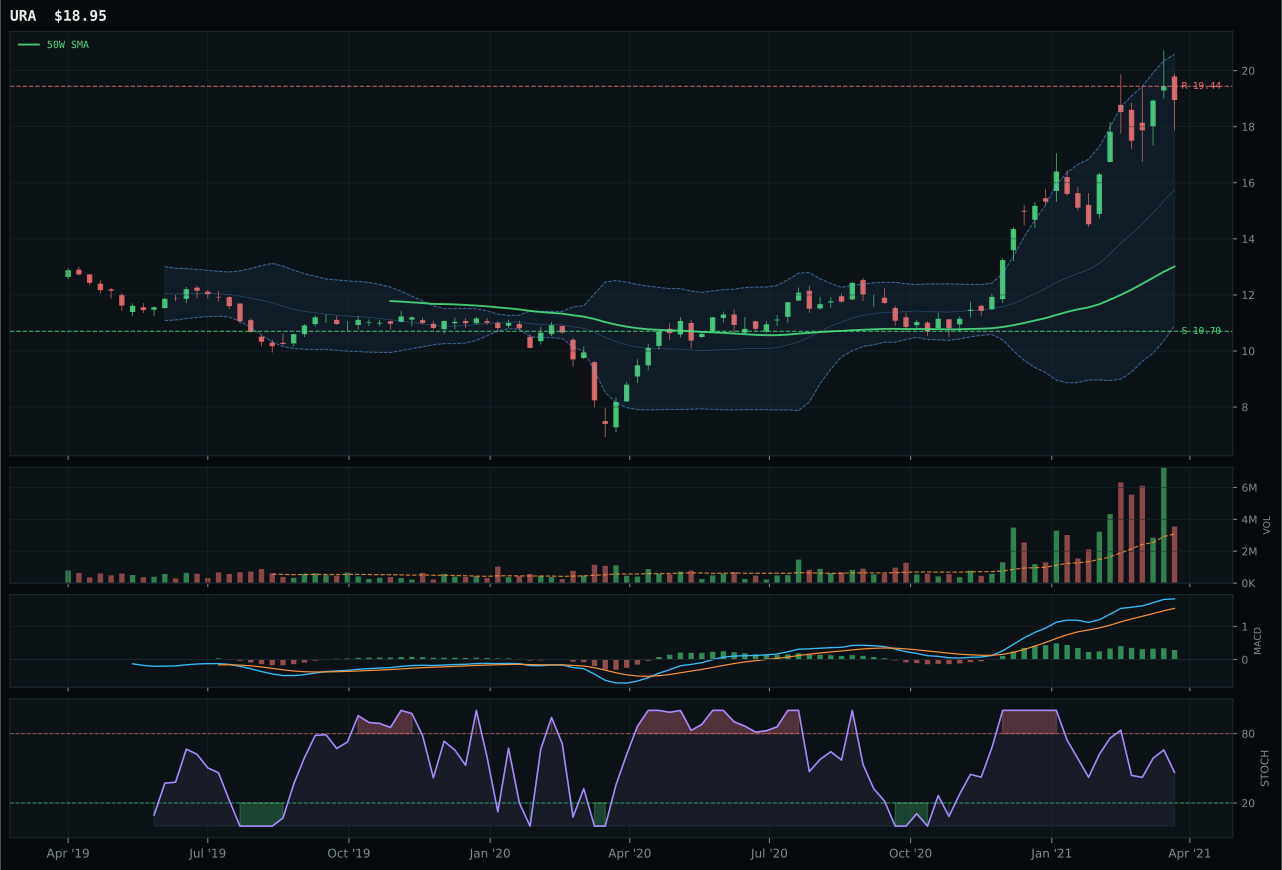
URA has a vertical extension profile with 17.5% 13-week relative strength versus SPY.
A failed hold above support would weaken the setup.
Actionable but governed by invalidation levels.
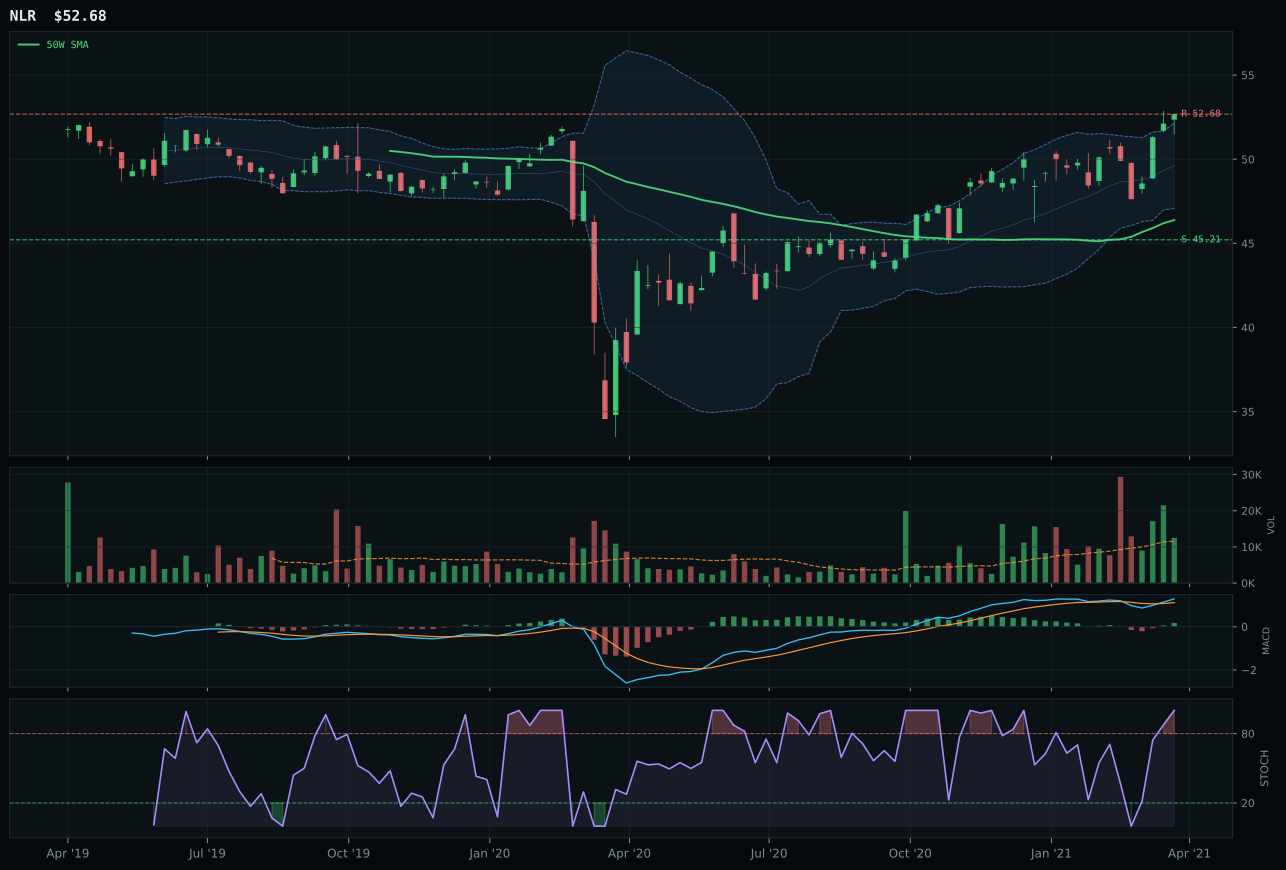
NLR has a neutral structure profile with 1.5% 13-week relative strength versus SPY.
A failed hold above support would weaken the setup.
Tracked, but not top-2 eligible because: .
URA won decisively because it delivers momentum confirmation at a perfect 100.0 tied to clean volume accumulation/confirmation (1.15x average volume), paired with the second-highest persistence score in the entire portfolio at 85.4. A 24.8% 13-week return on above-average volume and bullish-but-flattening MACD reveals controlled accumulation, not euphoric extension. URNM lost because despite posting an even higher 13-week return at 35.1%, its risk/reward is dramatically weaker (22.7 versus 30.6), its structure is less clean (65.2 versus 72.3), and most critically, its volume shows distribution pressure—active selling into strength—rather than accumulation. Stochastic RSI falling/neutral in URNM versus rising mid-zone in URA marks the timing inflection point: URA's setup invites fresh participation while URNM's is already rolling over. The 62.8% extension from the 50-week in URNM versus URA's 45.6% explains the volume divergence: URNM attracted late-stage momentum chasers while URA captured methodical capital allocators.
Nuclear Energy earned 5% allocation on a 51.4 category score because the macro environment supports energy themes broadly, but the technical setup is too extended to justify larger positioning. Energy scarcity (+9), real asset sponsorship (+7), and AI growth sponsorship (+5) are active, but the category-level macro fit (69.0/100) relies heavily on broad energy themes; uranium-specific descriptors are not pulling. Technical evidence is 75.6%, strong for URA but reflecting the fact that momentum is real—not a mirage. However, the risk-reward is poor at 30.6/100 (upside -2.5% to resistance, downside 77.1% to support), meaning the move is priced for near-perfect execution. Five percent is appropriate as a satellite position within the broader real-asset allocation. To upgrade to 10%, URA would need to pull back to the 50W or consolidate for 2-3 weeks with MACD flattening further, creating a higher-probability re-entry. Until that reset, Nuclear Energy is held but not favored. The category can turn into a 10% position quickly if uranium supply stories deteriorate further.
Technology — XLK
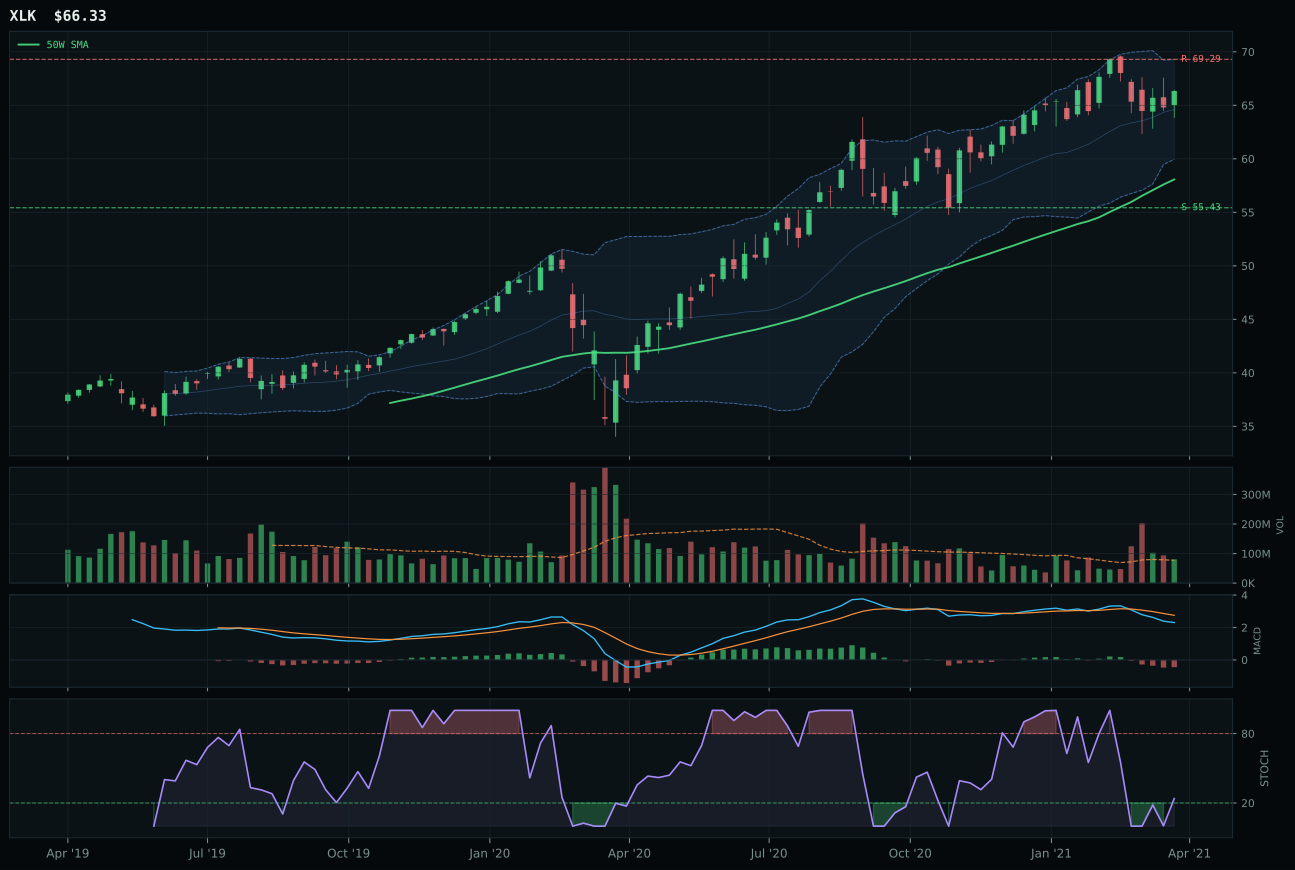
XLK has a neutral structure profile with -4.5% 13-week relative strength versus SPY.
A failed hold above support would weaken the setup.
Actionable but governed by invalidation levels.
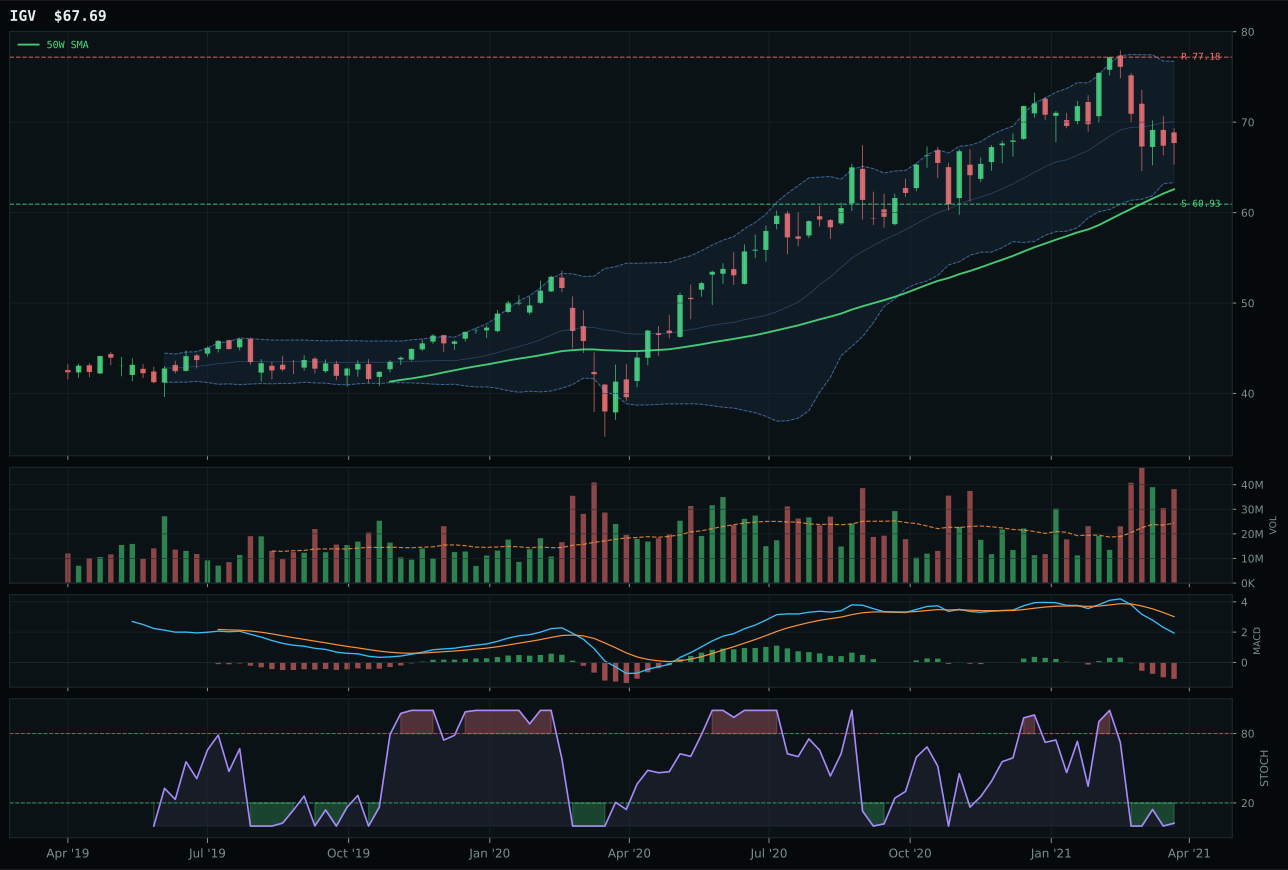
IGV has a neutral structure profile with -13.4% 13-week relative strength versus SPY.
A failed hold above support would weaken the setup.
Actionable but governed by invalidation levels.
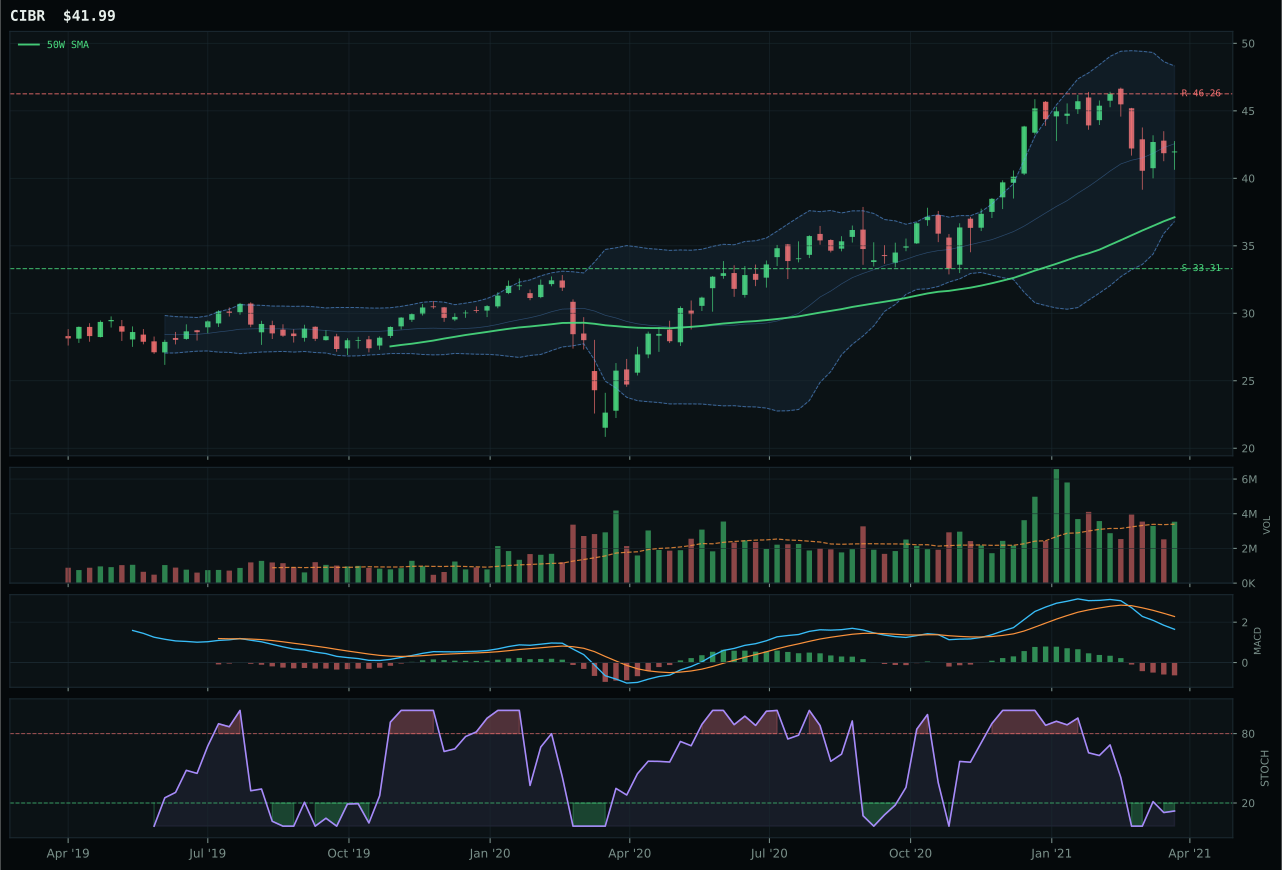
CIBR has a neutral structure profile with -14.4% 13-week relative strength versus SPY.
A failed hold above support would weaken the setup.
Actionable but governed by invalidation levels.
XLK claimed the category because it holds the cleanest relative strength profile within its peer set, posting 8.9% category-relative outperformance versus IGV's flat 0.0%, while both charts sit at neutral structures with price 14.2% above the 50W. The timing picture separates them decisively: XLK's stochastic RSI sits rising mid-zone at 0.24, a setup that invites fresh participation, while IGV's oversold turn-up at the same technical level signals late-stage reversal mechanics rather than early accumulation. Volume tells the real story—XLK trades at 1.04x its 20-week average (genuine equilibrium), whereas IGV shows accumulation/confirmation at a moment when momentum has already compressed to just 13% category-relative strength. Neither MACD is bullish, but XLK's weaker momentum reading (2.8% 13-week return) actually works in its favor here because it proves the 75.2% trend score is driven by price structure and slope persistence, not extension euphoria; IGV's negative 6.1% 13-week return paired with its oversold stochastic creates a whipsaw trap.
Technology earned 5% despite a 44.0 category score that ranks it outside the top two because the macro regime penalizes duration-sensitive growth. Credit stress and inflation pressure are both active headwinds, offsetting the AI growth tailwind. The category's technical evidence is 51.8/100—just above the midline—which means entry quality is mixed and the risk-adjusted return is modest. For Technology to climb into 5% allocation territory, either MACD would need to confirm bullishly across all three ETFs in the basket, or the macro descriptors would need to flip away from credit stress toward a risk-appetite continuation. Until that setup clarifies, five percent provides exposure without overcommitting to a category where the timing score (78.0) is strong but momentum confirmation (46.9) is soft. The extended broad market and tight policy conditions argue for holding this allocation flat.
Precious Metals — SLV
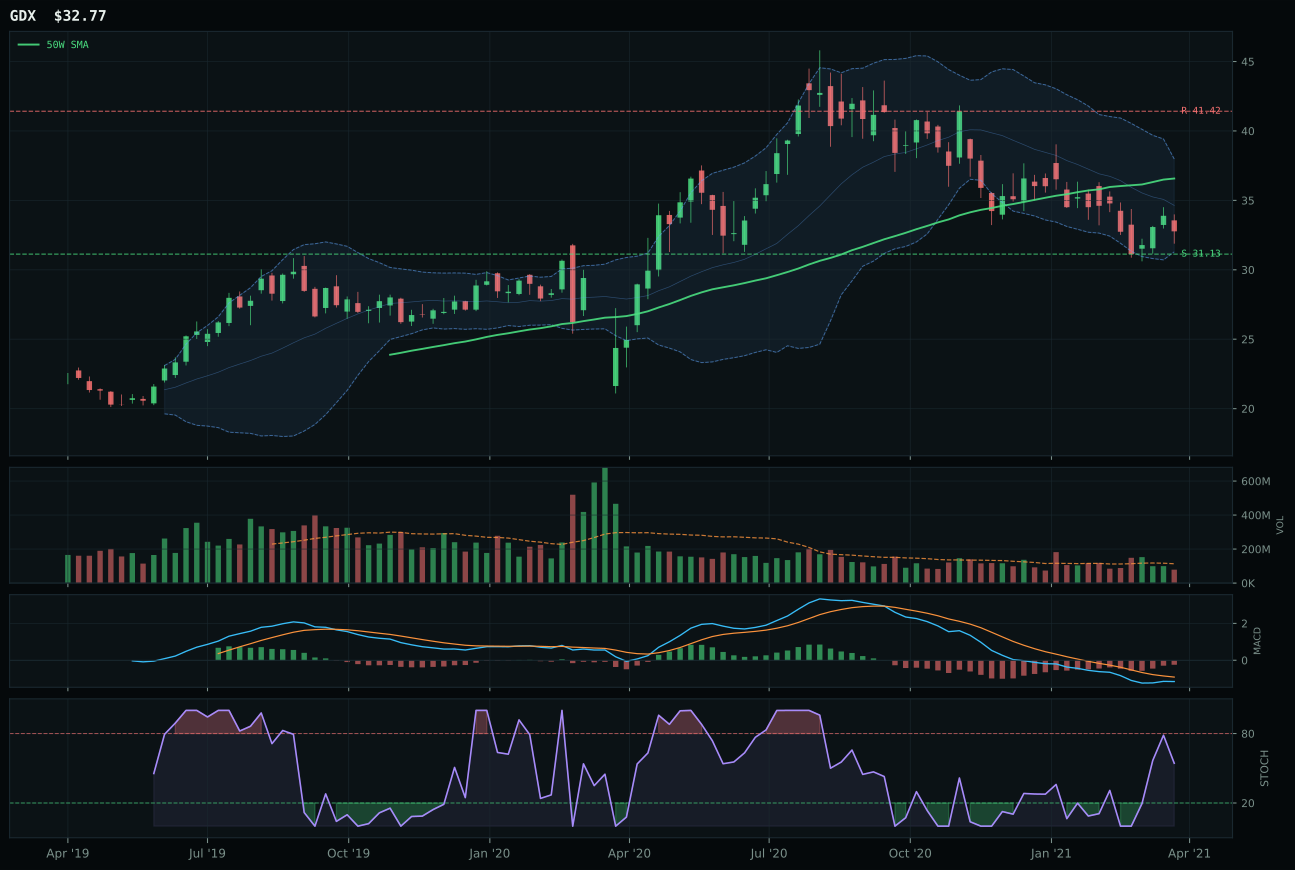
GDX has a neutral structure profile with -16.4% 13-week relative strength versus SPY.
A failed hold above support would weaken the setup.
Actionable but governed by invalidation levels.
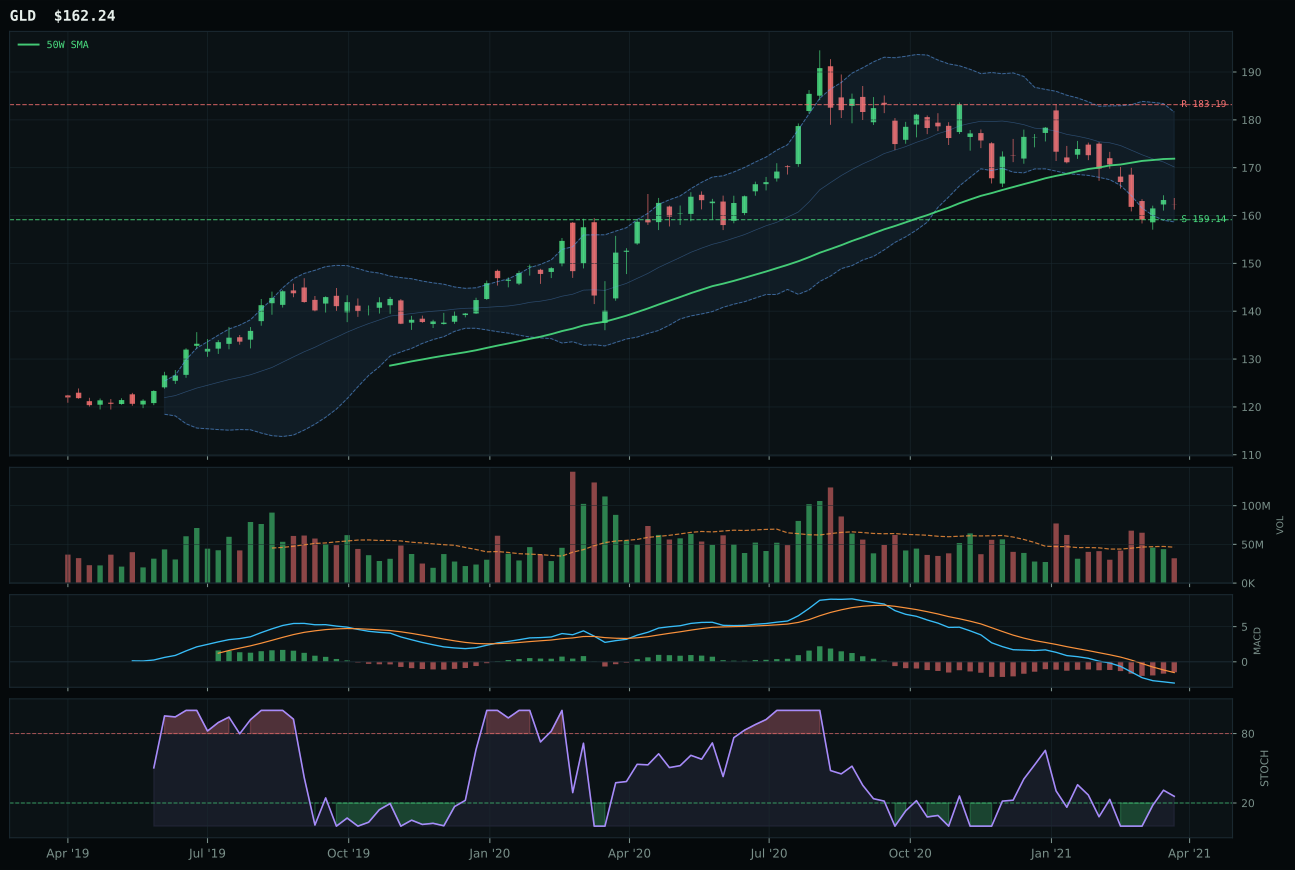
GLD has a pullback into support profile with -15.3% 13-week relative strength versus SPY.
A failed hold above support would weaken the setup.
Actionable but governed by invalidation levels.
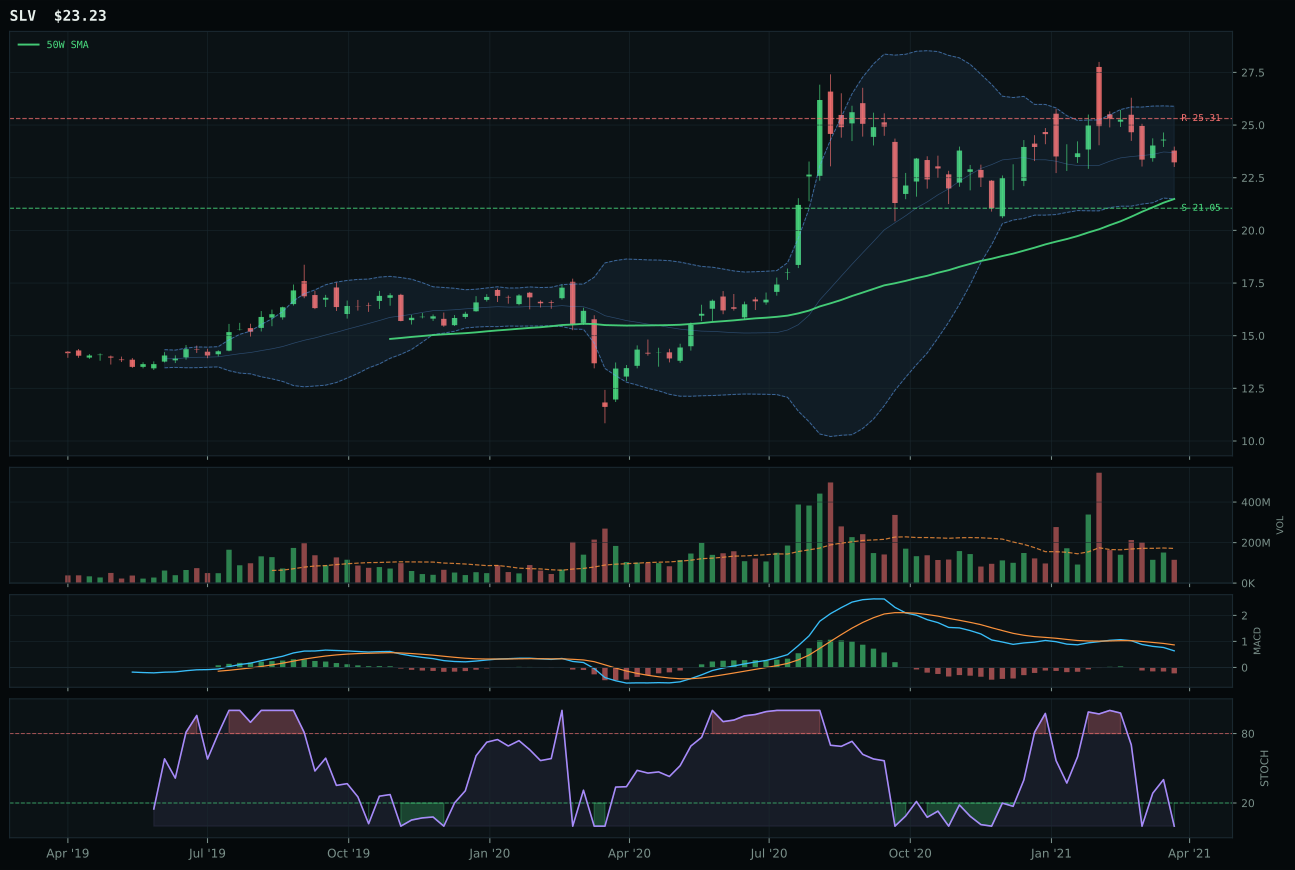
SLV has a neutral structure profile with -10.4% 13-week relative strength versus SPY.
A failed hold above support would weaken the setup.
Actionable but governed by invalidation levels.
SLV prevailed over GDX by the narrowest margin (minus-3.0 points) because it holds better category-relative strength at plus 5.0% despite inferior SPY-relative performance (minus-10.4% versus GDX's minus-16.4%). Both sit neutral structure with MACD weakening, but SLV's oversold stochastic at 0.00 paired with 8.1% proximity to the 50-week creates a clearer mean-reversion candidate than GDX's rising mid-zone stochastic in the middle retracement zone. The composition of their momentum tells the critical story: SLV's negative 3.0% 13-week return and negative 5.8% 4-week return mean the downside is fresher, making a bounce more architecturally likely; GDX's negative 9.0% 13-week alongside bearish-but-improving MACD says the reversal is already underway, which prices in quicker relief than might be available. Risk/reward heavily favors GDX on paper (90 versus 59), but in oversold contexts, tighter downside (10.4% to support for SLV) often precedes faster reversals than longer risk windows.
Precious Metals earned 5% despite a category score of 41.8 because the macro case for metals scarcity is active and the portfolio needed diversification within a real-asset sleeve that is already anchored to energy and agriculture. However, the technical evidence is poor at 33.6/100—the weakest support across all allocated categories—and SLV's 7.6% momentum confirmation is nearly nonexistent. The category's macro fit (49.0/100) is barely above neutral, held up only by metals scarcity (+7) and inflation pressure (+5), while risk appetite and dollar pressure pull in opposite directions. The 5% allocation is defensive: it hedges the portfolio against a hard dollar weakness or credit stress acceleration that would favor hard money, but it is not a conviction trade. To upgrade Precious Metals to 10%, SLV would need to consolidate and build volume accumulation, ideally with MACD improving and stochastic rising from oversold. Until that reset occurs, treat this position as portfolio insurance, not alpha.
AI — SMH
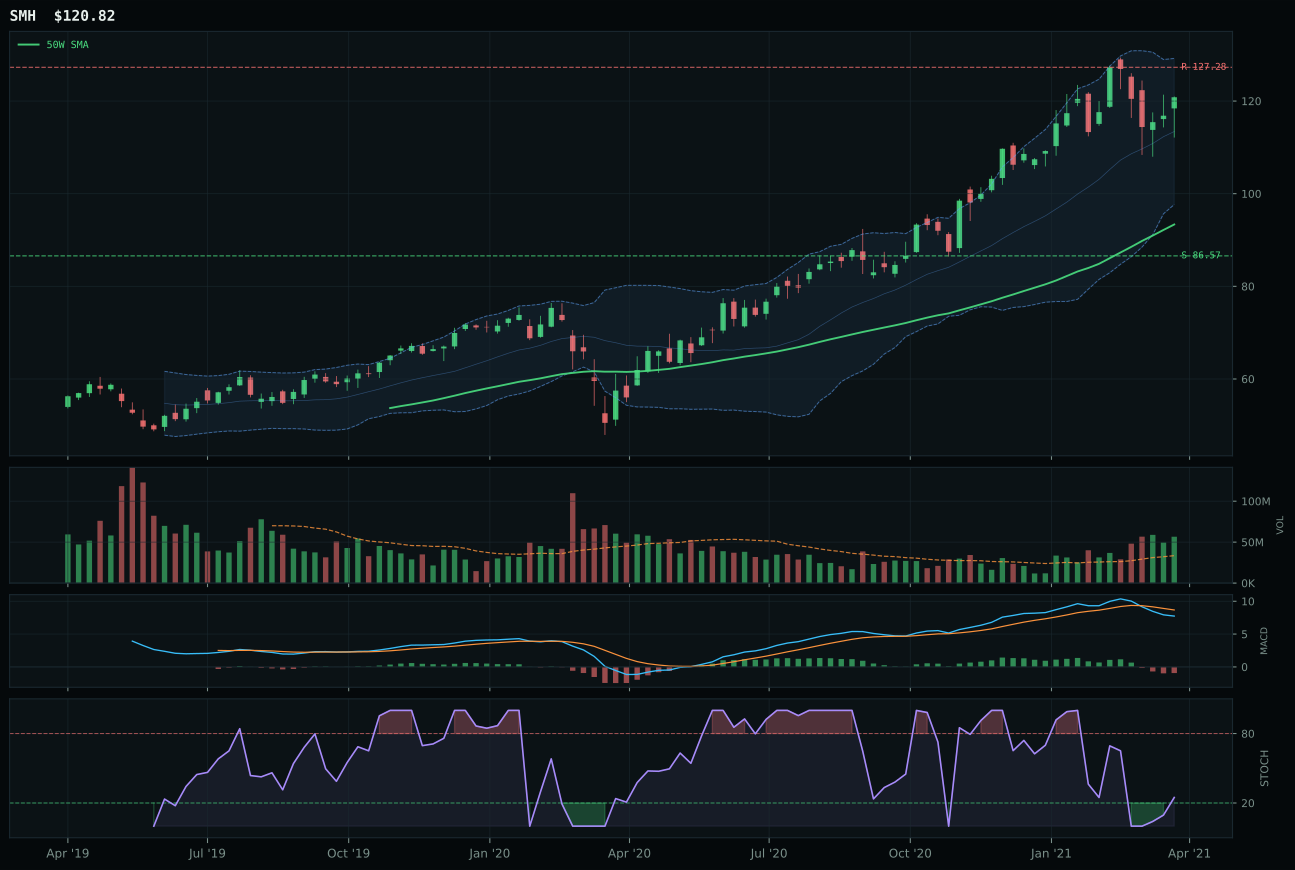
SMH has a vertical extension profile with 5.1% 13-week relative strength versus SPY.
A failed hold above support would weaken the setup.
Actionable but governed by invalidation levels.
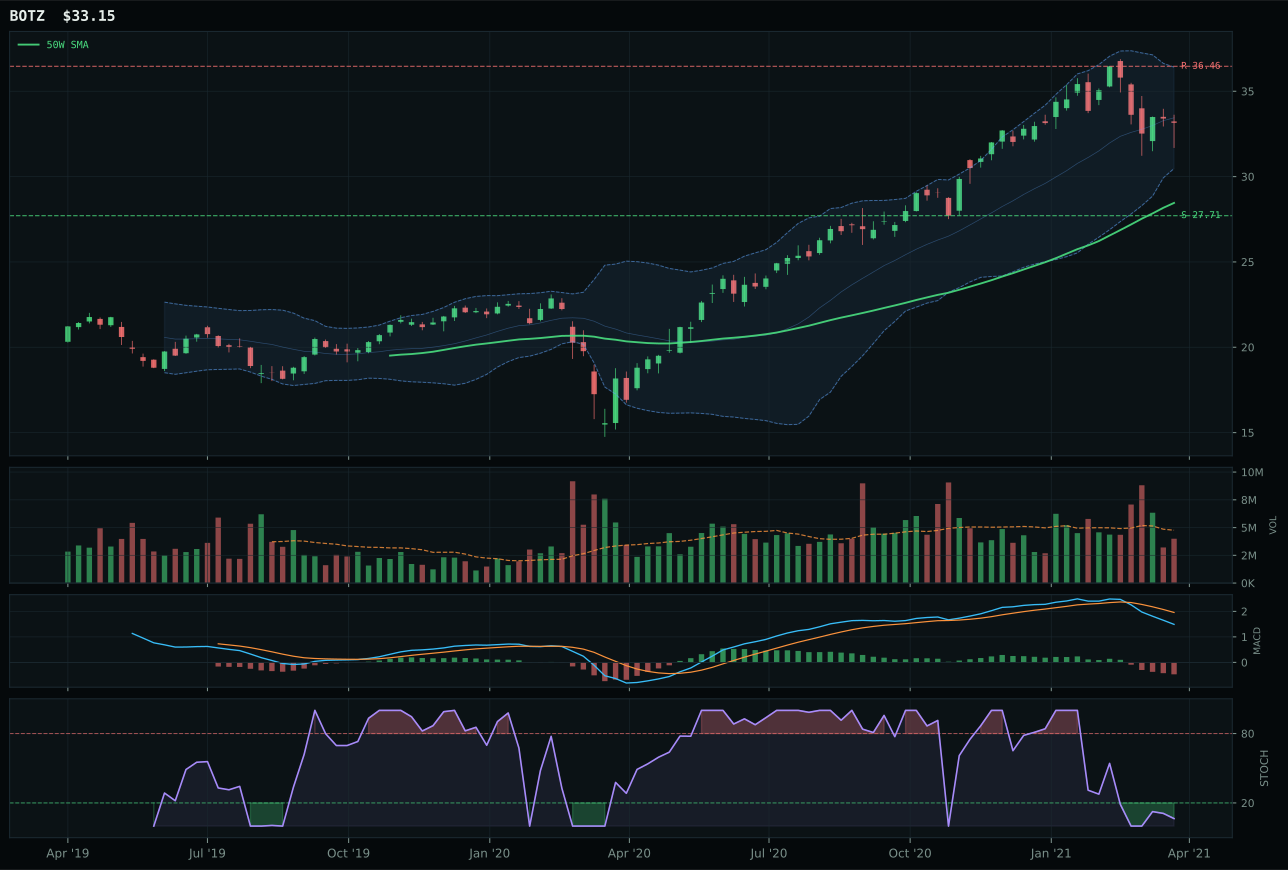
BOTZ has a vertical extension profile with -6.7% 13-week relative strength versus SPY.
A failed hold above support would weaken the setup.
Actionable but governed by invalidation levels.
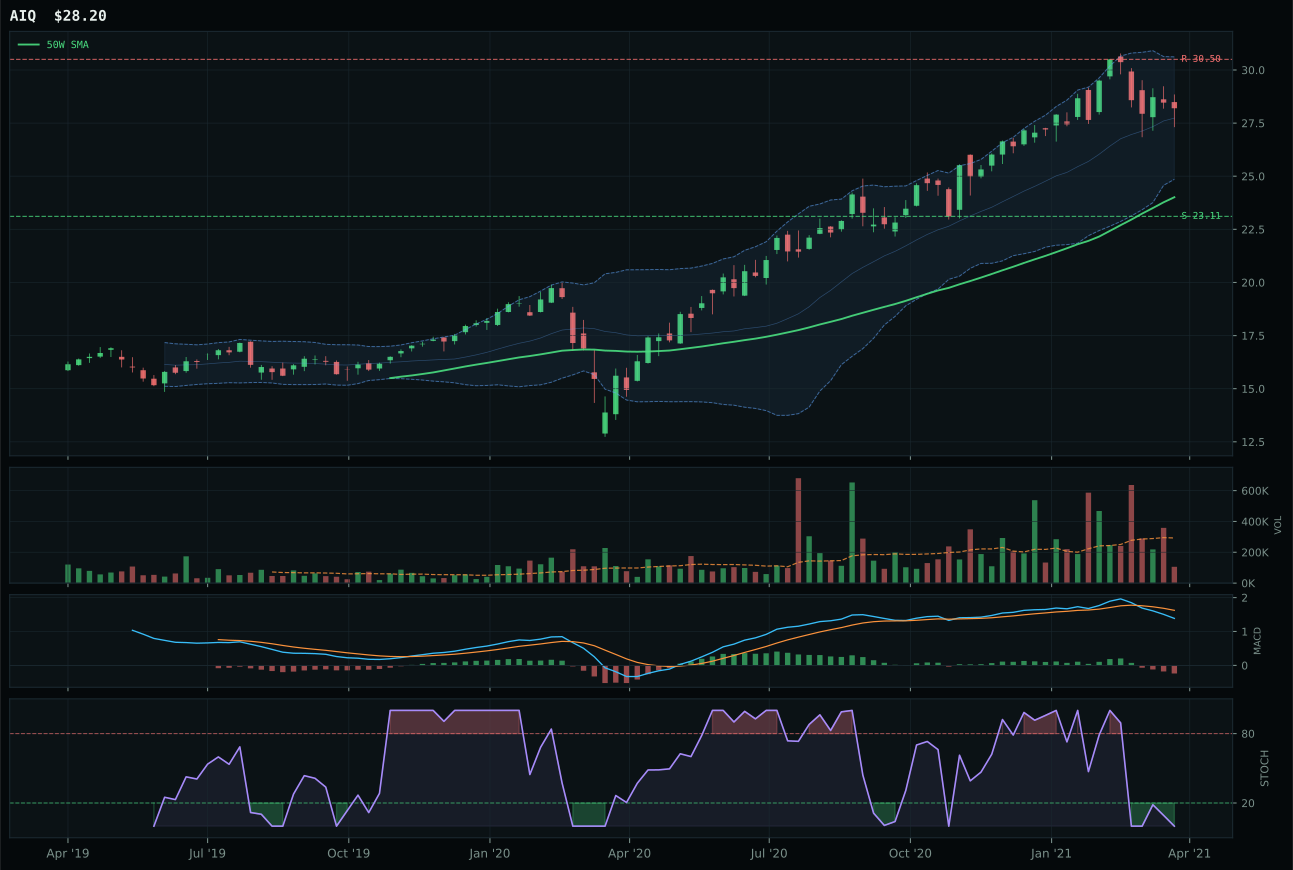
AIQ has a vertical extension profile with -3.1% 13-week relative strength versus SPY.
A failed hold above support would weaken the setup.
Tracked, but not top-2 eligible because: .
SMH dominated because it is the only representative in its peer set offering genuine positive relative strength: plus 5.1% versus SPY with a 12.5% 13-week return, while BOTZ and AIQ cratered at minus-6.7% and minus-3.1% respectively. The momentum confirmation score of 76.8 reflects real volume sponsorship—1.69x average 20-week volume flowing into an accumulation pattern—which validates the 29.4% extension above the 50W rather than punishing it as a late-stage bull trap. Structure quality separates SMH further: an 80.0 cleanliness score comes from vertical extension with 66.7% technical purity, not from mean-reversion compression. BOTZ's structure of 70.3 paired with oversold stochastic at turn-up and neutral volume reveals a bounce-play setup; SMH's rising mid-zone stochastic with confirmation volume is the difference between sponsorship and capitulation.
At 39.6 points, AI ranks outside top-2 because timing cost it dearly. The 56.0 timing score reflects the 29.4% extension—SMH is priced for perfection and leaves little room for disappointment. Macro fit is strong at 54.0/100, with AI growth sponsorship (+14) offsetting credit stress (-8), so the category earned its slot based on narrative strength. The allocation system assigned only 5% because the risk-reward (52.3) is compressed and upside to resistance is minimal. For AI to merit 10%, either SMH would need to pull back 10–15% to reset entry quality, or BOTZ would need to show conviction on volume to provide a broader, less stretched exposure. The category is in the portfolio because the AI sponsorship is real and persistent, but the technical setup is too extended to risk more capital at these levels. Monitor for consolidation or a clean pullback into the 50W as a re-entry signal.
Defense & Aerospace — ITA
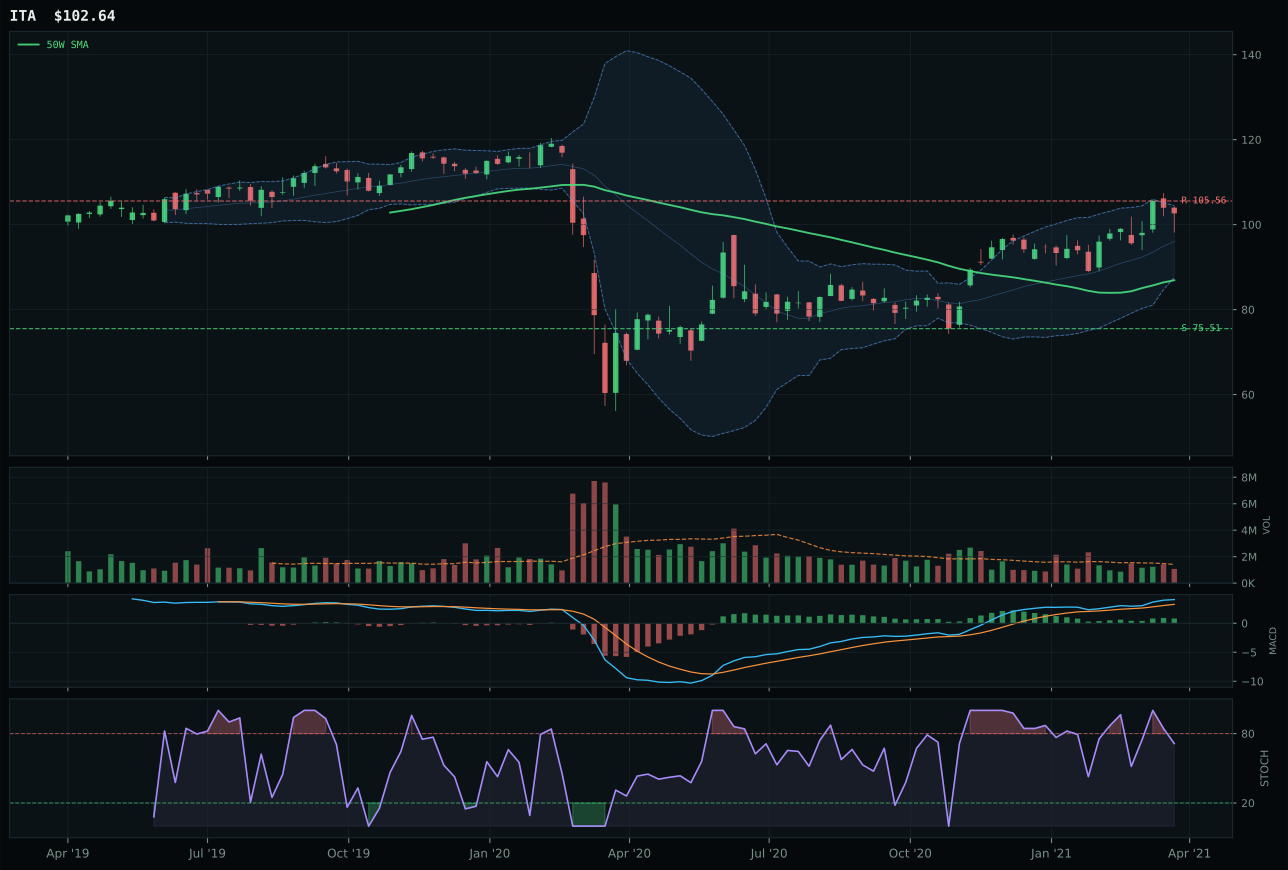
ITA has a vertical extension profile with 1.7% 13-week relative strength versus SPY.
A failed hold above support would weaken the setup.
Actionable but governed by invalidation levels.
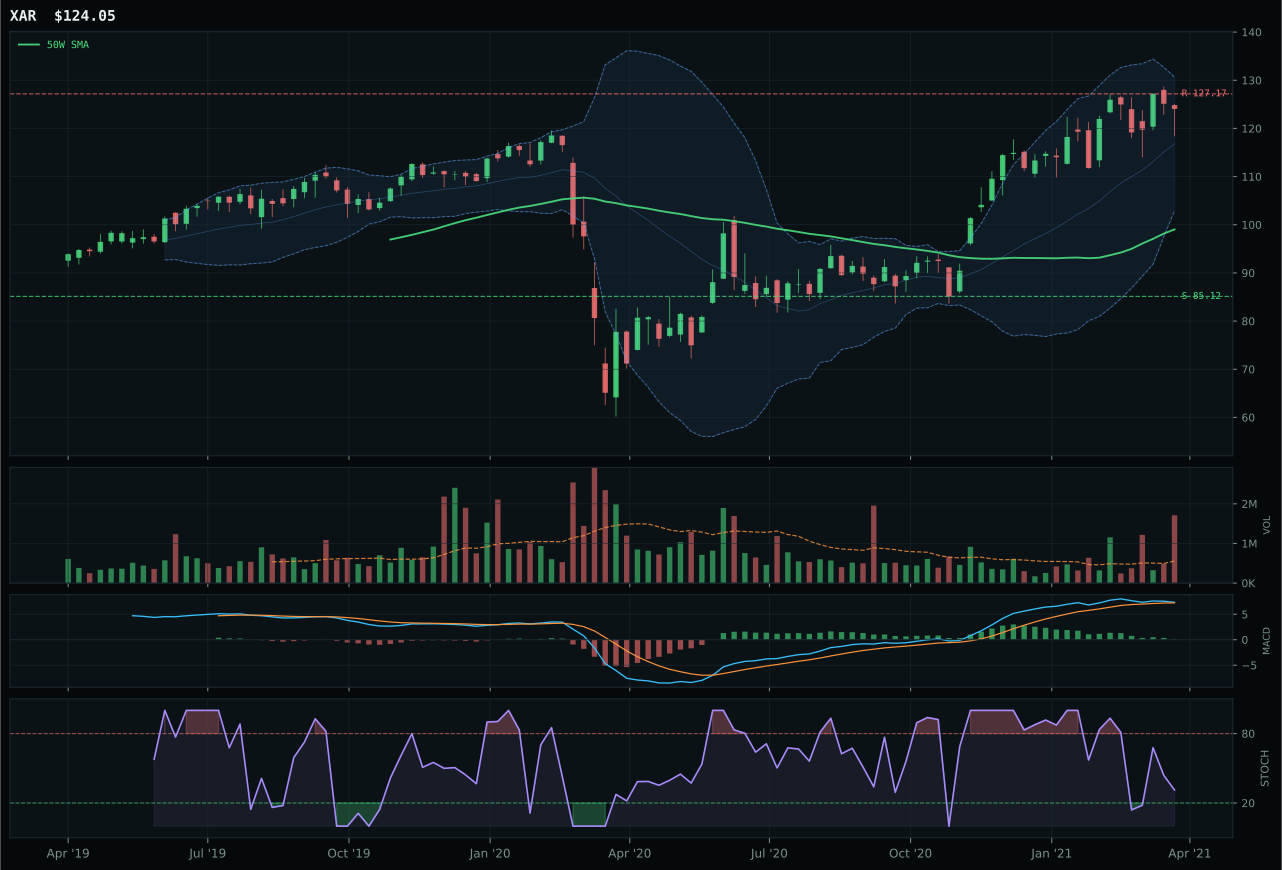
XAR has a vertical extension profile with 2.1% 13-week relative strength versus SPY.
A failed hold above support would weaken the setup.
Actionable but governed by invalidation levels.
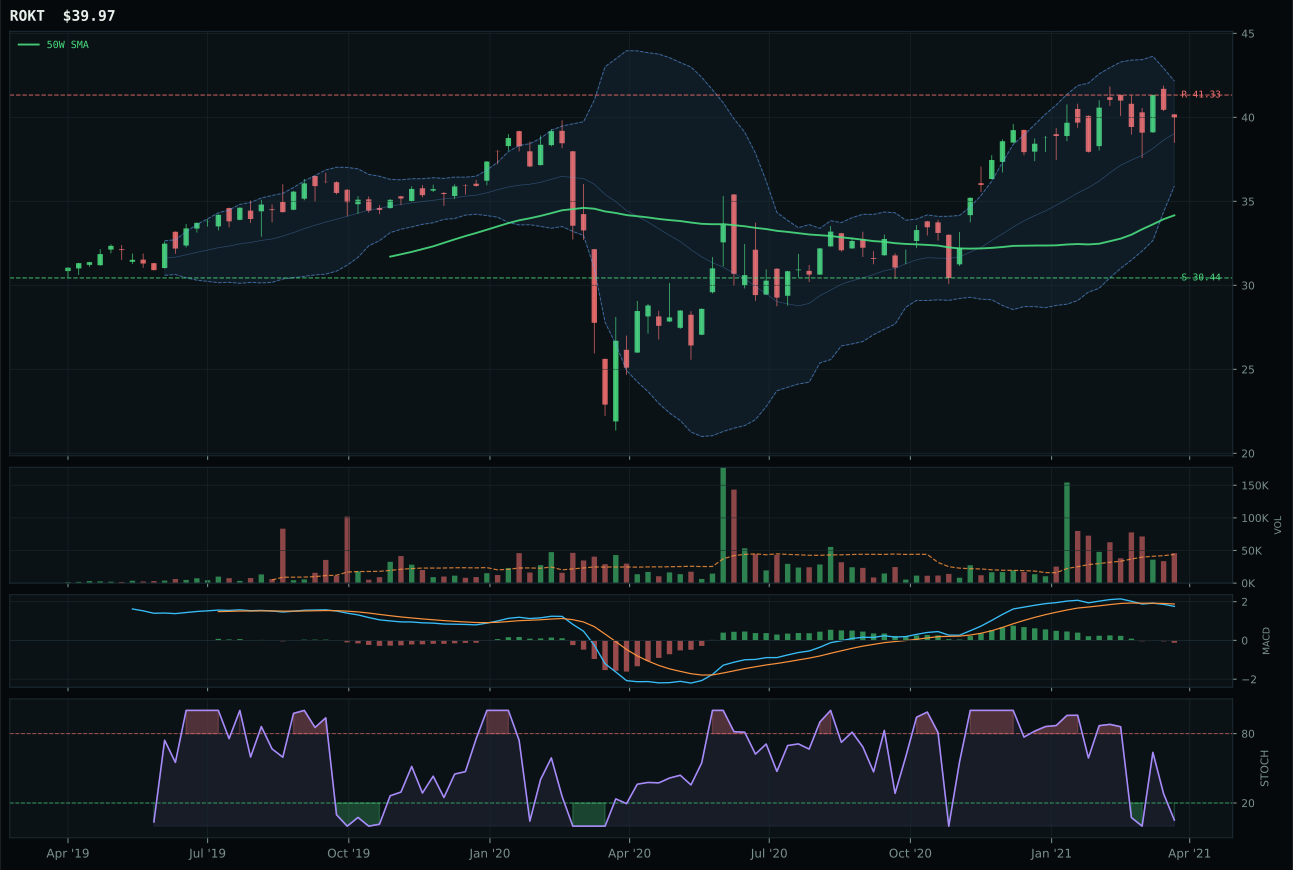
ROKT has a vertical extension profile with -3.3% 13-week relative strength versus SPY.
A failed hold above support would weaken the setup.
Tracked, but not top-2 eligible because: .
ITA won decisively because it is the sole representative earning a perfect 100.0 trend score, underpinned by a clean 0.6% positive 50-week slope and 1.7% SPY-relative strength in a sector where momentum is scarce. The chart sits 18.1% above the 50-week at Fibonacci 0.236—an extended but not runaway position—yet the conviction comes from MACD bullish and improving paired with falling/neutral stochastic RSI, a rare combination that shows strengthening histogram bars without euphoric price action. XAR lost because despite matching ITA's vertical extension setup, its 25.3% 50-week distance, distribution-pressure volume, and weakening MACD (bullish but flattening) reveal a setup rolling over exactly when new capital should be arriving. Risk/reward tilts against XAR too: only 30.0 versus ITA's 46.4, meaning the upside to resistance is 2.8% while downside to support sprawls 35.9%—XAR is stretched without conviction.
Defense & Aerospace is excluded from allocation this week and ranks 9th or 10th among the ten categories. The 39.2 final score masks a category-level macro fit of 64.0/100—actually respectable—but the technical setup simply cannot support new capital deployment. ITA's perfect trend score and 86.1% momentum are offset by poor risk-reward and extension, which means the move has already happened and capital should wait for a pullback. The macro environment (Transition/Mixed, active broad market bear +6, dollar pressure +3) provides some support for defense cyclicality, but the technical jury has already voted: the chart is exhausted and investors who rode it already captured the gains. Exclusion does not signal bearishness—ITA is still a strong company—but rather a disciplined refusal to chase extended entries. Once ITA consolidates 10–12% below current levels with MACD cycling lower, it becomes a top-3 category again.
Emerging Markets — INDA
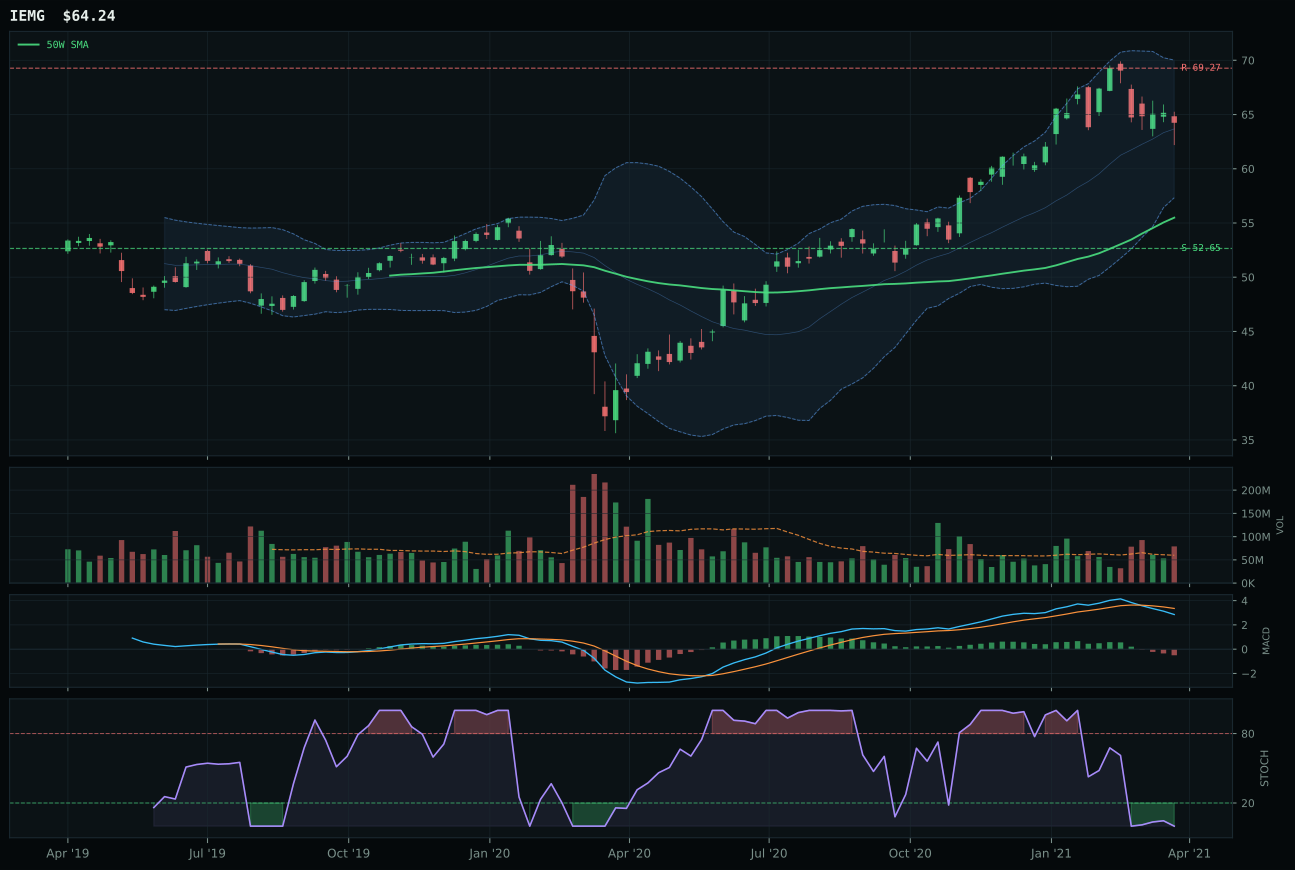
IEMG has a vertical extension profile with -0.8% 13-week relative strength versus SPY.
A failed hold above support would weaken the setup.
Actionable but governed by invalidation levels.
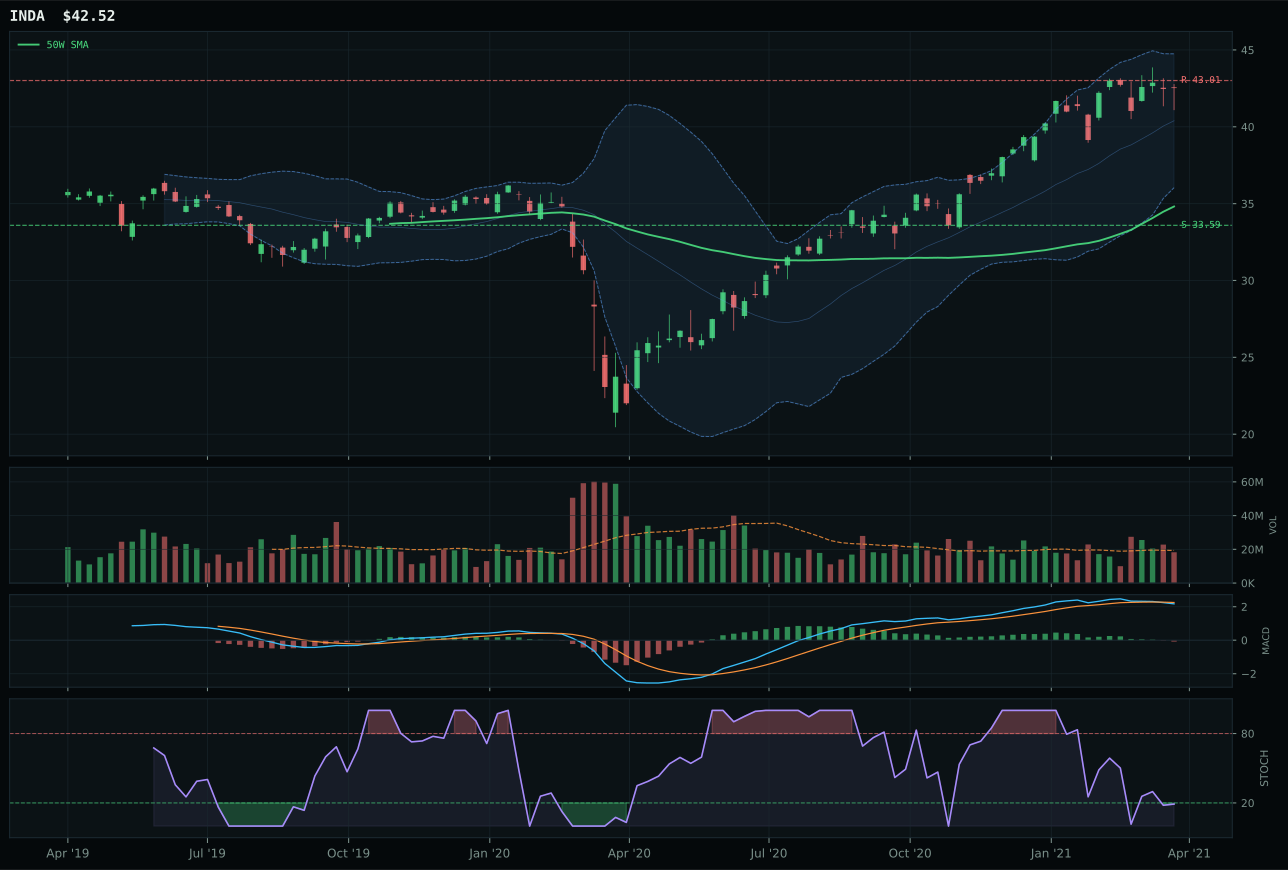
INDA has a vertical extension profile with 0.7% 13-week relative strength versus SPY.
A failed hold above support would weaken the setup.
Actionable but governed by invalidation levels.
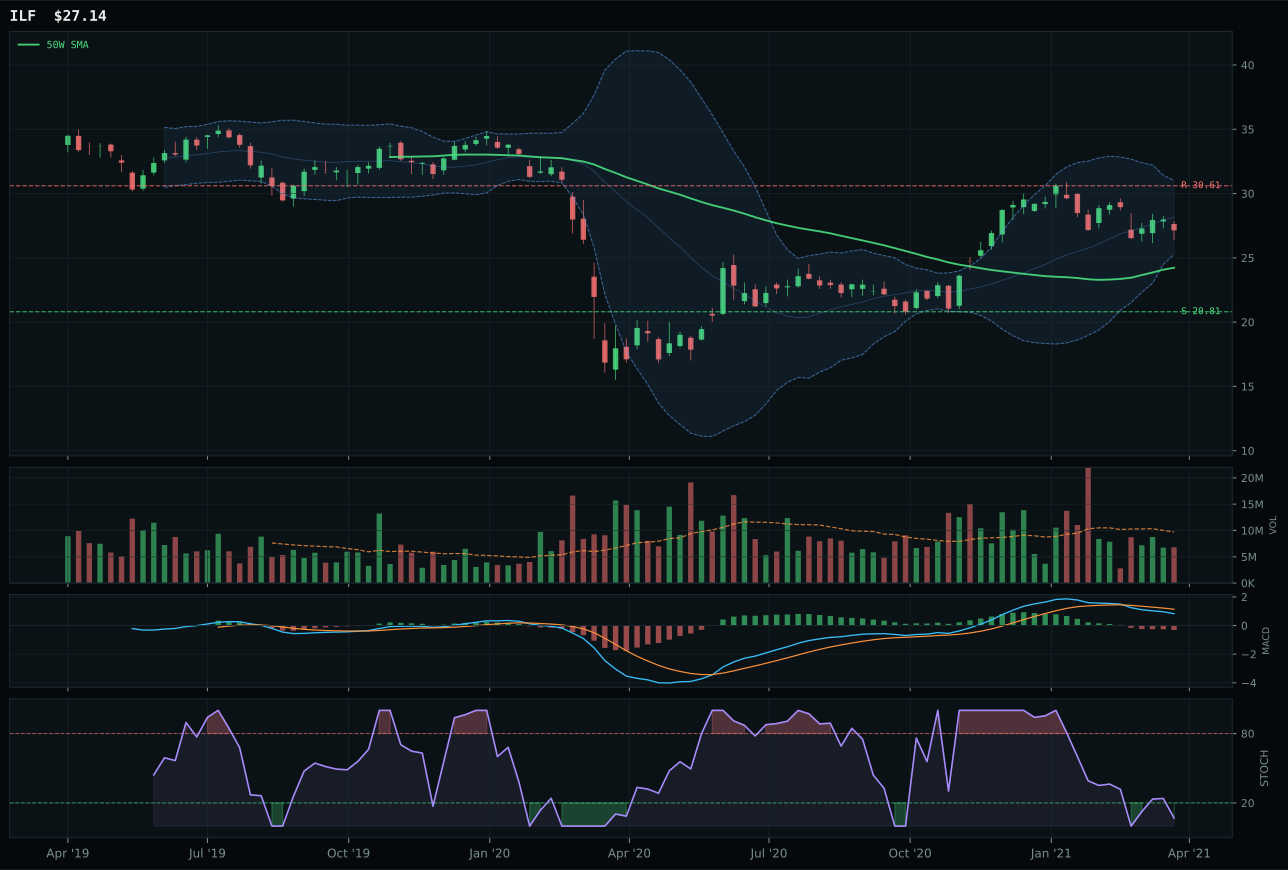
ILF has a neutral structure profile with -14.4% 13-week relative strength versus SPY.
A failed hold above support would weaken the setup.
Actionable but governed by invalidation levels.
INDA narrowly claimed category leadership over IEMG by plus-1.5% category-relative strength (versus IEMG's 0.0%), a marginal technical advantage that underscores how weak the category truly is. Both charts sit extended 22.1% and at similar Fibonacci levels, both show bearish/weakening MACD with oversold stochastic RSI, and both exhibit volume that ranges from neutral to above-average participation—meaning neither is commanding accumulation by serious capital. INDA's selection as representative reflects its slightly fresher 8.0% 13-week return paired with marginally cleaner trend (83.1 versus IEMG's 81), but this is a victory of degree, not magnitude. IEMG lost inches, not miles, and the score gap of minus-1.3 signals a category where no representative earns genuine conviction. The timing score of 40.0 in INDA (among the lowest in the portfolio) reflects that this trade is extended at exactly the moment when emerging markets should be rolling over due to dollar pressure active at minus-14 in the macro.
Emerging Markets is completely excluded from allocation this week, ranked 9th or 10th with a 13.1 category score. The macro fit is 25.0/100—the worst across all ten categories—crushed by active dollar pressure (-14), credit stress (-10), and broad market bear (-9), which override a modest risk appetite signal (+8). Dollar strength and credit stress are specifically toxic for EM because they tighten financing conditions and weaken carry returns. The technical evidence across INDA, IEMG, and ILF is weak to dire; all three show oversold conditions that have not yet triggered accumulation, and timing scores are poor. For Emerging Markets to earn even 5% allocation, two things must occur: (1) dollar pressure descriptor must turn off, which requires either a Fed pivot or inflation normalization, and (2) at least one of the three ETFs must consolidate and build volume accumulation above the 50W. Until both conditions are met, EM is completely off the table. This is not a short-term timing call; it is a regime exclusion driven by the active macro headwinds. Monitor for a complete reset of positioning and macro conditions before reconsidering.