
2021-03-19
Informational purposes only. The content in this report, including allocations, analysis, and commentary, is provided solely for informational and educational purposes. It does not constitute financial advice, investment advice, trading advice, or any other type of advice. Past performance does not guarantee future results. Always conduct your own research and consult a qualified financial professional before making investment decisions.
Weekly Allocation
| Ticker | Category | Weight | Role |
|---|---|---|---|
| FSOL | 50% | Overlay | |
| FCG | Traditional Energy | 10% | Top-2 (10%) |
| URA | Nuclear Energy | 10% | Top-2 (10%) |
| MOO | Agriculture & Livestock | 5% | Tier-2 (5%) |
| ITA | Defense & Aerospace | 5% | Tier-2 (5%) |
| PICK | Industrial Metals | 5% | Tier-2 (5%) |
| PAVE | Utilities & Infrastructure | 5% | Tier-2 (5%) |
| SLV | Precious Metals | 5% | Tier-2 (5%) |
| XLK | Technology | 5% | Tier-2 (5%) |
Trade Instructions — Monday Open
Sell the tranche from 2021-02-19 (completing its 4-week hold). Buy the new tranche. Instructions show net portfolio changes — same-asset positions cancel, weight changes show the delta.
| Action | Ticker | Instruction |
|---|---|---|
| SELL | COPX | Sell 33% of COPX position (reduce 7.50% → 5.00%) |
| SELL | XLE | Sell 25% of XLE position (reduce 10.00% → 7.50%) |
| SELL | IGV | Sell 50% of IGV position (reduce 2.50% → 1.25%) |
| SELL | IEMG | Sell entire IEMG position (1.25% of portfolio) |
| SELL | SMH | Sell 50% of SMH position (reduce 2.50% → 1.25%) |
| BUY | SLV | Buy SLV — 14.29% of freed cash (adds 1.25% to portfolio) |
| BUY | FCG | Buy FCG — 28.57% of freed cash (adds 2.50% to portfolio) |
| BUY | URA | Buy URA — 28.57% of freed cash (adds 2.50% to portfolio) |
| BUY | PICK | Buy PICK — 14.29% of freed cash (adds 1.25% to portfolio) |
| BUY | XLK | Buy XLK — 14.29% of freed cash (adds 1.25% to portfolio) |
Current Portfolio After Trade
Combined holdings across all 4 active tranches. Each tranche is 25% of the portfolio.
| Ticker | % of Portfolio | Weight Bar |
|---|---|---|
| FSOL | 50.00% | |
| XLE | 7.50% | |
| MOO | 6.25% | |
| COPX | 5.00% | |
| ITA | 5.00% | |
| PAVE | 3.75% | |
| ILF | 3.75% | |
| URNM | 3.75% | |
| SLV | 3.75% | |
| FCG | 2.50% | |
| URA | 2.50% | |
| IGV | 1.25% | |
| SMH | 1.25% | |
| INDA | 1.25% | |
| PICK | 1.25% | |
| XLK | 1.25% |
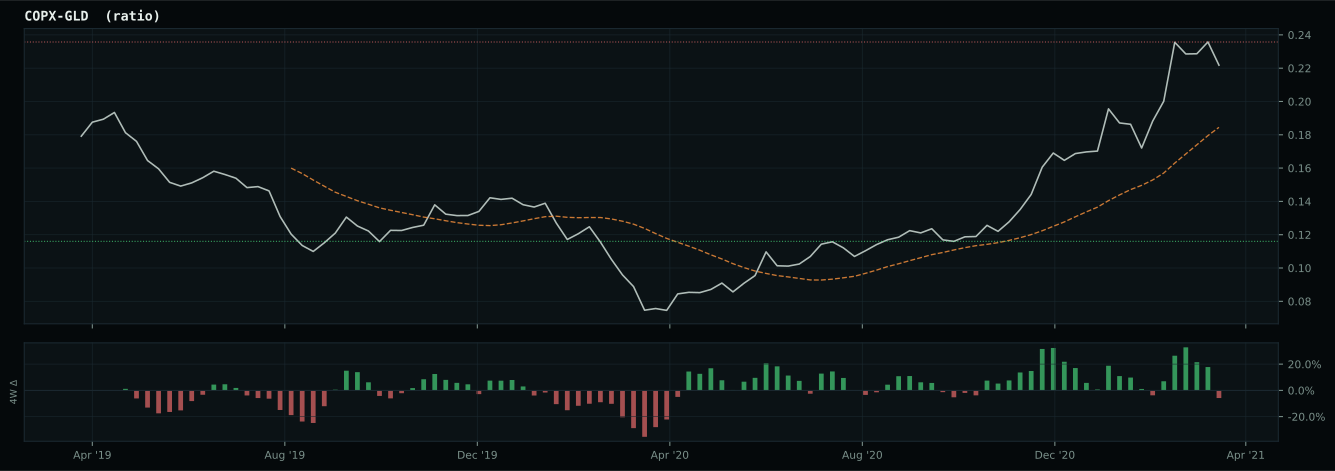
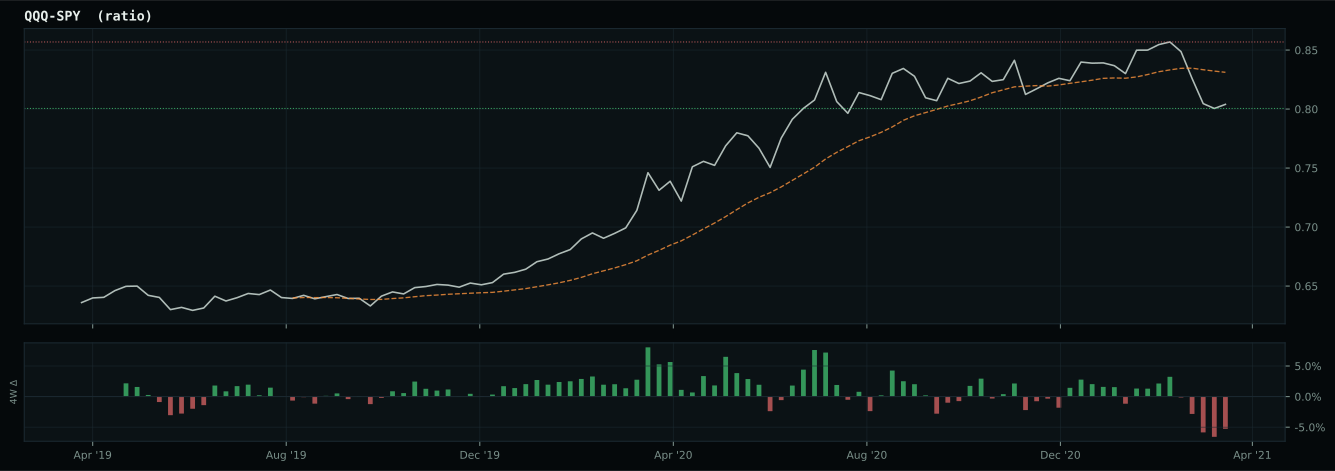
Macro Regime — Transition / Mixed
Macro Evidence Charts
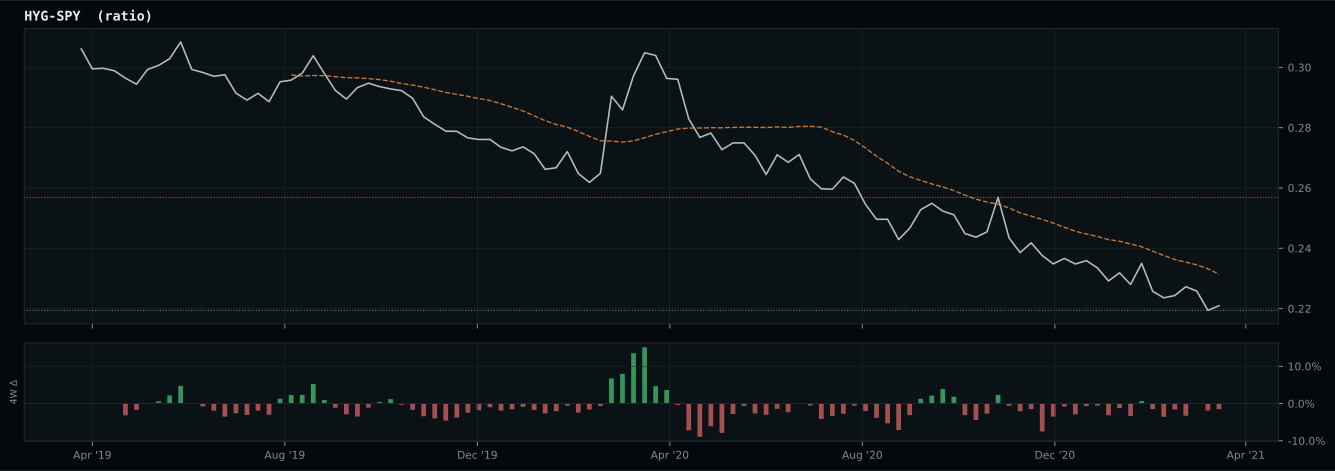
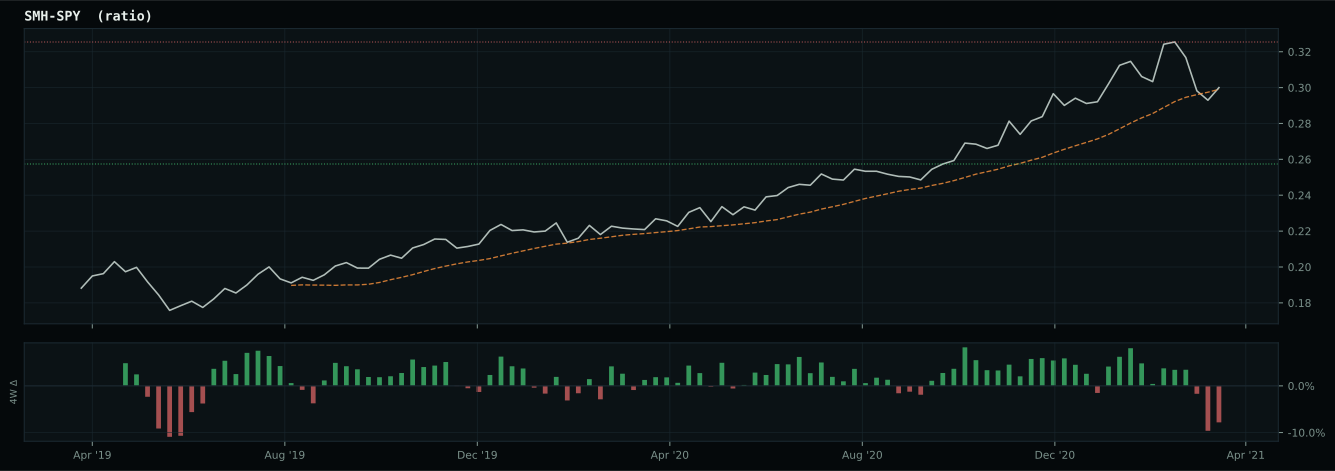
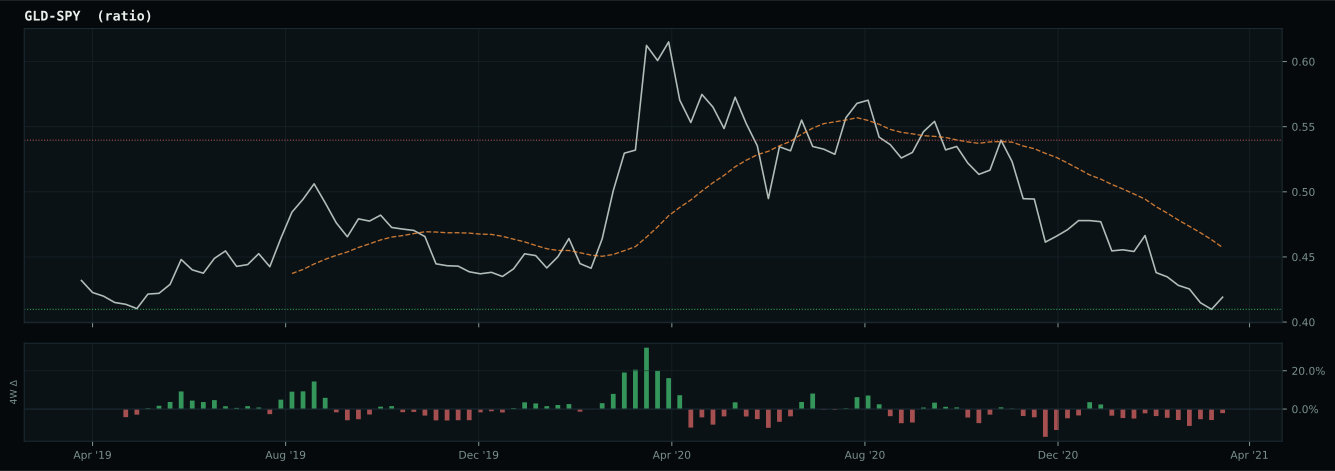
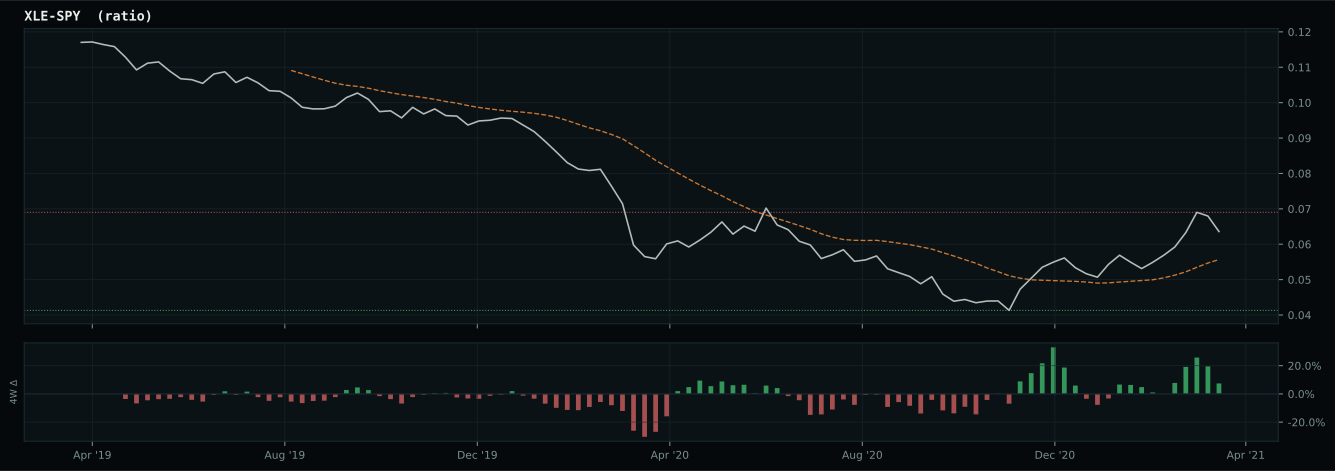
Market-implied signals behind the macro regime scores. Each ratio compares two assets; the direction and slope of the ratio is what the macro engine reads.
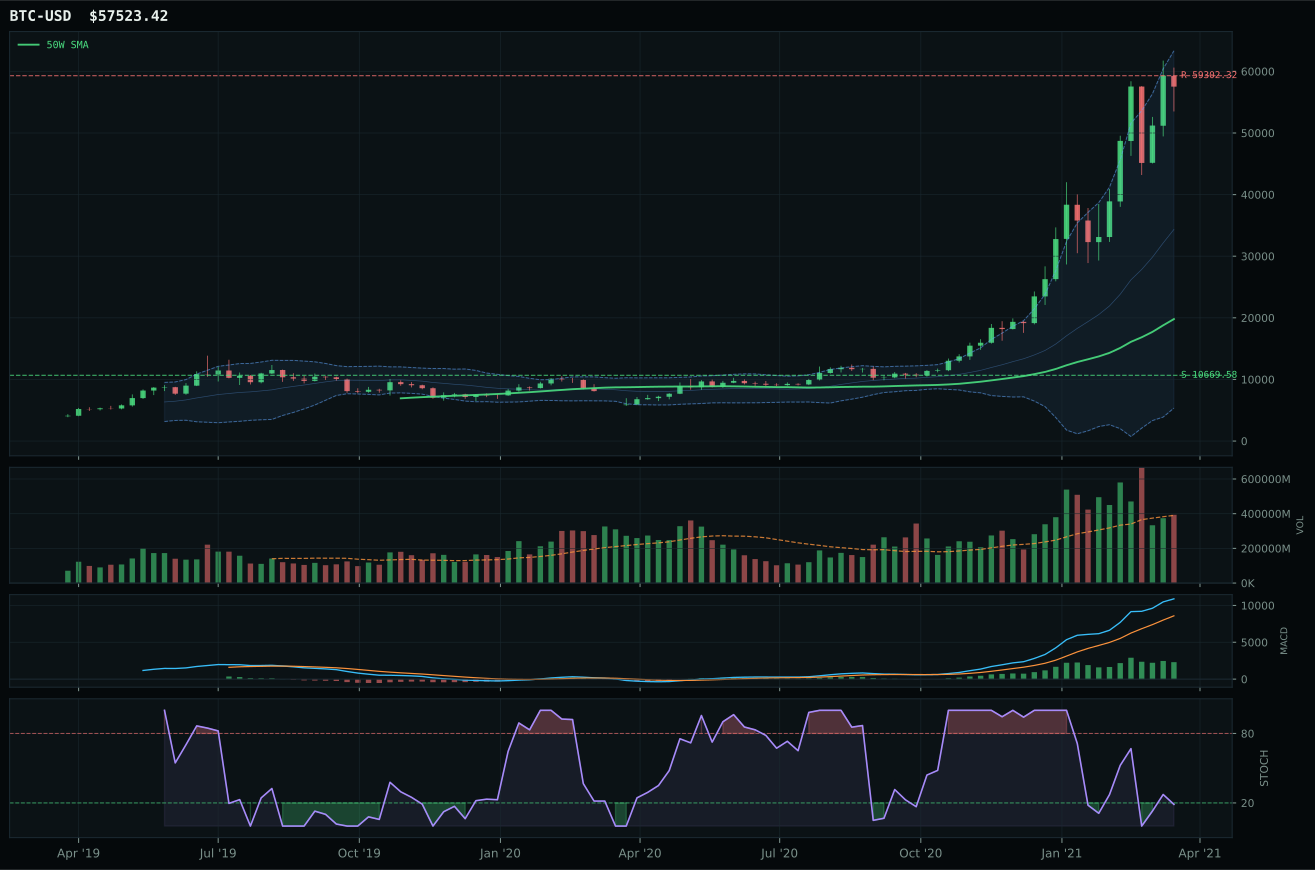
Crypto Regime — AltSeason
post-touch structure is too wide to count as a range; max/min close ratio is 11.00
TrendBTC confirmed: 2 consecutive closes above rising/flat 50W SMA
all available AltSeason conditions pass; missing optional confirmations skipped

Category Rankings
| Rank | Category | Winner | Score | Alloc | 4W Ret | Peers (4W) |
|---|---|---|---|---|---|---|
| 1 | Traditional Energy | FCG | 75.4 | 20% | -4.81% | XOP -6.4% · XLE -0.8% |
| 2 | Nuclear Energy | URA | 69.0 | 20% | -1.87% | URNM -5.2% · NLR +3.0% |
| 3 | Agriculture & Livestock | MOO | 55.5 | 10% | +3.32% | VEGI +2.1% · WEAT +6.3% |
| 4 | Defense & Aerospace | ITA | 55.3 | 10% | +1.61% | XAR +2.2% · ROKT +3.0% |
| 5 | Industrial Metals | PICK | 52.7 | 10% | +11.06% | COPX +10.5% · REMX +3.8% |
| 6 | Utilities & Infrastructure | PAVE | 49.8 | 10% | +4.73% | IGF +5.1% · XLU +9.2% |
| 7 | Precious Metals | SLV | 45.2 | 10% | +0.59% | GDX +6.8% · GLD +2.2% |
| 8 | Technology | XLK | 24.6 | 10% | +9.72% | CIBR +5.8% · IGV +7.0% |
| 9 | AI | SMH | 21.0 | 0% | +5.78% | AIQ +5.1% · BOTZ +6.5% |
| 10 | Emerging Markets | INDA | 9.2 | 0% | -5.21% | IEMG +1.2% · ILF +4.4% |
Traditional Energy — FCG
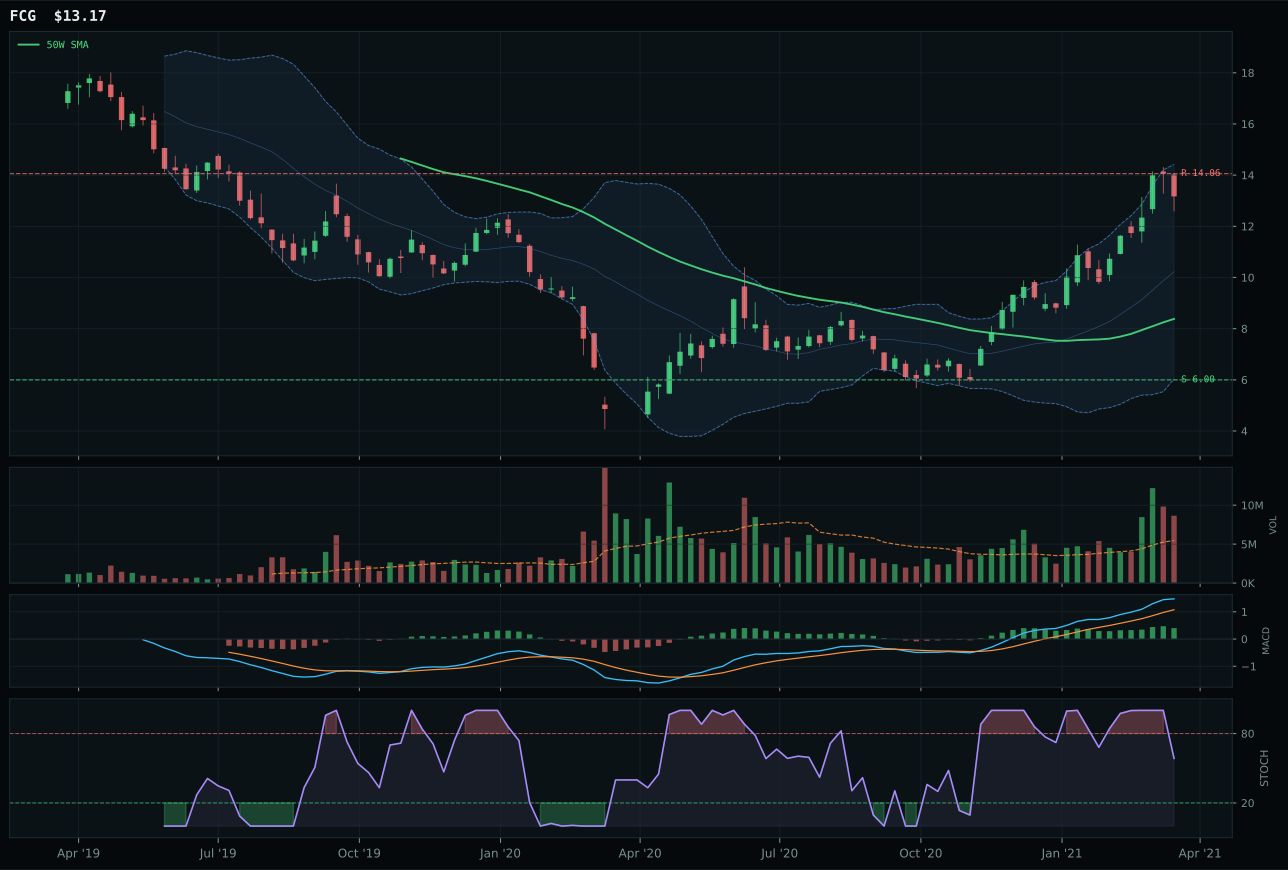
FCG has a vertical extension profile with 37.3% 13-week relative strength versus SPY.
A failed hold above support would weaken the setup.
Actionable but governed by invalidation levels.
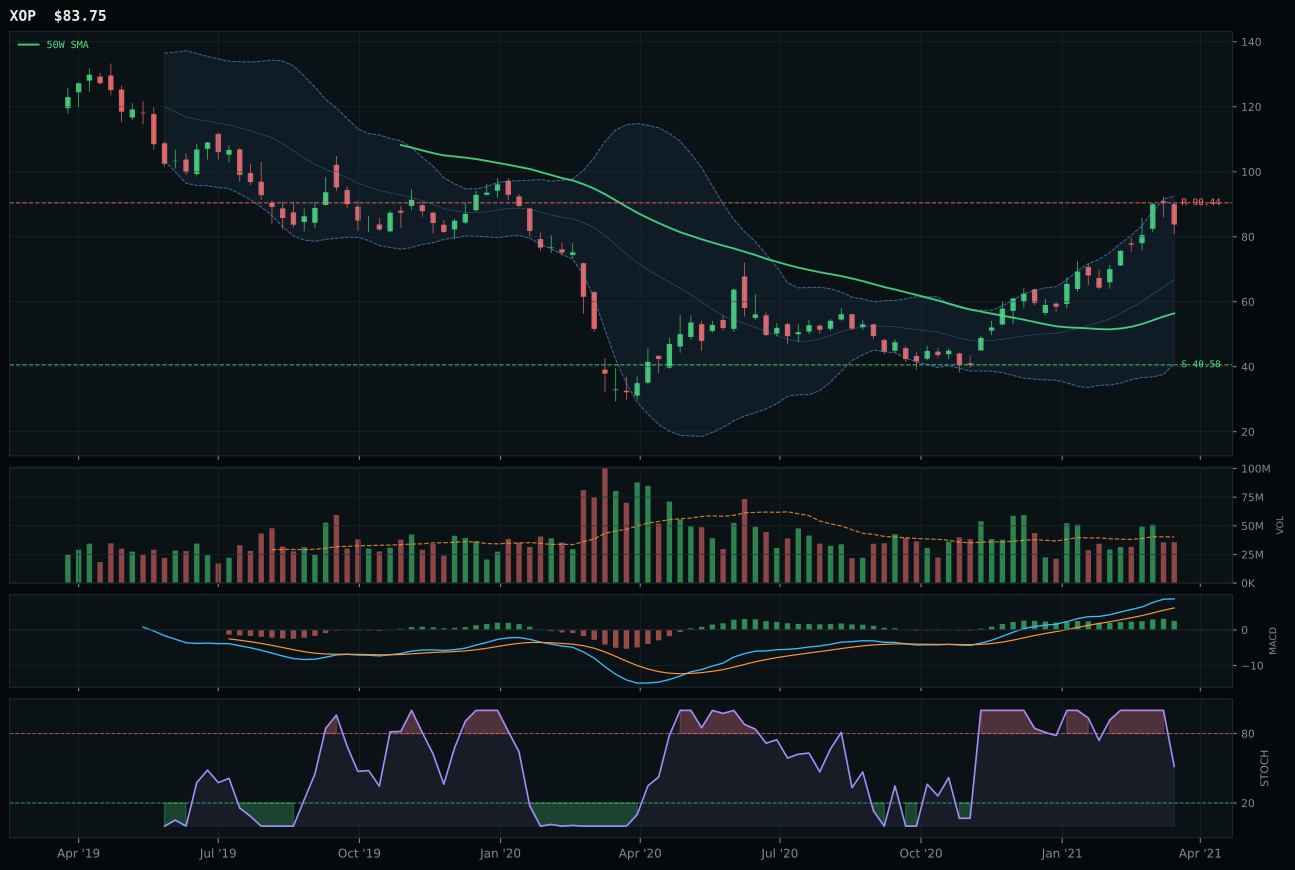
XOP has a vertical extension profile with 35.0% 13-week relative strength versus SPY.
A failed hold above support would weaken the setup.
Actionable but governed by invalidation levels.
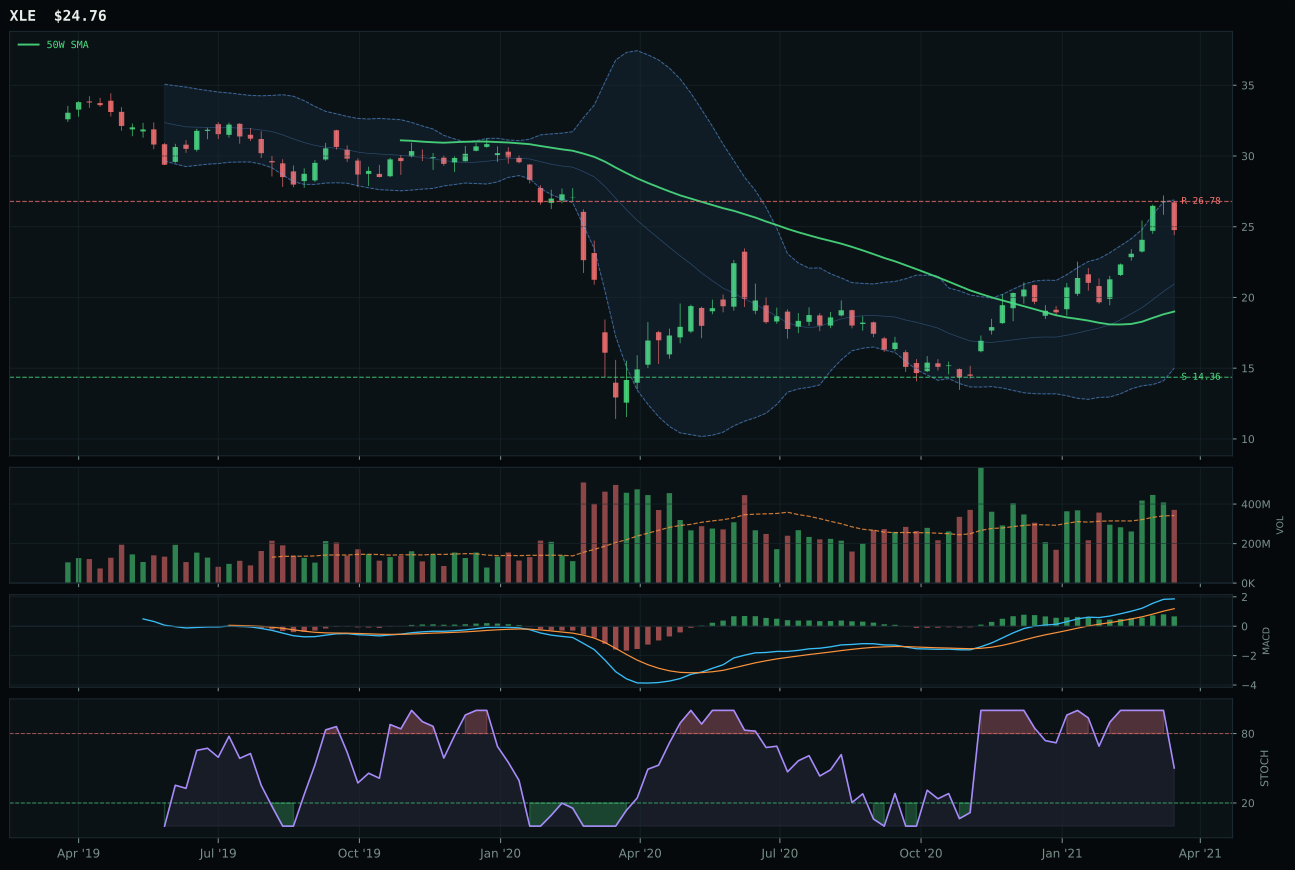
XLE has a vertical extension profile with 20.2% 13-week relative strength versus SPY.
A failed hold above support would weaken the setup.
Actionable but governed by invalidation levels.
FCG claims the top-2 slot despite a challenging chart structure because its 42.8% 13-week return and 37.3% relative strength versus SPY establish undeniable category leadership that the allocator cannot ignore under AltSeason conditions. The momentum confirmation score of 100.0 and persistence at 85.2/100 reflect that volume distribution is confirming price strength, a bullish sponsorship signal despite the distribution pressure notation at 1.58x the 20-week average—heavy volume into strength often precedes further advance in commodity cycles. XOP lost the representation decision by just 1.8 points despite scoring 58 composite versus FCG's 56 because category-relative strength at 2.4% for FCG versus 0.0% for XOP tips the tiebreaker toward FCG. The setup shows price above the 50-week but below the 200-week moving average, creating a recovery structure rather than a new-high breakout; this is precisely the setup that carries lowest whipsaw risk in a transition regime.
Traditional Energy earns top-2 overweight at 10% allocation based on its final category score of 75.4, the second-highest in the portfolio this week, anchored by exceptional macro alignment at 85.0/100. Energy scarcity, inflation pressure, supply shortage, and real-asset sponsorship all register as active, creating a 16-point macro boost that elevates the category above most peers. FCG's technical evidence of 46.5/100 is respectable but not outstanding—the 22.9/100 risk/reward reflects the extreme extension 57.1% above the 50-week moving average—yet the category score of 75.4 demonstrates that macro gravitation and momentum persistence outweigh timing concerns in the current regime. The 10% allocation reflects conviction that energy scarcity is structural, not cyclical, and that FCG's extreme relative strength at 37.3% versus SPY justifies entry even at elevated risk/reward ratios. This is a concentrated bet on commodity inflation durability under AltSeason.
Nuclear Energy — URA
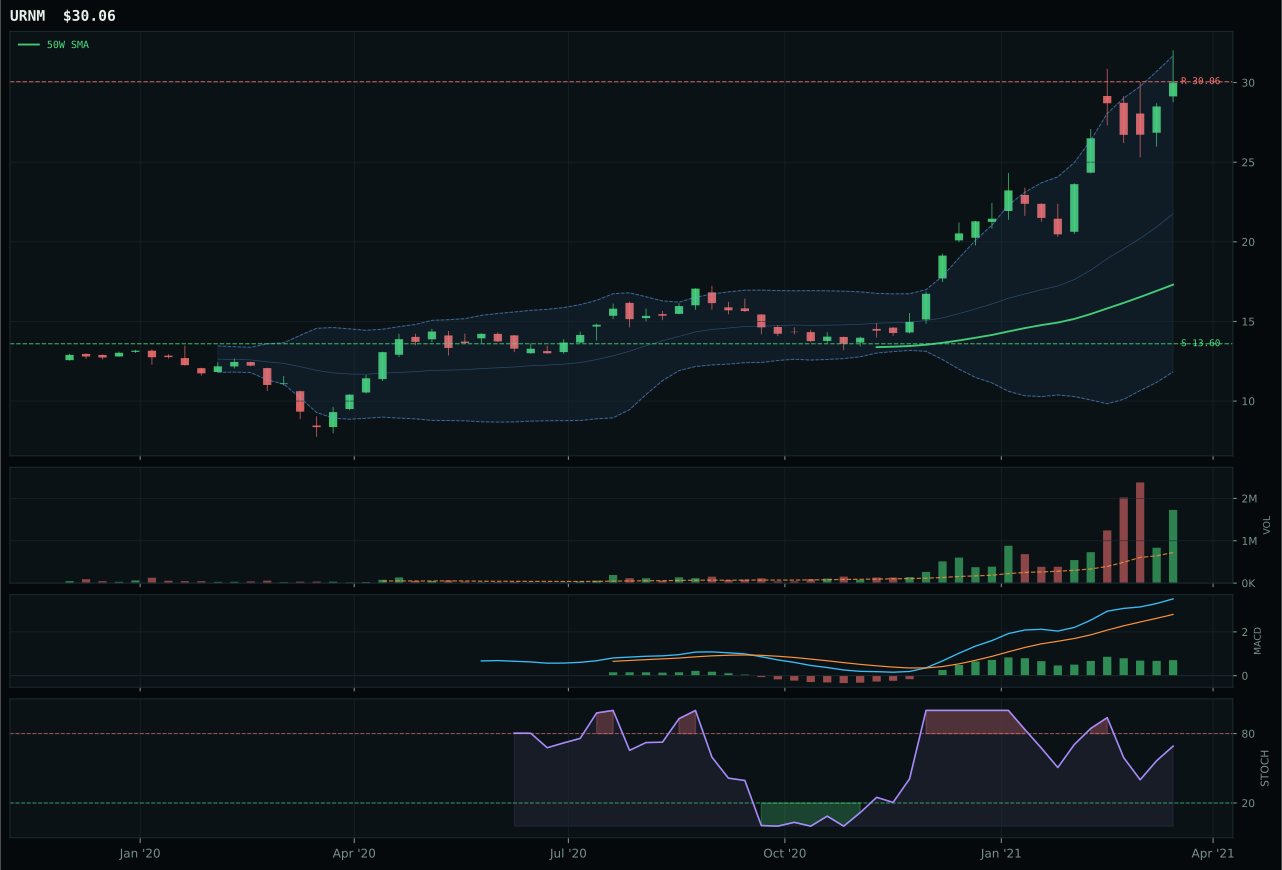
URNM has a vertical extension profile with 40.9% 13-week relative strength versus SPY.
A failed hold above support would weaken the setup.
Actionable but governed by invalidation levels.
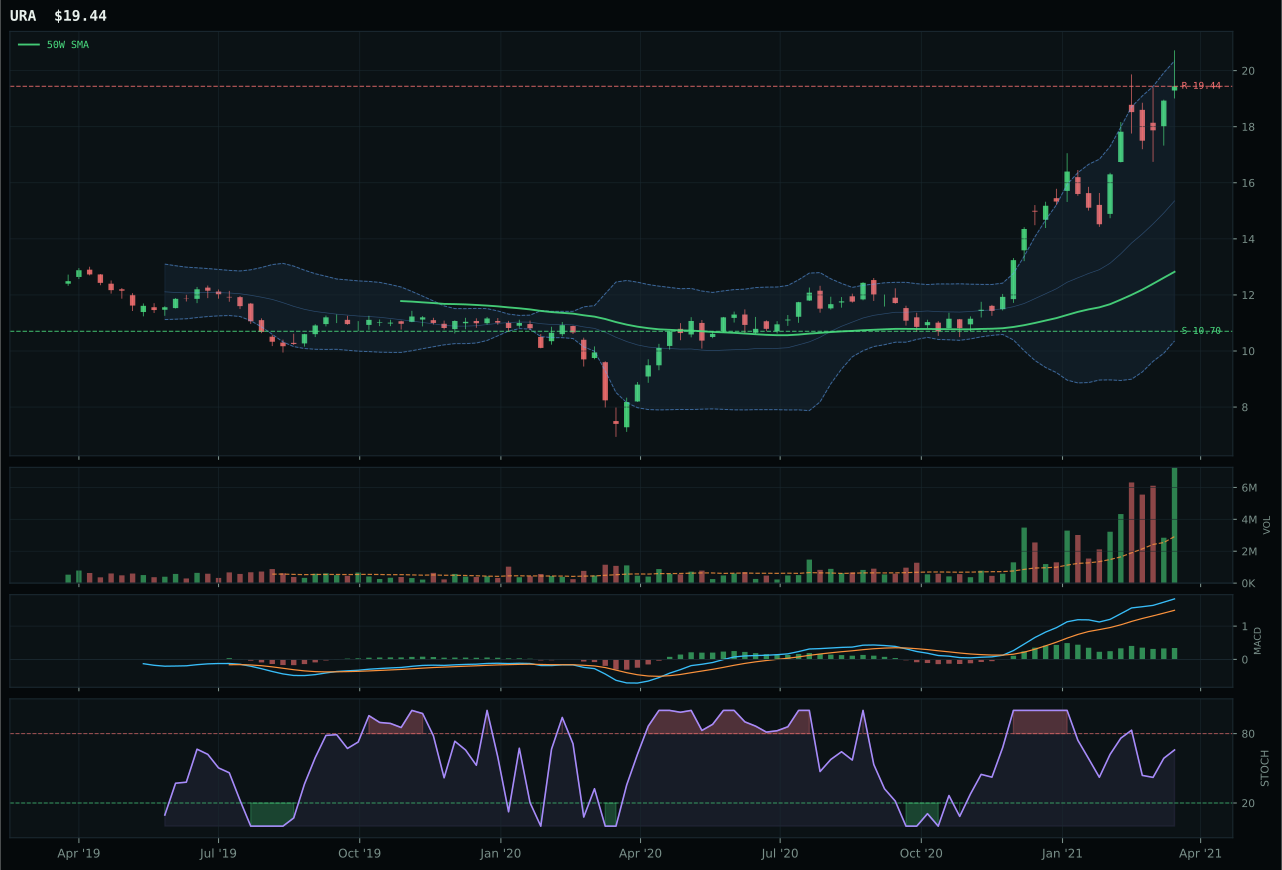
URA has a vertical extension profile with 24.4% 13-week relative strength versus SPY.
A failed hold above support would weaken the setup.
Actionable but governed by invalidation levels.
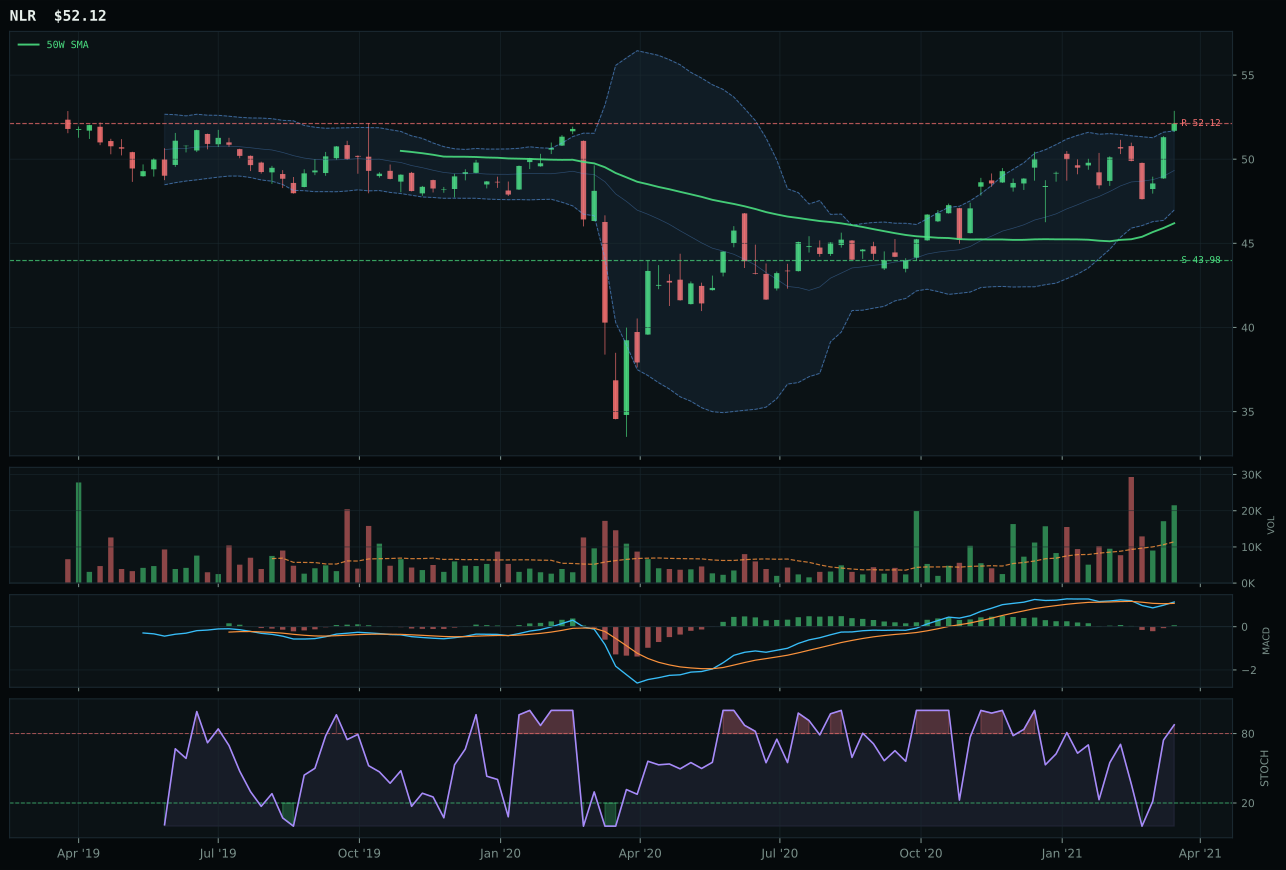
NLR has a neutral structure profile with -1.3% 13-week relative strength versus SPY.
A failed hold above support would weaken the setup.
Tracked, but not top-2 eligible because: .
URA wins the nuclear category with a flawless 100.0 trend score from price above both 50-week and 200-week moving averages, a strong 1.7% 50-week slope, and 24.4% relative strength versus SPY that establishes clear sector leadership. The 29.9% 13-week return and 66.0% 26-week return deliver exceptional absolute momentum, and critically, the volume confirmation at 88.0/100 combined with 2.75x the 20-week average in accumulation/confirmation volume signals institutional accumulation at extended levels—the ultimate strength confirmation. URNM lost despite scoring 92.8/100 on technical evidence because it sits 73.6% above its 50-week moving average versus URA's 51.6%, and its risk/reward deteriorates to 28.2 versus URA's 43.8, meaning every new buyer in URNM faces worse asymmetry. URA's persistence at 98.7/100 is exceptional, reflecting that relative strength, MACD improvement, and volume are all confirming together.
Nuclear Energy claims the second top-2 slot at 10% allocation with a final category score of 69.0, earning this tier alongside Traditional Energy as the two highest-conviction positions in the portfolio this week. The macro fit stands at 64.0/100 with energy scarcity, real-asset sponsorship, and inflation pressure all active, directly supporting uranium and nuclear assets under the current Transition/Mixed regime. URA's technical evidence of 87.1/100 is exceptional, driven by perfect trend confirmation, momentum at 100.0/100, volume-price confirmation at 88.0/100, and persistence at 98.7/100—these metrics indicate institutional capital is accumulating systematically rather than chasing on momentum. The 10% allocation reflects conviction that nuclear energy is experiencing a structural pivot toward scarcity sponsorship, and URA's clean uptrend with accumulation volume provides the cleanest entry point versus the more-extended URNM. This is the portfolio's highest-quality trend setup by persistence metrics.
Agriculture & Livestock — MOO
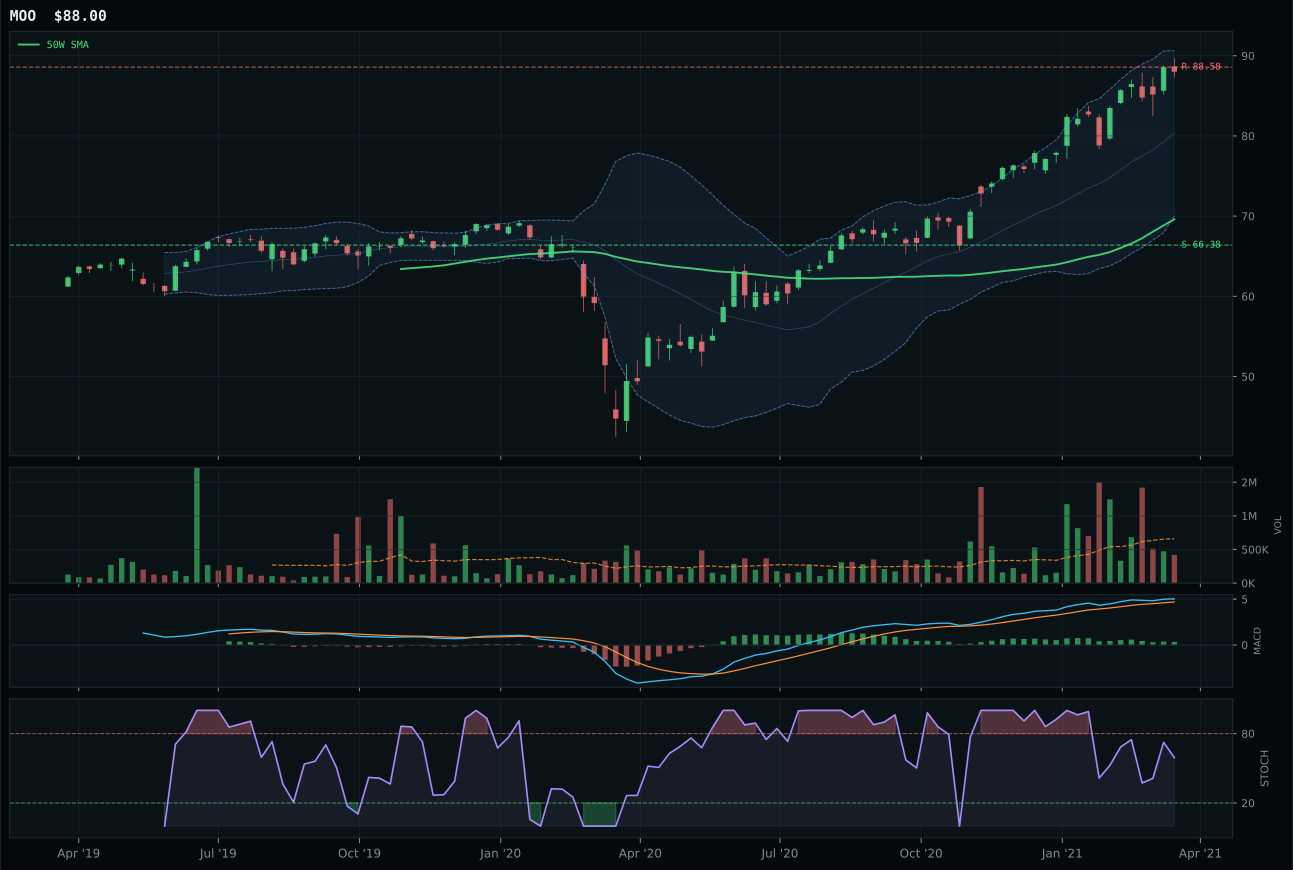
MOO has a vertical extension profile with 7.5% 13-week relative strength versus SPY.
A failed hold above support would weaken the setup.
Actionable but governed by invalidation levels.
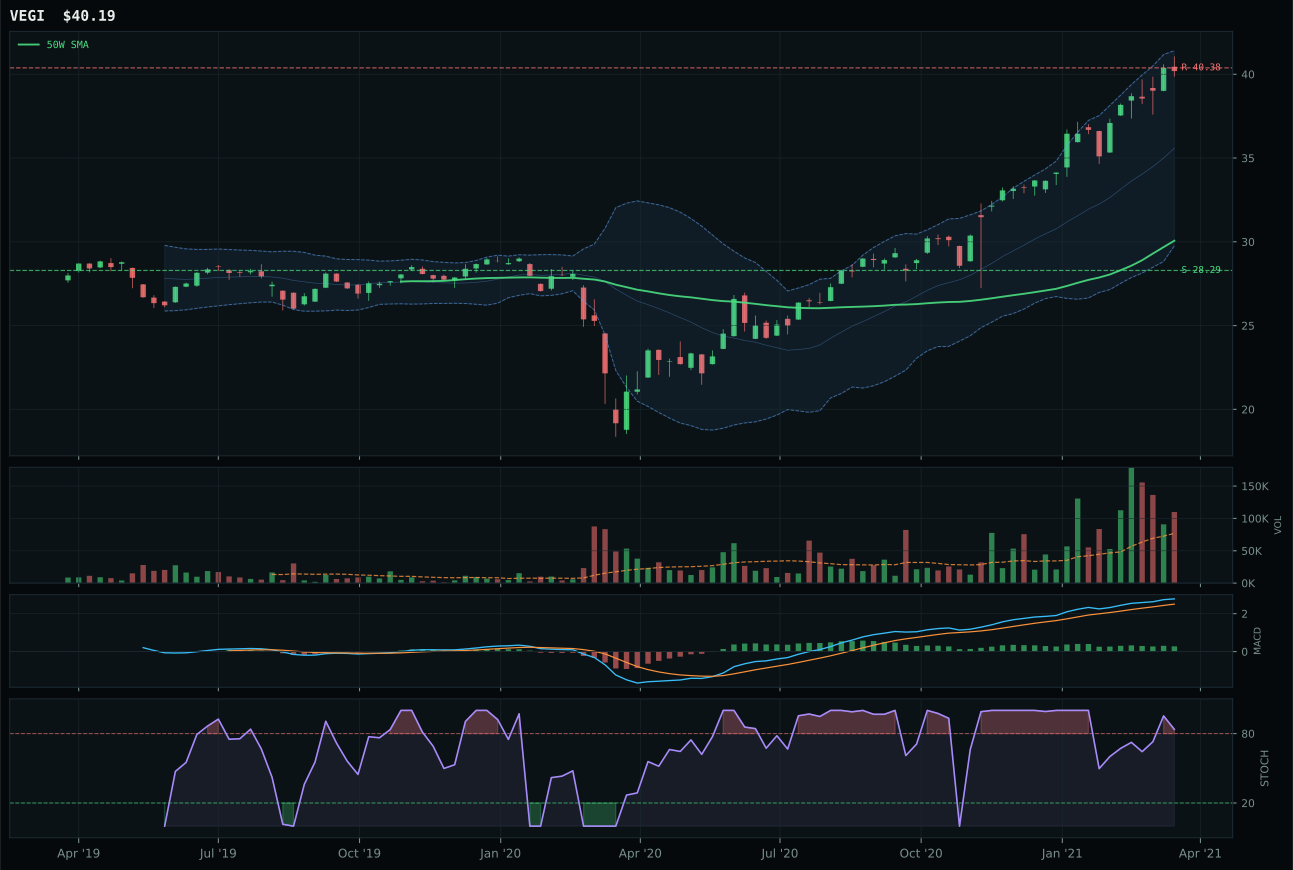
VEGI has a vertical extension profile with 13.9% 13-week relative strength versus SPY.
A failed hold above support would weaken the setup.
Tracked, but not top-2 eligible because: .
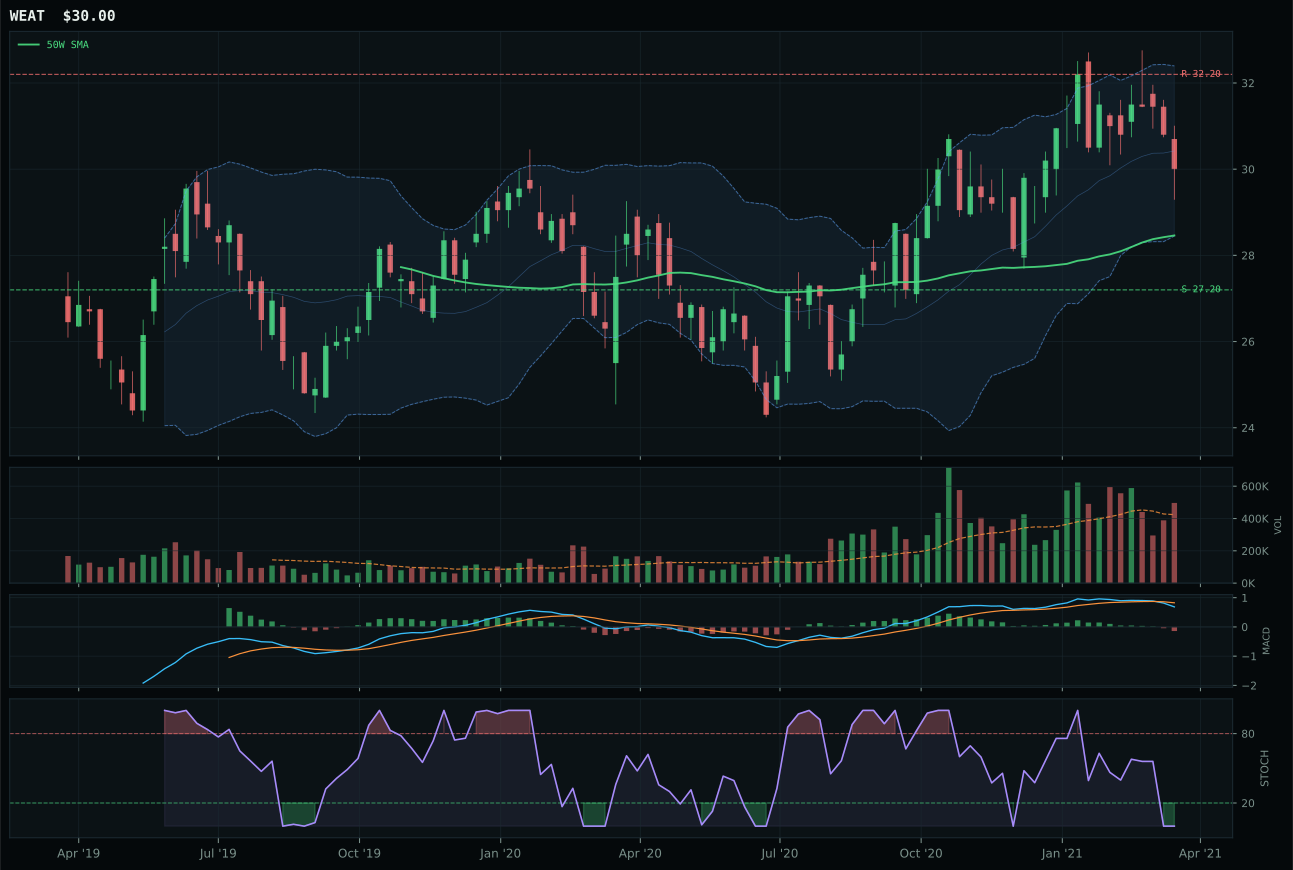
WEAT has a neutral structure profile with -3.8% 13-week relative strength versus SPY.
A failed hold above support would weaken the setup.
Actionable but governed by invalidation levels.
MOO wins with flawless trend confirmation at 100.0 from price above both 50-week and 200-week moving averages, a strong 1.1% 50-week slope, and 7.5% relative strength versus SPY that establishes sector leadership. The 13.0% 13-week return and 28.6% 26-week return deliver exceptional absolute momentum, and despite being extended 26.4% above the 50-week moving average, the rising mid-zone stochastic RSI at 0.59 shows momentum is controlled rather than reckless. VEGI lost because its stochastic RSI reached overbought momentum at 0.98 while stretched 33.7% above its 50-week moving average, creating a timing penalty that depressed its score to 32.0 versus MOO's 48.0 on the timing component. MOO's thin volume participation at 0.63x the 20-week average is the cost of an extended setup, but the 18.1-point gap to VEGI confirms the market is rotating toward the more prudently-timed entry.
Agriculture & Livestock secures 5% in tier-2 with a strong category-level final score of 55.5 supported by exceptional macro alignment at 86.0/100. Supply shortage and inflation pressure are both active descriptors that directly sponsor real-asset and commodity-producer equity, and the Transition/Mixed regime moderately supports the category thesis. MOO's technical evidence score of 58.5/100 and macro/narrative fit of 70.0/100 establish a solid foundation, with particular strength in momentum confirmation at 79.7/100 and relative strength leadership at 7.5% versus SPY. The category holds tier-2 weight rather than top-2 because two other categories score higher on the total opportunity hierarchy, but the persistence at 66.3/100 and volume-price confirmation at 62.7/100 suggest this position will compound if commodity scarcity narratives deepen. Agribusiness equity is building intermediate-term structural conviction.
Defense & Aerospace — ITA
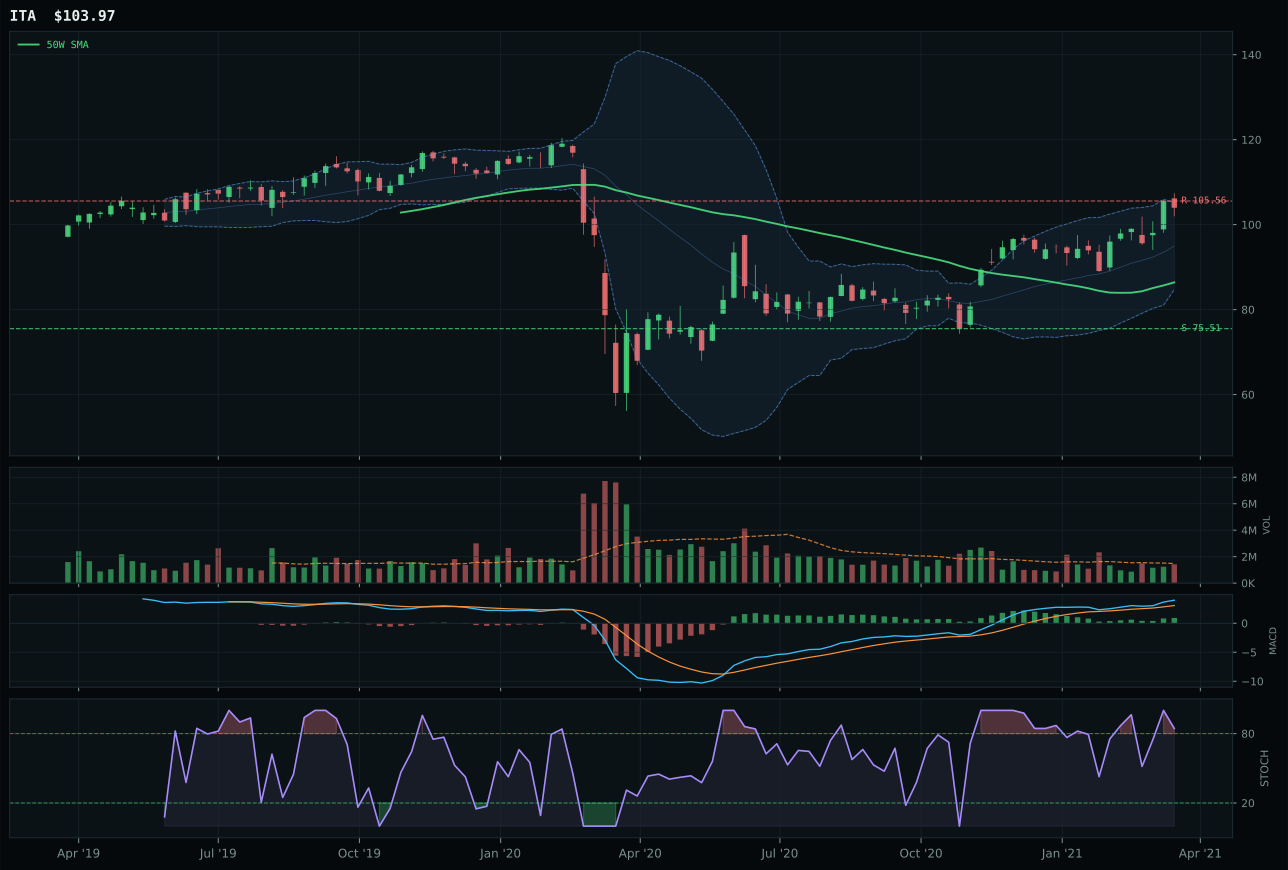
ITA has a vertical extension profile with 4.9% 13-week relative strength versus SPY.
A failed hold above support would weaken the setup.
Actionable but governed by invalidation levels.
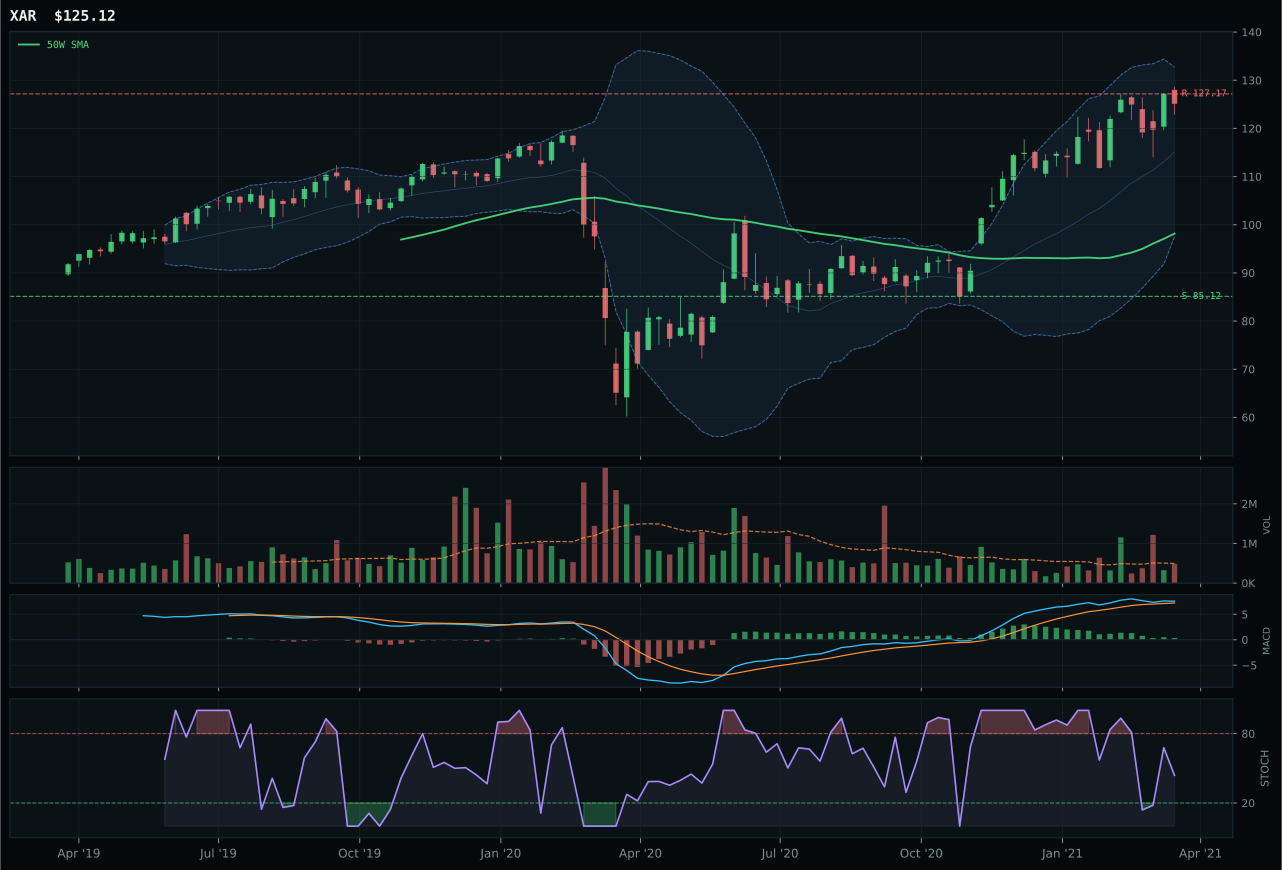
XAR has a vertical extension profile with 6.5% 13-week relative strength versus SPY.
A failed hold above support would weaken the setup.
Actionable but governed by invalidation levels.
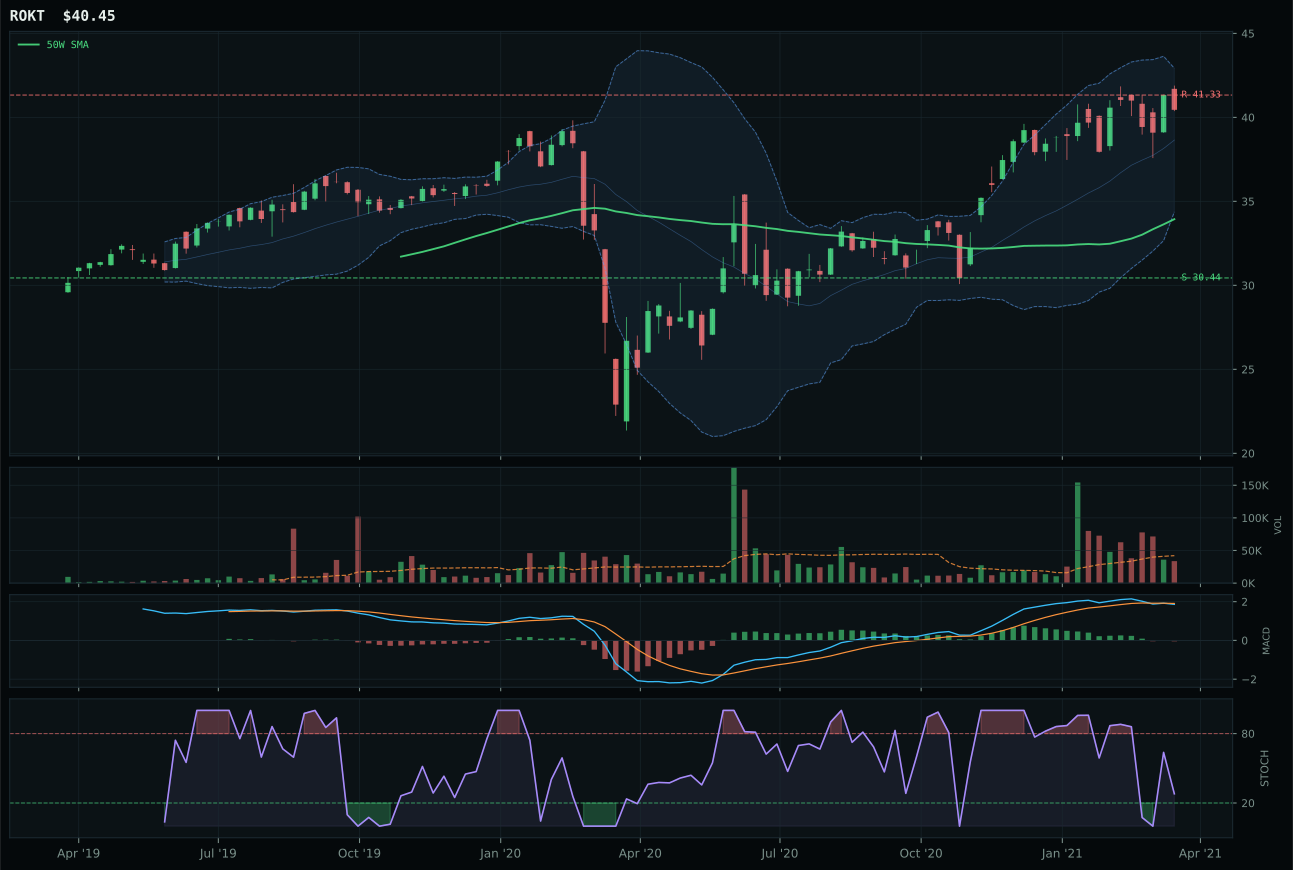
ROKT has a vertical extension profile with 1.1% 13-week relative strength versus SPY.
A failed hold above support would weaken the setup.
Tracked, but not top-2 eligible because: .
ITA wins decisively with a perfect trend score of 100.0 anchored on price above both the 50-week and 200-week moving averages, a robust 0.8% 50-week slope, and 4.9% relative strength versus SPY that establishes genuine market leadership. The 10.4% 13-week return and overbought stochastic RSI momentum at 0.84 combined with improving MACD confirm that the uptrend is being actively accumulated despite being extended 20.3% above the 50-week level. XAR lost this decision because its MACD is bullish but flattening rather than improving, signaling divergence, and it sits 27.5% above its 50-week moving average versus ITA's 20.3%, creating a relative timing disadvantage on the extension metric. The 7.1-point score gap reflects ITA's superior structure cleanliness at 73.3 versus 72.6, not a photograph moment but a meaningful technical advantage in a category where both ETFs share identical risk/reward at 37.7/38.
Defense & Aerospace claims 5% in tier-2 allocation, ranking outside the top-2 because its final category score of 55.3 trails the two highest-scoring opportunities this week. However, the category itself carries strong macro support at 64.0/100 from active broad market bear and dollar pressure descriptors that favor defensive equity positioning and hard assets. The structural case is sound: ITA shows perfect trend with bullish and improving MACD, strong momentum confirmation at 88.6/100, and volume-price persistence at 64.9/100. The allocation reflects portfolio balance—defense & aerospace is held as a secondary overweight, not a primary swing. For this category to advance to top-2, either the category score would need to break above the current tier-1 threshold or sector-level leadership would need to extend further, particularly through acceleration in the 4-week momentum signal.
Industrial Metals — PICK
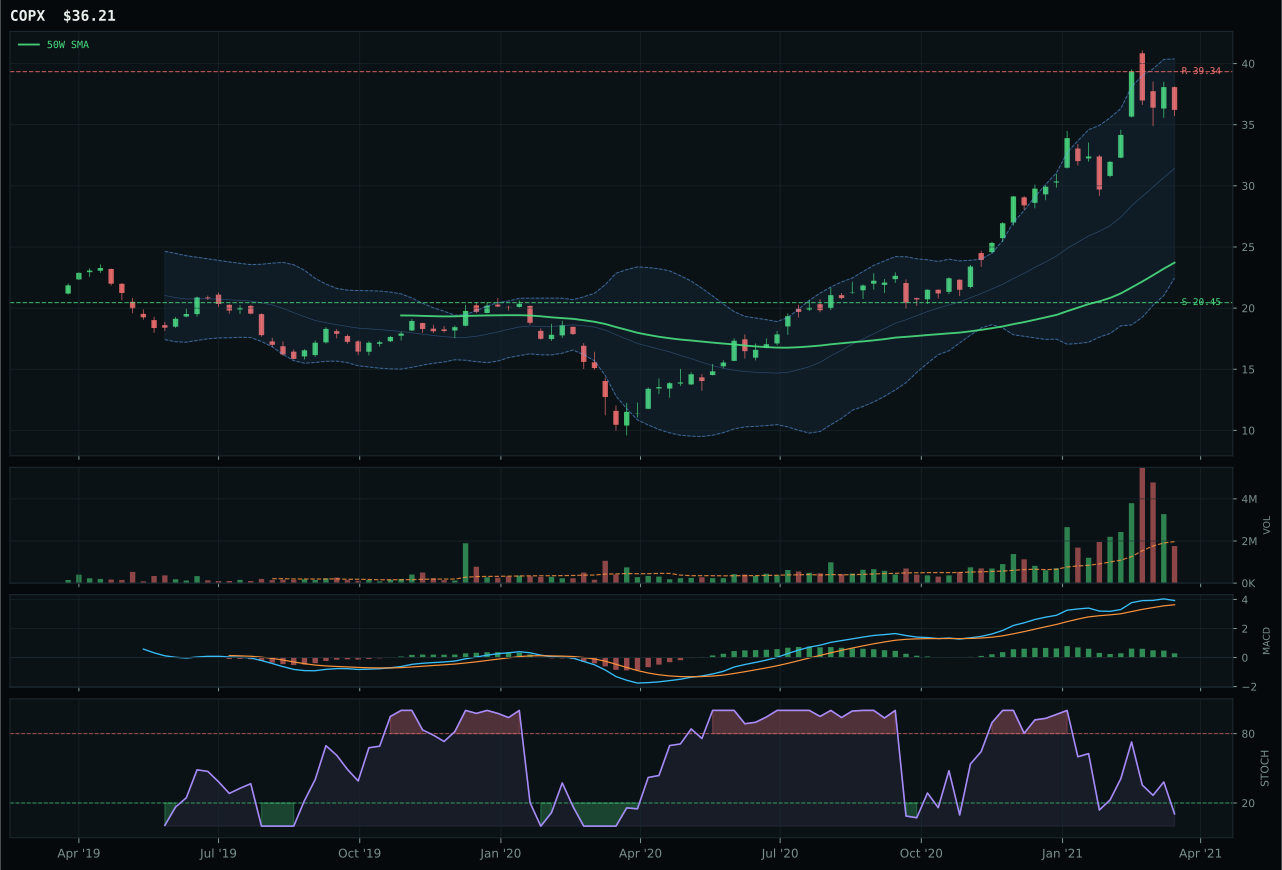
COPX has a vertical extension profile with 16.1% 13-week relative strength versus SPY.
A failed hold above support would weaken the setup.
Actionable but governed by invalidation levels.
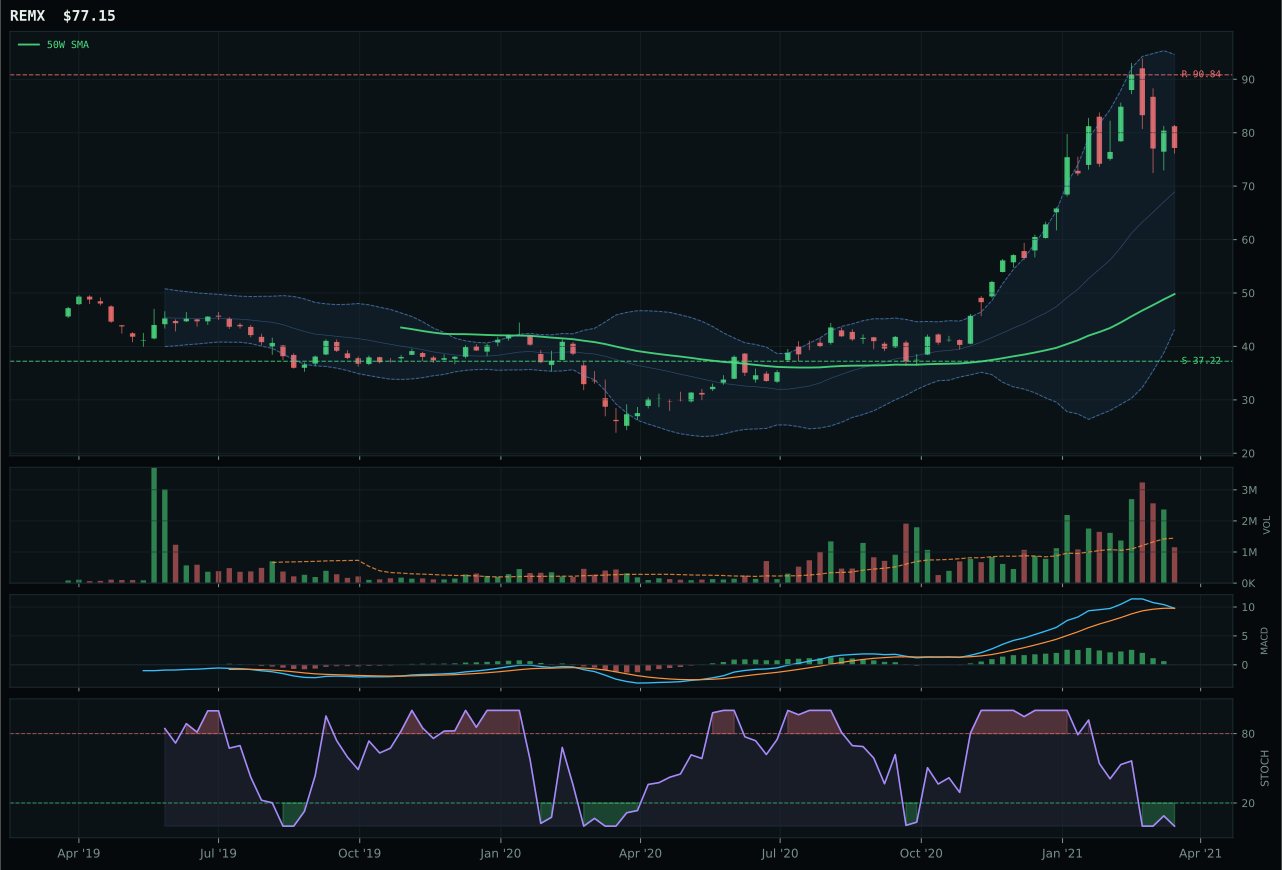
REMX has a vertical extension profile with 22.0% 13-week relative strength versus SPY.
A failed hold above support would weaken the setup.
Actionable but governed by invalidation levels.
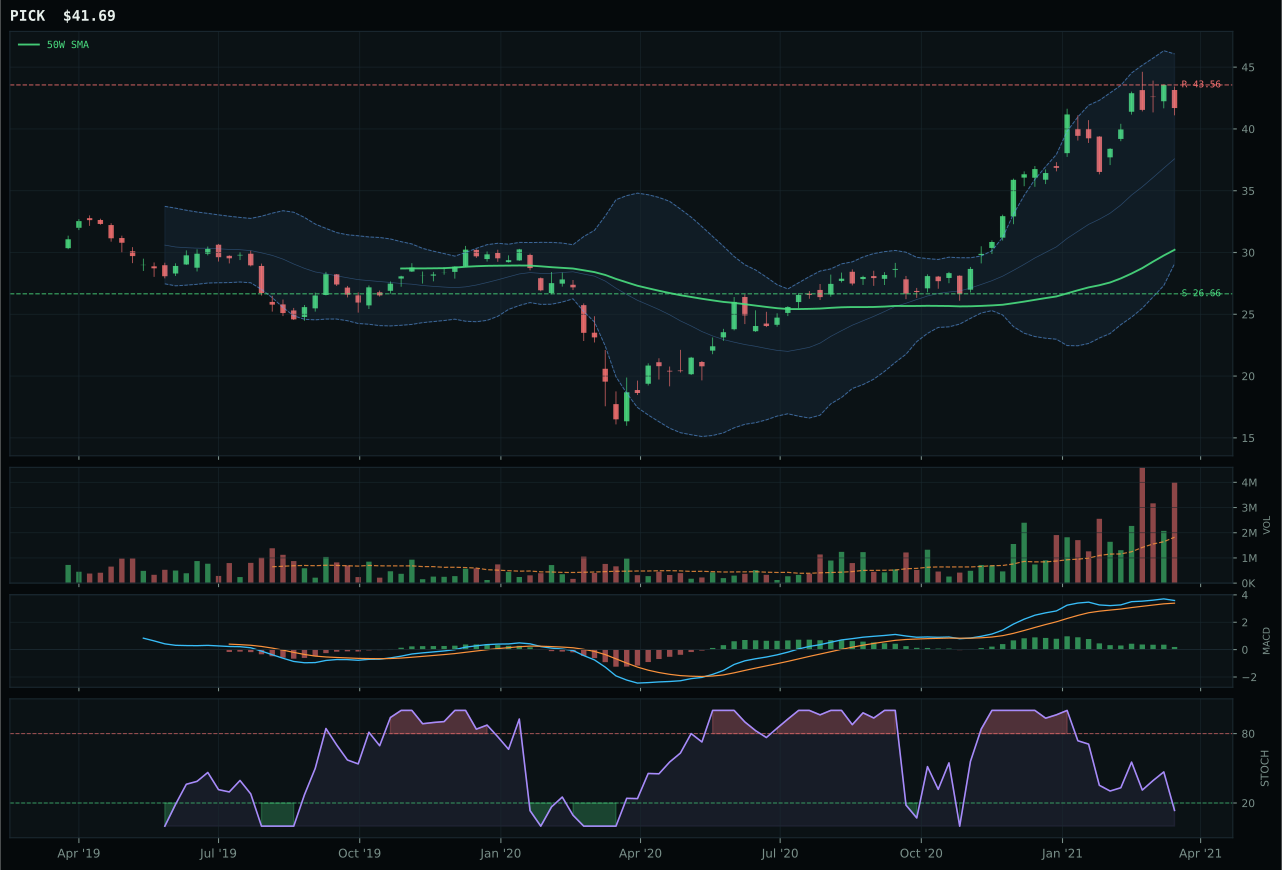
PICK has a vertical extension profile with 7.9% 13-week relative strength versus SPY.
A failed hold above support would weaken the setup.
Actionable but governed by invalidation levels.
PICK wins its category as the technical representative despite trading lower on the reasoning layer because COPX—the mechanical technical leader at 61.2—is stretched 52.7% above its 50-week moving average versus PICK's 38.0%, creating a critical timing penalty that the allocator applies through the setup quality filter. PICK's 100.0 trend score and 7.9% relative strength versus SPY are genuine, and the 13.4% 13-week return delivers real performance, but the -8.2% category-relative strength versus COPX reveals PICK is the laggard peer. However, COPX's extreme 52.7% extension above the 50-week level and -6.8 composite disadvantage to PICK's 56 signal that the optimal entry sits with the less-extended name despite lower absolute momentum. The stochastic RSI oversold at 0.14 in both names suggests a mean-reversion platform is forming, but PICK offers lower risk to entry because it is not as deep into the retracement zone.
Industrial Metals holds 5% in tier-2, scoring 52.7 as a category with strong macro support at 66.0/100 from metals scarcity and commodity breadth positive descriptors that help compensate for dollar pressure and credit stress headwinds. PICK's technical evidence of 19.7/100 is weak—reflecting distribution pressure at 2.19x the 20-week average and a low momentum confirmation at 53.3/100—yet the category survives in allocation because the macro fit dominates the decision. The portfolio is holding this position as a scarcity hedge rather than a technical trend-follow. PICK's risk/reward at 38.4/100 offers more downside to support than upside to resistance, a trade-off the allocator accepts because underlying metal shortage and supply constraints are the primary driver. Advancement to tier-1 would require clearing the 52-week high decisively and establishing a new trend structure above current resistance levels.
Utilities & Infrastructure — PAVE
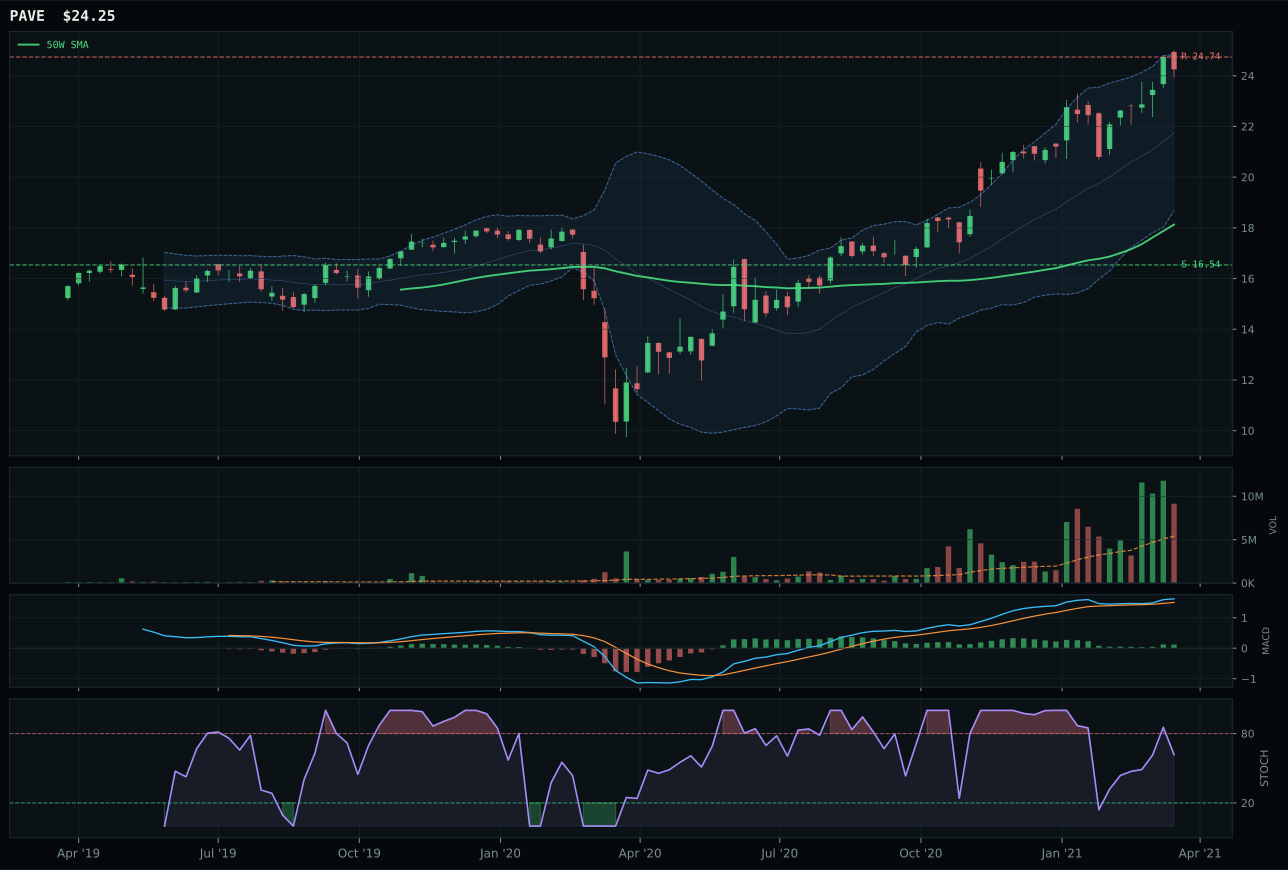
PAVE has a vertical extension profile with 10.4% 13-week relative strength versus SPY.
A failed hold above support would weaken the setup.
Actionable but governed by invalidation levels.
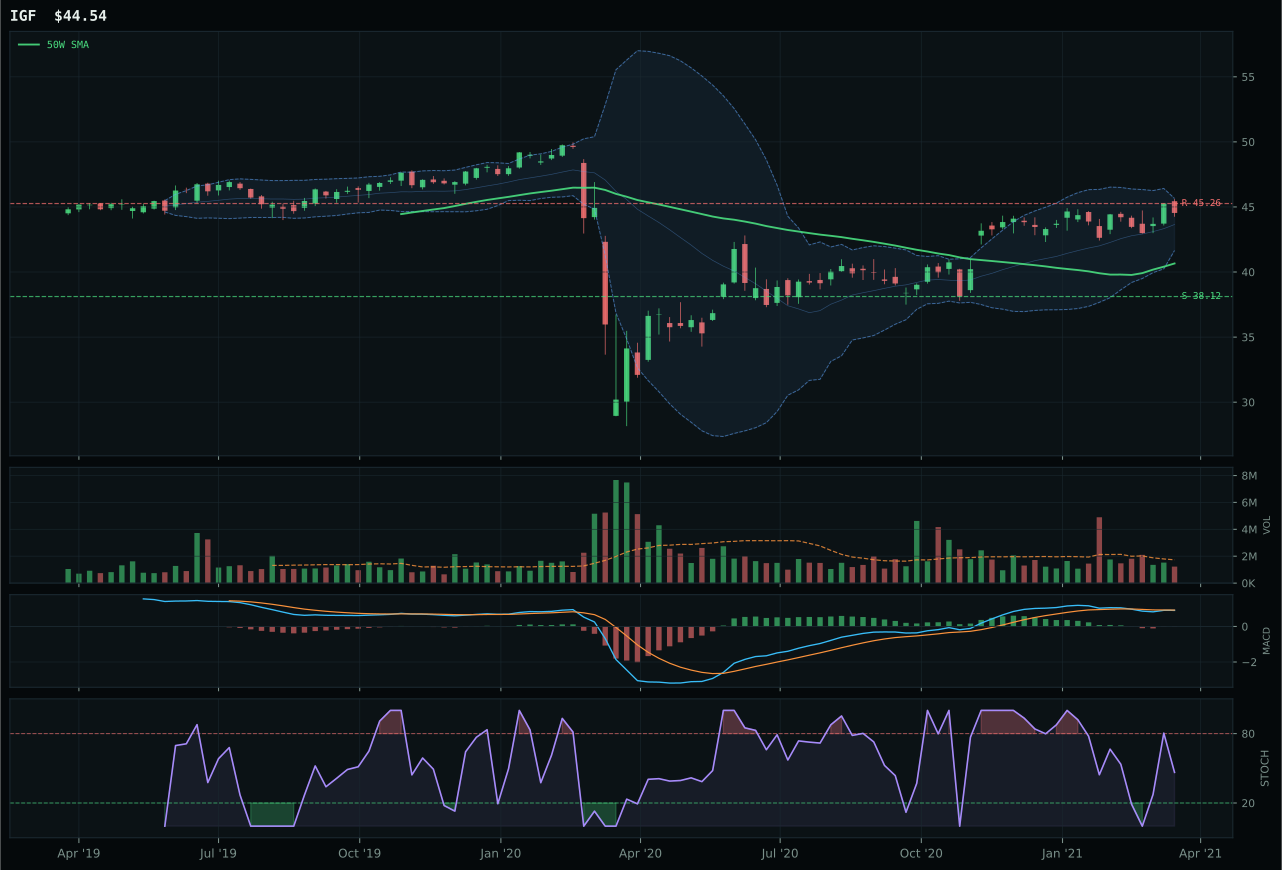
IGF has a neutral structure profile with -3.0% 13-week relative strength versus SPY.
A failed hold above support would weaken the setup.
Actionable but governed by invalidation levels.
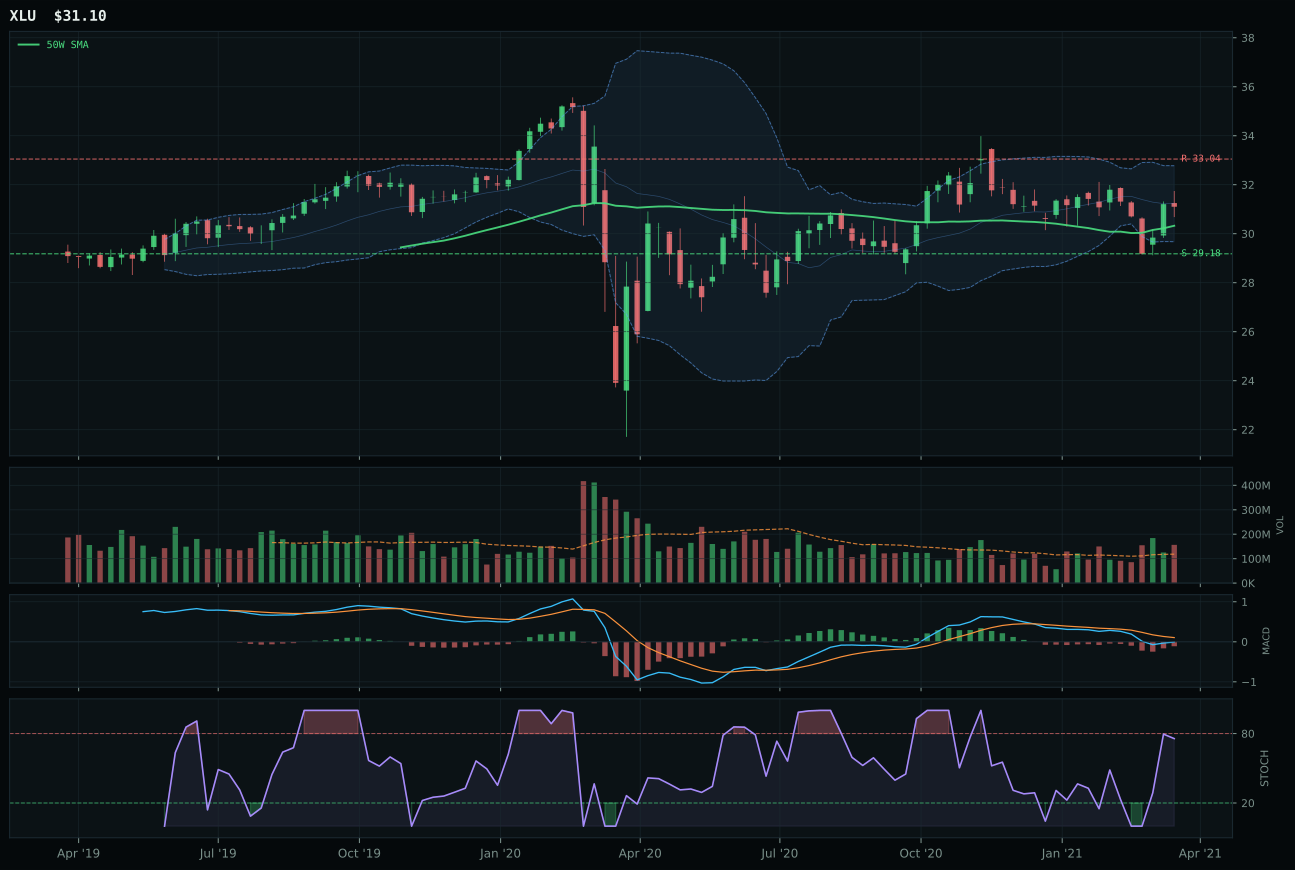
XLU has a compression near 50W profile with -5.6% 13-week relative strength versus SPY.
A failed hold above support would weaken the setup.
Actionable but governed by invalidation levels.
PAVE wins utilities and infrastructure with a perfect trend score of 100.0 from price decisively above both moving averages, a strong 1.4% 50-week slope, and 10.4% relative strength versus SPY that establishes clear sector leadership. The momentum confirmation score of 100.0 driven by 15.9% 13-week return and 13.4% category-relative strength over peers reveals that PAVE is the sole infrastructure ETF earning peer sponsorship within its basket. IGF lost despite carrying superior defensive characteristics because its MACD is bearish/weakening versus PAVE's bullish and improving, and more critically, IGF's -3.0% relative strength versus SPY and 0.0% category-relative strength signal market indifference despite its 44.4/100 technical evidence. The 2.3-point score gap reflects PAVE's 13.4% category relative strength commanding a decisive advantage in the allocation decision framework.
Utilities & Infrastructure receives 5% in tier-2 with a final category score of 49.8 supported by moderate macro alignment at 52.0/100 where Transition/Mixed regime conditions and broad market bear descriptors provide modest tailwinds. PAVE's technical evidence of 49.5/100 and macro/narrative fit of 49.0/100 create balance but insufficient conviction for top-2 consideration. The structure shows 100.0 trend confirmation with bullish and improving MACD, yet the extended 33.8% position above the 50-week moving average and low risk/reward at 29.8/100 signal that PAVE has already absorbed much of its upside. The allocation is held as a defensive secondary position within the infrastructure theme, not as a primary swing. Category advancement to top-2 would require either a material increase in credit stress relief (currently penalizing utilities at -5) or inflation pressure reversal that strengthens the income-yield narrative. For now, PAVE provides steady dividend-backed support with momentum persistence at 64.9/100 but lacks the explosive setup structure of the top-2 energy categories.
Precious Metals — SLV
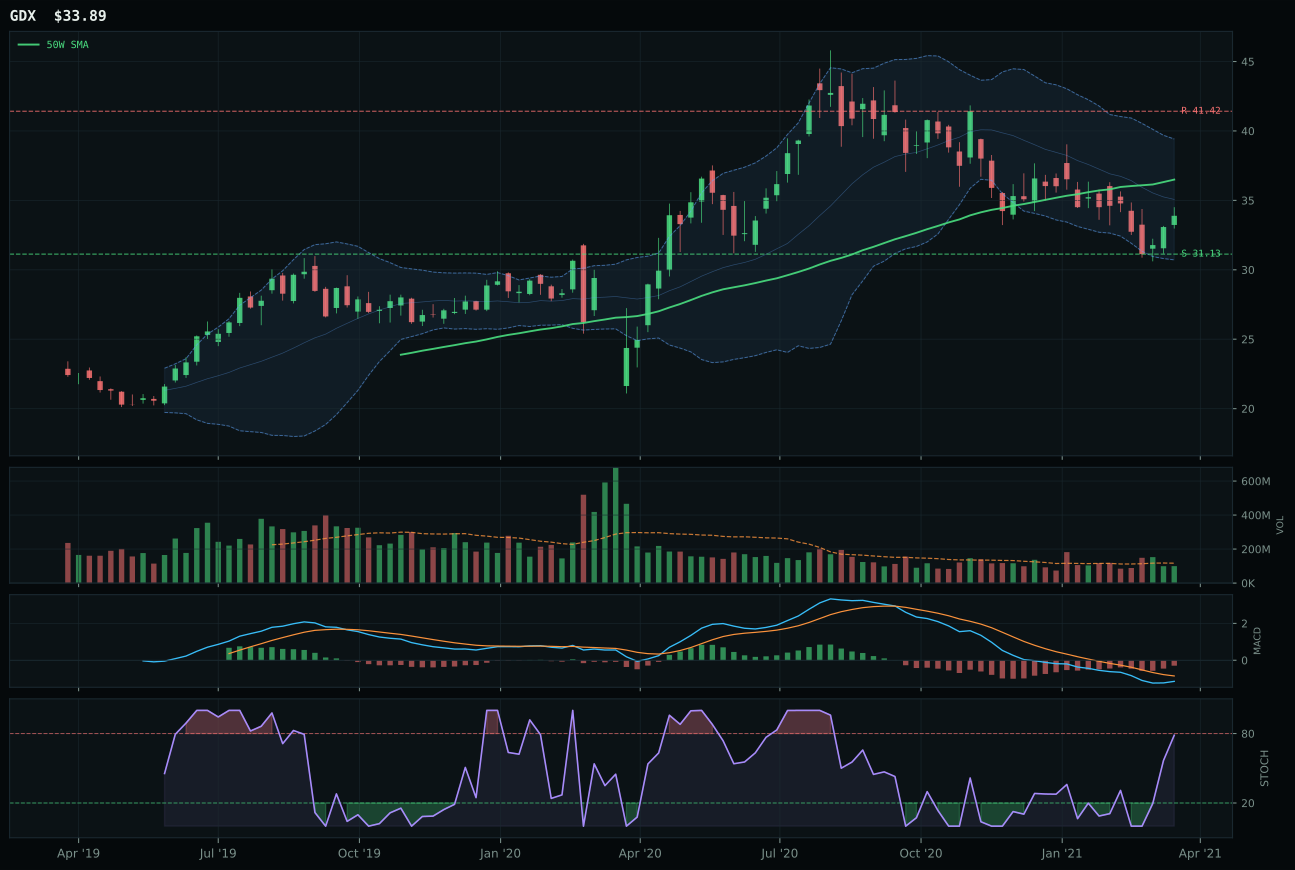
GDX has a neutral structure profile with -12.9% 13-week relative strength versus SPY.
A failed hold above support would weaken the setup.
Actionable but governed by invalidation levels.
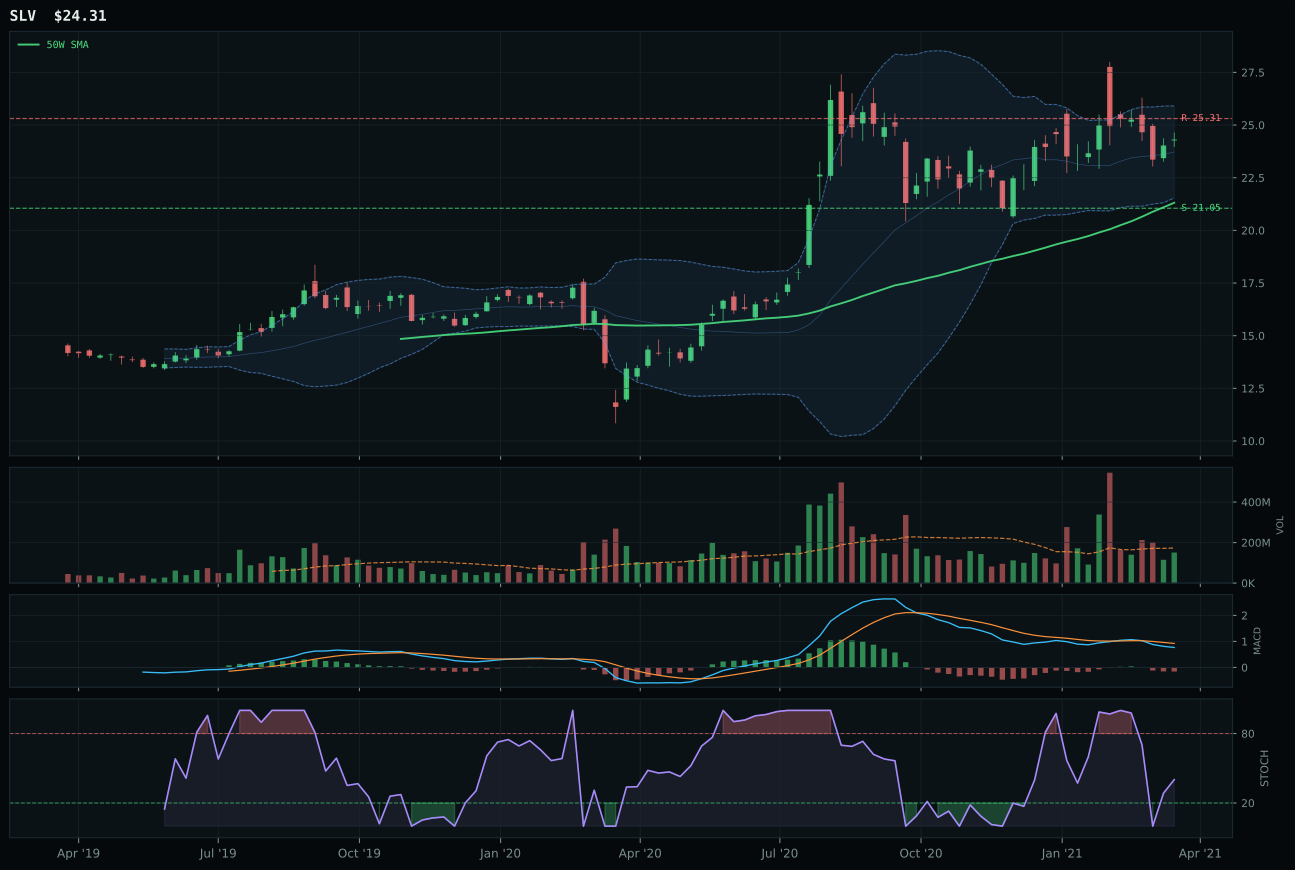
SLV has a neutral structure profile with -4.0% 13-week relative strength versus SPY.
A failed hold above support would weaken the setup.
Actionable but governed by invalidation levels.
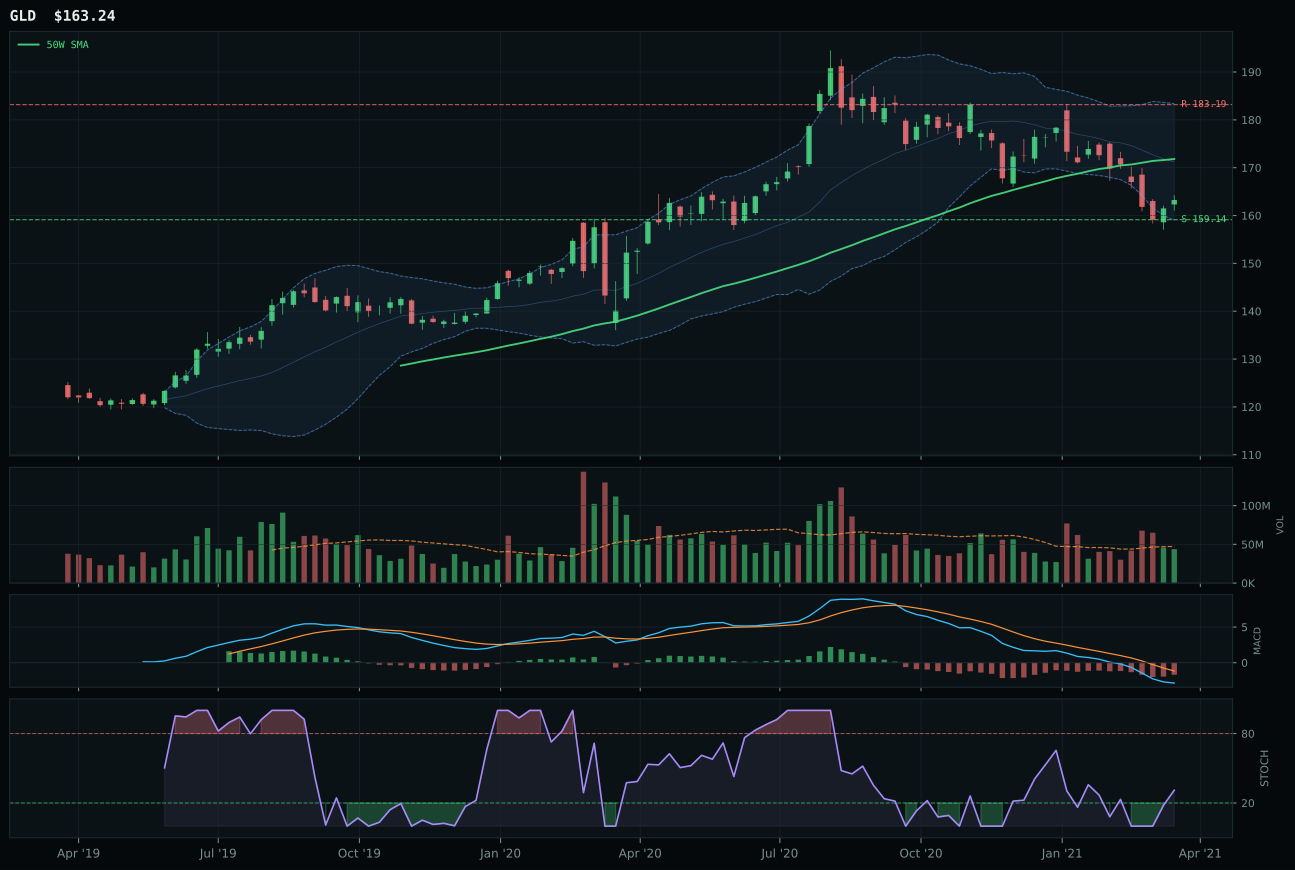
GLD has a pullback into support profile with -13.0% 13-week relative strength versus SPY.
A failed hold above support would weaken the setup.
Actionable but governed by invalidation levels.
SLV wins its category despite landing in tier-2 because it delivers 8.8% relative strength versus the precious metals basket median while GDX—which ranks higher on the reasoning layer at 54.9 technical evidence—carries -12.9% relative strength versus SPY and 0.0% category-relative strength, a sponsor deficit the allocator cannot ignore. Both charts sit in neutral structure with price roughly 14% above the 50-week moving average and MACD weakness, but SLV's falling/neutral stochastic RSI at 0.40 is less stretched than GDX's mid-zone positioning, granting a timing advantage. The 4.4-point gap between the winner's 49.8 composite and GDX's 53.6 initially appears inverted until one examines the representation filter: SLV wins the allocation decision because it owns peers within its own basket, a critical sponsorship signal in a category where dollar pressure creates macro friction.
Precious Metals receives 5% allocation in tier-2, trailing the top-2 because its final category score of 45.2 reflects modest macro support at 53.0/100 with dollar pressure as the only active positive descriptor and credit stress actively penalizing the category. The technical case is neutral: price above both moving averages with a clean 1.0% 50-week slope, but MACD bearish/weakening and a -4.0% SPY-relative performance create headwinds that prevent metals from advancing into higher portfolio tiers. SLV's 70.0 timing score and 75.9 trend score are respectable, but momentum confirmation lags at 36.9/100 on a -3.8% 4-week return and weak volume confirmation at 48.4/100. The metals allocation is defensive insurance tied to inflation protection and monetary uncertainty, not a conviction swing. Conversion to top-2 would require either a dollar-weakness event or a credit-stress acceleration that forces safe-haven rotations.
Technology — XLK
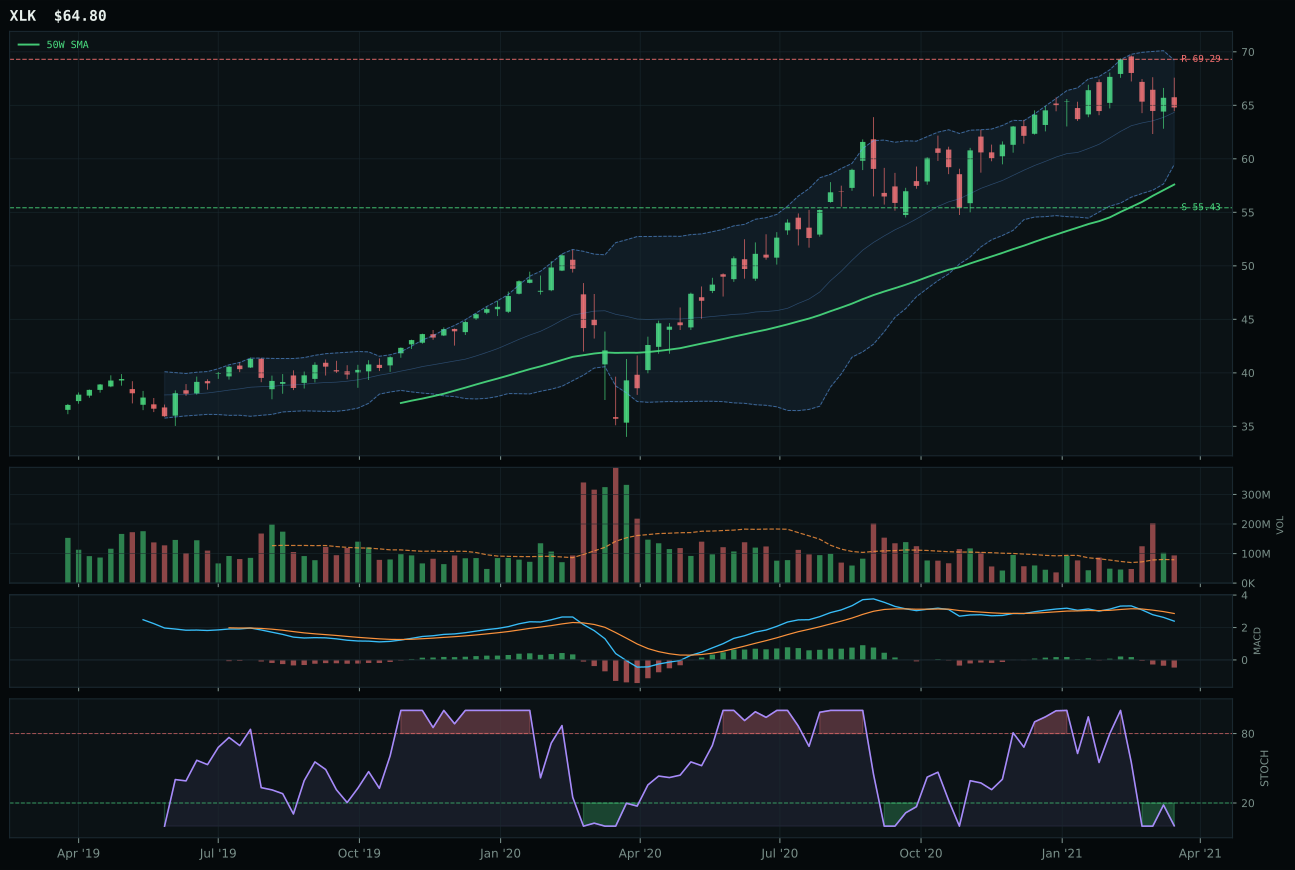
XLK has a neutral structure profile with -4.4% 13-week relative strength versus SPY.
A failed hold above support would weaken the setup.
Actionable but governed by invalidation levels.
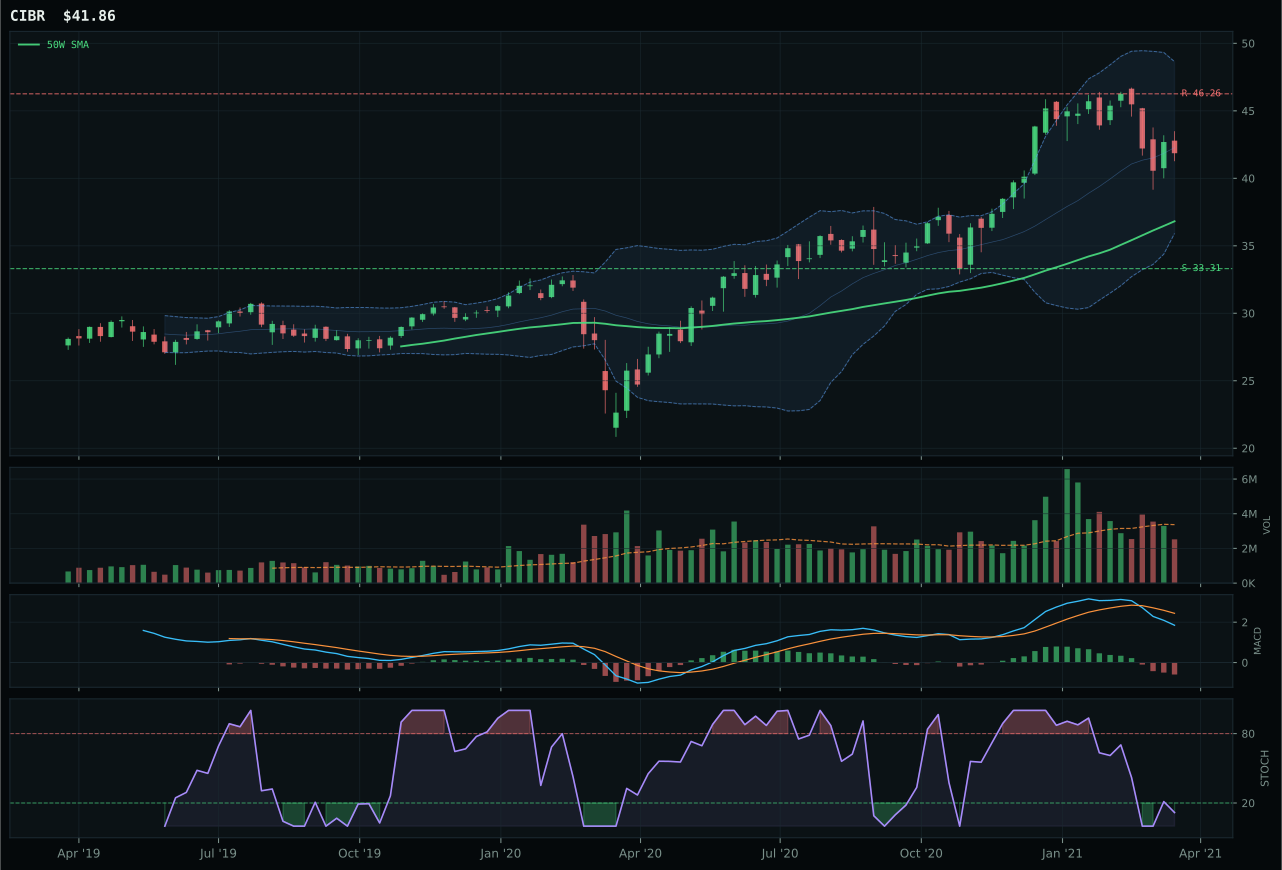
CIBR has a neutral structure profile with -10.0% 13-week relative strength versus SPY.
A failed hold above support would weaken the setup.
Actionable but governed by invalidation levels.
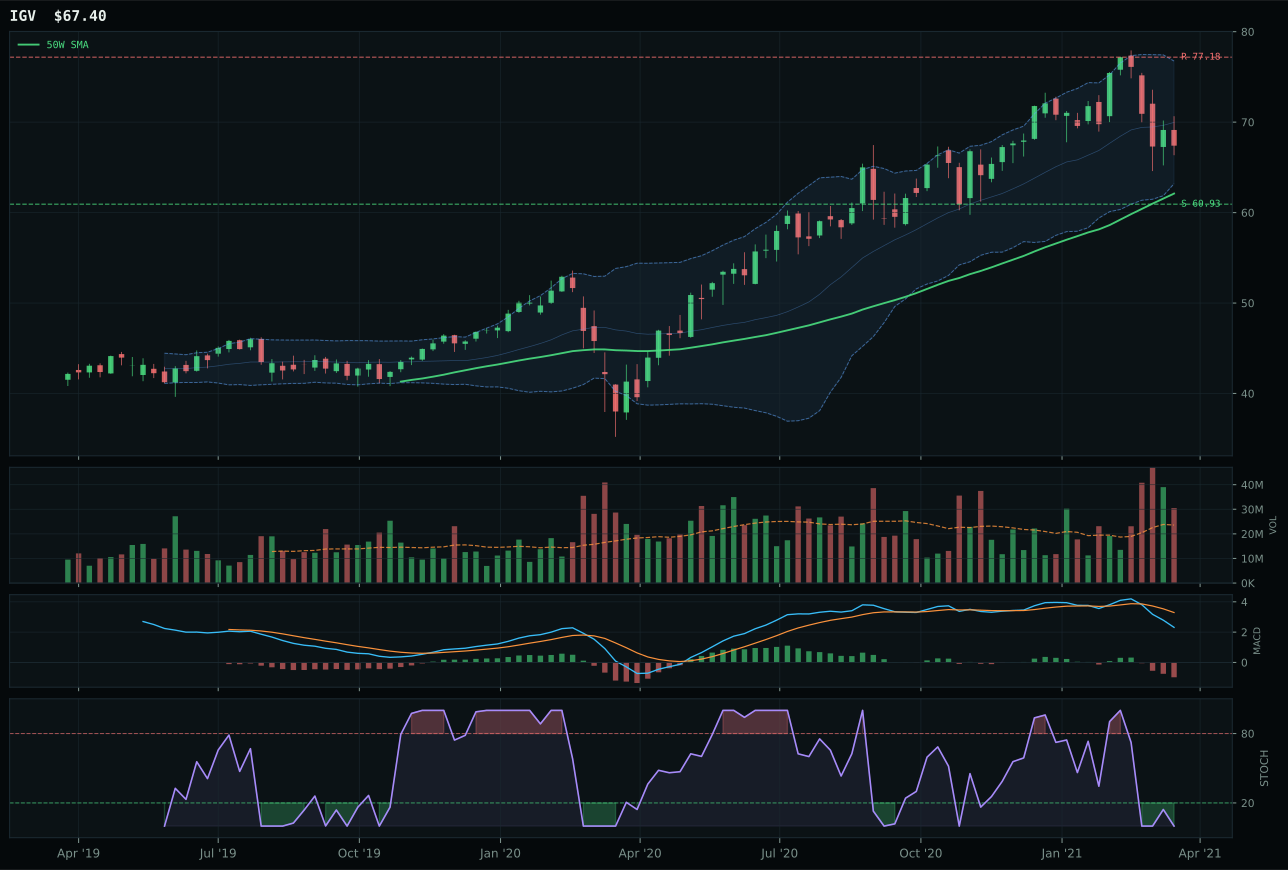
IGV has a neutral structure profile with -11.6% 13-week relative strength versus SPY.
A failed hold above support would weaken the setup.
Actionable but governed by invalidation levels.
XLK wins the category because it holds the leadership position within its three-ETF basket with a 5.6% relative strength advantage over peers and above-average volume participation at 1.19x the 20-week average. The chart is neutral in structure with price 12.5% above the 50-week moving average, delivering a clean technical foundation without the stretch penalties that weaken extended setups. CIBR lost despite matching XLK's timing score of 84 because its relative strength lagged 5.6 percentage points and its volume confirmation was thin, creating a sponsorship deficit that the allocator interprets as late-cycle participation rather than institutional accumulation. XLK's trend score of 75.3 reflects price above both key moving averages with a 0.9% 50-week slope and modest -4.4% SPY-relative performance that avoids the overcrowding signals present in higher-relative-strength peers.
Technology receives 5% allocation in tier-2, ranked outside the top-2 because its final category score of 24.6 falls below the two highest-scoring categories this week. Credit stress and inflation pressure actively penalize technology's macro fit, and the category-level macro assessment came in at just 34.0/100, reflecting the current Transition/Mixed regime's headwind against duration-sensitive hardware and software. The opportunity here is conditional: XLK shows clean neutral structure with oversold stochastic RSI turning up, establishing a mean-reversion platform rather than a breakout setup. For technology to earn a top-2 slot, either macro descriptors would need to reverse—particularly credit stress relief—or the representative would need to build a persistence case on stronger volume sponsorship and SPY-relative outperformance beyond the current 5.6% category edge.
AI — SMH
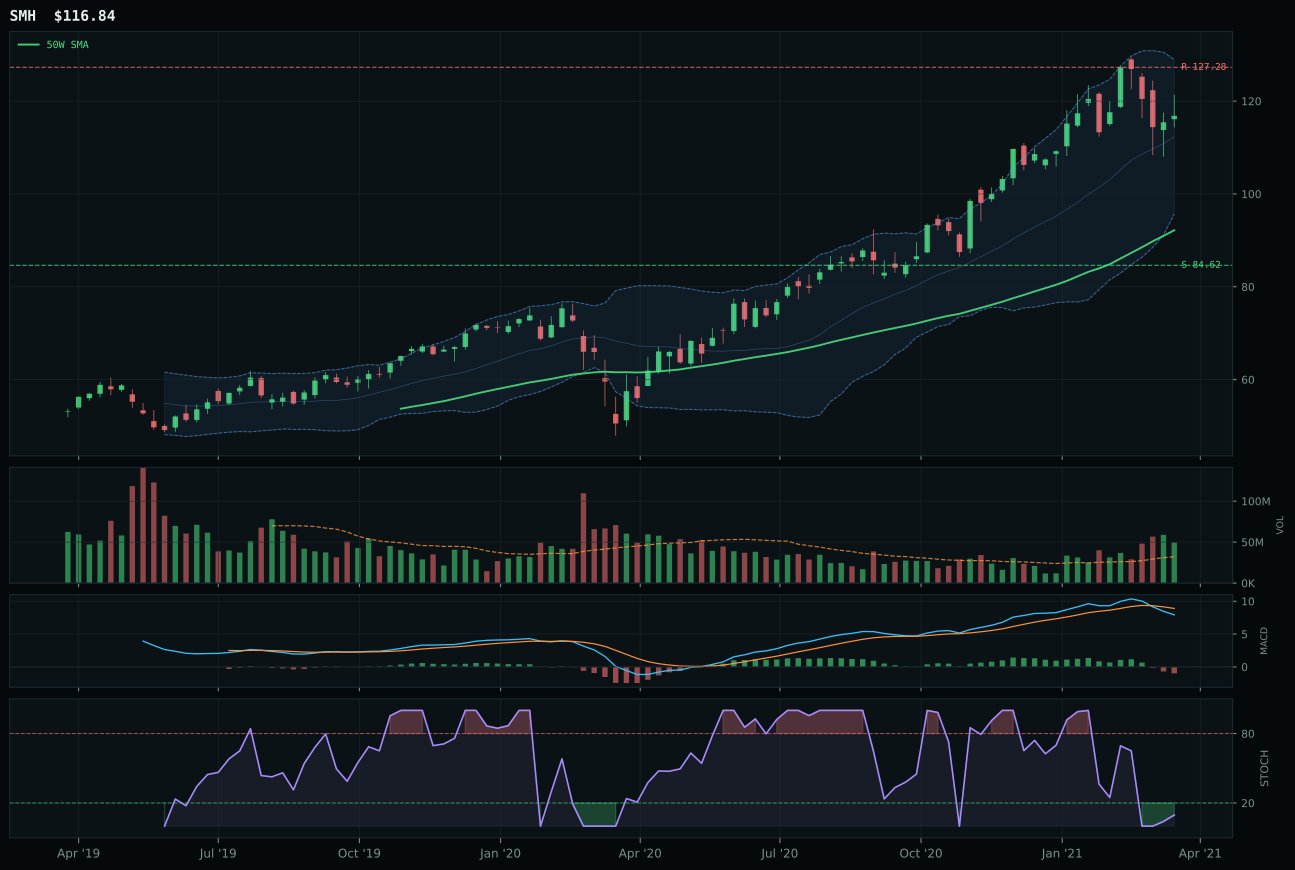
SMH has a vertical extension profile with 2.1% 13-week relative strength versus SPY.
A failed hold above support would weaken the setup.
Actionable but governed by invalidation levels.
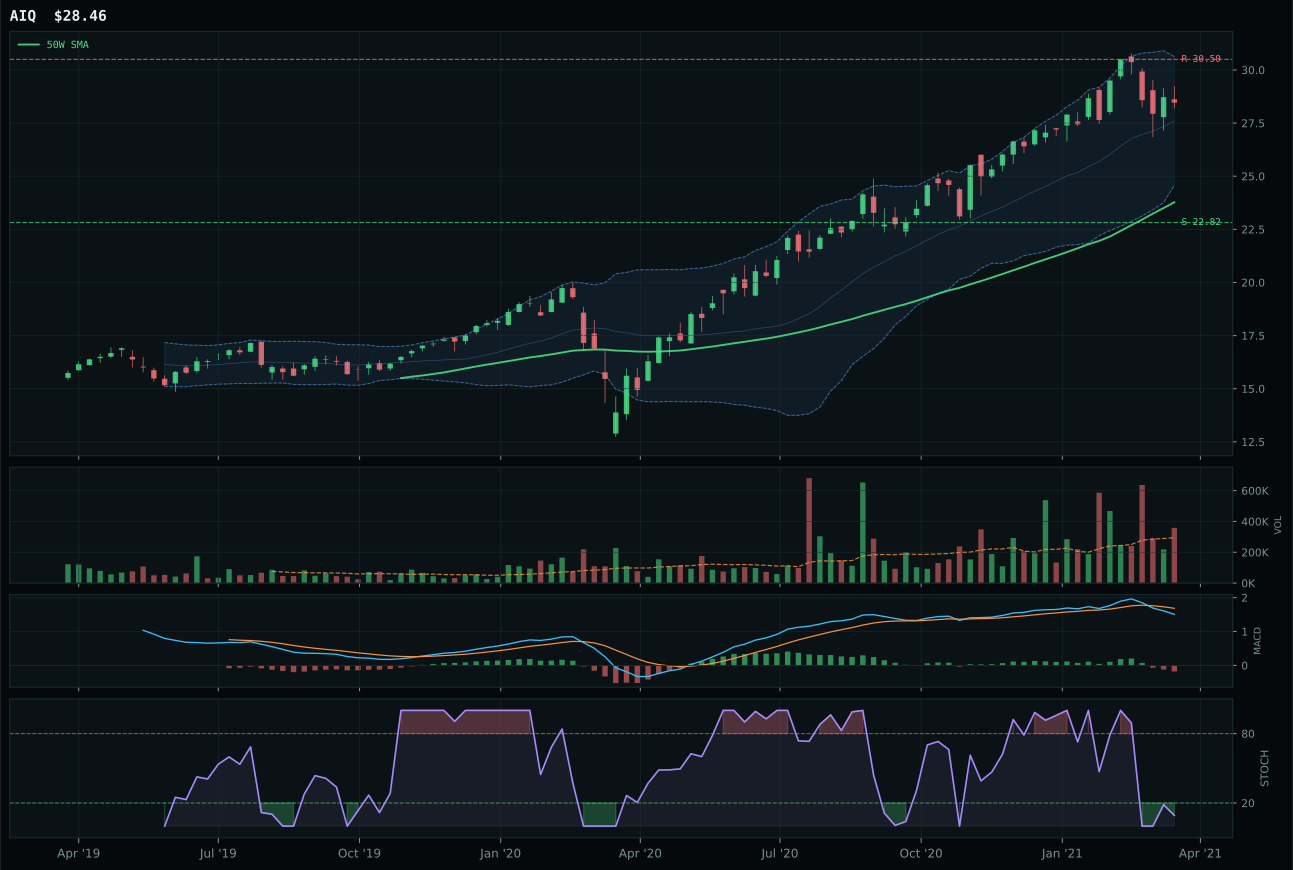
AIQ has a vertical extension profile with -0.7% 13-week relative strength versus SPY.
A failed hold above support would weaken the setup.
Tracked, but not top-2 eligible because: .
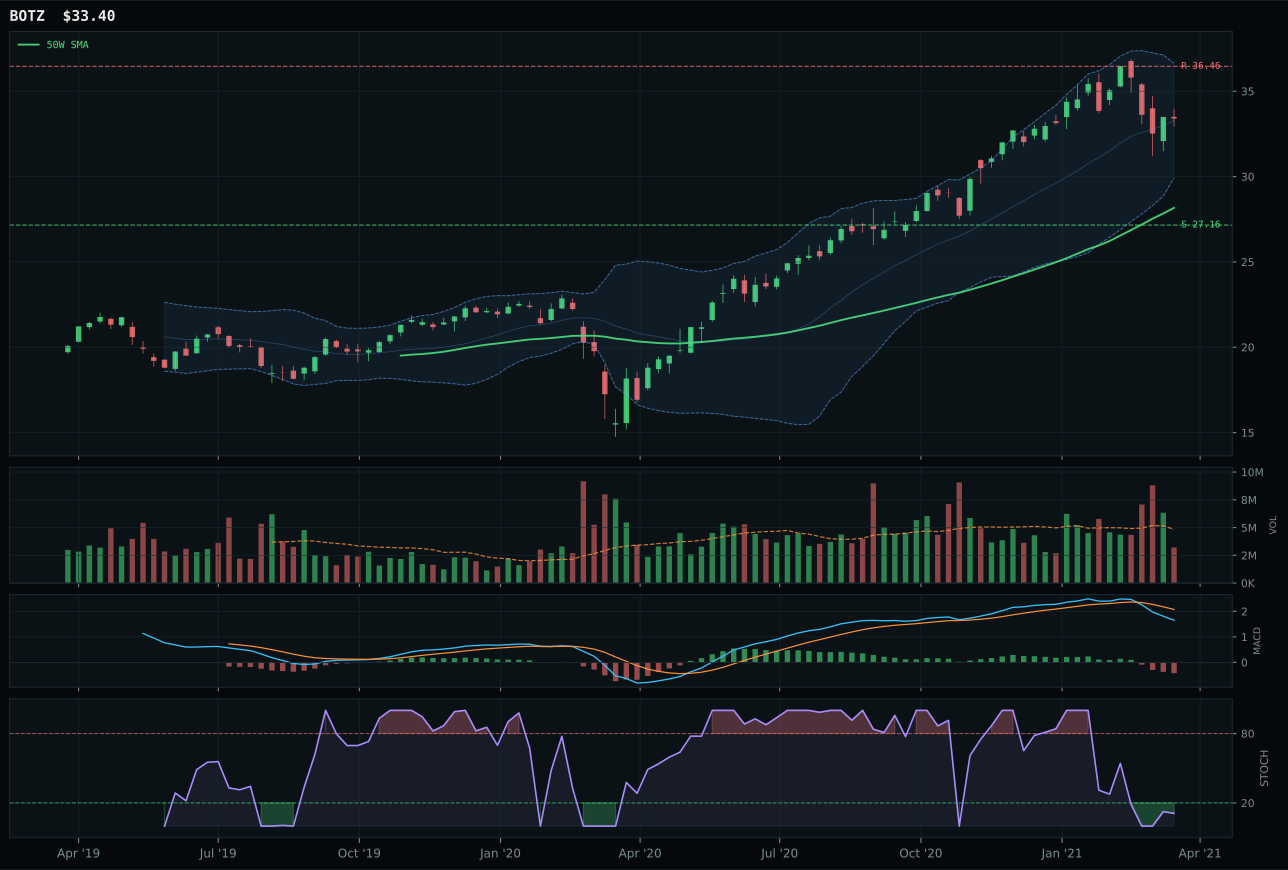
BOTZ has a vertical extension profile with -3.7% 13-week relative strength versus SPY.
A failed hold above support would weaken the setup.
Actionable but governed by invalidation levels.
SMH wins with clear technical superiority despite being extended 26.8% above the 50-week average because its 7.6% 13-week return and 2.1% relative strength versus SPY anchor strong absolute momentum that justifies the entry risk. Volume confirmation at 1.54x the 20-week average signals accumulation, and the stochastic RSI oversold turn-up at 0.10 combined with bullish MACD weakness suggests controlled consolidation rather than capitulation. AIQ lost ground because its risk/reward tilted worse at 49.9 versus 53.9, its structure scored 6.4 points lower, and critically, its category-relative strength sat at 0.0% versus SMH's 2.8%, revealing that SMH is the only AI expression earning peer sponsorship within the basket. The 24.4-point gap between winner and runner-up reflects a decisive technical separation, not a marginal call.
AI earns 0% allocation this week, ranked outside the top-two and excluded entirely because its final category score of 21.0 reflects severe macro headwinds that overwhelm technical strength in SMH. Credit stress, broad market bear, and dollar pressure all register as active, dragging the category-level macro fit to just 30.0/100. The portfolio must respect that SMH's technical evidence of 43.8/100 and macro/narrative fit of 44.0/100 still cannot overcome a regime that penalizes growth-duration exposure and foreign revenue sensitivity. For AI to return to allocation, the dollar would need to weaken materially, credit stress would need to lift, and broad market bear would need to flip. Until one of those macro conditions shifts, the oversold stochastic RSI setup in SMH is a tactical bounce within a category whose structural macro alignment remains hostile.
Emerging Markets — INDA
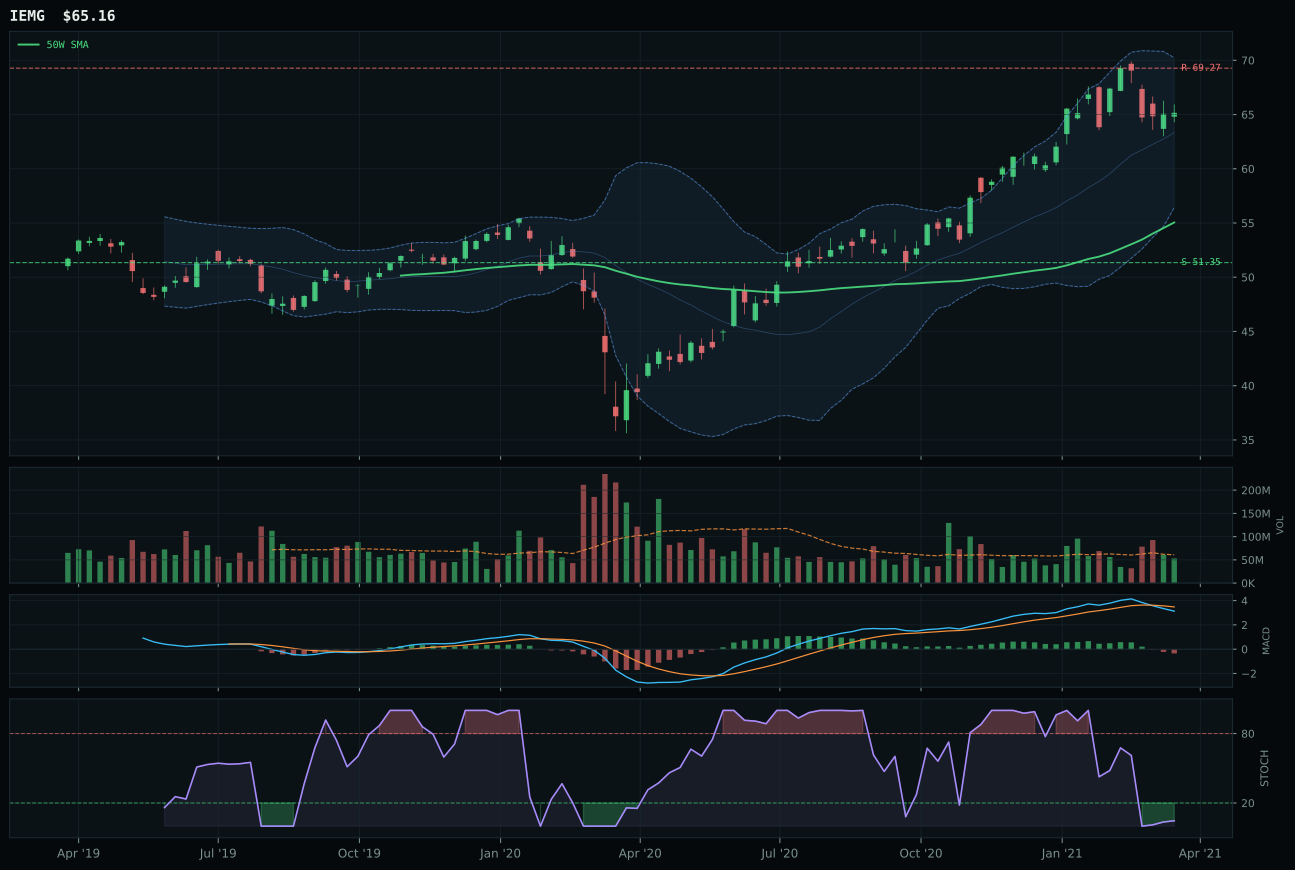
IEMG has a vertical extension profile with 1.1% 13-week relative strength versus SPY.
A failed hold above support would weaken the setup.
Actionable but governed by invalidation levels.
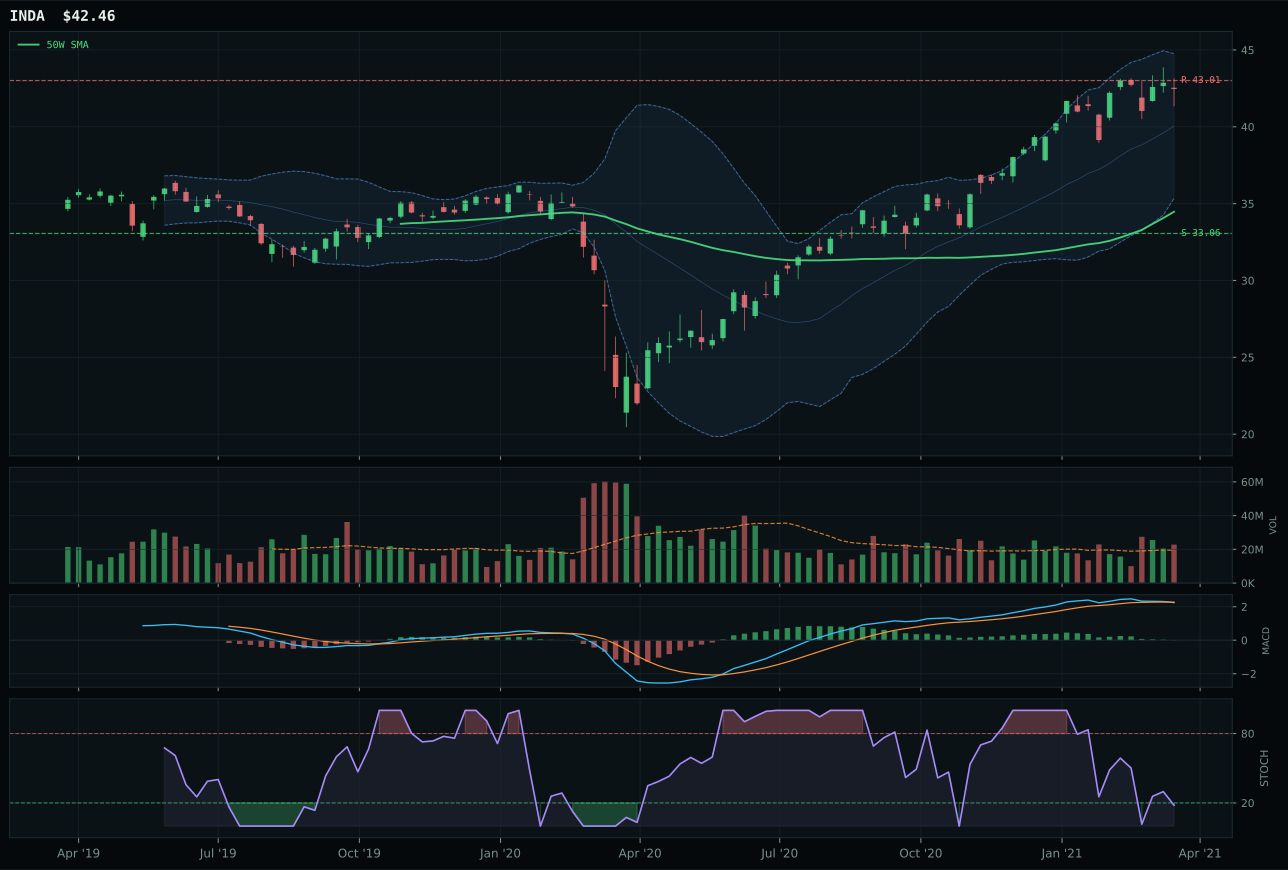
INDA has a vertical extension profile with 2.5% 13-week relative strength versus SPY.
A failed hold above support would weaken the setup.
Actionable but governed by invalidation levels.
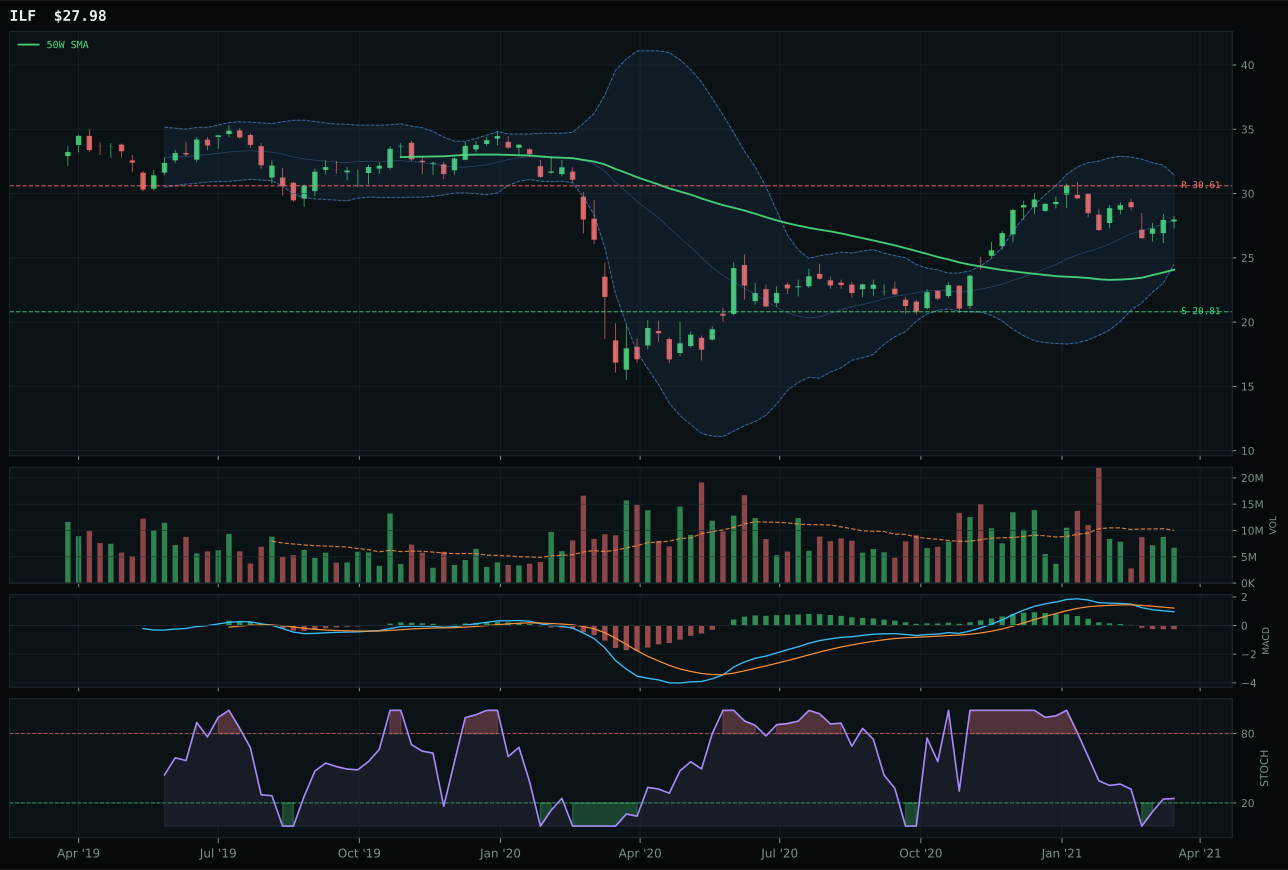
ILF has a vertical extension profile with -10.8% 13-week relative strength versus SPY.
A failed hold above support would weaken the setup.
Actionable but governed by invalidation levels.
INDA wins the emerging markets category by the narrowest technical margin at 0.7 points versus IEMG because it carries 1.4% category-relative strength and above-average volume participation at 1.17x the 20-week average versus IEMG's neutral volume, translating into superior sponsorship even though both charts are similarly extended and both carry bearish/weakening MACD structures. The 8.0% 13-week return and 23.9% 26-week return establish real performance, and the oversold stochastic RSI turning up at 0.18 creates a mean-reversion platform. Trend scores are nearly identical at 85.7 for INDA versus 84 for IEMG, but INDA's structure score of 77.1 versus 76.5 and timing score of 54.0 versus 62 reveal that INDA has achieved strength with slightly better risk positioning. However, this category victory is hollow within an allocation framework.
Emerging Markets earns 0% allocation this week because its final category score of 9.2 ranks outside the top-2 opportunities and reflects severe macro toxicity at just 17.0/100 macro fit. Dollar pressure at -14, credit stress at -10, and broad market bear at -9 all activate simultaneously, creating a macro tripwire that no technical setup can overcome. INDA's technical evidence of 44.8/100 and macro/narrative fit of only 40.0/100 sum to insufficient conviction under current regime conditions. The portfolio is explicitly excluding this category because emerging markets face headwinds from dollar strength, risk-off sentiment, and credit caution—precisely the opposite of the AltSeason flow that is driving energy and nuclear to the top-2 tier. For emerging markets to earn allocation, the dollar would need to break its strength regime, credit stress would need to reverse, and broad market bear would need to flip. Until those macro anchors shift, the INDA oversold setup remains a tactical bounce trap rather than a portfolio opportunity.