
2021-03-12
Informational purposes only. The content in this report, including allocations, analysis, and commentary, is provided solely for informational and educational purposes. It does not constitute financial advice, investment advice, trading advice, or any other type of advice. Past performance does not guarantee future results. Always conduct your own research and consult a qualified financial professional before making investment decisions.
Weekly Allocation
| Ticker | Category | Weight | Role |
|---|---|---|---|
| FSOL | 50% | Overlay | |
| XLE | Traditional Energy | 10% | Top-2 (10%) |
| COPX | Industrial Metals | 10% | Top-2 (10%) |
| URNM | Nuclear Energy | 5% | Tier-2 (5%) |
| MOO | Agriculture & Livestock | 5% | Tier-2 (5%) |
| ITA | Defense & Aerospace | 5% | Tier-2 (5%) |
| PAVE | Utilities & Infrastructure | 5% | Tier-2 (5%) |
| SLV | Precious Metals | 5% | Tier-2 (5%) |
| INDA | Emerging Markets | 5% | Tier-2 (5%) |
Trade Instructions — Monday Open
Sell the tranche from 2021-02-12 (completing its 4-week hold). Buy the new tranche. Instructions show net portfolio changes — same-asset positions cancel, weight changes show the delta.
| Action | Ticker | Instruction |
|---|---|---|
| SELL | REMX | Sell entire REMX position (2.50% of portfolio) |
| SELL | XOP | Sell entire XOP position (2.50% of portfolio) |
| SELL | SMH | Sell 33% of SMH position (reduce 3.75% → 2.50%) |
| SELL | IEMG | Sell 50% of IEMG position (reduce 2.50% → 1.25%) |
| SELL | IGV | Sell 33% of IGV position (reduce 3.75% → 2.50%) |
| SELL | XAR | Sell entire XAR position (1.25% of portfolio) |
| SELL | XLU | Sell entire XLU position (1.25% of portfolio) |
| BUY | COPX | Buy COPX — 22.22% of freed cash (adds 2.50% to portfolio) |
| BUY | XLE | Buy XLE — 22.22% of freed cash (adds 2.50% to portfolio) |
| BUY | ITA | Buy ITA — 11.11% of freed cash (adds 1.25% to portfolio) |
| BUY | PAVE | Buy PAVE — 11.11% of freed cash (adds 1.25% to portfolio) |
| BUY | URNM | Buy URNM — 11.11% of freed cash (adds 1.25% to portfolio) |
| BUY | SLV | Buy SLV — 11.11% of freed cash (adds 1.25% to portfolio) |
| BUY | INDA | Buy INDA — 11.11% of freed cash (adds 1.25% to portfolio) |
Current Portfolio After Trade
Combined holdings across all 4 active tranches. Each tranche is 25% of the portfolio.
| Ticker | % of Portfolio | Weight Bar |
|---|---|---|
| FSOL | 50.00% | |
| XLE | 10.00% | |
| COPX | 7.50% | |
| MOO | 6.25% | |
| ITA | 5.00% | |
| PAVE | 3.75% | |
| ILF | 3.75% | |
| URNM | 3.75% | |
| SMH | 2.50% | |
| IGV | 2.50% | |
| SLV | 2.50% | |
| IEMG | 1.25% | |
| INDA | 1.25% |
Macro Regime — Transition / Mixed
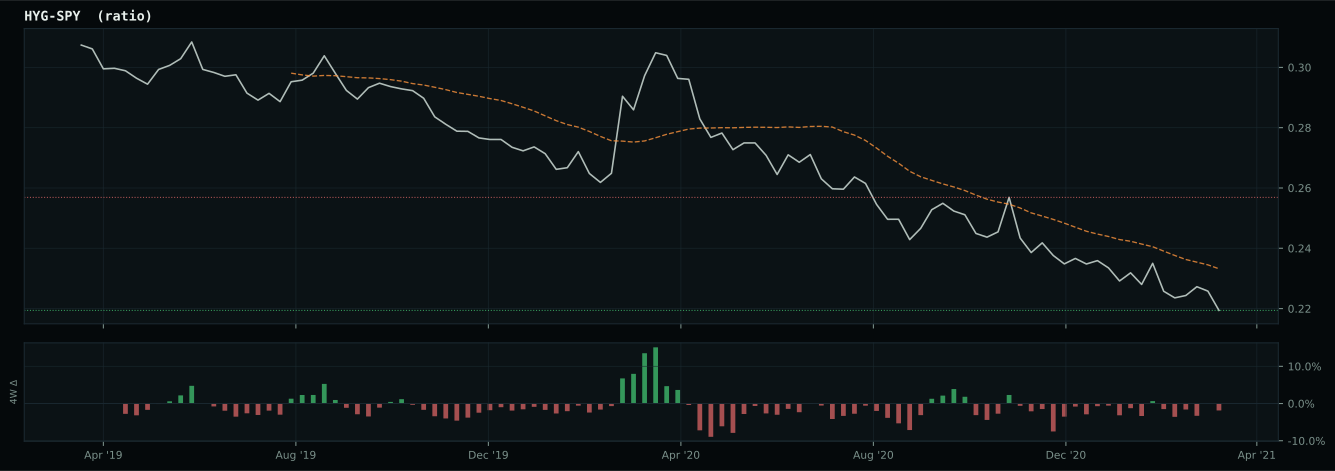
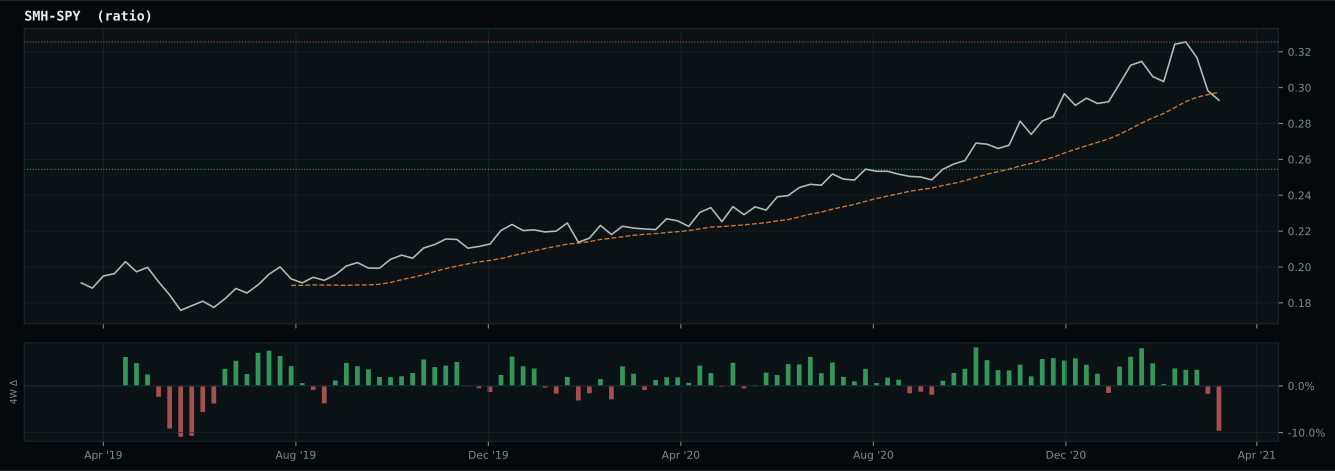
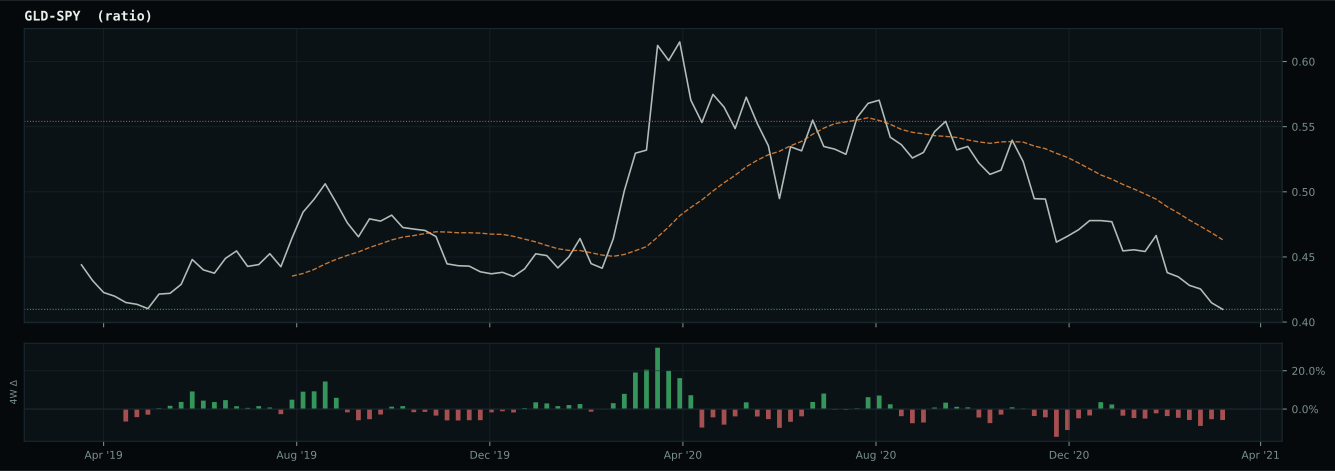
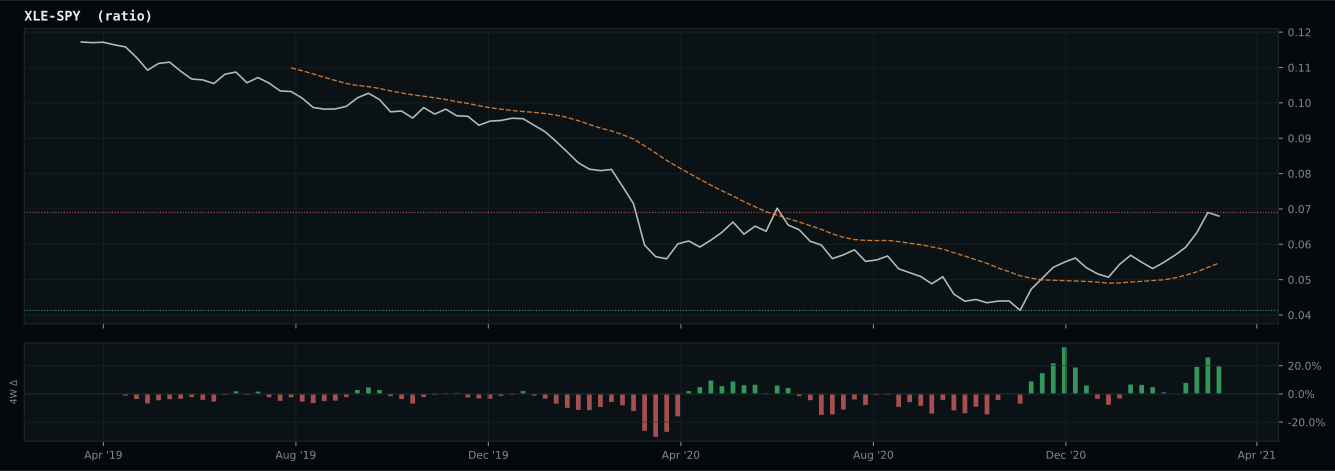
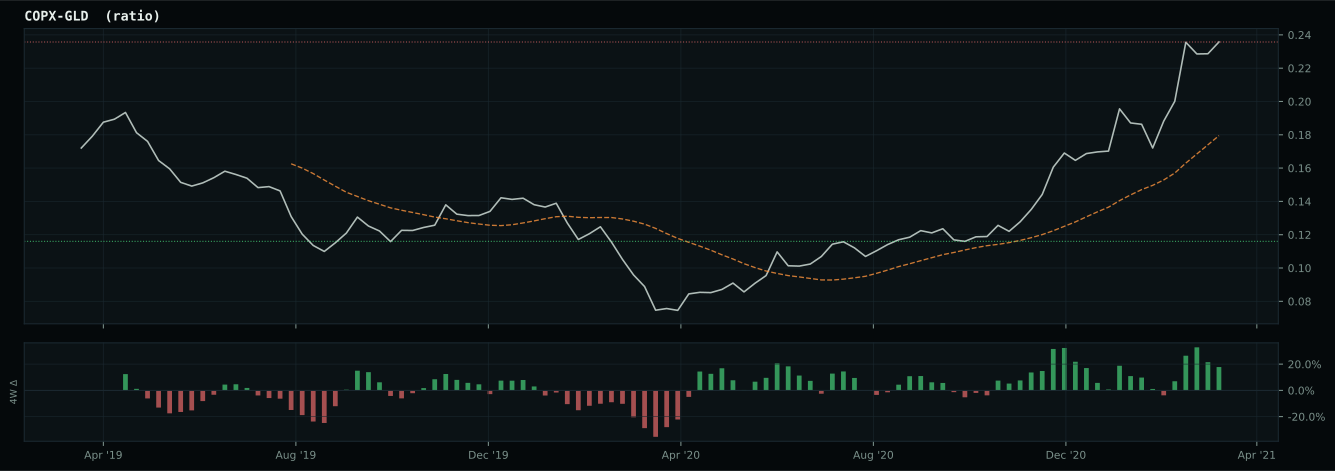
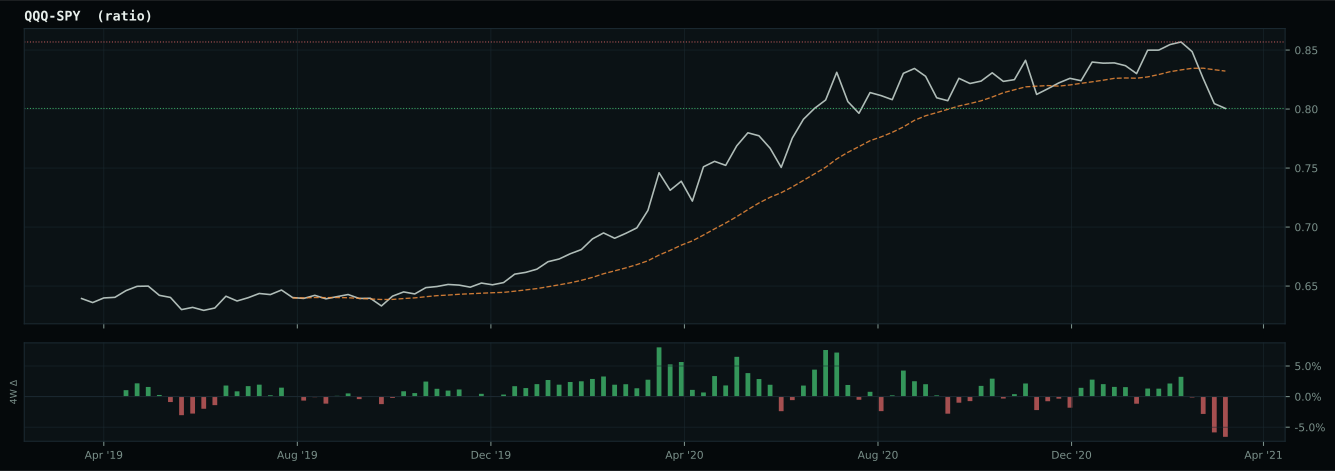
Macro Evidence Charts
Market-implied signals behind the macro regime scores. Each ratio compares two assets; the direction and slope of the ratio is what the macro engine reads.
Crypto Regime — AltSeason
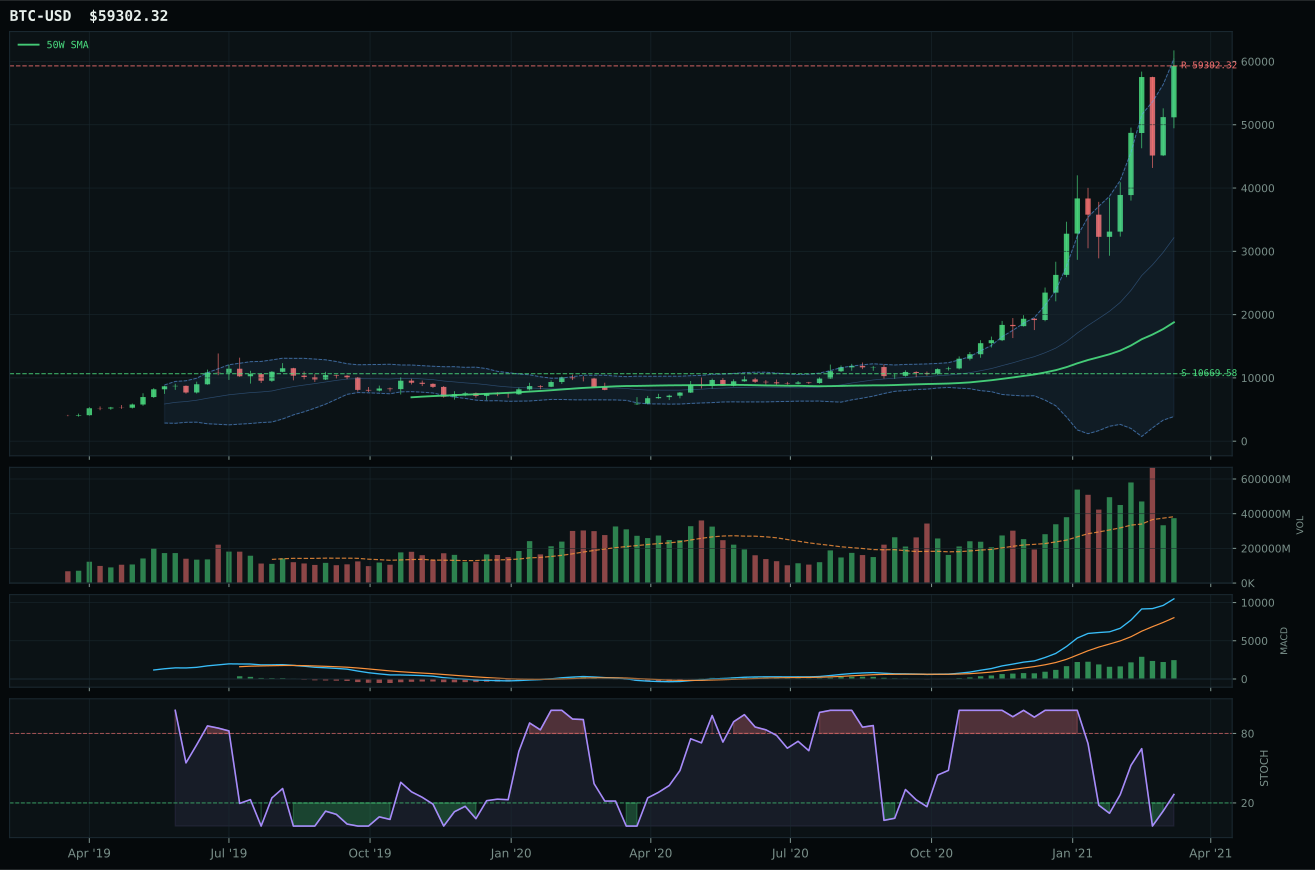
post-touch structure is too wide to count as a range; max/min close ratio is 10.67
TrendBTC confirmed: 2 consecutive closes above rising/flat 50W SMA
all available AltSeason conditions pass; missing optional confirmations skipped

Category Rankings
| Rank | Category | Winner | Score | Alloc | 4W Ret | Peers (4W) |
|---|---|---|---|---|---|---|
| 1 | Traditional Energy | XLE | 85.2 | 20% | -9.06% | FCG -10.1% · XOP -11.7% |
| 2 | Industrial Metals | COPX | 79.5 | 20% | -2.23% | REMX -5.7% · PICK +0.7% |
| 3 | Nuclear Energy | URNM | 65.4 | 10% | +5.13% | URA +3.2% · NLR +2.9% |
| 4 | Agriculture & Livestock | MOO | 56.3 | 10% | -0.24% | VEGI -0.6% · WEAT +0.8% |
| 5 | Defense & Aerospace | ITA | 50.7 | 10% | -0.36% | ROKT -1.6% · XAR +0.1% |
| 6 | Utilities & Infrastructure | PAVE | 43.8 | 10% | +2.00% | IGF +0.7% · XLU +3.7% |
| 7 | Precious Metals | SLV | 41.0 | 10% | -4.08% | GLD +0.3% · GDX +3.6% |
| 8 | Emerging Markets | INDA | 36.9 | 10% | -5.08% | IEMG -0.8% · ILF +0.7% |
| 9 | Technology | XLK | 28.8 | 0% | +7.36% | CIBR +0.6% · IGV +5.2% |
| 10 | AI | SMH | 25.3 | 0% | +9.74% | BOTZ +2.6% · AIQ +4.1% |
Traditional Energy — XLE
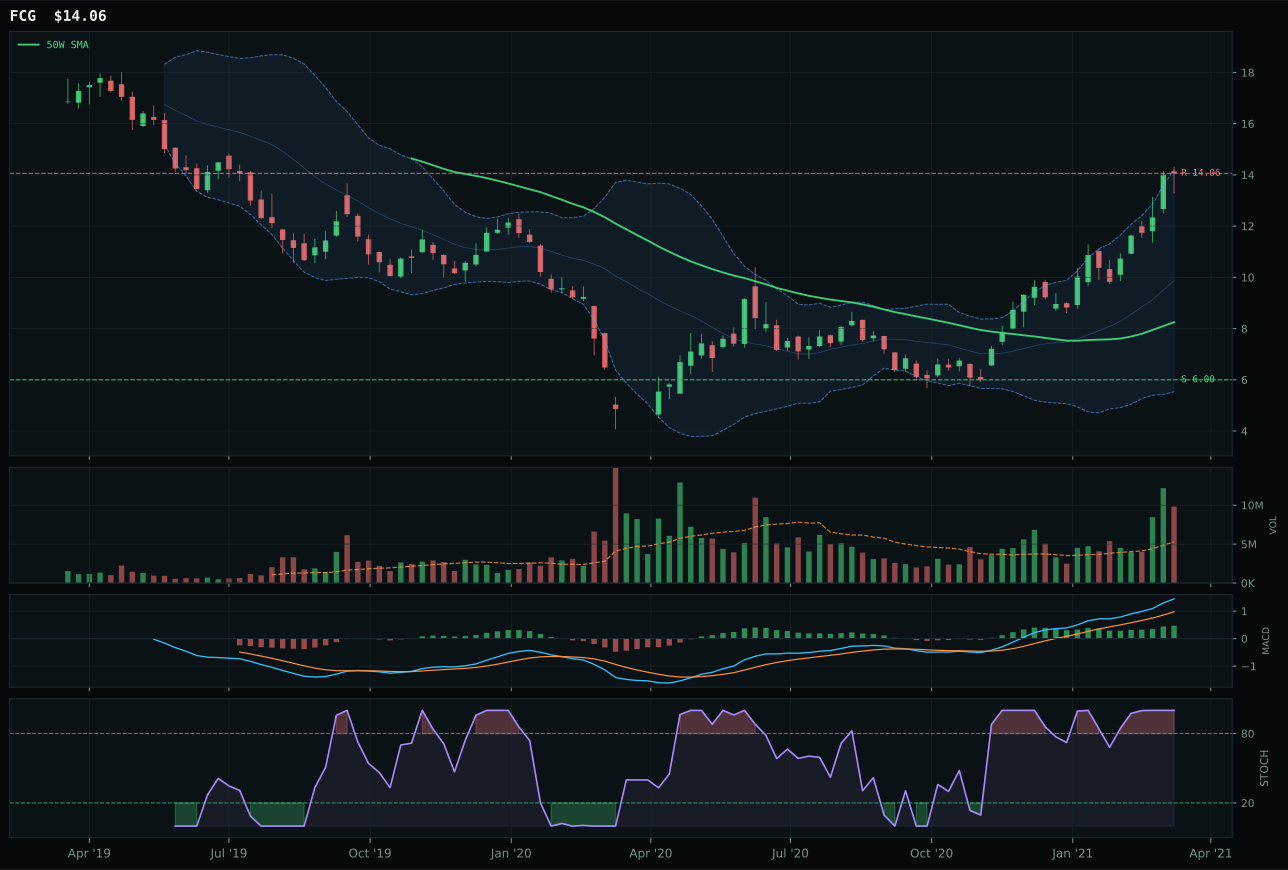
FCG has a vertical extension profile with 38.4% 13-week relative strength versus SPY.
A failed hold above support would weaken the setup.
Actionable but governed by invalidation levels.
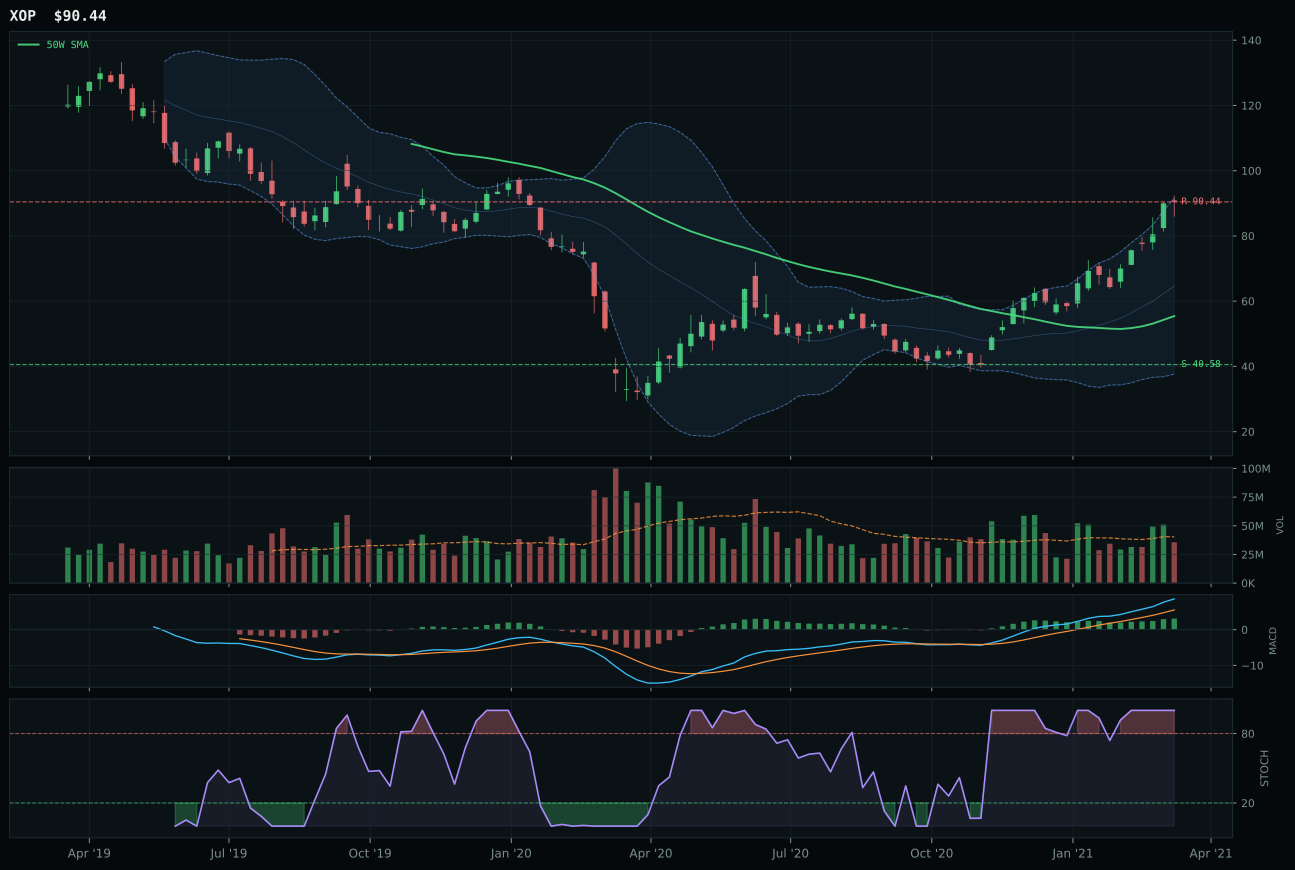
XOP has a vertical extension profile with 37.2% 13-week relative strength versus SPY.
A failed hold above support would weaken the setup.
Actionable but governed by invalidation levels.
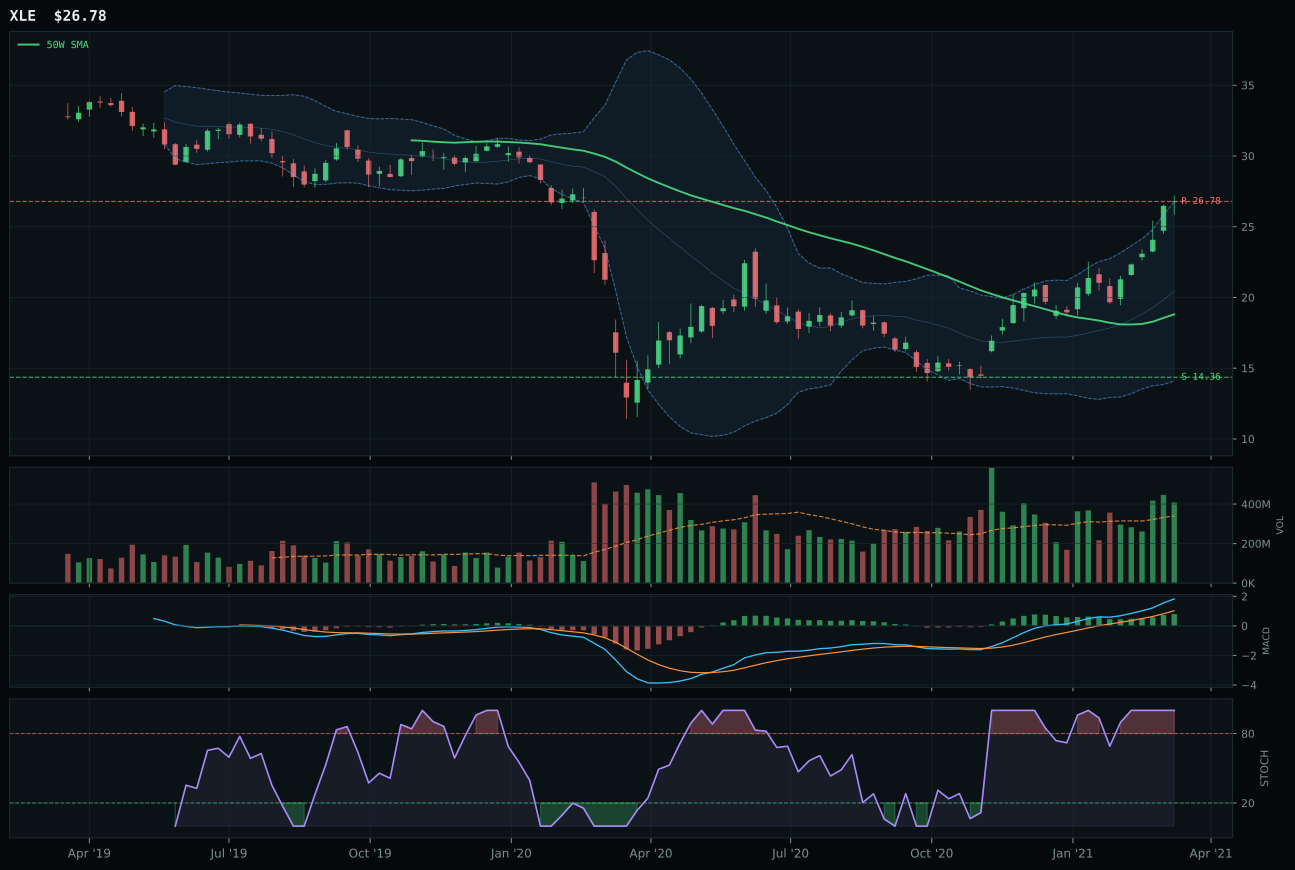
XLE has a vertical extension profile with 22.7% 13-week relative strength versus SPY.
A failed hold above support would weaken the setup.
Actionable but governed by invalidation levels.
XLE wins the energy category with a narrow margin despite FCG's technically superior 93.2/100 evidence score, because XLE's category-relative strength of -14.5% is less destructive than FCG's neutral macro fit and more defensible entry risk. The integrated energy portfolio delivers a 30.3% 13-week return and 64.2% 26-week return with 22.7% relative strength versus SPY, sitting 42.4% above the 50-week moving average with MACD actively bullish and improving and stochastic RSI in overbought momentum at 1.00. Volume at 1.20x the 20-week average shows above-average participation in a move that is extended but clearly sponsored. Critically, while XLE sits below the 200-week moving average (a yellow flag), its superior sponsorship profile and less-stretched valuation compared to FCG (which is 71.3% above the 50-week) make it the category representative despite being the runner-up on pure technical score.
Traditional Energy earns 10% as a top-2 overweight category with a final score of 85.2—the highest score in the entire portfolio. The macro support is exceptional: energy scarcity is active (+16), inflation pressure is active (+10), supply shortage is active (+9), real asset sponsorship is active (+7), and while credit stress is active (-7), the net macro fit of 85.0/100 is dominant. XLE's technical evidence of 70.3/100 is solid but not elite; the real driver is the category's macro alignment in a Transition/Mixed regime where supply constraints, geopolitical tensions, and energy transition capex all point to sustained premium pricing. The 22.7% relative strength versus SPY and robust volume confirmation at 1.20x the 20-week average show that energy is being actively accumulated despite price extensions. This is the portfolio's largest conviction position by macro score, reflecting the view that energy scarcity and inflation sponsorship are the most robust narratives available in the current environment.
Industrial Metals — COPX
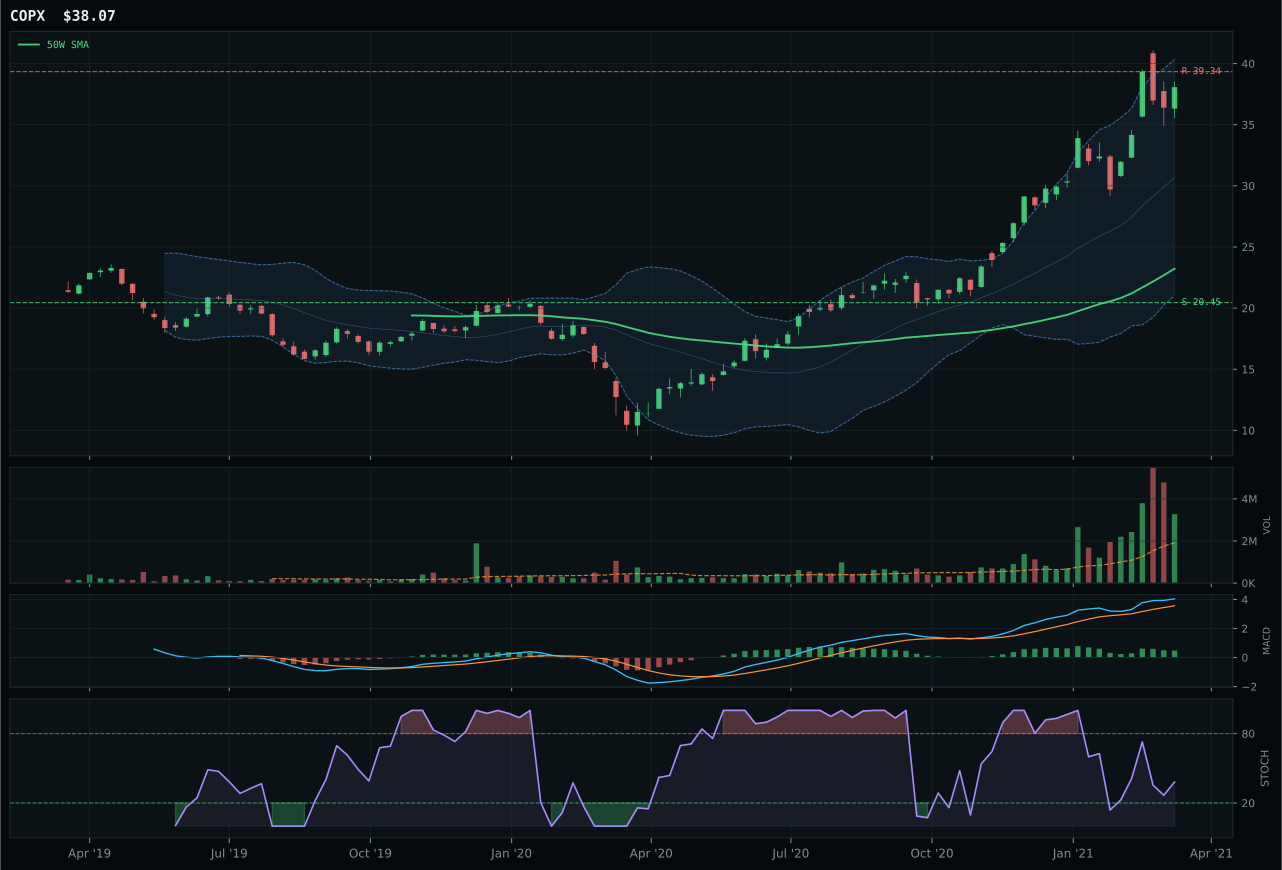
COPX has a vertical extension profile with 26.5% 13-week relative strength versus SPY.
A failed hold above support would weaken the setup.
Actionable but governed by invalidation levels.
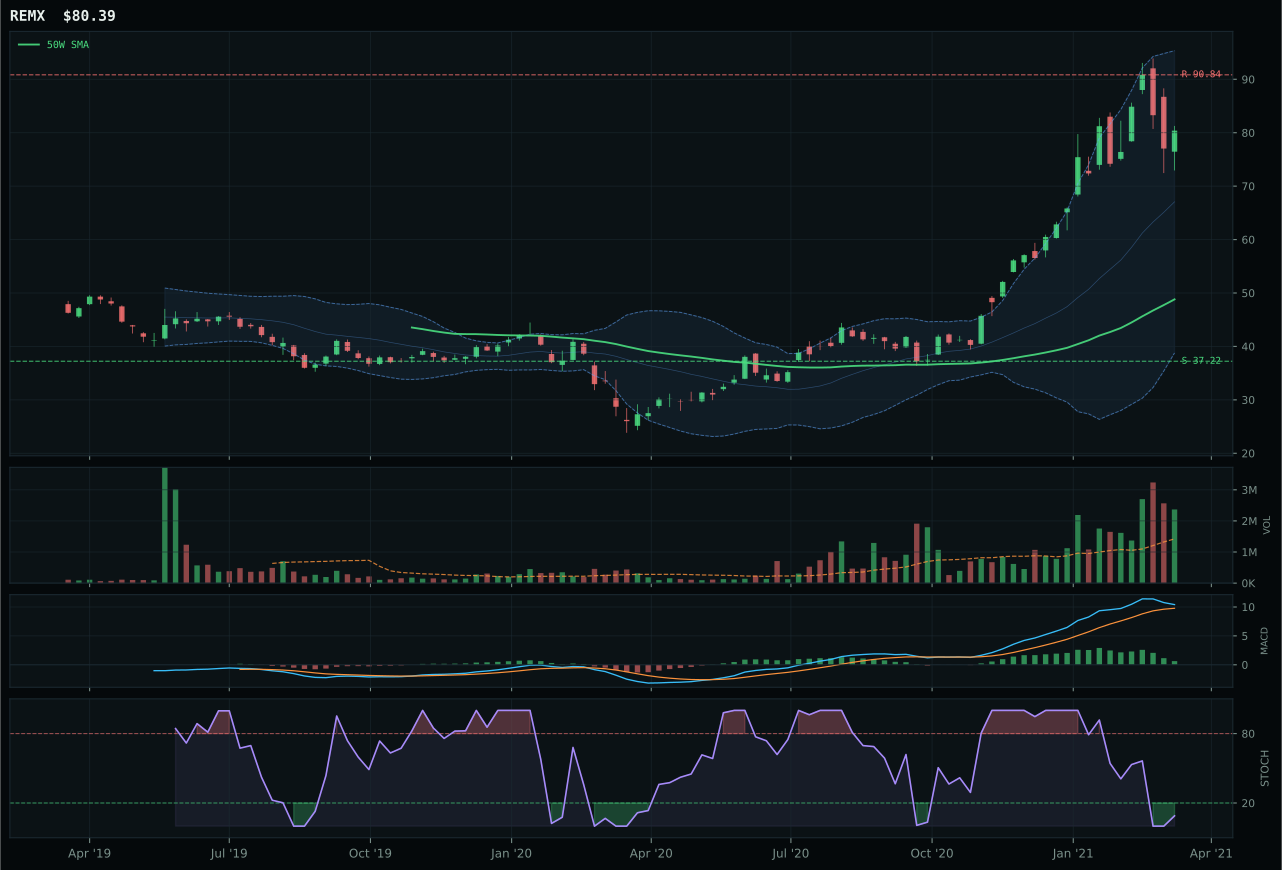
REMX has a vertical extension profile with 34.6% 13-week relative strength versus SPY.
A failed hold above support would weaken the setup.
Actionable but governed by invalidation levels.
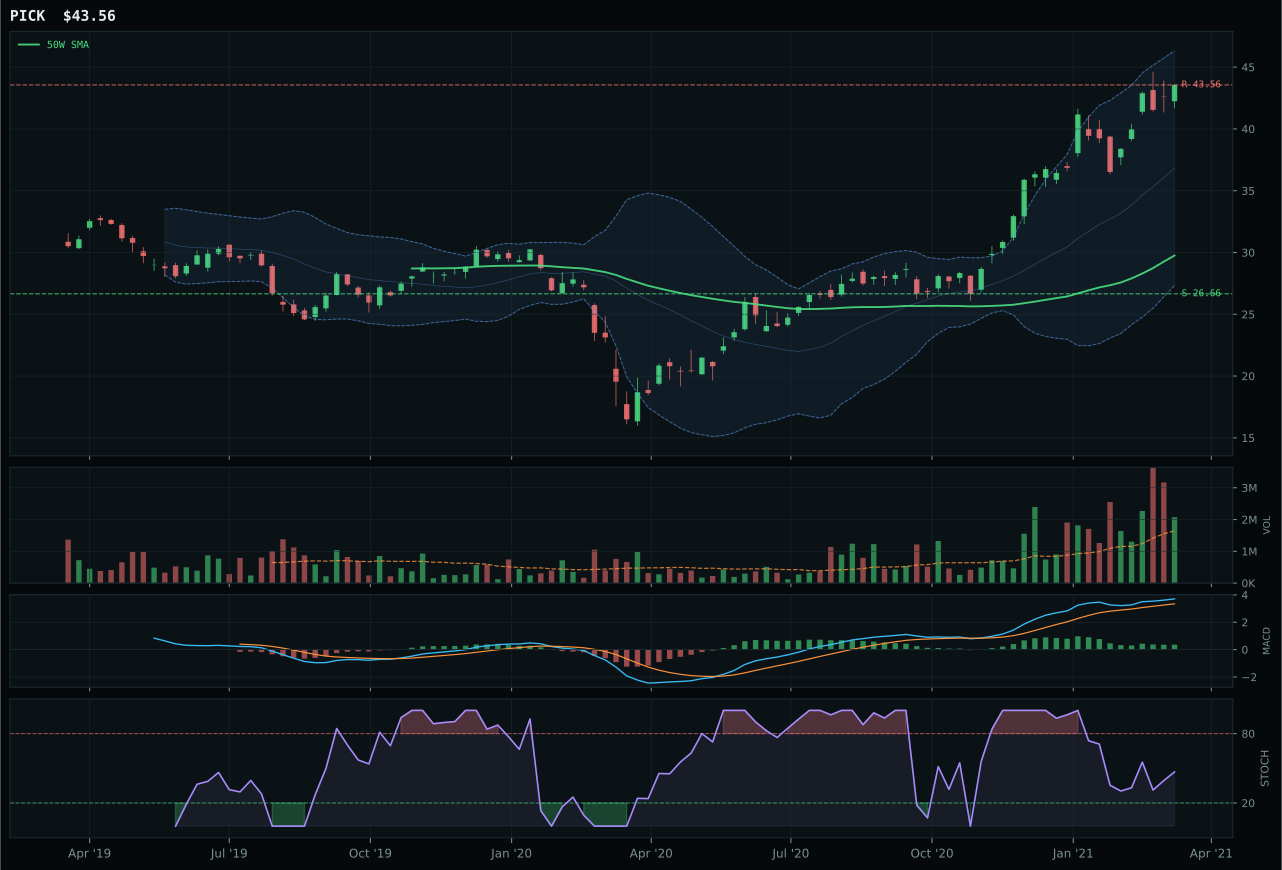
PICK has a vertical extension profile with 12.3% 13-week relative strength versus SPY.
A failed hold above support would weaken the setup.
Actionable but governed by invalidation levels.
COPX wins with a narrow 2.3-point margin over REMX to claim a top-2 slot at 10% allocation, driven by technical evidence that is nearly pristine and superior MACD confirmation. The copper and mining ETF delivers a 34.0% 13-week return and 72.3% 26-week return—extraordinary gains backed by a 26.5% relative strength versus SPY and a 63.9% extension above the 50-week moving average that is nonetheless supported by 1.72x volume participation (accumulation/confirmation). MACD is actively bullish and improving, stochastic RSI sits at 0.38 (falling/neutral rather than overbought), and price is positioned near the 52-week high with room to the Fibonacci 0.236 at 33.63. REMX shows a 42.2% 13-week return and 34.6% relative strength (outpacing COPX), but its MACD is bullish but flattening and stochastic RSI is oversold—a divergence signaling that rare earth momentum is peaking while copper's setup still has institutional legs.
Industrial Metals earns 10% as a top-2 overweight category with a final score of 79.5, anchored by the second-strongest macro narrative in the portfolio. Metals scarcity is active (+14), commodity breadth is positive (+10), real asset sponsorship is active (+6), and only credit stress (-7) moderates the thesis. The category-level macro fit of 73.0/100 combined with COPX's 90.6/100 technical evidence creates a confluence of macro and technical that justifies overweight conviction. The 63.9% extension above the 50-week would normally suggest taking partial profits, but the accumulation-level volume (1.72x the 20-week average) and the improving MACD pattern prove that larger positions are still being built into perceived supply constraints. This is the second-largest allocation by score after Traditional Energy, reflecting a portfolio posture that scarcity, inflation, and energy transition capex demand are the dominant narratives in the Transition/Mixed regime.
Nuclear Energy — URNM
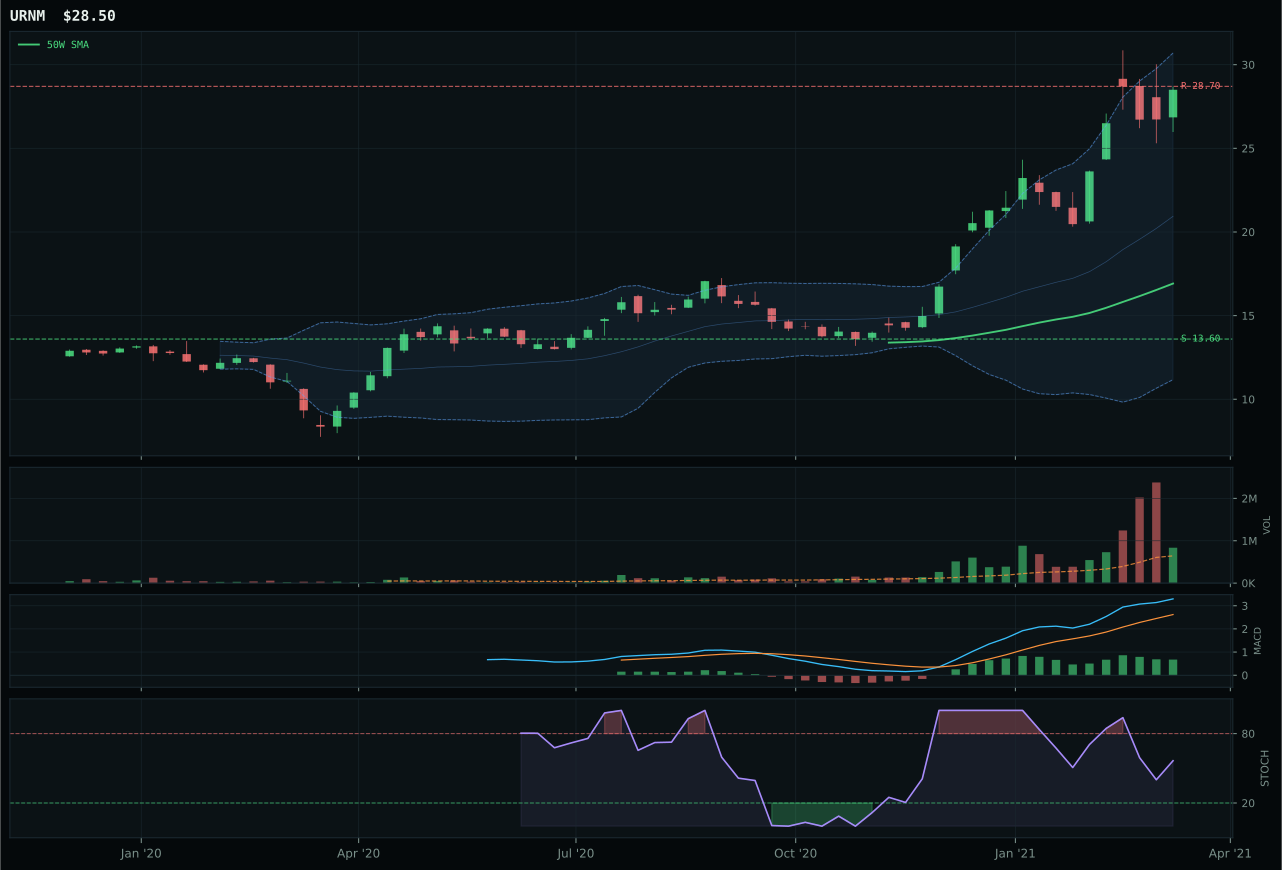
URNM has a vertical extension profile with 41.4% 13-week relative strength versus SPY.
A failed hold above support would weaken the setup.
Actionable but governed by invalidation levels.
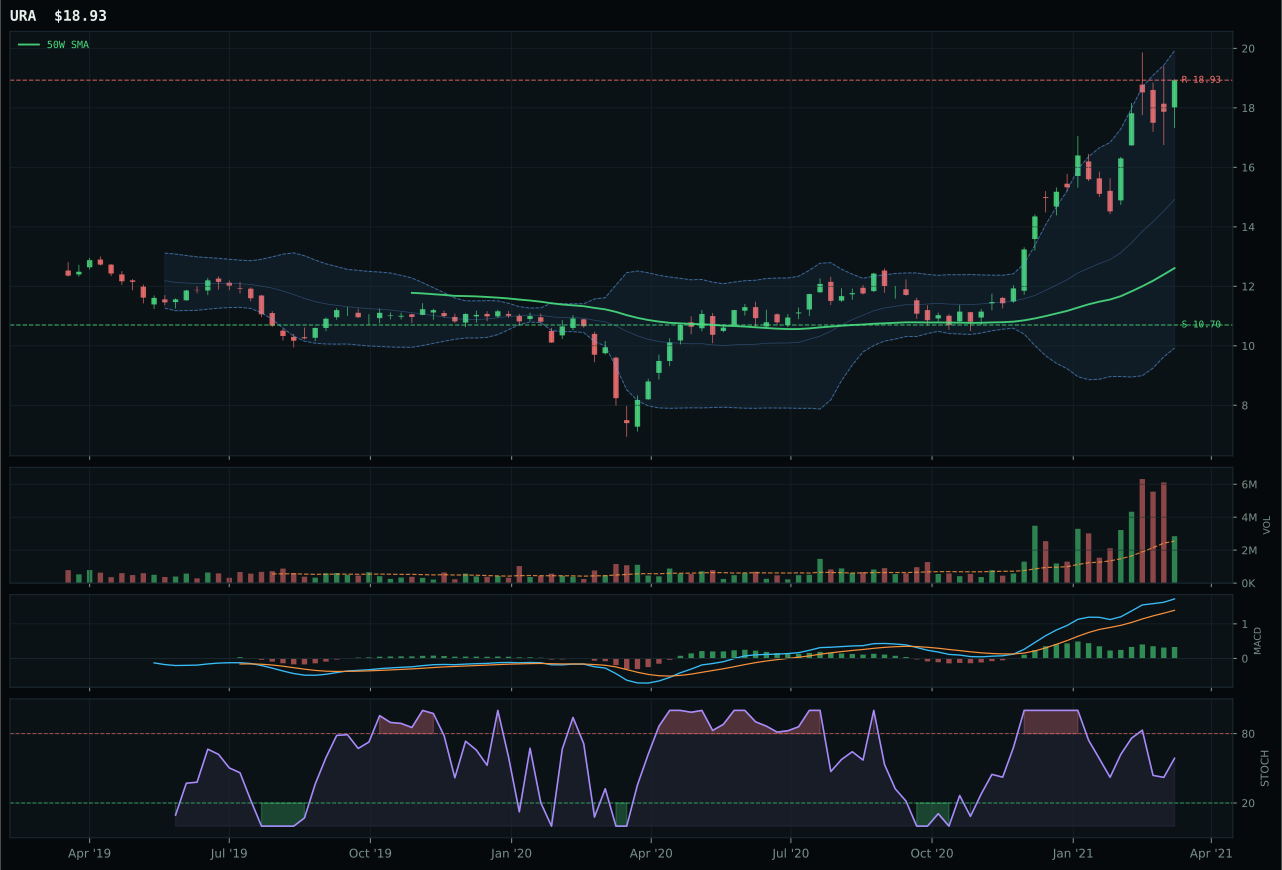
URA has a vertical extension profile with 24.3% 13-week relative strength versus SPY.
A failed hold above support would weaken the setup.
Actionable but governed by invalidation levels.
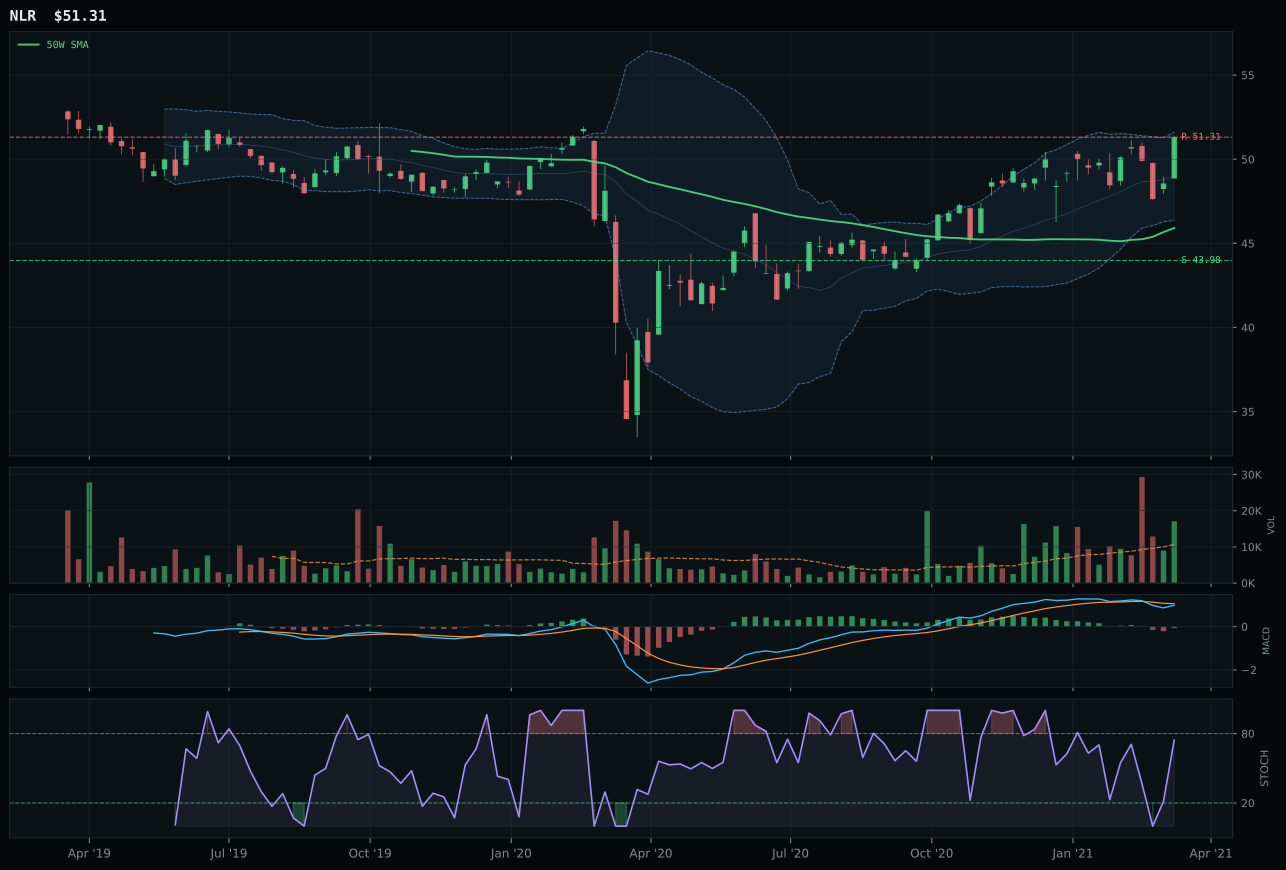
NLR has a neutral structure profile with -2.5% 13-week relative strength versus SPY.
A failed hold above support would weaken the setup.
Tracked, but not top-2 eligible because: .
URNM wins over URA with a clear 8.0-point advantage, powered by the most exceptional 13-week relative strength in the portfolio at 41.4% versus SPY and category-leading 17.0% relative strength within its basket. The uranium miner ETF delivers a 48.9% 13-week return on top of an 81.5% 26-week advance, with momentum confirmation at perfect 100.0/100 and volume-price confirmation at 81.2/100—evidence that every participant from small retail to major institutional players is accumulating into the nuclear thesis. Price sits 68.5% above the 50-week moving average with a 2.3% slope, MACD bullish and improving, and stochastic RSI in the 0.57 falling/neutral zone rather than overbought (critical for a move of this magnitude). URA's 31.9% 13-week return pales in comparison, MACD has only flattened rather than improved, and timing at 40.0/100 versus URNM's 53.0/100 reflects that URA's setup is more mature.
Nuclear Energy receives 5% allocation as tier-2 with a final score of 65.4, ranking below the top-two categories despite URNM's stunning 41.4% relative strength. The macro fit of 64.0/100 is strong but not dominant: energy scarcity is active (+9), real asset sponsorship is active (+7), inflation pressure is active (+3), and credit stress is active (-5). While URNM's technical evidence is exceptional at 87.0/100, the timing component (53.0/100) reflects genuine concern about entry risk at a 68.5% extension above the 50-week moving average. The allocation reflects conviction that nuclear energy scarcity and energy transition capex are legitimate themes, but the advanced stage of the move and the -0.7% upside to resistance limit this to tier-2 positioning. For nuclear to move to a 5% overweight, the system would need either a pullback to establish support at 13.60 and restart MACD from a lower base, or measurably stronger energy scarcity signals and credit-easing confirmation.
Agriculture & Livestock — MOO
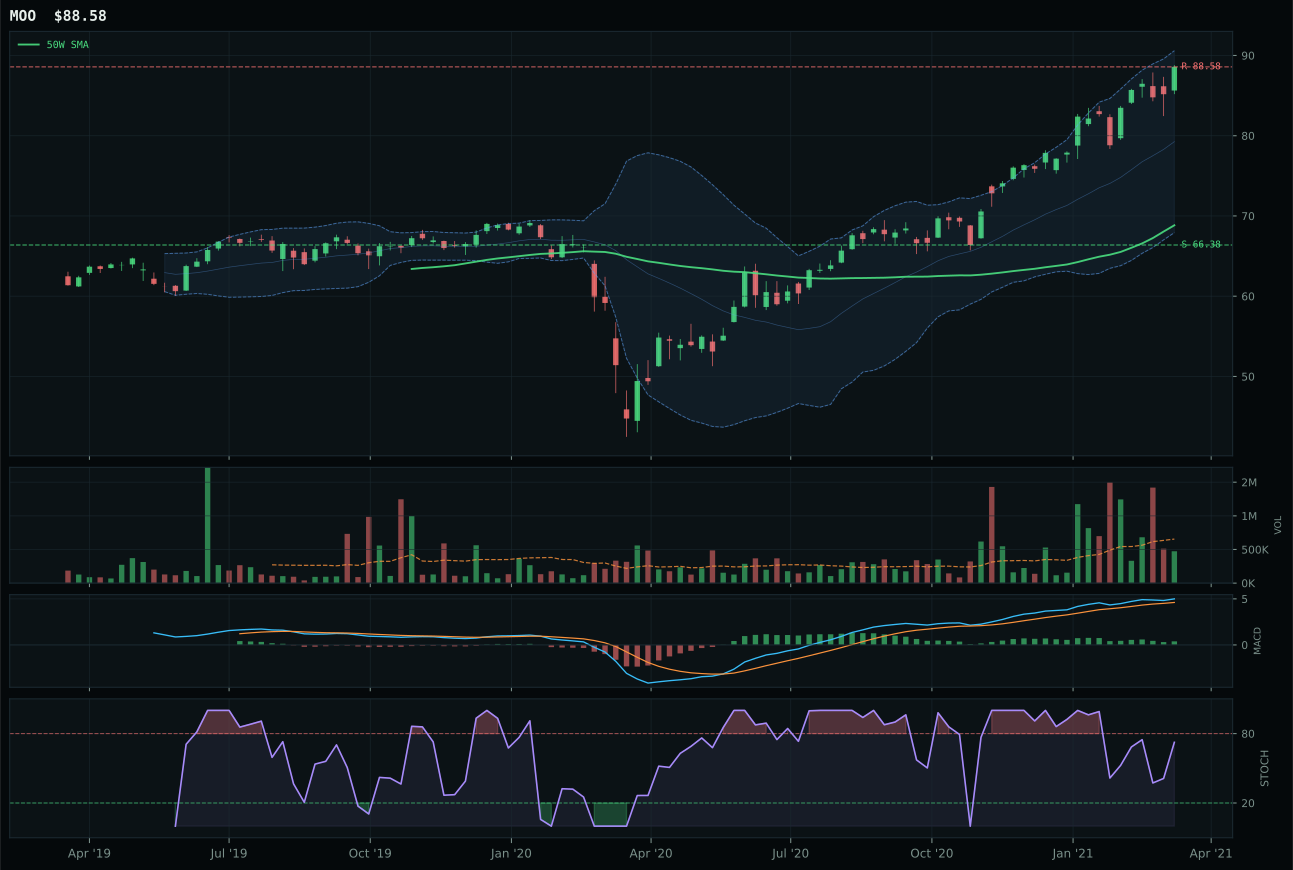
MOO has a vertical extension profile with 9.2% 13-week relative strength versus SPY.
A failed hold above support would weaken the setup.
Actionable but governed by invalidation levels.
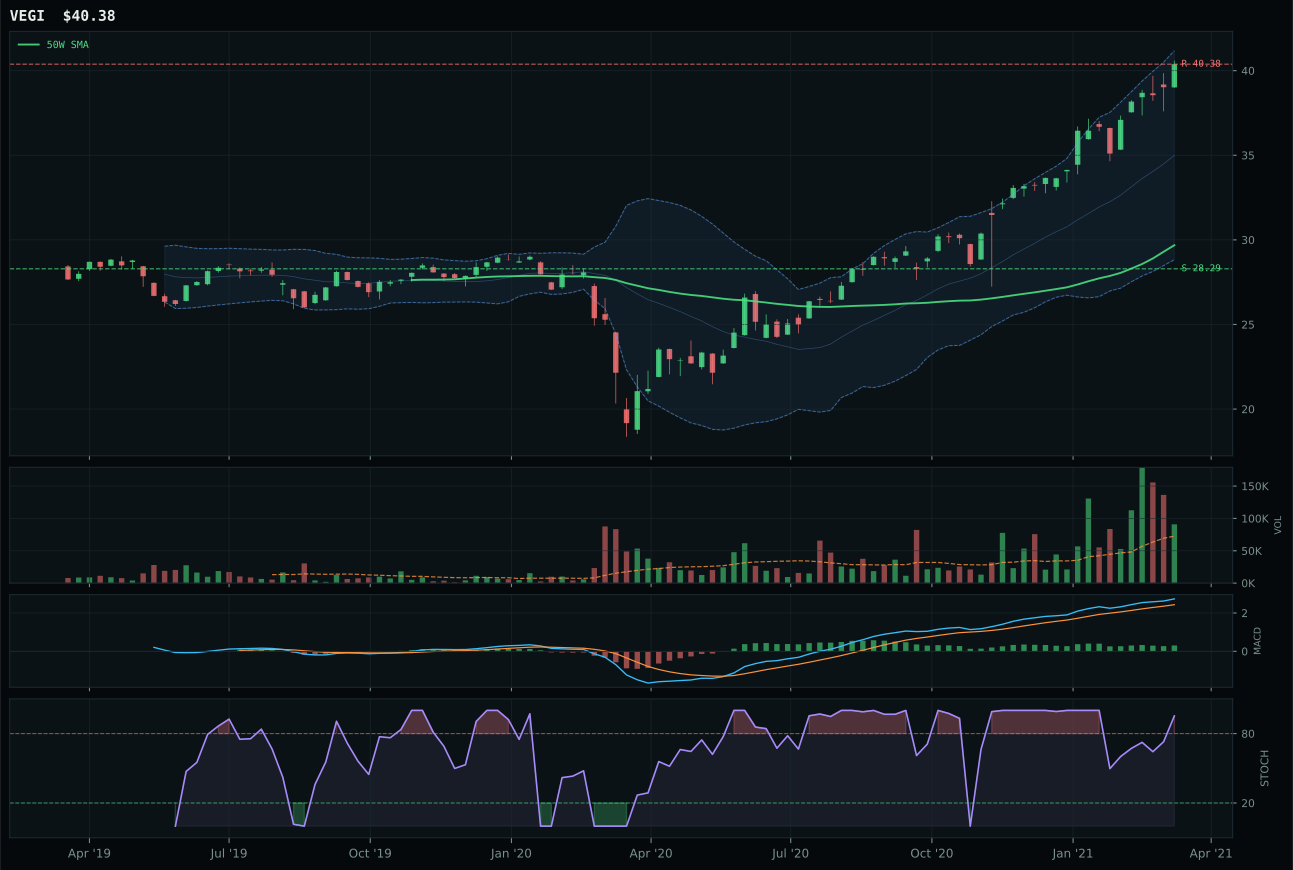
VEGI has a vertical extension profile with 14.0% 13-week relative strength versus SPY.
A failed hold above support would weaken the setup.
Tracked, but not top-2 eligible because: .
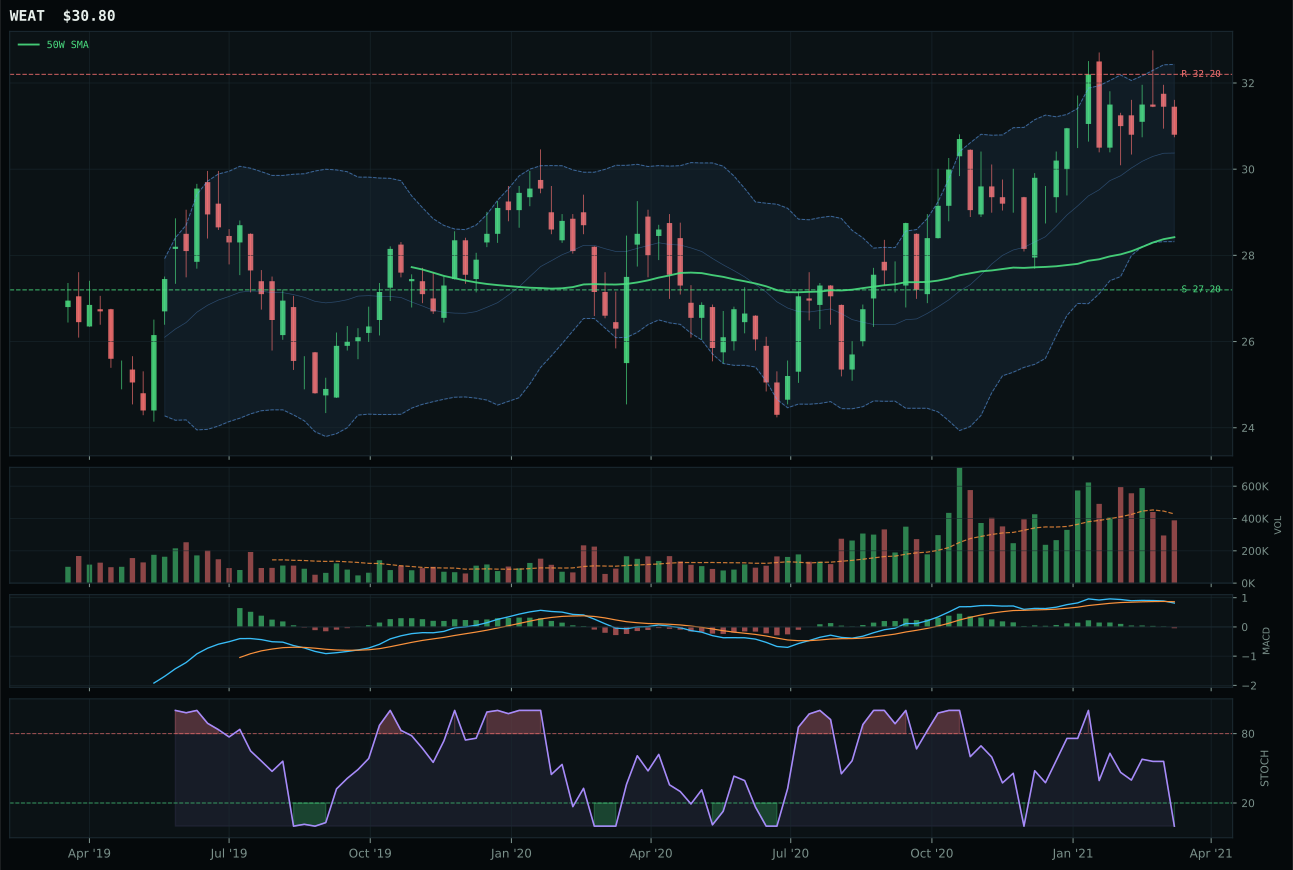
WEAT has a neutral structure profile with -4.2% 13-week relative strength versus SPY.
A failed hold above support would weaken the setup.
Actionable but governed by invalidation levels.
MOO wins over VEGI with commanding strength across momentum and macro narrative: a 16.7% 13-week return on top of a 30.4% 26-week advance, with +9.2% relative strength versus SPY and +0.0% within its category. The agribusiness portfolio sits 28.7% above the 50-week moving average with a 1.2% slope and MACD that remains bullish but flattening—the latter a slight caution flag, yet supported by volume at 0.72x the 20-week average that shows patient accumulation despite thin participation. Stochastic RSI at 0.72 is in the falling/neutral zone rather than overbought, creating an unusual combination of strong medium-term returns with technical setup that has room to run. VEGI's edge in 13-week returns (+21.6%) and category relative strength (+4.9%) is negated by its 36.0% extension above the 50-week, MACD flattening, and overbought stochastic RSI at 1.00—a setup where timing has deteriorated materially.
Agriculture & Livestock receives 5% allocation as a tier-2 holding with a category score of 56.3, benefiting from the strongest macro fit in the portfolio at 86.0/100. Supply shortage is active (+13), inflation pressure is active (+10), and real asset sponsorship is active (+8), creating a powerful macro tailwind that elevates the category despite MOO's extended technical setup. The 13-week RS of +9.2% and +14.9% category-relative strength demonstrate that agribusiness is being selected as an inflation hedge and scarcity play, a thesis reinforced by the Transition/Mixed regime's skepticism toward duration assets. Technical evidence for the category is solid at 56.5/100, but it is the macro narrative—commodities, supply constraints, and pricing power—that earns this allocation. To move to a 5% overweight, the category would need either a pullback into support at 66.38 for a fresher entry, or continued acceleration of real asset sponsorship signals that would signal a regime shift toward harder assets.
Defense & Aerospace — ITA
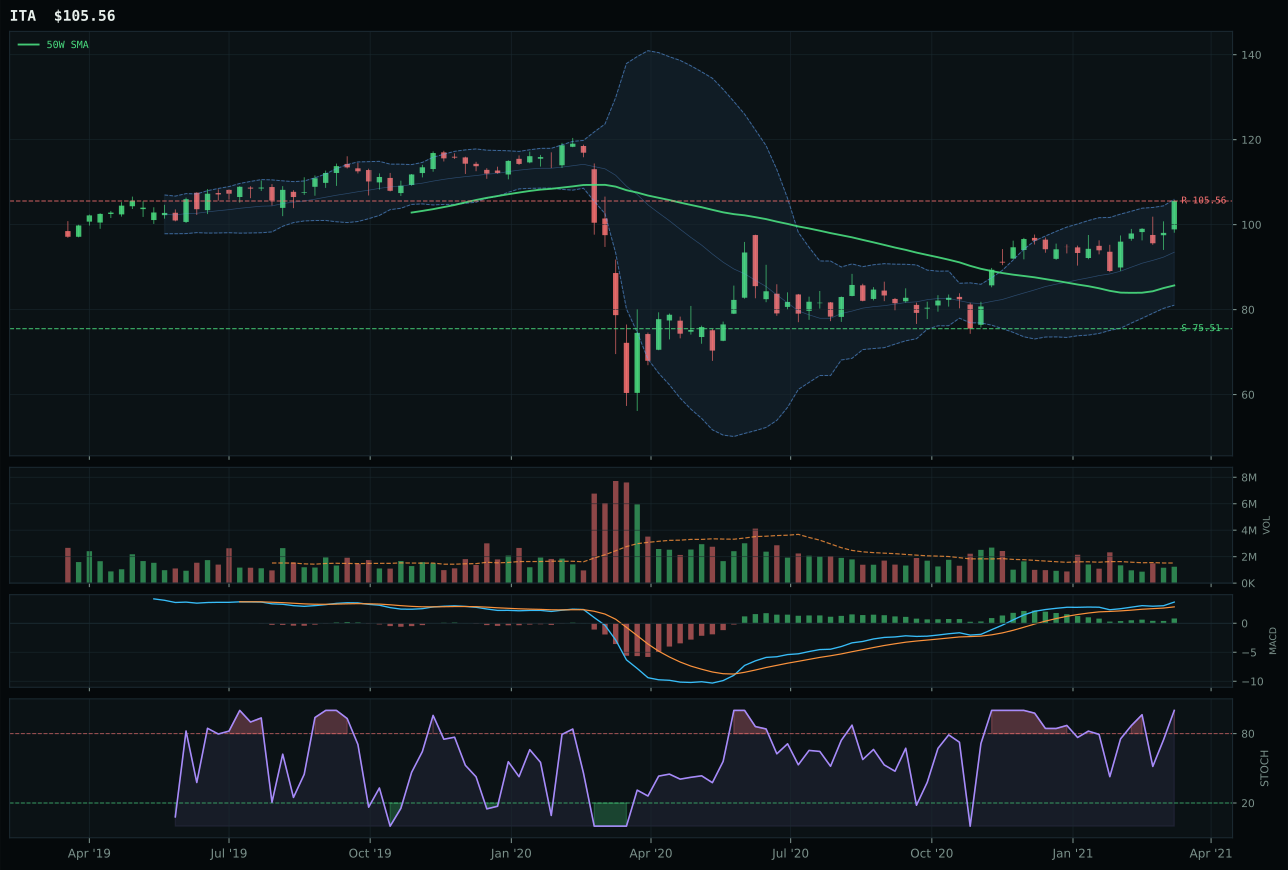
ITA has a vertical extension profile with 2.1% 13-week relative strength versus SPY.
A failed hold above support would weaken the setup.
Actionable but governed by invalidation levels.
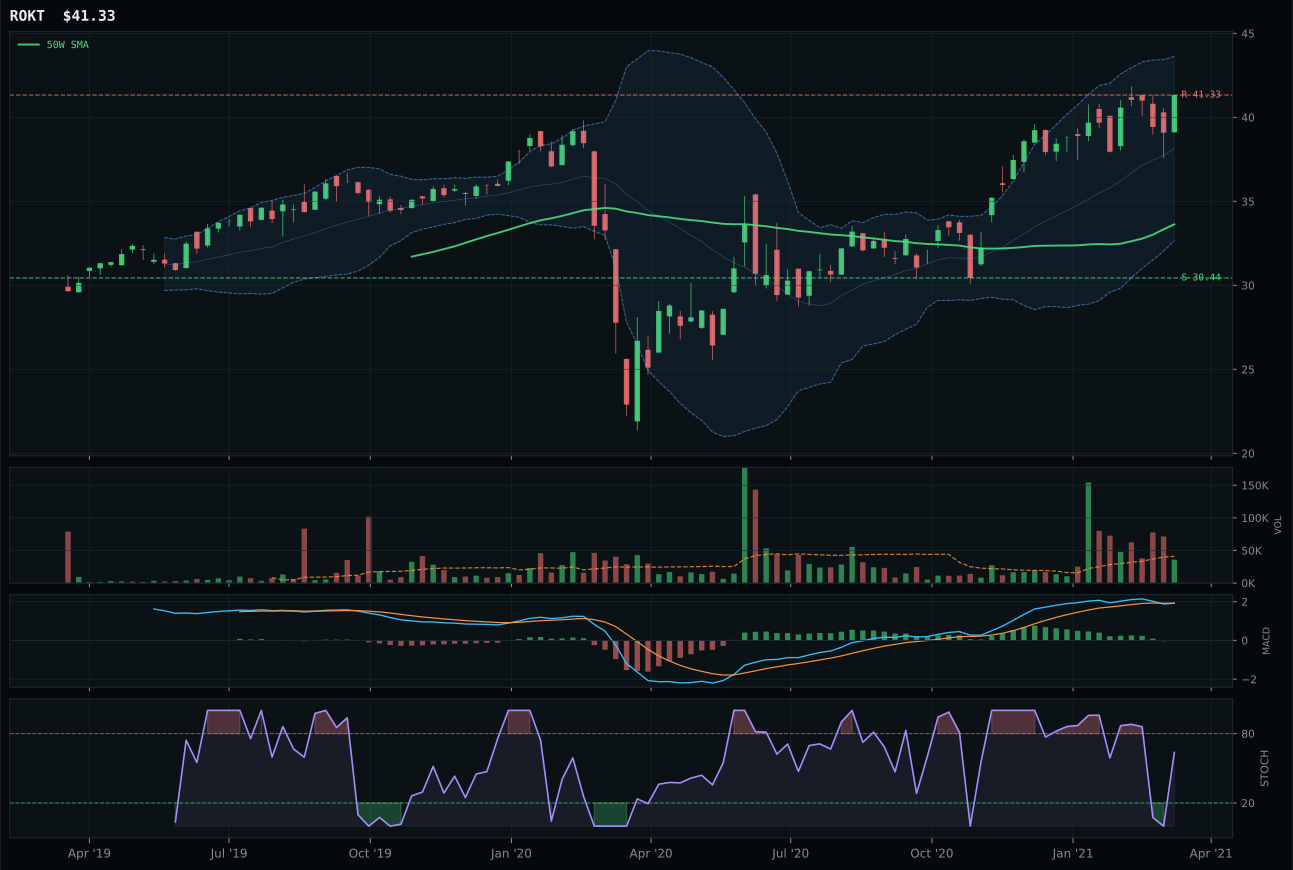
ROKT has a vertical extension profile with -2.3% 13-week relative strength versus SPY.
A failed hold above support would weaken the setup.
Tracked, but not top-2 eligible because: .
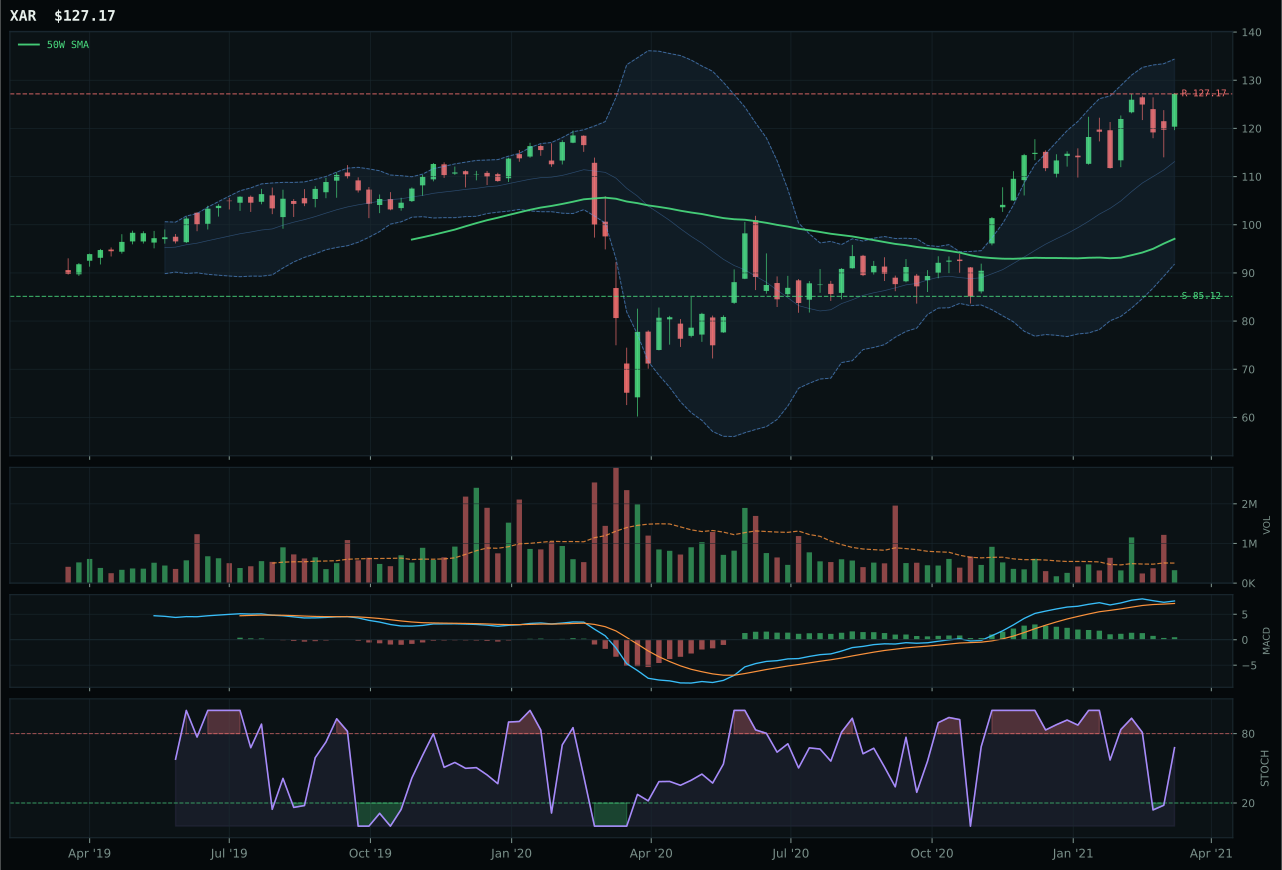
XAR has a vertical extension profile with 3.1% 13-week relative strength versus SPY.
A failed hold above support would weaken the setup.
Actionable but governed by invalidation levels.
ITA dominates this category with a decisive 34.2-point gap over ROKT, powered by a perfect 100.0/100 trend score and exceptional momentum confirmation at 88.4/100. Price is above both the 50-week and 200-week moving averages with a 0.7% slope, and relative strength versus SPY is +2.1%—a signal that defense primes are outpacing the broad market even in a Transition/Mixed regime. MACD is actively bullish and improving while stochastic RSI has reached overbought momentum at 1.00, confirming that money is flowing into the name with conviction rather than hesitation. The 9.7% 13-week return reflects genuine strength, though the 0.0% upside to resistance at 105.56 tells allocators that the setup is now extended and entry timing has shifted to favor hold over new long positions. ROKT's MACD is only bullish but flattening, and its category-relative strength lags at -4.4%, making it a distant second.
Defense & Aerospace earns 5% allocation as a tier-2 position despite a final category score of 50.7 that ranks below the top two. The macro environment of Transition/Mixed actually provides modest support here, and the active macro fit of 55.0/100 is buoyed by weak credit stress signals (+2) that hint at potential policy accommodation. ITA's technical evidence score of 67.2/100 is respectable, anchored by trend strength and exceptional momentum, but the extended valuation (23.2% above the 50-week) and risk-reward asymmetry (40.6/100) prevent this category from cracking the top-two overweight slots. The allocation reflects a view that defense durability and capex inelasticity remain compelling, but only at a tier-2 conviction level. To move up to a 5% overweight, the category would need either a pullback to establish a fresher entry point or a measurable shift in the macro regime toward clearer risk-off positioning.
Utilities & Infrastructure — PAVE
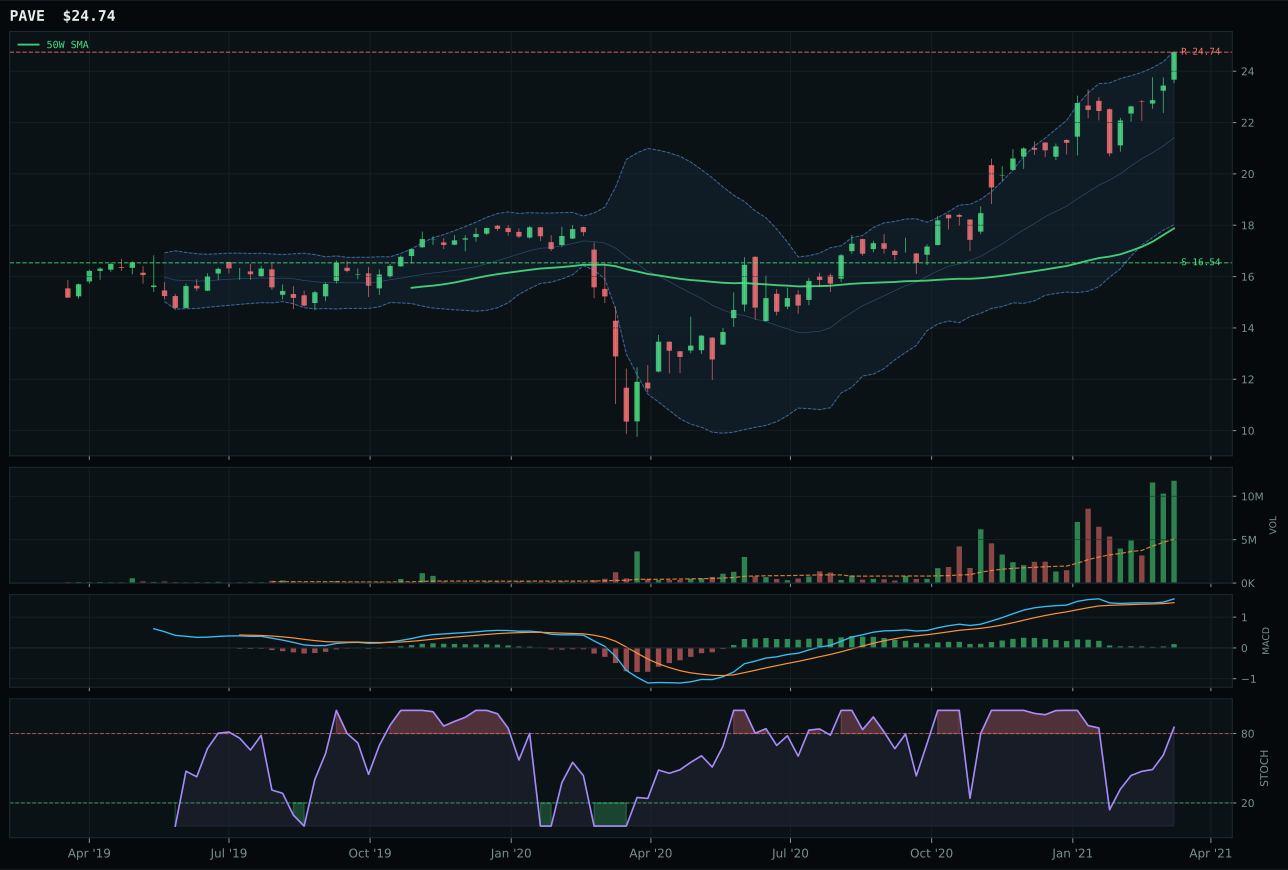
PAVE has a vertical extension profile with 10.6% 13-week relative strength versus SPY.
A failed hold above support would weaken the setup.
Actionable but governed by invalidation levels.
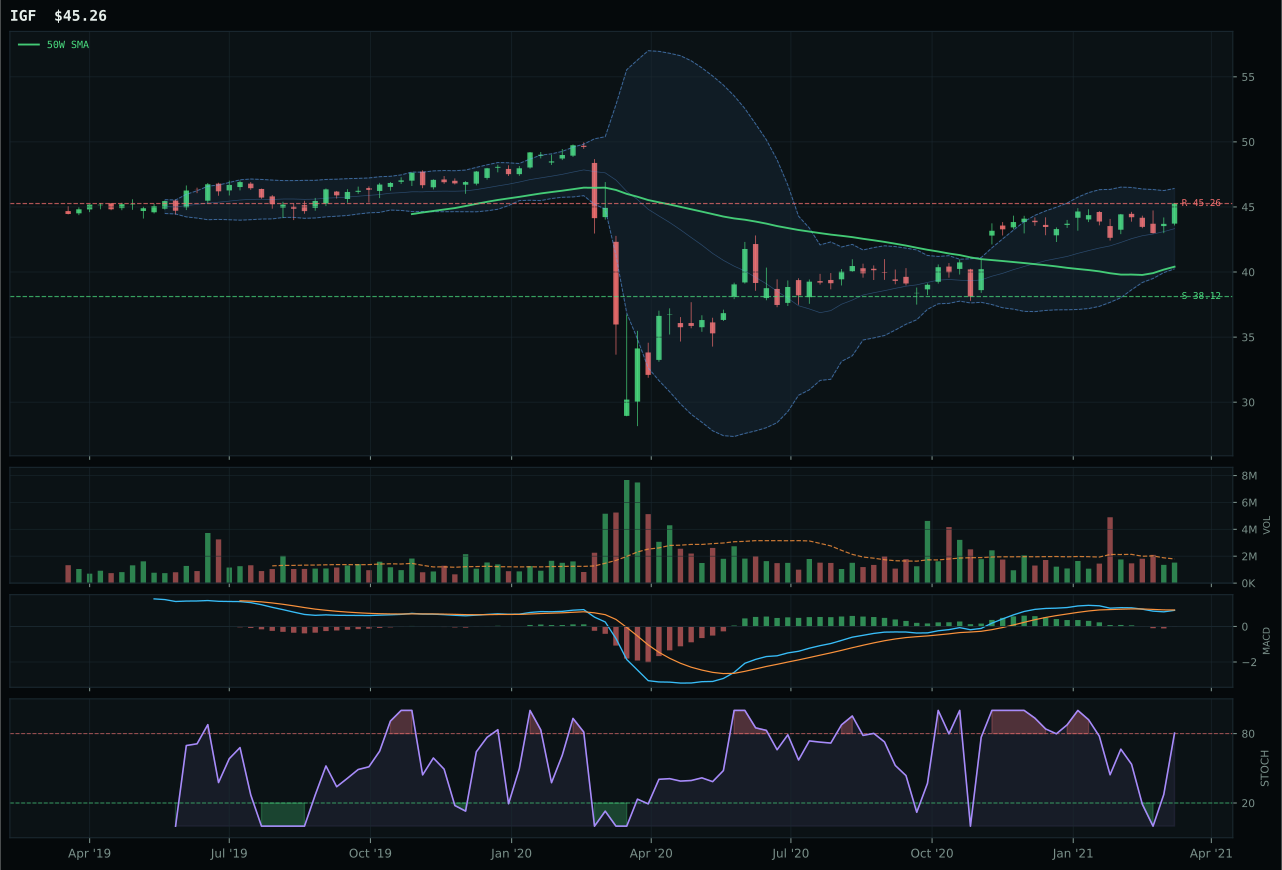
IGF has a neutral structure profile with -4.3% 13-week relative strength versus SPY.
A failed hold above support would weaken the setup.
Actionable but governed by invalidation levels.
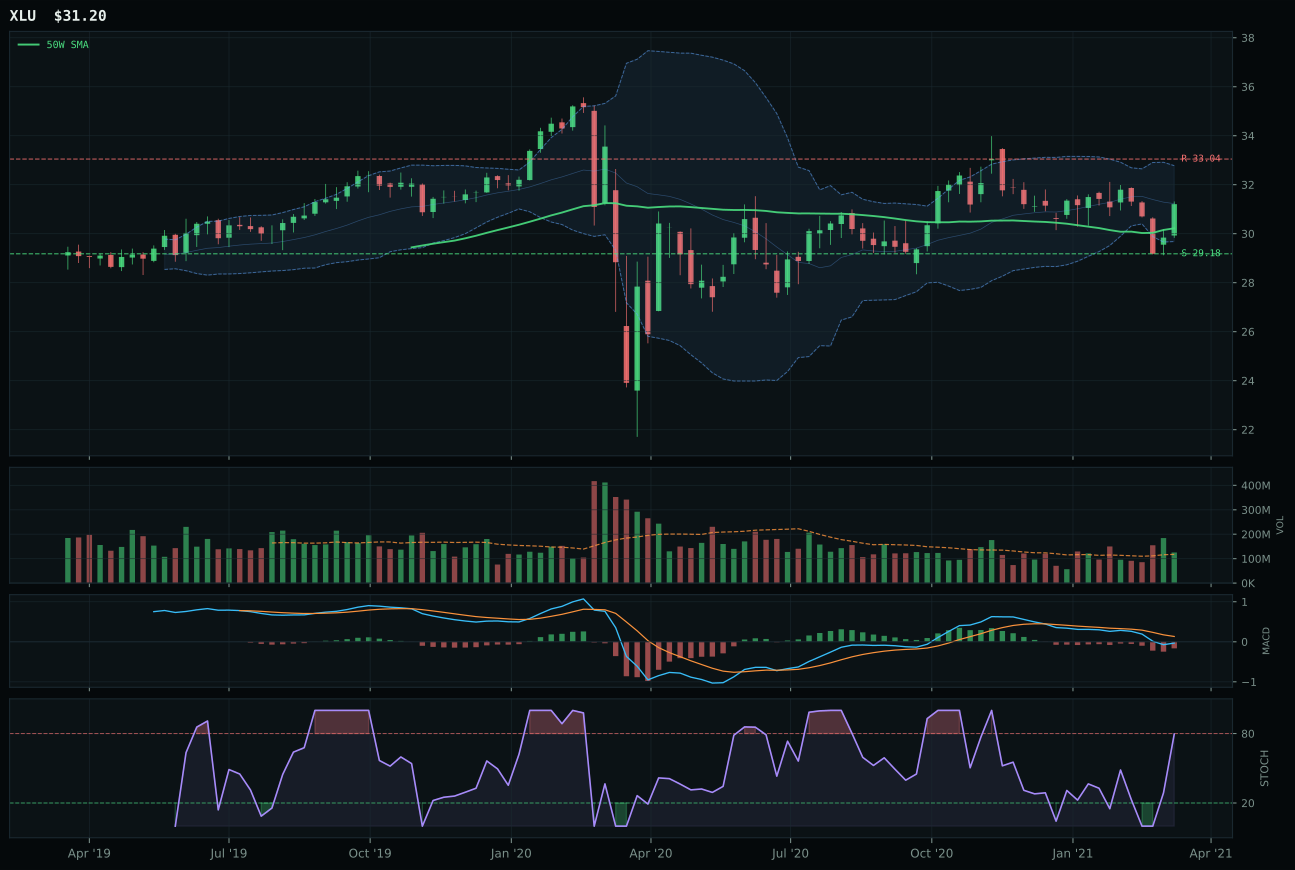
XLU has a neutral structure profile with -7.3% 13-week relative strength versus SPY.
A failed hold above support would weaken the setup.
Actionable but governed by invalidation levels.
PAVE dominates this category with a 6.7-point margin over IGF, powered by the cleanest structure (85.0/100) and strongest volume-price confirmation (94.0/100) in the category. The domestic infrastructure ETF delivers an 18.1% 13-week return and 46.9% 26-week return with +10.6% relative strength versus SPY and +14.9% within its category—a clear signal that U.S. infrastructure capex and government spending themes are being actively accumulated. Price sits 38.4% above the 50-week moving average with a 1.5% slope, MACD bullish and improving, stochastic RSI in overbought momentum at 0.85, and volume participation at 2.33x the 20-week average (accumulation/confirmation of the highest order). The 100.0/100 momentum confirmation combined with 95.9/100 persistence tells allocators that this is not a momentum-driven short squeeze but institutional positioning in a structural thesis. IGF's neutral structure, bearish/weakening MACD, and only neutral volume confirmation make it a distant second despite 76/100 trend strength.
Utilities & Infrastructure receives 5% allocation as tier-2 with a final score of 43.8, held back by a category-level macro fit of only 48.0/100 and moderate technical evidence of 95.3/100 (strong but offset by macro headwinds). Inflation pressure is active (-6), offsetting the modest positive from commodity breadth (+4). PAVE's 95.3/100 technical evidence is exceptional—among the highest in the portfolio—yet the macro environment of Transition/Mixed with credit stress and inflation pressure concerns does not strongly support utilities and infrastructure at overweight conviction. The allocation reflects a tactical view that domestic capex and infrastructure spending narratives still command sponsorship, but only at tier-2 sizing. To move to 5% overweight, the category would need either measurable relief in inflation narratives, credit condition improvement, or continued volume accumulation into PAVE that proves the capex thesis is immune to the broader macro headwinds that constrain utilities and duration assets.
Precious Metals — SLV
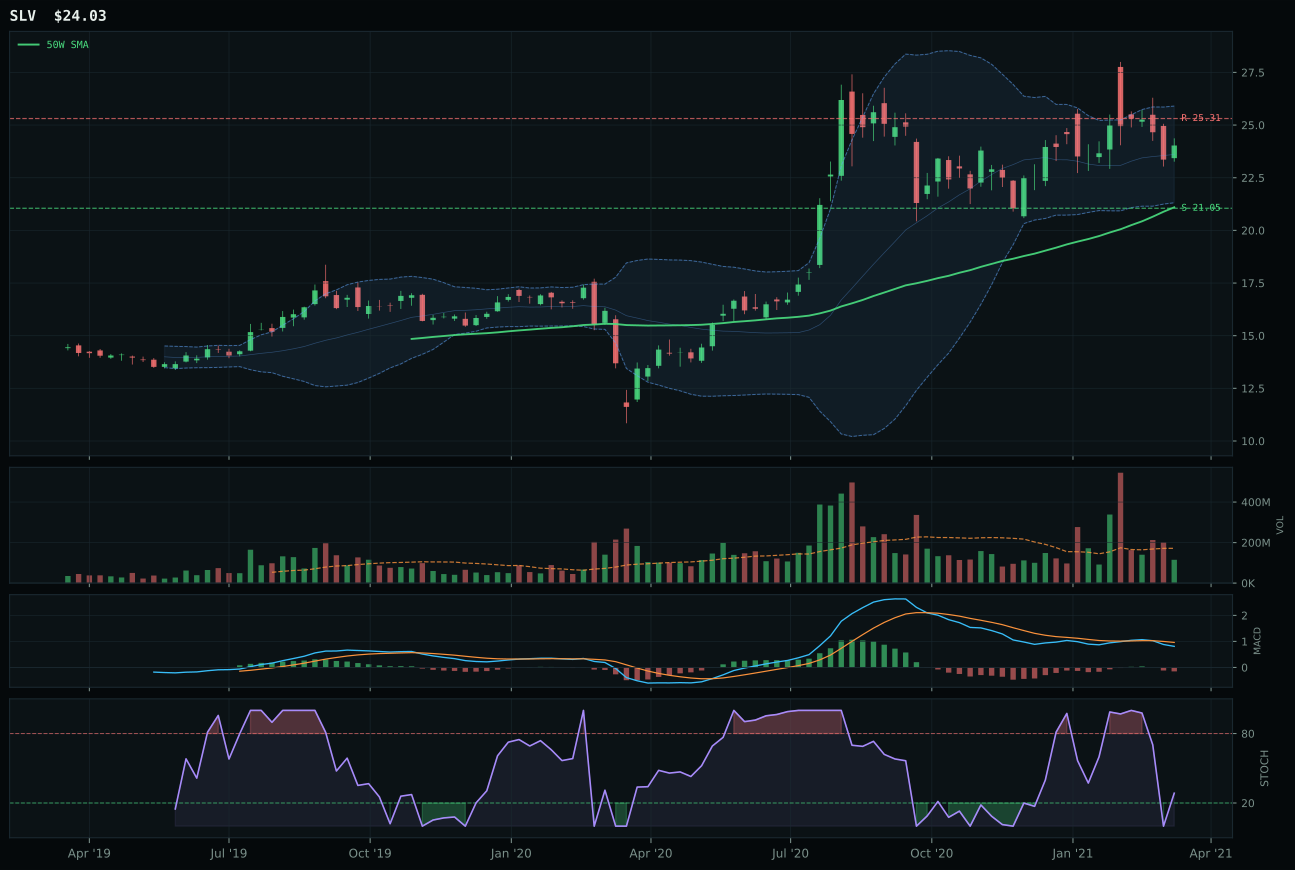
SLV has a neutral structure profile with 0.4% 13-week relative strength versus SPY.
A failed hold above support would weaken the setup.
Actionable but governed by invalidation levels.
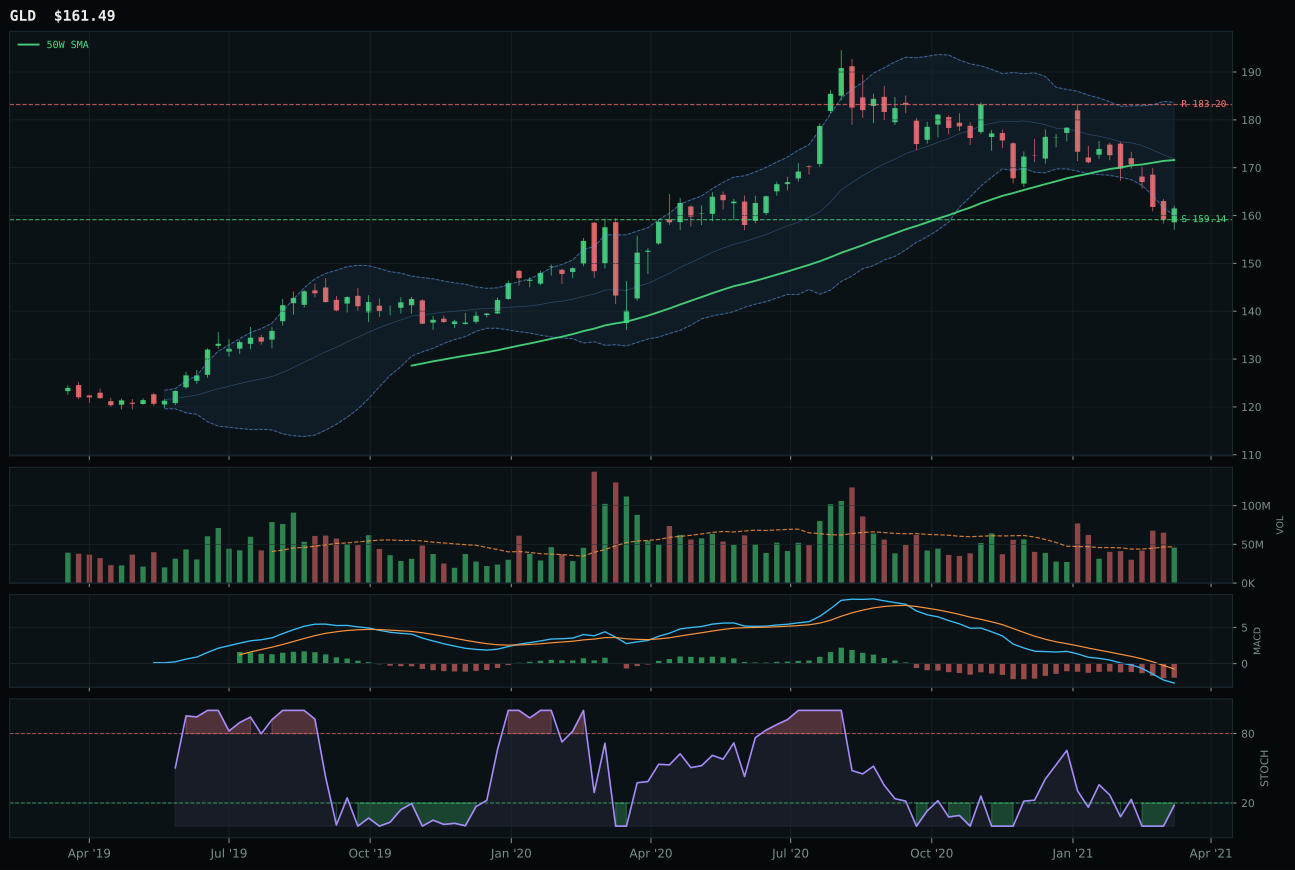
GLD has a pullback into support profile with -14.0% 13-week relative strength versus SPY.
A failed hold above support would weaken the setup.
Actionable but governed by invalidation levels.
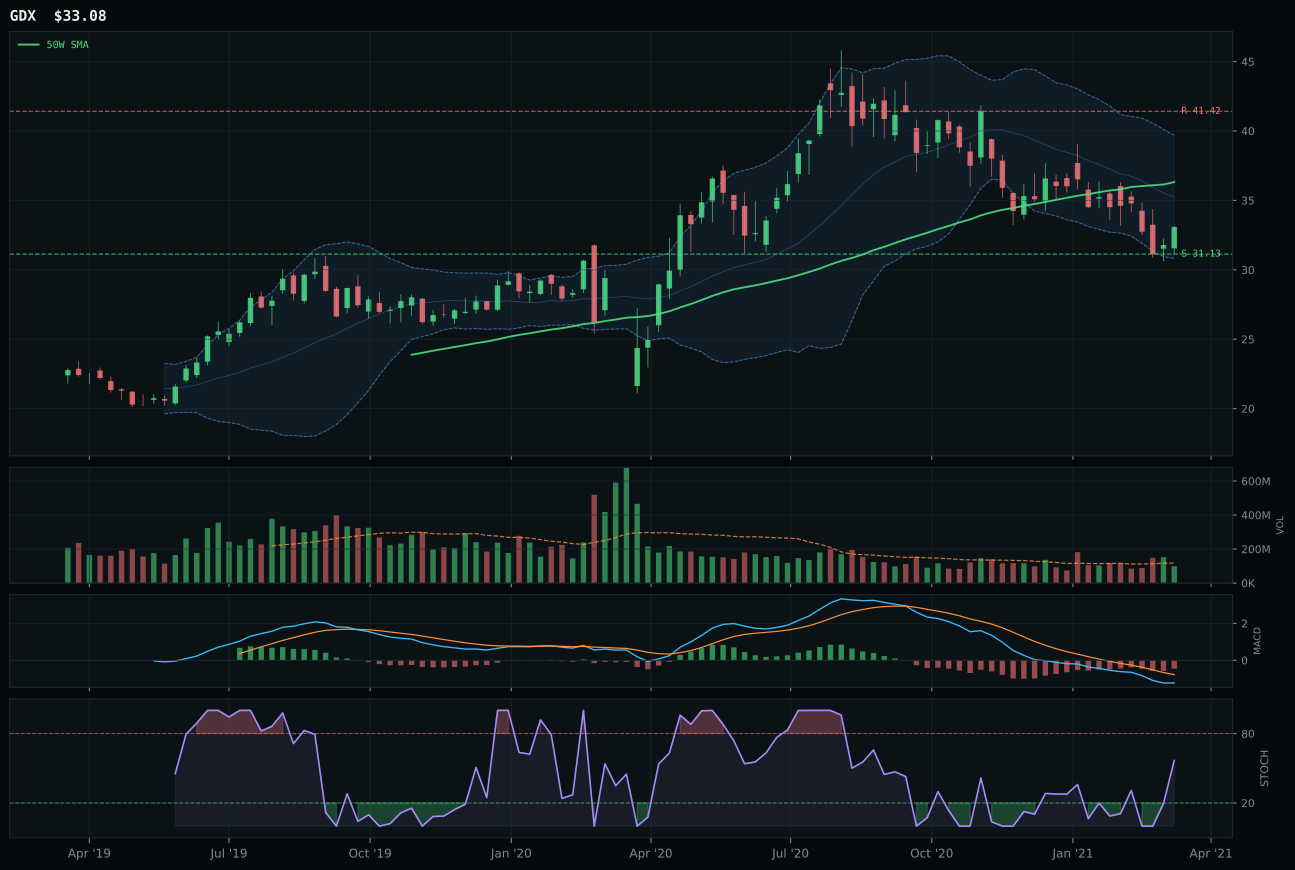
GDX has a neutral structure profile with -13.3% 13-week relative strength versus SPY.
A failed hold above support would weaken the setup.
Actionable but governed by invalidation levels.
SLV wins with a 14.4-point margin over GLD despite a neutral chart structure, powered by category-relative strength of +13.7% that reveals silver's hybrid character as both monetary hedge and industrial commodity. The 8.0% 13-week return and +0.4% relative strength versus SPY sit atop a structure that is higher-low/higher-high (above the 50-week and 200-week), though without vertical extension—meaning SLV has built a base rather than chased a breakout. Critically, SLV's +13.7% relative strength within the precious metals basket tells allocators that silver is being selected over gold and miners, likely because its industrial beta aligns with scarcity narratives while its monetary role hedges inflation. GLD, by contrast, shows -14.0% relative strength versus SPY and -6.4% 13-week return, signaling that pure monetary gold has lost institutional sponsorship in the current regime. Volume at 0.67x the 20-week average is thin, but SLV's timing score of 70.0/100 reflects well-positioned price relative to Fibonacci levels and moving averages.
Precious Metals receives 5% allocation as tier-2 with a final category score of 41.0, held back by a neutral macro fit of 50.0/100 and weak technical evidence for the category as a whole (category-level technical is 50.7/100). Metals scarcity and inflation pressure are active (+7 and +5 respectively), but these signals are insufficient to elevate precious metals above tier-2 conviction in a Transition/Mixed regime where real asset flows remain selective. SLV's relative outperformance within its category reflects smart beta rotation rather than category-level enthusiasm; the fact that silver beats gold and miners tells you the market is pricing industrial demand and scarcity, not monetary panic. To move to a 5% overweight, precious metals would need either a clear acceleration in inflation data or a pivot to explicit risk-off conditions with credit stress flags shifting to positive. The current allocation honors the case for inflation hedges without overcommitting to a macro call that the regime is moving decisively toward precious metals premium.
Emerging Markets — INDA
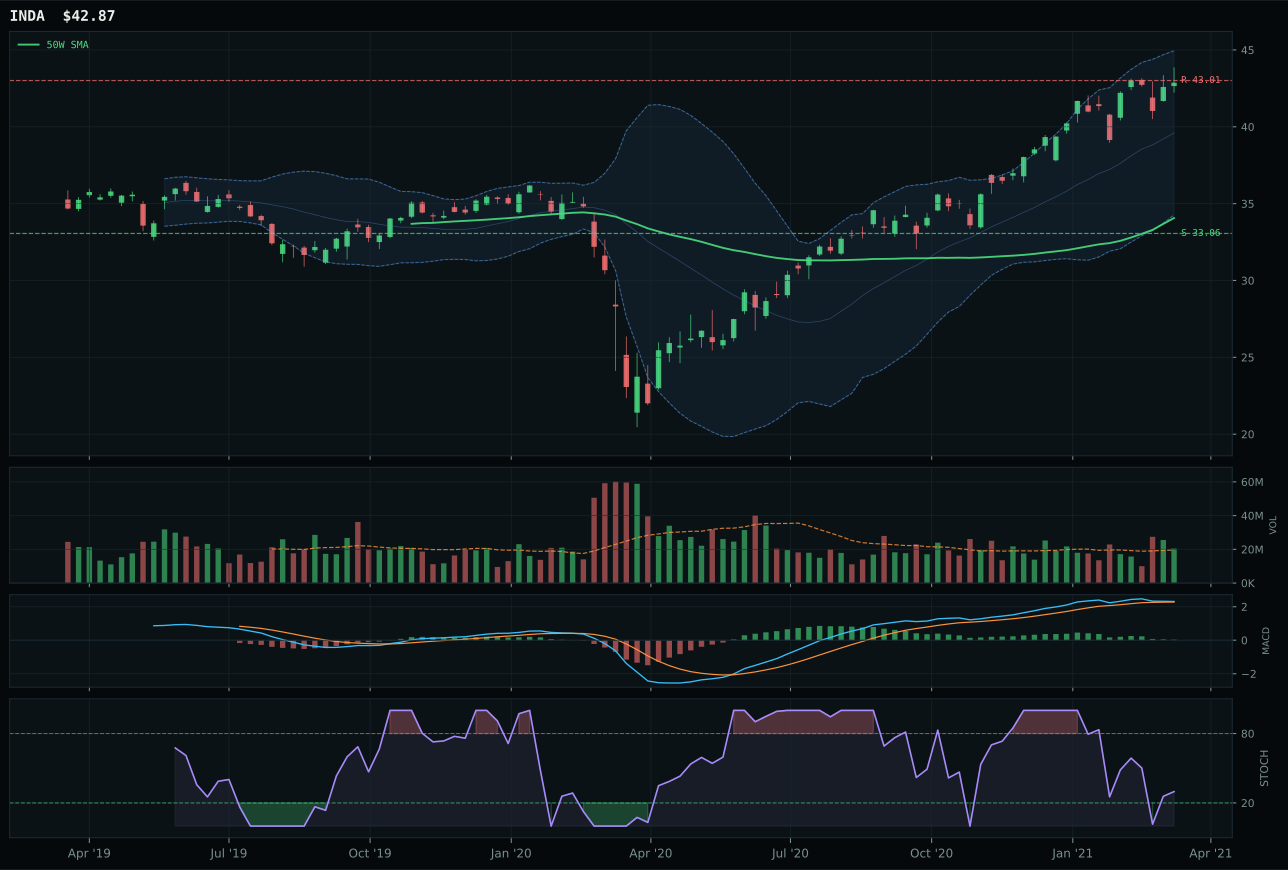
INDA has a vertical extension profile with 3.7% 13-week relative strength versus SPY.
A failed hold above support would weaken the setup.
Actionable but governed by invalidation levels.
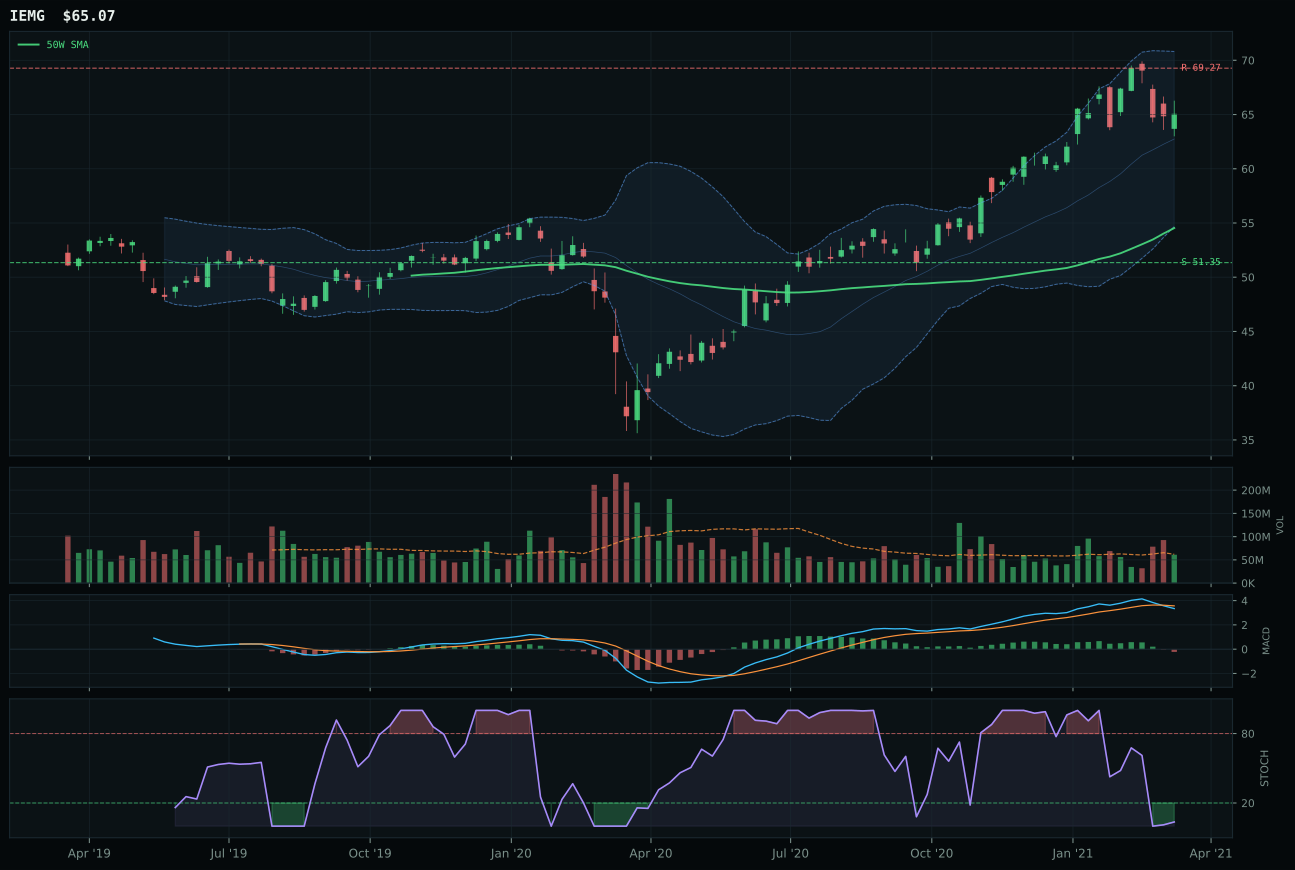
IEMG has a vertical extension profile with -0.9% 13-week relative strength versus SPY.
A failed hold above support would weaken the setup.
Actionable but governed by invalidation levels.
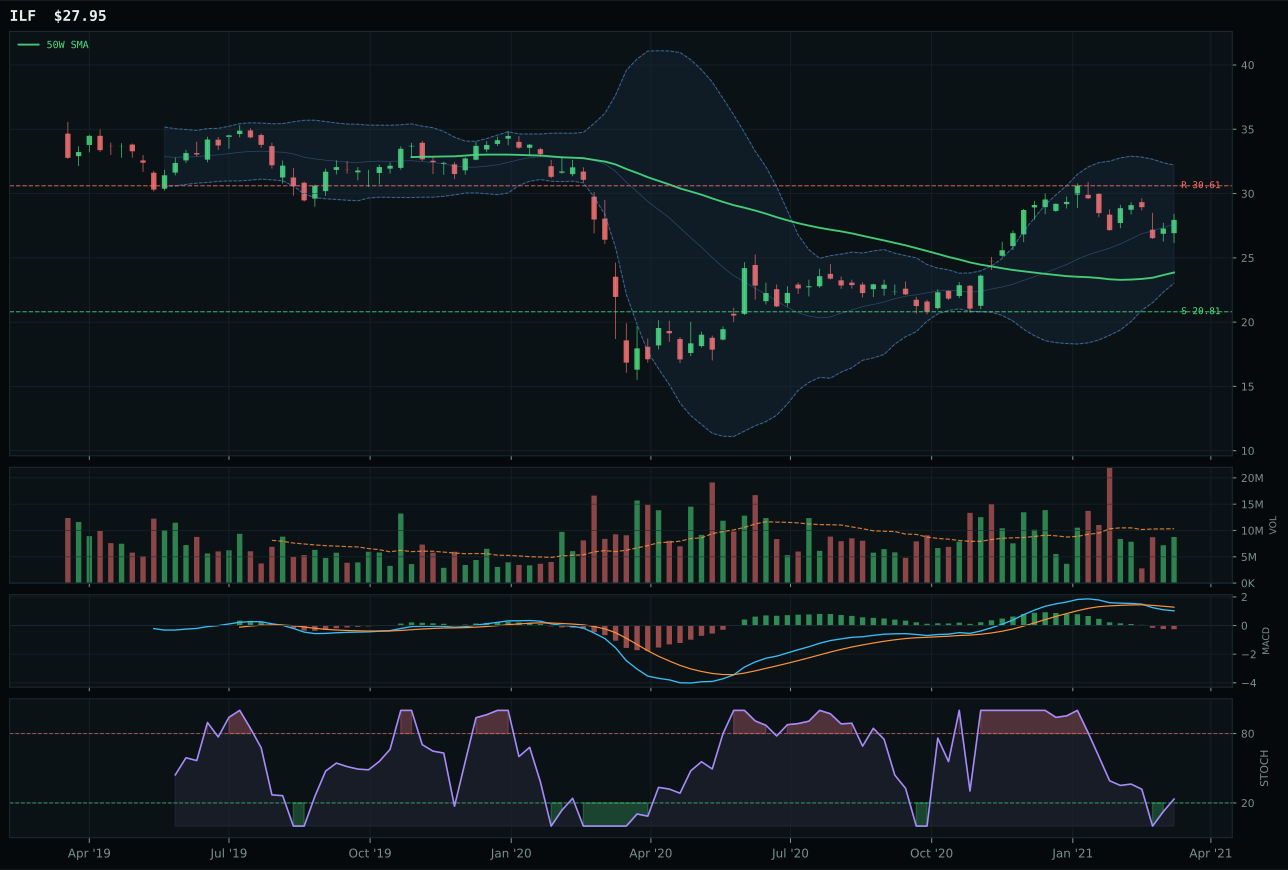
ILF has a vertical extension profile with -11.6% 13-week relative strength versus SPY.
A failed hold above support would weaken the setup.
Actionable but governed by invalidation levels.
INDA wins over IEMG with a 4.8-point margin, claiming victory through superior momentum confirmation and within-category relative strength that proves India is the selected emerging-market exposure. The India ETF delivers an 11.3% 13-week return with 26.5% 26-week gains and +3.7% relative strength versus SPY, posting a 25.8% extension above the 50-week moving average with a 1.1% slope and 79.7/100 momentum confirmation. MACD is bullish but flattening (a caution) yet supported by neutral volume at 1.05x the 20-week average, suggesting patient accumulation rather than panic covering. Critically, INDA's +4.6% category-relative strength reveals that within emerging markets, India's quality-growth narrative is being actively selected over broad-beta and Latin America exposure. IEMG's bearish/weakening MACD and oversold stochastic RSI at 0.0% category-relative strength tell allocators that broad emerging-market sentiment has turned negative, while India's bullish setup still commands institutional interest.
Emerging Markets receives 5% allocation as tier-2 with a final score of 36.9, reflecting mixed macro support and moderate technical evidence that do not justify higher conviction. EM liquidity support is active (+14) but credit stress is active (-10), netting to 54.0/100 category-level macro fit. INDA's technical evidence of 55.4/100 is respectable but not compelling, anchored by strong trend (100.0/100) offset by weak risk-reward (37.2/100) and timing (40.0/100) that reflects the 25.8% extension above the 50-week. The allocation rewards India's relative outperformance within emerging markets and acknowledges the modest macro lift from EM liquidity support, but the Transition/Mixed regime does not strongly favor growth-dependent exposure in less creditworthy markets. To move to 5% overweight, emerging markets would need either a clear pivot in credit conditions toward EM-friendly risk-on, or a pullback in INDA to the 50-week moving average at 30.46 with fresh MACD confirmation.
Technology — XLK
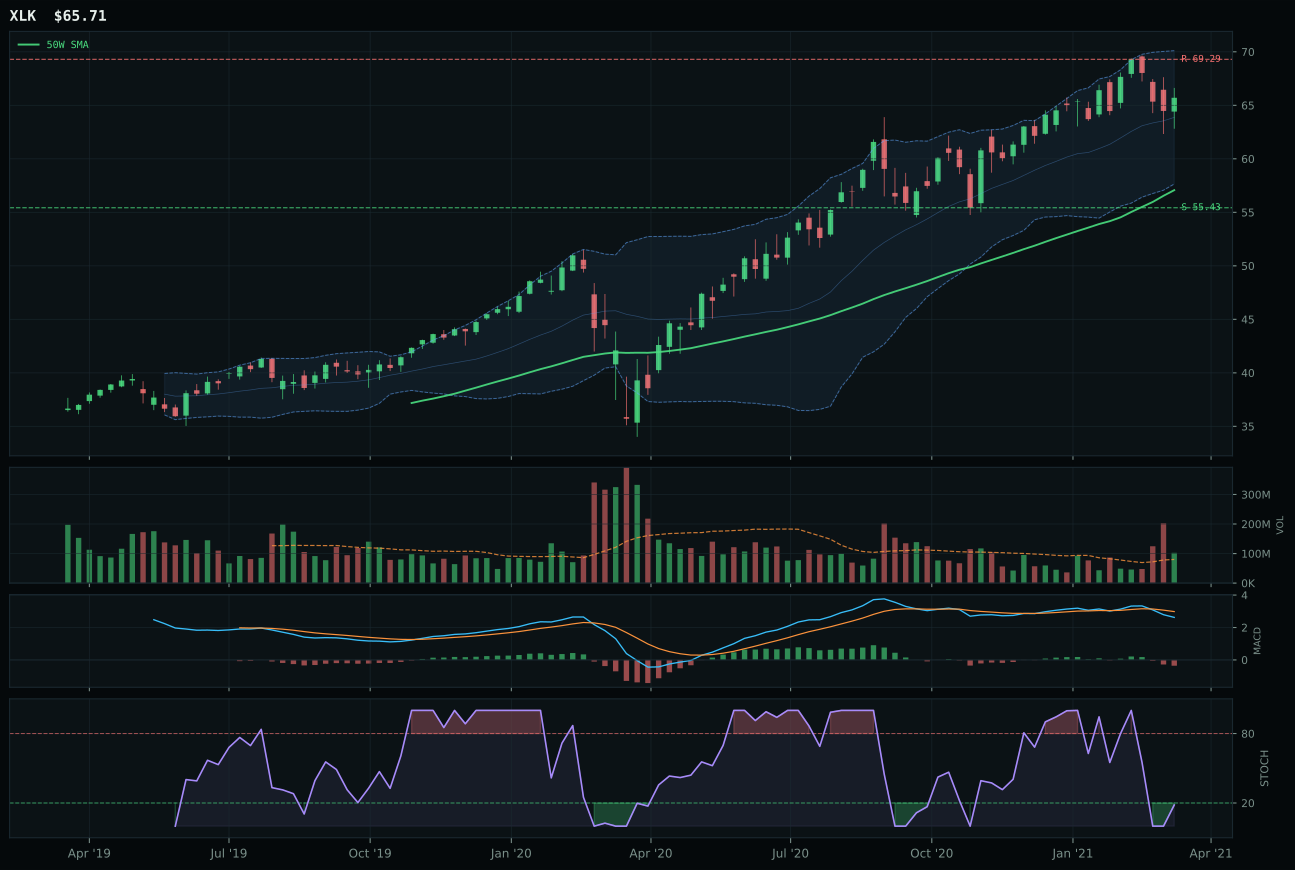
XLK has a vertical extension profile with -1.9% 13-week relative strength versus SPY.
A failed hold above support would weaken the setup.
Actionable but governed by invalidation levels.
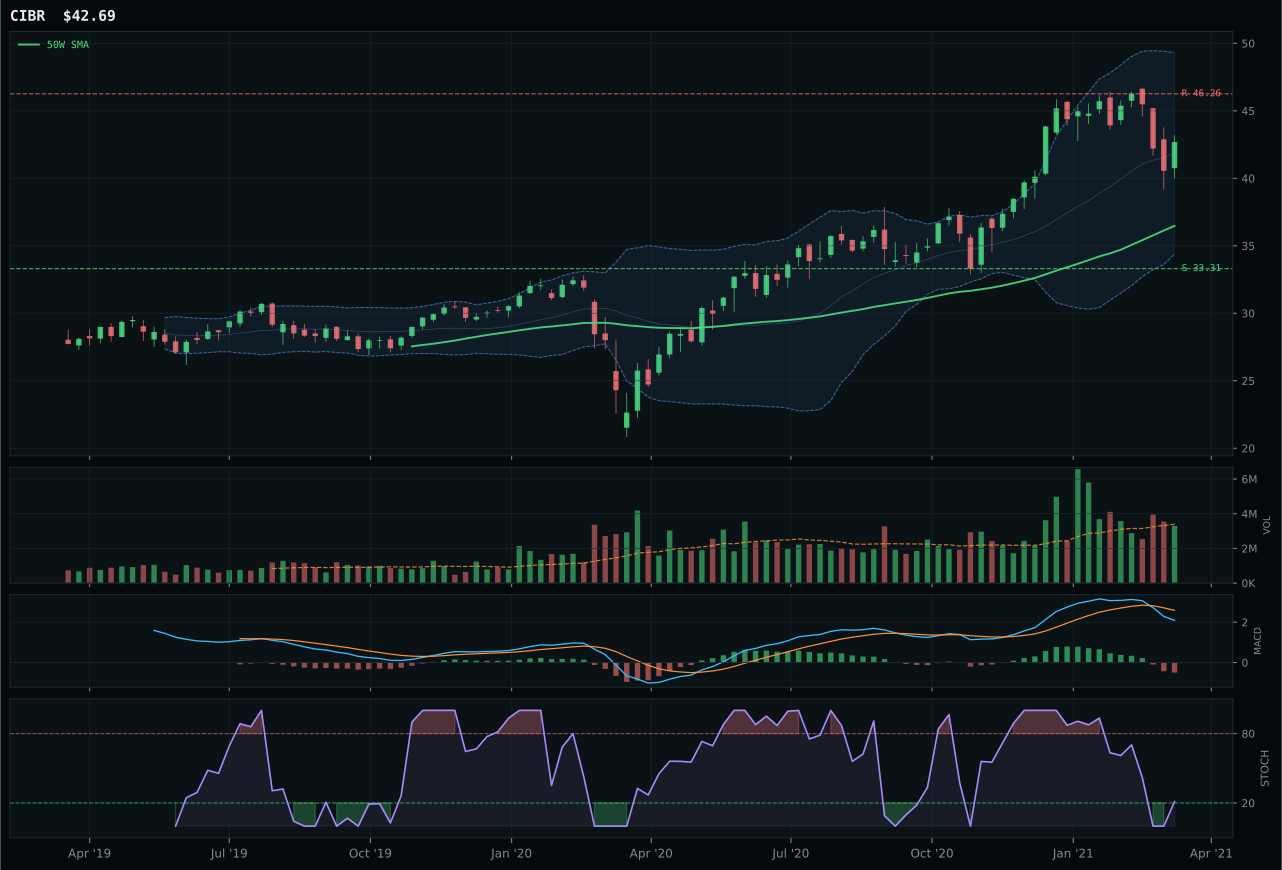
CIBR has a vertical extension profile with -1.2% 13-week relative strength versus SPY.
A failed hold above support would weaken the setup.
Actionable but governed by invalidation levels.
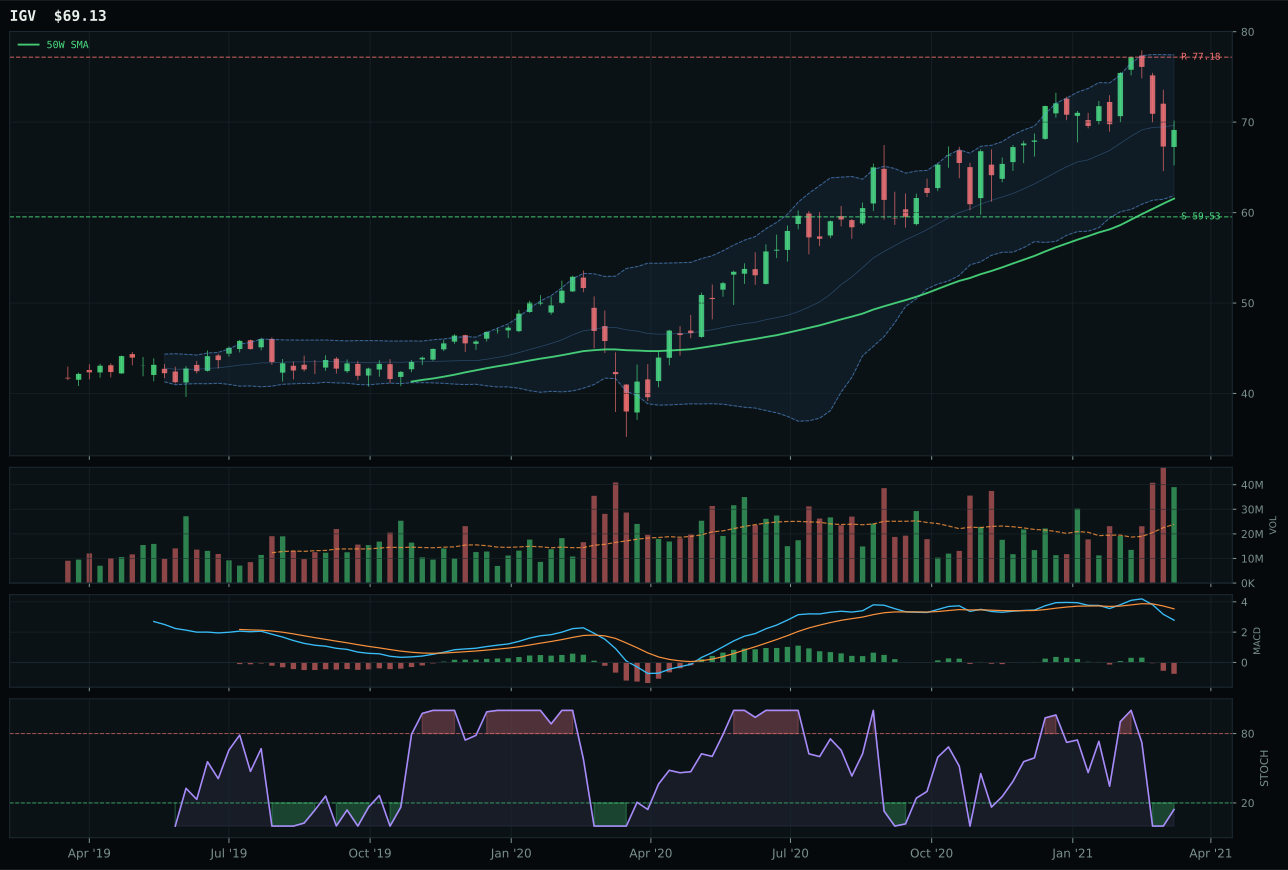
IGV has a neutral structure profile with -5.9% 13-week relative strength versus SPY.
A failed hold above support would weaken the setup.
Actionable but governed by invalidation levels.
XLK wins the category with a 1.8-point margin over CIBR, driven by superior trend confirmation and better volume sponsorship. Price sits 15.1% above the 50-week moving average with a clean 0.9% slope and positive relative strength versus SPY at -1.9%, meaning the broad technology complex is holding better than the market despite the extended valuation. Volume participation at 1.28x the 20-week average signals active accumulation, while MACD has begun to weaken and stochastic RSI is deeply oversold at 0.18—a setup that penalizes entry risk heavily but confirms institutional buying into perceived weakness. CIBR's structure score of 69.6 versus XLK's 76.5 reveals tighter support/resistance bands in XLK, and critically, CIBR's volume remains neutral rather than actively confirming, leaving cybersecurity's steady-beta narrative without the price-action proof that buyers are stepping in.
Technology receives 0% allocation this week, ranking outside the top two eligible categories at a final score of 28.8. The macro regime of Transition/Mixed actively penalizes growth-oriented technology exposure, with credit stress and inflation pressure both flagged as active headwinds. While XLK's 79.2/100 trend score is strong on its own, the category-level macro fit of only 39.0/100 signals that even the best technical setup cannot overcome the current regime's bias against duration risk and leverage-sensitive sectors. The system would require either a clear pivot to risk-on conditions with credit easing, or a decisive technical break by the category representative above 69.29 in resistance with volume confirmation, to earn its way back into allocation.
AI — SMH
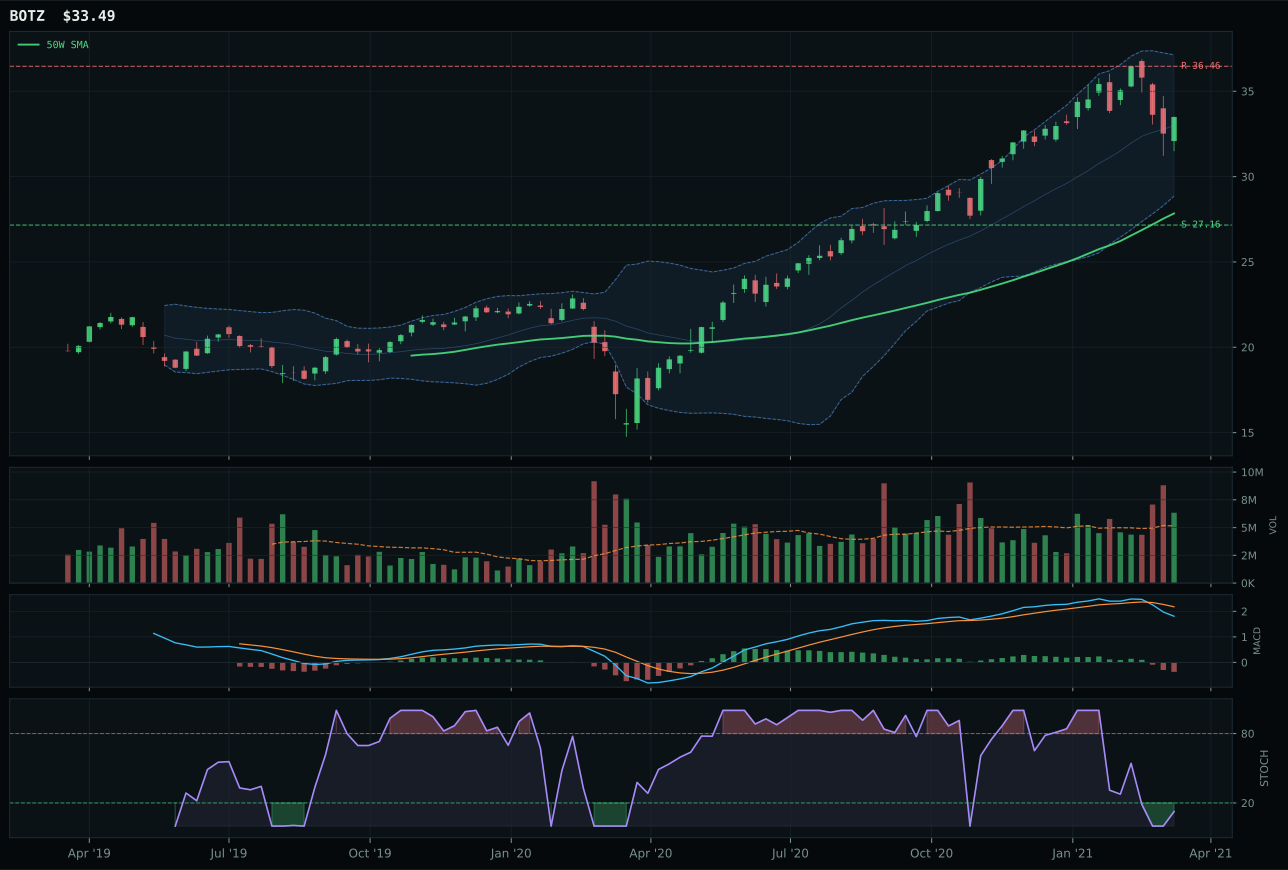
BOTZ has a vertical extension profile with -3.0% 13-week relative strength versus SPY.
A failed hold above support would weaken the setup.
Actionable but governed by invalidation levels.
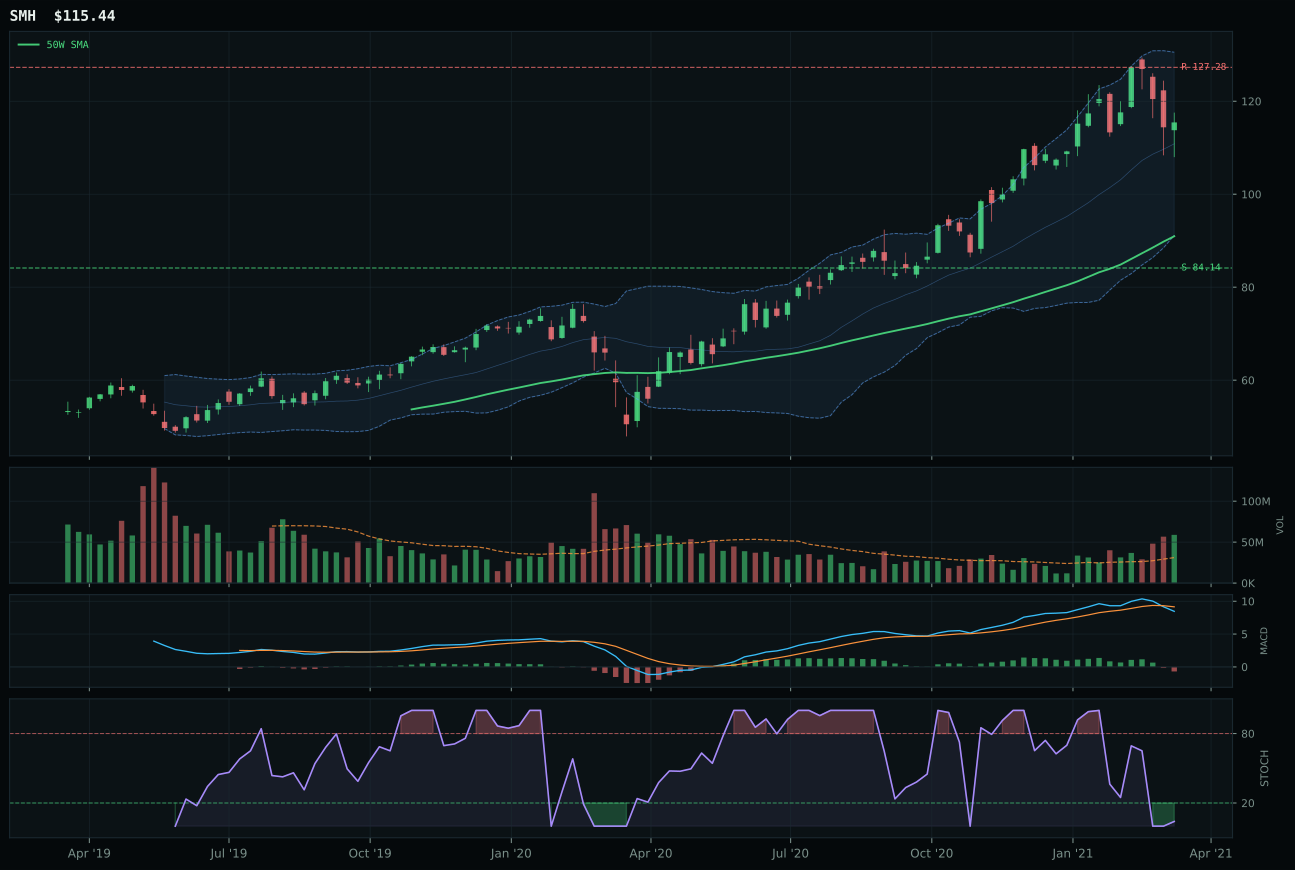
SMH has a vertical extension profile with 1.1% 13-week relative strength versus SPY.
A failed hold above support would weaken the setup.
Actionable but governed by invalidation levels.
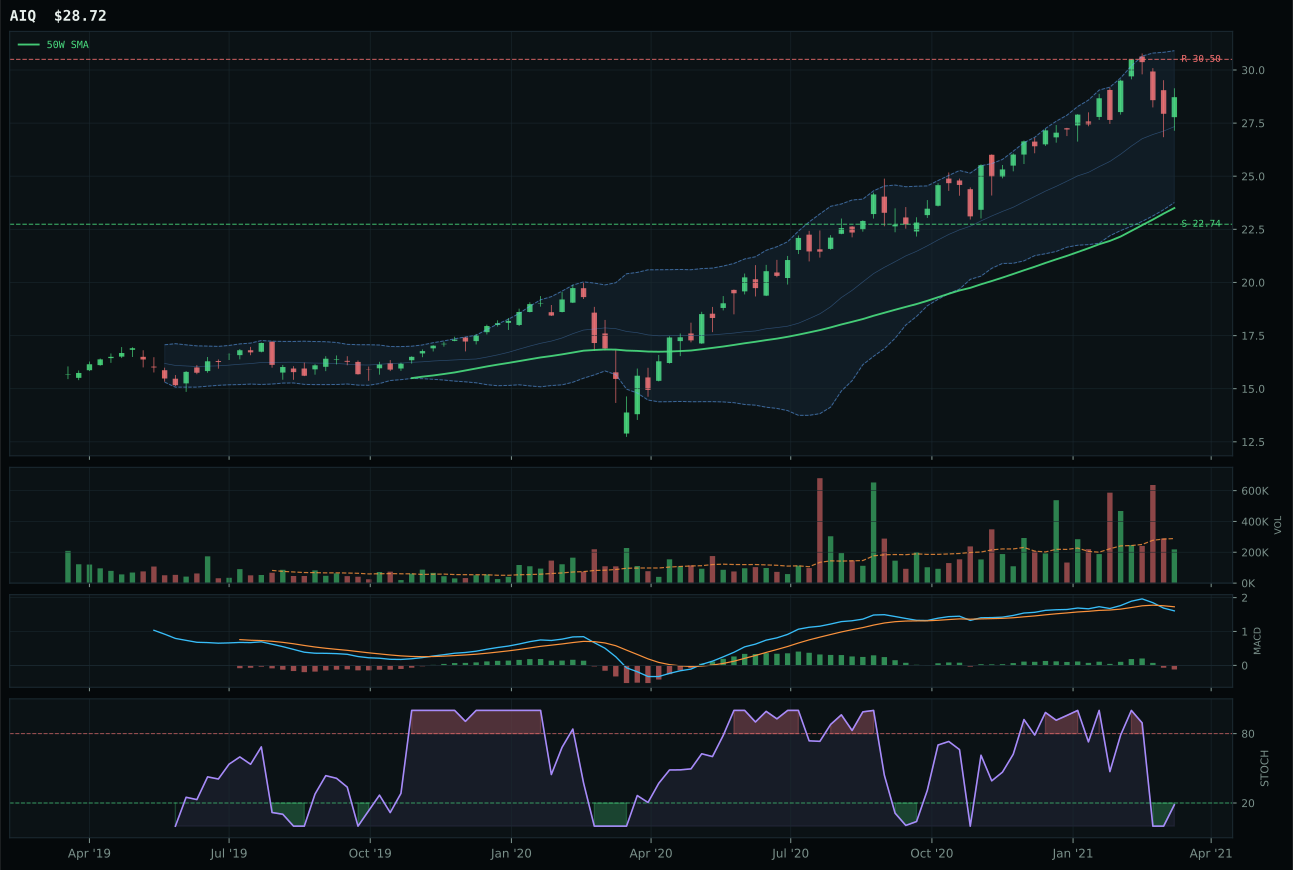
AIQ has a vertical extension profile with 1.2% 13-week relative strength versus SPY.
A failed hold above support would weaken the setup.
Tracked, but not top-2 eligible because: .
SMH wins with a 5.4-point advantage over BOTZ because semiconductor dominance delivers both superior momentum and volume confirmation that robotics cannot match. The semiconductor ETF's 13-week return of 8.6% sits atop 26-week gains of 39.0%, with relative strength versus SPY at 1.1%—a rare positive in a broad tech selloff. Volume participation at 1.89x the 20-week average reaches accumulation/confirmation levels, meaning larger players are accumulating into the 26.9% extension above the 50-week line rather than taking profits. BOTZ trails at -3.0% versus SPY with only above-average participation, and its 4-week return is already negative at -9.3%, signaling momentum divergence where the shorter-term sellers are gaining control. Price sits in the upper Fibonacci zone near 110.11, and while both charts are extended, SMH's volume sponsorship proves the AI trade still has institutional legs.
AI receives 0% allocation and ranks 9th or 10th in the category selection process with a final score of 25.3. Credit stress and weak technical evidence combine to exclude this category entirely from the portfolio. SMH's 35.6/100 technical score is dragged lower by timing (only 48.0/100) and risk-reward (54.5/100 upside with -9.3% downside), reflecting the reality that at a 26.9% extension, new buyers face asymmetric risk. The category-level macro fit of 42.0/100 provides minimal offset because the active macro descriptor profile does not strongly support growth-dependent artificial intelligence; instead, credit stress and inflation pressure remain active headwinds. For AI to earn its way into allocation, the system would need either a pullback to the 50-week moving average with MACD restart, or a shift in the macro regime toward credit ease and inflation moderation.