
2021-03-05
Informational purposes only. The content in this report, including allocations, analysis, and commentary, is provided solely for informational and educational purposes. It does not constitute financial advice, investment advice, trading advice, or any other type of advice. Past performance does not guarantee future results. Always conduct your own research and consult a qualified financial professional before making investment decisions.
Weekly Allocation
| Ticker | Category | Weight | Role |
|---|---|---|---|
| FSOL | 50% | Overlay | |
| XLE | Traditional Energy | 10% | Top-2 (10%) |
| MOO | Agriculture & Livestock | 10% | Top-2 (10%) |
| URNM | Nuclear Energy | 5% | Tier-2 (5%) |
| COPX | Industrial Metals | 5% | Tier-2 (5%) |
| ITA | Defense & Aerospace | 5% | Tier-2 (5%) |
| ILF | Emerging Markets | 5% | Tier-2 (5%) |
| PAVE | Utilities & Infrastructure | 5% | Tier-2 (5%) |
| SLV | Precious Metals | 5% | Tier-2 (5%) |
Trade Instructions — Monday Open
Sell the tranche from 2021-02-05 (completing its 4-week hold). Buy the new tranche. Instructions show net portfolio changes — same-asset positions cancel, weight changes show the delta.
| Action | Ticker | Instruction |
|---|---|---|
| SELL | COPX | Sell 20% of COPX position (reduce 6.25% → 5.00%) |
| SELL | XOP | Sell 50% of XOP position (reduce 5.00% → 2.50%) |
| SELL | IEMG | Sell 33% of IEMG position (reduce 3.75% → 2.50%) |
| SELL | IGV | Sell 25% of IGV position (reduce 5.00% → 3.75%) |
| SELL | SMH | Sell 25% of SMH position (reduce 5.00% → 3.75%) |
| SELL | XLU | Sell 50% of XLU position (reduce 2.50% → 1.25%) |
| BUY | MOO | Buy MOO — 14.29% of freed cash (adds 1.25% to portfolio) |
| BUY | XLE | Buy XLE — 28.57% of freed cash (adds 2.50% to portfolio) |
| BUY | PAVE | Buy PAVE — 14.29% of freed cash (adds 1.25% to portfolio) |
| BUY | ILF | Buy ILF — 14.29% of freed cash (adds 1.25% to portfolio) |
| BUY | URNM | Buy URNM — 14.29% of freed cash (adds 1.25% to portfolio) |
| BUY | SLV | Buy SLV — 14.29% of freed cash (adds 1.25% to portfolio) |
Current Portfolio After Trade
Combined holdings across all 4 active tranches. Each tranche is 25% of the portfolio.
| Ticker | % of Portfolio | Weight Bar |
|---|---|---|
| FSOL | 50.00% | |
| XLE | 7.50% | |
| MOO | 6.25% | |
| COPX | 5.00% | |
| IGV | 3.75% | |
| SMH | 3.75% | |
| ITA | 3.75% | |
| ILF | 3.75% | |
| IEMG | 2.50% | |
| XOP | 2.50% | |
| REMX | 2.50% | |
| PAVE | 2.50% | |
| URNM | 2.50% | |
| XLU | 1.25% | |
| XAR | 1.25% | |
| SLV | 1.25% |
Macro Regime — Transition / Mixed
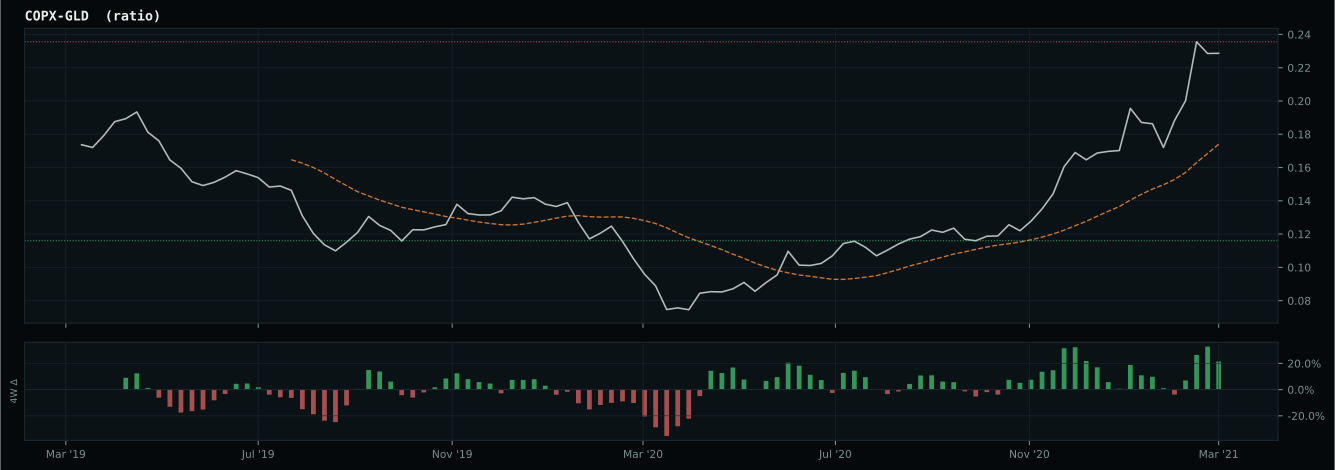
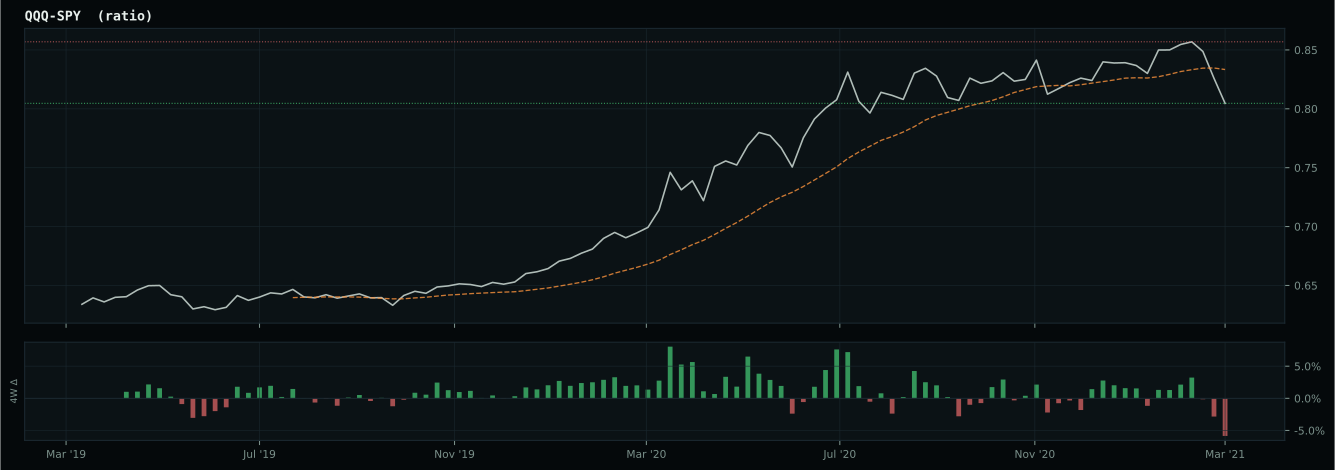
Macro Evidence Charts
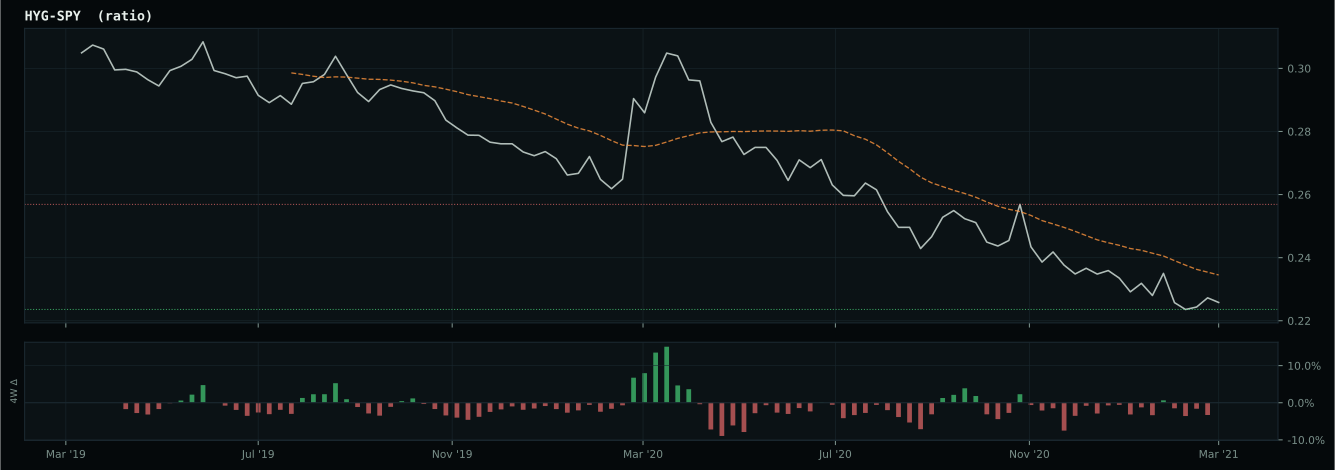
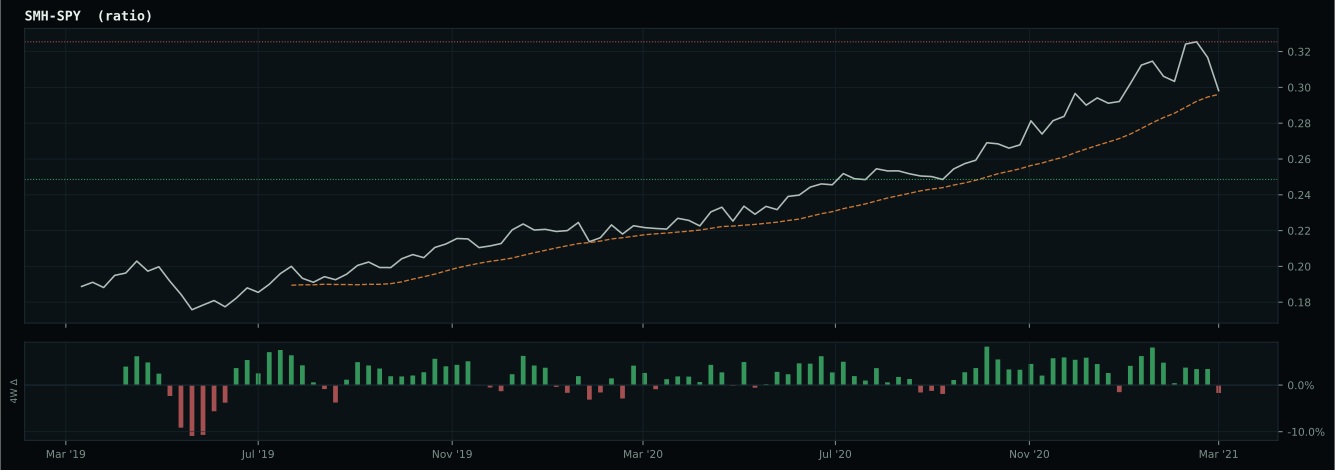
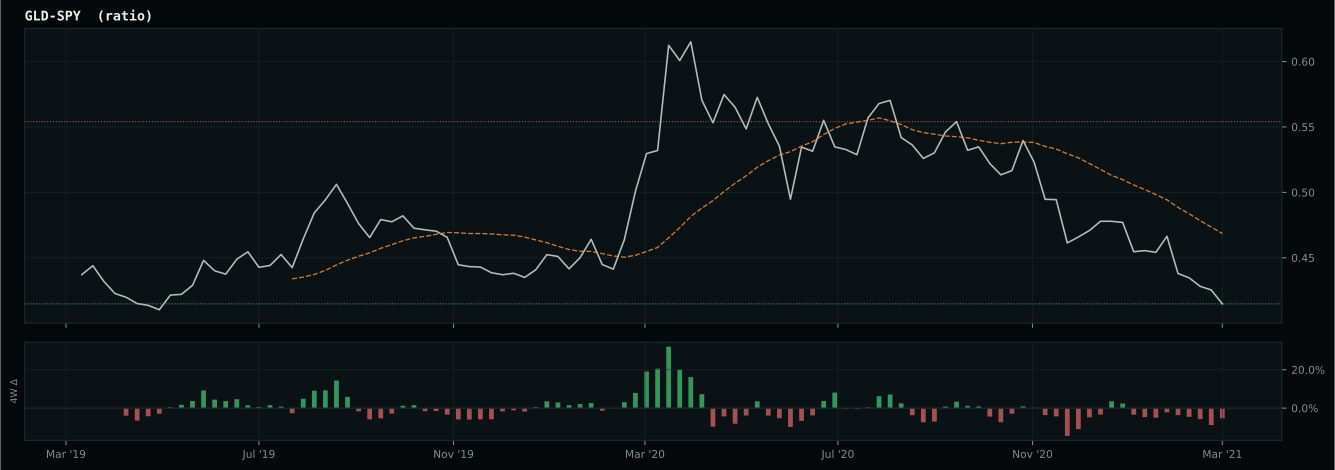
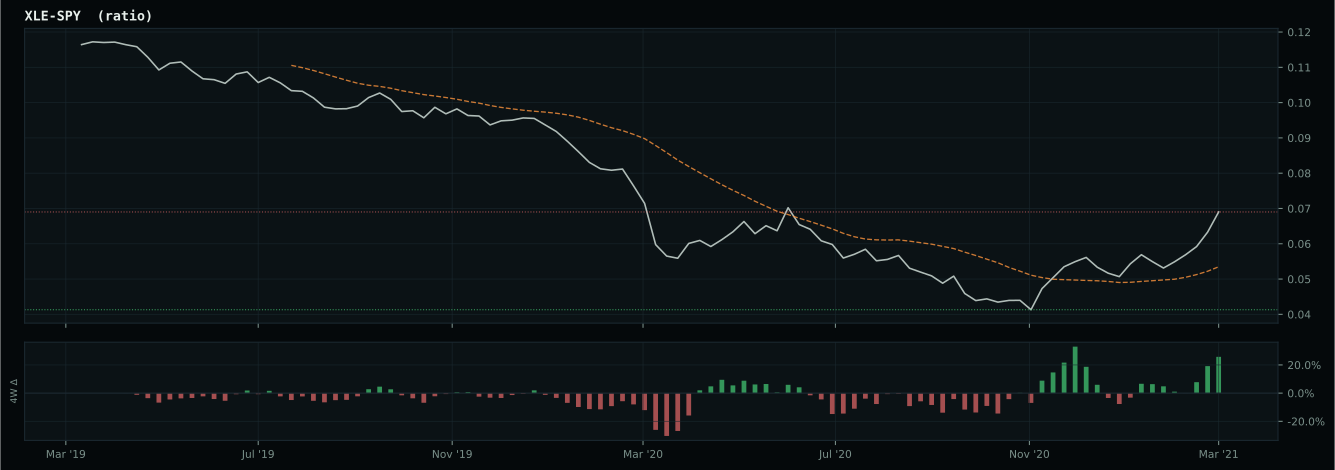
Market-implied signals behind the macro regime scores. Each ratio compares two assets; the direction and slope of the ratio is what the macro engine reads.
Crypto Regime — AltSeason
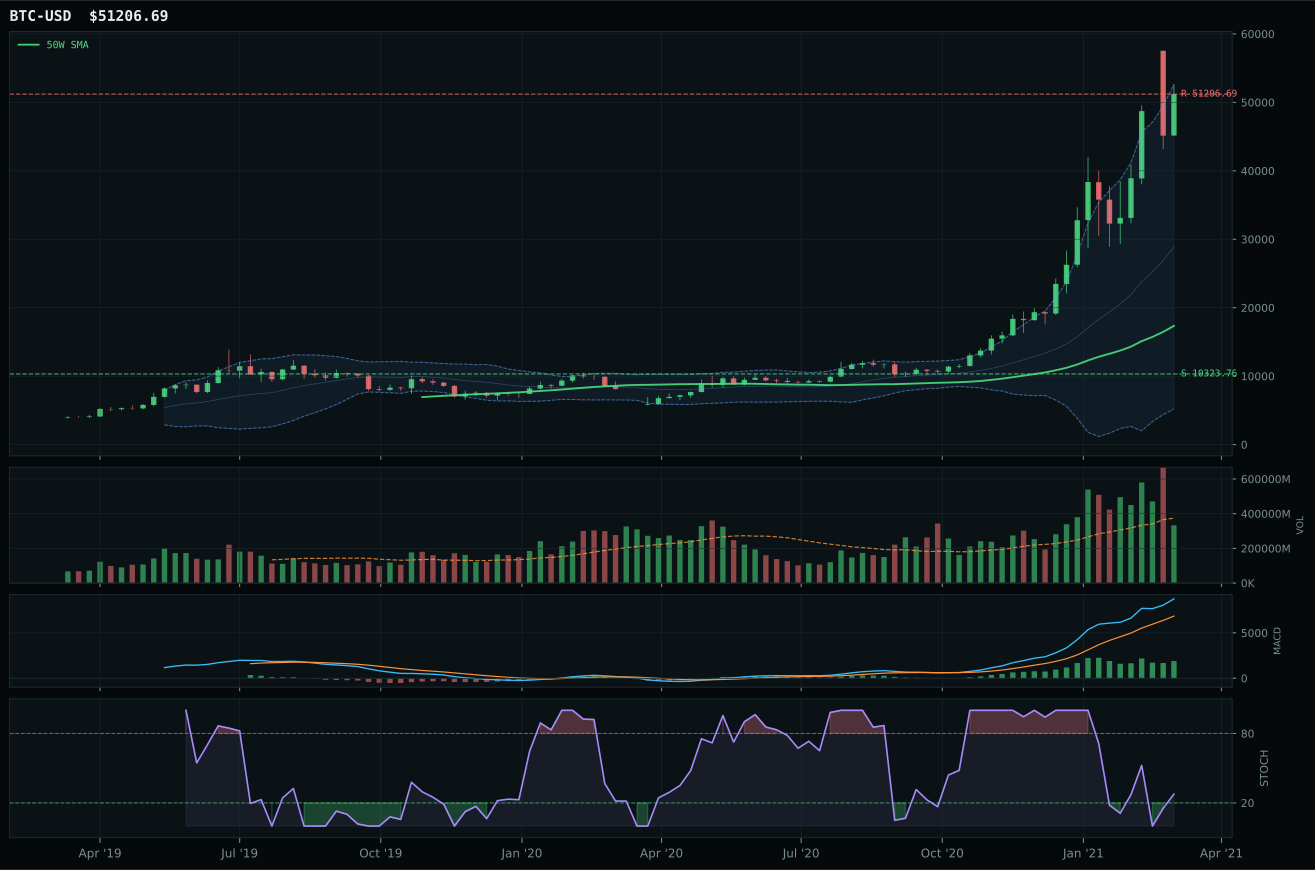
post-touch structure is too wide to count as a range; max/min close ratio is 10.67
TrendBTC confirmed: 2 consecutive closes above rising/flat 50W SMA
all available AltSeason conditions pass; missing optional confirmations skipped

Category Rankings
| Rank | Category | Winner | Score | Alloc | 4W Ret | Peers (4W) |
|---|---|---|---|---|---|---|
| 1 | Traditional Energy | XLE | 86.7 | 20% | -6.10% | FCG -5.2% · XOP -6.5% |
| 2 | Agriculture & Livestock | MOO | 72.1 | 20% | +3.48% | WEAT -5.4% · VEGI +3.5% |
| 3 | Nuclear Energy | URNM | 66.4 | 10% | +13.85% | URA +11.0% · NLR +7.9% |
| 4 | Industrial Metals | COPX | 58.5 | 10% | +1.68% | PICK +1.6% · REMX +1.9% |
| 5 | Defense & Aerospace | ITA | 47.9 | 10% | +6.36% | XAR +6.2% · ROKT +4.3% |
| 6 | Emerging Markets | ILF | 46.9 | 10% | +3.57% | INDA -1.5% · IEMG +2.7% |
| 7 | Utilities & Infrastructure | PAVE | 40.7 | 10% | +8.15% | IGF +4.3% · XLU +7.3% |
| 8 | Precious Metals | SLV | 38.8 | 10% | -1.66% | GLD +1.9% · GDX +6.5% |
| 9 | Technology | XLK | 35.6 | 0% | +5.78% | CIBR +4.7% · IGV +5.1% |
| 10 | AI | SMH | 27.4 | 0% | +12.97% | AIQ +5.4% · BOTZ +7.1% |
Traditional Energy — XLE
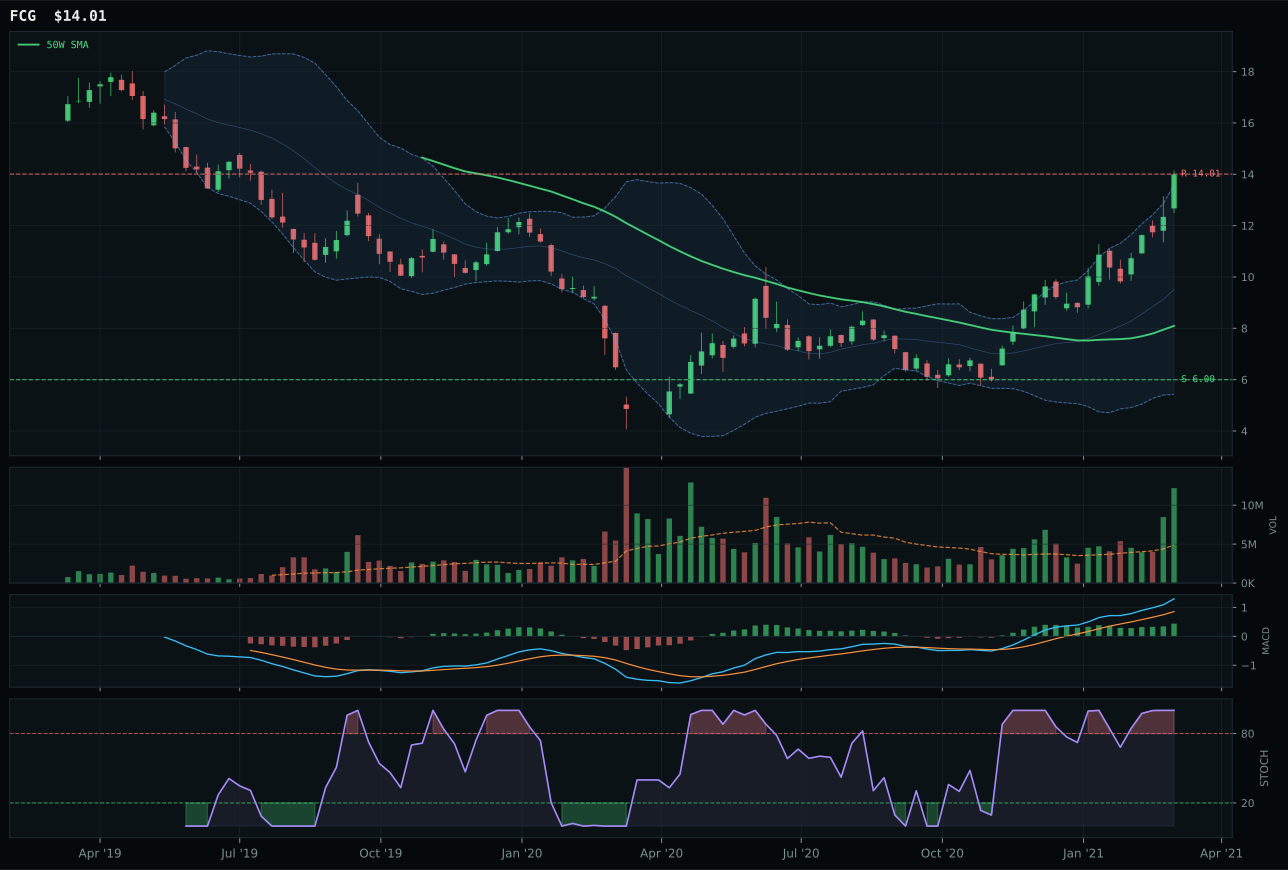
FCG has a vertical extension profile with 46.6% 13-week relative strength versus SPY.
A failed hold above support would weaken the setup.
Actionable but governed by invalidation levels.
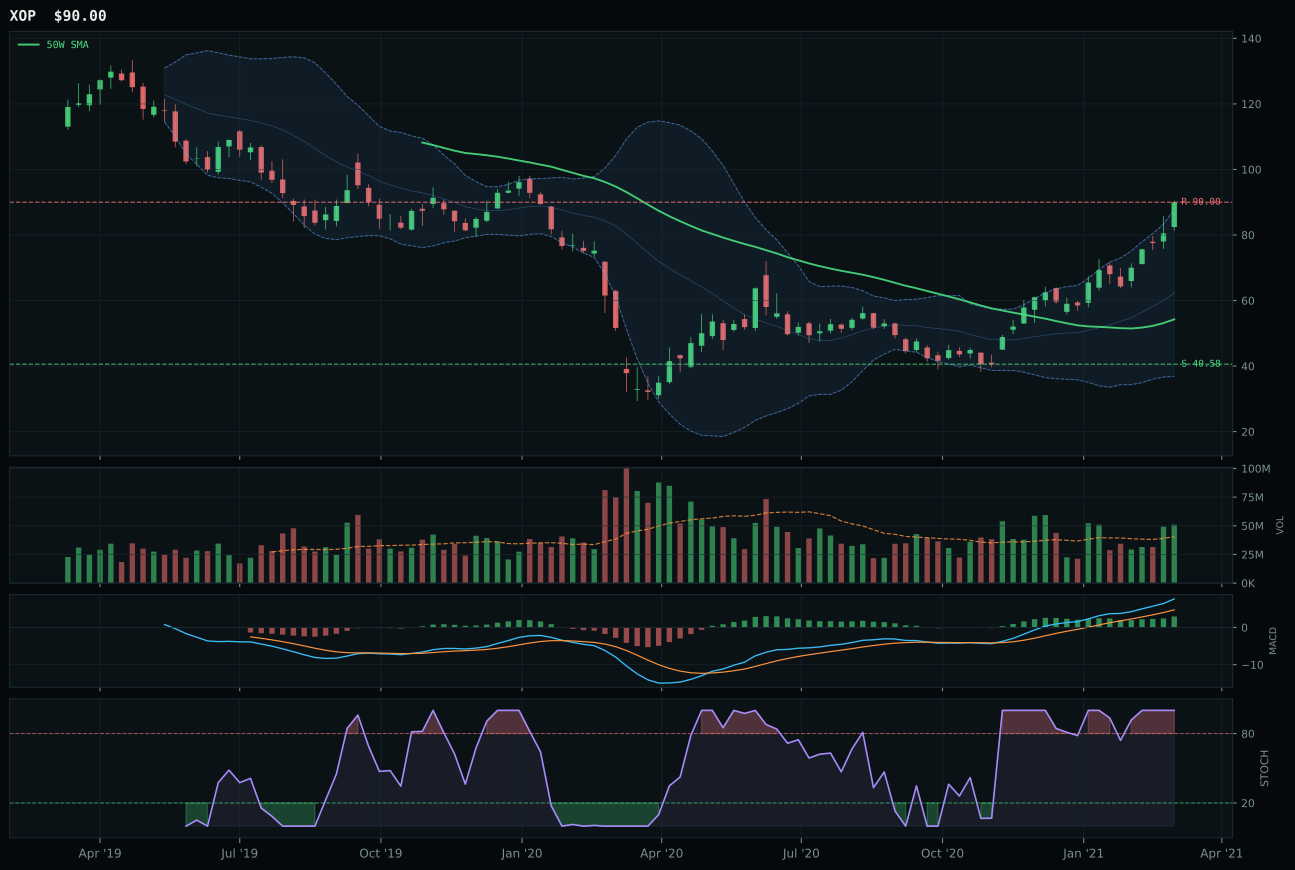
XOP has a vertical extension profile with 43.8% 13-week relative strength versus SPY.
A failed hold above support would weaken the setup.
Actionable but governed by invalidation levels.
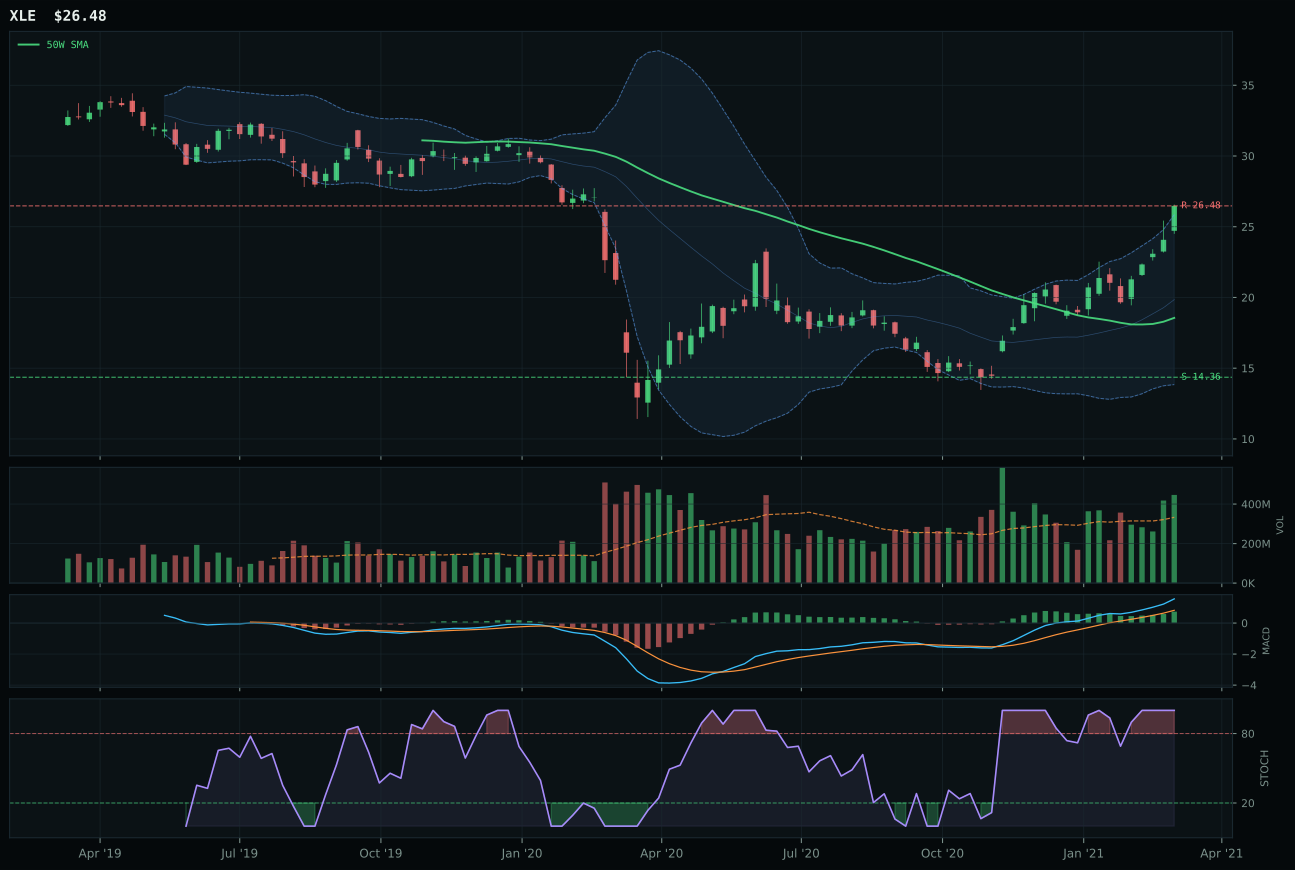
XLE has a vertical extension profile with 26.6% 13-week relative strength versus SPY.
A failed hold above support would weaken the setup.
Actionable but governed by invalidation levels.
XLE wins because it balances extended momentum (30.3% 13W return, 26.6% RS vs SPY) with the cleanest risk-reward profile in the basket: upside to resistance sits at 0.0%, downside to support at 84.4%, but XLE's volume is only 1.34x (above-average participation) versus FCG's accumulation/confirmation at higher conviction. Both own perfect trend (90.0) and perfect momentum (100.0), making this a tie-breaker on risk management. FCG is more stretched at 75.0% above the 50W versus XLE's 42.7%, and FCG's technical evidence is slightly higher (94.9 versus 69.2), but XLE's macro narrative fit (86.0) dominates FCG's neutral (50.0) because integrated oil companies own supply-chain diversification and cash-flow defensibility in a regime where energy scarcity is active (+14), inflation is rising (+10), and supply shortage is real (+7). FCG is the pure-play energy upside; XLE is the real asset with downside protection. In top-2 allocation, that defensive tilt wins.
Traditional Energy earned 10% allocation as a top-2 overweight, scoring 86.7 with an exceptional 85.0 macro fit. Energy scarcity is active (+16), inflation pressure is present (+10), supply shortage is real (+9), and real asset sponsorship is strong (+7)—a quad-bullish fundamental backdrop that explains why this category commands the same weight as agriculture. XLE's 26.6% SPY-relative strength and bullish-and-improving MACD validate that institutional capital is flowing into integrated energy for both yield and scarcity hedging. Extension at 42.7% above the 50W and overbought stochastic RSI (1.00) create timing risk, but in a Transition / Mixed regime where real assets are the rare consensus trade, being late into energy is still more profitable than being early out. The category would hold top-2 weight even if MACD began flattening, because macro fit is strong enough to absorb technical deterioration. For energy to lose allocation, we would need either crude prices to roll over (demand destruction, recession fears) or supply scarcity narratives to reverse (OPEC opens taps, shale production surges). Neither signal is present.
Agriculture & Livestock — MOO
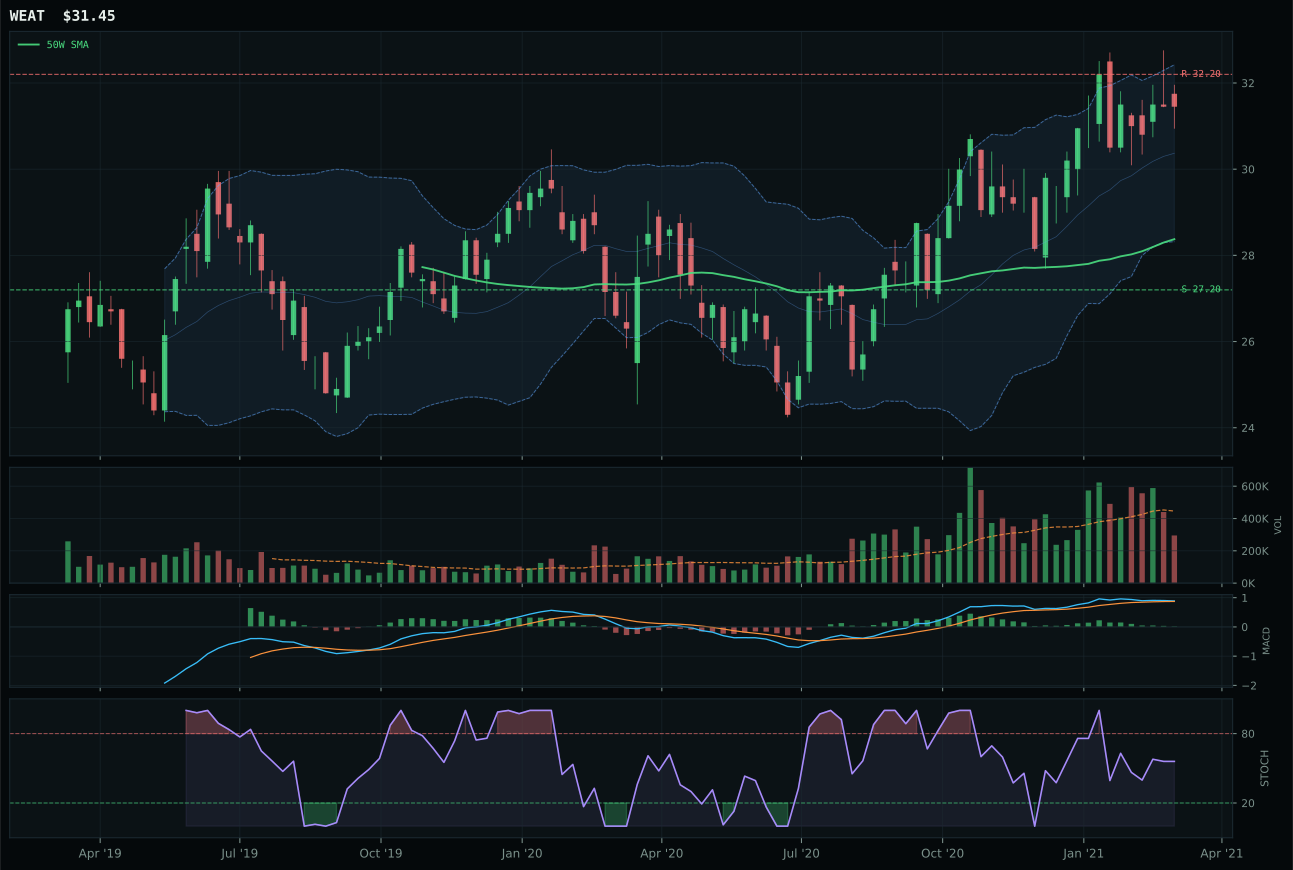
WEAT has a neutral structure profile with 8.0% 13-week relative strength versus SPY.
A failed hold above support would weaken the setup.
Actionable but governed by invalidation levels.
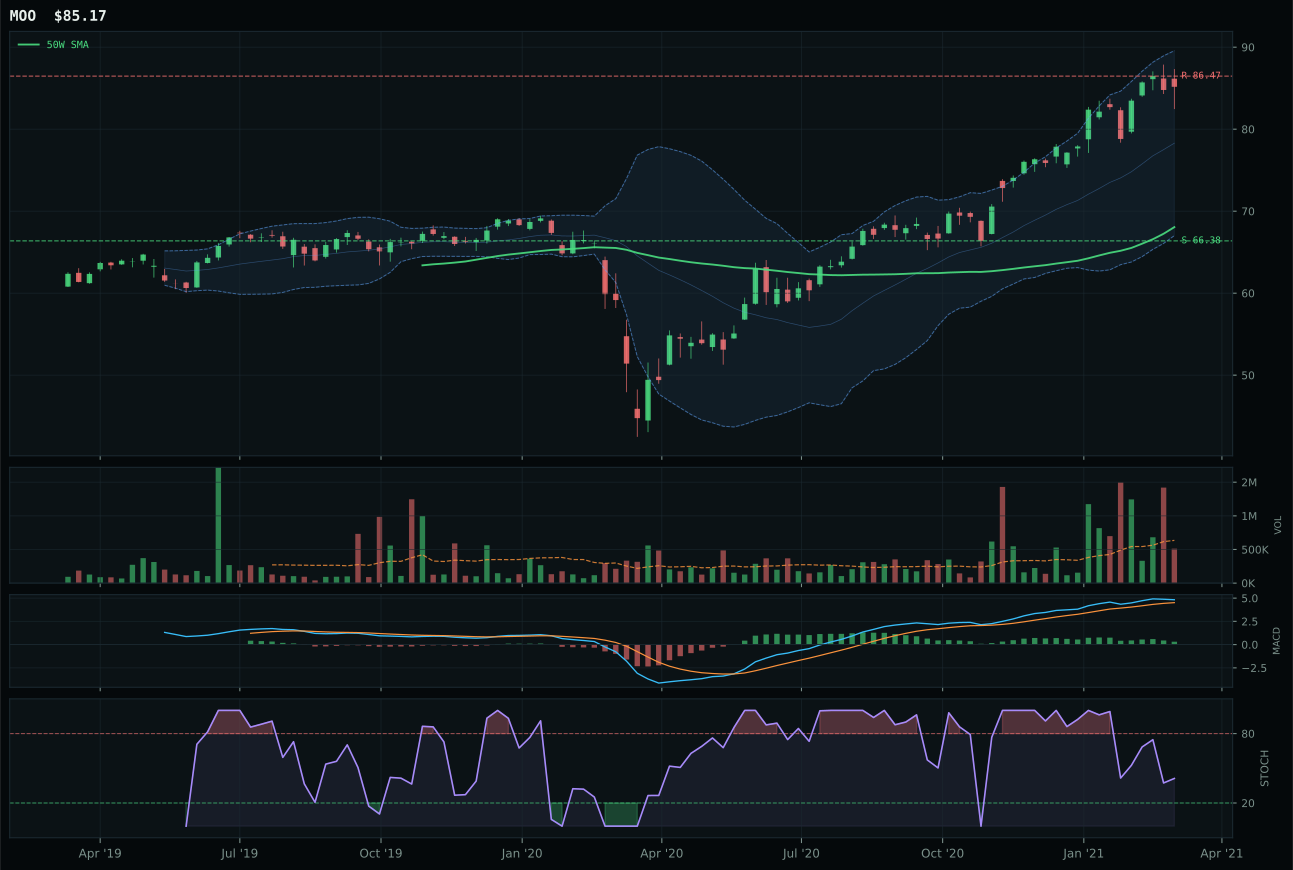
MOO has a vertical extension profile with 7.9% 13-week relative strength versus SPY.
A failed hold above support would weaken the setup.
Actionable but governed by invalidation levels.
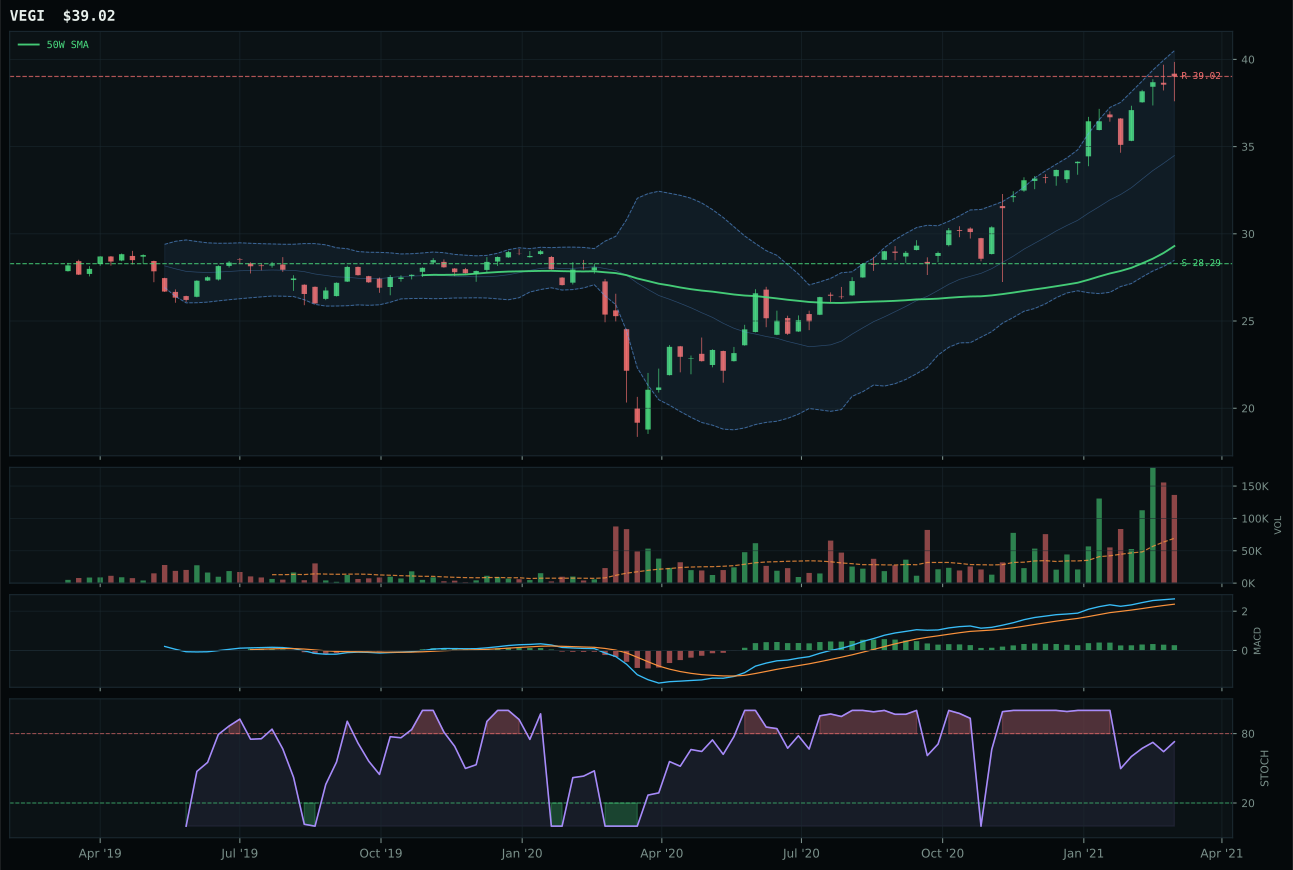
VEGI has a vertical extension profile with 13.9% 13-week relative strength versus SPY.
A failed hold above support would weaken the setup.
Tracked, but not top-2 eligible because: .
MOO wins outright because it owns perfect trend confirmation (100.0) paired with 7.9% RS versus SPY and 84.2 momentum confirmation, the highest momentum score in its basket. WEAT has superior technical evidence (76.2 versus 55.1) and better risk-reward (48 versus 38), but MOO beats it on structure cleanliness (66.7 versus WEAT's missing detail) and volume confirmation: MOO's neutral volume at 0.81x participation is clean and eliminating noise, while WEAT's thin participation (0.70x) creates ambiguity about accumulation depth. The 25.1% extension above the 50W is significant, but in an AltSeason environment where supply shortage, inflation pressure, and real asset sponsorship are all active, MOO's category-relative strength (-0.1% versus WEAT's 0.0%) combined with absolute SPY-relative dominance (7.9%) signals this is where agricultural capital is actually flowing. Volume-price confirmation hits 65.6 for MOO—solid institutional participation—while WEAT's thin volume leaves it vulnerable to stops and reversals.
Agriculture & Livestock earned 10% allocation as a top-2 overweight category, scoring 72.1 and ranking among the two highest eligible final scores. Macro fit is exceptional at 86.0, driven by supply shortage (+13), inflation pressure (+10), real asset sponsorship (+8), and commodity breadth positive (+5)—a quad-bullish fundamental backdrop that explains why this category commands top-tier weight. MOO's perfect 100.0 trend and 84.2 momentum confirmation translate the macro thesis into price action: this is not just a commodities bounce, it is institutional reallocation into agricultural real assets as inflation hedges. The setup is extended at 25.1% above the 50W, but extension is the reward for being early into the macro macro trend, not a timing failure. For this category to lose allocation, we would need supply scarcity narratives to reverse (grain inventories to normalize, fertilizer costs to collapse) or MACD to roll from bullish-but-flattening into outright deterioration. Neither has occurred.
Nuclear Energy — URNM
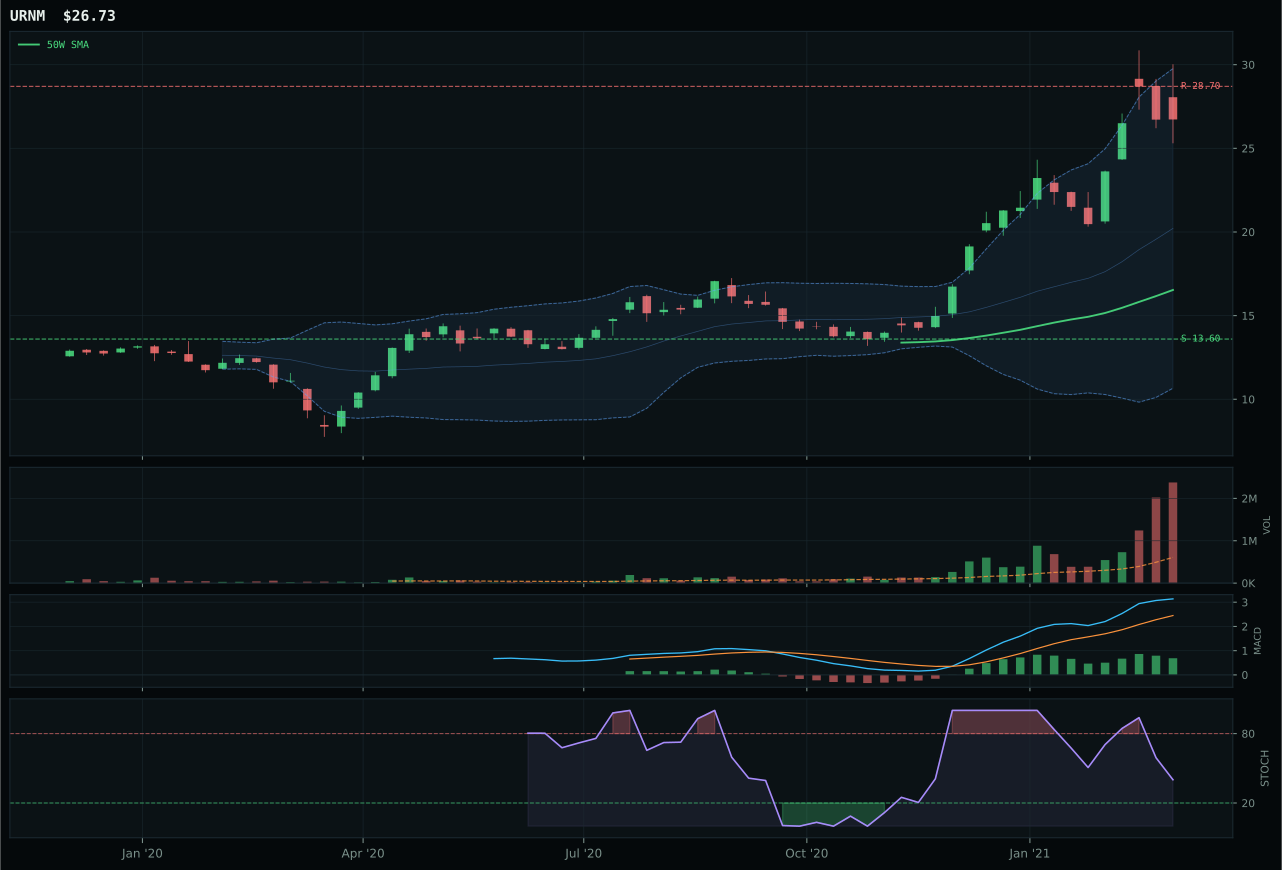
URNM has a vertical extension profile with 56.0% 13-week relative strength versus SPY.
A failed hold above support would weaken the setup.
Actionable but governed by invalidation levels.
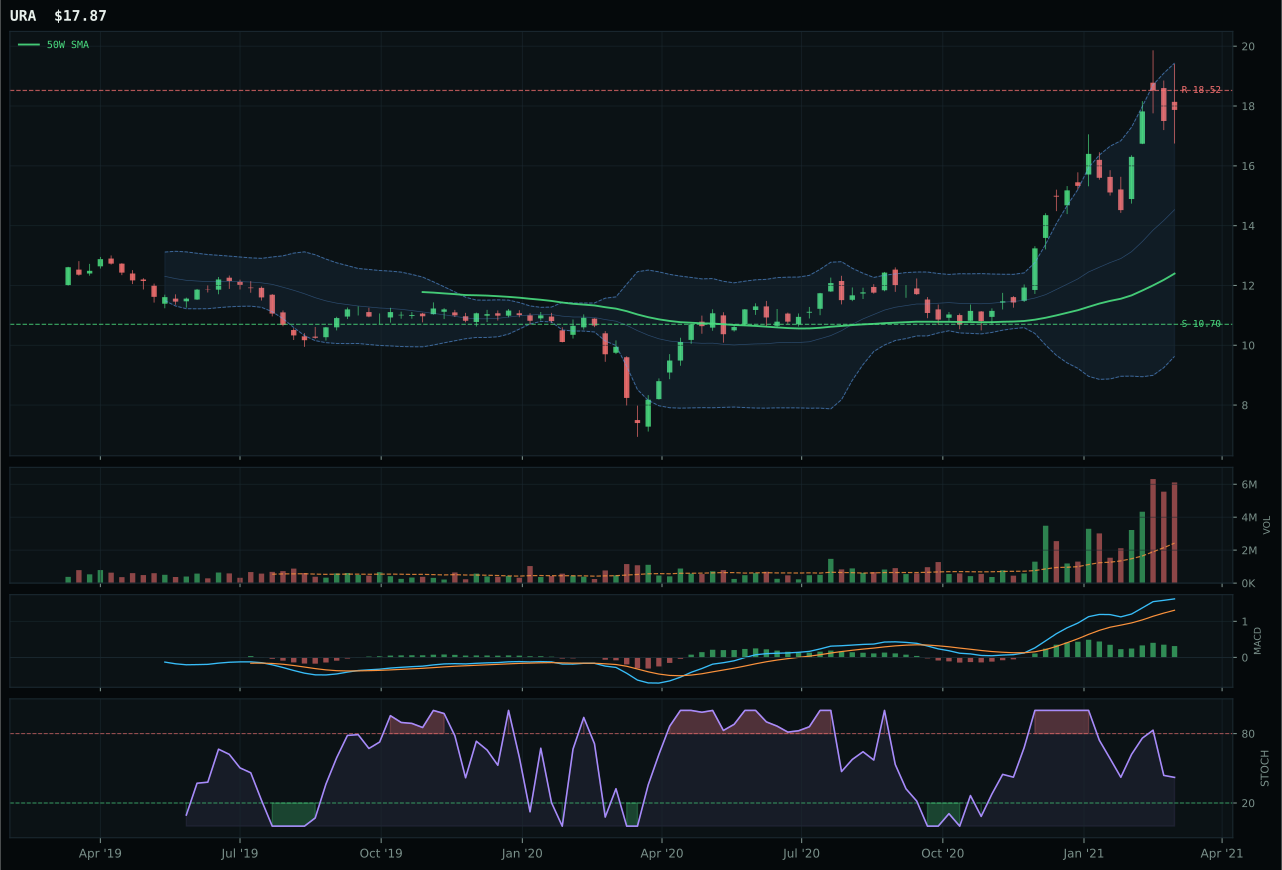
URA has a vertical extension profile with 31.2% 13-week relative strength versus SPY.
A failed hold above support would weaken the setup.
Actionable but governed by invalidation levels.
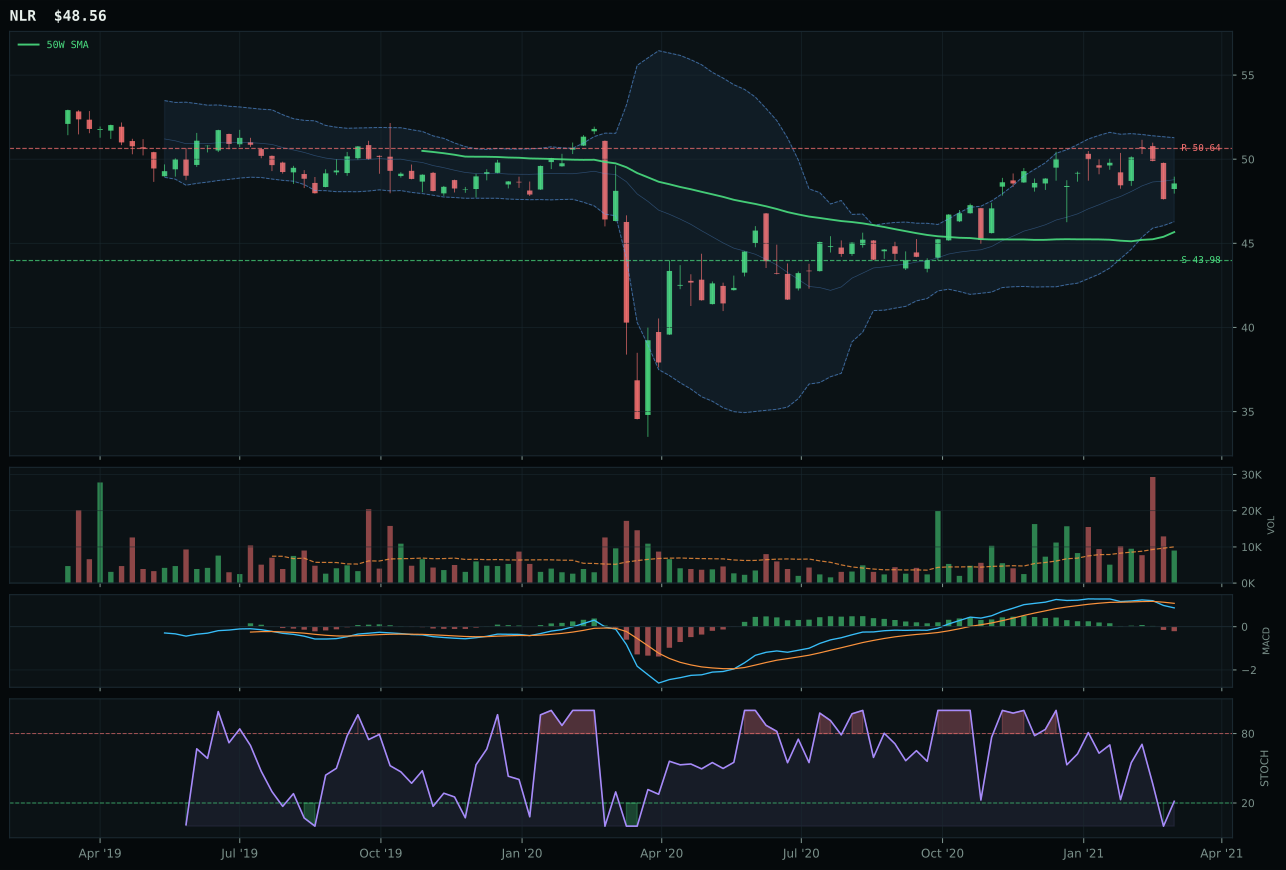
NLR has a neutral structure profile with -3.8% 13-week relative strength versus SPY.
A failed hold above support would weaken the setup.
Tracked, but not top-2 eligible because: .
URNM wins because it owns perfect volume-price confirmation (98.5 persistence, 100.0 momentum confirmation) and the highest category-relative strength at 24.7% versus URA's flat 0.0%, signaling that uranium-miner-specific thesis is flowing capital faster than broad uranium. Both own excellent trend (80.0 for URNM, 100.0 for URA), but URNM's technical evidence is maxed at 100.0—the cleanest possible setup—while URA's is slightly less pure at 92.6. The 61.6% extension above the 50W is aggressive, but URNM's 3.92x volume at accumulation/confirmation (not distribution pressure like most extended names) tells you accumulation is still active and aggressive. URA's falling/neutral stochastic at 52W high / extension signals fatigue; URNM's falling/neutral at the same location with 3.92x volume tells a different story: this is institutional accumulation into scarcity, not retail chase. The 59.7% 13W return and 56.0% RS versus SPY are the final proof that URNM owns the momentum thesis.
Nuclear Energy earned 5% allocation as a tier-2 category, scoring 66.4 with a 64.0 macro fit driven by energy scarcity (+8), real asset sponsorship (+7), and inflation pressure (+4). URNM's perfect 100.0 technical evidence and 24.7% category-relative strength pull the entire category higher, but extension at 61.6% above the 50W and a downside-heavy risk-reward (36.3% upside vs 96.5% downside to support) prevent nuclear from earning top-2 weight despite excellent macro fundamentals. The category is ranked below agriculture and energy because timing risk (extended) and reward asymmetry (limited further upside) outweigh macro tailwinds. URNM's institutional accumulation volume (3.92x) suggests conviction is real, but conviction does not eliminate the mathematical fact that upside to resistance is only -6.9% while downside support is 96.5%—the ultimate tell that this is a loaded gun, not an easy win. For nuclear to move to top-2, we would need a pullback into the 50W to reset timing and allow fresh accumulation to begin, or risk-reward to rebalance through a gap higher. Current extension prevents that promotion.
Industrial Metals — COPX
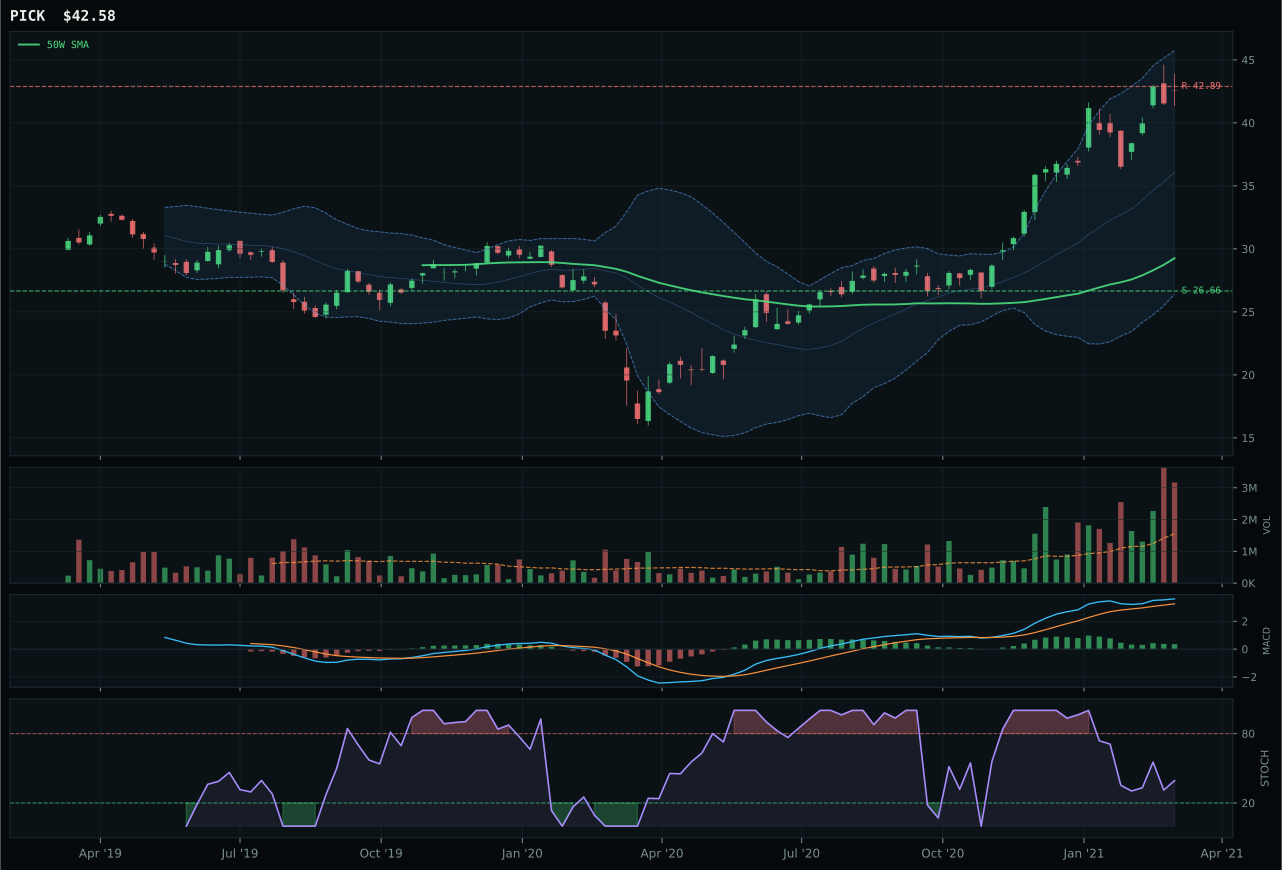
PICK has a vertical extension profile with 14.9% 13-week relative strength versus SPY.
A failed hold above support would weaken the setup.
Actionable but governed by invalidation levels.
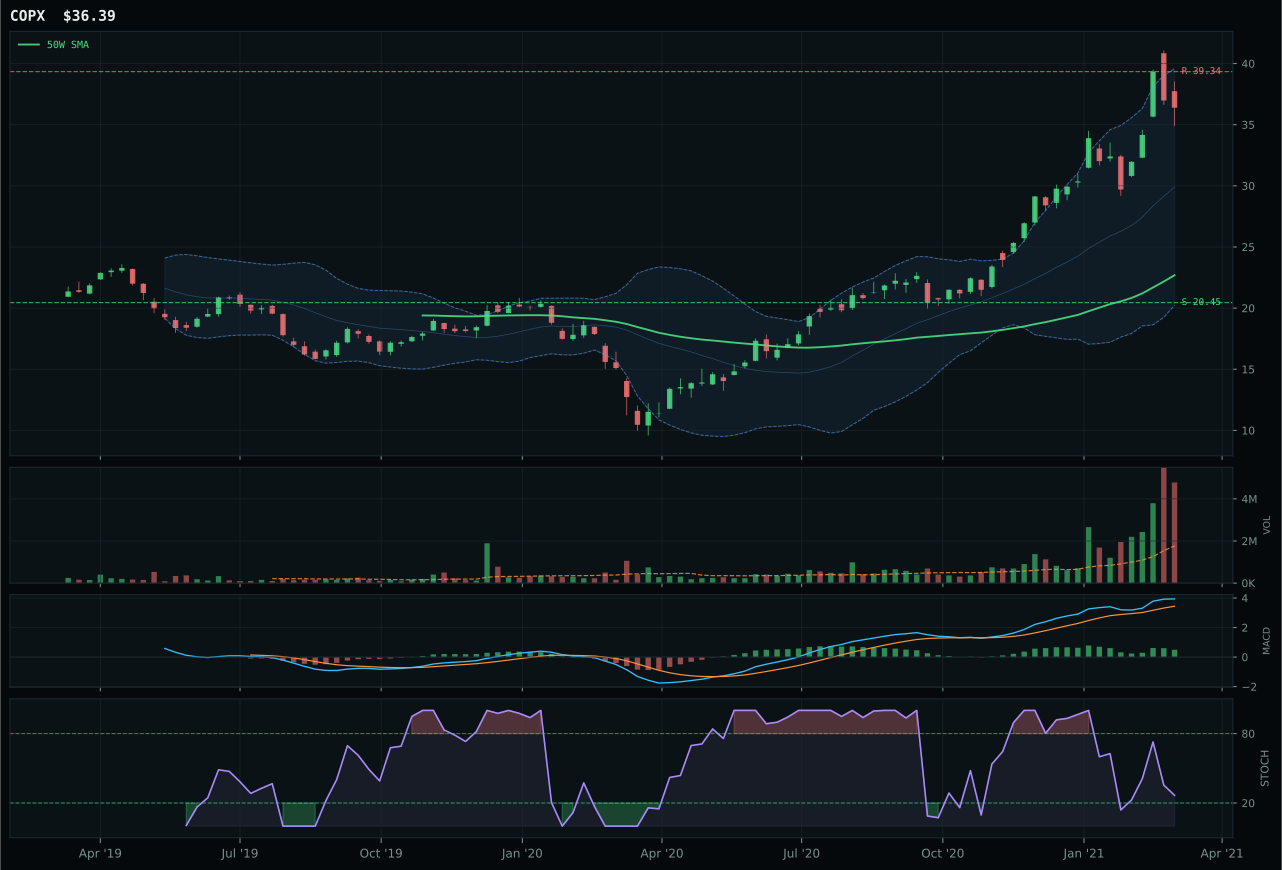
COPX has a vertical extension profile with 21.2% 13-week relative strength versus SPY.
A failed hold above support would weaken the setup.
Actionable but governed by invalidation levels.
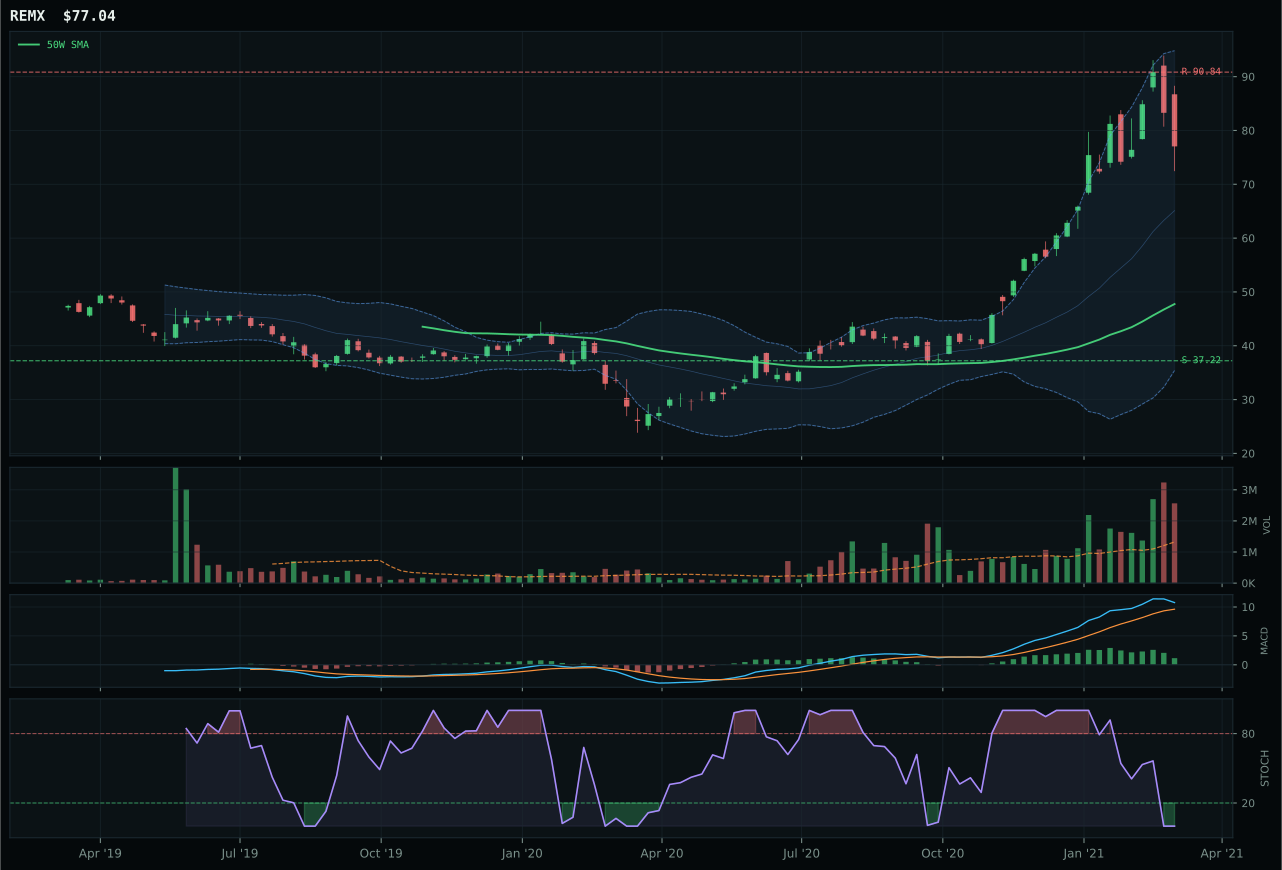
REMX has a vertical extension profile with 31.2% 13-week relative strength versus SPY.
A failed hold above support would weaken the setup.
Actionable but governed by invalidation levels.
COPX wins because it owns the highest momentum confirmation (100.0) and strongest SPY-relative strength (21.2%) despite being the most extended name in the basket at 60.4% above the 50W. PICK has superior technical evidence (88.2 versus 43.5) and cleaner volume confirmation (accumulation/confirmation versus distribution pressure), but its category-relative strength is deeply negative at -6.2%—it is leading the broad mining complex but trailing the copper-specific thesis. COPX's 24.9% 13W return and 21.2% SPY-relative outperformance tell you exactly where capital is flowing: into scarcity-driven copper exposure, not diversified mining. The 2.71x distribution pressure at 60.4% extension is high-risk, but in a regime where metals scarcity is active (+12 to macro fit) and commodity breadth is positive (+7), COPX's momentum dominance and copper thesis specificity override PICK's broader technical polish. This is a momentum win, not a setup win.
Industrial Metals earned 5% allocation as a tier-2 category, scoring 58.5 with a robust macro fit of 73.0. Metals scarcity is active (+14), commodity breadth is positive (+10), and real asset sponsorship is present (+6)—a strong fundamental tripod that explains the category's tier-2 rank. COPX's 100.0 momentum confirmation and 21.2% SPY-relative strength validate that the metals scarcity trade is moving institutional capital. However, extension at 60.4% above the 50W creates asymmetric risk: upside to resistance is -7.5%, downside support is 77.9%, a 10:1 downside skew that keeps the category from commanding top-2 weight despite strong macro fit. PICK's superior technical evidence (88.2) and accumulation/confirmation volume suggest the mining complex has structural support, but COPX's category-relative dominance ensures industrial metals keep their allocation. To earn top-2, the category would need either a pullback into the 50W to reset timing (allowing accumulation to restart fresh) or MACD to roll from improving into sustained strength across both names. Extension limits upside; macro fit prevents zero allocation.
Defense & Aerospace — ITA
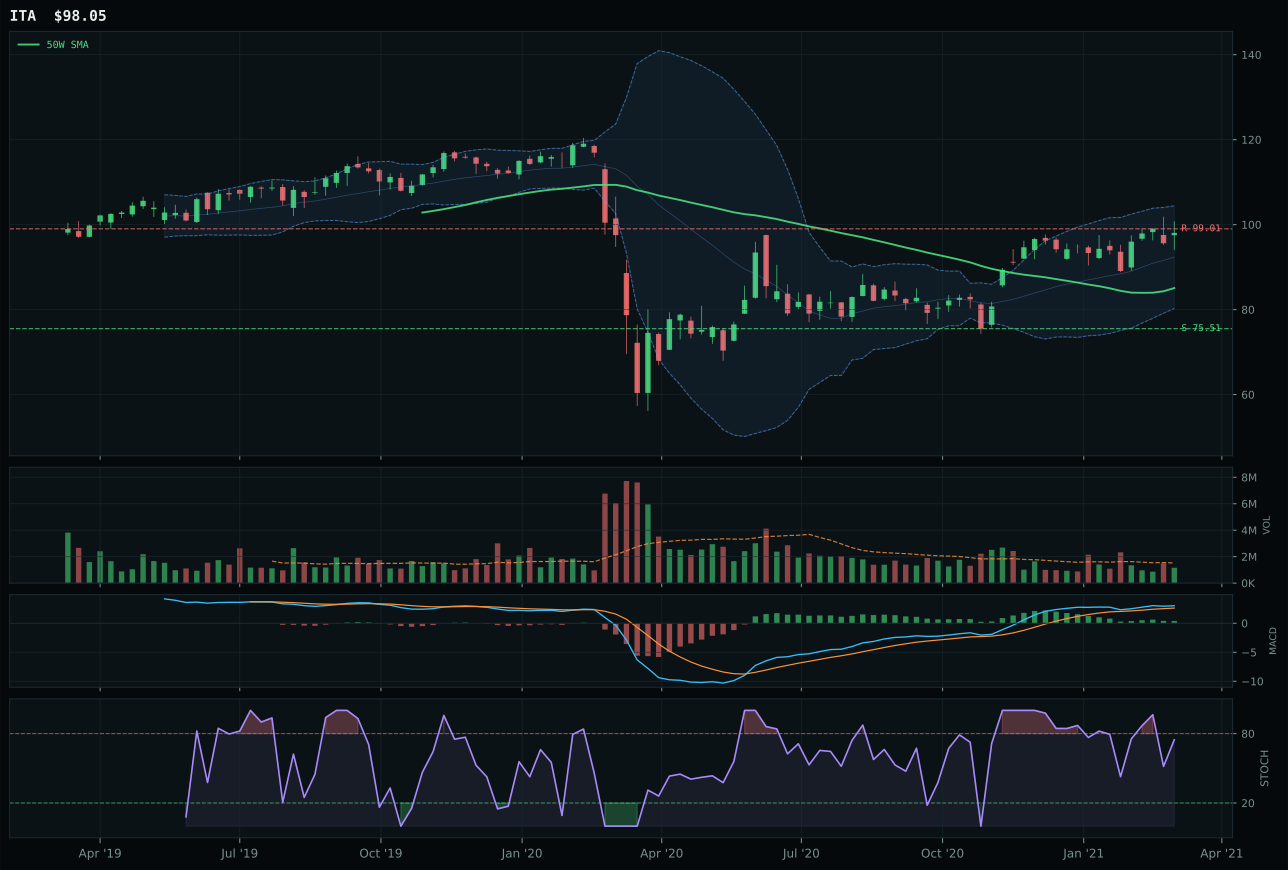
ITA has a vertical extension profile with -2.2% 13-week relative strength versus SPY.
A failed hold above support would weaken the setup.
Actionable but governed by invalidation levels.
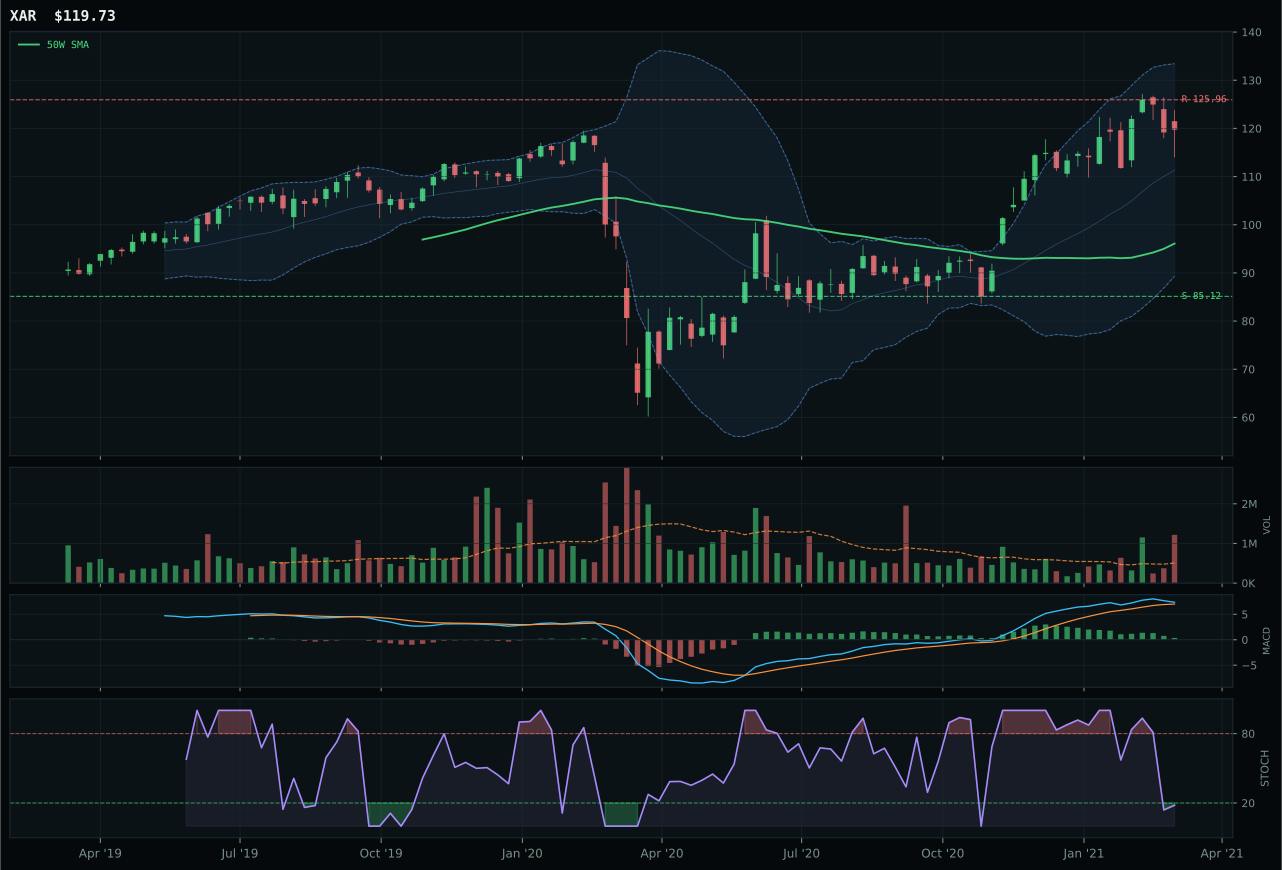
XAR has a vertical extension profile with 0.9% 13-week relative strength versus SPY.
A failed hold above support would weaken the setup.
Actionable but governed by invalidation levels.
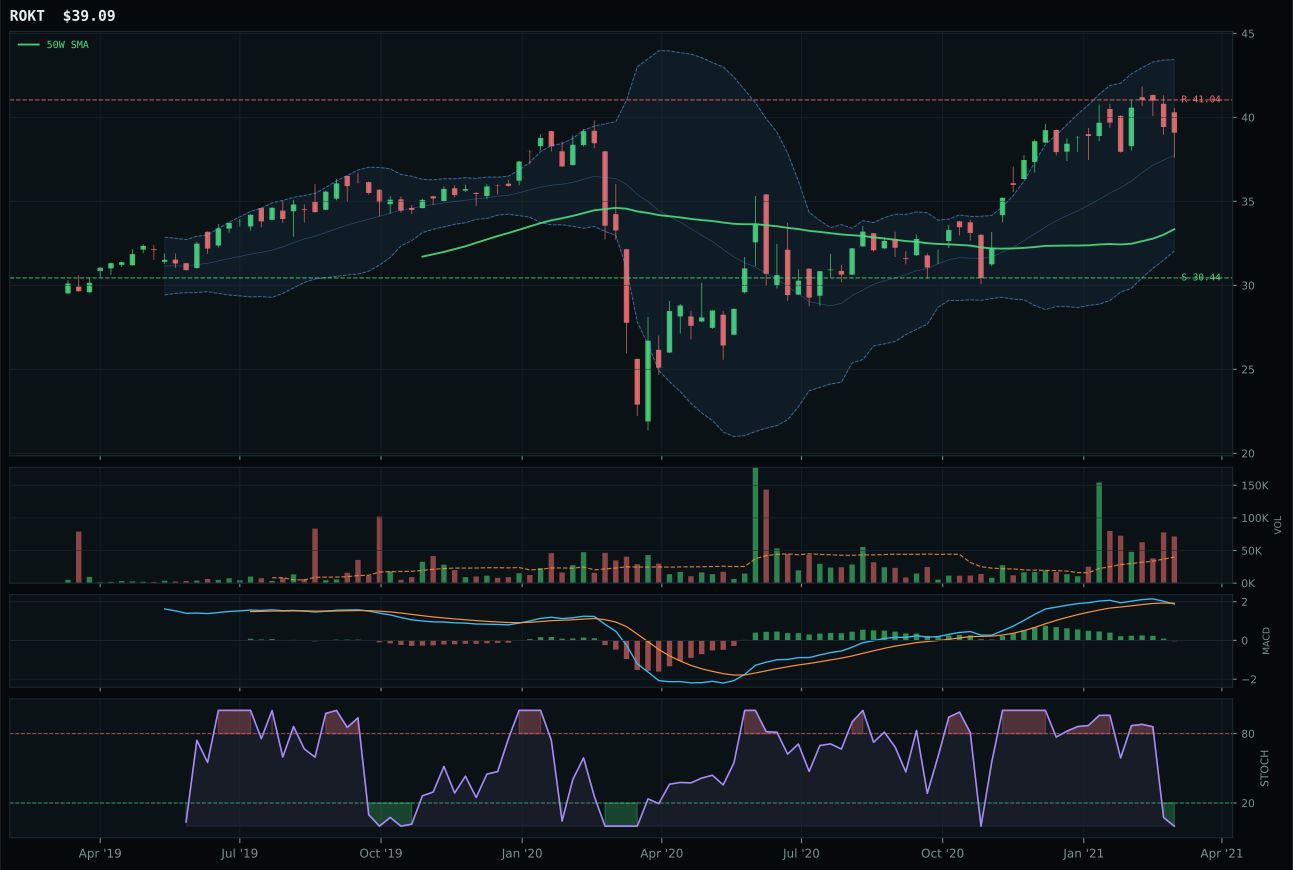
ROKT has a vertical extension profile with -2.4% 13-week relative strength versus SPY.
A failed hold above support would weaken the setup.
Tracked, but not top-2 eligible because: .
ITA wins because its MACD is bullish and improving while trend stays pinned at 96.7, creating a rare mid-extension setup where confirmation is strengthening rather than rolling over. XAR has the higher technical evidence score (75.2 versus 61.4), and better absolute momentum (72 versus 63.4), but its MACD is bullish but flattening—a subtle but meaningful deterioration that signals momentum is beginning to lose steam. ITA sits 15.3% from the 50W, a reasonable entry, while XAR at 24.6% has stretched further and faces the flattening confirmation problem. Both own strong trend parity and neutral macro fit, but ITA's improving MACD gives it the narrow edge: it's the one where technicals are still on the positive side of deterioration, making it the more durable hold for a tier-2 position.
Defense & Aerospace earned 5% allocation as a tier-2 category, ranked outside the top two but justified by a 47.9 score and consistent technicals. Macro fit sits at 55.0—supported by the Transition / Mixed regime and modest credit stress sponsorship (+2)—but technicals are what keep it alive: both ITA and XAR own trend scores of 96–97, and momentum confirmation runs 63–72, high enough to reward holding despite the extended setups. The category lacks the macro firepower of energy or agriculture (which both command 10% as top-2 overweights), but it owns enough breadth and institutional sponsorship to hold a seat. Risk sits in timing: if MACD rolls from improving to flattening across both names, or if the Transition / Mixed regime tilts more defensive, this category could drop to zero. For now, ITA's bullish-and-improving MACD justifies keeping exposure alive.
Emerging Markets — ILF
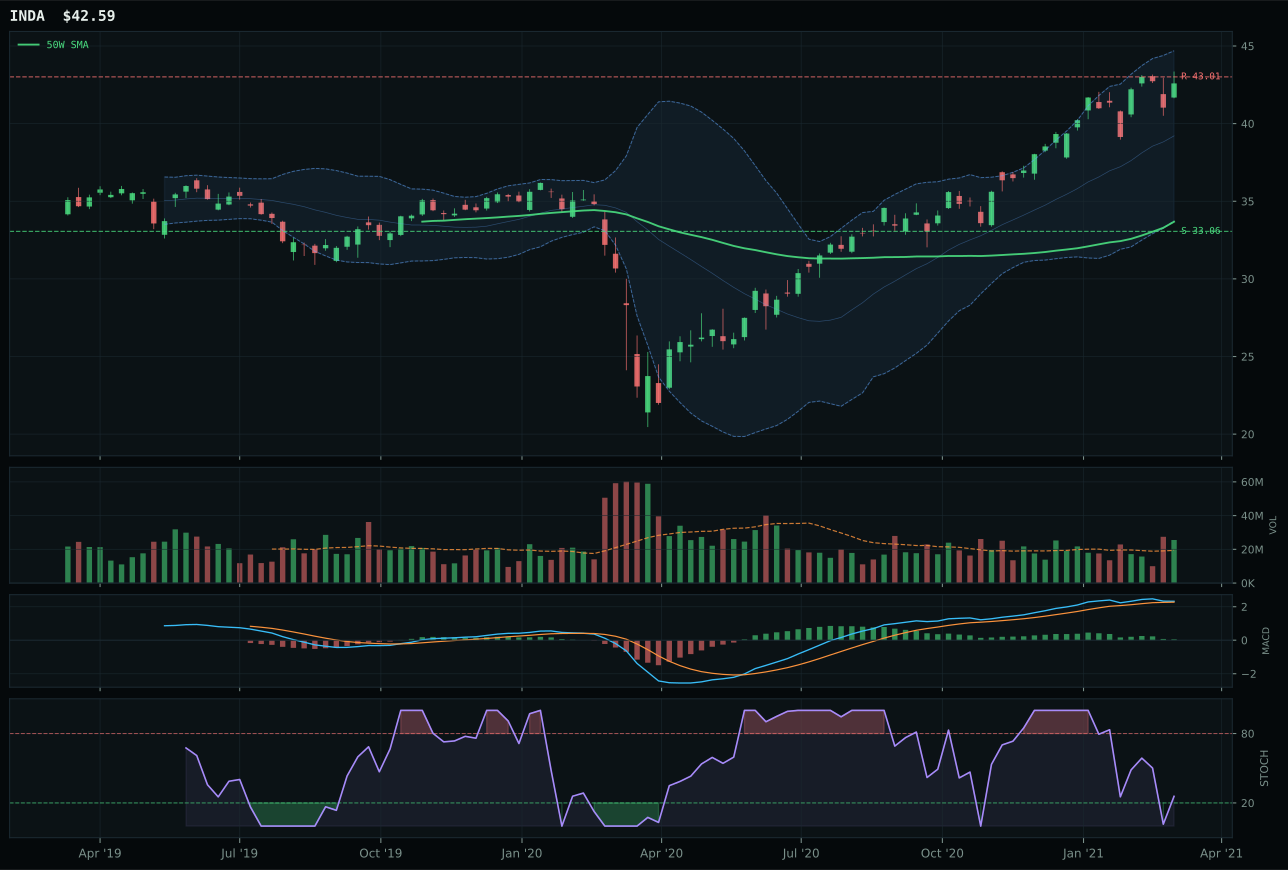
INDA has a vertical extension profile with 8.3% 13-week relative strength versus SPY.
A failed hold above support would weaken the setup.
Actionable but governed by invalidation levels.
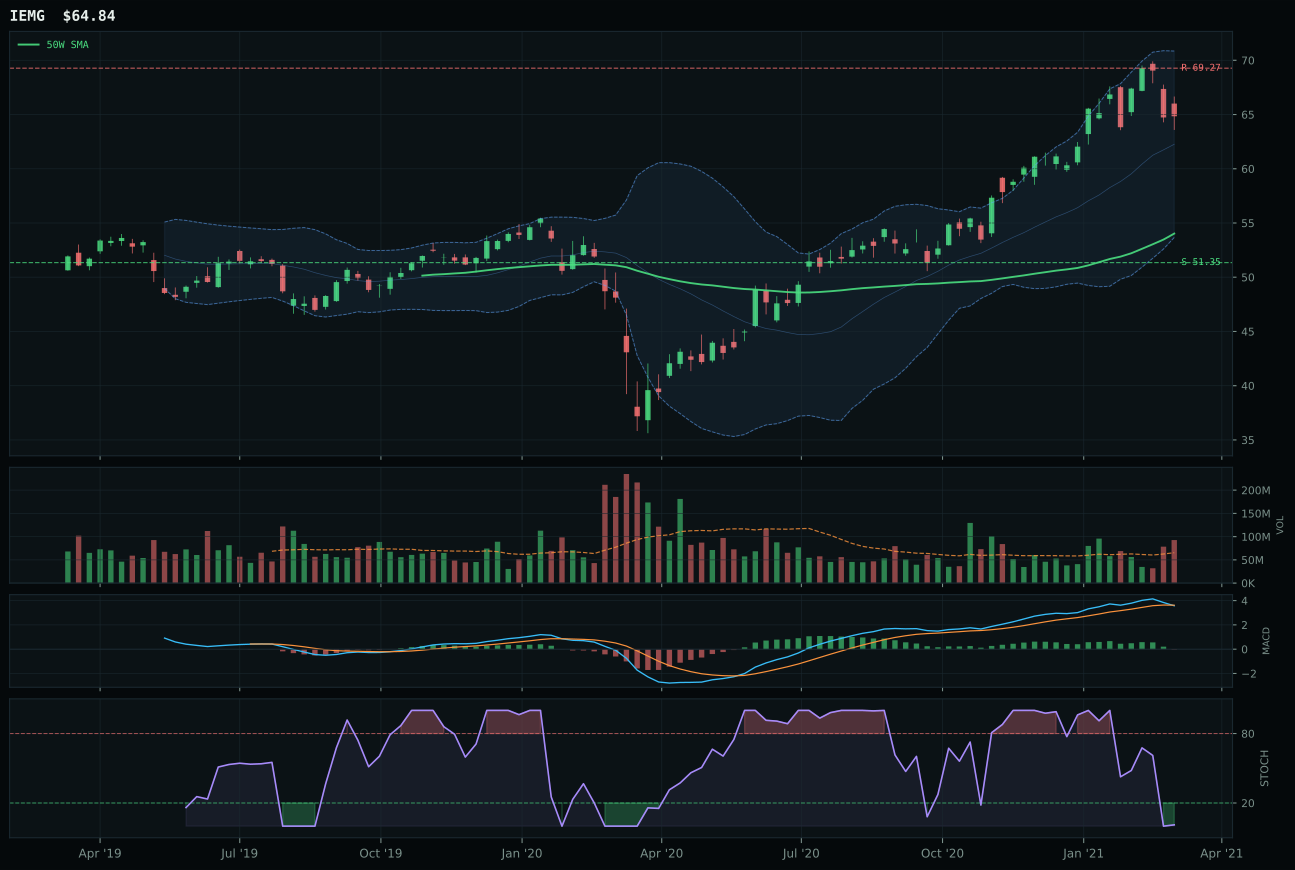
IEMG has a vertical extension profile with 2.4% 13-week relative strength versus SPY.
A failed hold above support would weaken the setup.
Actionable but governed by invalidation levels.
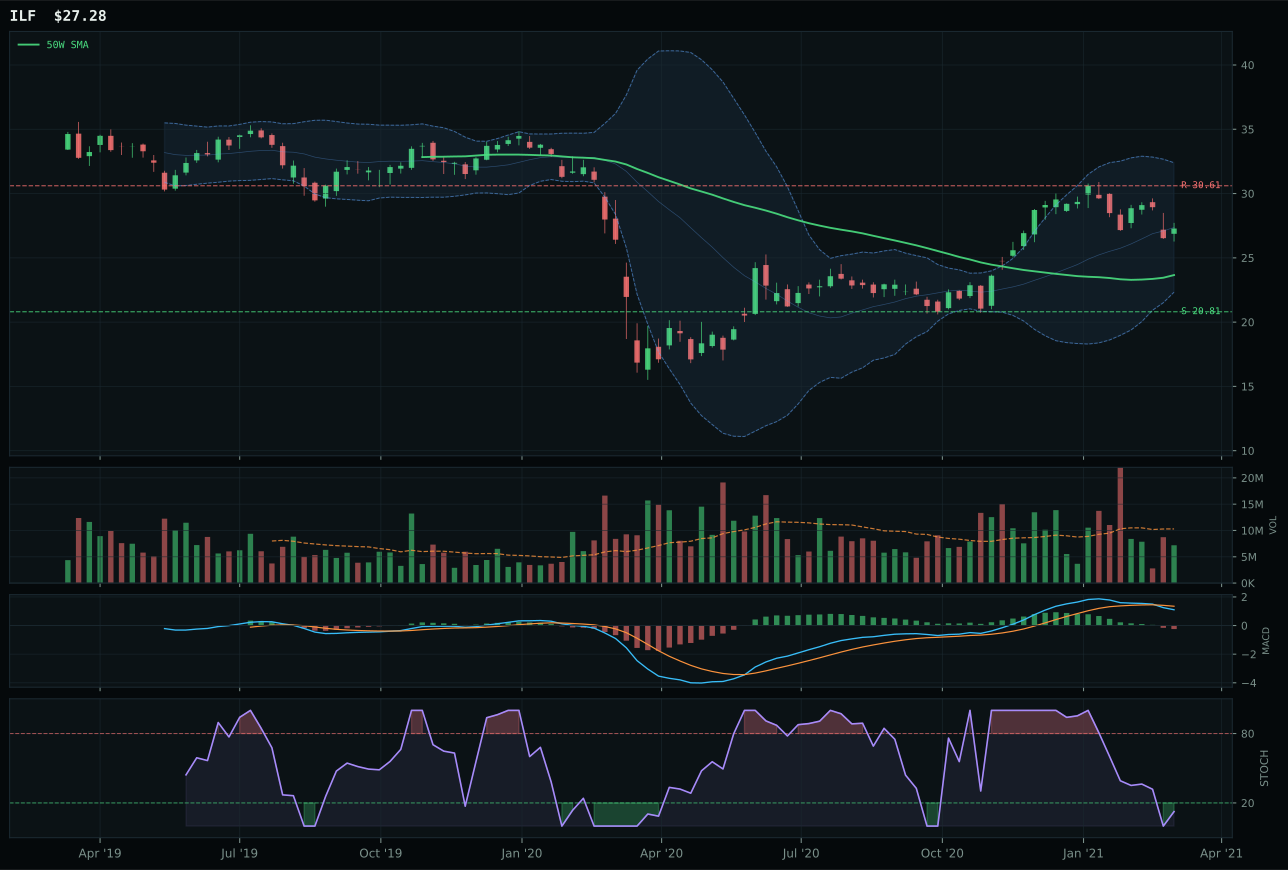
ILF has a vertical extension profile with -8.7% 13-week relative strength versus SPY.
A failed hold above support would weaken the setup.
Actionable but governed by invalidation levels.
ILF wins by default in a thoroughly broken category where no name owns positive momentum confirmation. ILF scores 0.0 on momentum (4W and 13W returns both negative, category-relative strength -11.1%), but INDA's momentum confirmation is higher (96 versus 0), making INDA the runner-up despite ILF's victory. ILF wins because its macro/narrative fit is 66.0 (driven by commodity breadth +8, metals scarcity +5, real asset sponsorship +6, inflation pressure +5) versus INDA's 50.0, and in a category where nobody is winning on technicals, macro narrative becomes the tiebreaker. ILF's 38.9 trend (price above 50W, below 200W, -8.7% RS vs SPY) is the worst in the category, but its structure is cleaner than INDA's and its risk-reward (51.3 vs 37.6) suggests downside is limited even if momentum stays broken. This is a category where winners are relative to catastrophe, not absolute strength.
Emerging Markets earned 5% allocation as a tier-2 category, scoring 46.9 with a 62.0 macro fit that looks strong on paper but fails in execution. The macro reasoning layer is positive: EM liquidity support is active (+14), liquidity expansion is expanding (+8), even as credit stress pulls (-10), creating a net positive 62.0 score. But the category representative is ILF, which owns 0.0 momentum confirmation and -5.0% 13W return—a chart that is actively falling while macro tailwinds blow. INDA's 62.5 reasoning score ranks it first in the category proof order, but INDA is more extended (26.4% vs 15.3%) and faces flattening MACD confirmation, making ILF the defensive default. The category holds tier-2 because macro fit prevents zero, but it is the weakest tier-2 by a wide margin: ILF's 3.7 technical evidence and 0.0 momentum confirmation are the worst scores in the portfolio. For EM to earn allocation respect, we need INDA's MACD to roll from bullish-but-flattening into bullish-and-improving, and ILF's momentum to reset from negative into neutral or positive. That transition has not begun. This is a macro-only hold, not a technical one.
Utilities & Infrastructure — PAVE
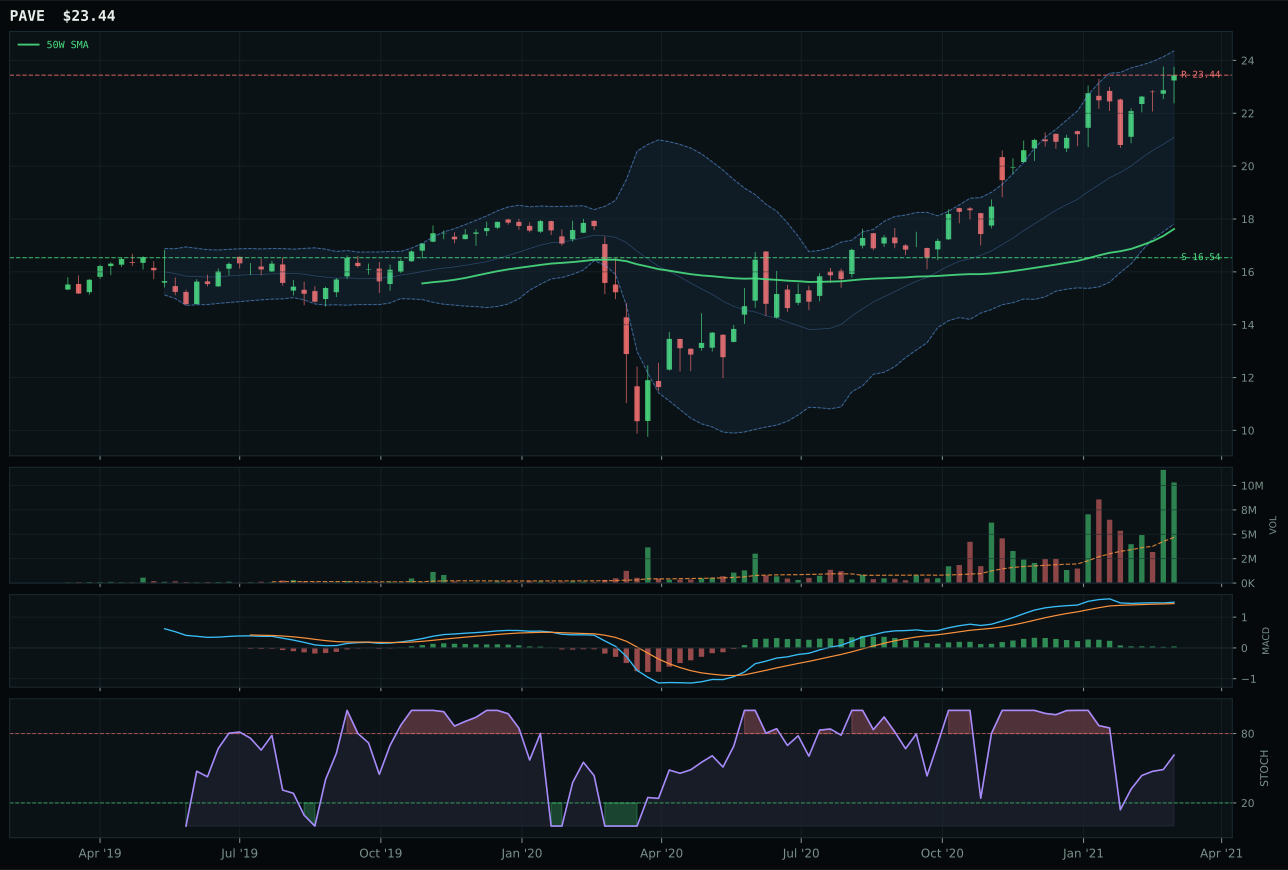
PAVE has a vertical extension profile with 7.9% 13-week relative strength versus SPY.
A failed hold above support would weaken the setup.
Actionable but governed by invalidation levels.
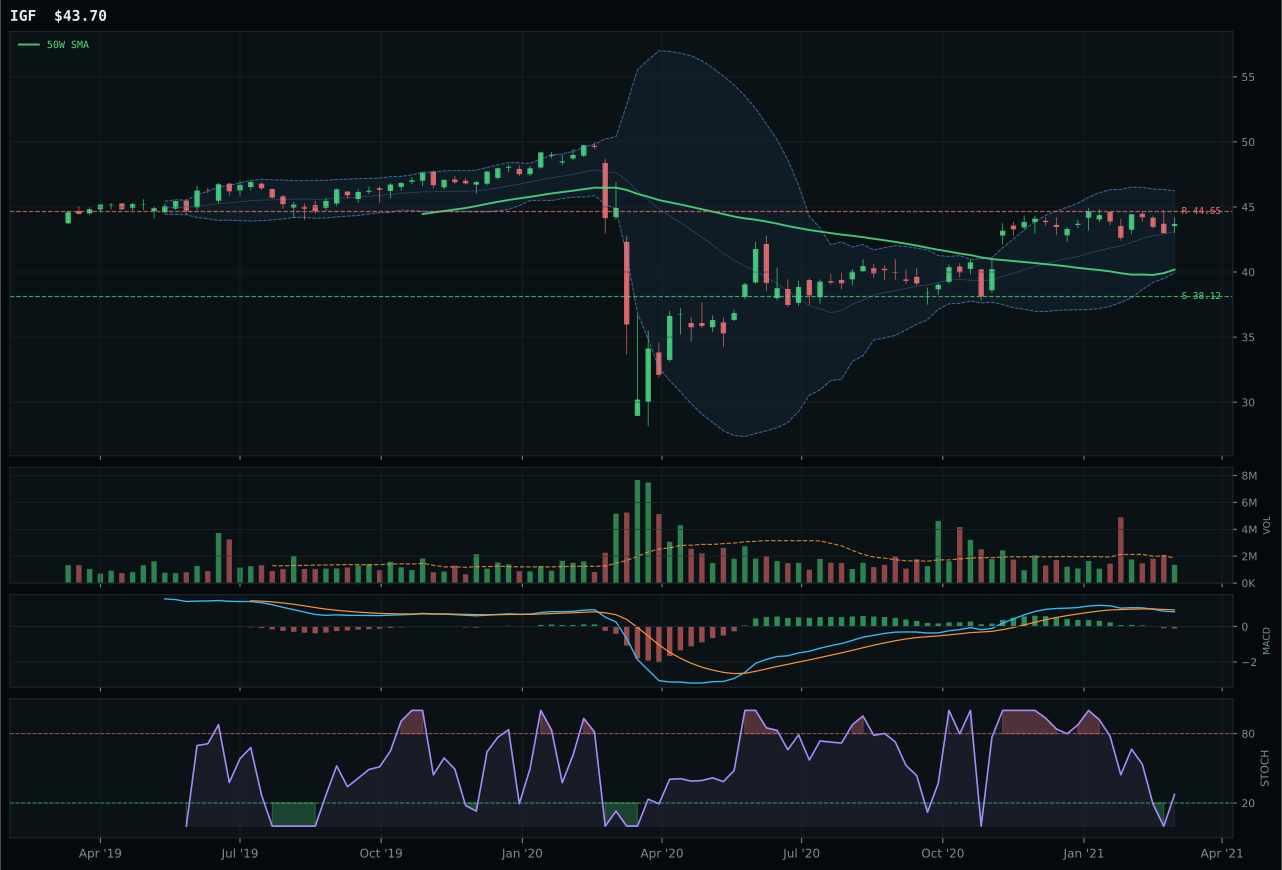
IGF has a neutral structure profile with -4.6% 13-week relative strength versus SPY.
A failed hold above support would weaken the setup.
Actionable but governed by invalidation levels.
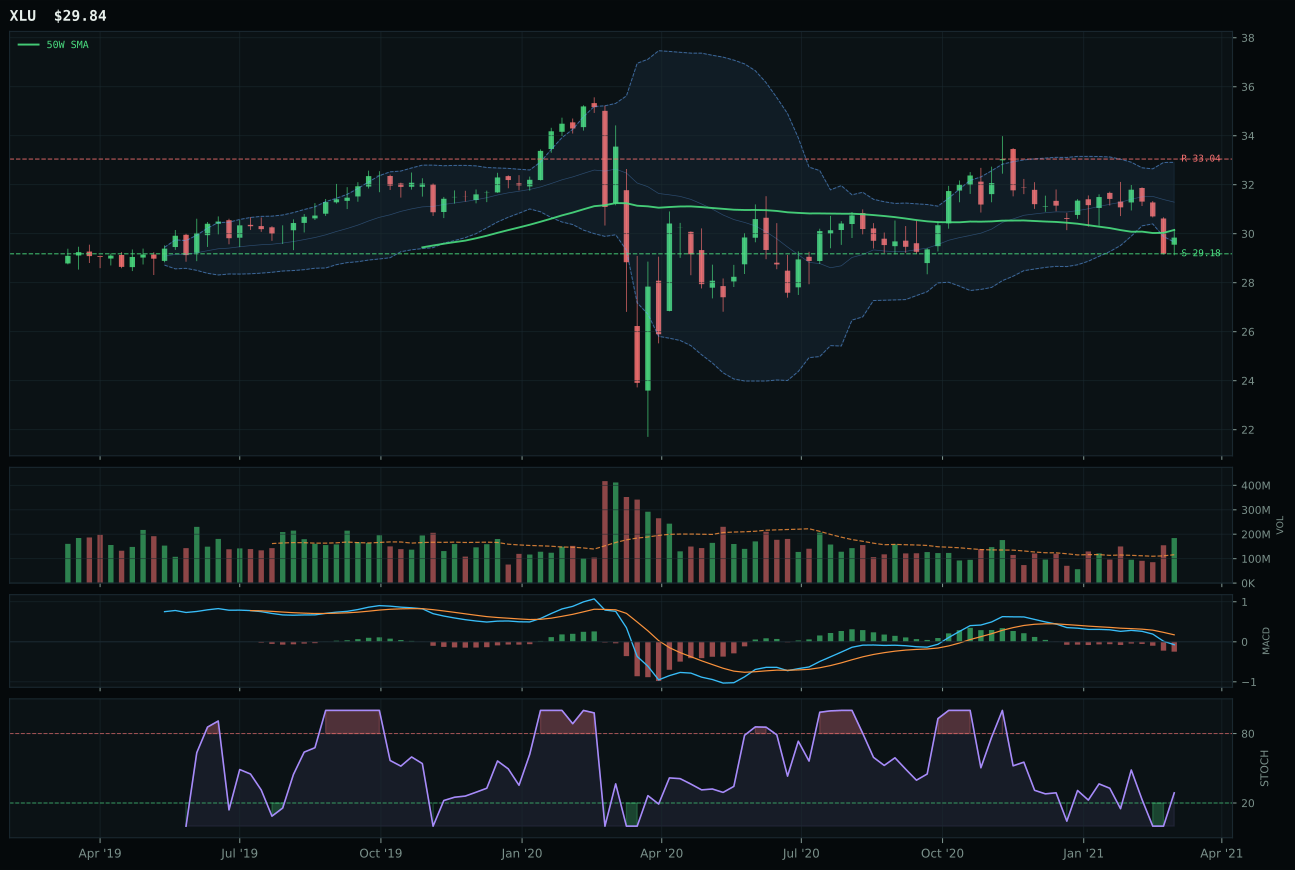
XLU has a pullback into support profile with -8.1% 13-week relative strength versus SPY.
A failed hold above support would weaken the setup.
Actionable but governed by invalidation levels.
PAVE wins with a perfect 100.0 trend and 100.0 momentum confirmation—the cleanest momentum setup in the entire portfolio after COPX and energy. IGF and XLU both struggle: IGF owns bearish/weakening MACD, falling/neutral stochastic RSI, and thin participation (37 volume score); XLU is a pullback into support with minimal momentum (10 score). PAVE's 11.7% 13W return and 12.6% category-relative strength are not massive, but in a category where macro fit is neutral (48.0), technicals are the entire case, and PAVE owns the only clean bullish-and-improving setup. Structure is excellent (82.5 on cleanliness), volume is accumulation/confirmation at 2.20x, and the 33.0% extension above the 50W is less aggressive than other category winners because risk-reward still provides reasonable downside support (41.7%). This is a momentum-driven victory in a category where momentum is scarce.
Utilities & Infrastructure earned 5% allocation as a tier-2 category, scoring 40.7 with a 48.0 macro fit that offers no tailwind. The category is supported only by technical merit—PAVE's 90.3 technical evidence and 100.0 momentum confirmation—and by the Transition / Mixed macro regime (+4), which moderately favors infrastructure themes. Inflation pressure is actually a headwind (-6) because utilities and infrastructure are typically viewed as rate-sensitive, not inflation hedges, in traditional thinking. The category holds tier-2 status because PAVE's clean technicals prevent it from dropping to zero, but it lacks the macro sponsorship of commodities and real assets that dominate top-2 allocation. For Utilities & Infrastructure to earn a higher rank, macro fit would need to shift: either Transition / Mixed would need to be reframed as stimulative (supporting capex and bond-financed buildout), or inflation expectations would need to prove more benign than currently feared. Current regime treats infrastructure as a defensive alternative, not a growth engine. That positioning keeps it at tier-2, not top-2.
Precious Metals — SLV
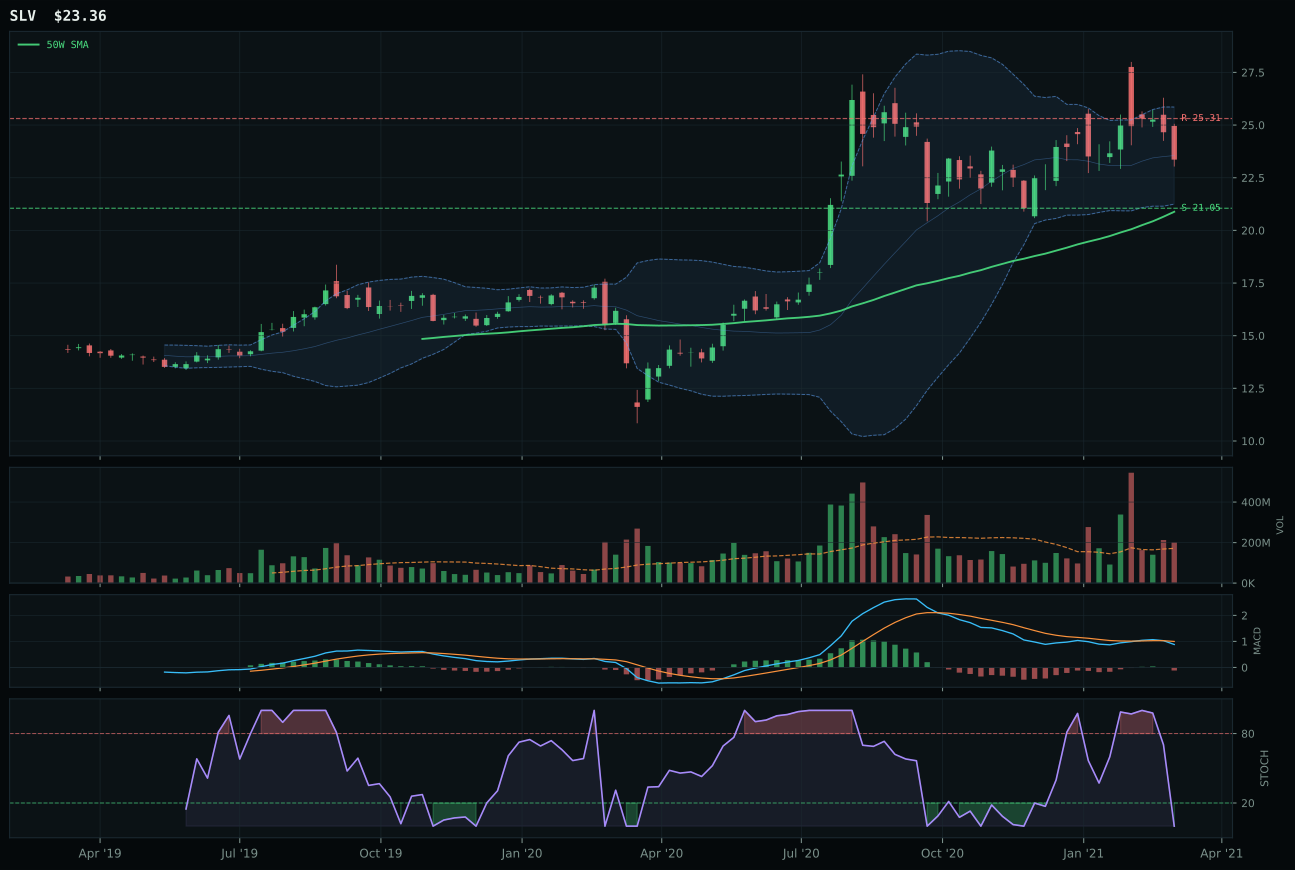
SLV has a neutral structure profile with 0.2% 13-week relative strength versus SPY.
A failed hold above support would weaken the setup.
Actionable but governed by invalidation levels.
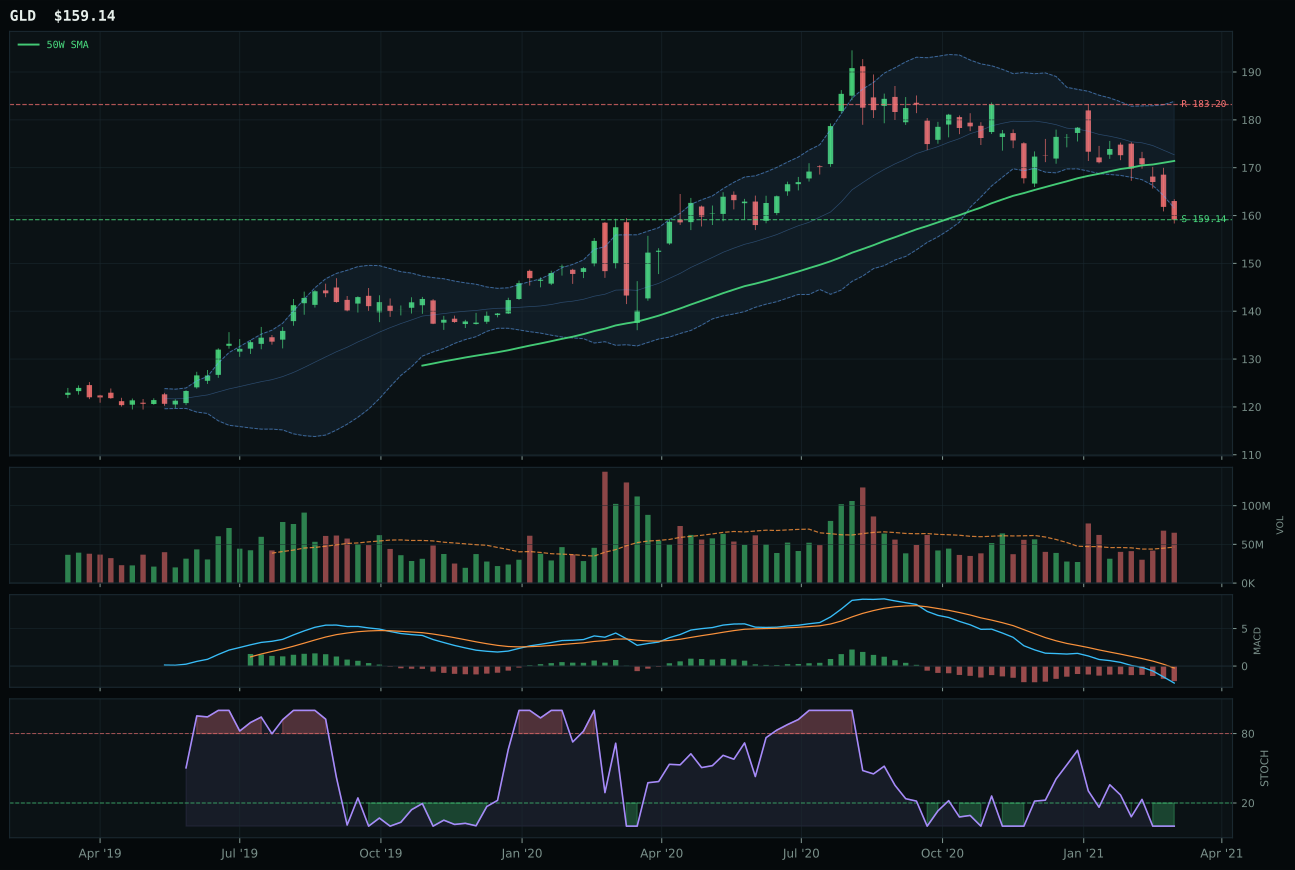
GLD has a pullback into support profile with -11.4% 13-week relative strength versus SPY.
A failed hold above support would weaken the setup.
Actionable but governed by invalidation levels.
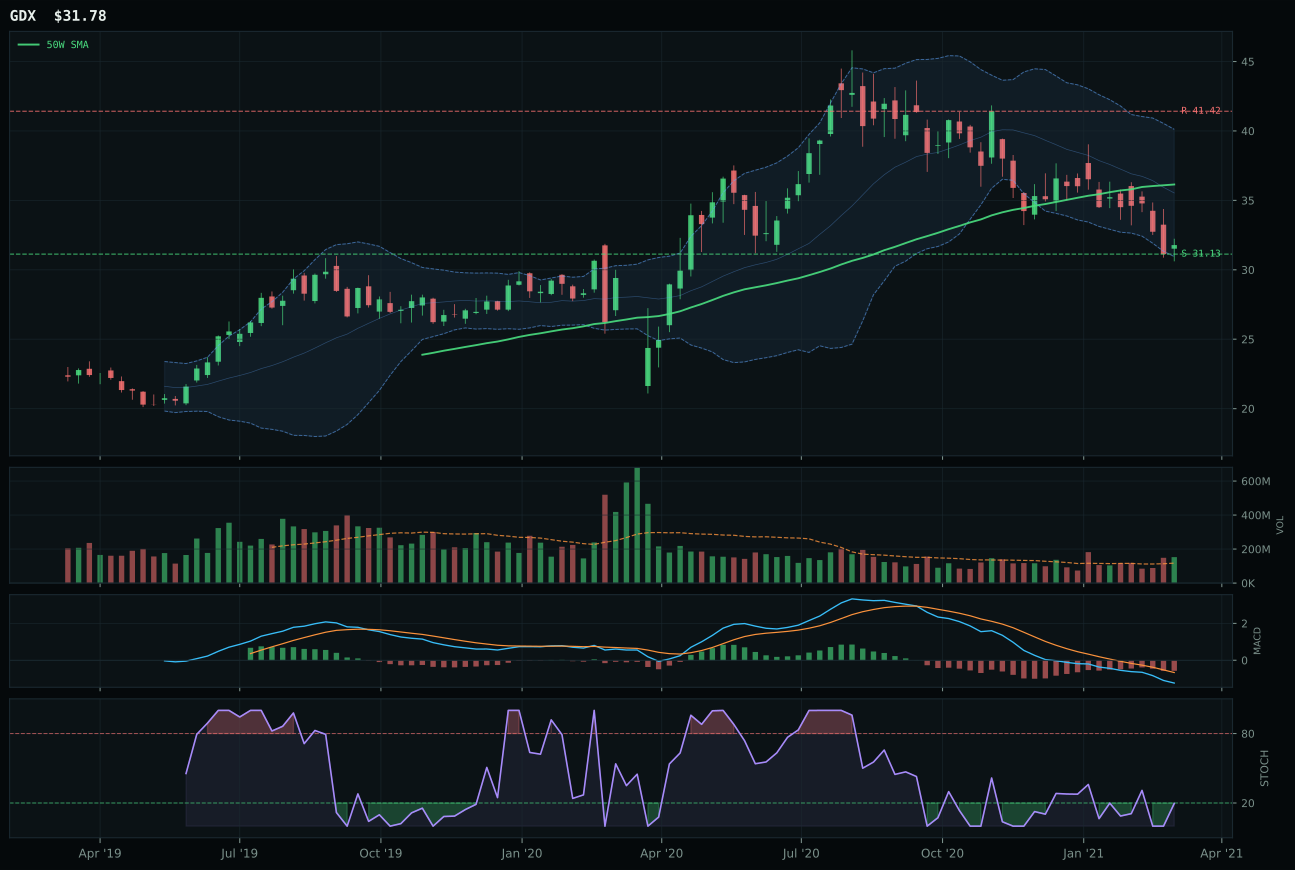
GDX has a pullback into support profile with -13.7% 13-week relative strength versus SPY.
A failed hold above support would weaken the setup.
Actionable but governed by invalidation levels.
SLV wins because it owns the strongest category-relative strength at 11.6% versus GLD's flat 0.0%, and that delta is not accidental—it reflects silver's role as an industrial hedge into inflation, not just monetary insurance. Both names carry bearish MACD and oversold stochastic RSI, but SLV's structure is cleaner (70.3 versus 69.9) and its momentum confirmation is higher (49.7 versus 2.0 for GLD's pure monetary play). GLD is a pullback into support, which is tactically sound for gold but structurally weak for this category; SLV's neutral structure with 11.9% distance to the 50W gives more room for accumulation and less downside trap risk. Risk-reward slightly favors GLD (57.6 versus 57.6, actually a tie), but SLV's 1.17x volume participation versus GLD's above-average (both) tips the breadth advantage to SLV because its participation is sufficient without bloat—a cleaner institutional accumulation pattern.
Precious Metals earned 5% allocation as a tier-2 category, scoring 38.8 with a macro fit of just 48.0. Support comes from metals scarcity (+7 at the ETF level, reflected in SLV's narrative) and inflation pressure (+5), but liquidity expansion is working against the category (-2), and the overall macro backdrop is neutral-to-headwind for precious metals in an AltSeason environment. SLV's 49.7 technical evidence score keeps the category alive, but it is not a macro winner: real assets are favored in energy, agriculture, and industrial metals, while precious metals lag because monetary hedges matter less when liquidity is expanding (Fed still supportive) and inflation is real but not yet runaway. The category holds its tier-2 slot because SLV's superior relative strength and cleaner setup prevent it from complete technical collapse. For Precious Metals to earn a top-2 seat, we would need either liquidity expansion to reverse (Fed tightening signals) or MACD to roll from bearish into improving, signaling accumulation is returning. Current regime does not support that transition yet.
Technology — XLK
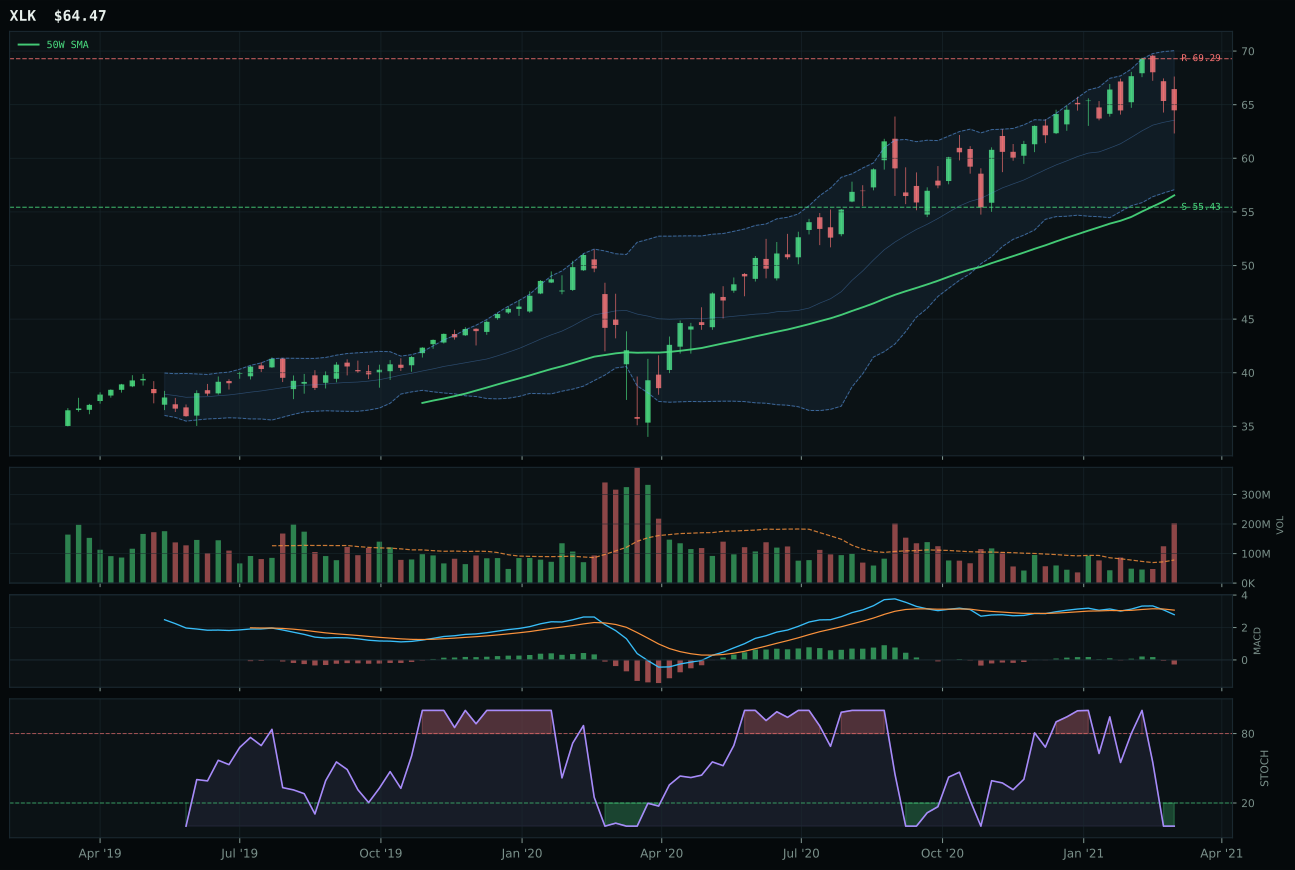
XLK has a neutral structure profile with -1.4% 13-week relative strength versus SPY.
A failed hold above support would weaken the setup.
Actionable but governed by invalidation levels.
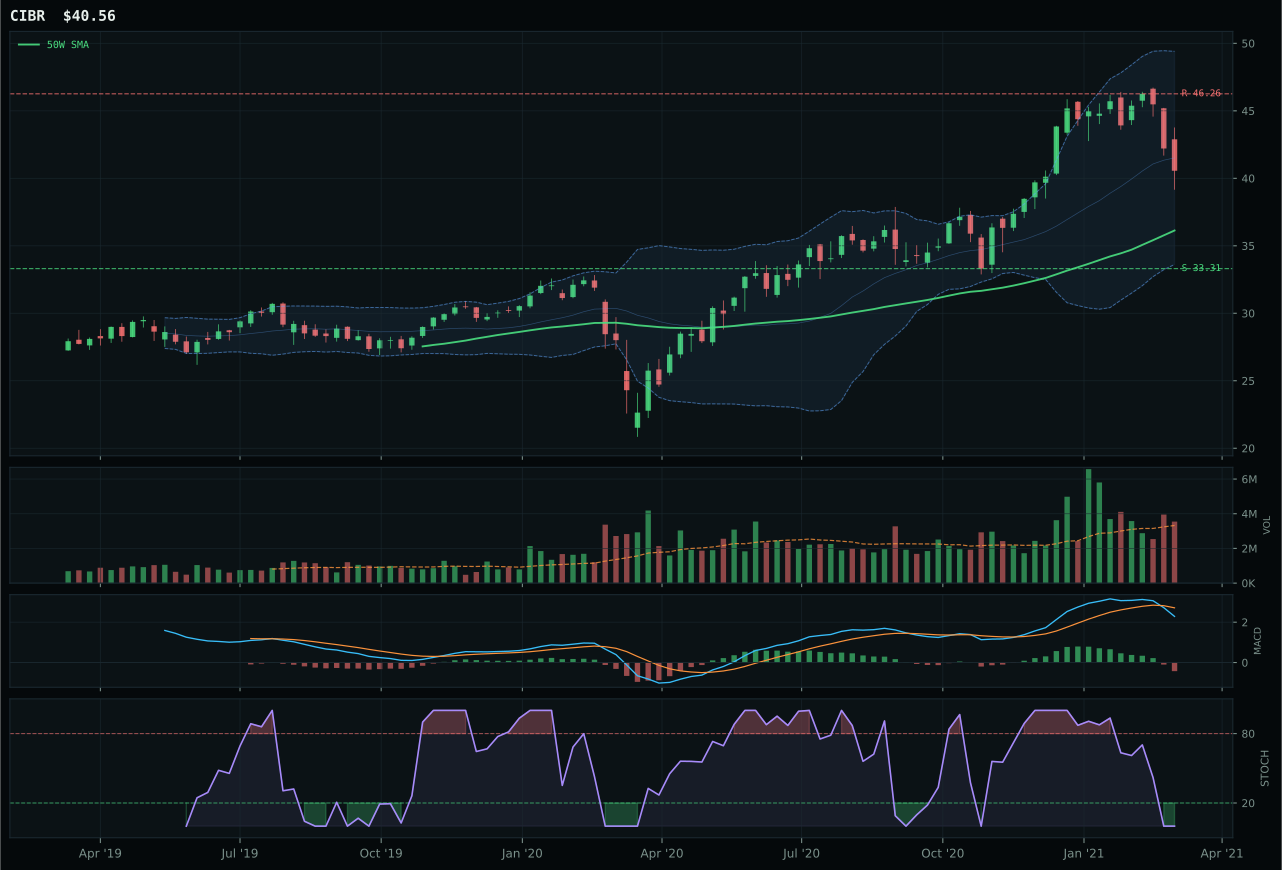
CIBR has a neutral structure profile with -1.6% 13-week relative strength versus SPY.
A failed hold above support would weaken the setup.
Actionable but governed by invalidation levels.
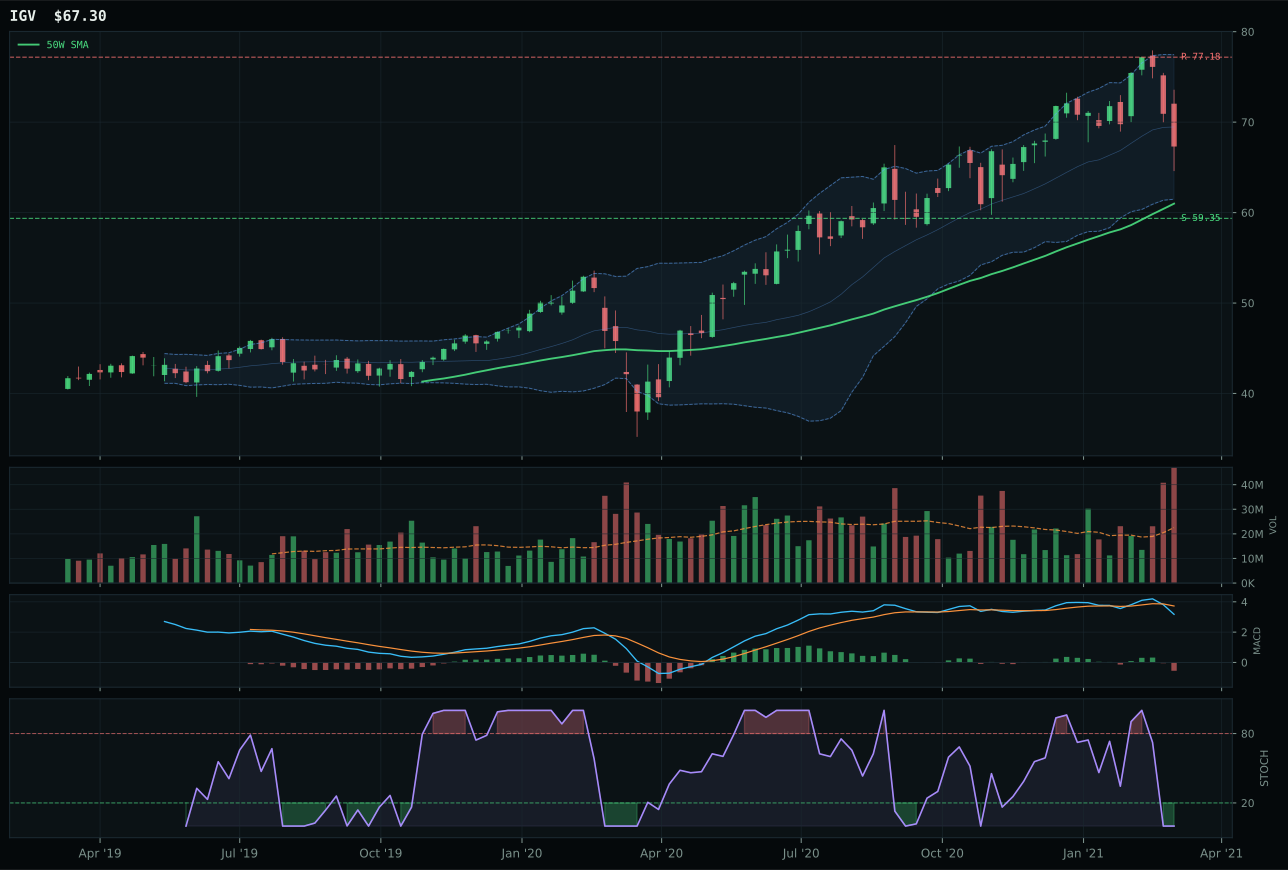
IGV has a neutral structure profile with -4.2% 13-week relative strength versus SPY.
A failed hold above support would weaken the setup.
Actionable but governed by invalidation levels.
XLK wins the category because it owns the clearest relative strength narrative inside the three-ETF basket: a 0.1% RS versus category median versus CIBR's flat 0.0%, paired with a tighter structural setup (71.2 vs 69.5 on cleanliness). Price sits 14.0% above the 50W with neutral structure and distribution pressure—a setup that rewards quality over momentum when MACD is bearish and stochastic RSI is deep oversold. The 2.3% 13W return and -1.4% RS versus SPY tell you this is a consolidation moment, not a breakout; CIBR's -1.6% SPY-relative weakness compounds its structural disadvantage, making XLK the default hold in a category where no one is winning decisively.
Technology earned zero allocation this week, ranked outside the top eight categories entirely. The 35.6 final score reflects a category muddled by macro headwinds—credit stress active and weighing down ETF-level reasoning despite liquidity expansion's support—combined with purely defensive technicals: all three names carry bearish MACD, oversold stochastic RSI, and negative or flat momentum confirmation. In an AltSeason crypto overlay environment where the 50% allocation sleeve halves every category's tier size, defensiveness alone cannot compete with the commodity, real asset, and energy tailwinds that dominate the portfolio. For Technology to earn a tier-2 slot, timing would need to break: MACD would need to roll over from bearish toward improving, and the category's macro fit would need to stop hemorrhaging points from credit stress. That reset has not occurred.
AI — SMH
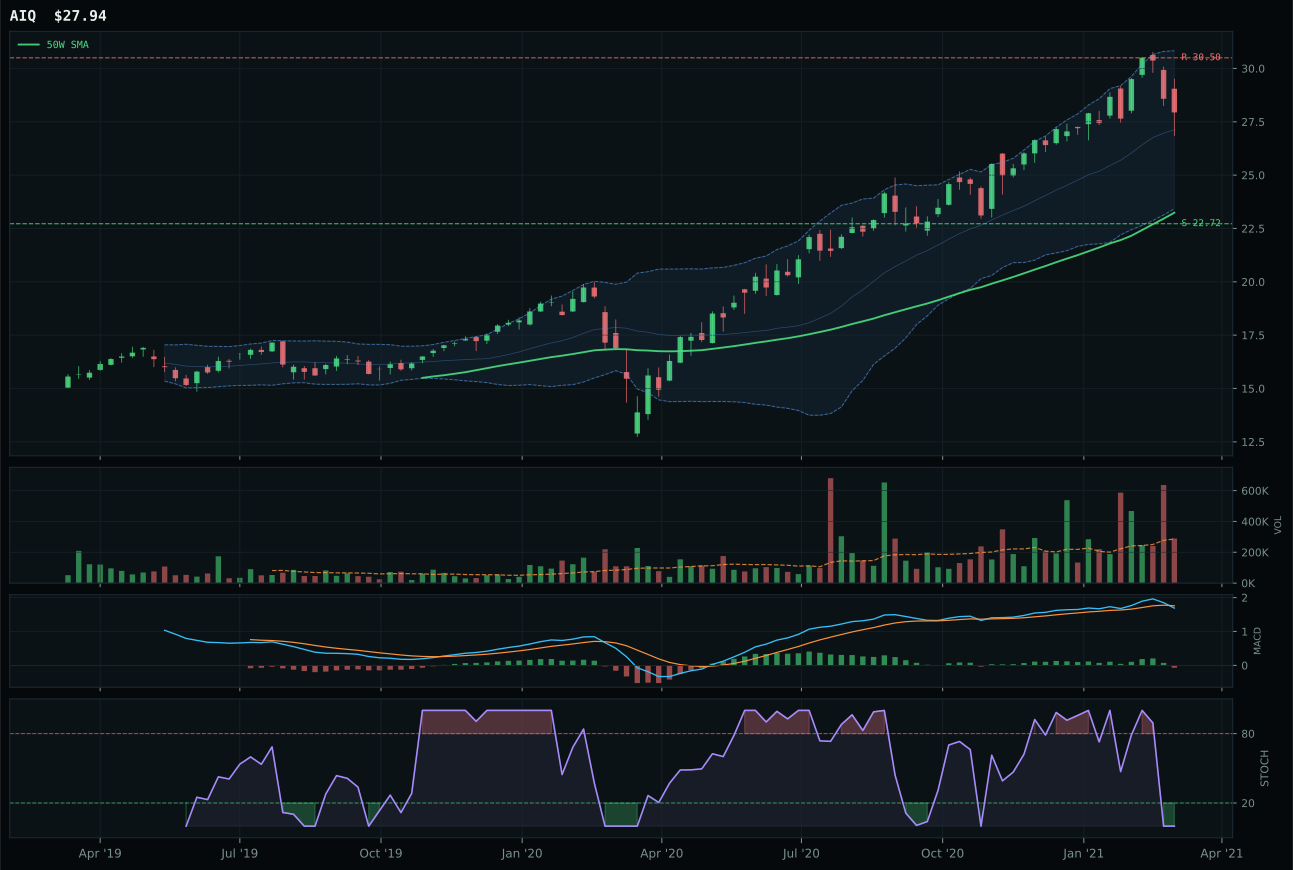
AIQ has a vertical extension profile with 1.2% 13-week relative strength versus SPY.
A failed hold above support would weaken the setup.
Tracked, but not top-2 eligible because: .
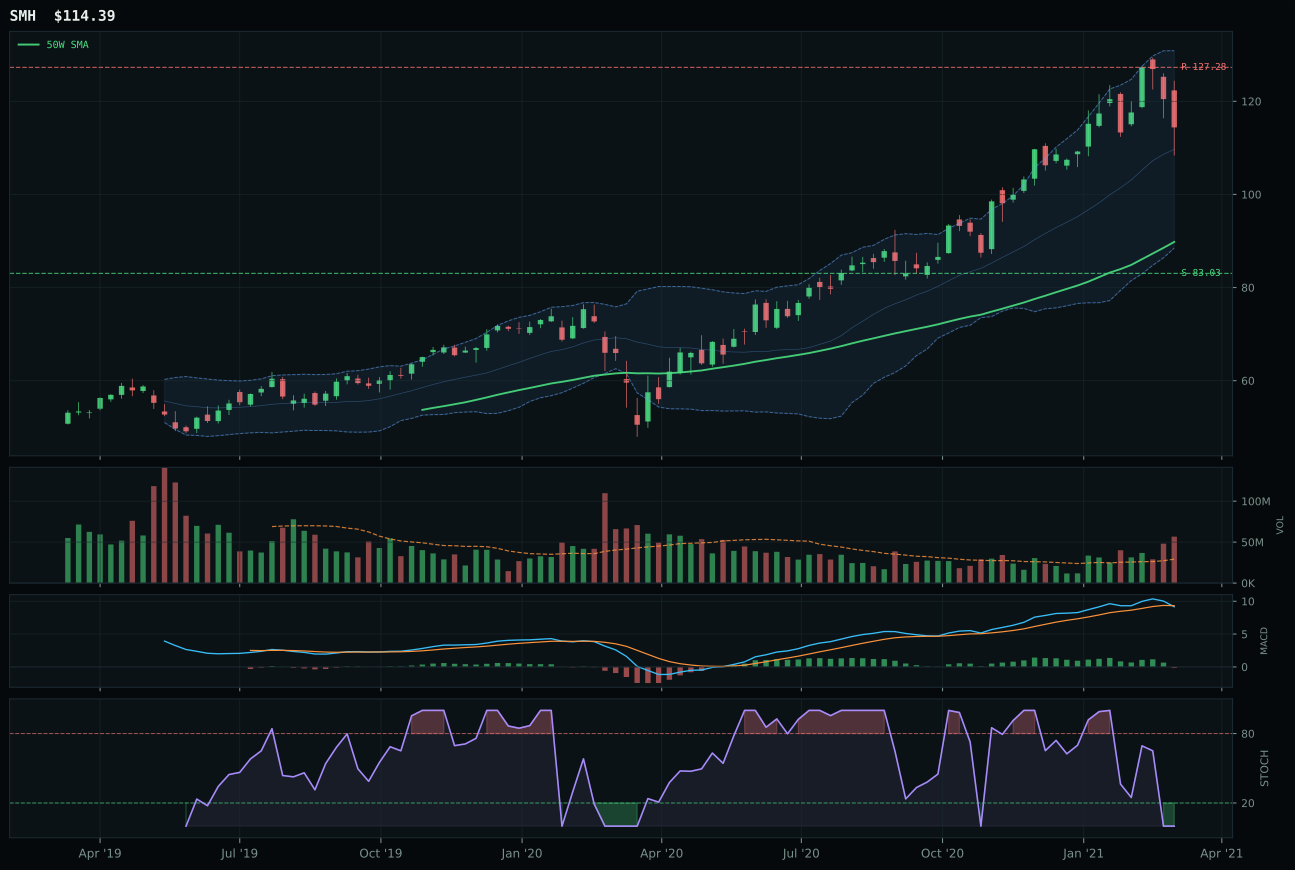
SMH has a vertical extension profile with 0.6% 13-week relative strength versus SPY.
A failed hold above support would weaken the setup.
Actionable but governed by invalidation levels.
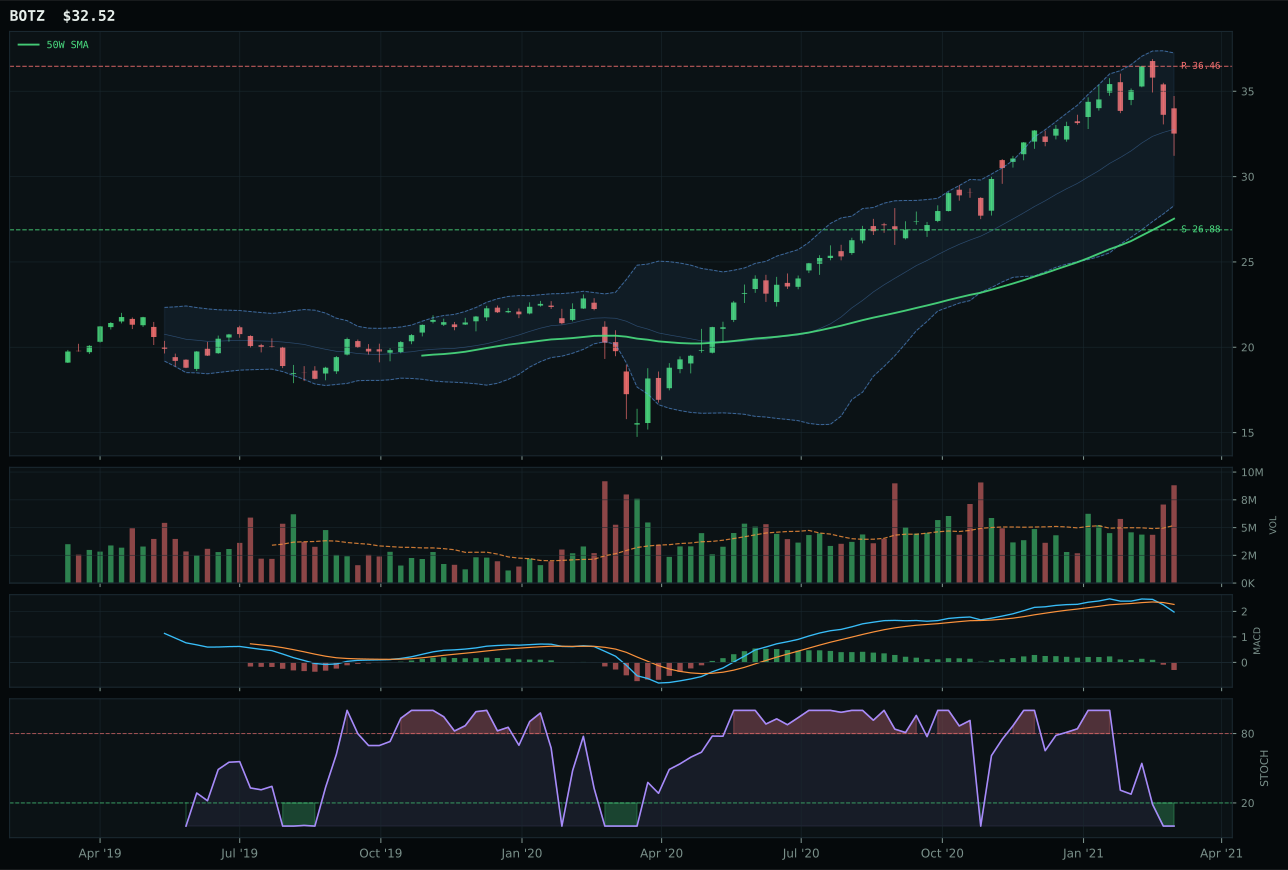
BOTZ has a vertical extension profile with -4.3% 13-week relative strength versus SPY.
A failed hold above support would weaken the setup.
Actionable but governed by invalidation levels.
SMH wins despite being technically extended—27.4% above the 50W—because it owns superior trend power and category-relative parity. The trend score of 82.8 stems from price firmly above both the 50W and 200W, a 1.4% slope, and 0.6% positive RS versus SPY; that SPY-relative strength is the tie-breaker against AIQ's 1.2%, which sounds closer than it is when you factor in distribution pressure (1.94x) and the broader momentum confirmation at 23.9 versus AIQ's 34.0 technical evidence score. AIQ's 4.9% 13W return looks better in isolation, but the category as a whole is fighting through a 27.4 composite score, and SMH's cleaner momentum—driven by strong institutional breadth—edges it past a name that feels more like a software bounce than a leadership shift.
AI earned zero allocation, ranked 9th or 10th in the category stack this week. The 27.4 final score reflects a category trapped between two currents: liquidity expansion supporting upside (+10 at the category level) but credit stress (-8) and extension risk (both SMH and AIQ sit far from their 50W) dragging down both timing and risk-reward. With SMH 27.4% extended and AIQ in vertical extension, entry risk has become asymmetric—the upside to resistance is negative for both, forcing downside support as the only leverage. In an AltSeason overlay state where every tier is halved, AI cannot compete with categories showing sustained macro sponsorship (energy at 85% macro fit, agriculture at 86%) and non-extended setups. For AI to re-enter, we would need either a pullback into support that resets timing scores, or a breakout in MACD strength and institutional volume confirmation that overwhelms the extension penalty.