
2021-02-26
Informational purposes only. The content in this report, including allocations, analysis, and commentary, is provided solely for informational and educational purposes. It does not constitute financial advice, investment advice, trading advice, or any other type of advice. Past performance does not guarantee future results. Always conduct your own research and consult a qualified financial professional before making investment decisions.
Some tracked tickers were excluded due to missing live weekly price data: SGOV: Historical cache SGOV has only 39 usable weekly bars
Weekly Allocation
| Ticker | Category | Weight | Role |
|---|---|---|---|
| FSOL | 50% | Overlay | |
| XLE | Traditional Energy | 10% | Top-2 (10%) |
| ILF | Emerging Markets | 10% | Top-2 (10%) |
| COPX | Industrial Metals | 5% | Tier-2 (5%) |
| MOO | Agriculture & Livestock | 5% | Tier-2 (5%) |
| SMH | AI | 5% | Tier-2 (5%) |
| ITA | Defense & Aerospace | 5% | Tier-2 (5%) |
| URNM | Nuclear Energy | 5% | Tier-2 (5%) |
| IGV | Technology | 5% | Tier-2 (5%) |
Trade Instructions — Monday Open
Sell the tranche from 2021-01-29 (completing its 4-week hold). Buy the new tranche. Instructions show net portfolio changes — same-asset positions cancel, weight changes show the delta.
| Action | Ticker | Instruction |
|---|---|---|
| SELL | FCG | Sell entire FCG position (2.50% of portfolio) |
| SELL | IEMG | Sell 40% of IEMG position (reduce 6.25% → 3.75%) |
| SELL | XAR | Sell 50% of XAR position (reduce 2.50% → 1.25%) |
| SELL | XLK | Sell entire XLK position (1.25% of portfolio) |
| SELL | XLU | Sell 33% of XLU position (reduce 3.75% → 2.50%) |
| BUY | IGV | Buy IGV — 14.29% of freed cash (adds 1.25% to portfolio) |
| BUY | ITA | Buy ITA — 14.29% of freed cash (adds 1.25% to portfolio) |
| BUY | XLE | Buy XLE — 28.57% of freed cash (adds 2.50% to portfolio) |
| BUY | ILF | Buy ILF — 28.57% of freed cash (adds 2.50% to portfolio) |
| BUY | URNM | Buy URNM — 14.29% of freed cash (adds 1.25% to portfolio) |
Current Portfolio After Trade
Combined holdings across all 4 active tranches. Each tranche is 25% of the portfolio.
| Ticker | % of Portfolio | Weight Bar |
|---|---|---|
| FSOL | 50.00% | |
| COPX | 6.25% | |
| MOO | 5.00% | |
| SMH | 5.00% | |
| XOP | 5.00% | |
| IGV | 5.00% | |
| XLE | 5.00% | |
| ITA | 3.75% | |
| IEMG | 3.75% | |
| XLU | 2.50% | |
| REMX | 2.50% | |
| ILF | 2.50% | |
| XAR | 1.25% | |
| PAVE | 1.25% | |
| URNM | 1.25% |
Macro Regime — Transition / Mixed
Macro Evidence Charts
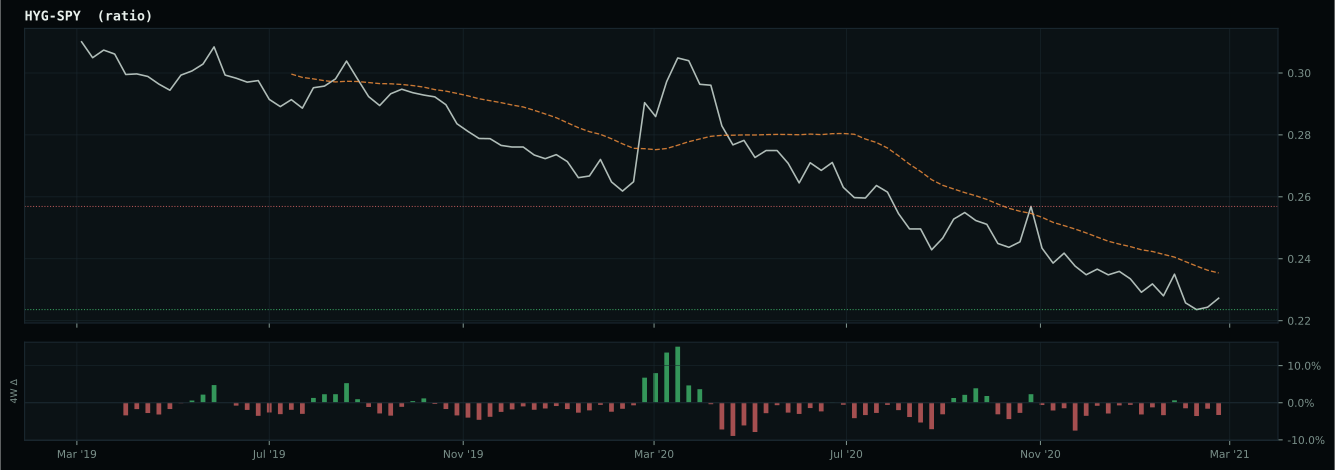
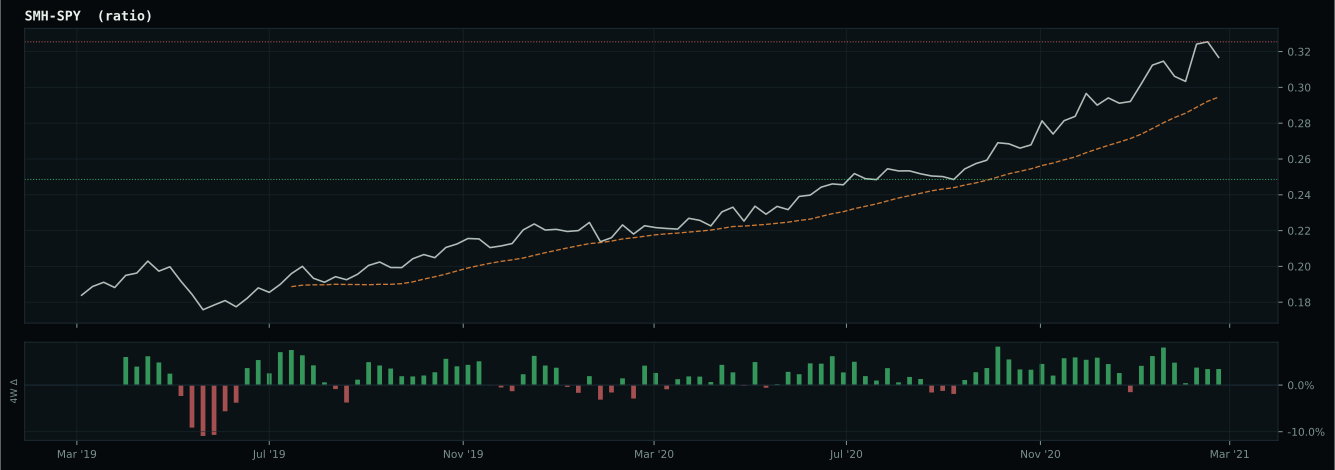
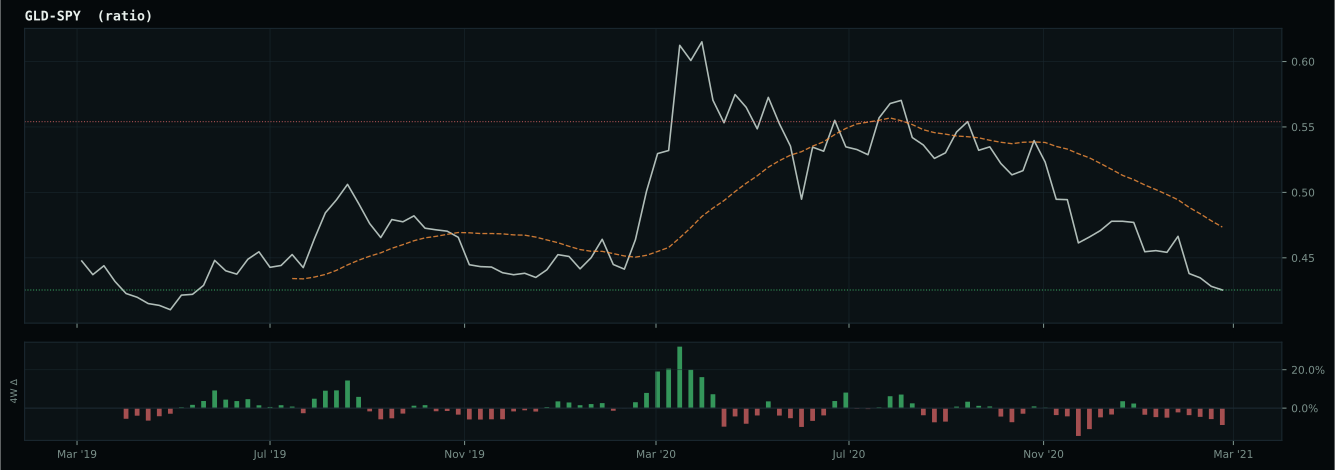
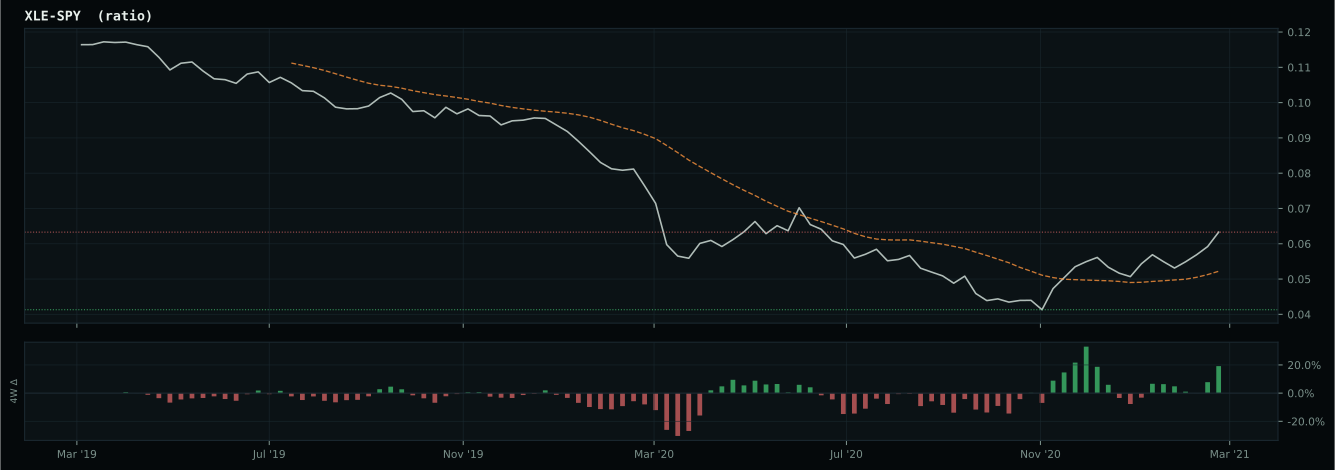
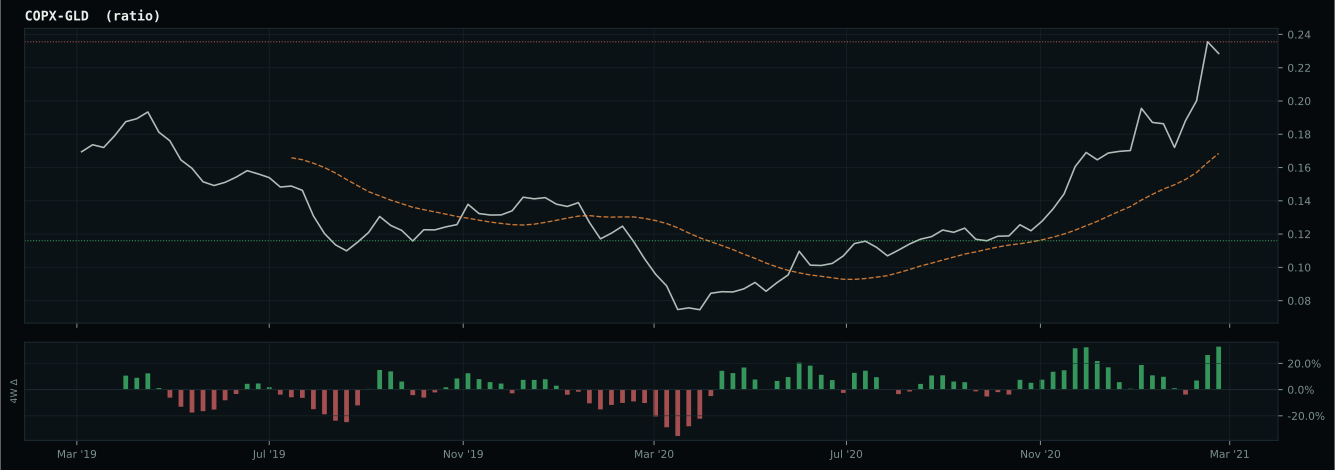
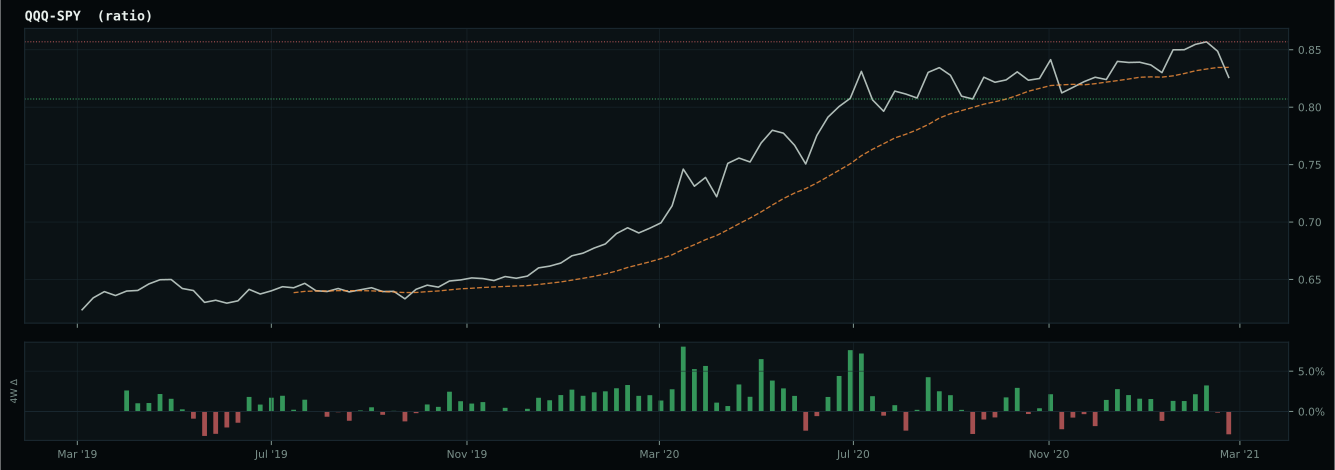
Market-implied signals behind the macro regime scores. Each ratio compares two assets; the direction and slope of the ratio is what the macro engine reads.
Crypto Regime — AltSeason
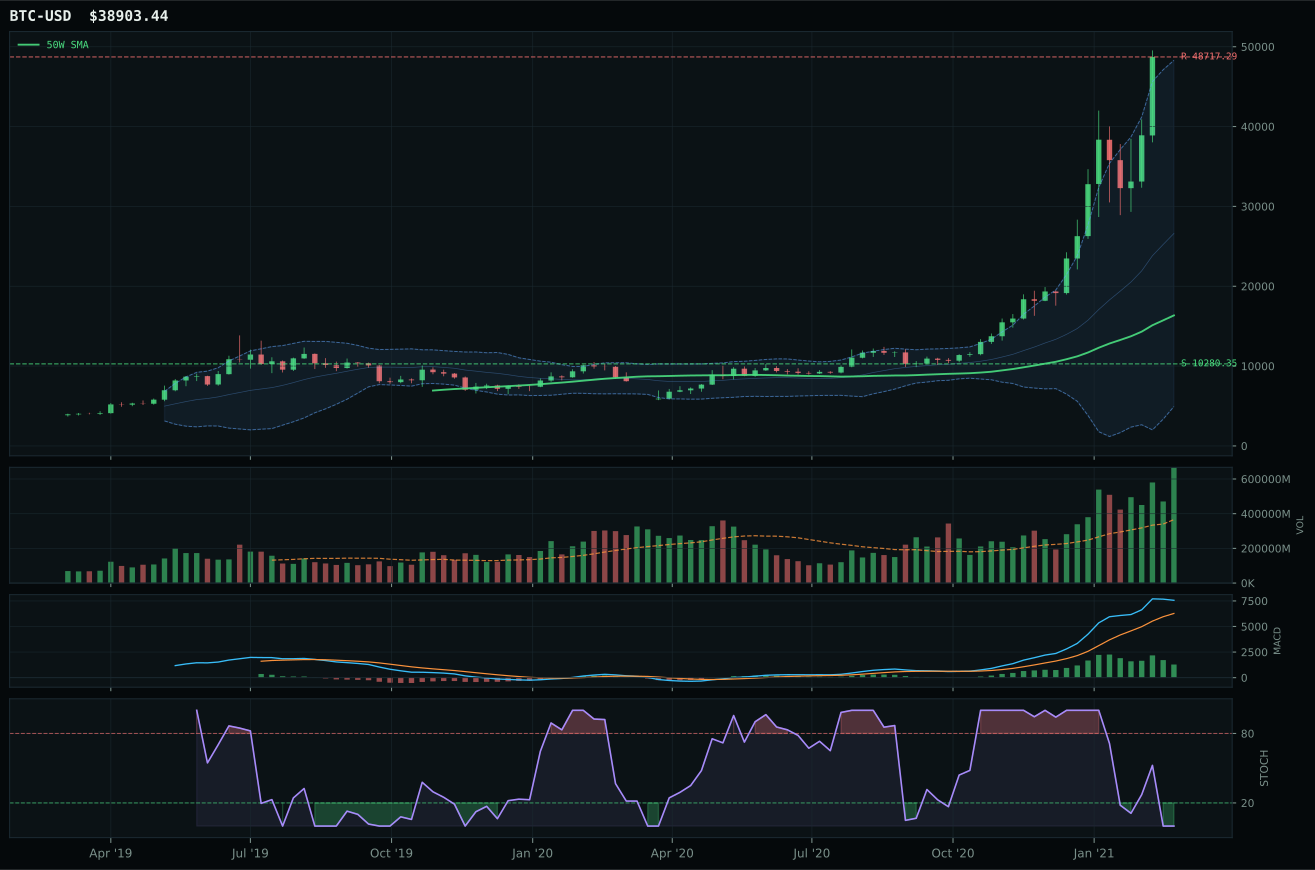
post-touch structure is too wide to count as a range; max/min close ratio is 10.67
TrendBTC confirmed: 2 consecutive closes above rising/flat 50W SMA
all available AltSeason conditions pass; missing optional confirmations skipped

Category Rankings
| Rank | Category | Winner | Score | Alloc | 4W Ret | Peers (4W) |
|---|---|---|---|---|---|---|
| 1 | Traditional Energy | XLE | 85.7 | 20% | +1.17% | FCG +3.2% · XOP -0.3% |
| 2 | Emerging Markets | ILF | 66.4 | 20% | -0.11% | IEMG -3.4% · INDA +1.1% |
| 3 | Industrial Metals | COPX | 59.7 | 10% | -6.76% | REMX -15.8% · PICK -2.7% |
| 4 | Agriculture & Livestock | MOO | 57.4 | 10% | +1.64% | WEAT -6.9% · VEGI +2.2% |
| 5 | AI | SMH | 50.3 | 10% | -2.17% | AIQ -3.2% · BOTZ -2.8% |
| 6 | Defense & Aerospace | ITA | 49.8 | 10% | +6.04% | XAR +2.0% · ROKT -0.7% |
| 7 | Nuclear Energy | URNM | 49.1 | 10% | +3.19% | URA +5.1% · NLR +9.2% |
| 8 | Technology | IGV | 43.3 | 10% | -6.85% | CIBR -2.4% · XLK -0.5% |
| 9 | Utilities & Infrastructure | PAVE | 35.9 | 0% | +7.62% | IGF +2.9% · XLU +7.2% |
| 10 | Precious Metals | SLV | 30.2 | 0% | -7.49% | GDX +3.1% · GLD -1.0% |
Traditional Energy — XLE
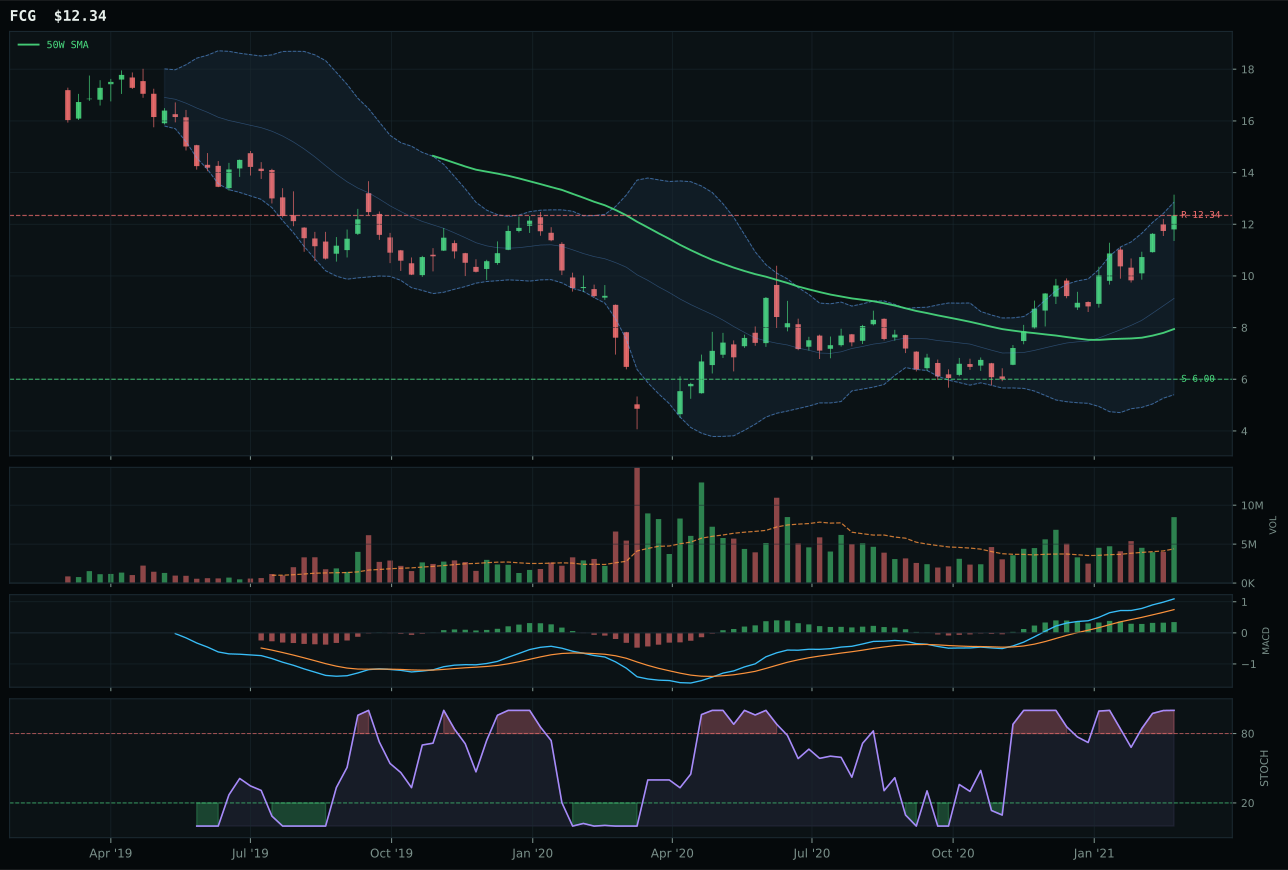
FCG has a vertical extension profile with 36.8% 13-week relative strength versus SPY.
A failed hold above support would weaken the setup.
Actionable but governed by invalidation levels.
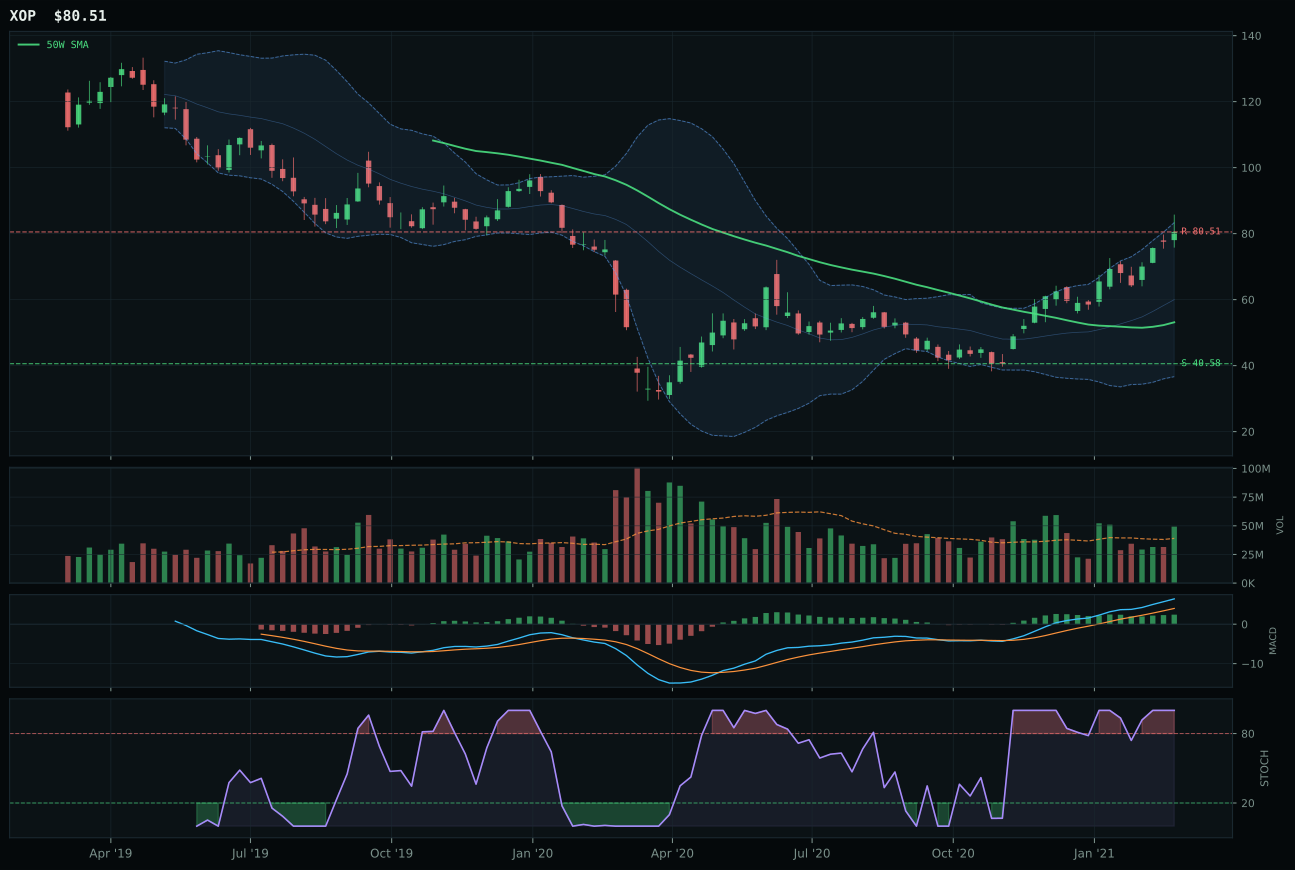
XOP has a vertical extension profile with 34.5% 13-week relative strength versus SPY.
A failed hold above support would weaken the setup.
Actionable but governed by invalidation levels.
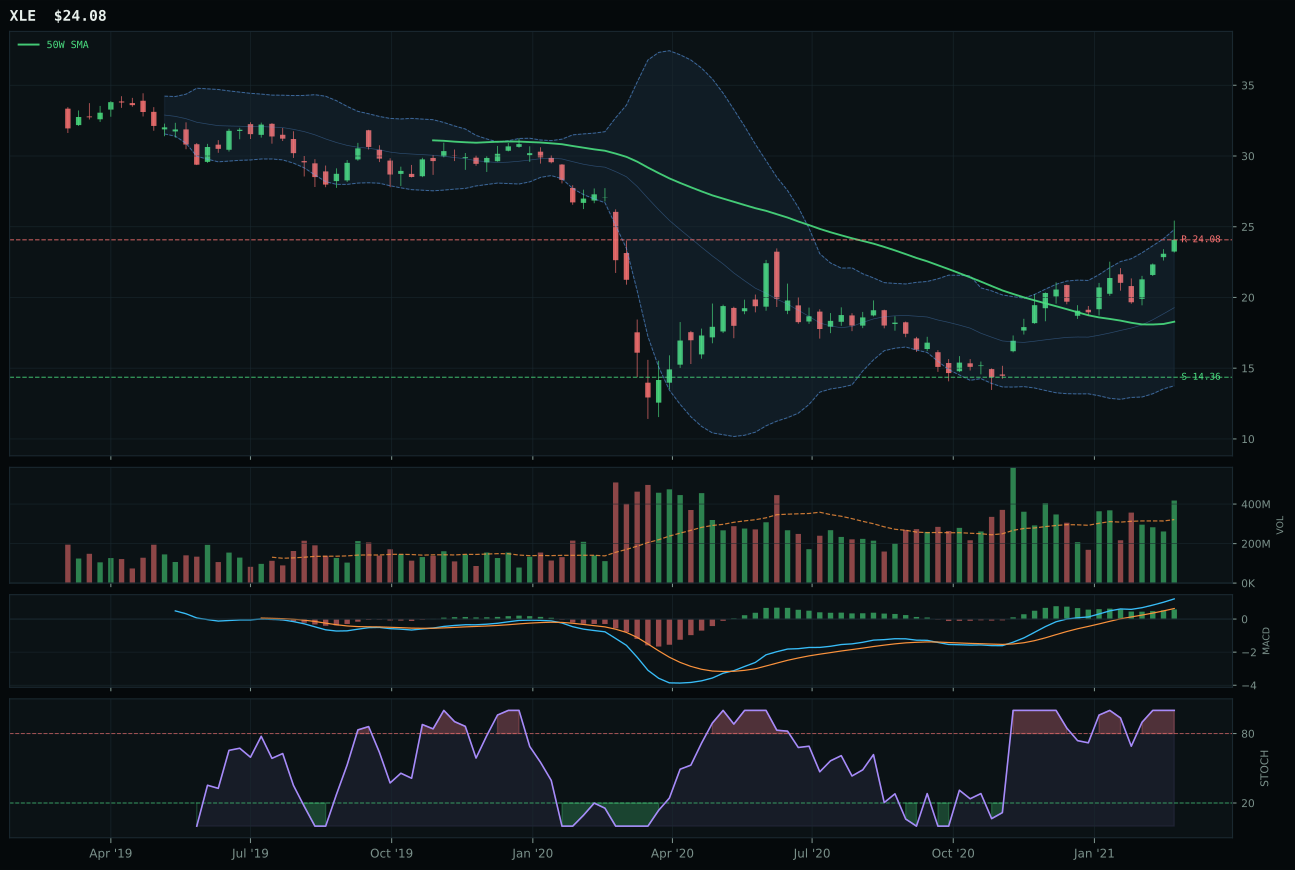
XLE has a vertical extension profile with 19.2% 13-week relative strength versus SPY.
A failed hold above support would weaken the setup.
Actionable but governed by invalidation levels.
XLE earns top-2 status with 85.7 category score, but the technical setup is deceptively fragile: the winner is selected not because of clean momentum but because it is the least worst timing alternative. XLE sits 31.7% extended from the 50W with stochastic RSI at overbought 1.00 and risk/reward of only 39.1—no upside to resistance paired with 67.7% downside to 14.36 support. The MACD is bullish and improving, which keeps the setup valid, but the 23.7% 13W return has already captured the move. FCG (the reasoned winner at 85.0 macro but runner-up technically) is even worse: 58.0% extended with identical overbought stochastic, worse timing score at 37.0, and risk/reward of 28.4. XLE's 1.3-point technical edge over FCG comes from its lower extension and marginally better risk/reward, making it the default leader in a category where all entries are late. The category-relative strength at -15.4% signals that XLE is lagging its energy peers, a red flag masked by SPY outperformance of 19.2%.
Energy claims the top-2 slot with 10% allocation—one of only two categories to earn this tier. The macro case is overwhelming: energy scarcity at 16 points, inflation pressure at 10, supply shortage at 9, and real asset sponsorship at 7 combine for 42 macro points of support, driving category-level macro fit to 85.0. This is the strongest-conviction macro call in the portfolio. The allocation decision is made despite technical extension, not because of it. XLE enters a crowded trade with limited upside and substantial downside, yet the portfolio accepts this risk because AltSeason rotations privilege real assets and scarcity hedges over duration. Risk management here is explicit: 10% is the allocation cap precisely because timing is late. Any technical breakdown—MACD rolling over, stochastic rolling below 0.5, or support at 14.36 yielding—would trigger a rapid de-risk. The 10% holds as long as energy scarcity narratives remain active; it would be cut sharply on macro descriptor changes.
Emerging Markets — ILF
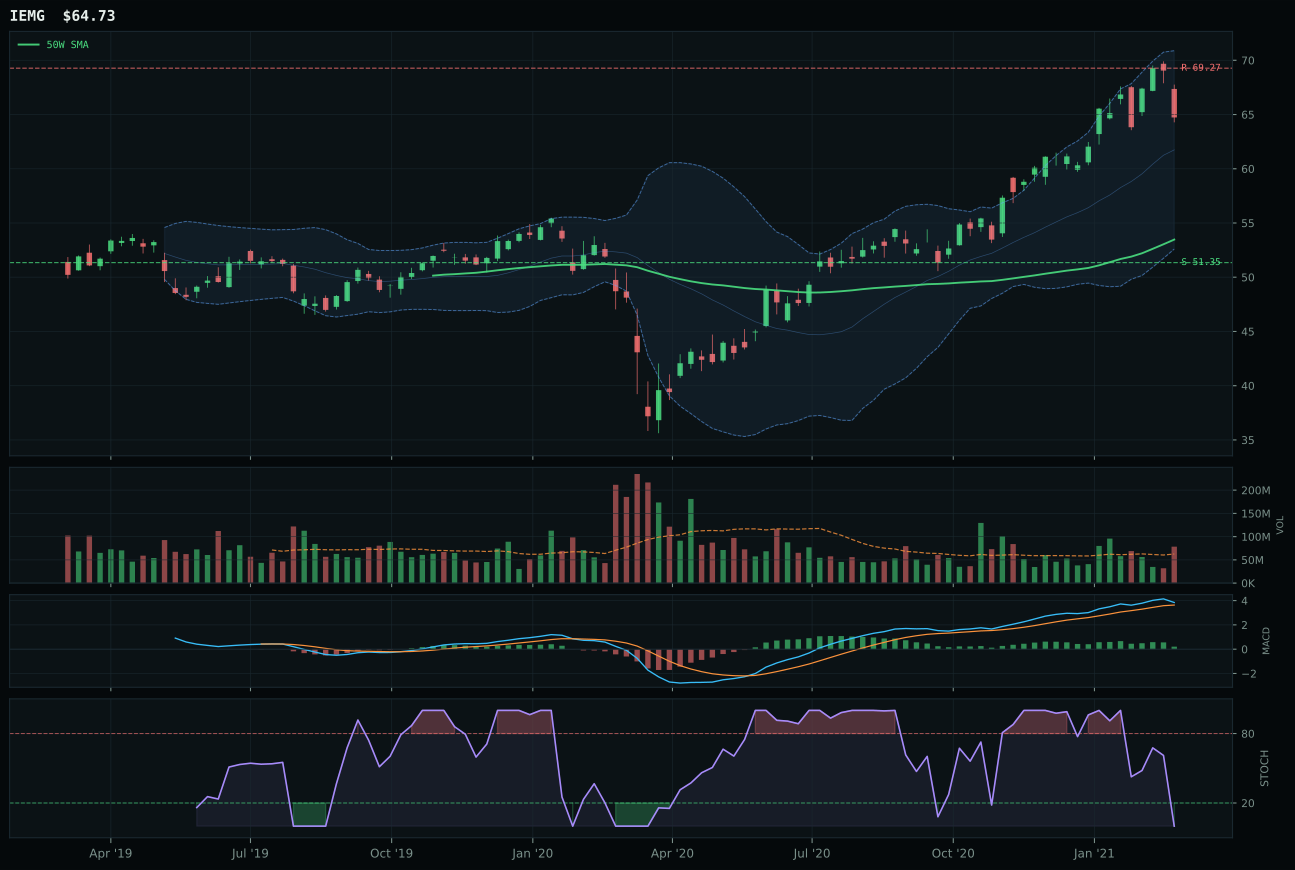
IEMG has a vertical extension profile with 3.1% 13-week relative strength versus SPY.
A failed hold above support would weaken the setup.
Actionable but governed by invalidation levels.
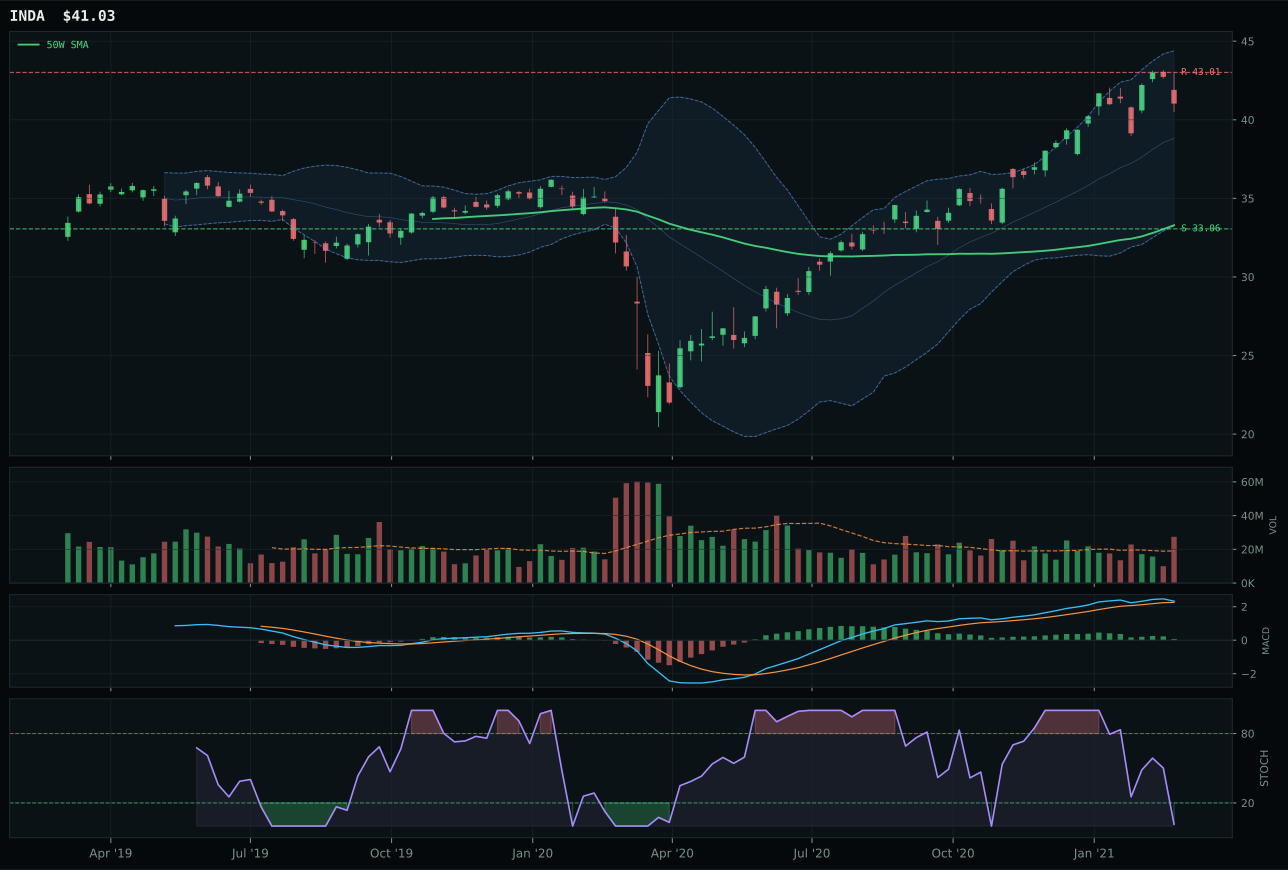
INDA has a vertical extension profile with 6.4% 13-week relative strength versus SPY.
A failed hold above support would weaken the setup.
Actionable but governed by invalidation levels.
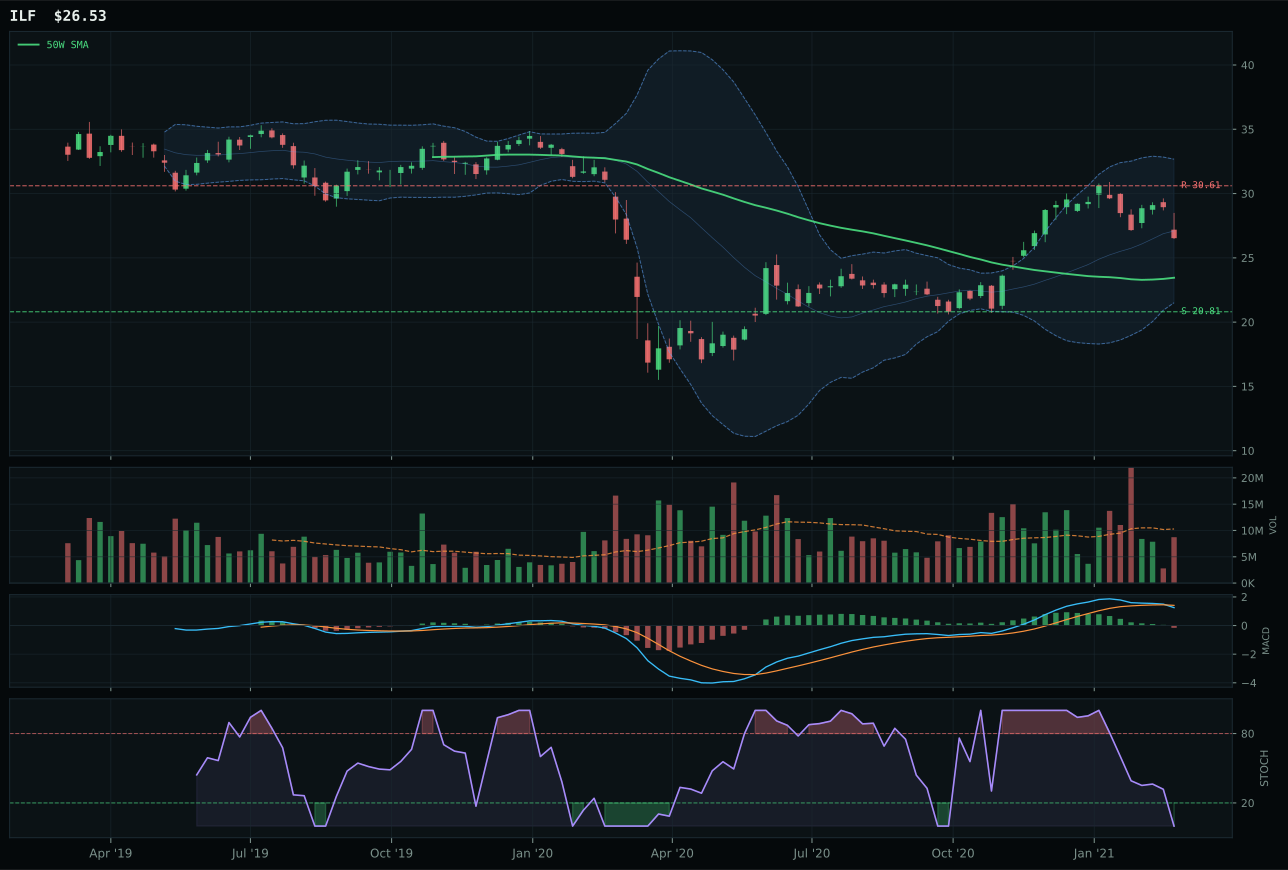
ILF has a neutral structure profile with -6.0% 13-week relative strength versus SPY.
A failed hold above support would weaken the setup.
Actionable but governed by invalidation levels.
ILF wins selection despite posting only 6.5 momentum confirmation versus IEMG's 76 and INDA's 95, because timing offers superior risk management in a category where both leading macro-weighted ETFs are extended. ILF sits 13.1% from the 50W with neutral volume and stochastic RSI at oversold 0.00 paired with bearish-weakening MACD—a defensive, mean-reversion-prone setup. IEMG is 21.1% extended with bullish-but-flattening MACD and above-average participation, signaling that momentum is decelerating. ILF's neutral structure generates 70.0 timing score versus IEMG's 48.0, and its superior risk/reward of 53.7 (versus IEMG's 49.5) provides more downside protection. ILF's -1.4% 13W return trails IEMG's 7.7%, but in a Transition/Mixed regime, the allocator is choosing the setup most likely to stabilize rather than the one most likely to run. The 18.8-point score gap appears extreme until adjusted for timing: ILF is the least extended way to capture emerging-market commodity and real-asset beta.
Emerging Markets claims the second top-2 slot with 10% allocation and 66.4 category score, second only to Energy. The macro case supports this: EM liquidity support at 14 points, liquidity expansion at 8, and risk appetite positive at 8 provide 30 macro points of tailwind, nearly matching Energy's macro sponsorship. Yet the portfolio has chosen ILF—the technically weakest representative—as the vehicle, signaling that this is a macro-conviction allocation with active timing discipline. The category macro fit of 70.0 is second-highest in the portfolio. ILF's bearish MACD and oversold stochastic are features, not bugs: they signal that the category is in consolidation mode rather than extended momentum. EM would be cut immediately if stochastic RSI rolled below 0.00 and MACD broke below the zero line definitively, signaling that EM liquidity support is reversing. For now, the 10% holds as a structural macro bet on emerging-market liquidity and commodity beta, with ILF as the defensive entry point.
Industrial Metals — COPX
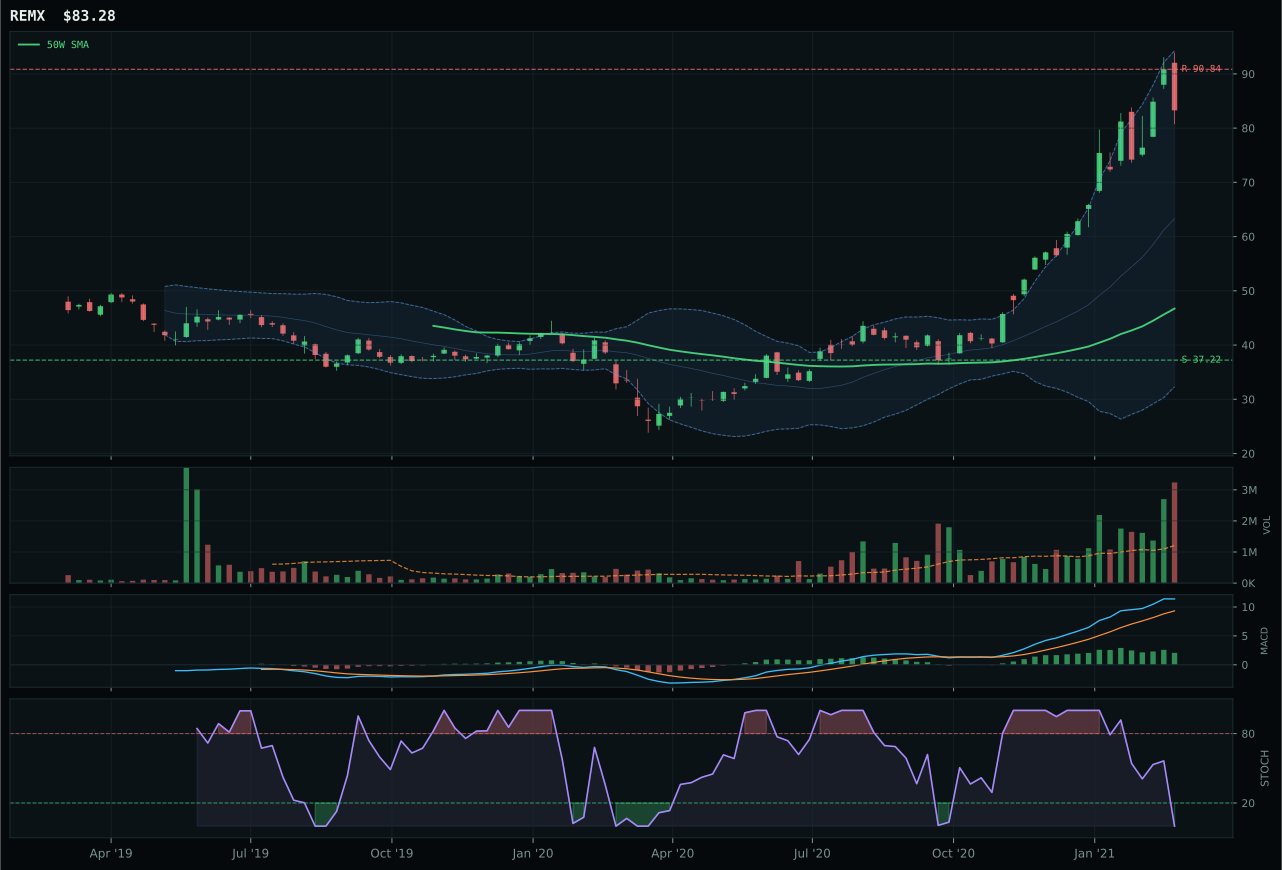
REMX has a vertical extension profile with 43.9% 13-week relative strength versus SPY.
A failed hold above support would weaken the setup.
Actionable but governed by invalidation levels.
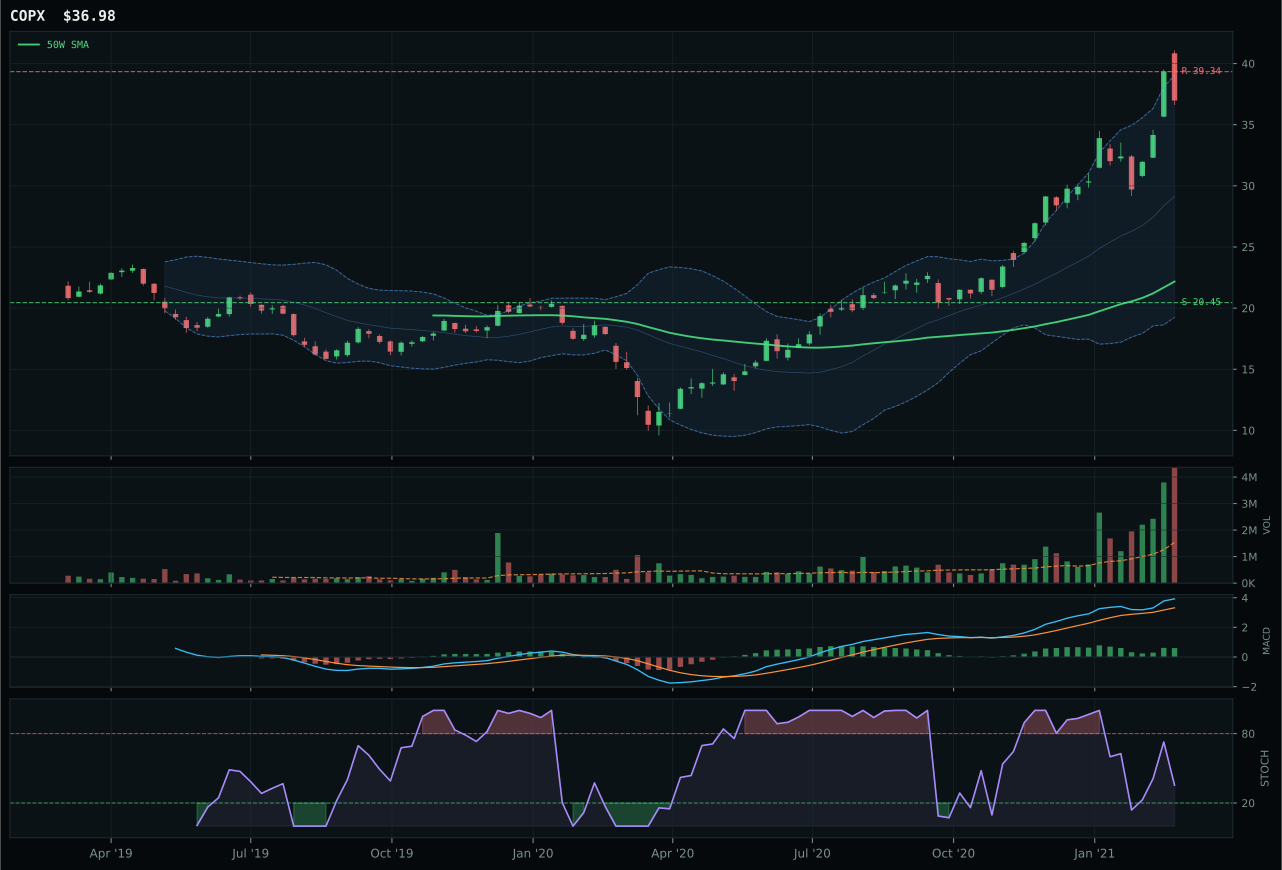
COPX has a vertical extension profile with 32.7% 13-week relative strength versus SPY.
A failed hold above support would weaken the setup.
Actionable but governed by invalidation levels.
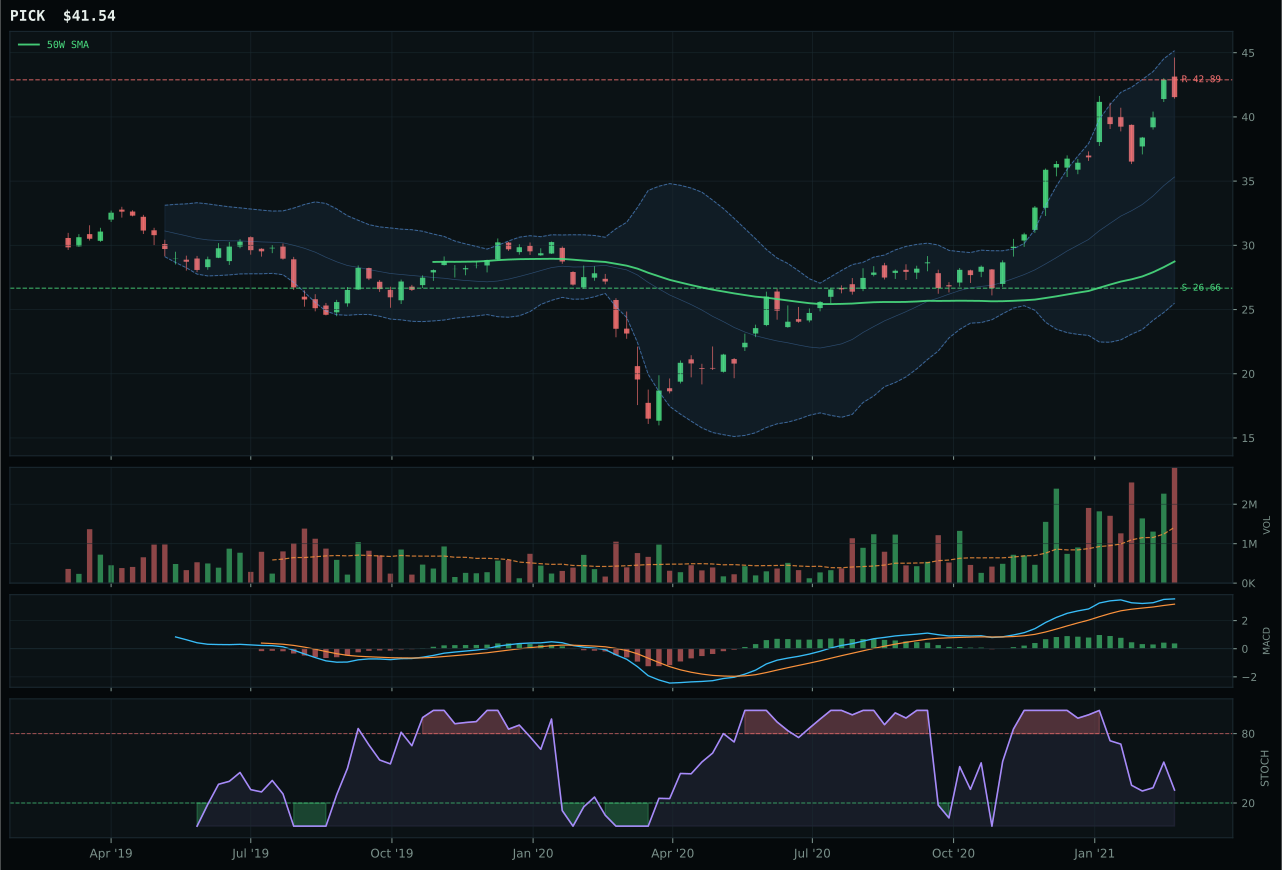
PICK has a vertical extension profile with 21.5% 13-week relative strength versus SPY.
A failed hold above support would weaken the setup.
Actionable but governed by invalidation levels.
COPX clinches the category with superior timing (61.0 vs 48.0 for REMX) rooted in 66.8% extension paired with bullish-and-improving MACD and stochastic RSI rising through mid-zone at 0.35, a setup that shows active accumulation despite the extreme price advance. REMX, though posting higher 13W returns at 48.4% versus COPX's 37.3%, commits the timing sin of being more extended at 78.2% from the 50W while its MACD flattens and stochastic RSI overshoots to 1.0 overbought. Risk/reward tilts decisively: COPX offers 38.3 versus REMX's 23.2, meaning COPX has better downside protection relative to upside potential. The 5.8-point gap also reflects COPX's cleaner 70.9 structure score and category-relative strength at parity (0.0%) while REMX leads at 11.2%—COPX is leadership relative to the category median, not the basket leader. Metals scarcity and commodity breadth macro support both, but COPX's MACD durability edges REMX's exhaustion signal.
Industrial Metals earns 5% with a 59.7 category score and 73.0 macro fit, placing it in tier-3 behind XLE and ILF. Metals scarcity at 14 macro points and commodity breadth positive at 10 deliver strong fundamental support, yet the category remains subordinate to energy's 85.7 and emerging markets' 66.4 due to execution risk. COPX trades 66.8% extended from its 50W with only 38.3 risk/reward—every new buyer in this setup is late to the accumulation phase. The category would ascend to tier-2 if COPX consolidated into its 50W, allowing stochastic RSI to reset below 0.5 and MACD to flatten, proving that institutional money remains committed rather than taking profits. Alternatively, if global copper supply dislocates or inflation accelerates beyond 4%, the macro sponsorship alone could justify higher allocation. For now, 5% respects the scarcity narrative while acknowledging that price extension has priced much of the good news into current levels.
Agriculture & Livestock — MOO
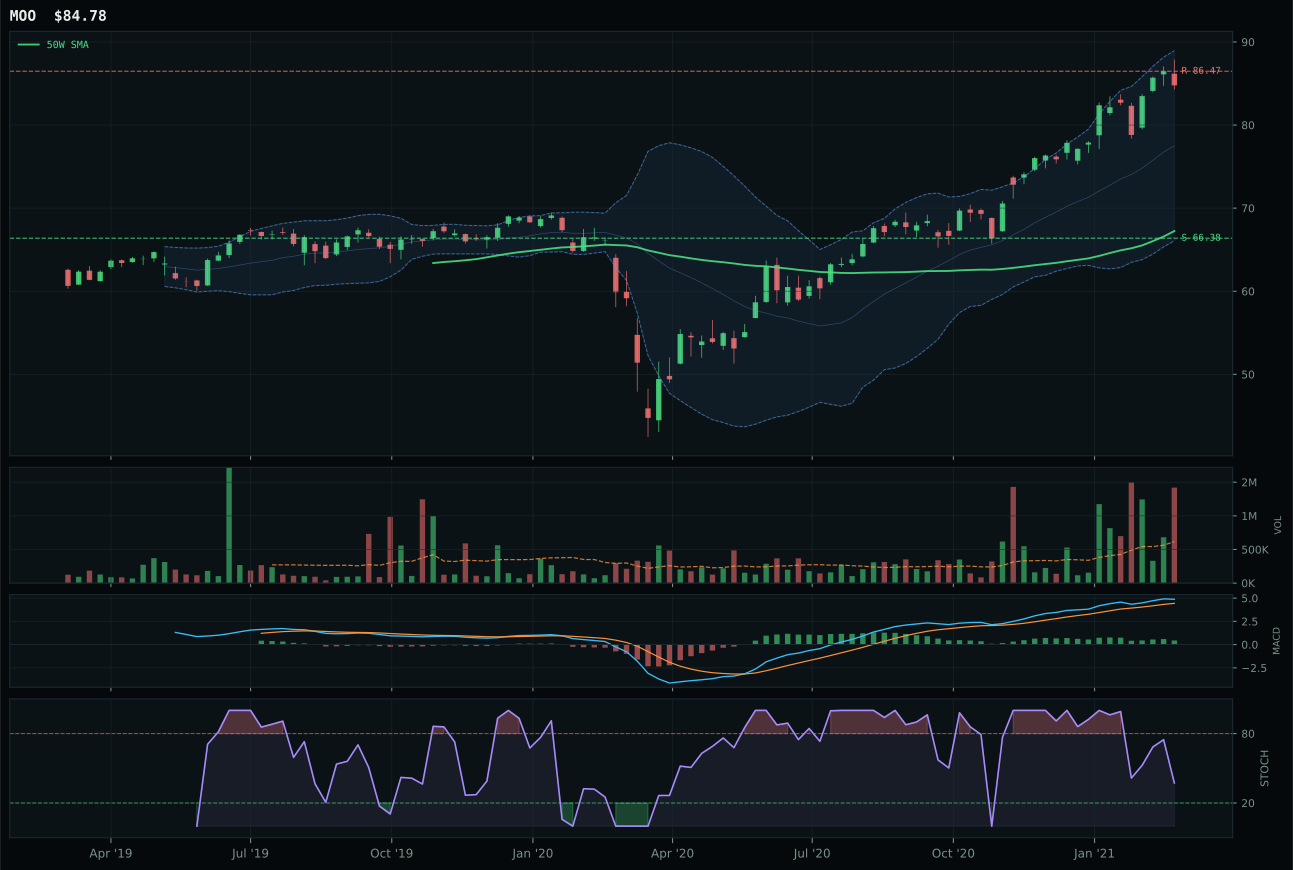
MOO has a vertical extension profile with 6.9% 13-week relative strength versus SPY.
A failed hold above support would weaken the setup.
Actionable but governed by invalidation levels.
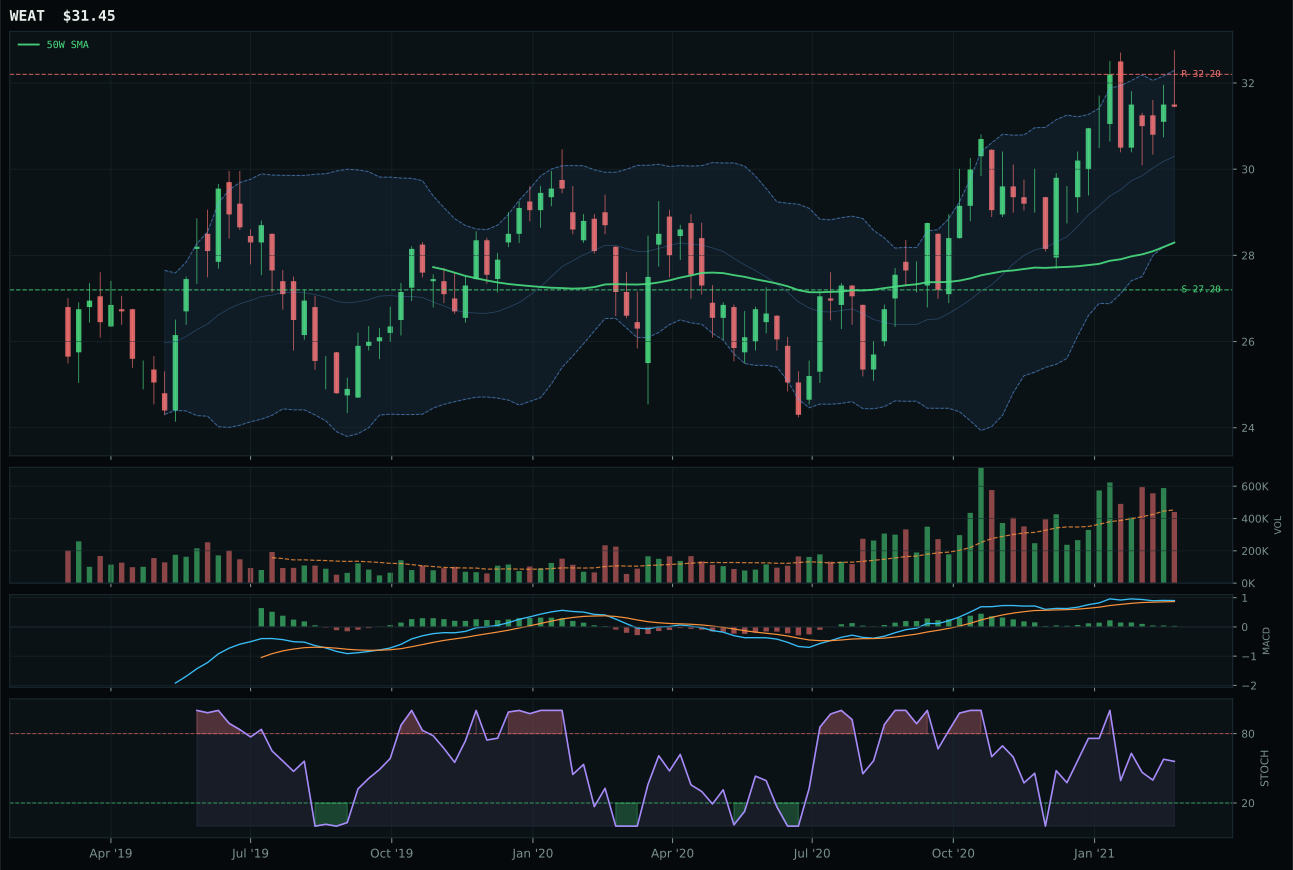
WEAT has a neutral structure profile with 1.8% 13-week relative strength versus SPY.
A failed hold above support would weaken the setup.
Actionable but governed by invalidation levels.
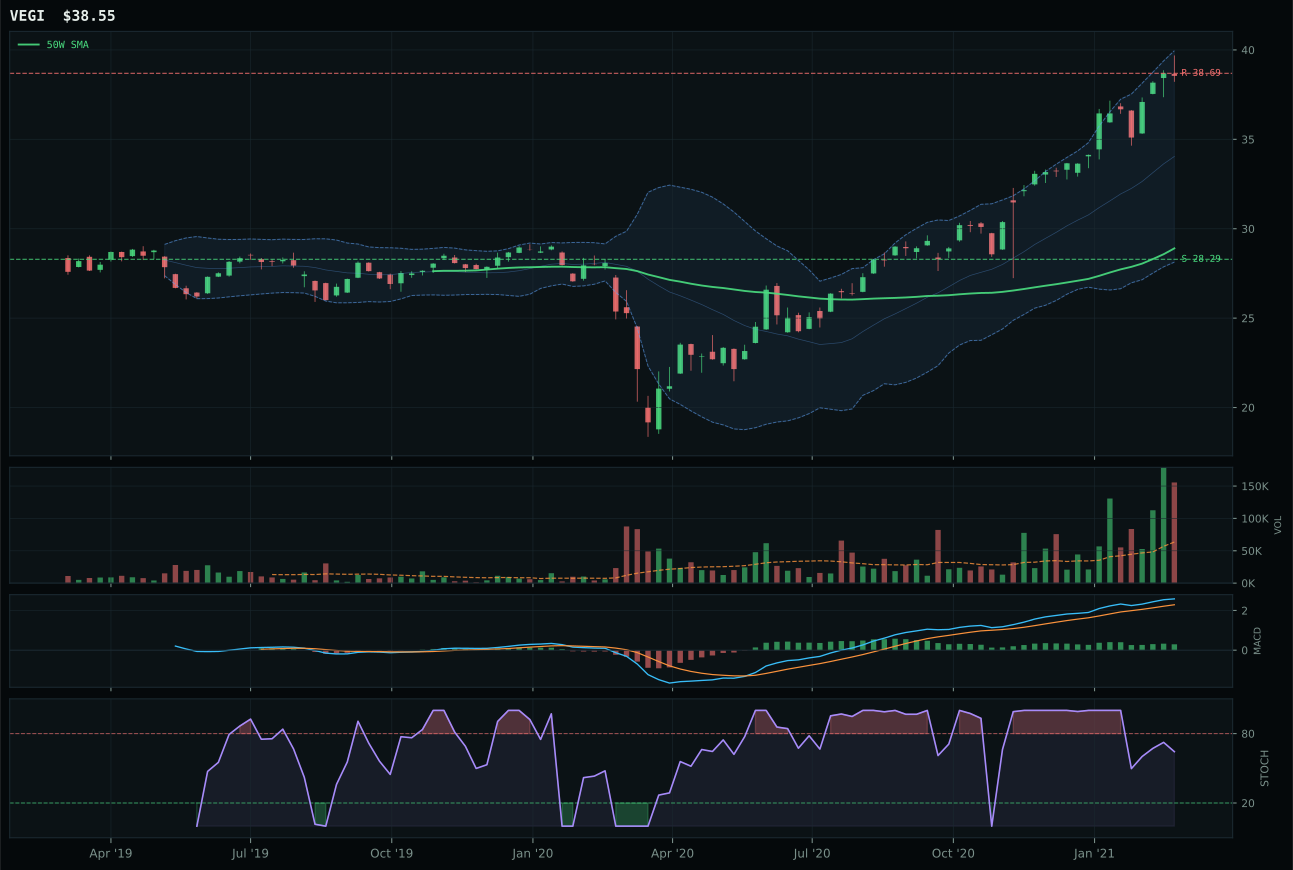
VEGI has a vertical extension profile with 12.0% 13-week relative strength versus SPY.
A failed hold above support would weaken the setup.
Tracked, but not top-2 eligible because: .
MOO triumphs despite WEAT posting a stronger 72 technical composite score, because MOO's 85.8 momentum confirmation and bullish-and-improving MACD overcome WEAT's structural advantages. MOO delivers 11.5% 13W returns with 6.9% SPY outperformance and—critically—0.0% category-relative strength that puts it in leadership parity with WEAT's -5.1% lag. The deciding factor is MACD trajectory: MOO's bullish and improving stance versus WEAT's bullish but flattening signals momentum persistence. Both face extreme entry risk at near 52W highs, MOO at 26.1% extension and WEAT at a less-stretched structure, but the category macro—supply shortage at 13 points, inflation pressure at 10, real asset sponsorship at 8—rewards whoever is leading the money flow. MOO's 2.30x volume distribution pressure and falling stochastic RSI at 0.37 mark active accumulation into overbought conditions, a setup that persists when macro sponsorship is strong.
Agriculture earns 5% with a commanding 57.4 category score and 86.0 macro fit—the strongest macro support in the portfolio after AI. Supply shortage and inflation pressure deliver 23 macro points of support, while real asset sponsorship adds 8 and commodity breadth positive contributes 5. Yet MOO remains in tier-3 because the technical side screams extension risk: 30.3 risk/reward with only -2.0% upside to resistance and 27.7% downside to support. The category is one of the few where macro and technical are openly at war. Agriculture would justify tier-2 upgrade if MOO could consolidate and base rather than extend, proving that accumulation is institutional rather than retail FOMO. Alternatively, if inflation continues printing hot or agricultural supply shocks escalate globally, the macro case alone could overwhelm timing concerns. For now, the 5% captures real-asset sponsorship without over-committing to an extended setup.
AI — SMH
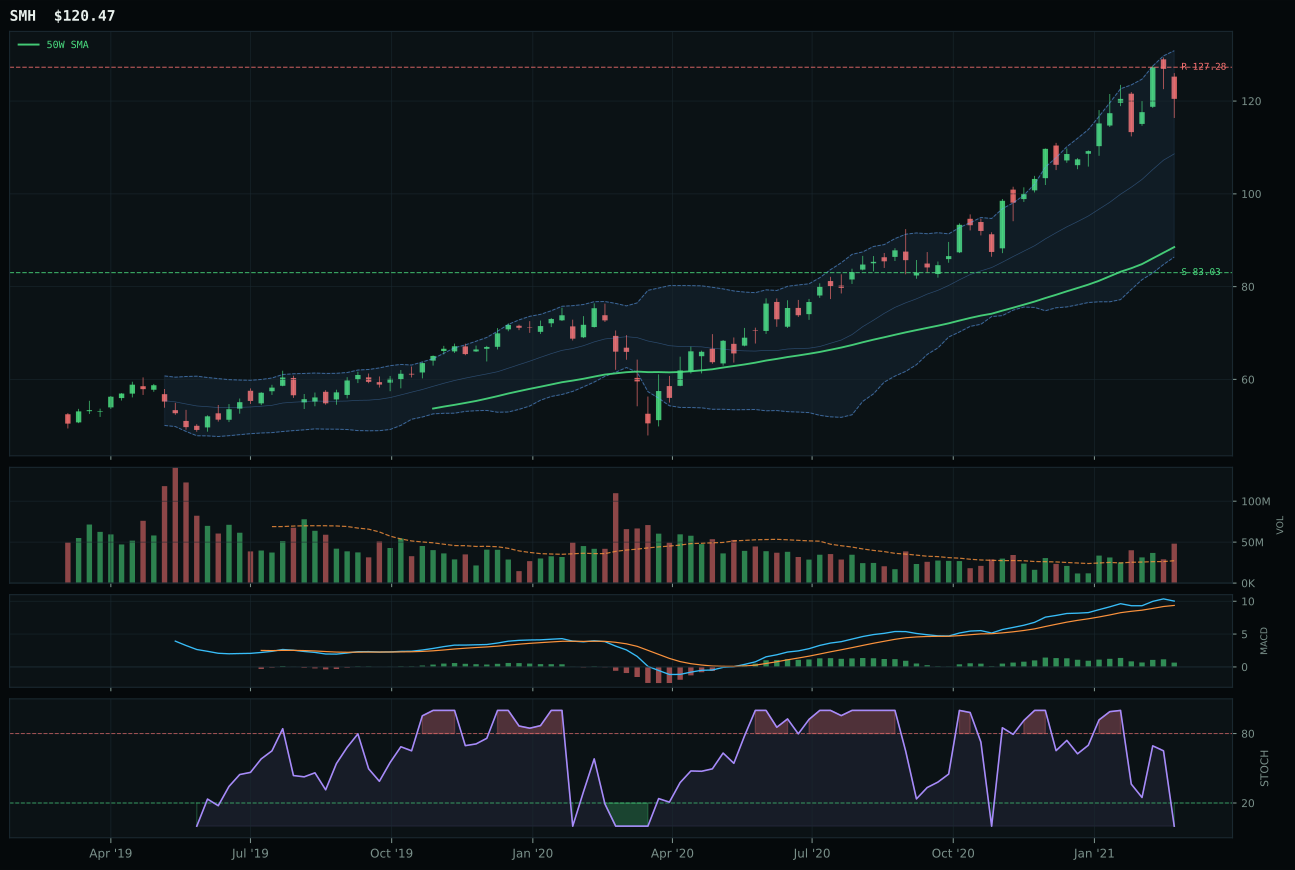
SMH has a vertical extension profile with 12.1% 13-week relative strength versus SPY.
A failed hold above support would weaken the setup.
Actionable but governed by invalidation levels.
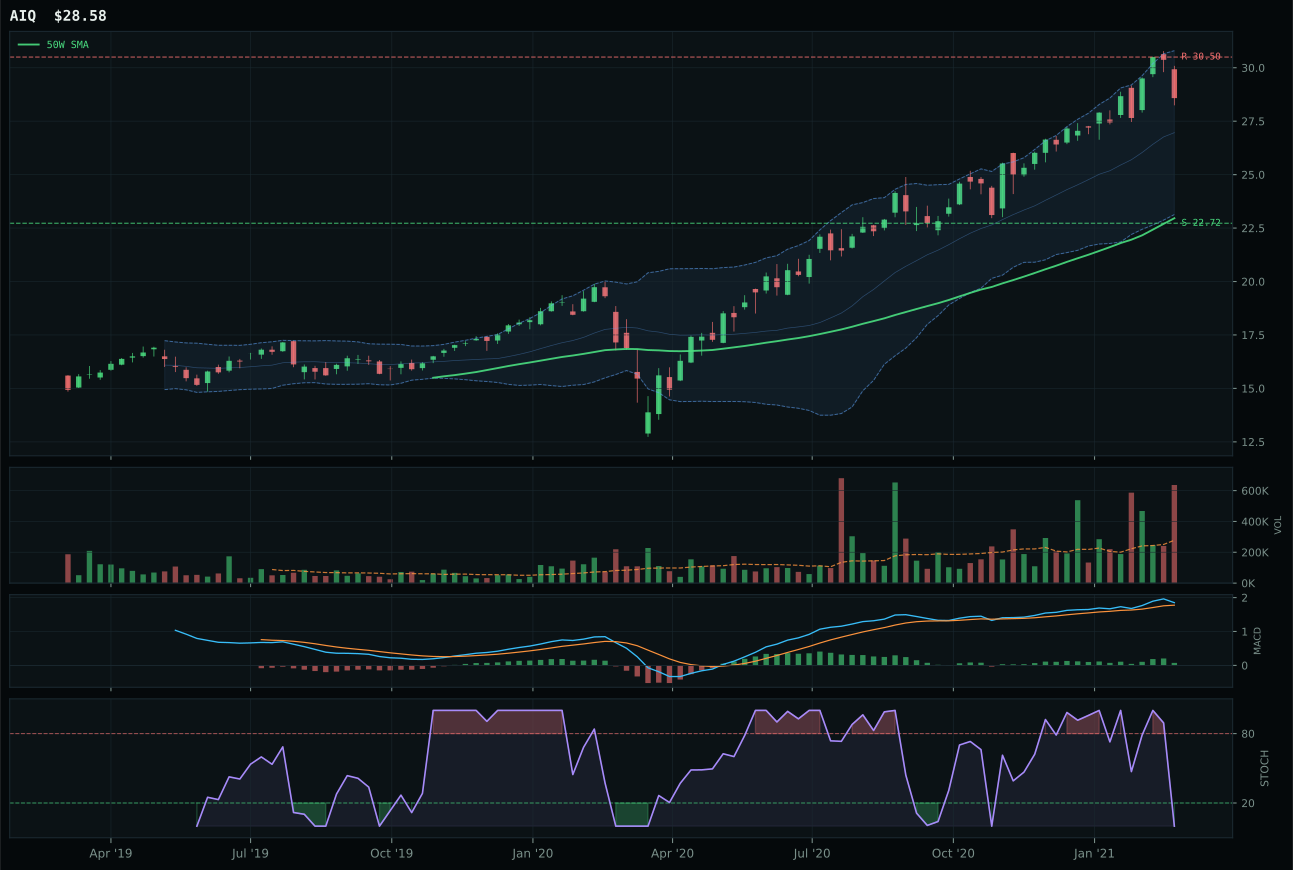
AIQ has a vertical extension profile with 5.2% 13-week relative strength versus SPY.
A failed hold above support would weaken the setup.
Tracked, but not top-2 eligible because: .
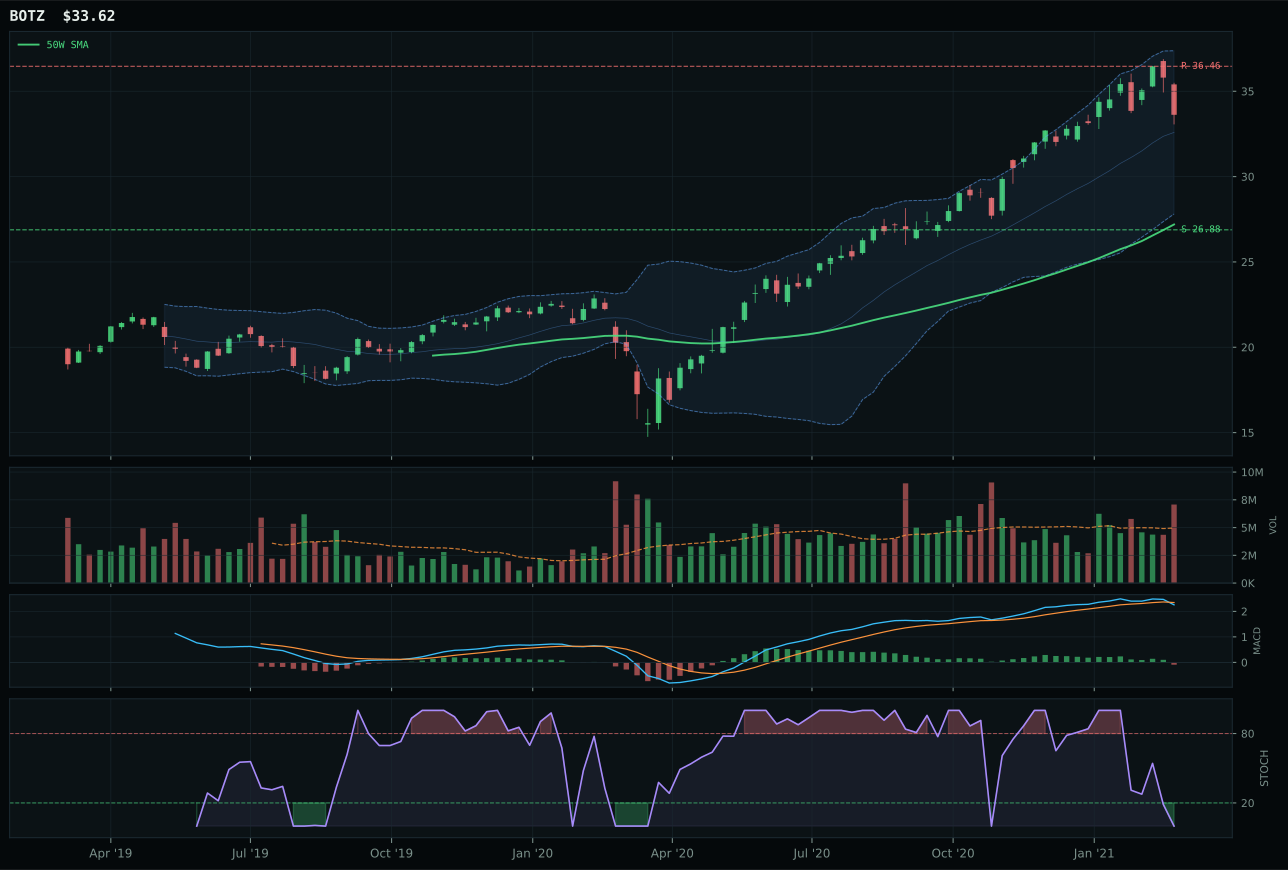
BOTZ has a vertical extension profile with 0.5% 13-week relative strength versus SPY.
A failed hold above support would weaken the setup.
Actionable but governed by invalidation levels.
SMH dominates with a perfect 100.0 momentum score and equally flawless trend score, powered by 16.7% 13W returns, 12.1% SPY outperformance, and a 6.9% category-relative edge that signals true peer leadership. The 36.1% extension above the 50W is punishing on entry risk, yet the magnitude of the moves—37.2% 26W return and 100.0 momentum confirmation—demonstrates this is not a false breakout but rather a genuine accumulation move. AIQ, the runner-up, posted 9.8% 13W returns with only 5.2% SPY outperformance and sits dead at 0.0% category-relative strength, meaning it is merely keeping pace with BOTZ. More damaging to AIQ's case: its MACD is bullish and improving versus SMH's bullish but flattening, yet AIQ trails on structure cleanliness (69.1 vs 69.8) and loses the category-relative strength war entirely. The 21.8-point score gap is decisive, driven by SMH's peer dominance and momentum persistence in a regime where AI growth sponsorship adds 14 macro points.
AI ranks 50.2 and receives 5% despite strong fundamentals: category-level macro fit sits at 76.0, the highest among the 10 categories, yet it still lands in tier-3. The constraint is timing, not conviction. SMH is 36.1% extended with overbought stochastics and risk/reward of only 39.1—every point of upside faces 45.1 points of downside to support at 83.03. The AI category benefits from liquidity expansion, risk appetite, and explicit AI growth sponsorship totaling 24 macro points, but that macro tailwind has already been priced into a technical setup that rewards early accumulators, not late arrivals. Sector allocation would shift sharply higher if SMH could consolidate and base near the 50W, allowing stochastic RSI to work lower and MACD to flatten rather than decline. Until then, 5% honors the macro strength while respecting the timing constraint.
Defense & Aerospace — ITA
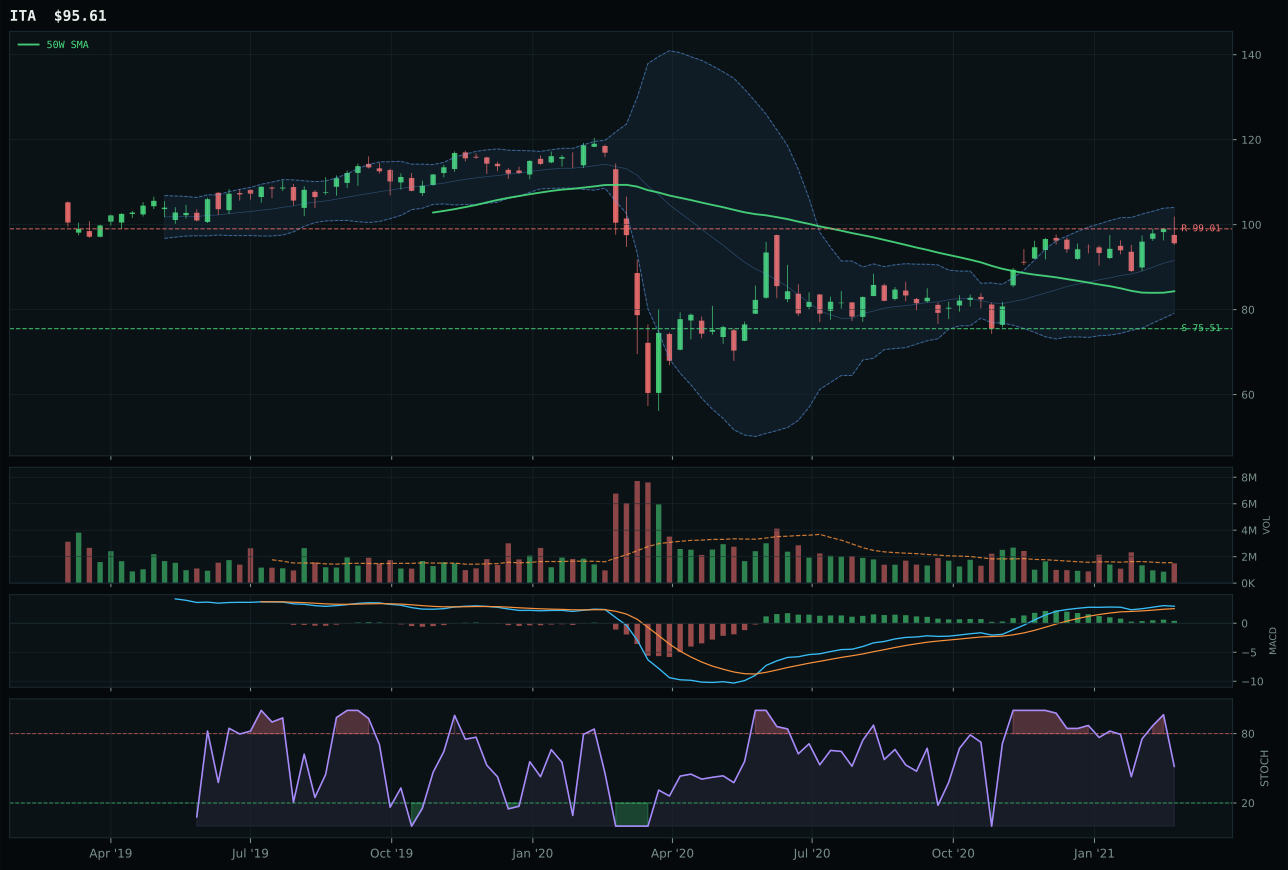
ITA has a neutral structure profile with -3.6% 13-week relative strength versus SPY.
A failed hold above support would weaken the setup.
Actionable but governed by invalidation levels.
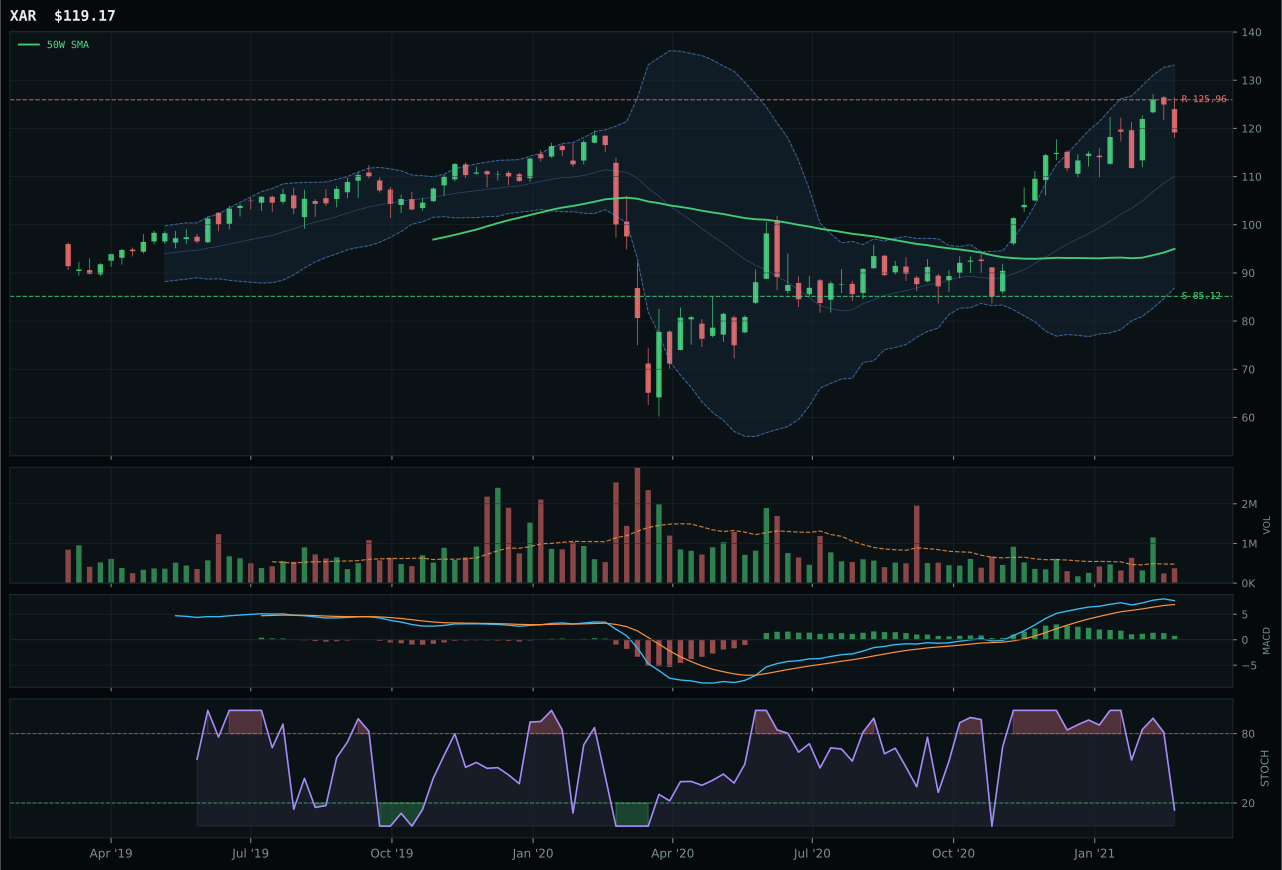
XAR has a vertical extension profile with 4.2% 13-week relative strength versus SPY.
A failed hold above support would weaken the setup.
Actionable but governed by invalidation levels.
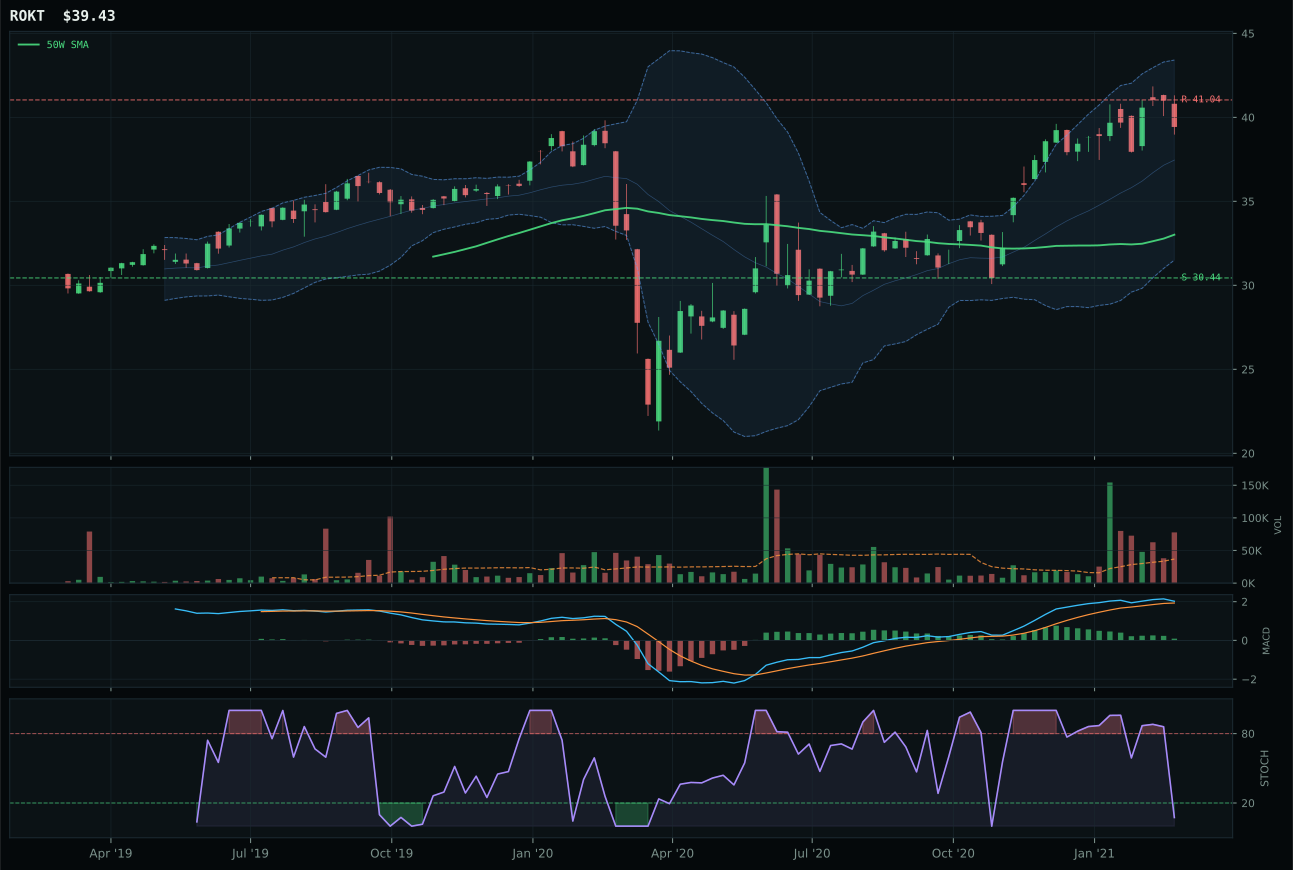
ROKT has a vertical extension profile with 0.7% 13-week relative strength versus SPY.
A failed hold above support would weaken the setup.
Tracked, but not top-2 eligible because: .
ITA captures the category with a decisive timing advantage: 75.0 versus XAR's 48.0, rooted in ITA sitting only 13.4% from the 50W with a neutral volume profile and MACD improving from below zero. The structure divergence is stark—ITA's neutral setup means price has room to work without immediately exhausting, while XAR's vertical extension at 25.4% from the 50W leaves it vulnerable to mean reversion despite higher absolute momentum at 8.8% 13W. ITA's MACD is bullish and improving with stochastic RSI falling into neutral at 0.52, a configuration that speaks to accumulation rather than late-stage buying. The 7.8-point score gap widens because XAR's MACD is bullish but flattening—a warning flag for momentum deceleration—and ITA's timing score compounds by its cleaner support/resistance structure. Both trade at SPY-relative underperformance, but ITA's reserve strength and lack of extension offer a longer runway.
Defense & Aerospace earns 5% with a 49.8 category score, placing it squarely in tier-3 behind energy and emerging markets. The macro case is neutral at 55.0: credit stress adds a modest 2 points while Transition/Mixed adds 3, leaving ITA without the structural macro sponsorship of commodities or energy. This is a tactical, technically-driven allocation rooted in ITA's timing advantage and the fact that no descriptor actively penalizes the setup. Risk appetite remains positive (neutral at -0 for this category) and liquidity expansion applies universally, but defense lacks the scarcity narrative powering metals or the energy security case. ITA would merit upgrade consideration if the macro descriptor 'geopolitical risk premium' activated or if value rotation intensified—both would change the narrative calculus. For now, the 5% represents a hedge position with solid technical footing but limited macro tailwind.
Nuclear Energy — URNM
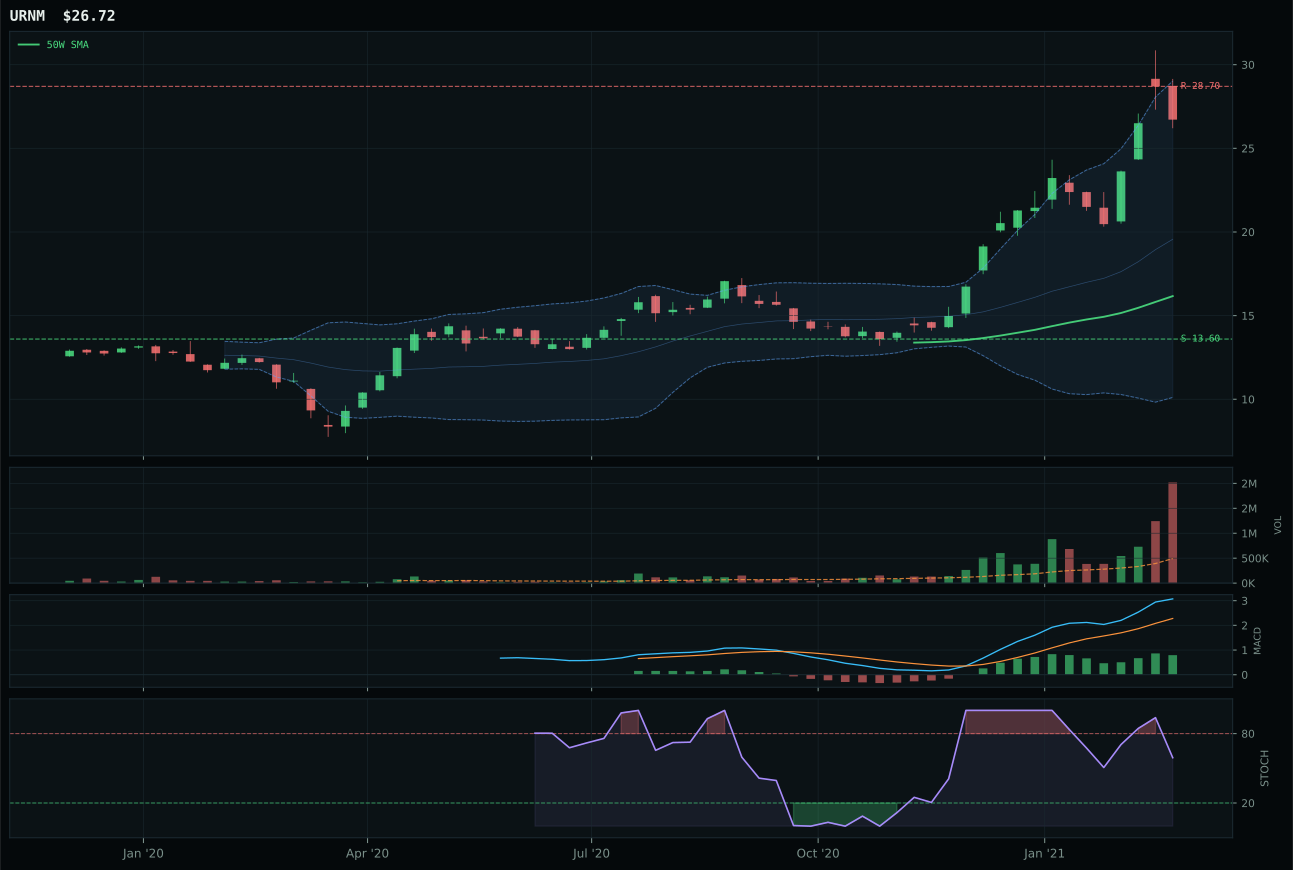
URNM has a vertical extension profile with 73.7% 13-week relative strength versus SPY.
A failed hold above support would weaken the setup.
Actionable but governed by invalidation levels.
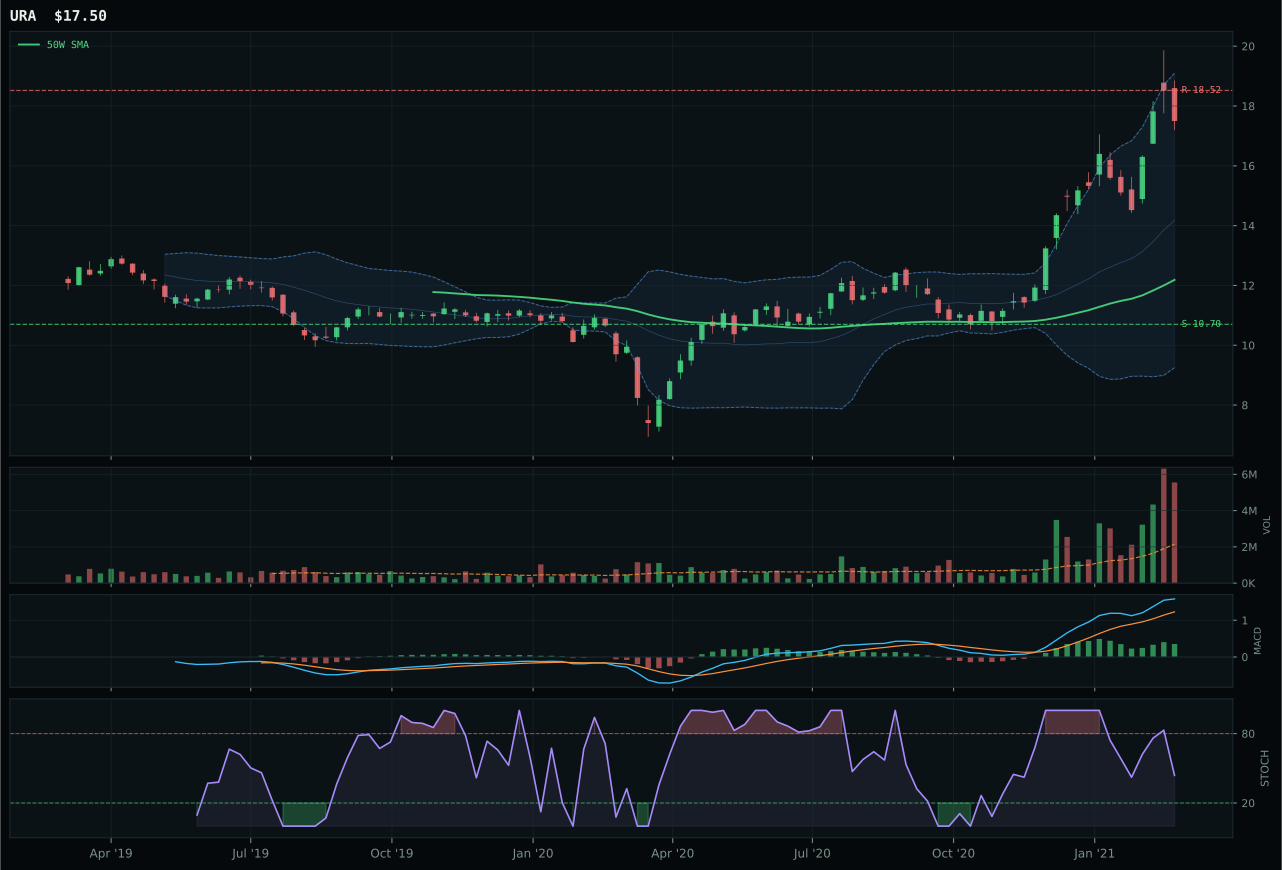
URA has a vertical extension profile with 42.1% 13-week relative strength versus SPY.
A failed hold above support would weaken the setup.
Actionable but governed by invalidation levels.
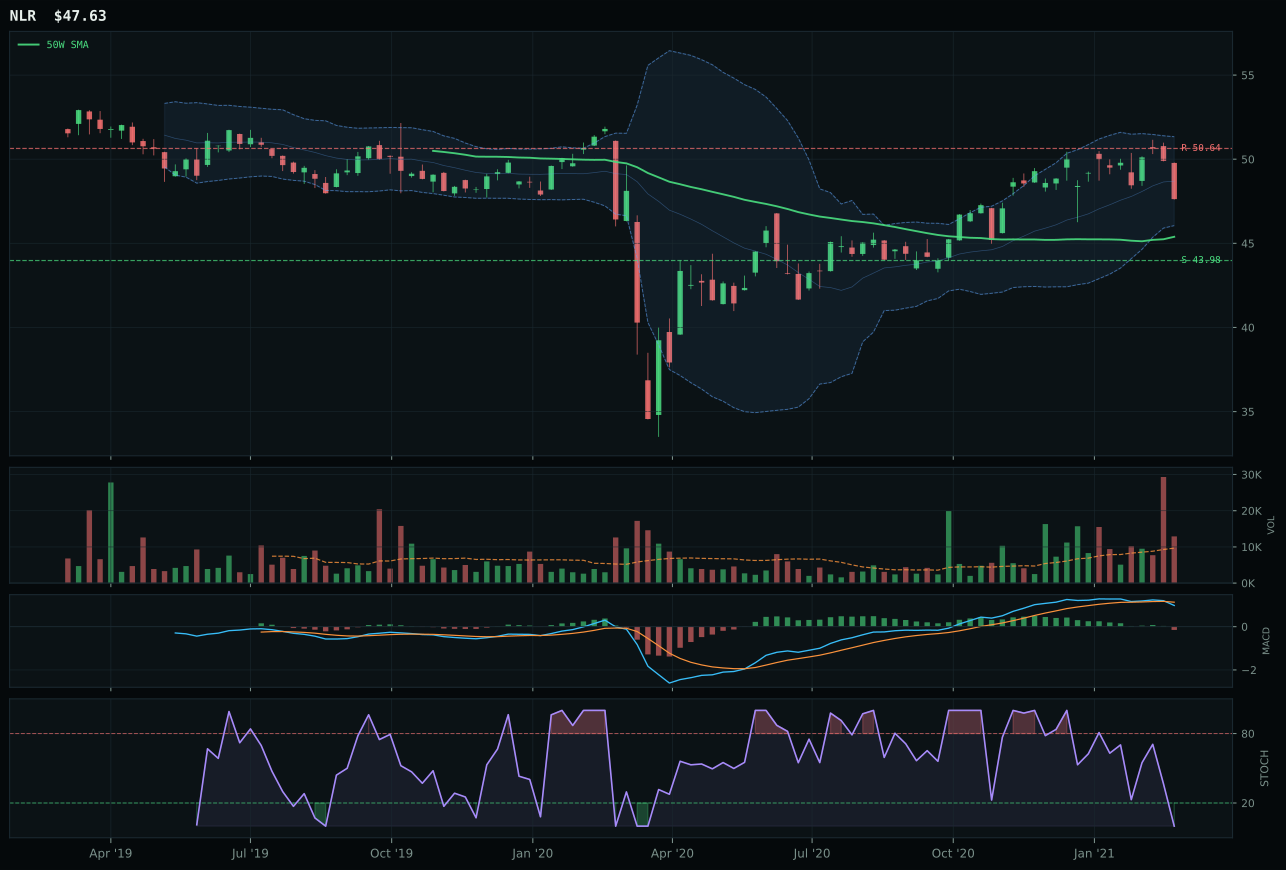
NLR has a neutral structure profile with -8.0% 13-week relative strength versus SPY.
A failed hold above support would weaken the setup.
Tracked, but not top-2 eligible because: .
URNM defeats URA in a tight category despite URA's cleaner 100.0 trend score and 53 composite ranking, because URNM's 31.6% category-relative strength versus URA's 0.0% proves institutional demand concentration. URNM's 78.3% 13W return and 73.7% SPY outperformance are extreme, yet the setup holds because MACD is bullish and improving with falling stochastic RSI at 0.59, signaling active accumulation rather than exhaustion. URA posts 46.7% 13W with 42.1% SPY outperformance—still powerful—but the category-relative flatness indicates its returns are matched by category peers, losing the leadership test. Both sit extended: URNM at 65.2% from the 50W, URA at a less-stretched structure, yet URNM's 100.0 momentum confirmation and 100.0 persistence override the entry-risk penalty. The 12.2-point score gap is driven entirely by URNM's relative strength dominance and momentum persistence, a direct read on which name is attracting fresh capital.
Nuclear earns 5% with 49.1 category score and 69.0 macro fit, placing it in tier-3 despite strong momentum. Energy scarcity at 9 macro points and real asset sponsorship at 7 drive the category macro case, yet credit stress at -5 creates structural headwind. URNM's extreme extension—65.2% above the 50W with only 23.3 risk/reward and 96.4% downside to support—makes this a speculative momentum play rather than a structural allocation. The category would earn tier-2 consideration if URNM consolidated for 2-3 weeks, allowing stochastic RSI to reset below 0.4 and MACD to flatten, proving that accumulation is genuine. Alternatively, if energy scarcity escalates into a true supply crisis (storage constraints, geopolitical disruption), the macro case would strengthen. For now, 5% captures leveraged uranium beta without over-committing to an extended setup in a lower-conviction macro regime.
Technology — IGV
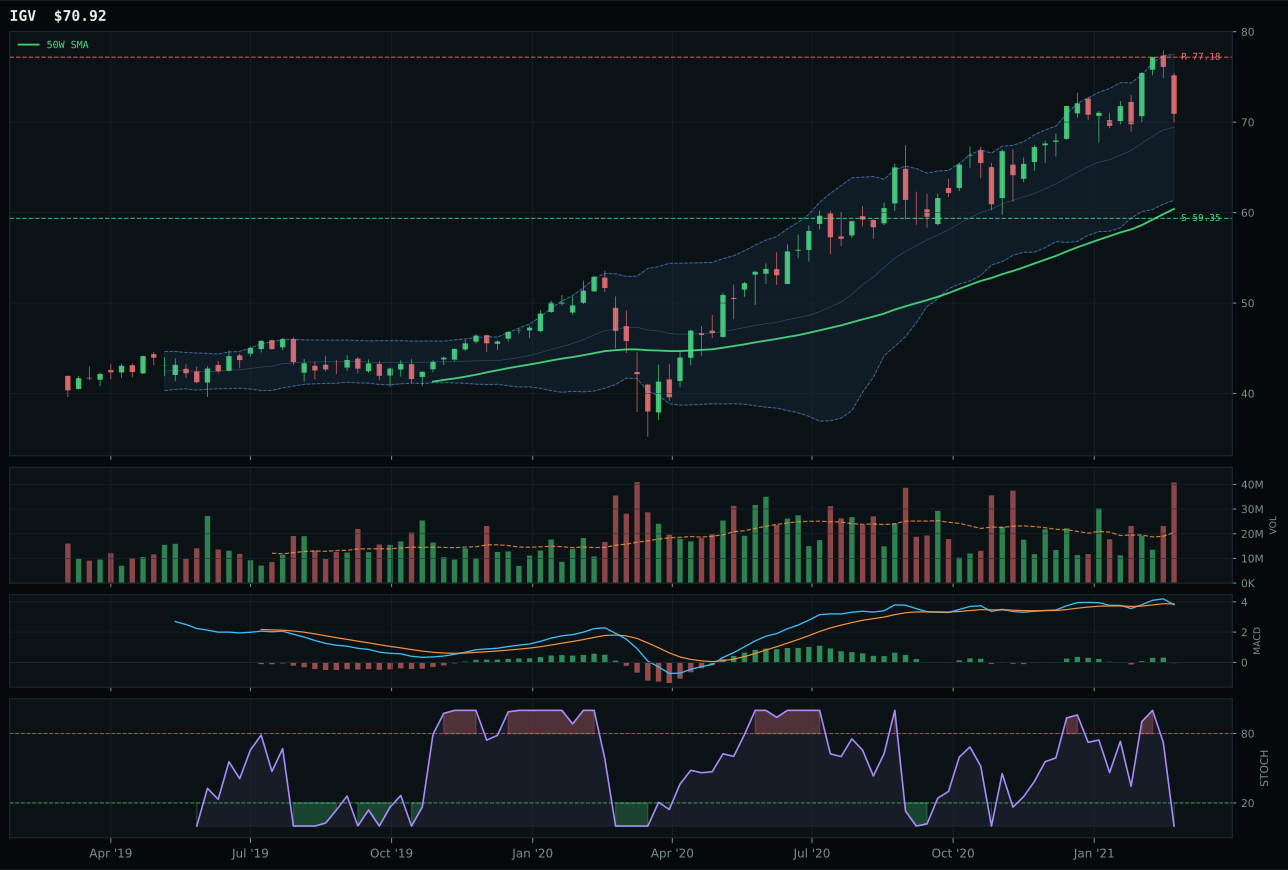
IGV has a vertical extension profile with 0.9% 13-week relative strength versus SPY.
A failed hold above support would weaken the setup.
Actionable but governed by invalidation levels.
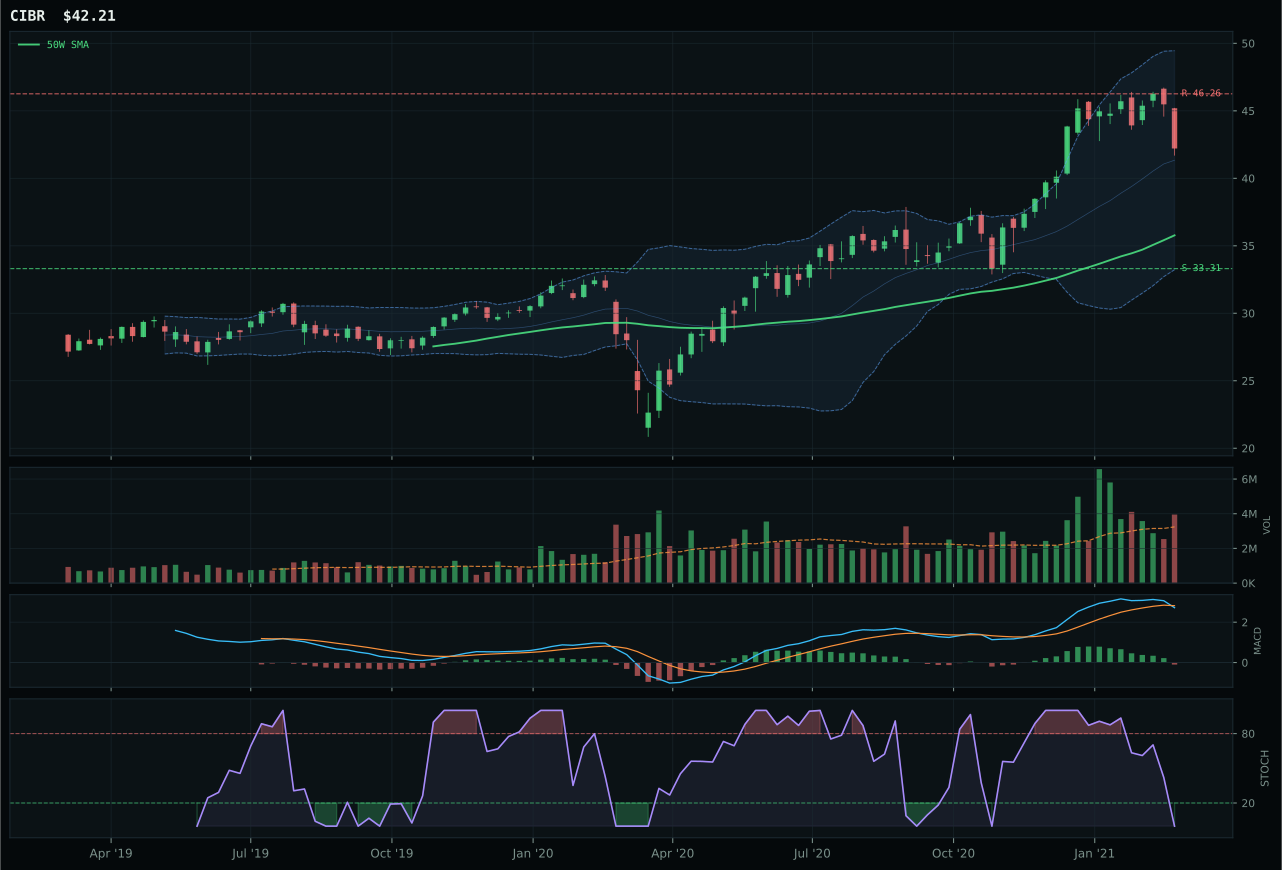
CIBR has a vertical extension profile with 5.1% 13-week relative strength versus SPY.
A failed hold above support would weaken the setup.
Actionable but governed by invalidation levels.
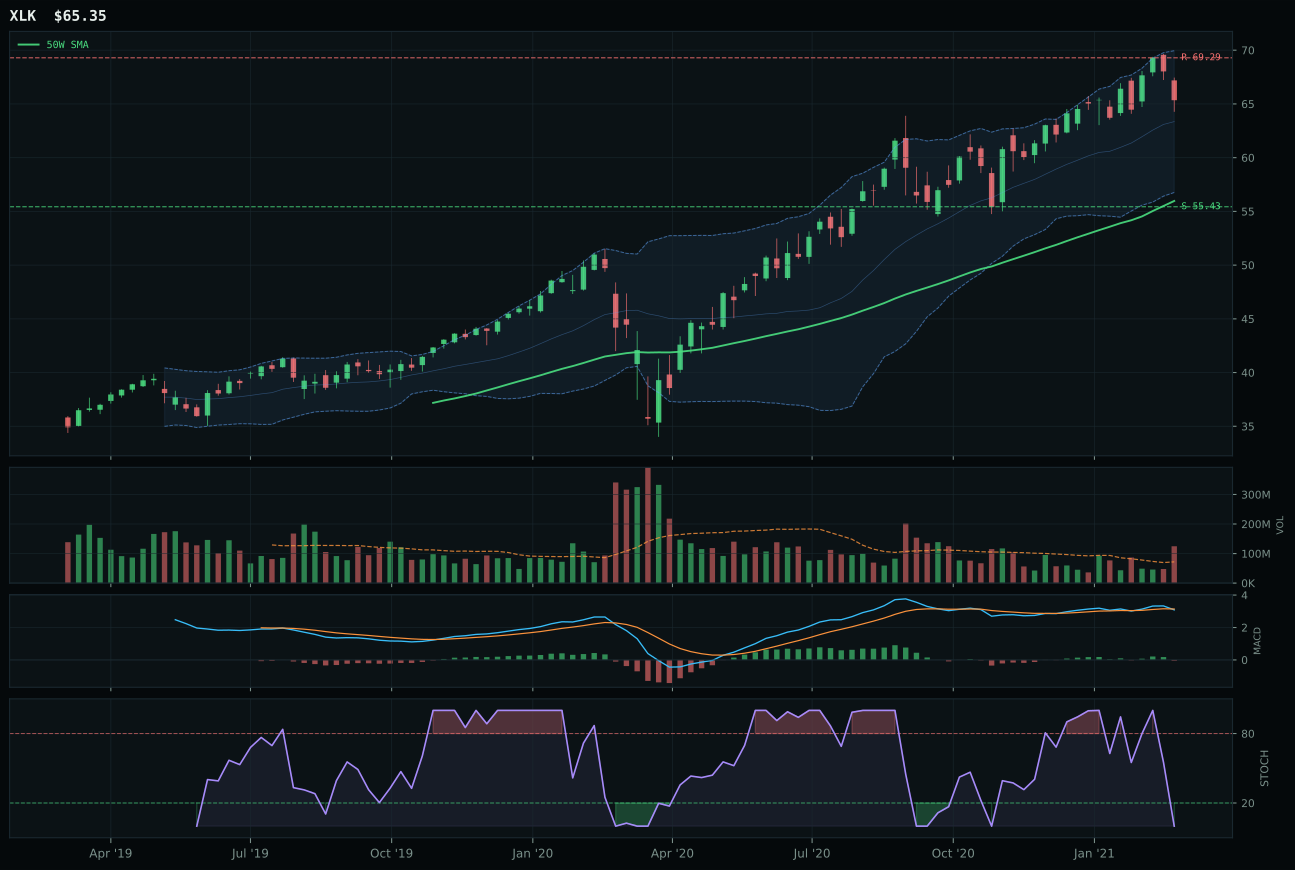
XLK has a vertical extension profile with 2.0% 13-week relative strength versus SPY.
A failed hold above support would weaken the setup.
Actionable but governed by invalidation levels.
IGV wins the category with a 94.3 trend score rooted in clean price action above both the 50W and 200W, paired with a measured 1.0% 50W slope that signals durability rather than exhaustion. The runner-up CIBR scored higher on absolute momentum—9.7% 13W return versus IGV's 5.5%—but its timing disadvantage proved decisive: CIBR's MACD is bearish and weakening while IGV's is bearish but improving, a critical distinction when both setups sit in the upper retracement zone. Volume distribution pressure hits both names, but IGV's 17.4% extension from the 50W versus CIBR's stronger 5.1% relative strength versus SPY presents the classic risk-reward tension: IGV is technically healthier on trajectory, CIBR offers cheaper entry. The category-relative strength divergence of -1.1% for IGV versus 3.1% for CIBR narrows the gap, but timing score of 53.0 versus 48.0 tilts the decision toward the more prudent technical setup.
Technology earns a 5% allocation despite scoring only 43.3, ranking it below seven other categories in the current portfolio construction. The macro regime—Transition / Mixed with active liquidity expansion and risk appetite support—should theoretically favor duration-sensitive growth, yet the category's 63.0 macro fit score masks a fundamental timing problem: both leading ETFs sit extended from their 50W, leaving new money vulnerable. Credit stress bleeding -7 points from the category macro score creates a structural headwind that technical strength alone cannot overcome. For Technology to graduate to tier-2 or higher allocation, the setup would need to reset into cleaner support structures with MACD confirmation across the basket, or macro conditions would need to shift decisively away from credit tightening. The 5% sleeve holds exposure to the narrative, but it is a defensive position within a stronger macro regime.
Utilities & Infrastructure — PAVE
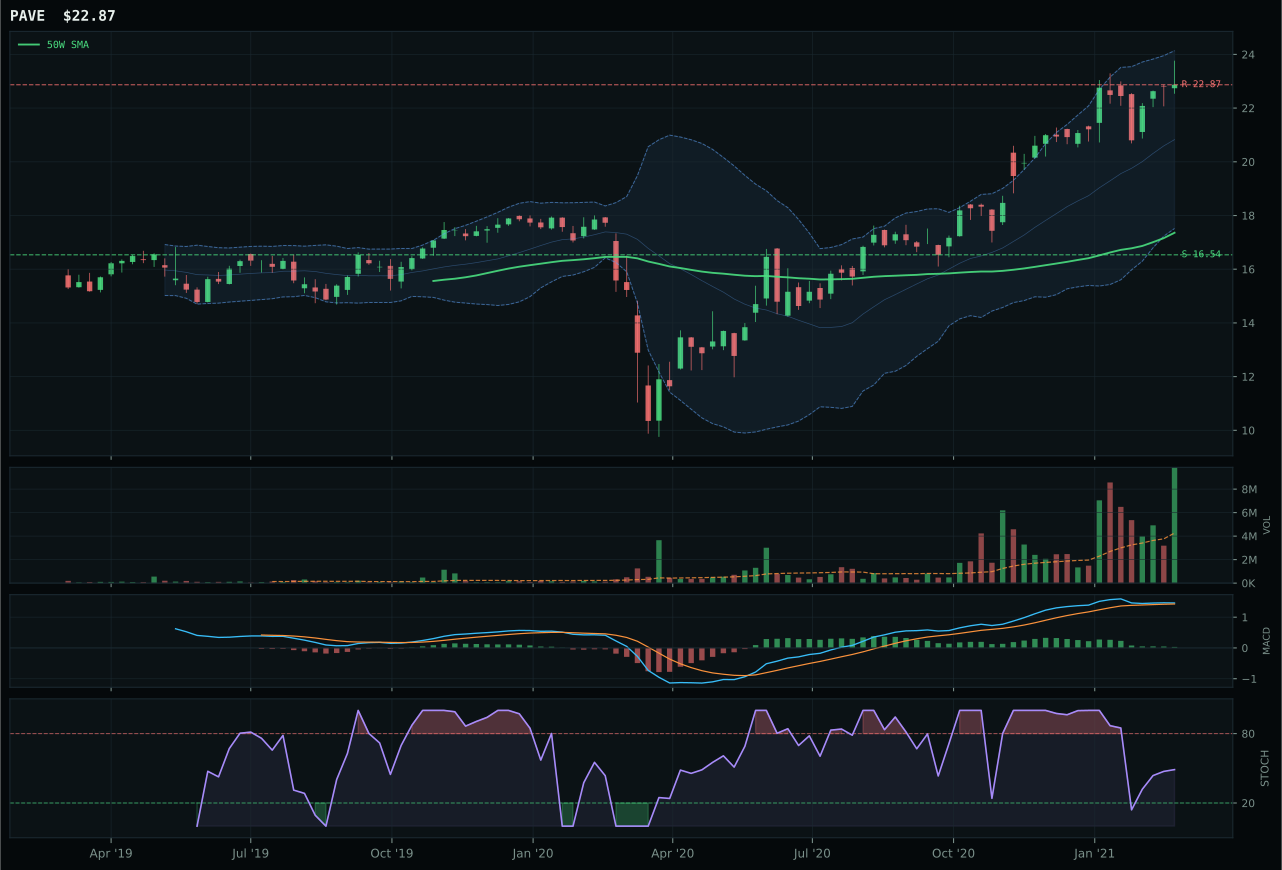
PAVE has a vertical extension profile with 6.4% 13-week relative strength versus SPY.
A failed hold above support would weaken the setup.
Actionable but governed by invalidation levels.
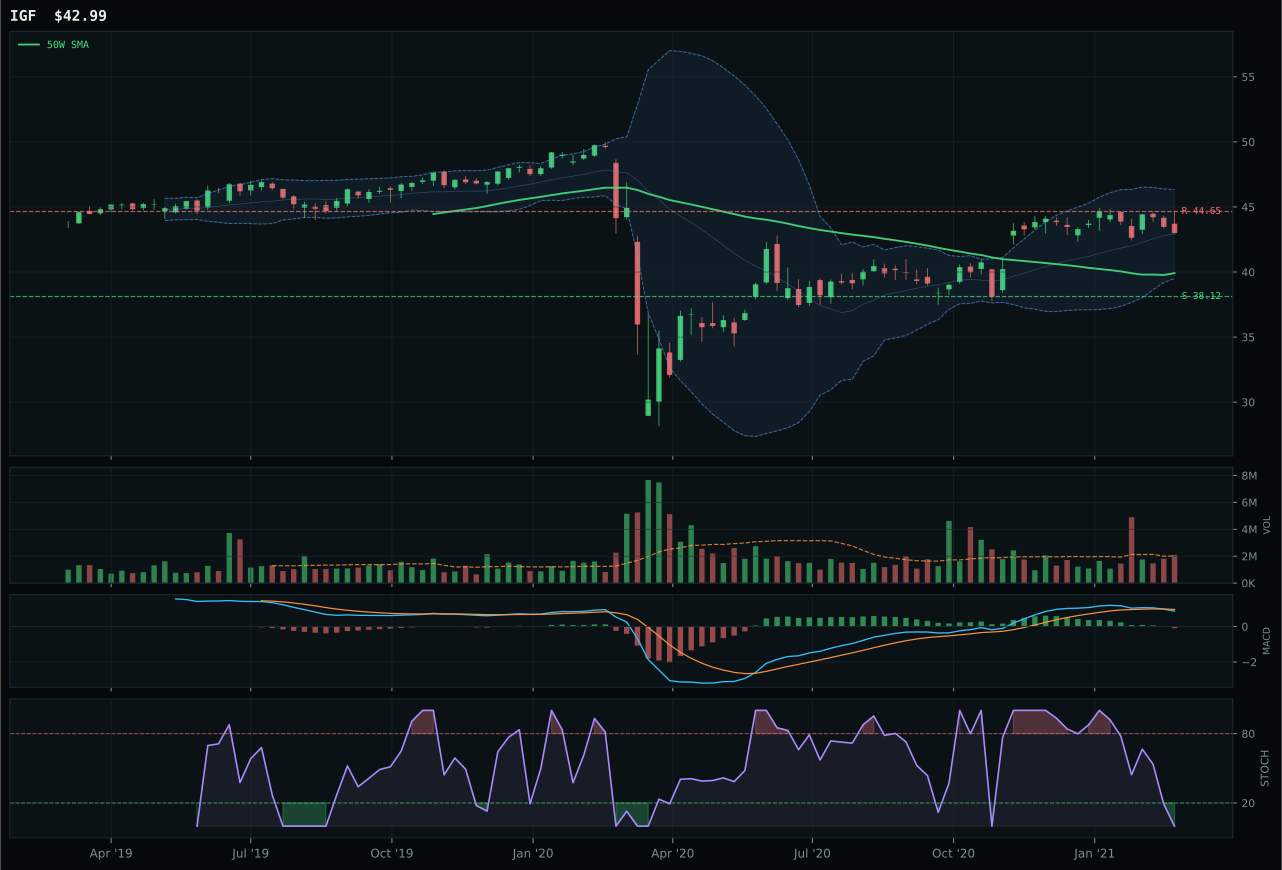
IGF has a neutral structure profile with -6.5% 13-week relative strength versus SPY.
A failed hold above support would weaken the setup.
Actionable but governed by invalidation levels.
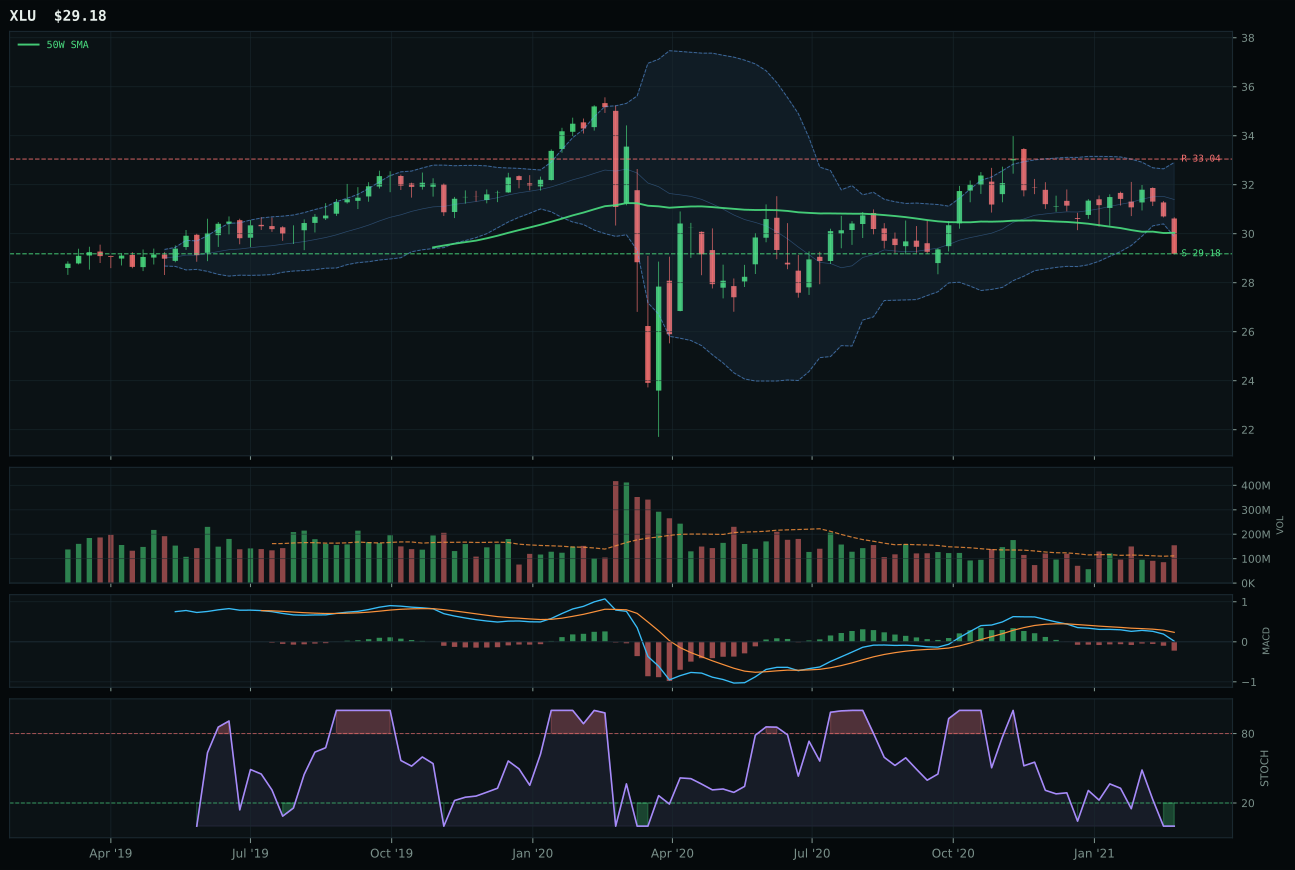
XLU has a pullback into support profile with -13.1% 13-week relative strength versus SPY.
A failed hold above support would weaken the setup.
Actionable but governed by invalidation levels.
PAVE dominates with 100.0 trend and momentum scores, delivering 11.0% 13W returns with 6.4% SPY outperformance and 13.0% category-relative strength that dwarfs IGF's 0.0% and XLU's -8.5%. The setup is pristine: bullish-but-flattening MACD paired with stochastic RSI rising through mid-zone at 0.49 and accumulation-level volume at 2.72x the 20W average. PAVE's 91.0 volume-price confirmation and 86.8 persistence are the highest scores in the basket, signaling that institutional accumulation is genuine and sustained. IGF and XLU both post bearish-weakening MACD and oversold stochastic, placing them in pullback-into-support postures lacking peer leadership. The 13.0-point gap versus IGF reflects PAVE's momentum dominance and superior volume sponsorship. Despite 31.8% extension from the 50W, PAVE's accumulation-level volume and improving stochastic behavior suggest that price acceleration is continuing rather than reversing.
Utilities & Infrastructure earns 0% allocation, ranking 9th or 10th and excluded entirely. PAVE's impressive 66 technical composite cannot overcome a category macro fit of only 46.0, the third-worst in the portfolio. Inflation pressure actively subtracts -6 points because utilities and infrastructure are rate-sensitive and benefit from disinflationary regimes. Risk appetite positive subtracts -2 from the category, a direct signal that the AltSeason regime favors risk assets and real-asset diversification over defensives. The category macro is structurally opposed to the current regime. PAVE would immediately become a candidate for allocation if inflation rolls over, credit stress activates (currently neutral), or risk appetite reverses to neutral/negative. Under current conditions, Utilities is excluded because it represents defensive positioning in a regime that rewards risk-taking and real-asset allocation. The 0% is a regime call, not a technical judgment on PAVE's strength.
Precious Metals — SLV
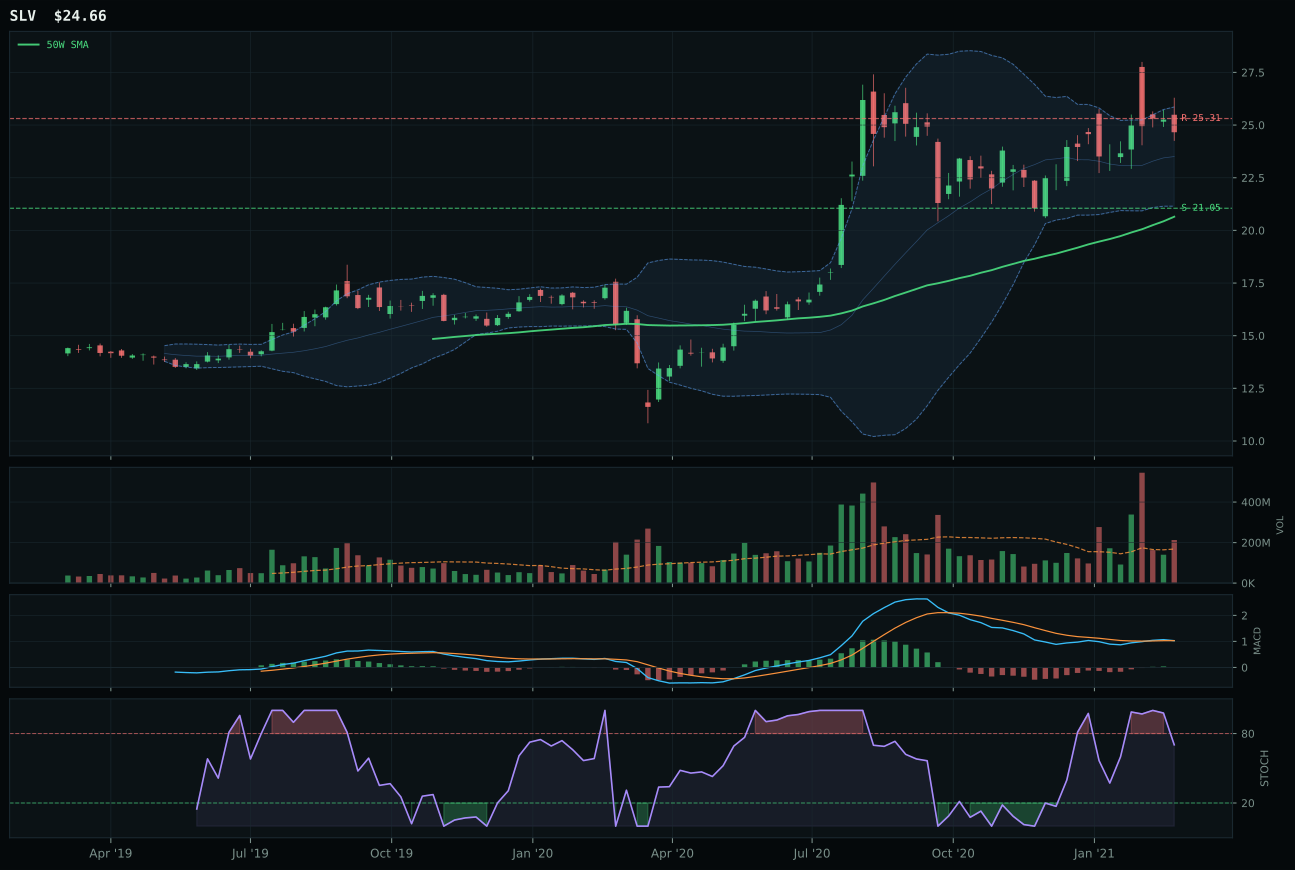
SLV has a vertical extension profile with 12.6% 13-week relative strength versus SPY.
A failed hold above support would weaken the setup.
Actionable but governed by invalidation levels.
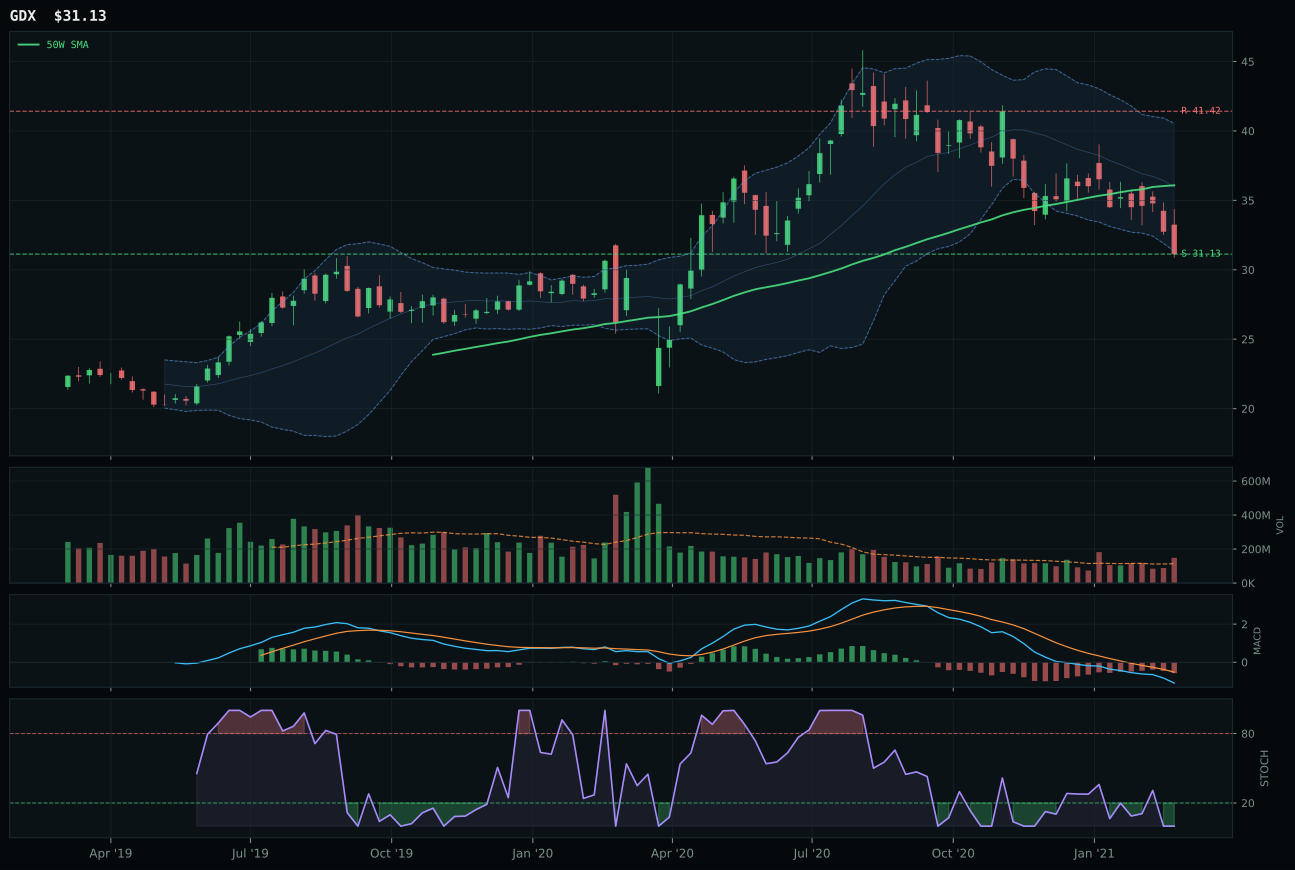
GDX has a pullback into support profile with -13.6% 13-week relative strength versus SPY.
A failed hold above support would weaken the setup.
Actionable but governed by invalidation levels.
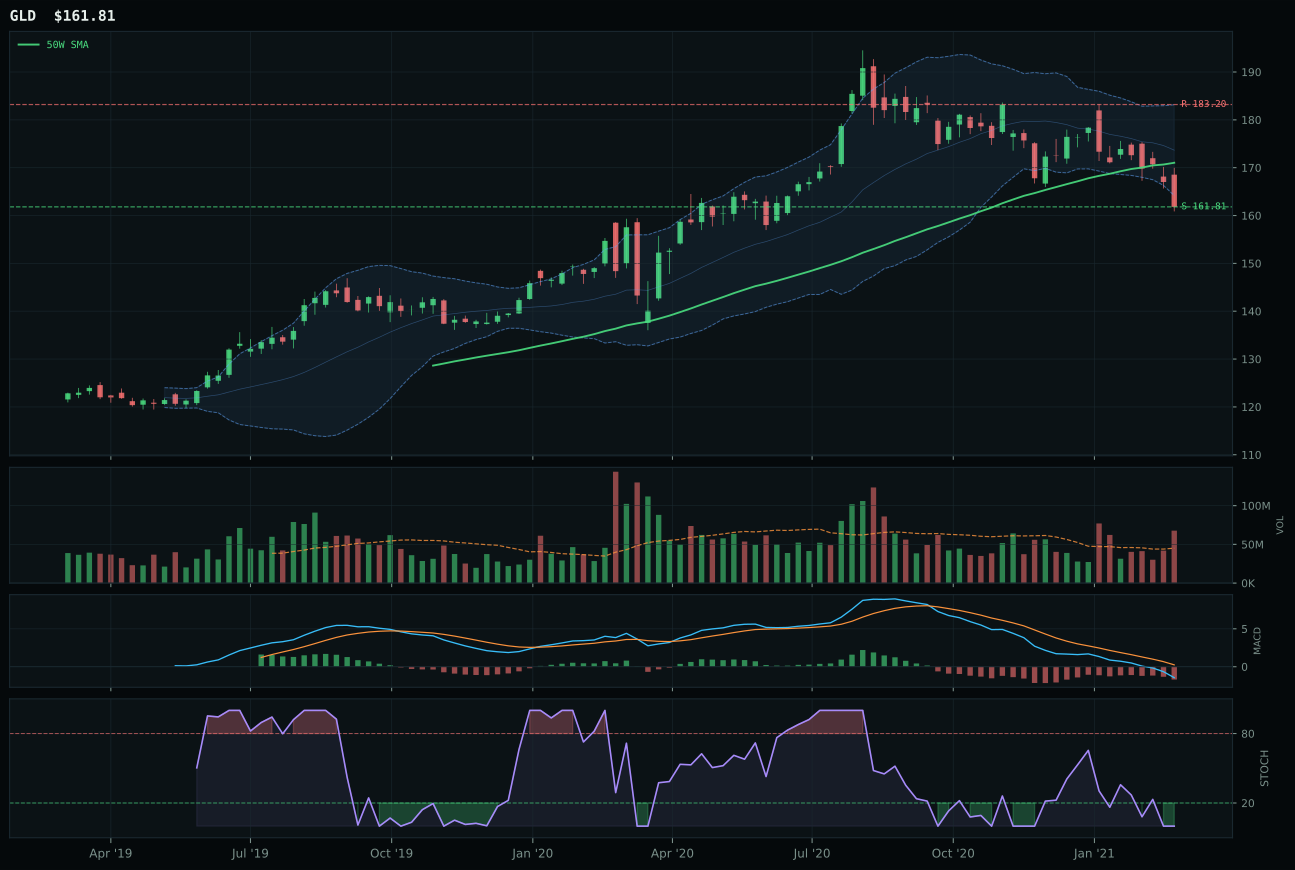
GLD has a pullback into support profile with -8.2% 13-week relative strength versus SPY.
A failed hold above support would weaken the setup.
Actionable but governed by invalidation levels.
SLV dominates with 100.0 momentum confirmation and 100.0 trend, posting 17.1% 13W returns and 12.6% SPY outperformance alongside 20.7% category-relative strength that dwarfs GDX's -5.5% underperformance. The structure is clean: vertical extension with bullish-and-improving MACD and falling stochastic RSI at 0.70, a configuration that shows strong hands still accumulating. GDX is in structural collapse—bearish/weakening MACD, oversold stochastic, and -13.6% SPY underperformance—placing it in pullback-into-support mode rather than leadership. The 33.5-point score gap reflects SLV's absolute dominance in momentum, structure, and relative strength. GDX's only advantage is theoretical: its risk/reward of 98 offers massive downside cushion to support at 31.13, but that only matters if gold bottoms and miners stabilize. SLV is where the money is flowing.
Precious Metals earns 0% allocation this week despite SLV's 74 composite score and 91.2 technical evidence. The category scores only 30.2 and ranks 9th or 10th, excluded entirely from the portfolio. The core problem: macro fit sits at 44.0, the weakest in the 10-category set, because risk appetite positive—a dominant regime descriptor—actively subtracts 4 points and liquidity expansion subtracts 2. The AltSeason regime is rotating away from safe-haven hedges and toward risk assets and real asset diversification. SLV's near-perfect technical score matters less when macro conditions are working against the entire narrative. To earn allocation, Precious Metals would need either a material shift in credit stress (currently neutral) or explicit risk-off signals that activate flight-to-safety buying. Under the current regime, SLV is a tactical short-term trade, not a strategic portfolio component.