
2021-02-19
Informational purposes only. The content in this report, including allocations, analysis, and commentary, is provided solely for informational and educational purposes. It does not constitute financial advice, investment advice, trading advice, or any other type of advice. Past performance does not guarantee future results. Always conduct your own research and consult a qualified financial professional before making investment decisions.
Some tracked tickers were excluded due to missing live weekly price data: SGOV: Historical cache SGOV has only 38 usable weekly bars
Weekly Allocation
| Ticker | Category | Weight | Role |
|---|---|---|---|
| FSOL | 50% | Overlay | |
| COPX | Industrial Metals | 10% | Top-2 (10%) |
| XLE | Traditional Energy | 10% | Top-2 (10%) |
| MOO | Agriculture & Livestock | 5% | Tier-2 (5%) |
| IGV | Technology | 5% | Tier-2 (5%) |
| IEMG | Emerging Markets | 5% | Tier-2 (5%) |
| SMH | AI | 5% | Tier-2 (5%) |
| ITA | Defense & Aerospace | 5% | Tier-2 (5%) |
| PAVE | Utilities & Infrastructure | 5% | Tier-2 (5%) |
Trade Instructions — Monday Open
Sell the tranche from 2021-01-22 (completing its 4-week hold). Buy the new tranche. Instructions show net portfolio changes — same-asset positions cancel, weight changes show the delta.
| Action | Ticker | Instruction |
|---|---|---|
| SELL | XOP | Sell 33% of XOP position (reduce 7.50% → 5.00%) |
| SELL | XLK | Sell 50% of XLK position (reduce 2.50% → 1.25%) |
| SELL | XAR | Sell 33% of XAR position (reduce 3.75% → 2.50%) |
| SELL | URA | Sell entire URA position (1.25% of portfolio) |
| BUY | IGV | Buy IGV — 20.00% of freed cash (adds 1.25% to portfolio) |
| BUY | ITA | Buy ITA — 20.00% of freed cash (adds 1.25% to portfolio) |
| BUY | XLE | Buy XLE — 40.00% of freed cash (adds 2.50% to portfolio) |
| BUY | PAVE | Buy PAVE — 20.00% of freed cash (adds 1.25% to portfolio) |
Current Portfolio After Trade
Combined holdings across all 4 active tranches. Each tranche is 25% of the portfolio.
| Ticker | % of Portfolio | Weight Bar |
|---|---|---|
| FSOL | 50.00% | |
| COPX | 6.25% | |
| IEMG | 6.25% | |
| XOP | 5.00% | |
| SMH | 5.00% | |
| MOO | 5.00% | |
| XLU | 3.75% | |
| IGV | 3.75% | |
| XAR | 2.50% | |
| FCG | 2.50% | |
| ITA | 2.50% | |
| REMX | 2.50% | |
| XLE | 2.50% | |
| XLK | 1.25% | |
| PAVE | 1.25% |
Macro Regime — Transition / Mixed
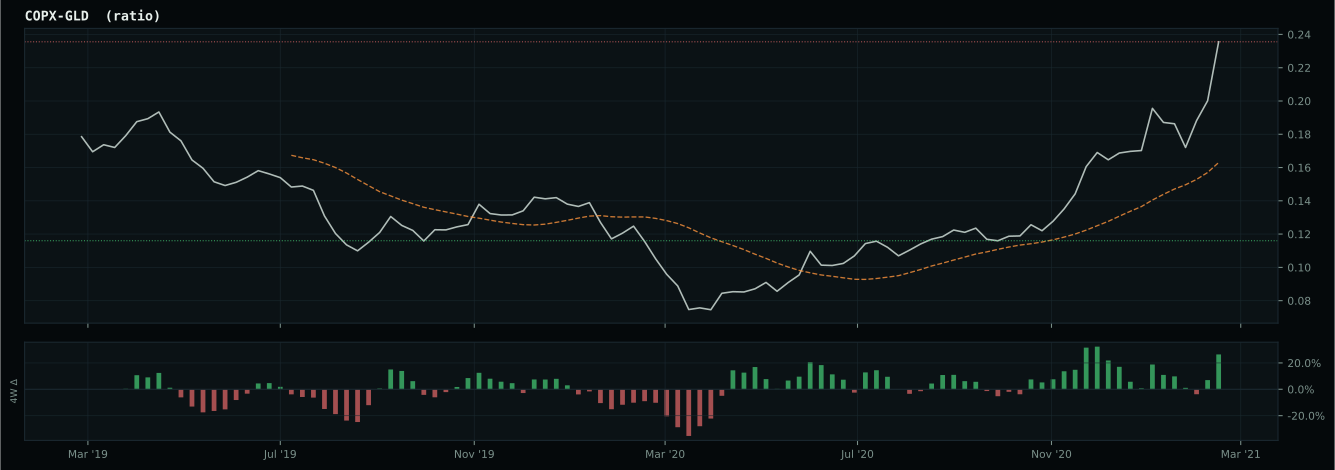
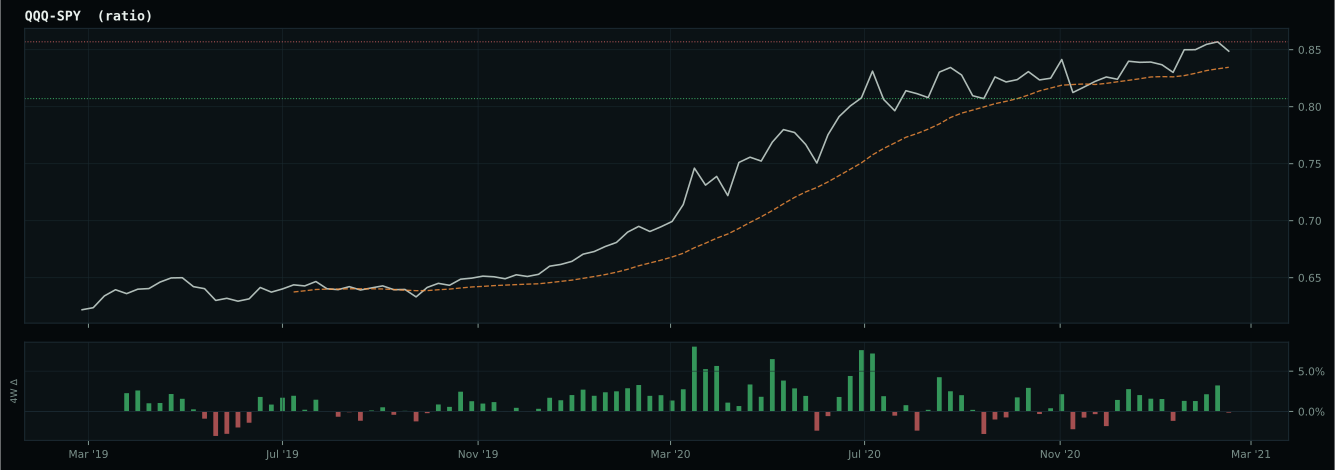
Macro Evidence Charts
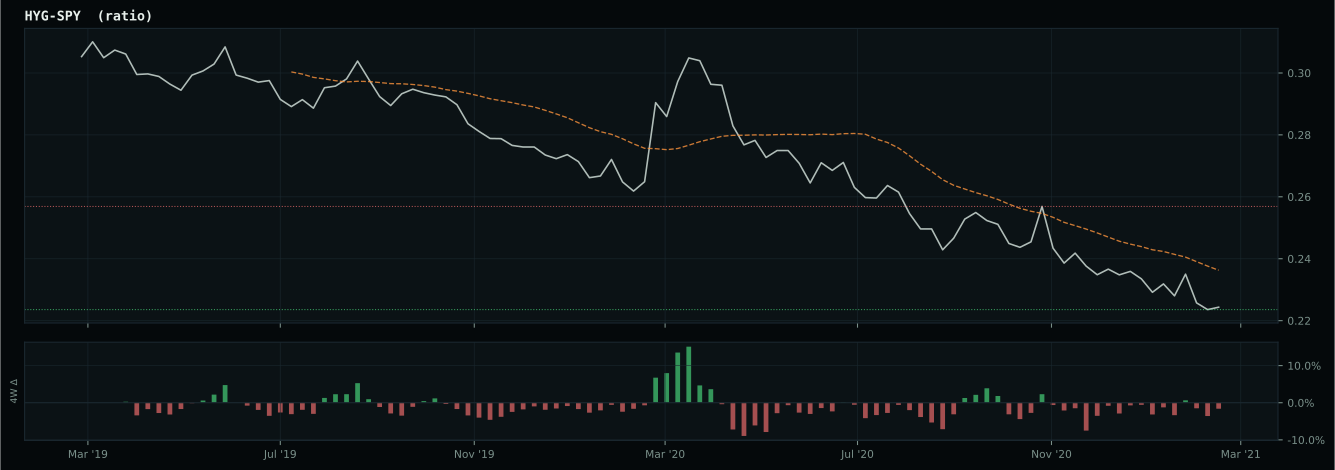
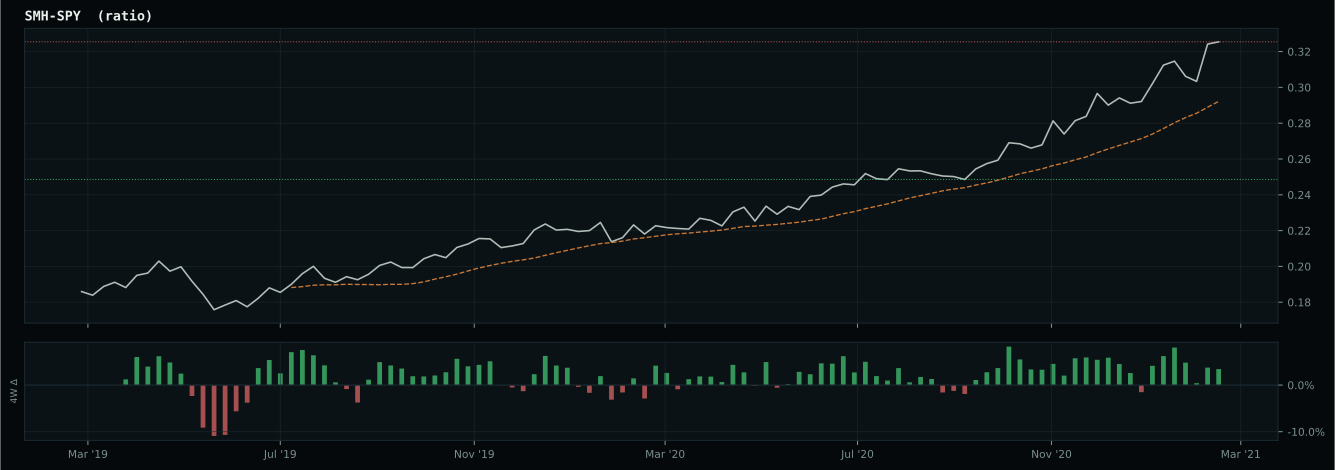
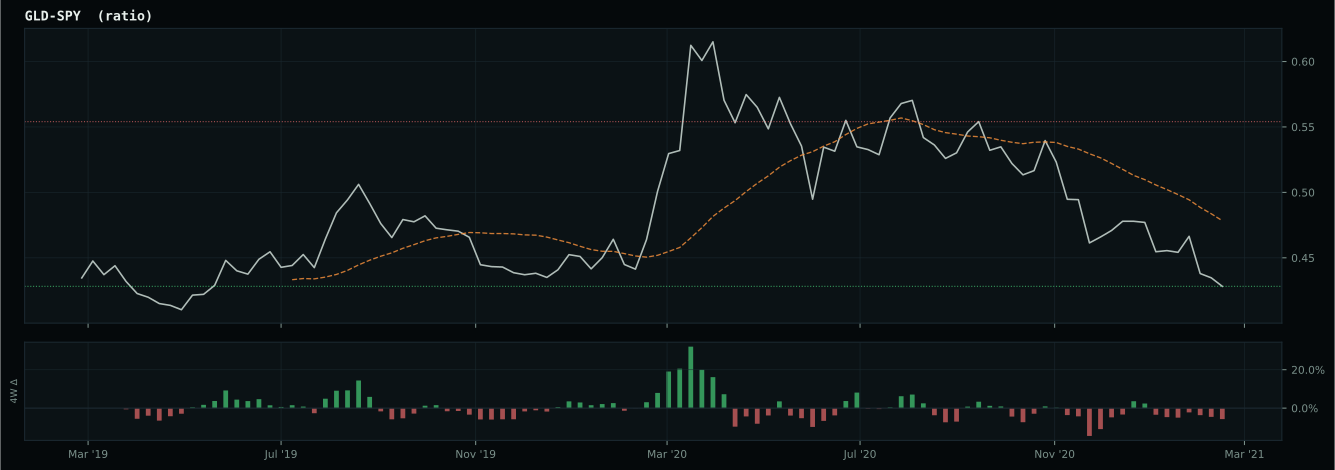
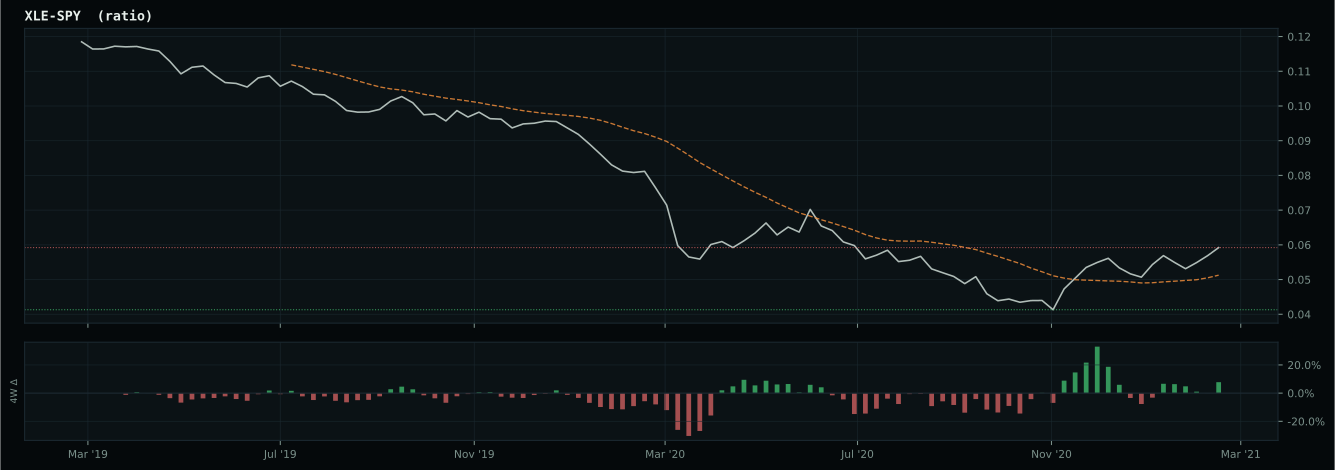
Market-implied signals behind the macro regime scores. Each ratio compares two assets; the direction and slope of the ratio is what the macro engine reads.
Crypto Regime — AltSeason
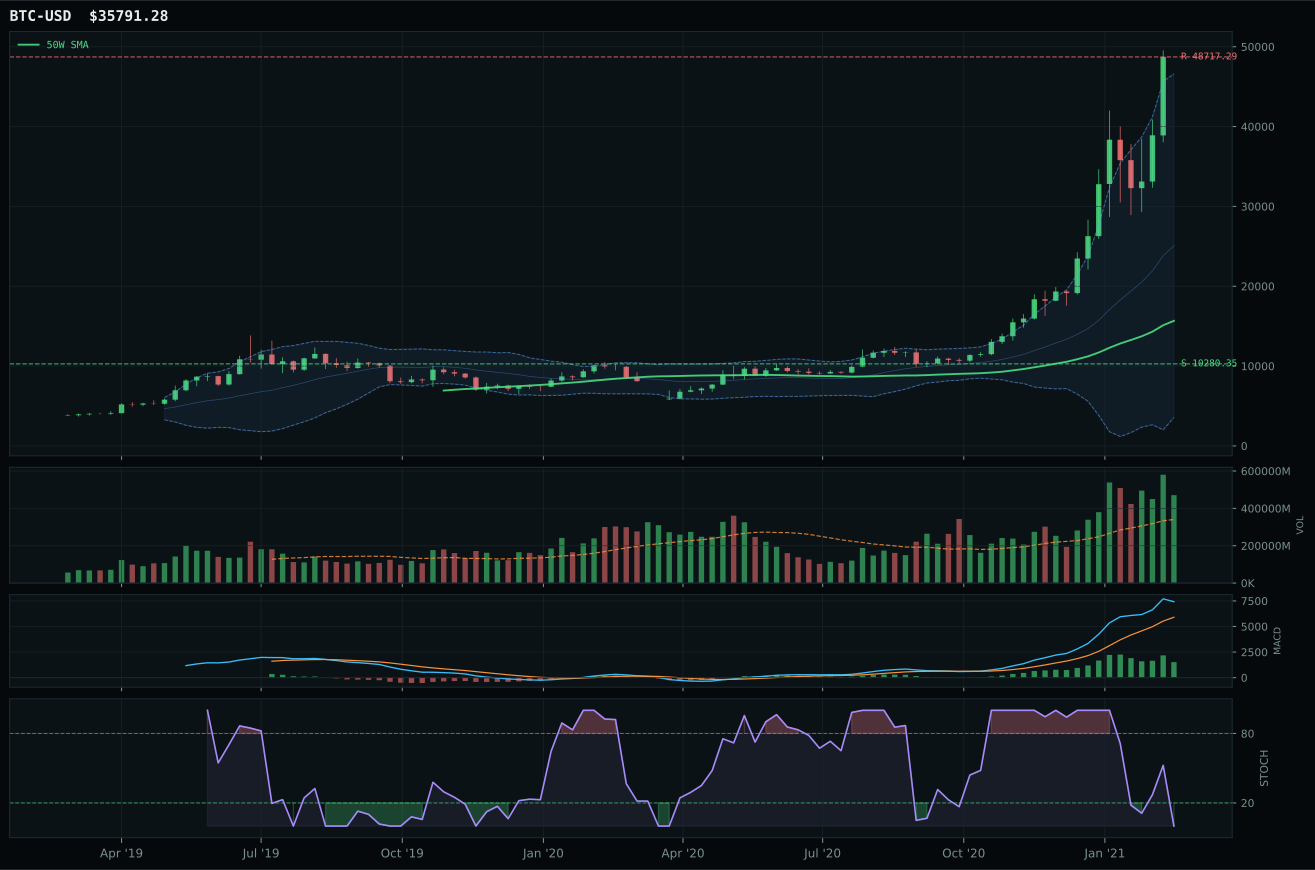
post-touch structure is too wide to count as a range; max/min close ratio is 9.03
TrendBTC confirmed: 2 consecutive closes above rising/flat 50W SMA
all available AltSeason conditions pass; missing optional confirmations skipped

Category Rankings
| Rank | Category | Winner | Score | Alloc | 4W Ret | Peers (4W) |
|---|---|---|---|---|---|---|
| 1 | Industrial Metals | COPX | 86.1 | 20% | -11.34% | REMX -16.1% · PICK -4.0% |
| 2 | Traditional Energy | XLE | 75.5 | 20% | +5.18% | XOP +6.8% · FCG +10.9% |
| 3 | Agriculture & Livestock | MOO | 72.3 | 10% | +2.16% | WEAT -4.8% · VEGI +4.0% |
| 4 | Technology | IGV | 62.4 | 10% | -8.40% | CIBR -7.2% · XLK -3.2% |
| 5 | Emerging Markets | IEMG | 61.5 | 10% | -3.74% | INDA +1.6% · ILF +1.6% |
| 6 | AI | SMH | 53.9 | 10% | -5.47% | AIQ -4.8% · BOTZ -6.1% |
| 7 | Defense & Aerospace | ITA | 49.7 | 10% | +6.59% | XAR +0.7% · ROKT -1.5% |
| 8 | Utilities & Infrastructure | PAVE | 41.4 | 10% | +7.78% | IGF +1.9% · XLU +0.6% |
| 9 | Nuclear Energy | URA | 39.6 | 0% | +6.40% | URNM +5.9% · NLR +5.2% |
| 10 | Precious Metals | SLV | 39.2 | 0% | -6.67% | GLD -3.7% · GDX +0.9% |
Industrial Metals — COPX
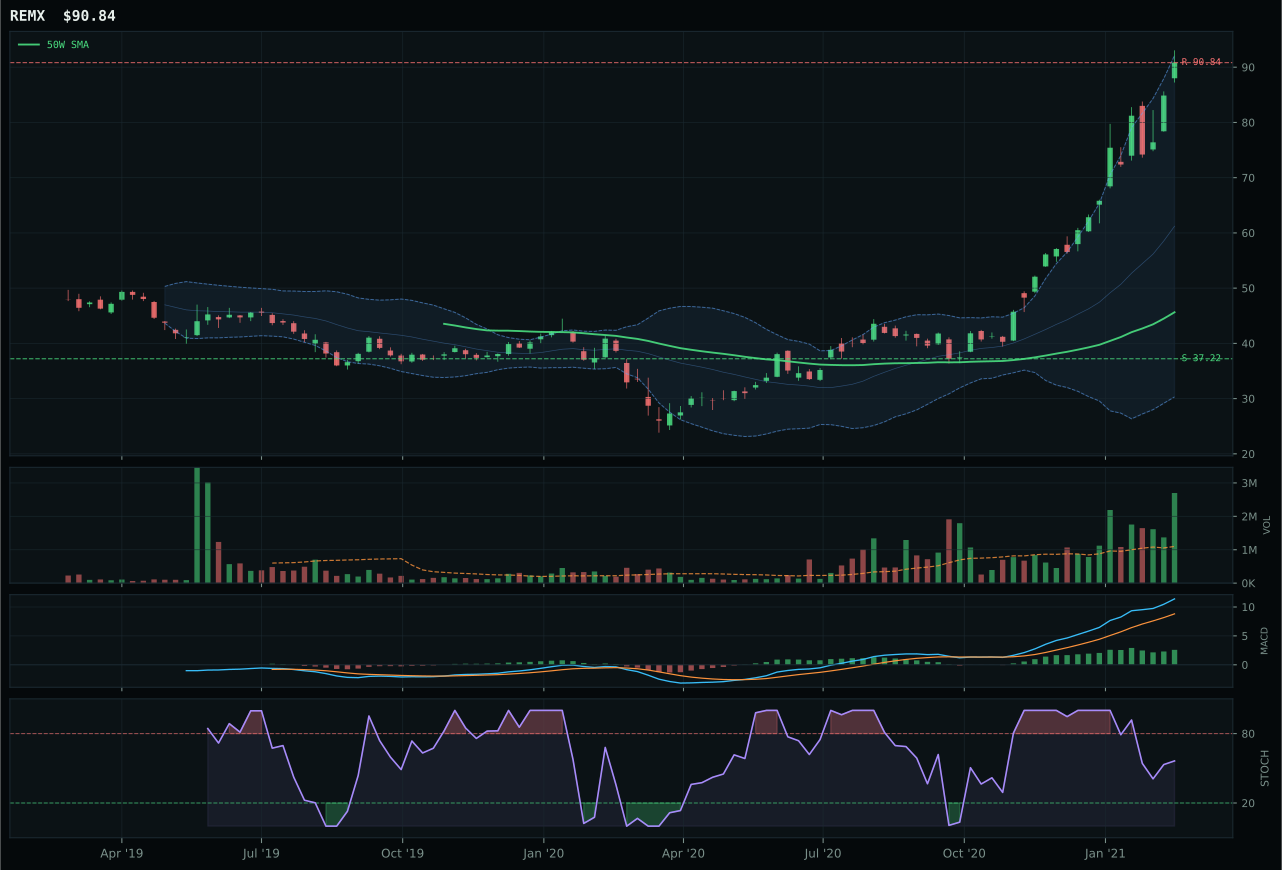
REMX has a vertical extension profile with 64.7% 13-week relative strength versus SPY.
A failed hold above support would weaken the setup.
Actionable but governed by invalidation levels.
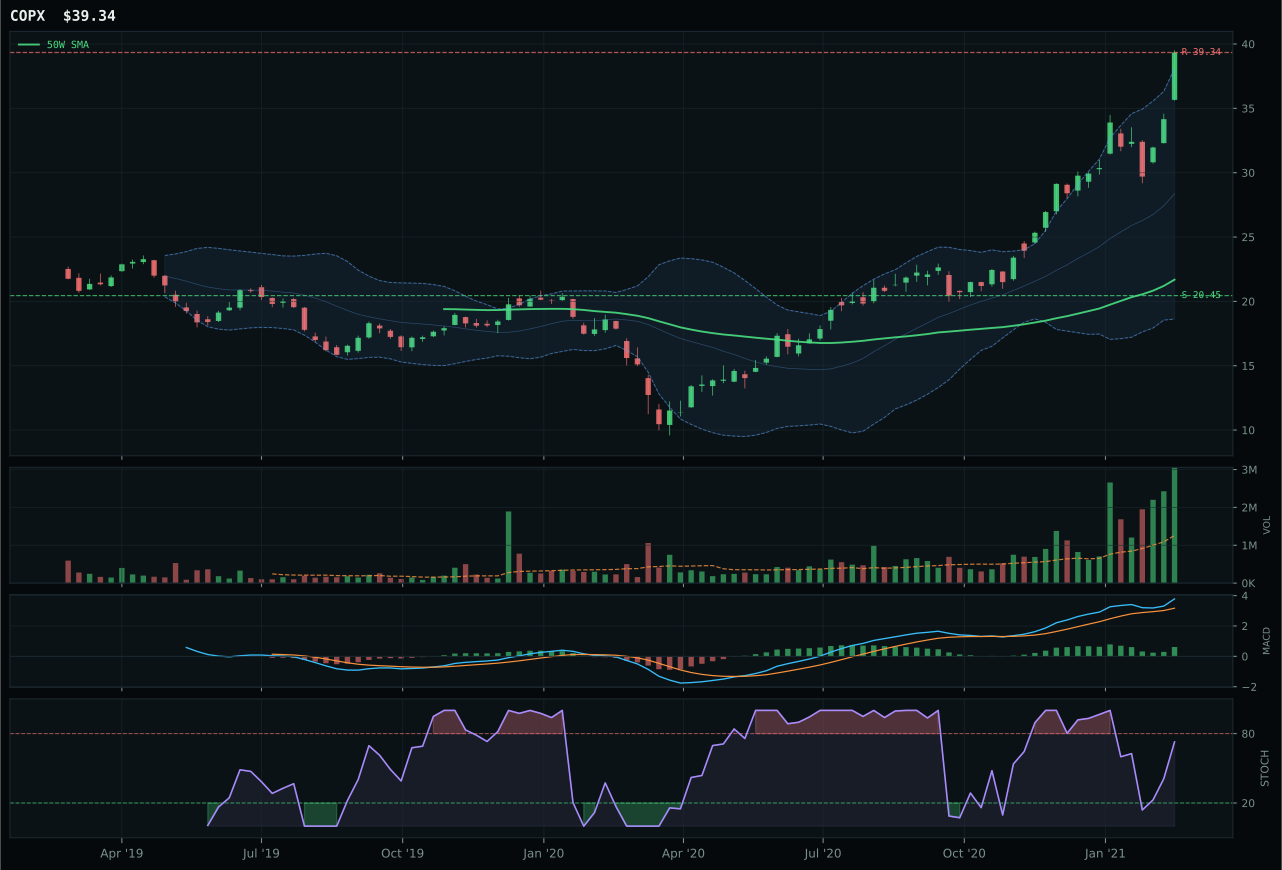
COPX has a vertical extension profile with 45.5% 13-week relative strength versus SPY.
A failed hold above support would weaken the setup.
Actionable but governed by invalidation levels.
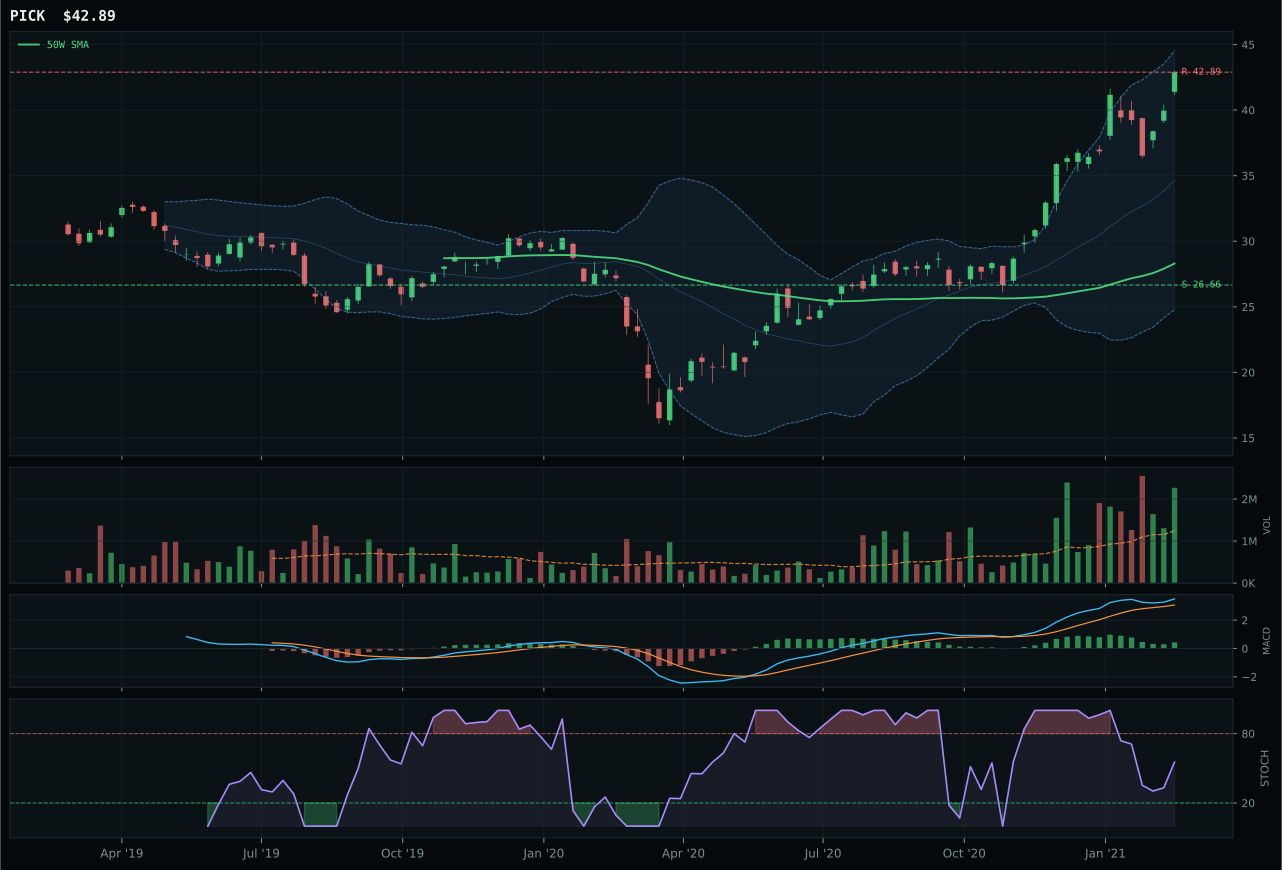
PICK has a vertical extension profile with 29.3% 13-week relative strength versus SPY.
A failed hold above support would weaken the setup.
Actionable but governed by invalidation levels.
COPX wins Industrial Metals decisively and earns top-2 portfolio status with commanding technical evidence and exceptional relative strength. The copper ETF has soared 55.3% in 13 weeks with 45.5% relative strength versus SPY—a breathtaking move that speaks to genuine supply-side constraint and industrial demand renaissance. Volume participation at 3.02x the 20-week average is accumulation-level confirmation, the cleanest institutional sponsorship in the portfolio. MACD is bullish and improving, stochastic RSI rises through mid-zone at 0.73, and the setup is a vertical extension with near-perfect momentum persistence at 100.0. The 81.4% extension from the 50-week moving average is steep, denting timing to 53.0, but risk/reward of 43.6 reflects that support sits 92.4% below current price—buyers have built a fortress. REMX challenges on relative strength (64.7% SPY-relative) but loses on timing deterioration (MACD flattening, more stretched at 99.1%), making COPX's leadership unambiguous.
Industrial Metals earns 10% as a top-2 overweight category with a commanding 86.1 score, reflecting the strongest technical scores in the portfolio paired with exceptional macro fit. The category-level macro narrative is exceptional: metals scarcity at +14, commodity breadth positive at +10, real asset sponsorship at +6, balanced against credit stress at -7. COPX's own macro fit reaches 69.0/100, and its technical evidence is 99.2/100—the highest technical score of any category representative. The allocation reflects this reality: in a transition regime where inflation is pressuring growth and supply shortages are accelerating, copper—the forward-looking inflation hedge tied to industrial demand and renewable capex—offers superior risk-adjusted entry compared to defensive alternatives. The 10% weighting signals that among the portfolio's growth and inflation-hedge choices, copper and industrial metals command the most urgent allocation. This will remain top-2 only if MACD remains improving and volume stays elevated; any deterioration in accumulation or MACD flattening would trigger a lower-ranking review.
Traditional Energy — XLE
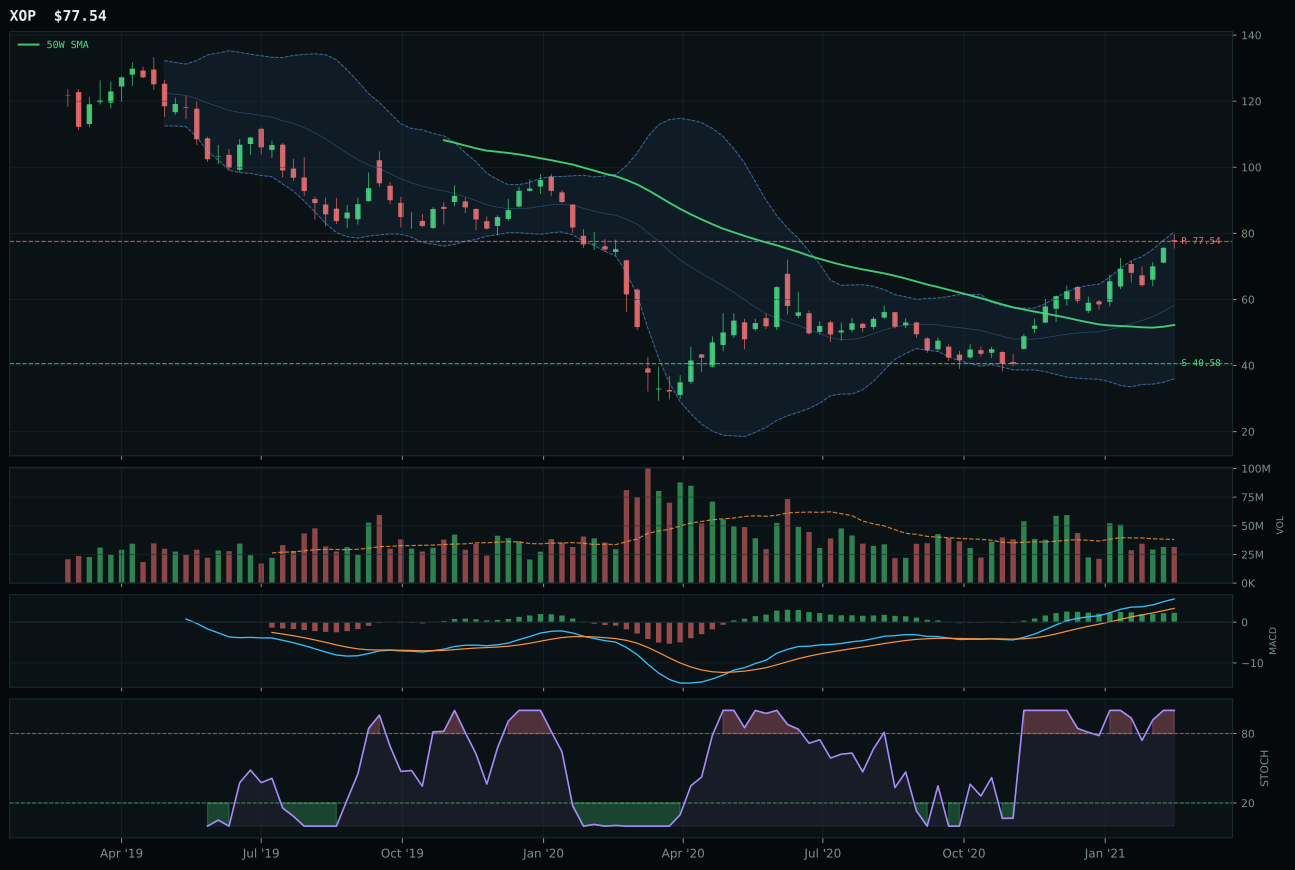
XOP has a vertical extension profile with 39.2% 13-week relative strength versus SPY.
A failed hold above support would weaken the setup.
Actionable but governed by invalidation levels.
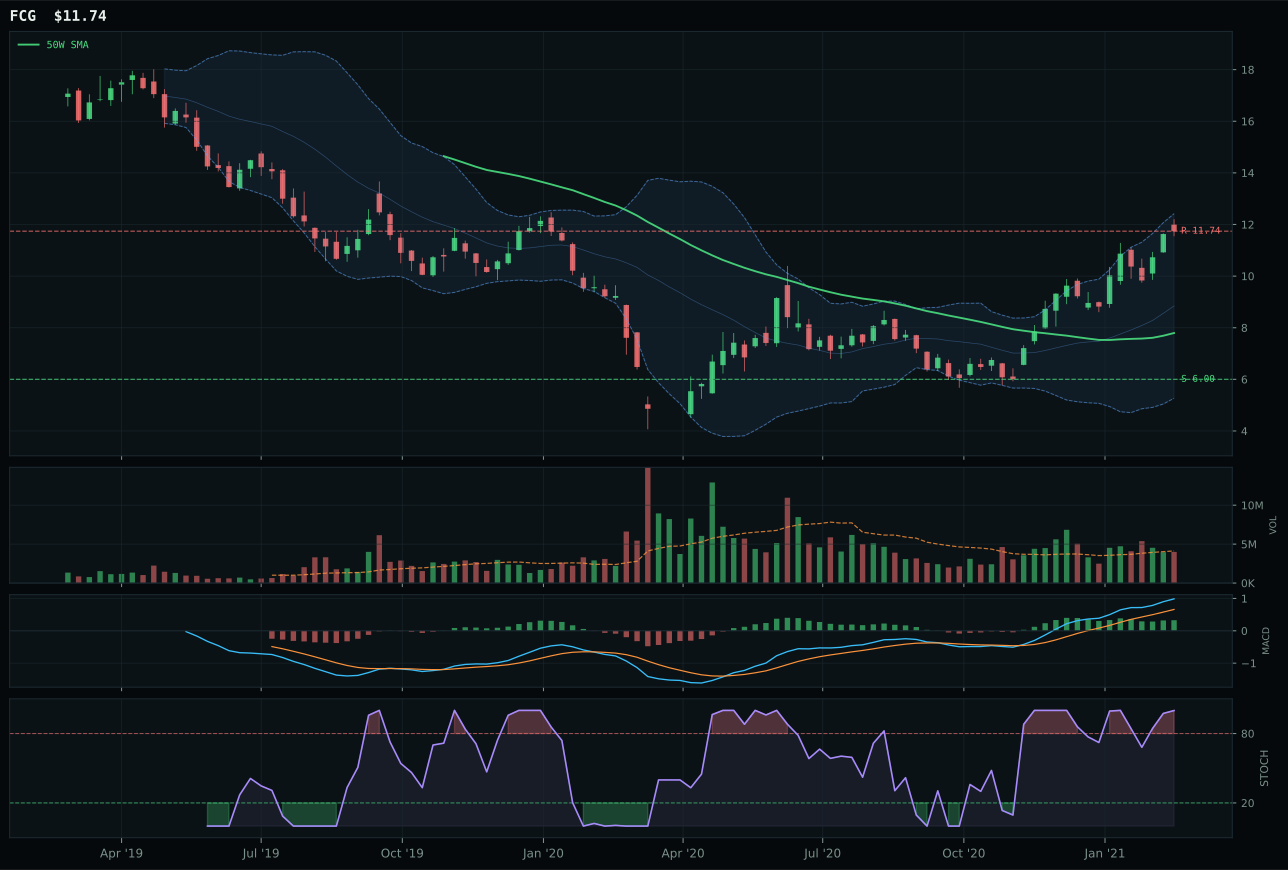
FCG has a vertical extension profile with 39.8% 13-week relative strength versus SPY.
A failed hold above support would weaken the setup.
Actionable but governed by invalidation levels.
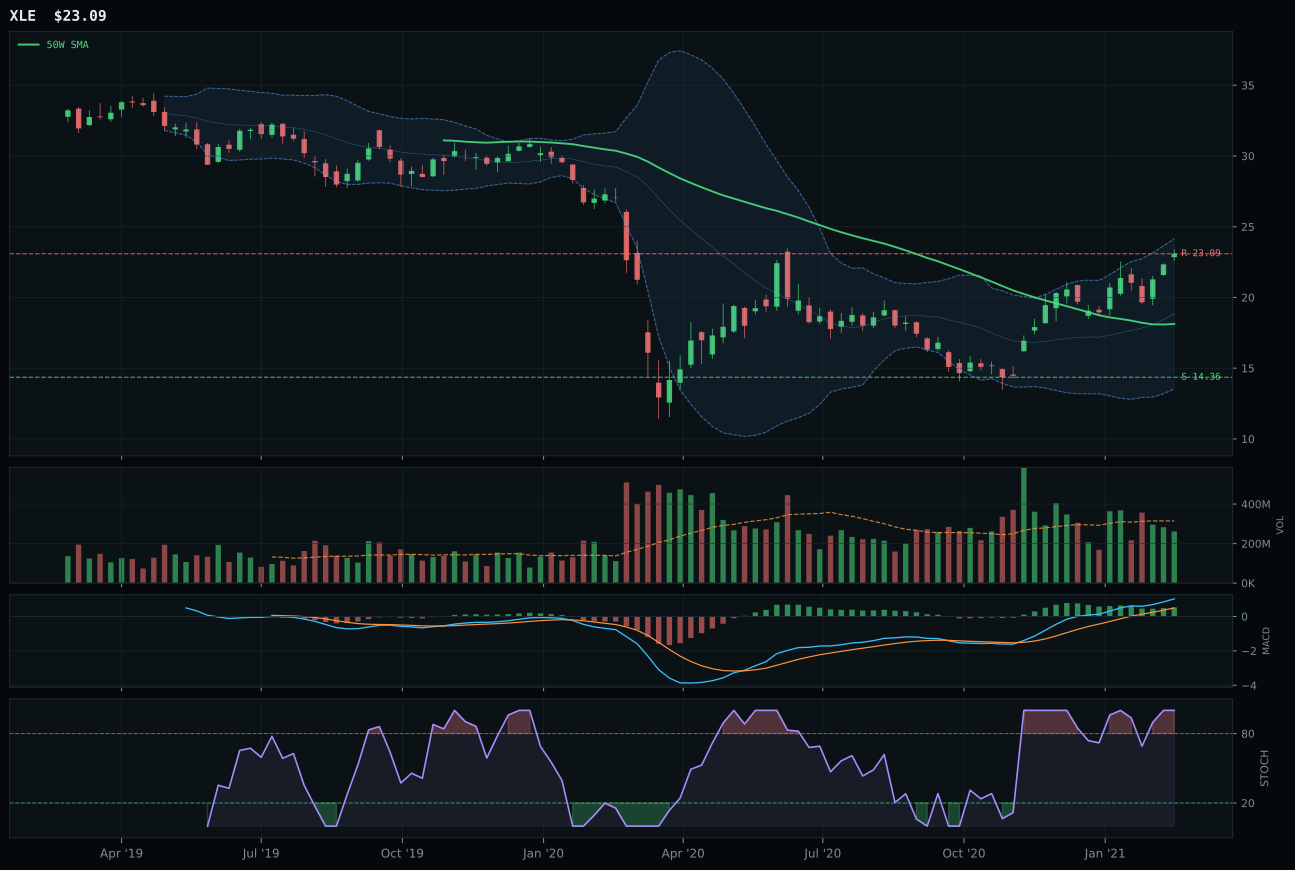
XLE has a vertical extension profile with 19.2% 13-week relative strength versus SPY.
A failed hold above support would weaken the setup.
Actionable but governed by invalidation levels.
XLE wins Traditional Energy and secures top-2 portfolio allocation despite technical scores weaker than COPX, because macro sponsorship is nearly as powerful and timing mechanics offer better risk-reward for new capital. The integrated energy ETF has returned 29.0% in 13 weeks with 19.2% relative strength versus SPY, but critically, it trades only 27.4% above the 50-week moving average—roughly half COPX's extension. Volume is neutral (0.83x average), not accumulation, which reflects that institutional buyers have already positioned and recent strength is momentum continuation. Stochastic RSI sits overbought at 1.00, and MACD is flattening, so technical deterioration is evident—yet XLE's advantage versus XOP and FCG lies in superior risk-reward (47.4 vs 38.6 for XOP) and better timing score (40.0 vs 32.0). The -20.0% category-relative strength signals XLE is the conservative pick within energy, and it is winning by being less stretched, not by being stronger.
Traditional Energy earns 10% as a top-2 overweight allocation despite technical evidence of 47.4/100 (weak in absolute terms) because category-level macro fit reaches 85.0/100—nearly equal to Industrial Metals' 73.0. Energy scarcity is active at +16, inflation pressure at +10, supply shortage at +9, and real asset sponsorship at +7, creating a fortress of macro support. The category score of 75.5 places it second among all ten categories, and the macro narrative is straightforward: OPEC cuts, geopolitical tension in the Middle East, and renewable transition bottlenecks are creating genuine commodity scarcity. XLE's selection as representative (over XOP's higher relative strength) reflects prudent allocation discipline: XOP's 48.3% extension and 39.2% SPY-relative strength represent dangerous late-stage positioning, while XLE's more moderate metrics offer the same macro exposure with better entry timing and lower reversion risk. The 10% allocation will remain justified so long as energy prices hold above recent support and OPEC discipline persists; deterioration in crude above support would require a re-evaluation, but current regime supports this weighting.
Agriculture & Livestock — MOO
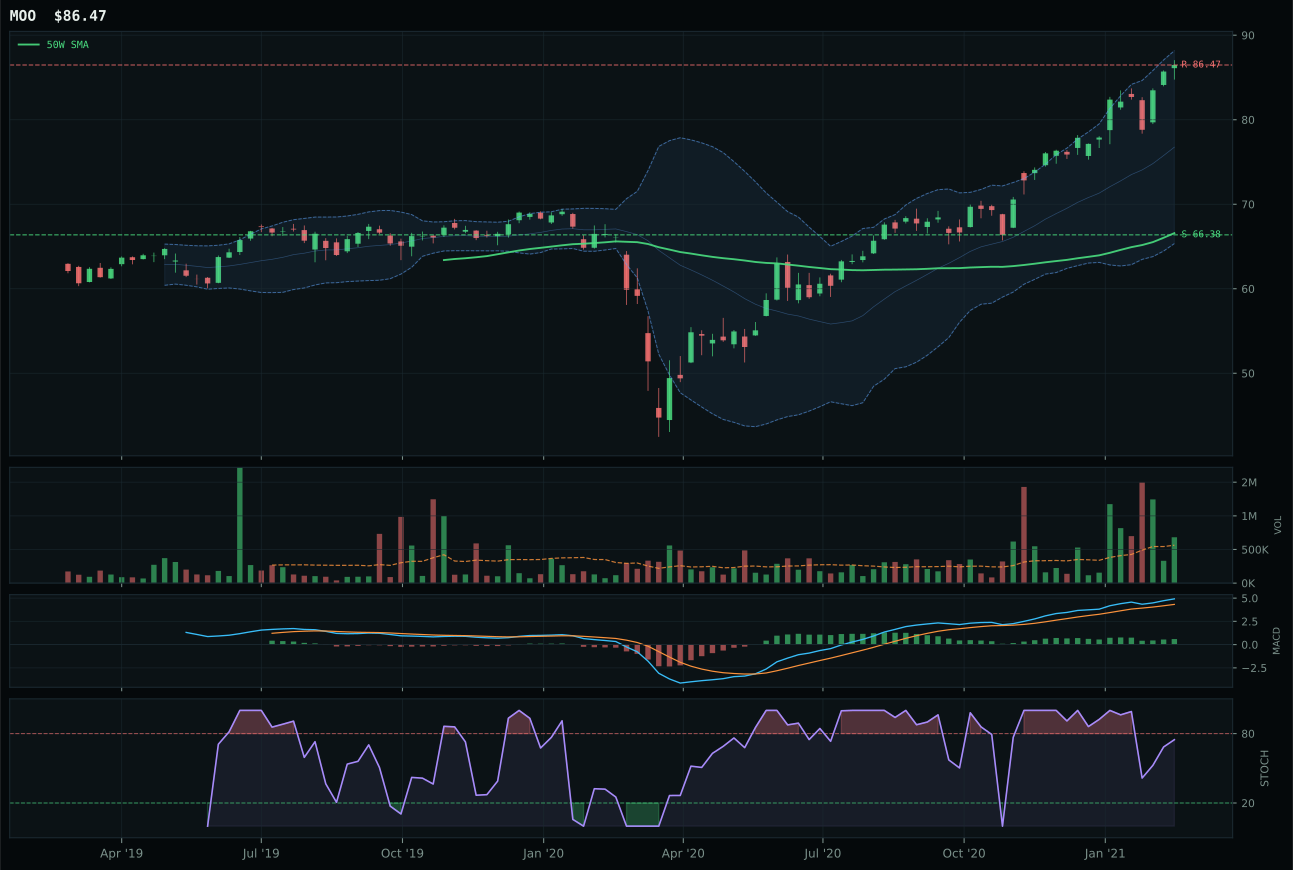
MOO has a vertical extension profile with 7.0% 13-week relative strength versus SPY.
A failed hold above support would weaken the setup.
Actionable but governed by invalidation levels.
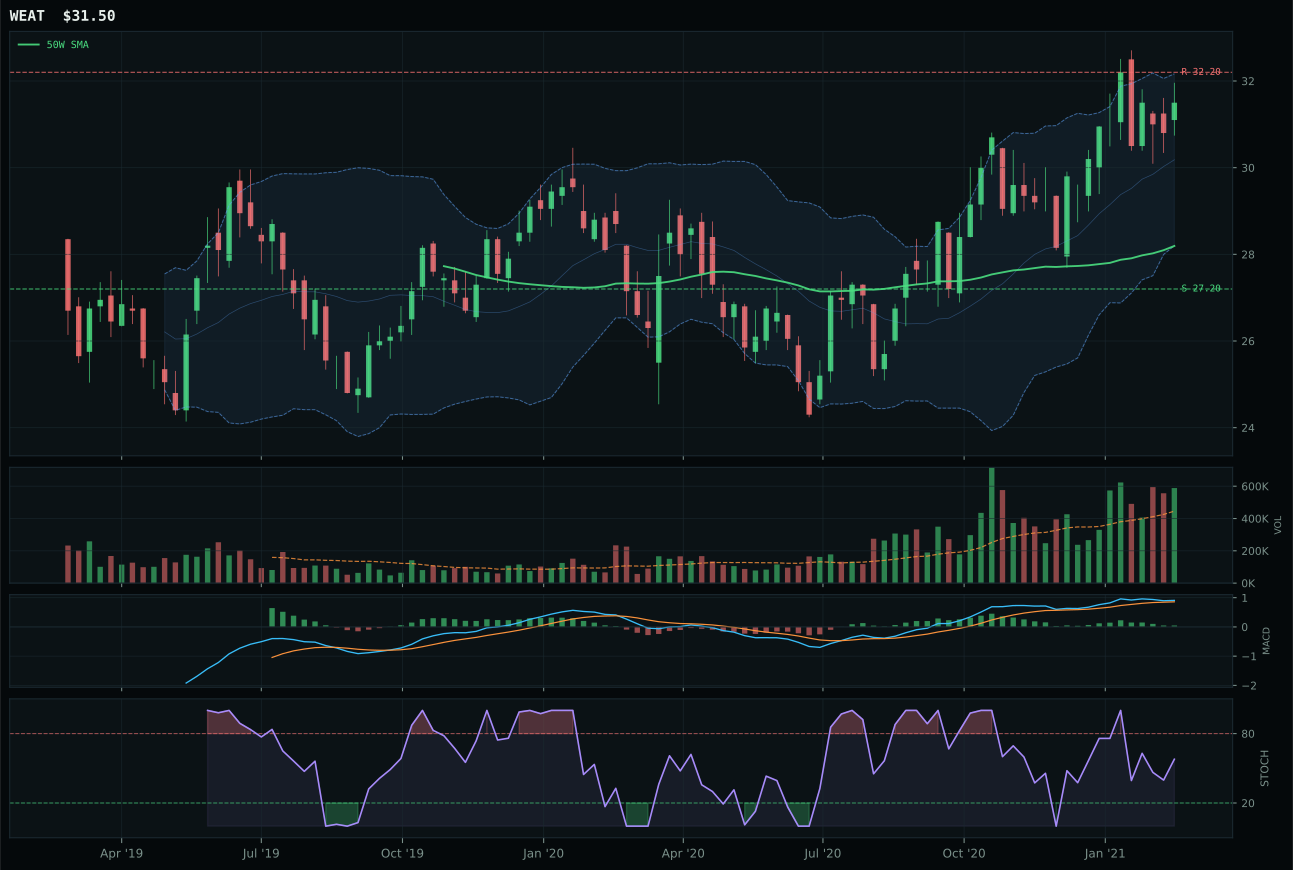
WEAT has a neutral structure profile with -1.9% 13-week relative strength versus SPY.
A failed hold above support would weaken the setup.
Actionable but governed by invalidation levels.
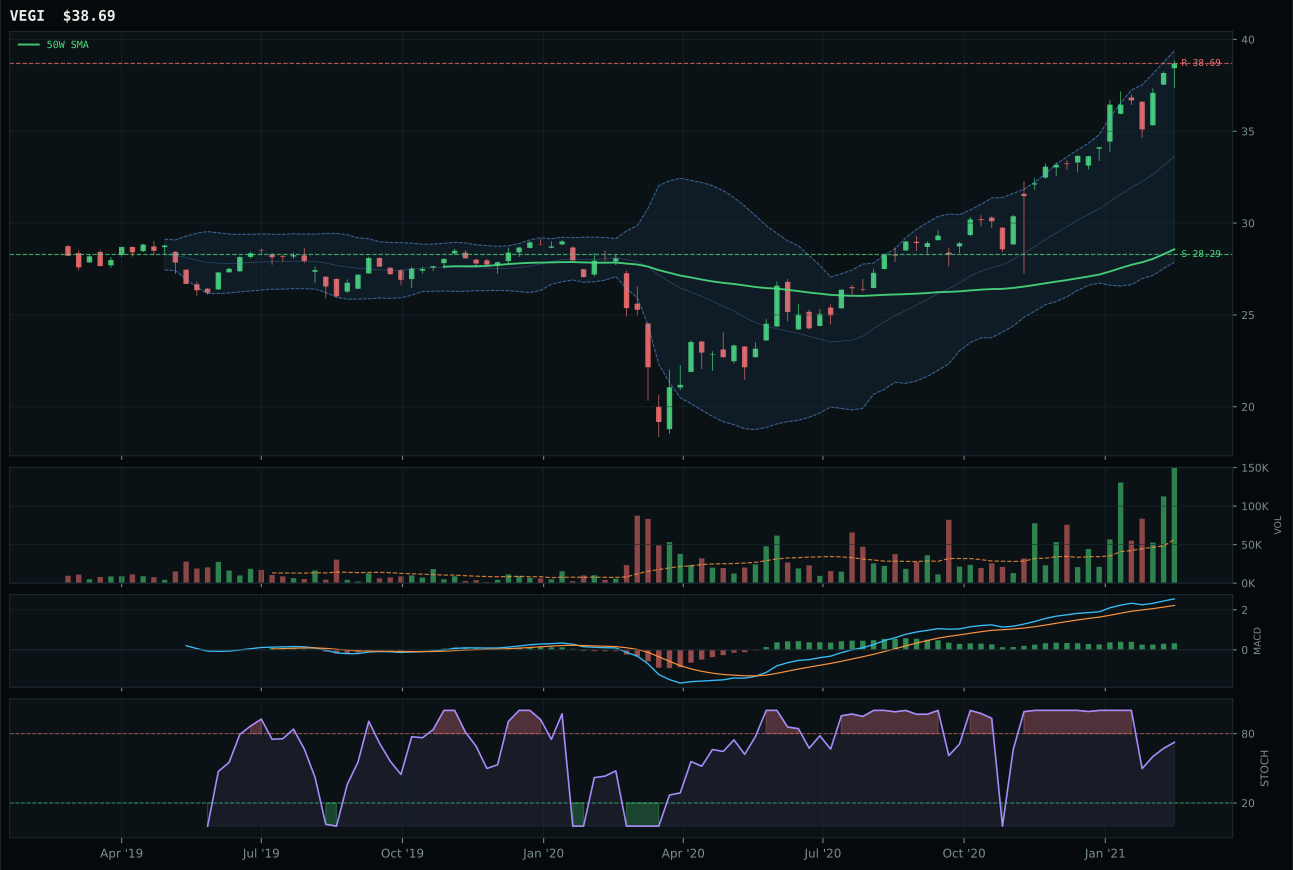
VEGI has a vertical extension profile with 10.5% 13-week relative strength versus SPY.
A failed hold above support would weaken the setup.
Tracked, but not top-2 eligible because: .
MOO wins with a decisive 4.3-point lead over WEAT by combining perfect trend confirmation with superior momentum structure and real macro sponsorship. The fund has delivered 16.7% in 13 weeks with 7.0% relative strength versus SPY, sits cleanly above both the 50-week and 200-week moving averages with positive slope, and trades just 29.9% above the 50-week—extended but not catastrophic. Stochastic RSI rises through the mid-zone at 0.75, and crucially, category-relative strength is 0.0%, meaning MOO is winning on absolute merit, not relative underperformance from its peers. Volume at 1.21x average confirms accumulation. WEAT stumbles because its stochastic RSI has rolled over to neutral, structure is less clean, and it carries -8.9% category-relative strength, indicating the market is voting against this specific expression despite the broad bullish agricultural thesis.
Agriculture & Livestock earns 5% in tier-2 with a robust 72.2 category score, but ranks behind Industrial Metals and Traditional Energy because those two own superior technical scores and equally compelling macro narratives. The 86.0/100 category-level macro fit is exceptional—supply shortage active at +13, inflation pressure at +10, real asset sponsorship at +8, and commodity breadth positive at +5—creating one of the strongest descriptor profiles in the portfolio. Yet timing remains a constraint: MOO is extended 29.9% from the 50-week, denting timing to 48.0. To command a top-2 allocation, Agriculture would need either a correction that resets its entry window or a marked acceleration in the supply shortage narrative (fertilizer constraints, crop failures, or export restrictions tightening further). For now, the 5% allocation honors the category's strong fundamentals while respecting that Industrial Metals' 45.5% SPY-relative strength and Traditional Energy's 19.2% relative strength represent superior risk-adjusted opportunities in the current regime.
Technology — IGV
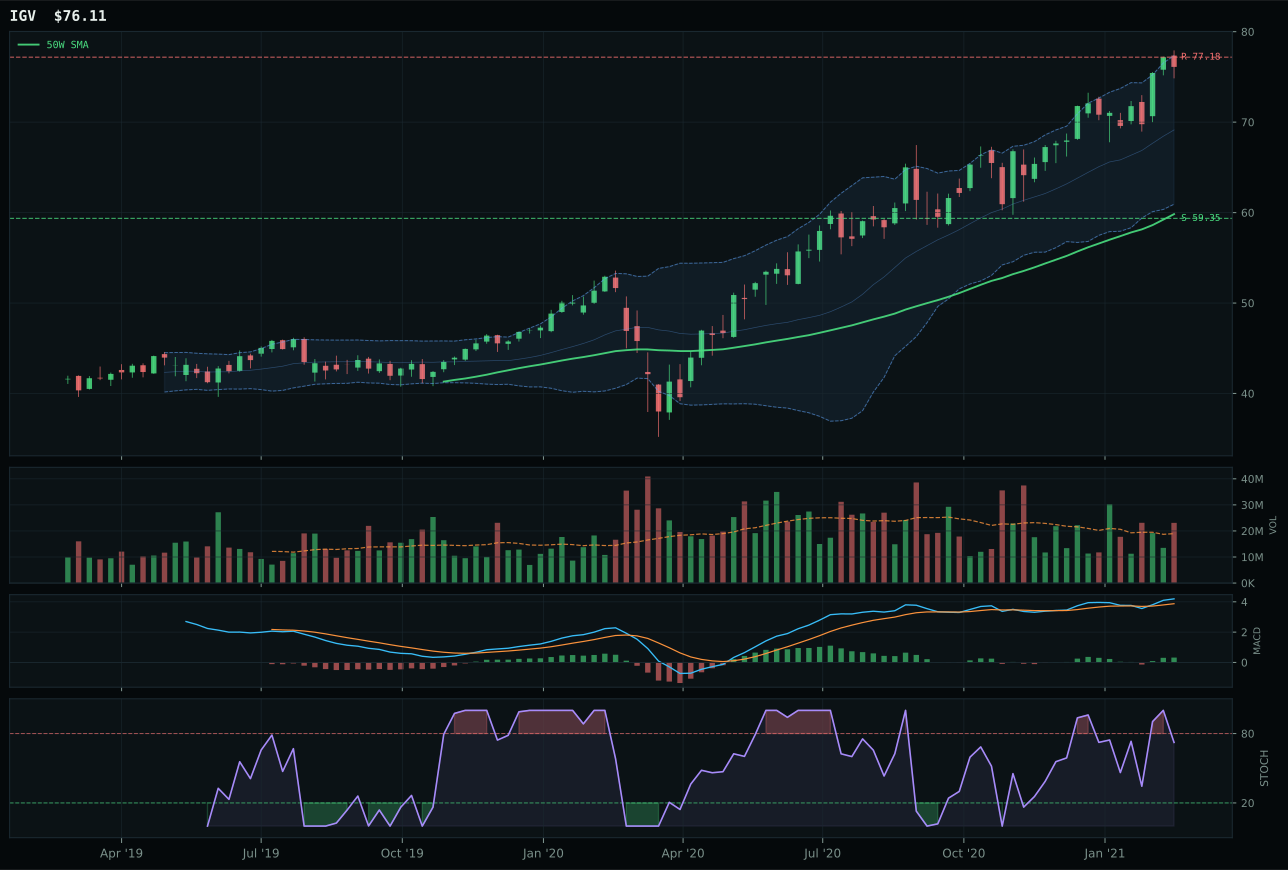
IGV has a vertical extension profile with 6.6% 13-week relative strength versus SPY.
A failed hold above support would weaken the setup.
Actionable but governed by invalidation levels.
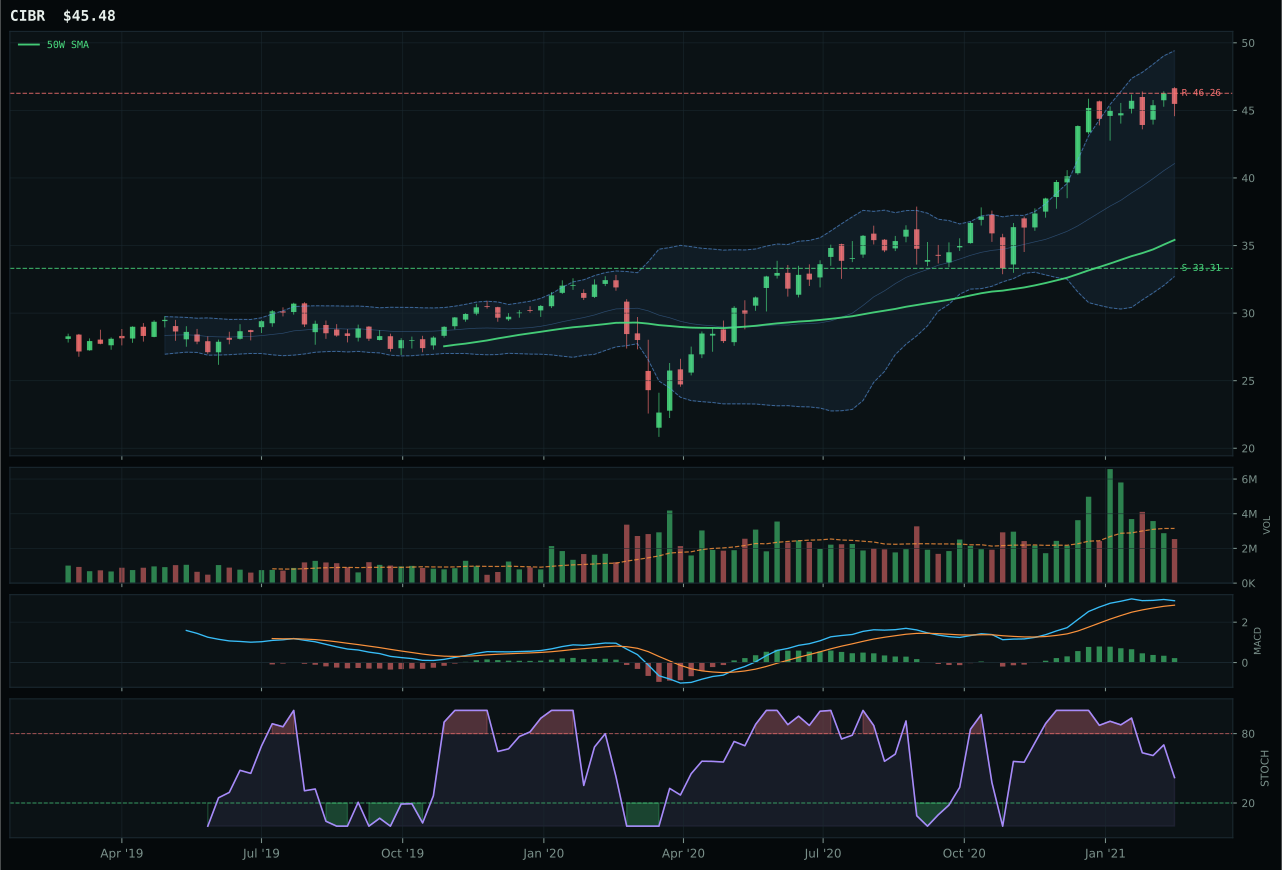
CIBR has a vertical extension profile with 11.9% 13-week relative strength versus SPY.
A failed hold above support would weaken the setup.
Actionable but governed by invalidation levels.
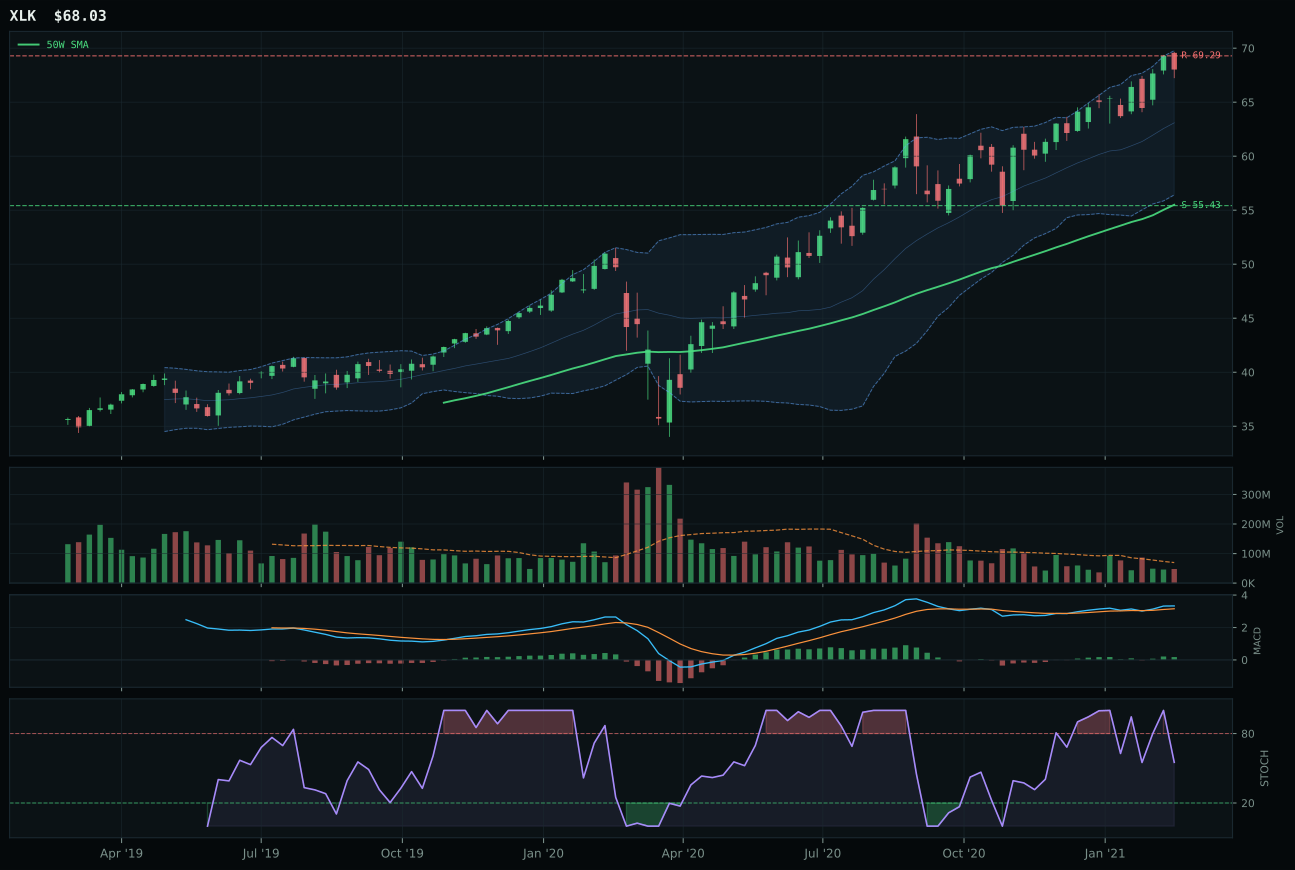
XLK has a vertical extension profile with 3.5% 13-week relative strength versus SPY.
A failed hold above support would weaken the setup.
Actionable but governed by invalidation levels.
IGV wins the category with a 3.8-point margin over CIBR by combining cleaner structure with superior momentum confirmation. The fund sits 27.2% above its 50-week moving average—extended but not prohibitively so—with MACD bullish and improving while stochastic RSI rises through the mid-zone at 0.72, signaling buyers refreshing positions rather than exhausting themselves. Volume participation at 1.22x the 20-week average validates the move as accumulation rather than a bounce. CIBR's setup is technically inferior: MACD has begun flattening, stochastic RSI sits neutral, and volume participation is neutral, meaning the momentum is stalling even as price remains elevated. The 6.6% relative strength versus SPY combined with category-relative strength of 0.0% tells us IGV's leadership is legitimate within its peer group, not borrowed from broad market enthusiasm.
Technology earns a 5% allocation as a tier-2 category, ranking third through eighth in the portfolio review and reflecting the tension between solid technical positioning and a macro regime that is mixed at best. The category's 62.4 score rests on 79.4/100 structure quality and perfect trend confirmation, but timing registers only 53.0/100 due to the extended distance from the 50-week moving average—every new buyer is paying up for a move already well underway. Risk appetite remains positive in the descriptor checklist, which helps, but credit stress is active and inflation pressure is building, creating headwinds for duration-heavy growth exposures like software. To earn promotion to top-2 would require either the macro picture to brighten sharply on credit or timing to reset closer to support; at current levels, Technology holds its allocation but does not command portfolio priority against industrial metals and energy, which blend superior technicals with far stronger macro sponsorship.
Emerging Markets — IEMG
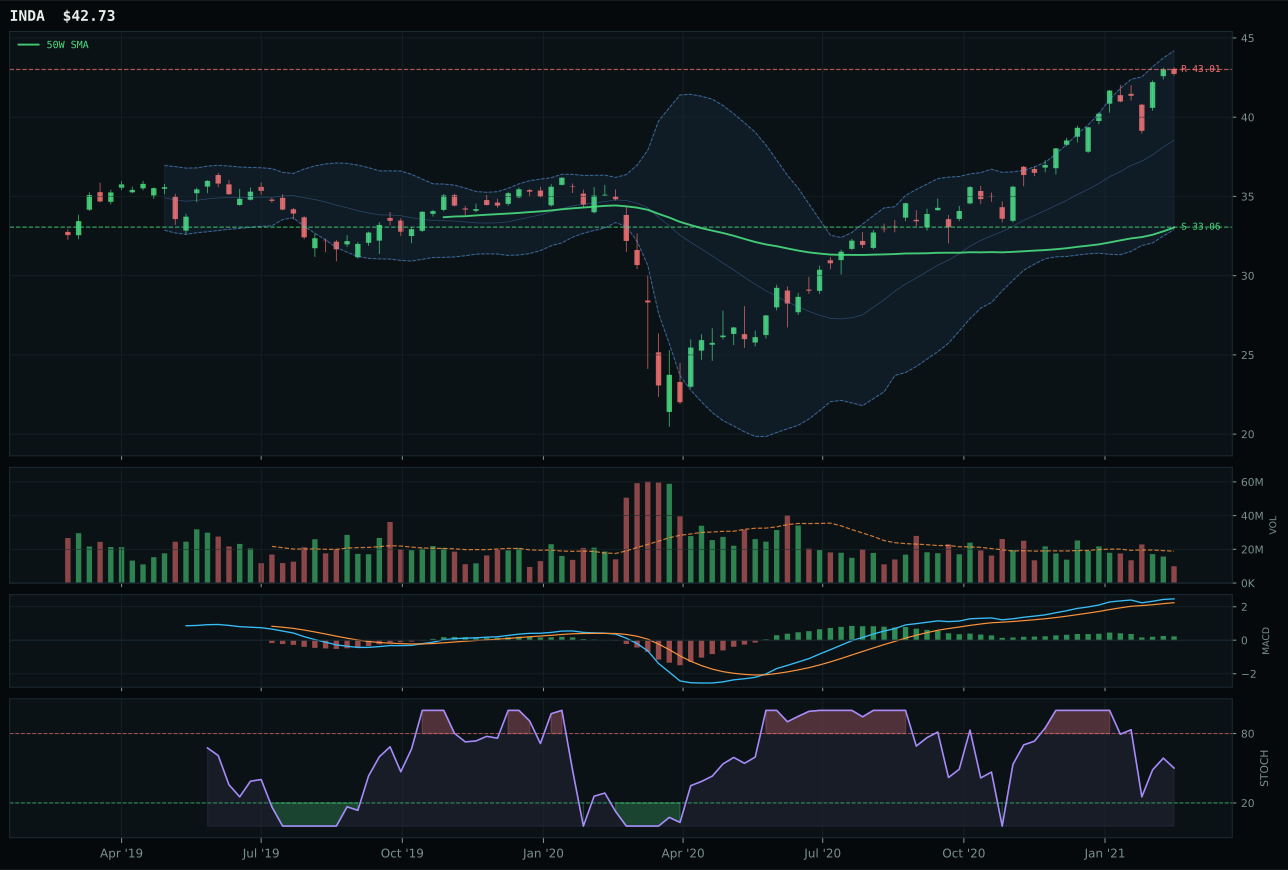
INDA has a vertical extension profile with 7.3% 13-week relative strength versus SPY.
A failed hold above support would weaken the setup.
Actionable but governed by invalidation levels.
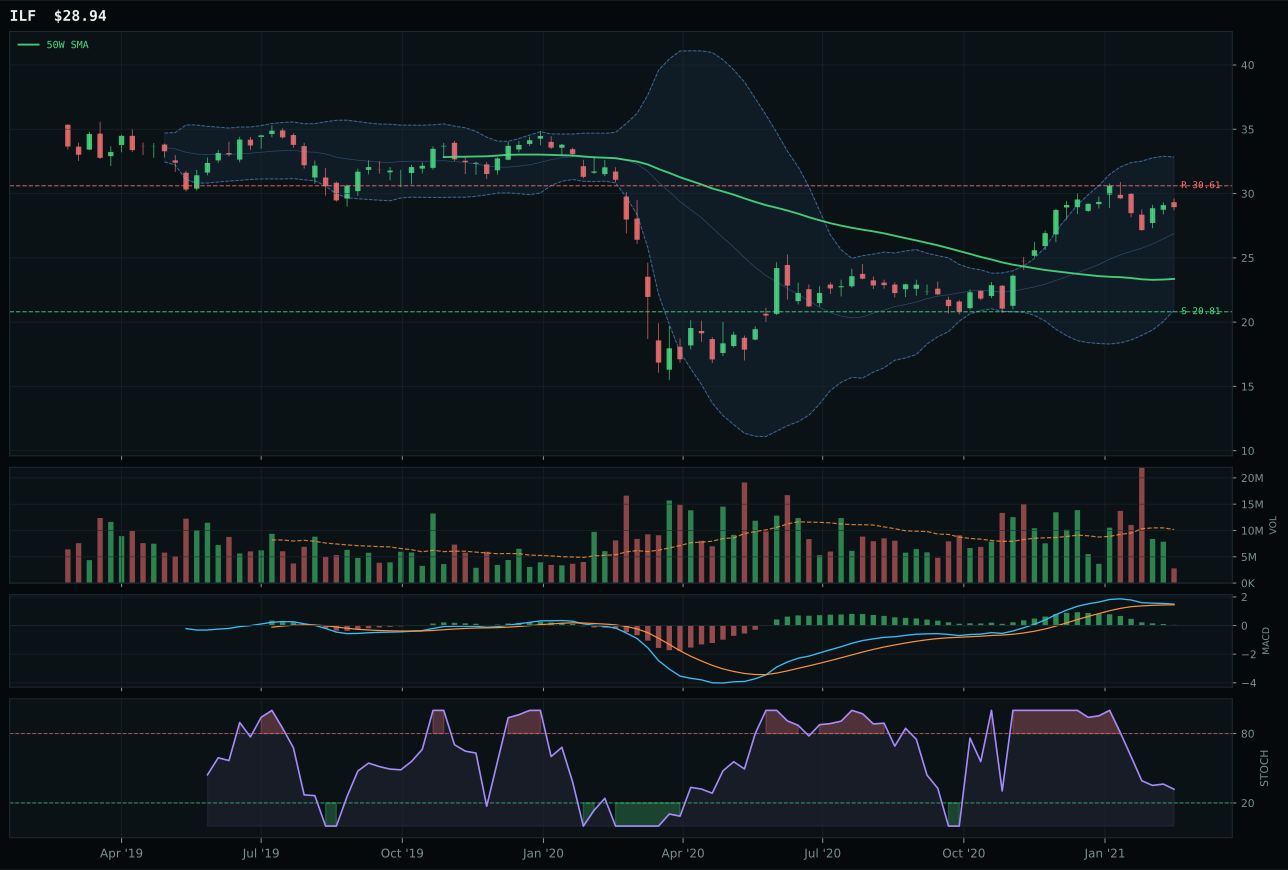
ILF has a vertical extension profile with 3.3% 13-week relative strength versus SPY.
A failed hold above support would weaken the setup.
Actionable but governed by invalidation levels.
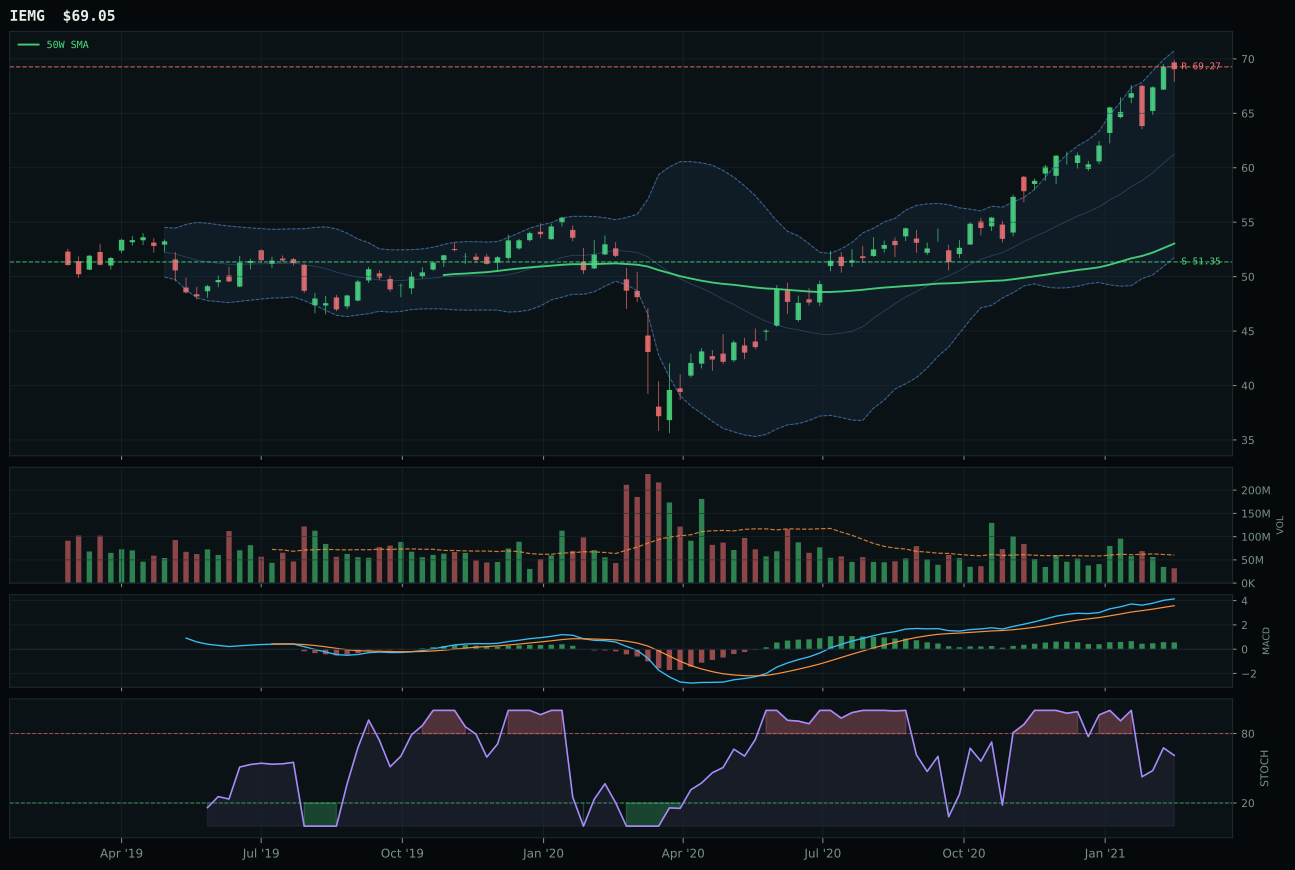
IEMG has a vertical extension profile with 7.7% 13-week relative strength versus SPY.
A failed hold above support would weaken the setup.
Actionable but governed by invalidation levels.
IEMG wins by the slimmest margin—just 0.8 points versus INDA—on a single technical differentiator: category-relative strength of 0.3% versus 0.0%, reflecting infinitesimal outperformance inside a category where all three expressions show nearly identical technical posture. Both IEMG and INDA deliver 17.4% and 17.1% respectively over 13 weeks, trade 30.2% and similarly extended above their 50-week moving averages, show MACD bullish but flattening, and feature rising stochastic RSI through mid-zone with thin volume participation. The separation lies not in setup quality but in breadth: IEMG's broad emerging-market beta (60.5 reasoned ETF score) versus INDA's India-specific concentration (60.2) gives the category representative a marginally better claim on being a true risk-appetite proxy. This is not a convincing win, but score discipline requires a representative.
Emerging Markets earns 5% in tier-2 despite a respectable 61.5 category score, because it ranks behind eight stronger opportunities in the portfolio review. The category's macro fit is 62.0/100 with EM liquidity support at +14 and risk appetite positive at +8, but credit stress active at -10 creates genuine headwind tension. IEMG's thin participation at 0.53x average volume signals that institutional buyers have not refreshed positions and recent strength is momentum-driven rather than accumulation. Timing is 48.0/100 due to 30.2% extension from the 50-week moving average, and risk-reward registers only 37.2 with upside to resistance already exhausted. To earn higher allocation, Emerging Markets would need either genuine EM-specific macro acceleration (commodity demand, currency strength, credit stabilization) or better technical setup with resumption of volume participation. At current levels, with EM stocks extended and volume thin, the 5% allocation honors the category's positive momentum while respecting that Industrial Metals, Traditional Energy, Agriculture, and even Technology offer superior risk-adjusted opportunities in the current regime. EM remains vulnerable to any tightening of credit or reversal in risk appetite.
AI — SMH
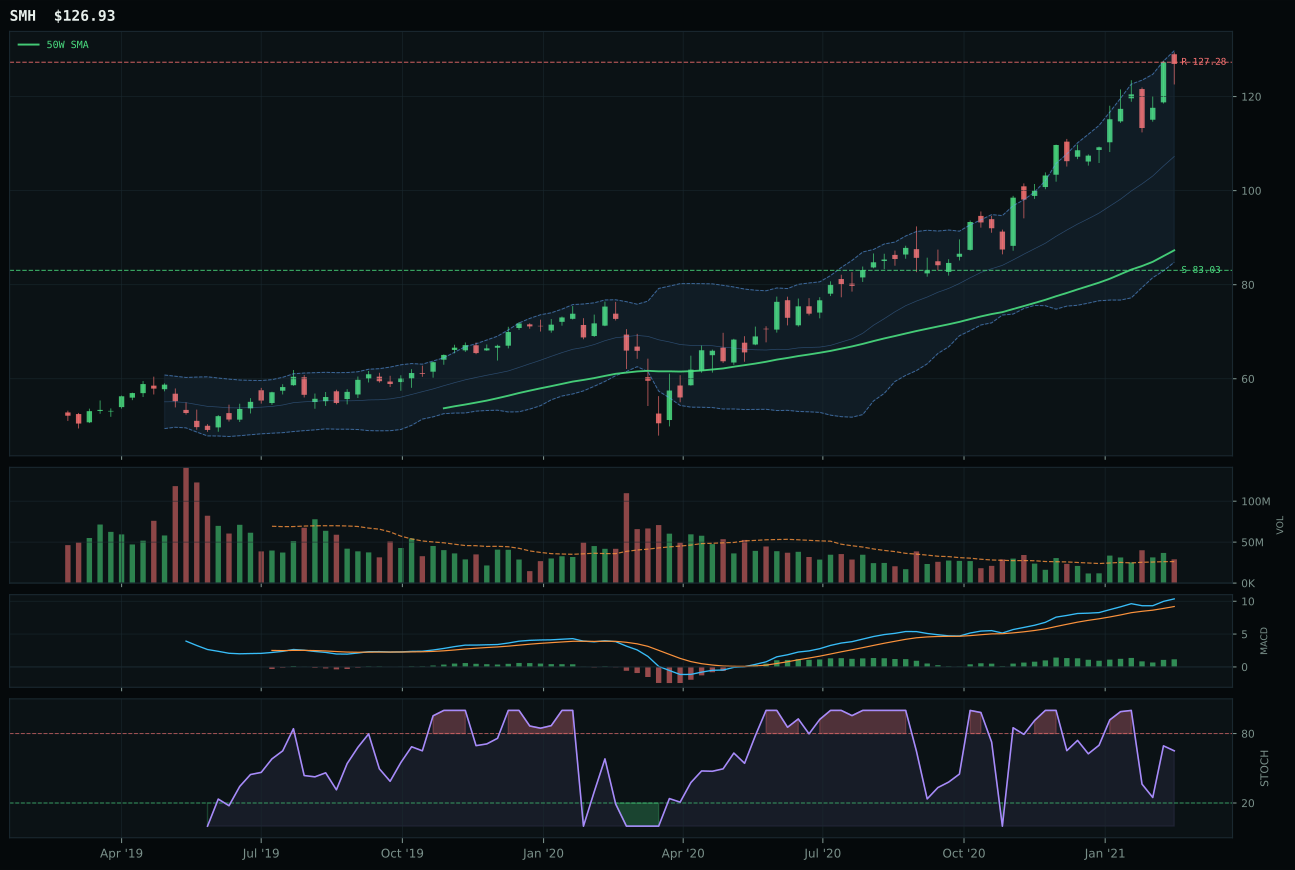
SMH has a vertical extension profile with 17.2% 13-week relative strength versus SPY.
A failed hold above support would weaken the setup.
Actionable but governed by invalidation levels.
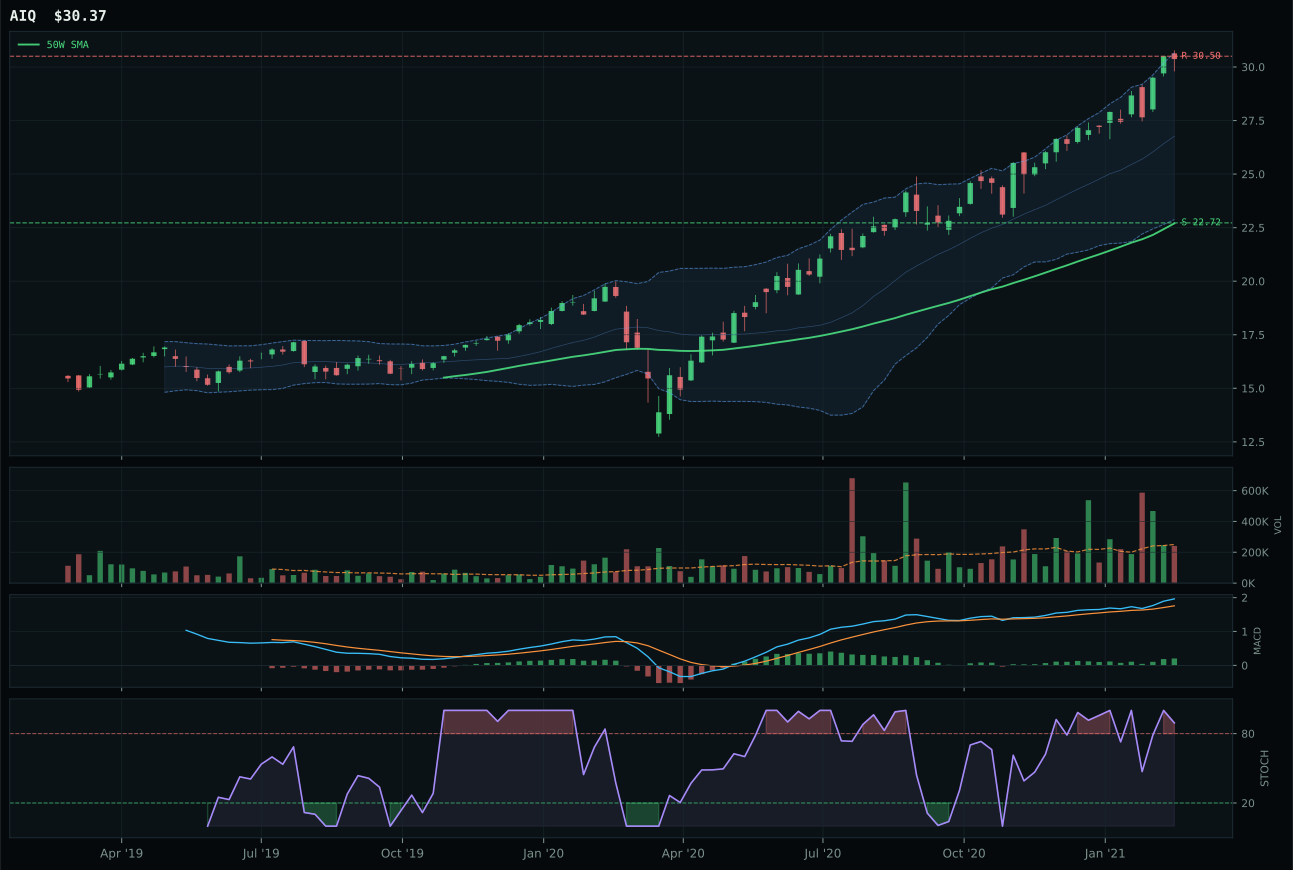
AIQ has a vertical extension profile with 10.2% 13-week relative strength versus SPY.
A failed hold above support would weaken the setup.
Tracked, but not top-2 eligible because: .
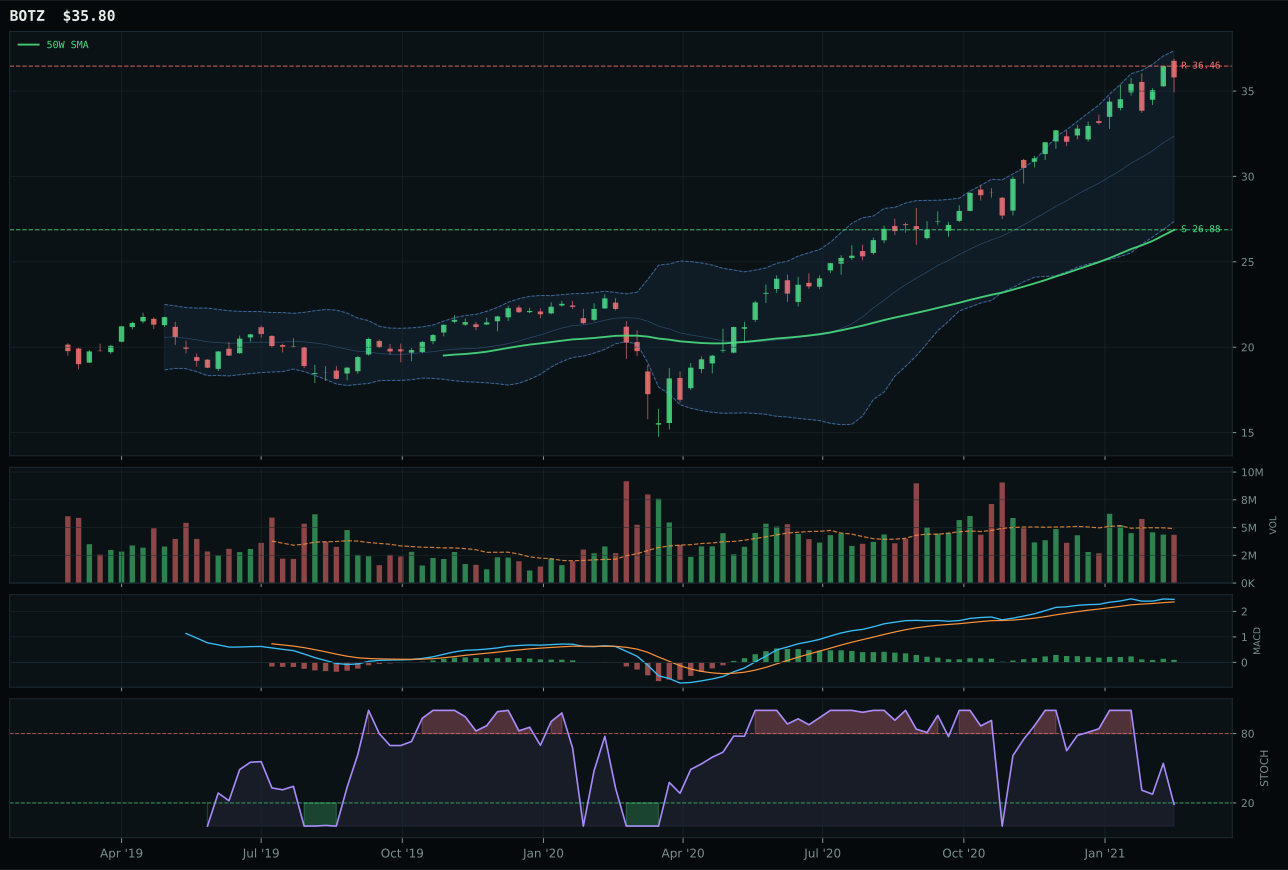
BOTZ has a vertical extension profile with 5.5% 13-week relative strength versus SPY.
A failed hold above support would weaken the setup.
Actionable but governed by invalidation levels.
SMH wins decisively over AIQ with a 27.4-point technical advantage, capturing AI category leadership through sheer breadth of confirmation. The semiconductor ETF has delivered 26.9% over 13 weeks with 17.2% relative strength versus SPY—a genuine outperformance, not market-beta noise—backed by accumulation-level volume at 1.10x average and MACD that remains bullish if flattening. Stochastic RSI at 0.65 sits comfortably in the rising mid-zone, avoiding the overbought exhaustion that afflicts AIQ at 0.83. The 45.4% extension from the 50-week moving average is extreme and dents the timing score to 48.0, but momentum confirmation at 100.0 and volume-price persistence at 86.4 tell us this move has real institutional sponsorship. AIQ, by contrast, combines weak technical evidence (41.0 composite) with overbought stochastic RSI momentum, neutral volume, and deteriorating structure—all the hallmarks of a trap for late momentum chasers.
AI earns 5% as a tier-2 category despite a 53.9 final score that reflects exceptional macro fit (66.0/100) and category-level composition weighted toward semiconductor and compute winners. The active descriptors for AI growth sponsorship and risk appetite positive carry real weight, pumping the macro narrative to 68.0/100 at the ETF level for SMH. However, the category's 53.9 ranking places it well behind Industrial Metals (86.1) and Traditional Energy (75.5), which combine stronger technicals with even more robust macro tailwinds from supply shortage, inflation, and real-asset sponsorship. AI's path to top-2 status requires either sustained improvement in timing setup (moving back toward the 50-week, not further away) or a marked deterioration in the commodity complex's technical footing. For now, the allocation recognizes SMH's leadership while maintaining discipline: the category is real, but it is not yet the portfolio's best risk-adjusted opportunity in a mixed macro regime where inflation and commodity scarcity are the dominant themes.
Defense & Aerospace — ITA
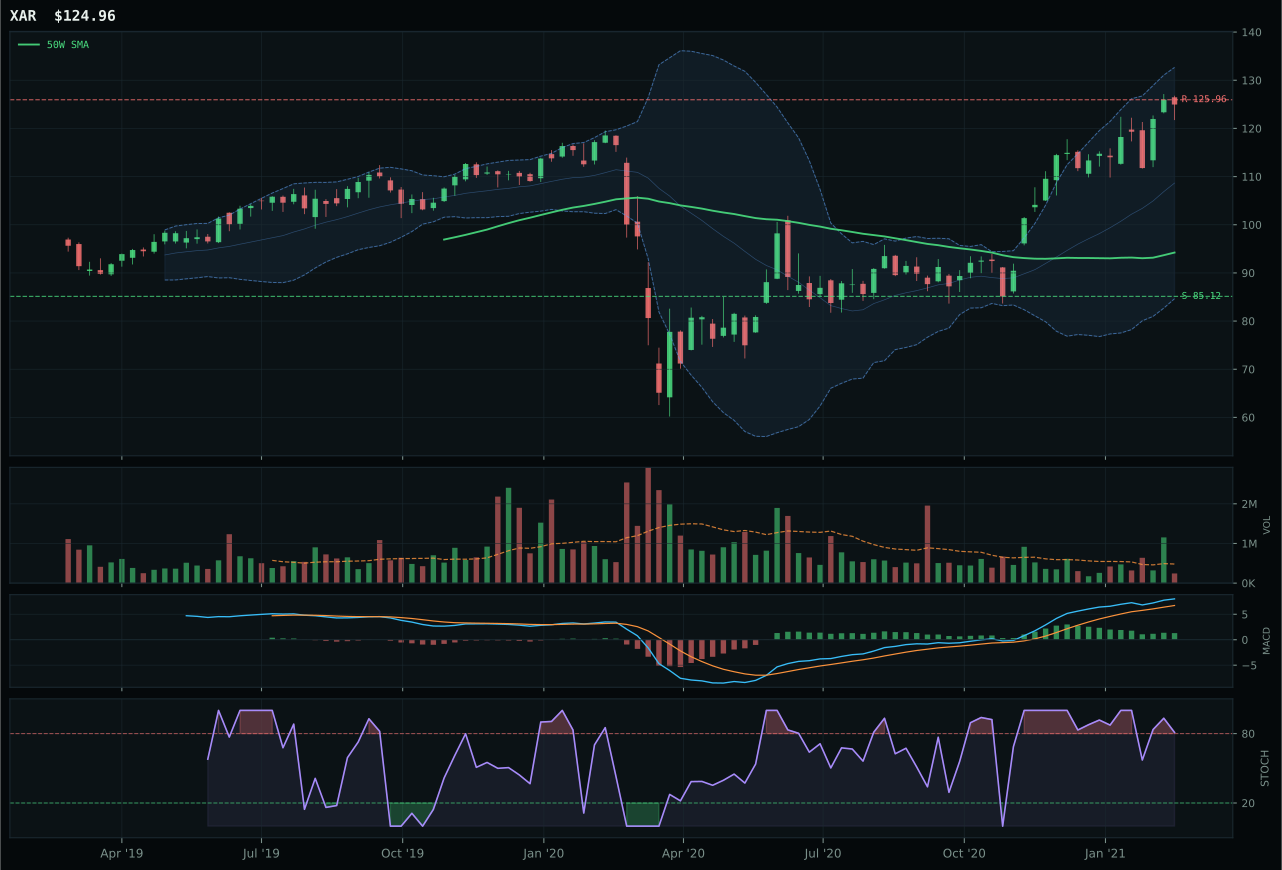
XAR has a vertical extension profile with 10.2% 13-week relative strength versus SPY.
A failed hold above support would weaken the setup.
Actionable but governed by invalidation levels.
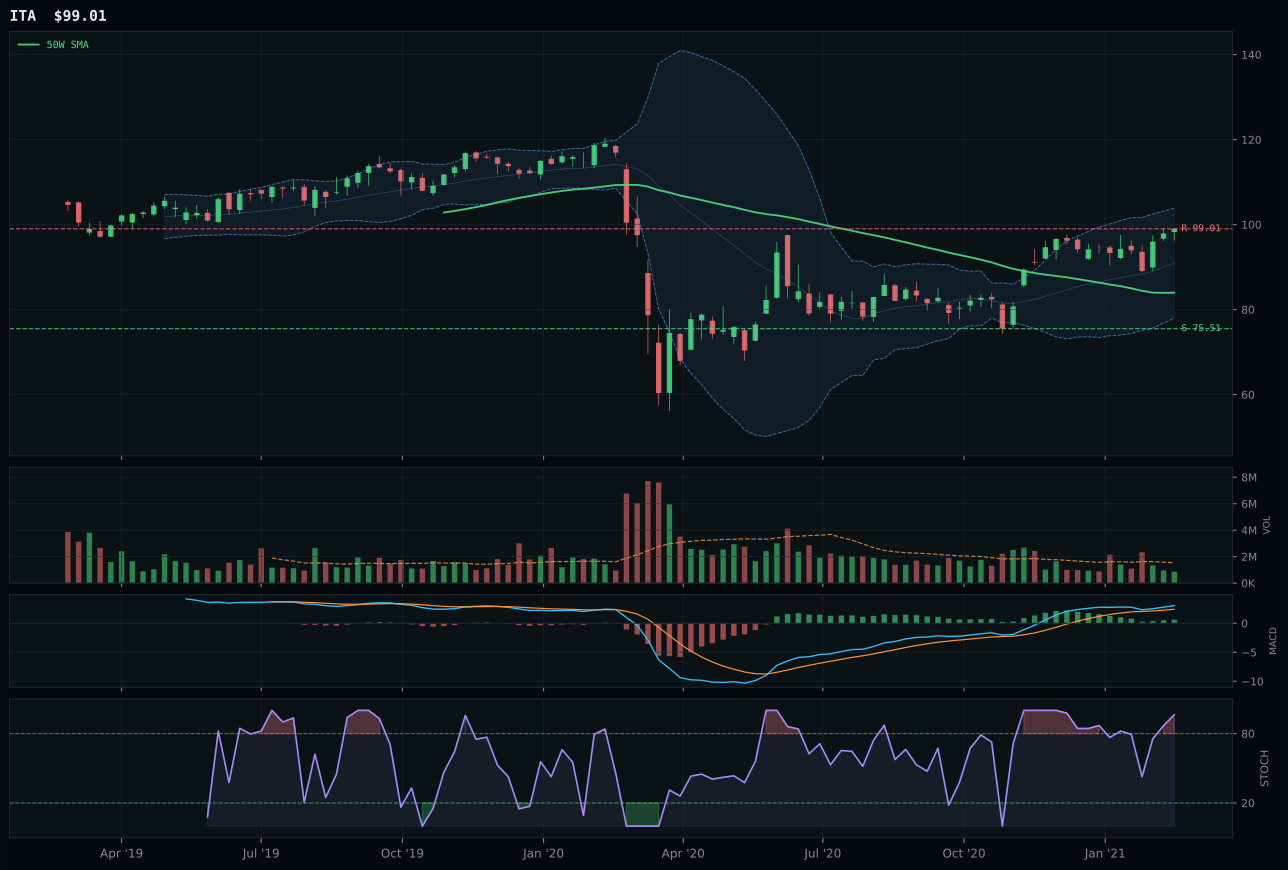
ITA has a vertical extension profile with -1.0% 13-week relative strength versus SPY.
A failed hold above support would weaken the setup.
Actionable but governed by invalidation levels.
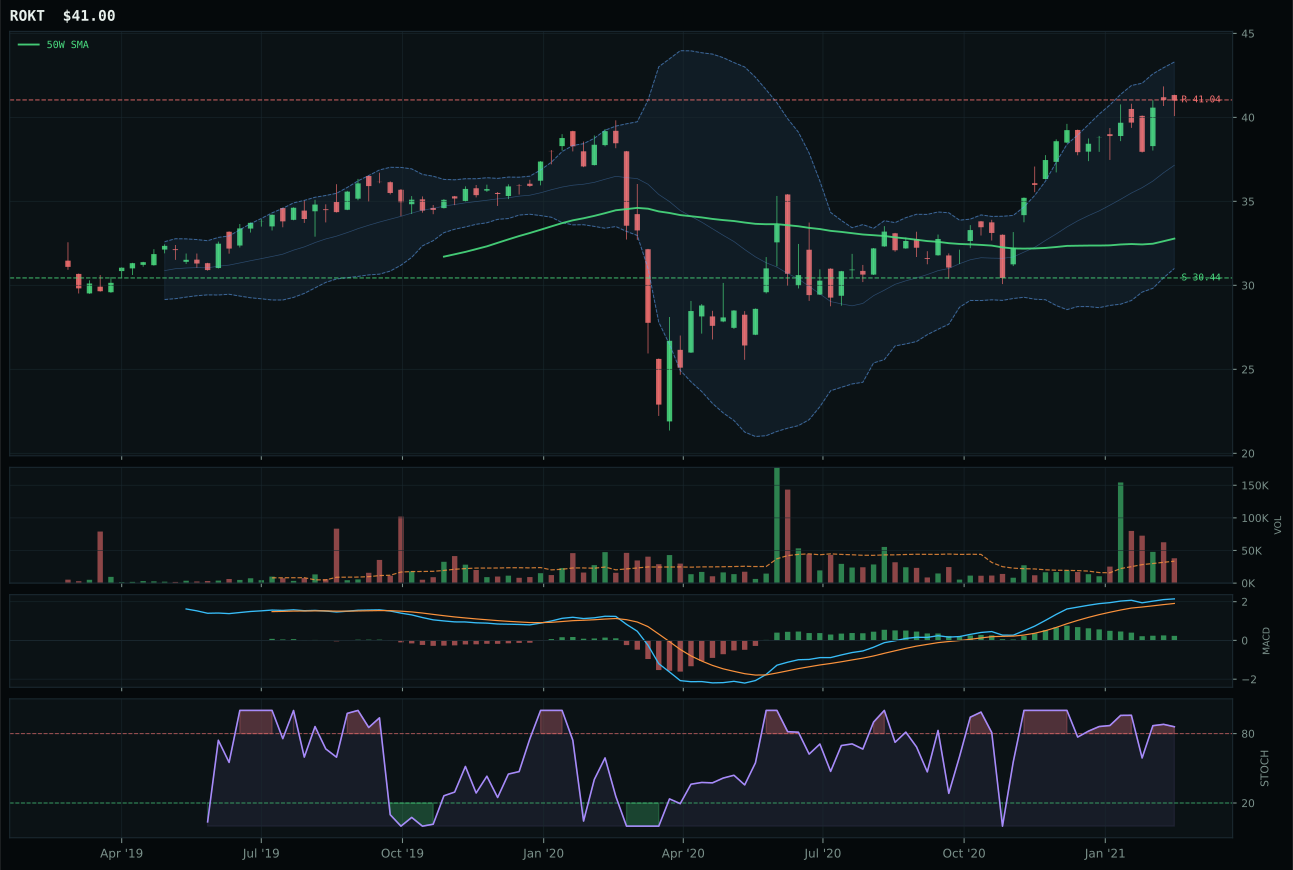
ROKT has a vertical extension profile with 4.2% 13-week relative strength versus SPY.
A failed hold above support would weaken the setup.
Tracked, but not top-2 eligible because: .
ITA edges XAR by the narrowest margin—just 0.4 points—by offering superior risk-reward geometry despite weaker momentum credentials. The fund has climbed only 8.7% in 13 weeks and shows negative category-relative strength of -5.2%, but it sits just 17.9% above the 50-week moving average versus XAR's 32.6%, meaning ITA buyers face 15% less reversion risk if the setup unwinds. More critically, ITA's risk/reward registers 49.6/100 with upside to resistance flat but a 31% cushion to support, compared to XAR's 37.3 with a wider gap between resistance and support that favors continuation risk. Both show overbought stochastic RSI momentum and thin volume participation, but ITA's lower absolute extension and better downside cushion make it the sounder representative even as the category overall shows weak technical sponsorship and neutral macro fit.
Defense & Aerospace receives 5% in tier-2, ranking below Industrial Metals and Traditional Energy but still eligible for capital allocation in a portfolio designed to balance momentum with macro regime fit. The category's 49.7 score is dampened by weak technical evidence (43.9/100 for the winner ITA), thin participation (0.56x average volume), and MACD that has begun flattening across the peer group. Transition/Mixed macro helps slightly (+3) and credit stress active (+2) can support defensive narratives, but no strong descriptor tailwind exists for this exposure. Risk-reward is actually reasonable—the category is not stretched as badly as semiconductors or nuclear—but the rank reflects honest assessment: there are nine other categories to allocate first. Defense would need either a genuine deterioration in risk appetite (triggering real defensive buying) or improved technical setup with volume confirmation to move higher in the stack. At 5%, it receives the benefit of the doubt that geopolitical tension remains a portfolio hedge, but not the priority capital it would command in a bear-market or credit-stress regime.
Utilities & Infrastructure — PAVE
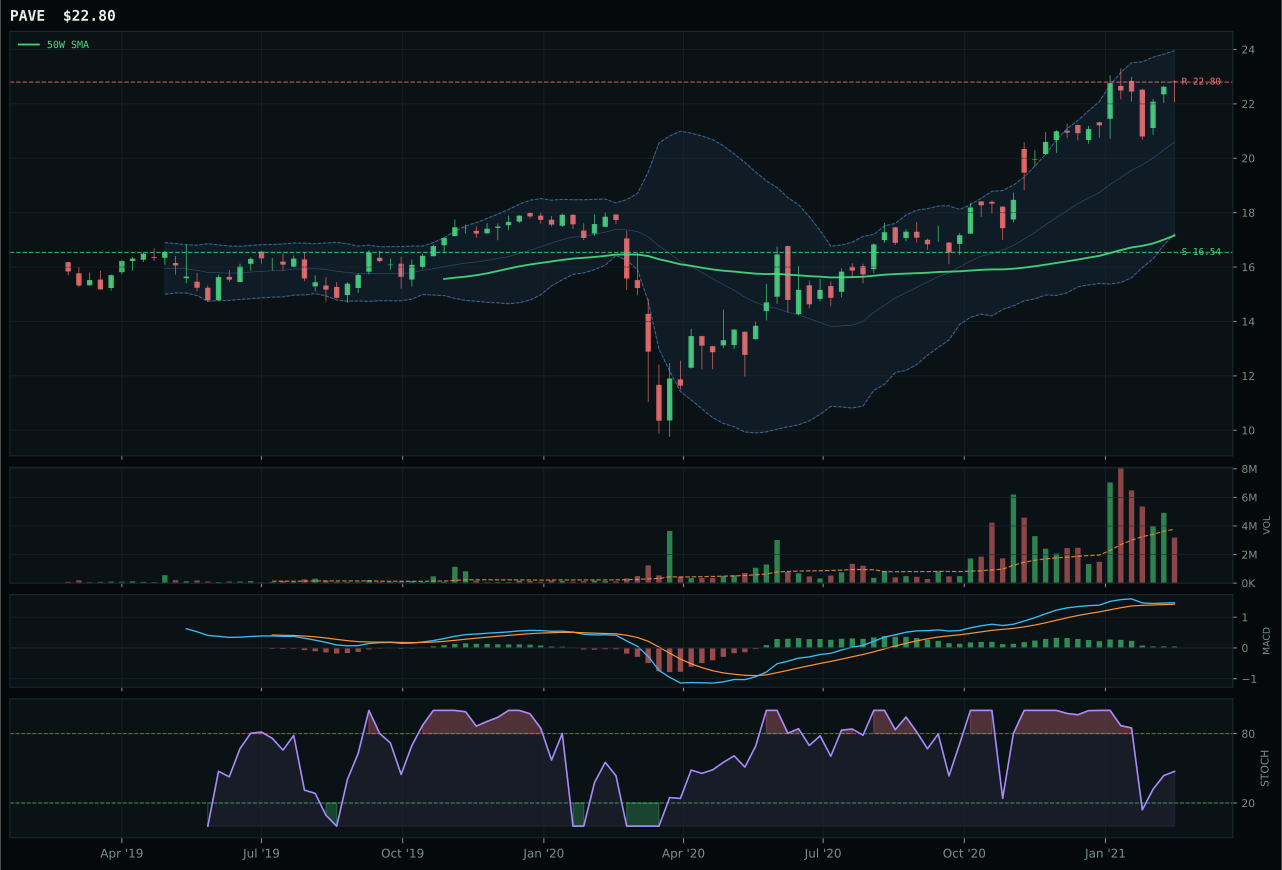
PAVE has a vertical extension profile with 4.5% 13-week relative strength versus SPY.
A failed hold above support would weaken the setup.
Actionable but governed by invalidation levels.
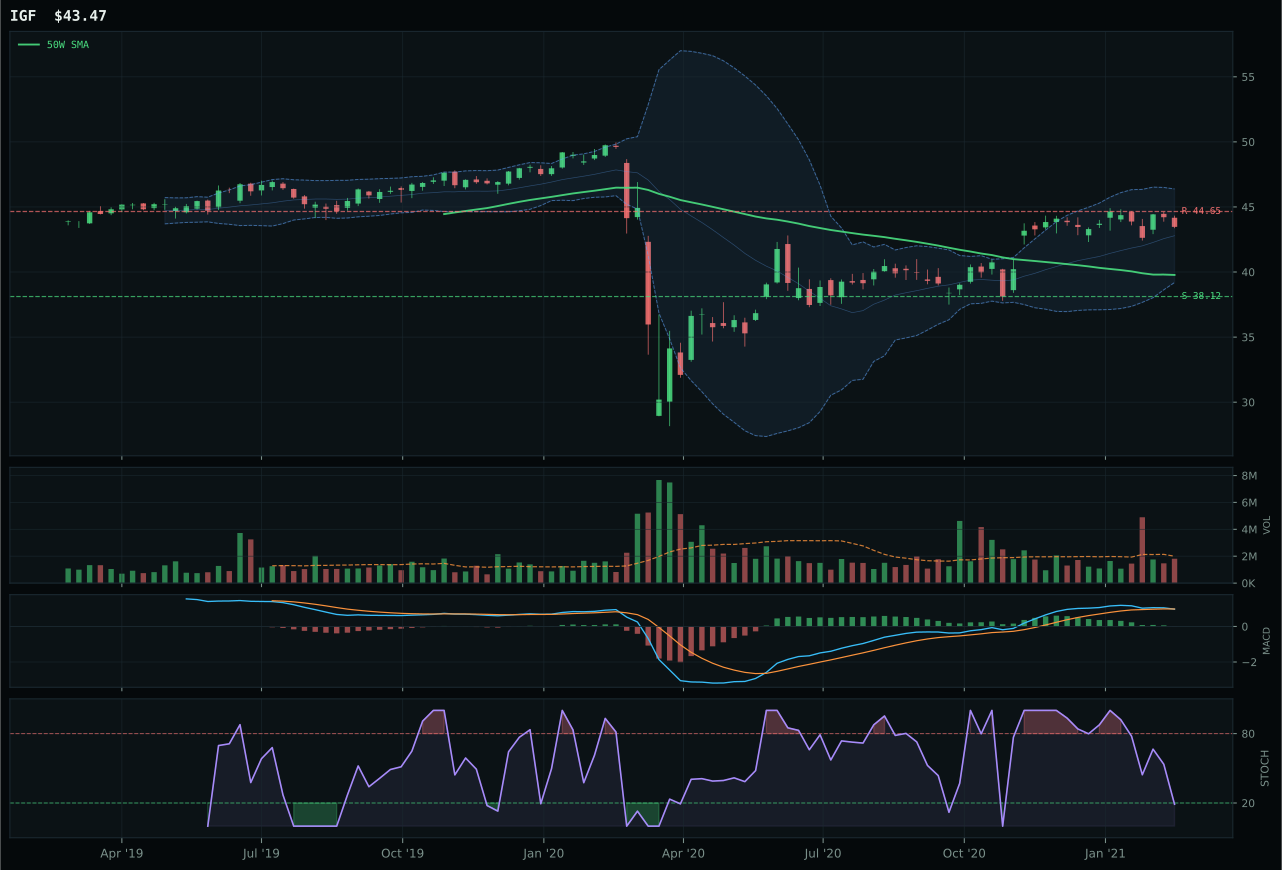
IGF has a neutral structure profile with -9.3% 13-week relative strength versus SPY.
A failed hold above support would weaken the setup.
Actionable but governed by invalidation levels.
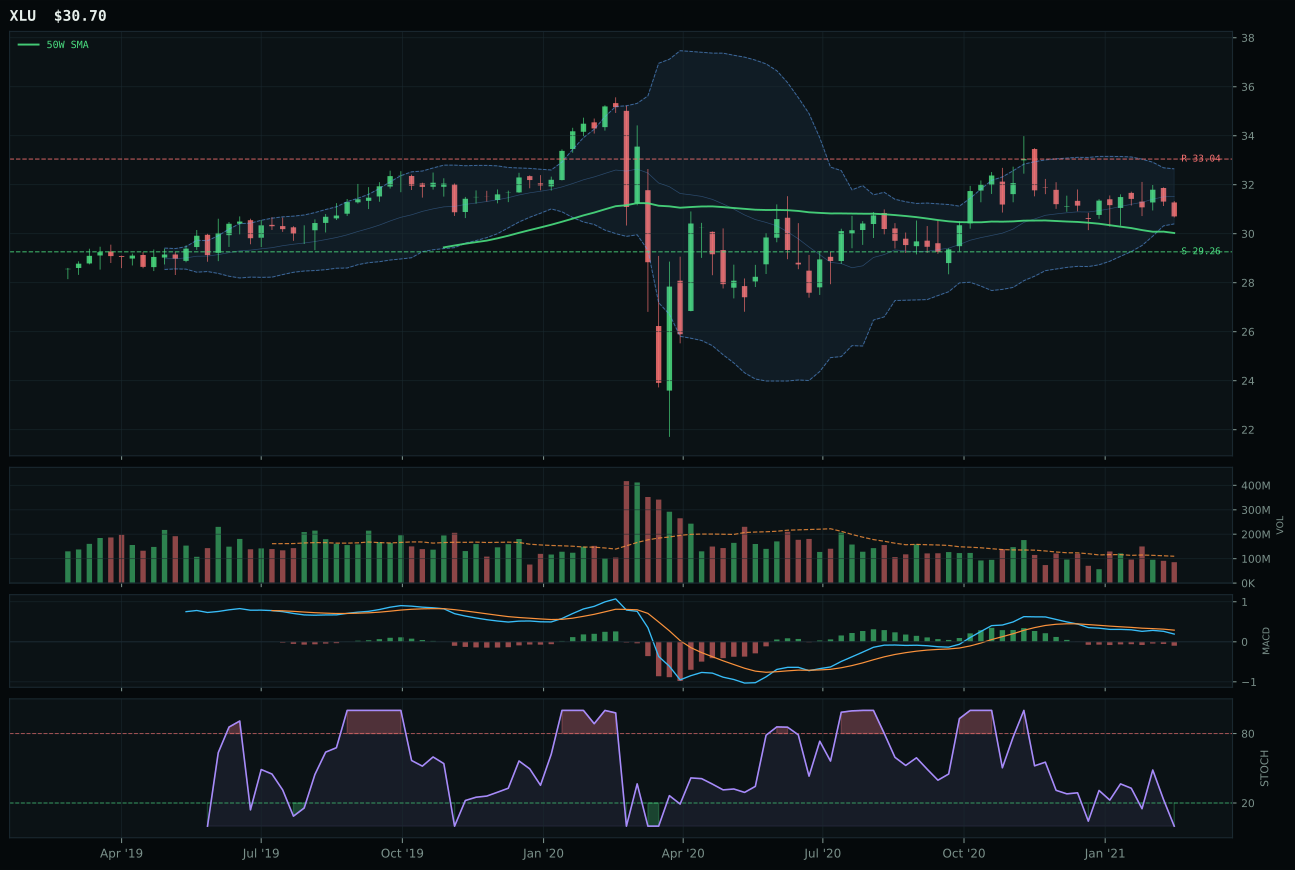
XLU has a pullback into support profile with -13.1% 13-week relative strength versus SPY.
A failed hold above support would weaken the setup.
Actionable but governed by invalidation levels.
PAVE wins Utilities & Infrastructure by a decisive 9.0 points over IGF by delivering clean uptrend structure where competitors falter into deterioration. The infrastructure ETF combines perfect trend confirmation (100.0 from price above both the 50-week and 200-week moving averages with positive slope), superior momentum (100.0 for 13-week 14.2% return and 13.8% category-relative strength), and crucially, a 68.5/100 technical evidence score against IGF's 32.7. MACD is bullish if flattening, stochastic RSI rises through mid-zone at 0.47, and volume is neutral—all legitimate but not exceptional. IGF, by contrast, shows bearish/weakening MACD, oversold stochastic RSI, neutral structure setup, and weak relative strength of -9.3% versus SPY. The 32.9% extension from the 50-week for PAVE is material, but not ruinous, and offers a far cleaner entry into the infrastructure thesis than IGF's deteriorating technical picture.
Utilities & Infrastructure earns 5% in tier-2 ranking with a category score of 41.4, the lowest allocation in the portfolio. The category's 46.0/100 macro fit reflects conflicting signals: Transition/Mixed helps slightly (+4), but inflation pressure active is a headwind (-6) for yield-dependent infrastructure, and risk appetite positive subtracts (-2) as risk seekers rotate away from defensive dividend themes. The 4.5% relative strength for PAVE versus SPY is marginal, and neutral volume participation signals no institutional urgency. To earn higher allocation, Utilities would require either a dramatic reversal in risk appetite (defensive rotation on equity fear) or specific inflation-driven capex tailwinds (fiscal infrastructure spending, renewable subsidy acceleration). At current portfolio positioning, with real assets (metals, energy, agriculture) commanding top-2 slots and growth assets (technology, AI) holding tier-2, defensive utilities occupy the lowest priority. The 5% allocation provides exposure to a category that is technically intact but macro-starved, serving as a safety valve if risk appetite deteriorates. Any further deterioration in stochastic RSI or breakdown below the 50-week moving average would trigger removal from the portfolio entirely.
Nuclear Energy — URA
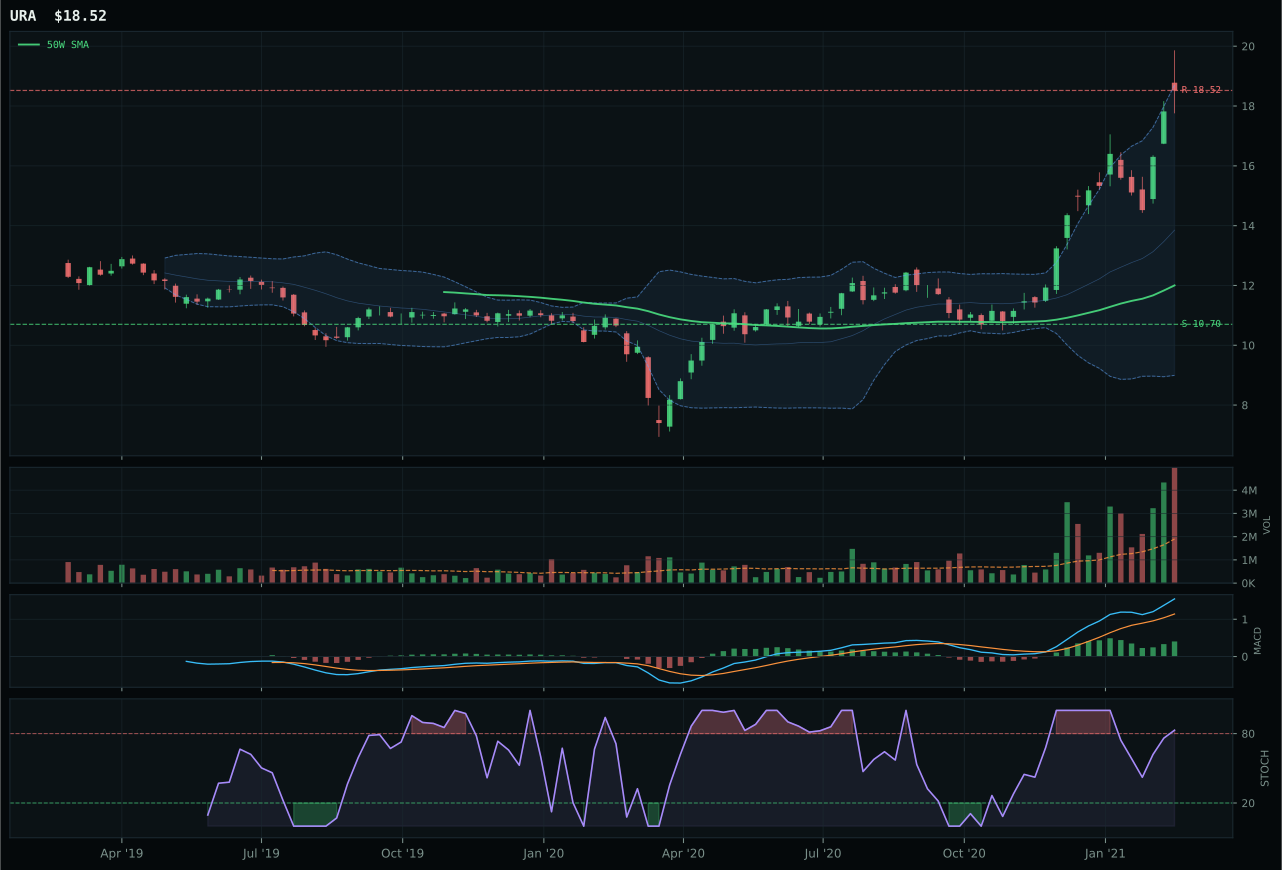
URA has a vertical extension profile with 52.3% 13-week relative strength versus SPY.
A failed hold above support would weaken the setup.
Actionable but governed by invalidation levels.
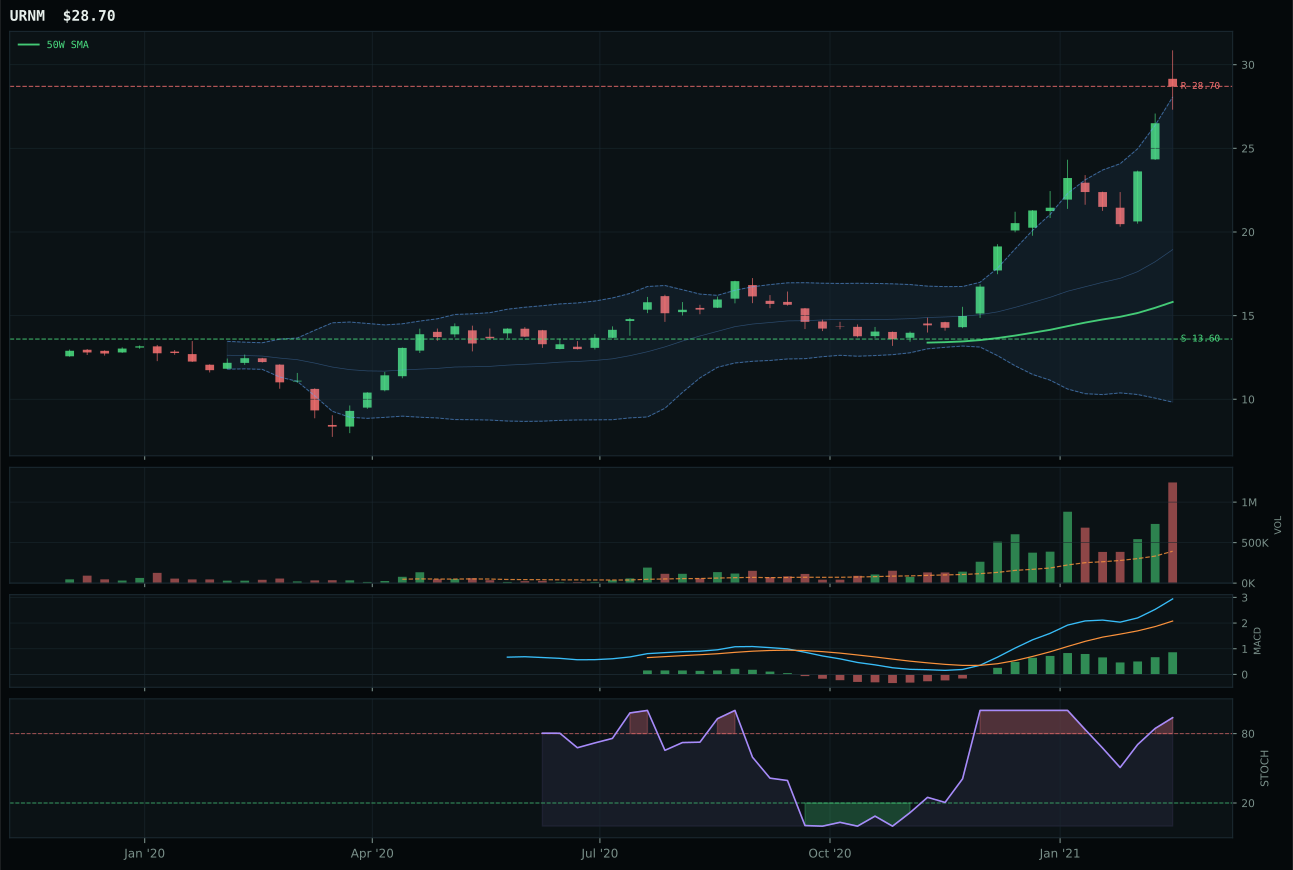
URNM has a vertical extension profile with 91.3% 13-week relative strength versus SPY.
A failed hold above support would weaken the setup.
Tracked, but not top-2 eligible because: .
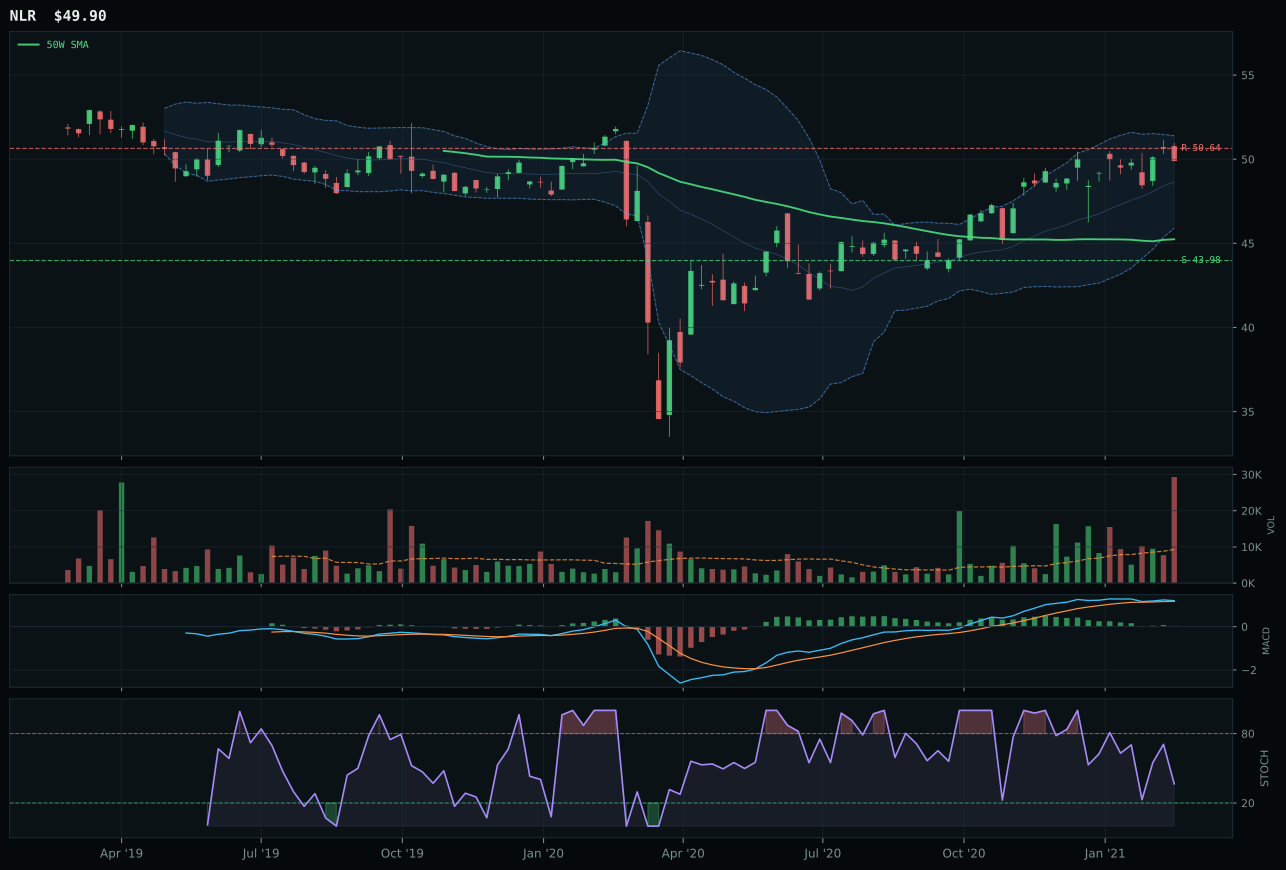
NLR has a neutral structure profile with -7.0% 13-week relative strength versus SPY.
A failed hold above support would weaken the setup.
Tracked, but not top-2 eligible because: .
URA wins Nuclear Energy decisively, but the category earns 0% allocation because it ranks 9th or 10th overall. The uranium ETF shows exceptional technical merit: 62.0% in 13 weeks, 52.3% relative strength versus SPY, and momentum persistence at 100.0 with volume at 3.32x average (accumulation/confirmation). MACD is bullish and improving, stochastic RSI sits overbought but not rolling over, and structure is clean at 82.8. The 54.3% extension from the 50-week moving average is steep, but this is the cleanest institutional accumulation in the portfolio outside of copper. URNM loses decisively because it is far more extended at 81.4%, carries excessive -7% SPY-relative strength at -7 in the descriptor checklist, and shows weaker timing (37.0 vs 45.0)—this is a speculative bubble next to URA's genuine supply-narrative accumulation.
Nuclear Energy earns 0% allocation this week, ranking 9th or 10th, because category-level macro fit is only 50.0/100 despite URA's exceptional 96.4 technical evidence. The fundamental problem: no category-specific descriptor profile exists to anchor the narrative. Energy scarcity is active at +9 and real asset sponsorship at +7, but these same descriptors favor Traditional Energy (85.0 category fit) and Industrial Metals (73.0) far more directly. Nuclear lacks the supply-shortage signal that drives copper and agricultural prices, and it lacks the geopolitical urgency that backs crude oil. Risk appetite remains positive, which is neutral-to-negative for a speculative commodity play with binary regulatory and adoption risks. URA's technical excellence is real, but technique cannot overcome portfolio discipline: in a mixed macro regime with limited capital allocation, categories with stronger macro fit and comparable technicals (Industrial Metals, Energy) must receive priority. Nuclear would earn allocation only if energy scarcity narratives intensify specifically around grid capacity and coal retirement, or if risk appetite turns negative and URA's technical break sustains on macro rebalancing rather than pure momentum.
Precious Metals — SLV
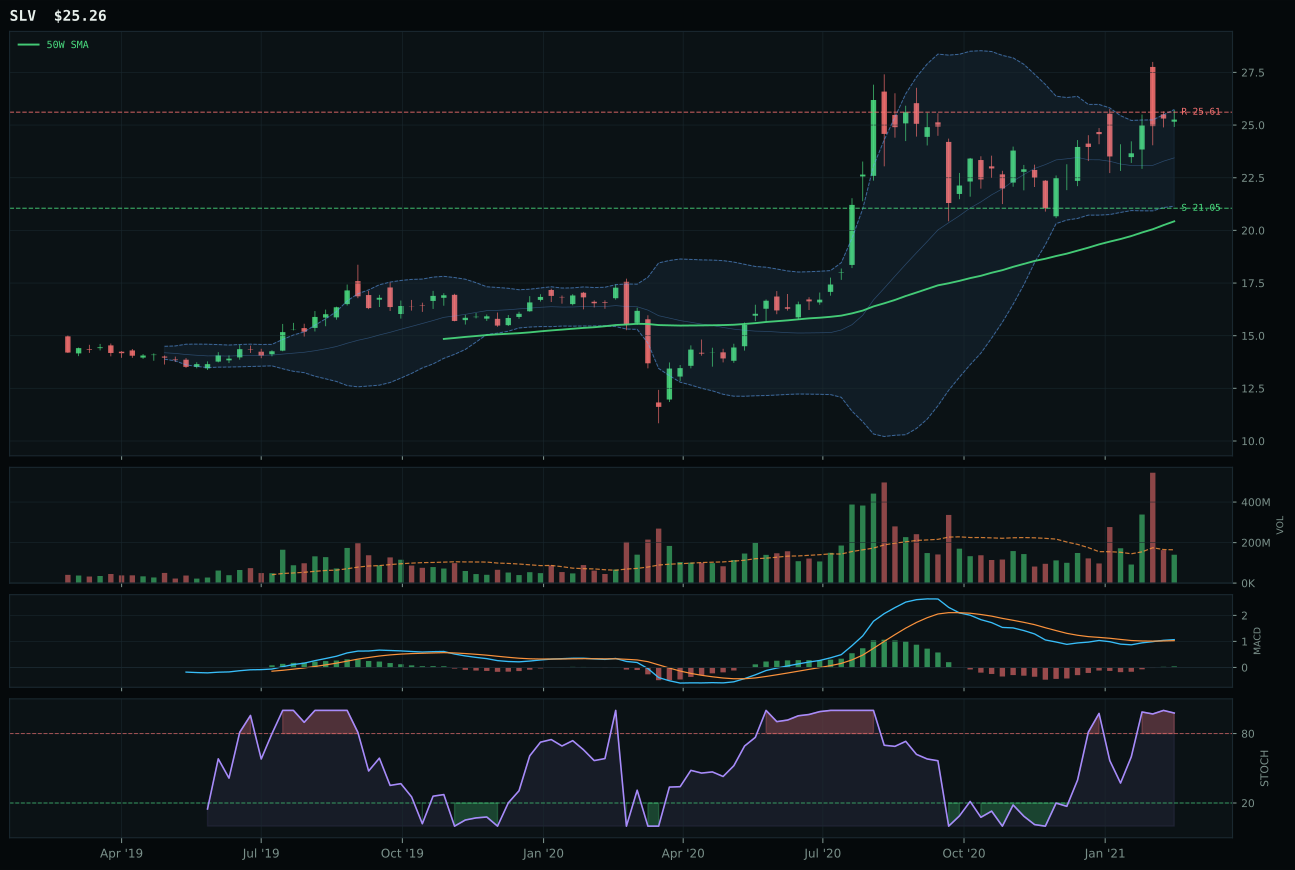
SLV has a vertical extension profile with 2.6% 13-week relative strength versus SPY.
A failed hold above support would weaken the setup.
Actionable but governed by invalidation levels.
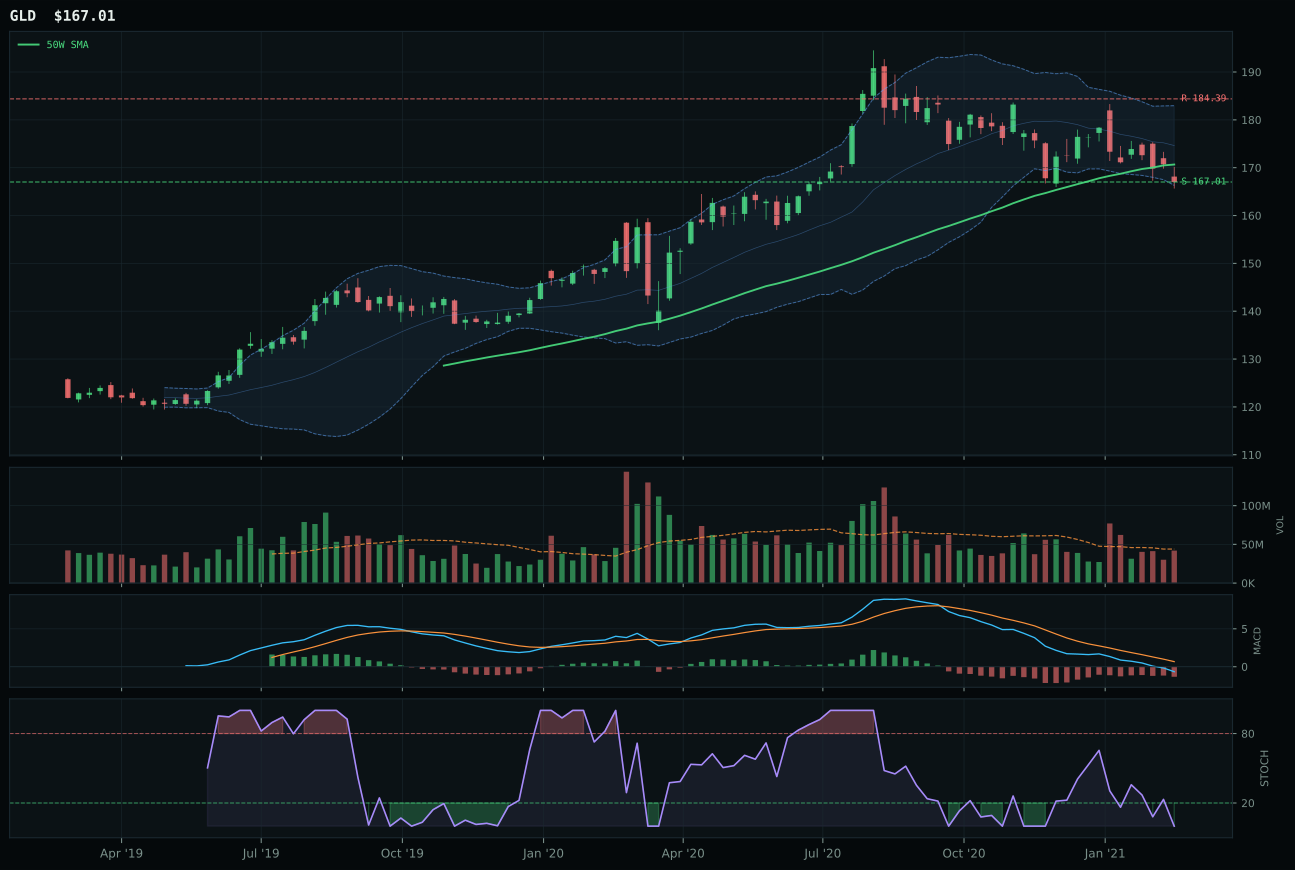
GLD has a pullback into support profile with -14.7% 13-week relative strength versus SPY.
A failed hold above support would weaken the setup.
Actionable but governed by invalidation levels.
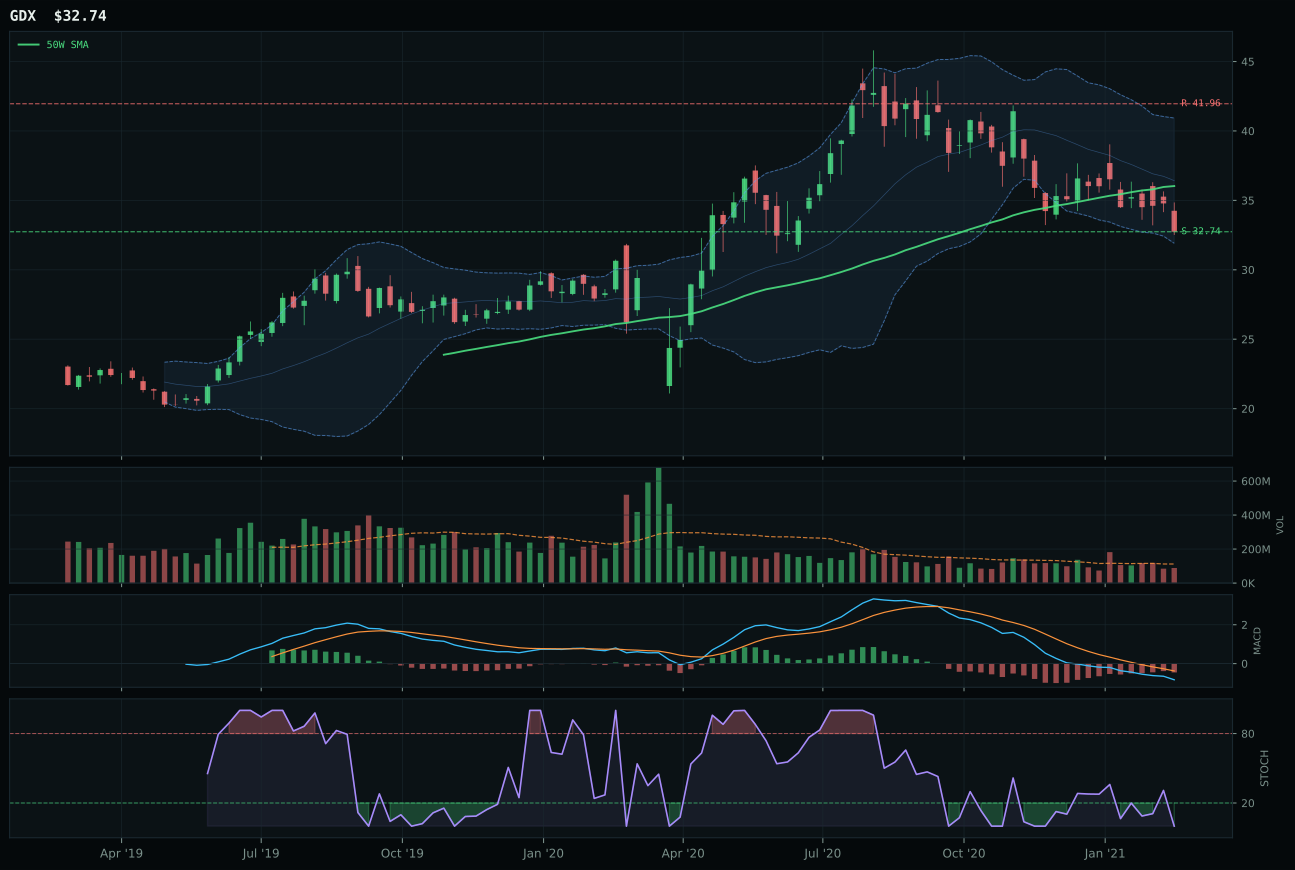
GDX has a pullback into support profile with -18.6% 13-week relative strength versus SPY.
A failed hold above support would weaken the setup.
Actionable but governed by invalidation levels.
SLV wins a weak category by a clear 16.1-point margin, but remains excluded from the portfolio because Precious Metals as a whole ranks 9th or 10th. The silver ETF shows legitimate strength: 12.3% in 13 weeks, 2.6% relative strength versus SPY, and MACD bullish and improving. Stochastic RSI at 0.98 is overbought and rolling over, however, which dents timing to 35.0. Volume is neutral, not accumulation, suggesting the move is running on momentum rather than fresh institutional buying. More damaging, GLD (the traditional hedge) has deteriorated into bearish/weakening MACD and oversold stochastic RSI, indicating gold-as-monetary-hedge is actively losing traction. Category-relative strength of 17.3% for SLV means silver is winning against a basket that includes a deteriorating monetary hedge and mining stocks struggling with valuation, not against SPY. The true issue: in a risk-appetite-positive regime, safe-haven metals attract neither momentum nor accumulation.
Precious Metals earns 0% allocation this week, ranking 9th or 10th, because the category-level macro fit registers only 46.0/100 and the active descriptor checklist provides weak support. Risk appetite is marked positive (a headwind for traditional hedges at -4), and while inflation pressure is active and metals scarcity is active (+7), these tailwinds are overwhelmed by the regime itself: in Transition/Mixed with risk appetite positive, investors rotate away from monetary hedges into real assets with inflation sensitivity and growth optionality. SLV's technical score of 65.3 is respectable, but the 39.2 category final reflects that GLD and GDX are deteriorating while the macro environment starves the complex of natural buyers. Precious metals would earn allocation only if either risk appetite turns negative sharply (triggering defensive rotation) or if inflation pressure intensifies enough to overcome the positive risk-appetite signal—neither condition holds. Until credit stress activates or equity volatility spikes, this category remains outside the portfolio entirely.