
2021-02-12
Informational purposes only. The content in this report, including allocations, analysis, and commentary, is provided solely for informational and educational purposes. It does not constitute financial advice, investment advice, trading advice, or any other type of advice. Past performance does not guarantee future results. Always conduct your own research and consult a qualified financial professional before making investment decisions.
Some tracked tickers were excluded due to missing live weekly price data: SGOV: Historical cache SGOV has only 37 usable weekly bars
Weekly Allocation
| Ticker | Category | Weight | Role |
|---|---|---|---|
| FSOL | 50% | Overlay | |
| REMX | Industrial Metals | 10% | Top-2 (10%) |
| XOP | Traditional Energy | 10% | Top-2 (10%) |
| SMH | AI | 5% | Tier-2 (5%) |
| IEMG | Emerging Markets | 5% | Tier-2 (5%) |
| MOO | Agriculture & Livestock | 5% | Tier-2 (5%) |
| IGV | Technology | 5% | Tier-2 (5%) |
| XAR | Defense & Aerospace | 5% | Tier-2 (5%) |
| XLU | Utilities & Infrastructure | 5% | Tier-2 (5%) |
Trade Instructions — Monday Open
Sell the tranche from 2021-01-15 (completing its 4-week hold). Buy the new tranche. Instructions show net portfolio changes — same-asset positions cancel, weight changes show the delta.
| Action | Ticker | Instruction |
|---|---|---|
| SELL | FBTC | Sell entire FBTC position (12.50% of portfolio) |
| SELL | WEAT | Sell entire WEAT position (1.25% of portfolio) |
| SELL | XLK | Sell 33% of XLK position (reduce 3.75% → 2.50%) |
| SELL | URA | Sell 50% of URA position (reduce 2.50% → 1.25%) |
| SELL | GLD | Sell entire GLD position (1.25% of portfolio) |
| BUY | FSOL | Buy FSOL — 71.43% of freed cash (adds 12.50% to portfolio) |
| BUY | IEMG | Buy IEMG — 7.14% of freed cash (adds 1.25% to portfolio) |
| BUY | MOO | Buy MOO — 7.14% of freed cash (adds 1.25% to portfolio) |
| BUY | XLU | Buy XLU — 7.14% of freed cash (adds 1.25% to portfolio) |
| BUY | IGV | Buy IGV — 7.14% of freed cash (adds 1.25% to portfolio) |
Current Portfolio After Trade
Combined holdings across all 4 active tranches. Each tranche is 25% of the portfolio.
| Ticker | % of Portfolio | Weight Bar |
|---|---|---|
| FSOL | 50.00% | |
| XOP | 7.50% | |
| COPX | 6.25% | |
| IEMG | 6.25% | |
| SMH | 5.00% | |
| MOO | 5.00% | |
| XAR | 3.75% | |
| XLU | 3.75% | |
| XLK | 2.50% | |
| FCG | 2.50% | |
| IGV | 2.50% | |
| REMX | 2.50% | |
| URA | 1.25% | |
| ITA | 1.25% |
Macro Regime — Transition / Mixed
Macro Evidence Charts
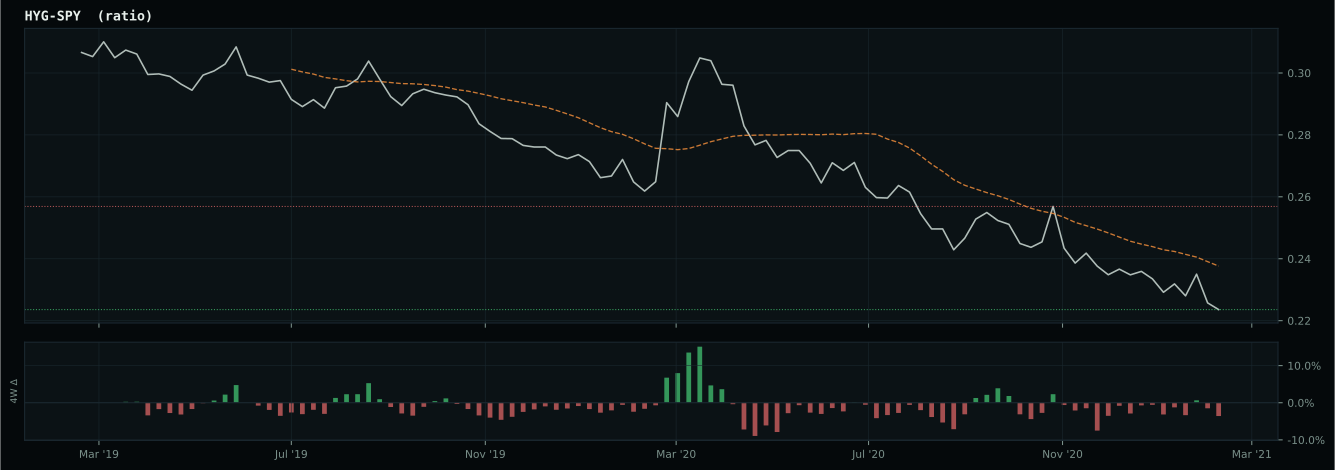
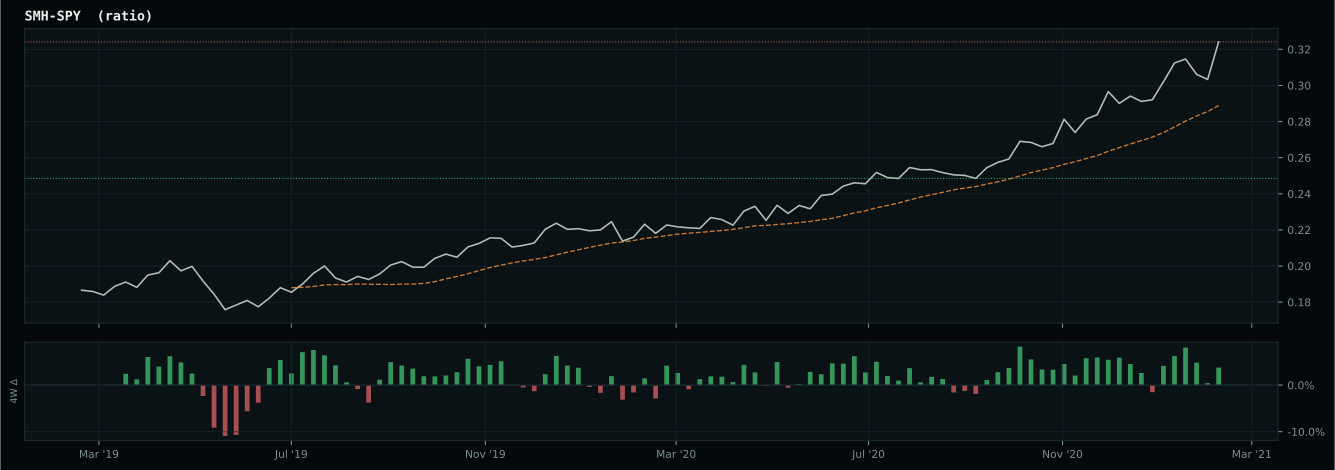
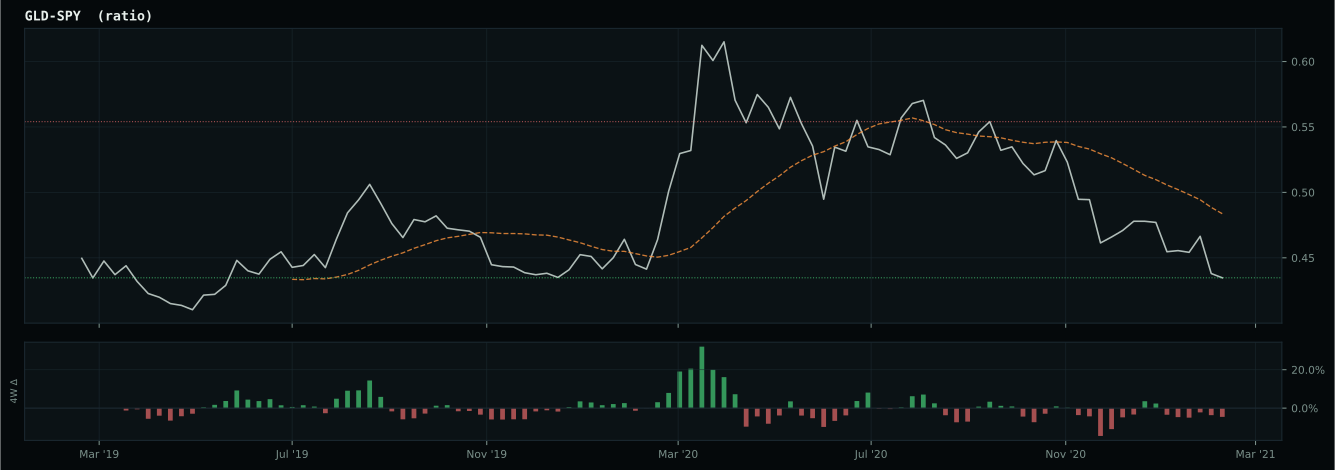
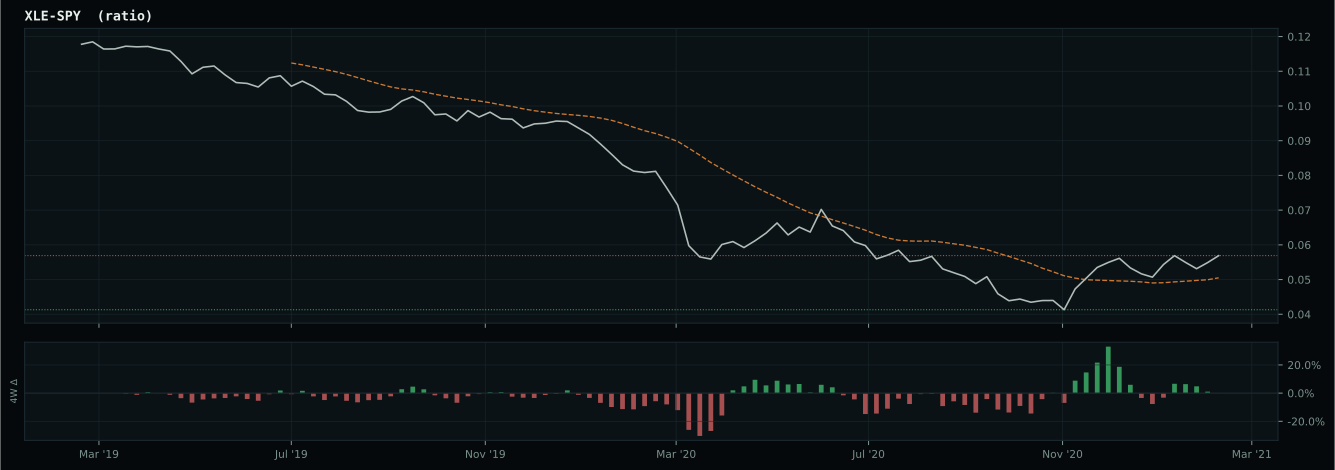
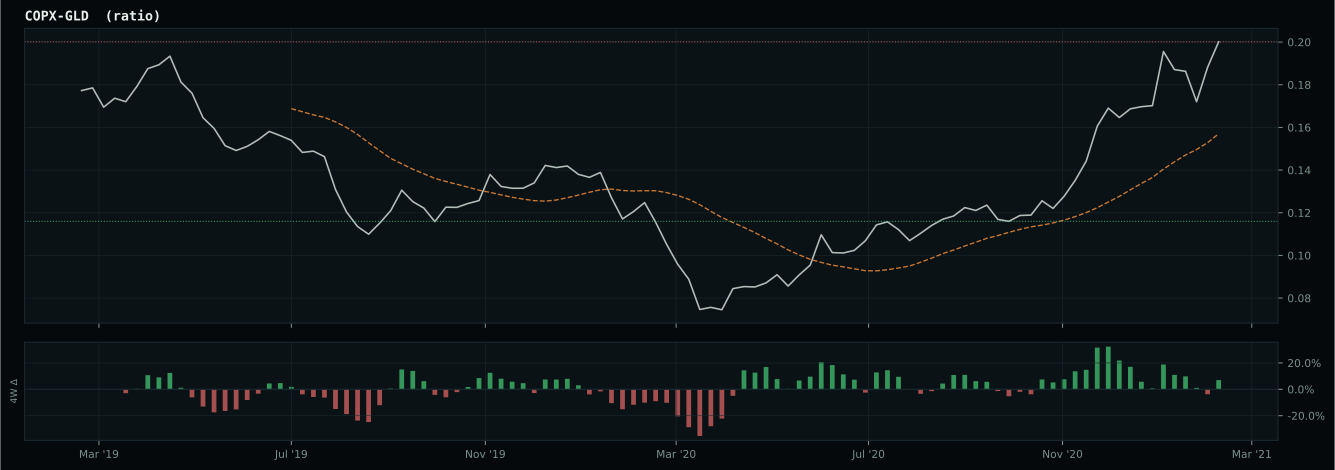
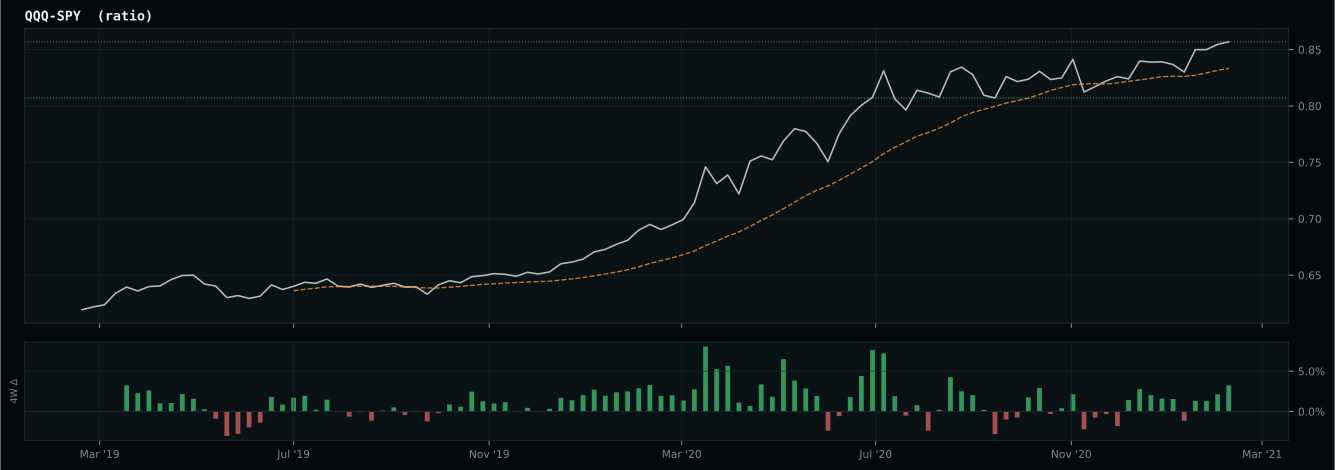
Market-implied signals behind the macro regime scores. Each ratio compares two assets; the direction and slope of the ratio is what the macro engine reads.
Crypto Regime — AltSeason
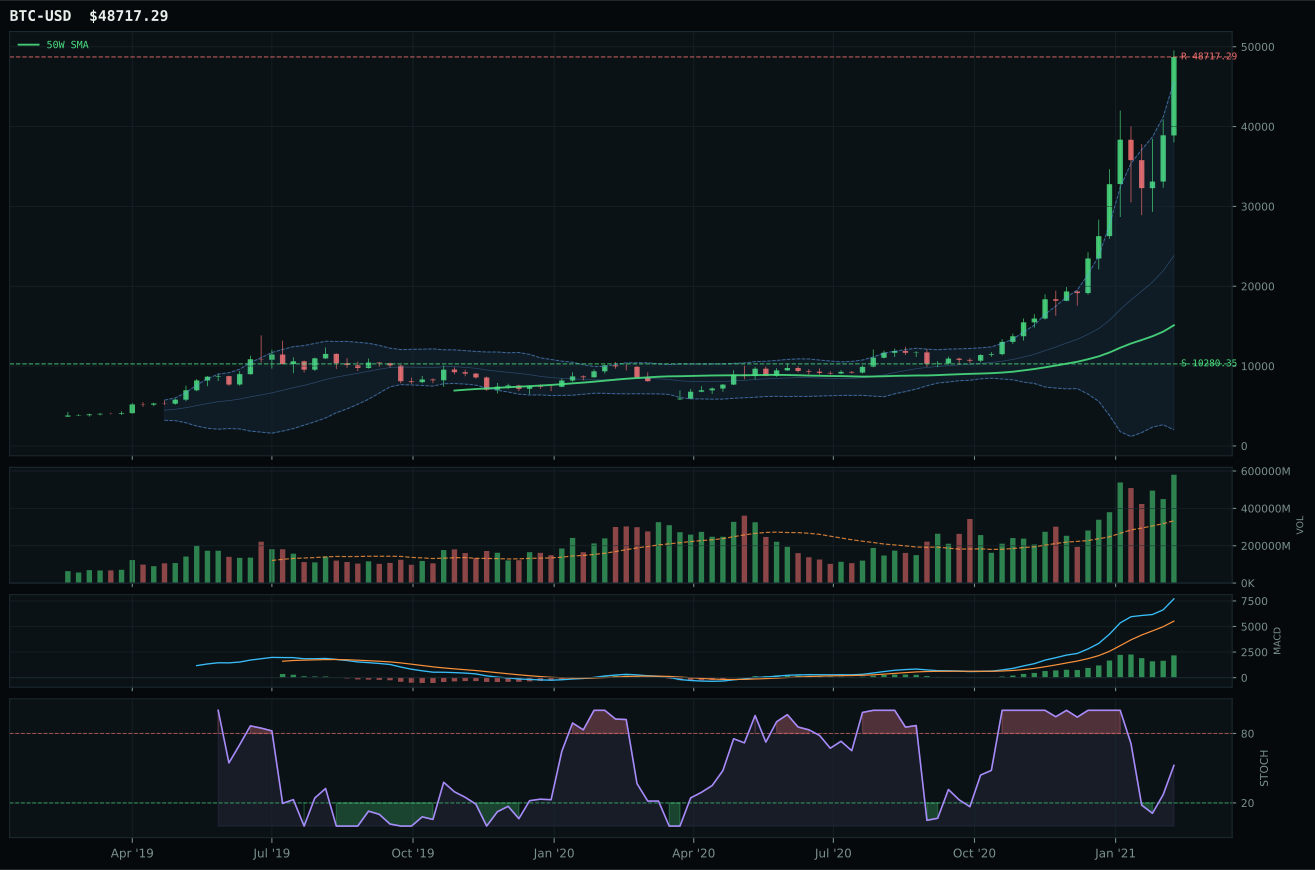
post-touch structure is too wide to count as a range; max/min close ratio is 7.21
TrendBTC confirmed: 2 consecutive closes above rising/flat 50W SMA
all available AltSeason conditions pass; missing optional confirmations skipped

Category Rankings
| Rank | Category | Winner | Score | Alloc | 4W Ret | Peers (4W) |
|---|---|---|---|---|---|---|
| 1 | Industrial Metals | REMX | 81.9 | 20% | -7.70% | COPX +6.8% · PICK +4.3% |
| 2 | Traditional Energy | XOP | 75.8 | 20% | +15.49% | FCG +16.8% · XLE +17.0% |
| 3 | AI | SMH | 64.7 | 10% | -9.99% | AIQ -6.6% · BOTZ -8.9% |
| 4 | Emerging Markets | IEMG | 62.0 | 10% | -7.00% | ILF -5.1% · INDA -1.2% |
| 5 | Agriculture & Livestock | MOO | 59.2 | 10% | +2.98% | VEGI +5.3% · WEAT -1.3% |
| 6 | Technology | IGV | 58.4 | 10% | -10.63% | XLK -5.5% · CIBR -8.3% |
| 7 | Defense & Aerospace | XAR | 53.1 | 10% | +1.22% | ROKT +0.9% · ITA +8.1% |
| 8 | Utilities & Infrastructure | XLU | 50.8 | 10% | -0.08% | PAVE +9.3% · IGF +2.9% |
| 9 | Precious Metals | SLV | 48.8 | 0% | -3.54% | GLD -3.5% · GDX -3.0% |
| 10 | Nuclear Energy | URA | 43.8 | 0% | +2.72% | URNM -0.1% · NLR +1.8% |
Industrial Metals — REMX
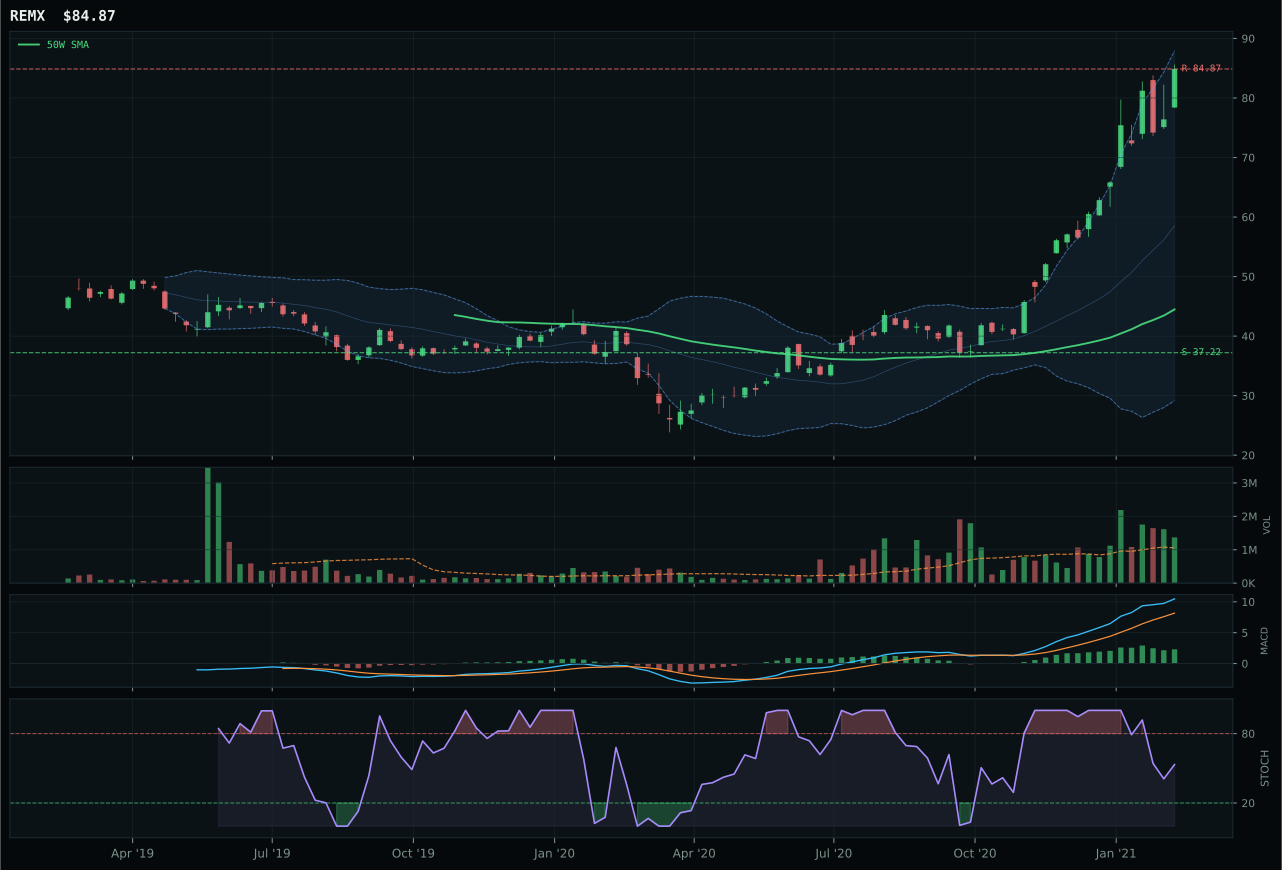
REMX has a vertical extension profile with 66.1% 13-week relative strength versus SPY.
A failed hold above support would weaken the setup.
Actionable but governed by invalidation levels.
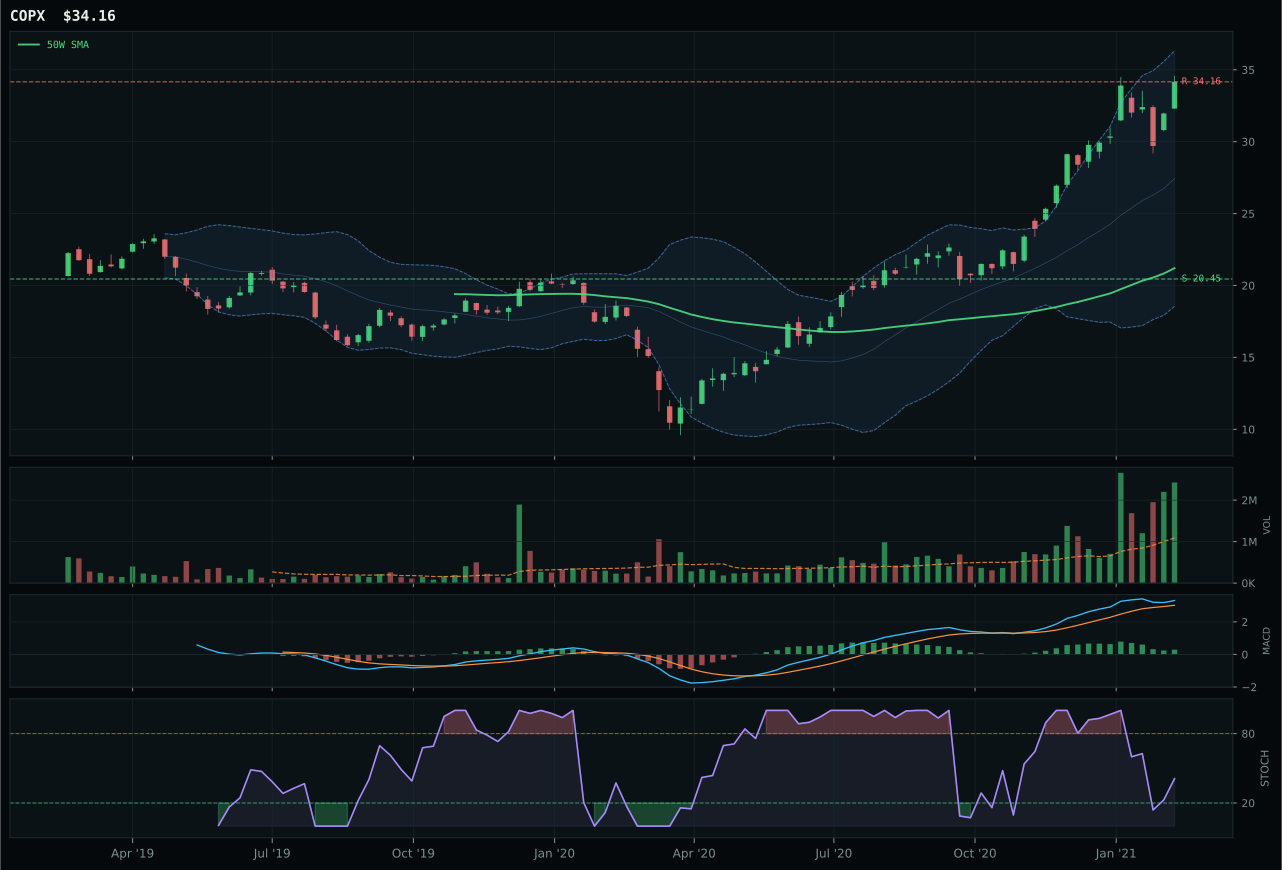
COPX has a vertical extension profile with 33.0% 13-week relative strength versus SPY.
A failed hold above support would weaken the setup.
Actionable but governed by invalidation levels.
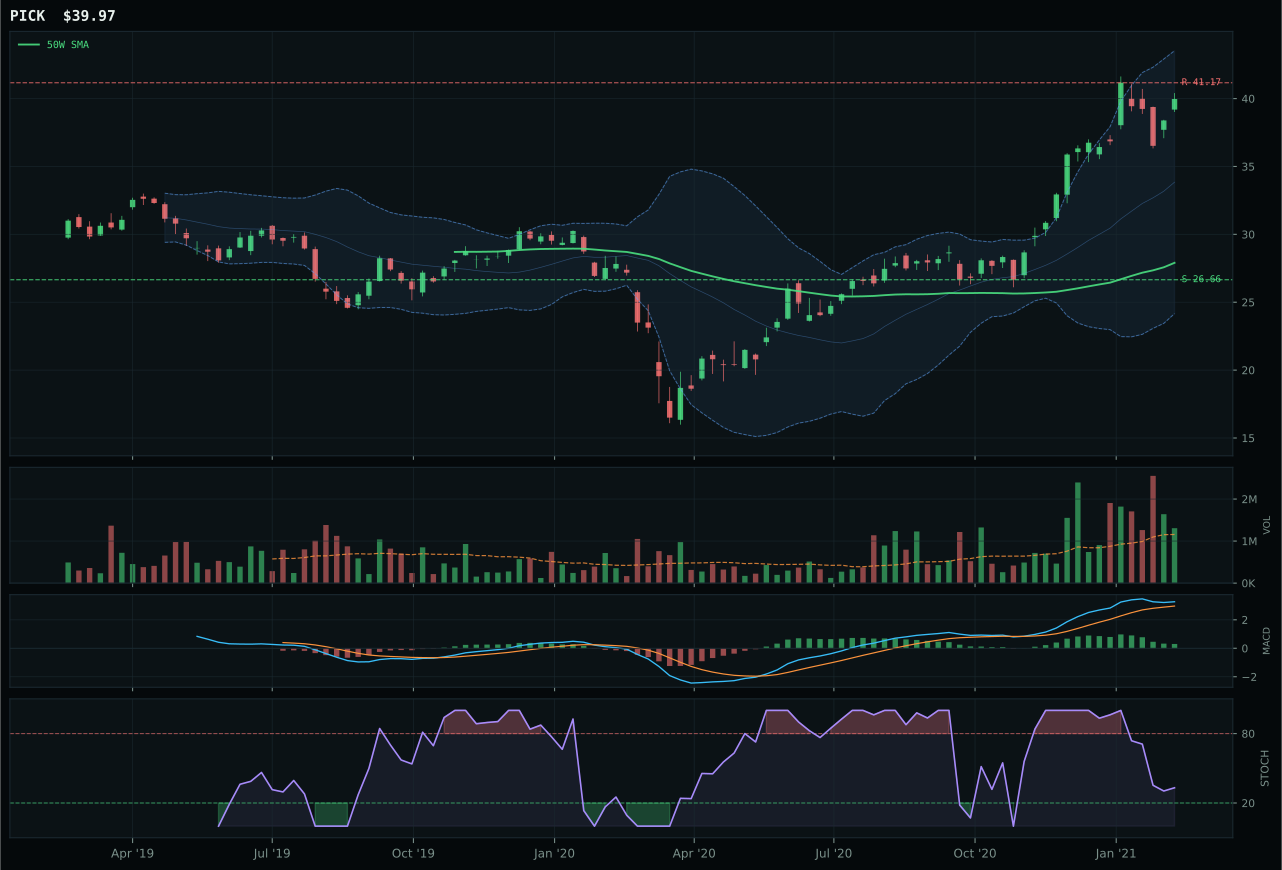
PICK has a vertical extension profile with 24.1% 13-week relative strength versus SPY.
A failed hold above support would weaken the setup.
Actionable but governed by invalidation levels.
REMX dominates Industrial Metals with a 33.1% category-relative strength edge and persistence at 100.0/100—the highest persistence score in the entire portfolio—marking this as not just an extended move but a genuinely accumulated one. The 75.8% thirteen-week return and 66.1% SPY relative strength speak to a rare-earth supply-chain scarcity narrative that is driving not passive flows but active capital redeployment. At 90.8% extension above the 50W, REMX trades at an extreme entry risk, yet volume at 1.30x average and MACD bullish-but-flattening paired with stochastic RSI falling toward neutral at 0.53 tells a story of controlled strength—momentum is moderating but not reversing. COPX lost by just 1.8 points, a razor-thin margin, with equivalent momentum (100 for both) and timing (40), yet COPX surrenders because category-relative strength reads 0.0% while REMX claims 33.1%; in a heavily extended market, peer leadership becomes the tiebreaker, and REMX is the name that real money is flowing into within this tactical category.
Industrial Metals claims the top-2 10% overweight on an 81.9 final score—the second-highest score across all ten categories this week—and merits its elite positioning on both technical force and macro alignment. The category macro fit measures 73.0/100, with metals scarcity (+14), commodity breadth positive (+10), and real asset sponsorship (+6) creating the portfolio's most cohesive narrative support for this trade. REMX's 94.6 technical evidence score reflects trend (100), momentum (100), and volume-price confirmation (98.6) that is nearly perfect; the sole weakness is risk/reward at 38.1/100, driven by the 90.8% extension leaving no upside room to resistance. In an AltSeason regime with supply-shortage and inflation-pressure descriptors firing, this category represents a high-conviction bet on scarcity economics that justifies its top-2 slot despite entry risk. The allocation reflects a portfolio that is rotating hard into real assets; any pullback that resets REMX into the 50–60% extension zone while preserving the momentum narrative would create an even more compelling setup.
Traditional Energy — XOP
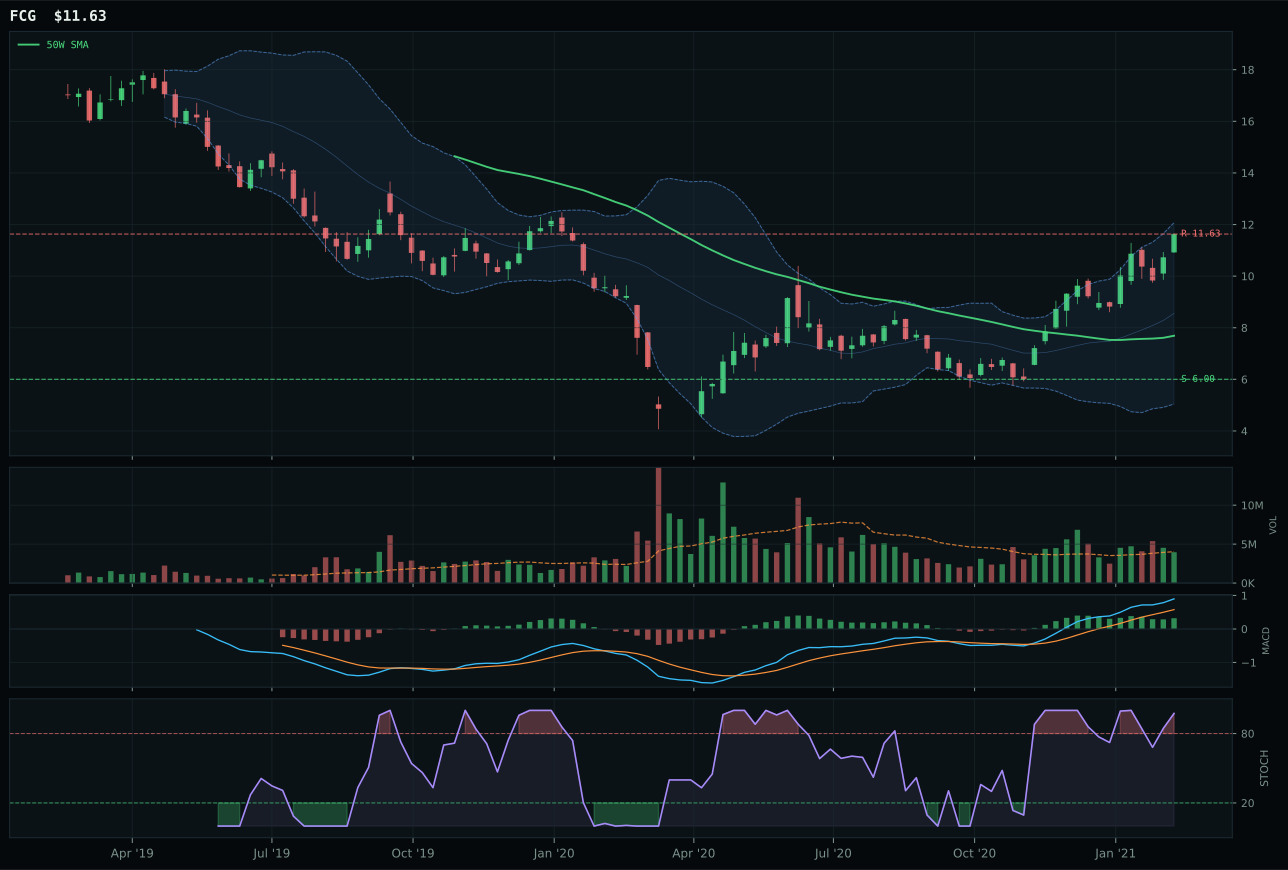
FCG has a vertical extension profile with 51.7% 13-week relative strength versus SPY.
A failed hold above support would weaken the setup.
Actionable but governed by invalidation levels.
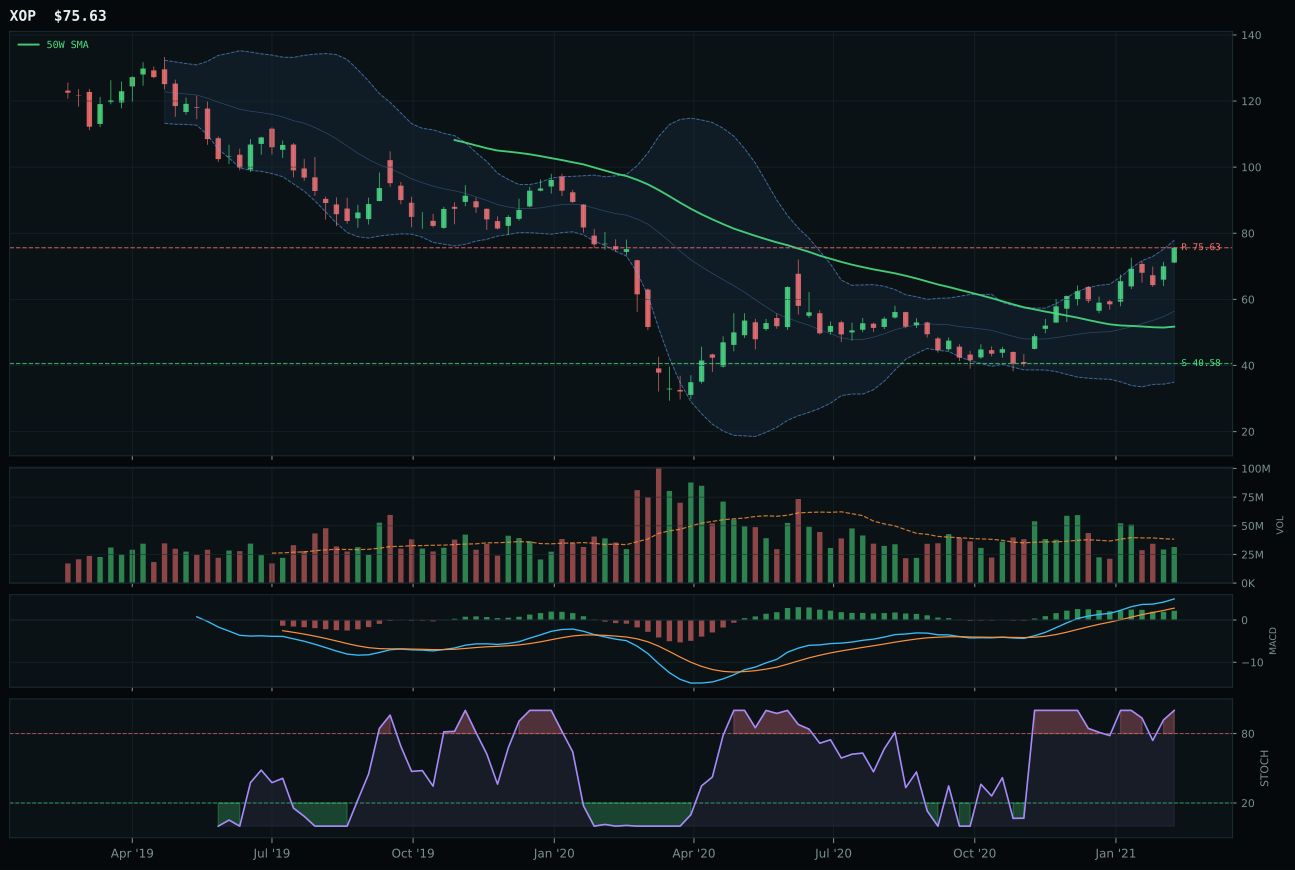
XOP has a vertical extension profile with 45.1% 13-week relative strength versus SPY.
A failed hold above support would weaken the setup.
Actionable but governed by invalidation levels.
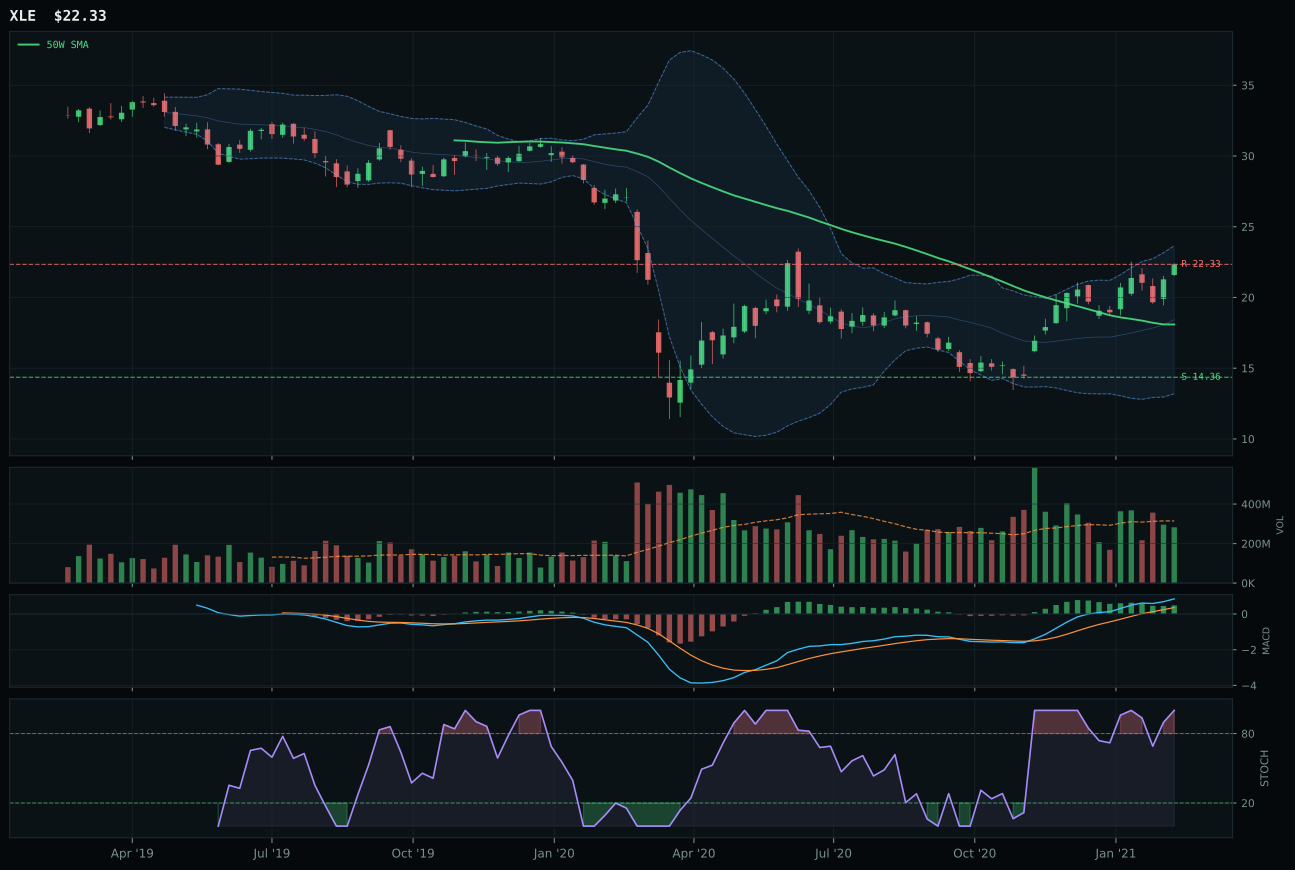
XLE has a vertical extension profile with 22.2% 13-week relative strength versus SPY.
A failed hold above support would weaken the setup.
Actionable but governed by invalidation levels.
XOP wins Traditional Energy by a margin so tight (0.1 points) that the decision rests on marginal technical differences rather than clear separation. Both XOP and FCG sit at vertical extension with identical timing scores (32/100) and identical momentum (100), yet XOP edges out the natural-gas leader on risk/reward (23.7 vs 23.5) and structure cleanliness (69.0 vs 68.6). More critically, XOP lands at a 46.1% extension versus FCG's 53.9%, meaning the allocation prefers the slightly less-stretched entry point even though FCG's 61.3% thirteen-week return and 51.7% SPY relative strength are superior. XOP's 54.8% thirteen-week return and 45.1% relative strength remain robust; the winner's advantage emerges from disciplined geometry rather than momentum power. Both trade on the same bullish-but-flattening MACD and overbought stochastic RSI at 1.00, but with volume at neutral for both, the tiebreaker favors XOP's more conservative position in the Fibonacci extension.
Traditional Energy ranks top-2 at 10% allocation on a 75.8 final score, earning its overweight slot on exceptional macro tailwinds and strong technical momentum despite visible entry risk. The category macro fit soars to 85.0/100—the highest macro score available—driven by energy scarcity (+16), inflation pressure (+10), supply shortage (+9), and real asset sponsorship (+7). These descriptors are not theoretical; they are actively shaping flows into a sector that just posted 54.8% thirteen-week returns on spot crude above $60 and geopolitical supply-risk intensity. XOP's weakness at 23.7/100 risk/reward (downside to support is 86.4%, meaning a break in trend exposes real loss potential) is the allocation's primary concern, yet it is outweighed by the narrative that energy scarcity and inflation are sustaining this trade through extended technicals. The top-2 positioning reflects a portfolio manager's conviction that macro regime change (Transition / Mixed tilting toward scarcity and inflation) justifies accepting overbought technicals; any failure of the support structure at 40.58 would trigger immediate rank demotion.
AI — SMH
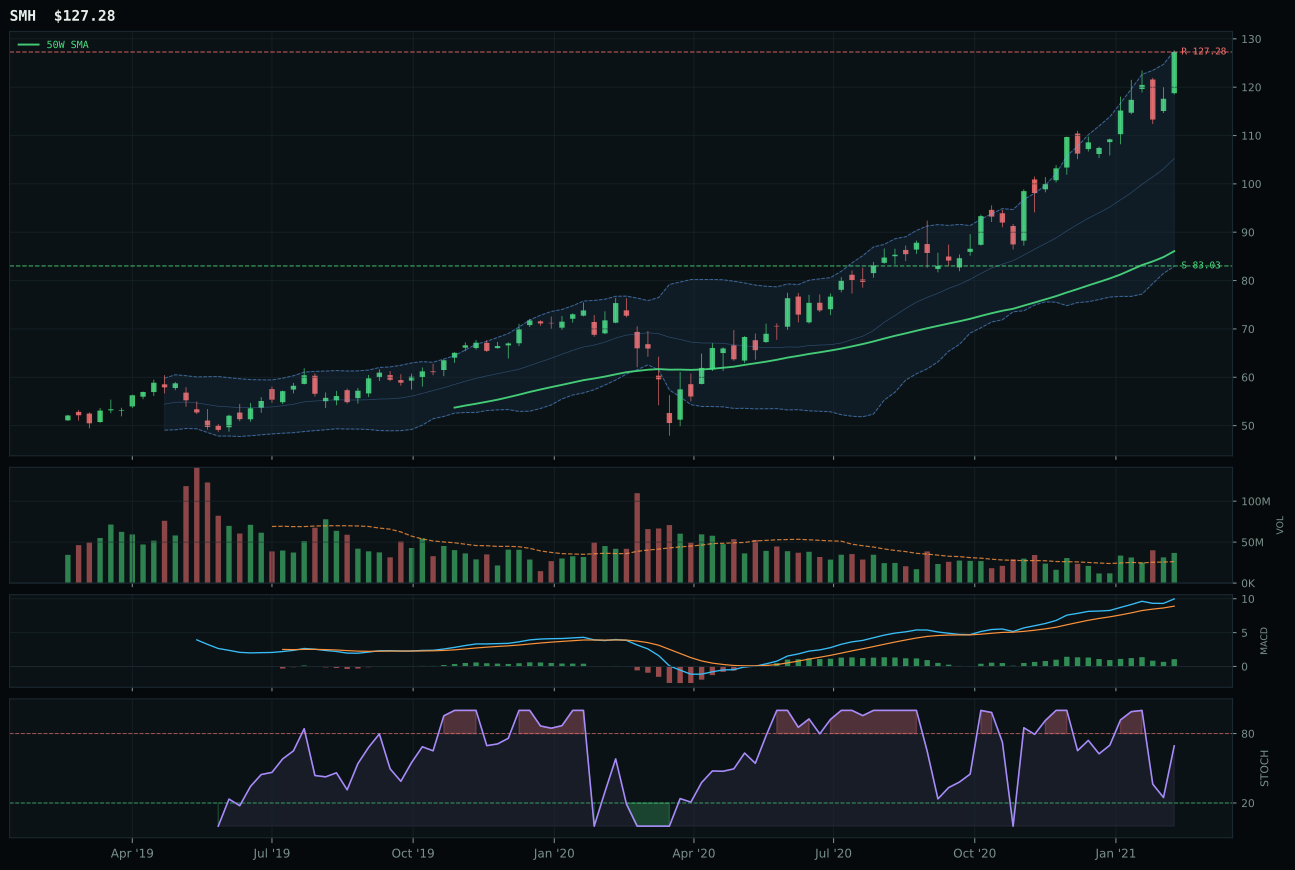
SMH has a vertical extension profile with 20.1% 13-week relative strength versus SPY.
A failed hold above support would weaken the setup.
Actionable but governed by invalidation levels.
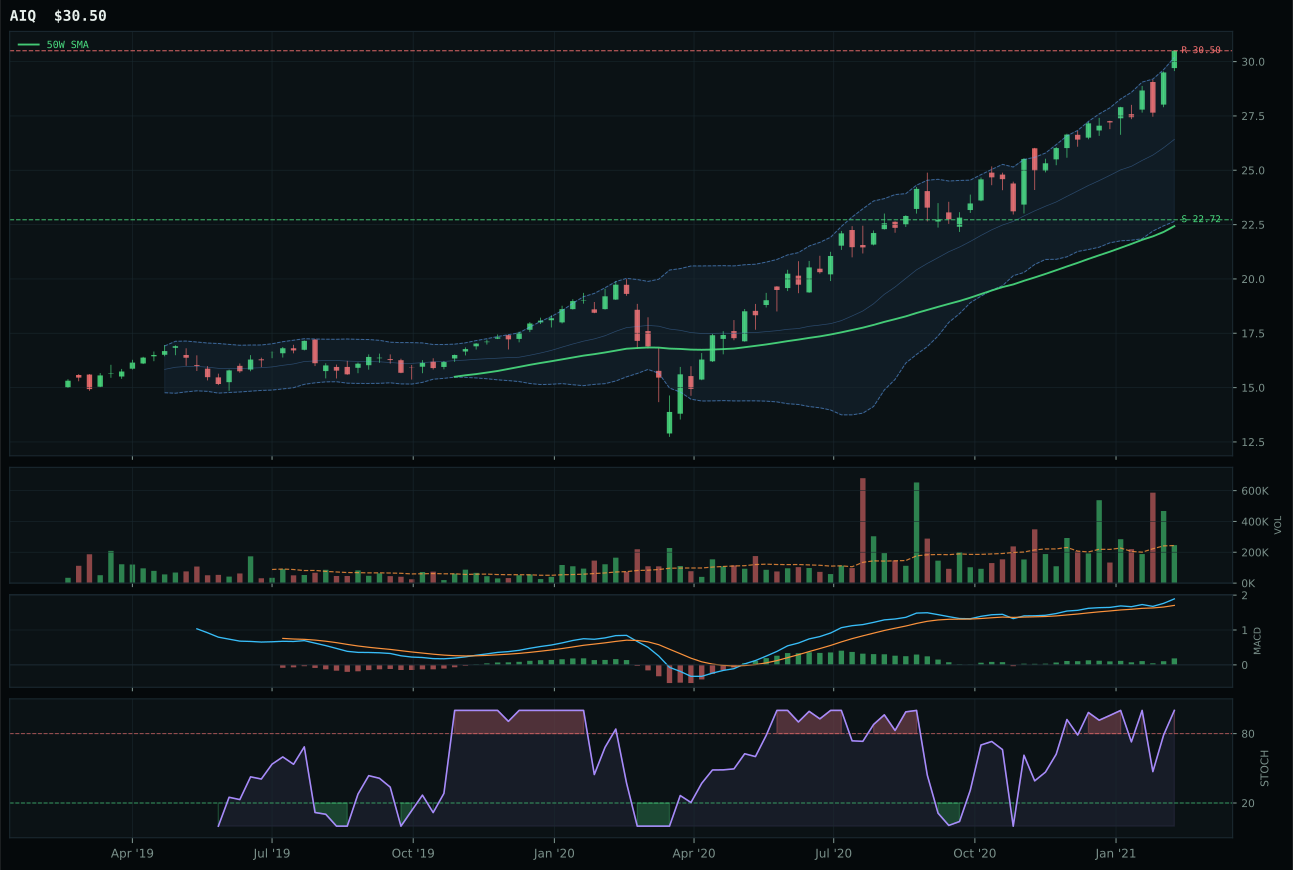
AIQ has a vertical extension profile with 12.4% 13-week relative strength versus SPY.
A failed hold above support would weaken the setup.
Tracked, but not top-2 eligible because: .
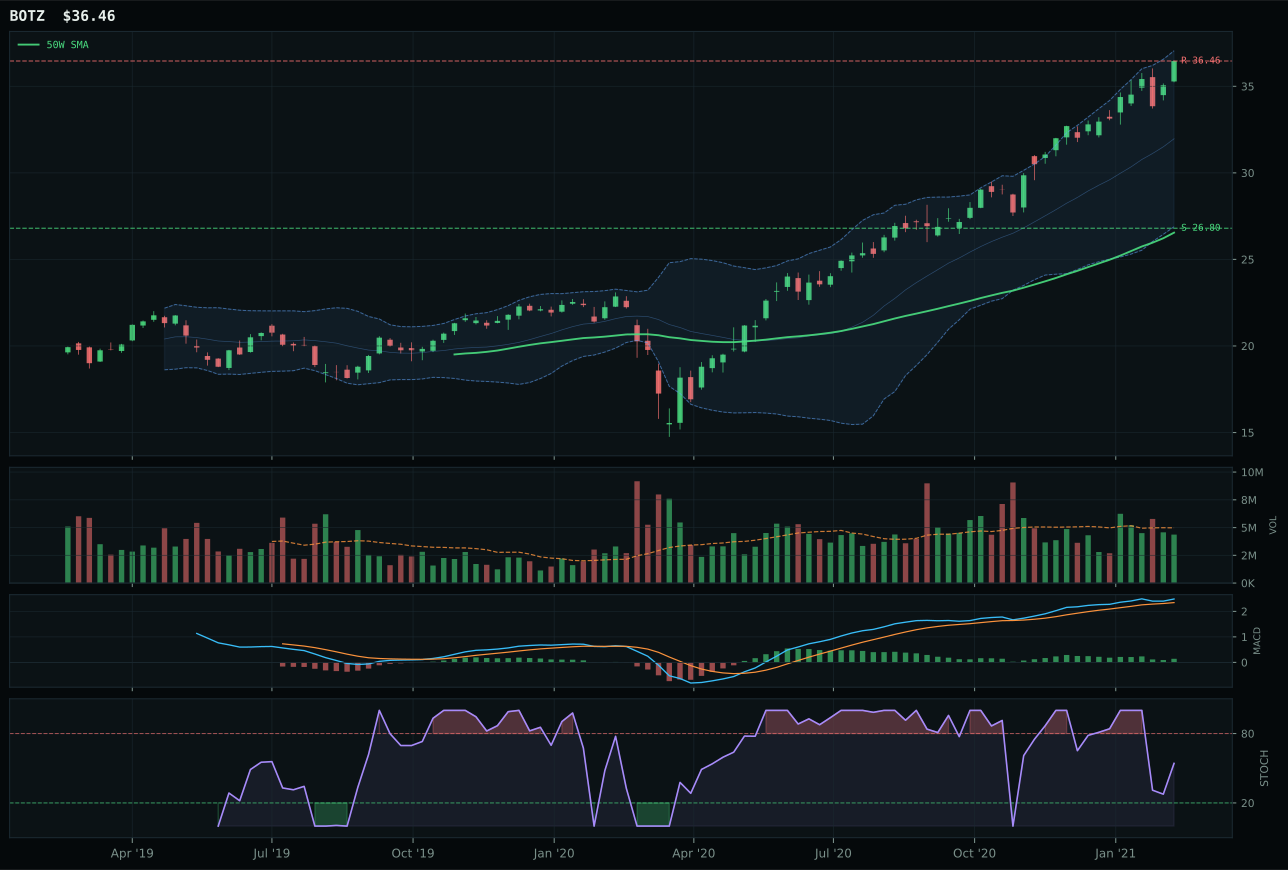
BOTZ has a vertical extension profile with 9.9% 13-week relative strength versus SPY.
A failed hold above support would weaken the setup.
Actionable but governed by invalidation levels.
SMH wins the AI category decisively on a 26.0-point gap versus AIQ, anchored by superior timing, structure quality, and volume confirmation that AIQ simply cannot match. At 47.8% extension above the 50W, SMH trades at a real entry penalty, yet the semiconductor leader compensates with above-average participation at 1.41x its twenty-week volume average—meaning accumulation is real—and a 7.7% category-relative strength edge that confirms this is the peer investors are actually deploying capital into. The 29.7% thirteen-week return paired with 20.1% SPY relative strength marks SMH as the clearest expression of AI compute leadership; MACD is bullish but flattening and stochastic RSI falling toward neutral at 0.69, signaling that momentum is cooling but not yet broken. AIQ's technical evidence came in at 41.0/100, a full 34.7 points below SMH's 75.7, because its volume sits neutral rather than accumulating and its category-relative strength remains flat at 0.0%, meaning it underperforms even the median of its own peer set despite posting a 12.4% SPY edge.
AI captures 5% allocation as a tier-2 category on a 64.7 final score, ranking below the two eligible leaders but earning enough technical and macro support to hold a meaningful position. The AI growth sponsorship descriptor is firing at a +14 weighting, and risk appetite positive adds another +10, creating a 66.0/100 category macro fit that is genuinely supportive. SMH's leadership draws from semiconductor scarcity, data-center demand, and the structural reshuffling of compute infrastructure—narratives that are macro-synchronized with current risk appetite. To reach top-2 status, this category would need either sharper volume confirmation at the representative level or a sharper pullback that resets the 47.8% extension into a cleaner entry. The current allocation reflects a portfolio manager's willingness to own AI exposure through a seasoned leader while acknowledging that entry risk and the category's sixth-overall ranking prevent it from joining the two commodities plays that are now dominating portfolio positioning.
Emerging Markets — IEMG
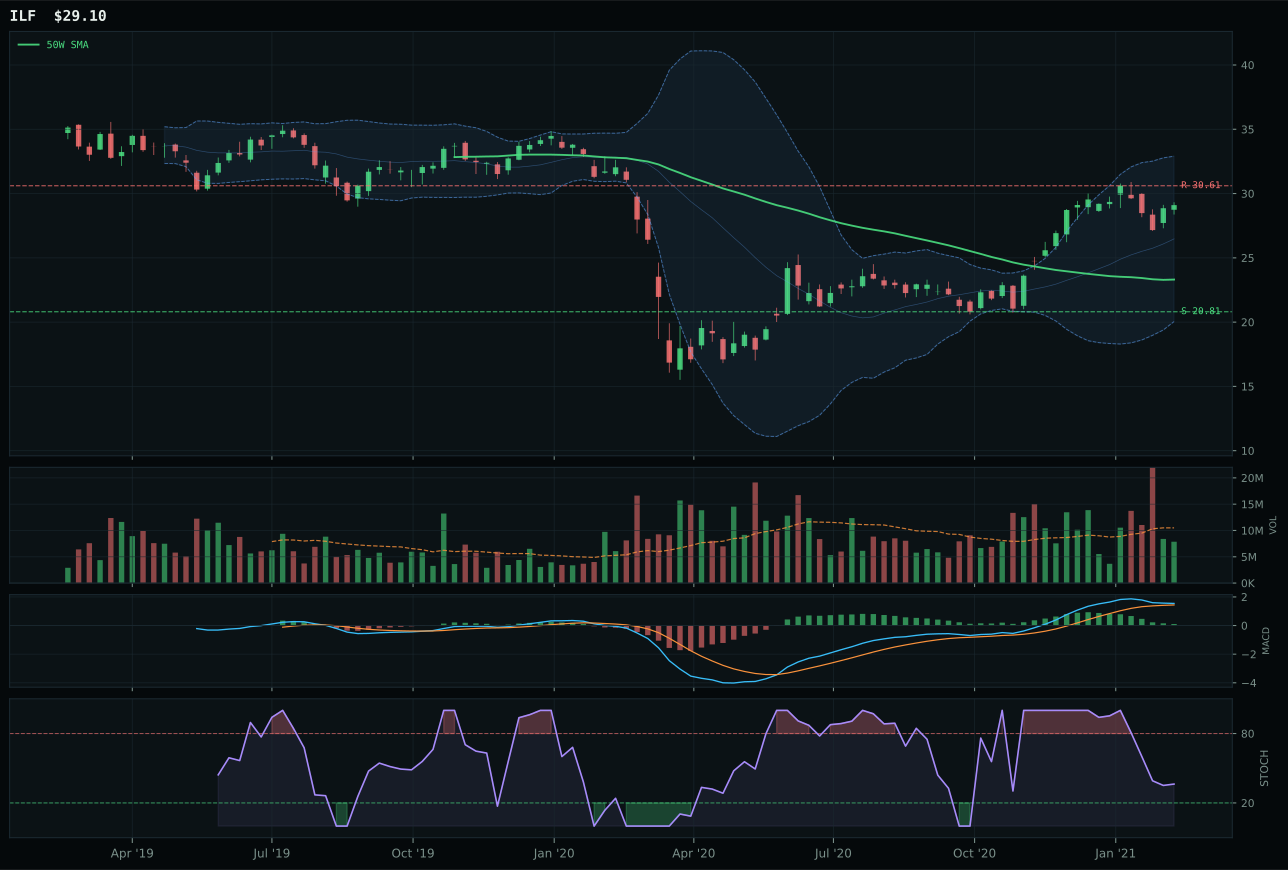
ILF has a vertical extension profile with 8.0% 13-week relative strength versus SPY.
A failed hold above support would weaken the setup.
Actionable but governed by invalidation levels.
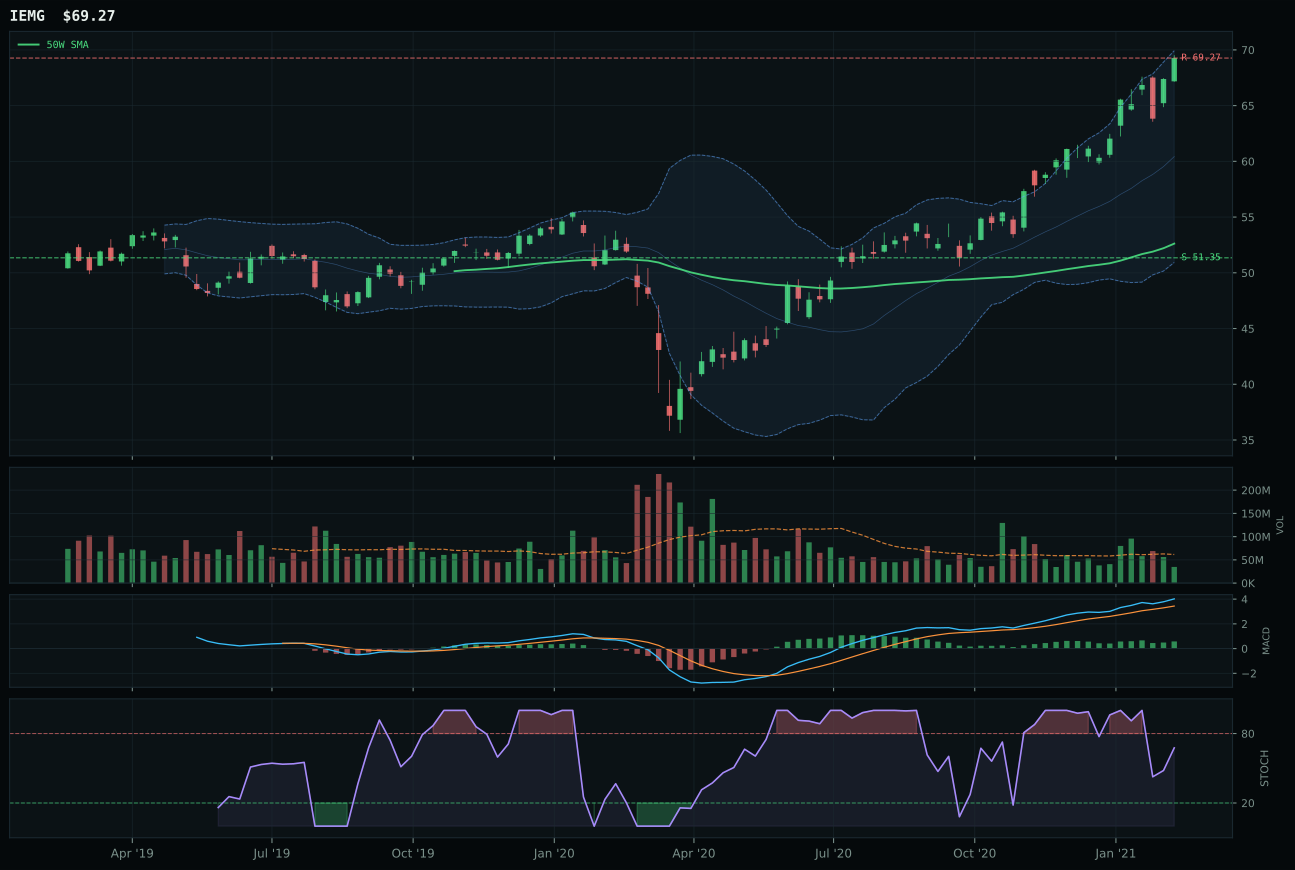
IEMG has a vertical extension profile with 10.1% 13-week relative strength versus SPY.
A failed hold above support would weaken the setup.
Actionable but governed by invalidation levels.
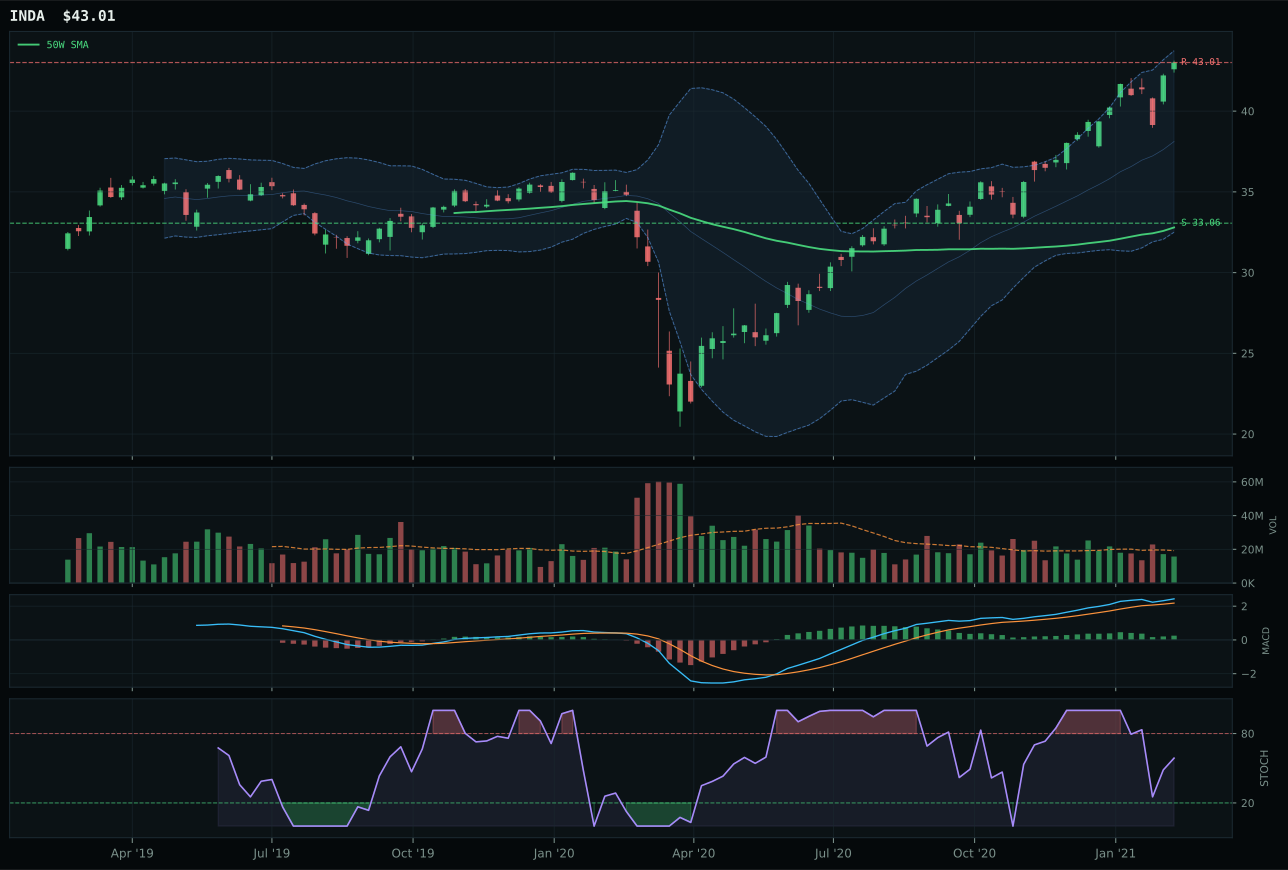
INDA has a vertical extension profile with 8.7% 13-week relative strength versus SPY.
A failed hold above support would weaken the setup.
Actionable but governed by invalidation levels.
IEMG wins Emerging Markets by a slender 1.1-point margin over ILF, claiming the category on marginally cleaner structure (75.7 vs 73.5) and fractionally better category-relative strength (+1.4% vs -0.7%) rather than on absolute momentum. Both sit at vertical extension—IEMG at 31.6%, ILF at slightly more stretched position—with identical MACD (bullish but flattening) and stochastic RSI (falling/neutral), yet IEMG's broader emerging-market exposure and zero funding-advantage versus ILF's Latin America commodity beta create a technical nod to IEMG. The 19.7% thirteen-week return trails ILF's 17.6% very slightly, but IEMG's category-relative strength advantage signals it is the preferred name for actual emerging-market exposure within this peer set. Volume is thin for both (0.57x for IEMG, implied thin for ILF), meaning neither is benefiting from real accumulation sponsorship, and that lack of conviction is reflected in the tier-2 allocation despite the win.
Emerging Markets holds 5% tier-2 allocation on a 62.0 final score, benefiting from a 62.0/100 category macro fit that is underpinned by EM liquidity support (+14) and risk appetite positive (+8), yet tempered by active credit stress (-10). IEMG's broad beta positioning—rather than ILF's commodity and value tilt—aligns better with the current risk-appetite narrative, even as thin volume participation signals that EM flows are not yet explosive. The category ranks sixth overall and holds its 5% slot as a liquidity and diversification play within a portfolio that is heavily tilted toward commodities and energy. To earn top-2 status, emerging markets would need either a sharper flow reversal that reverses the credit-stress penalty or a macro shift that elevates EM growth expectations meaningfully. For now, IEMG's neutral setup and macro ambiguity confine it to tier-2; it is a position to own for breadth but not to overcommit to in a regime still dominated by real-asset and energy scarcity.
Agriculture & Livestock — MOO
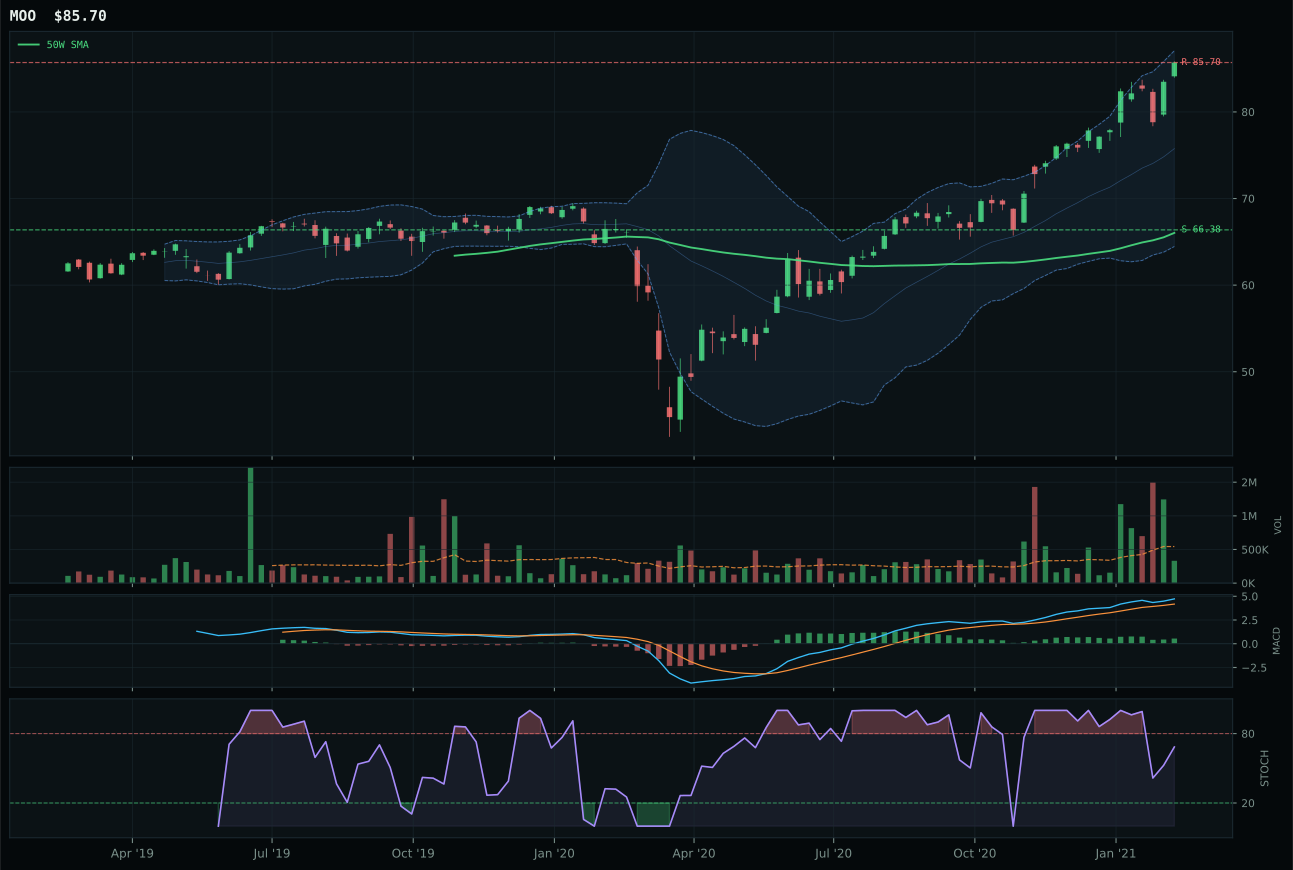
MOO has a vertical extension profile with 8.0% 13-week relative strength versus SPY.
A failed hold above support would weaken the setup.
Actionable but governed by invalidation levels.
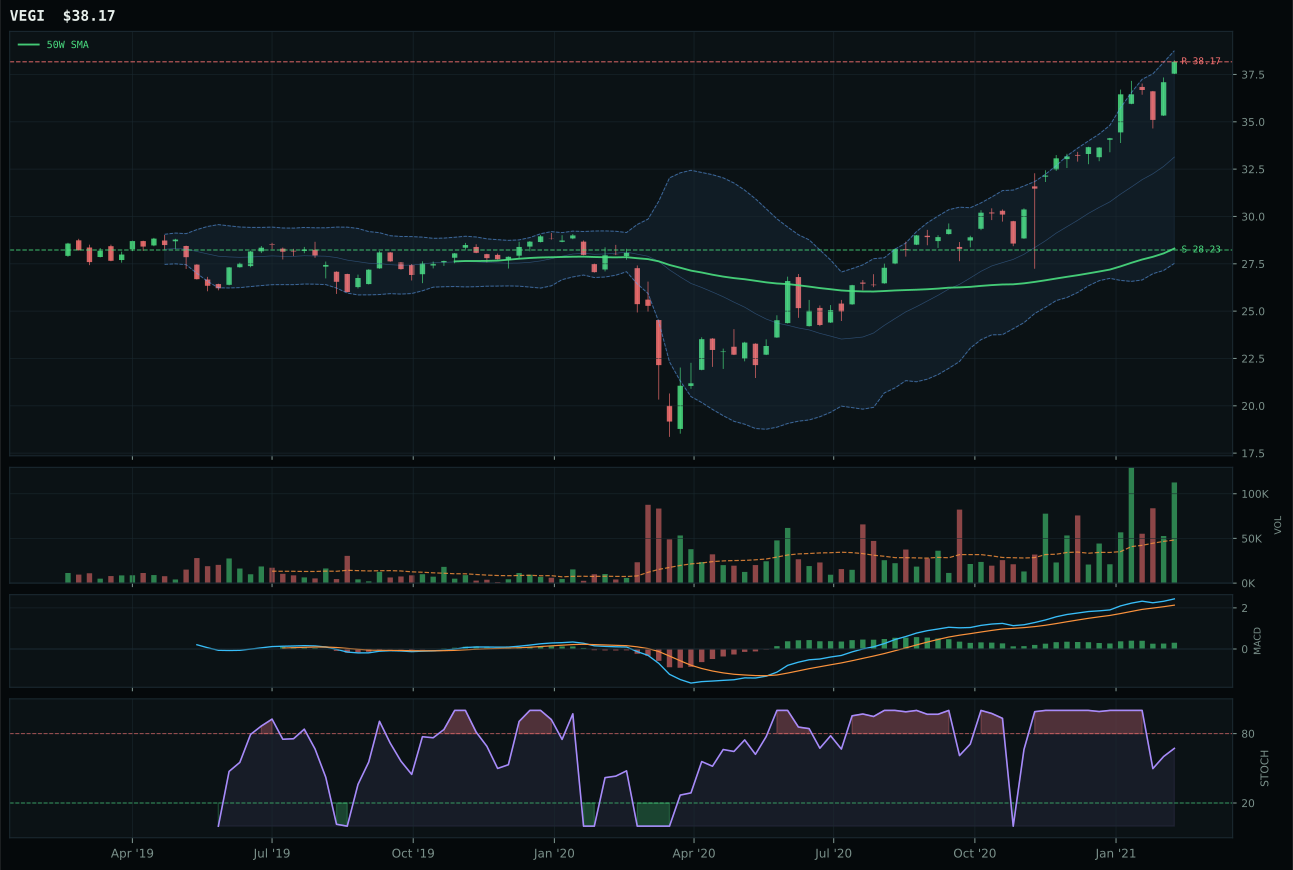
VEGI has a vertical extension profile with 11.6% 13-week relative strength versus SPY.
A failed hold above support would weaken the setup.
Tracked, but not top-2 eligible because: .
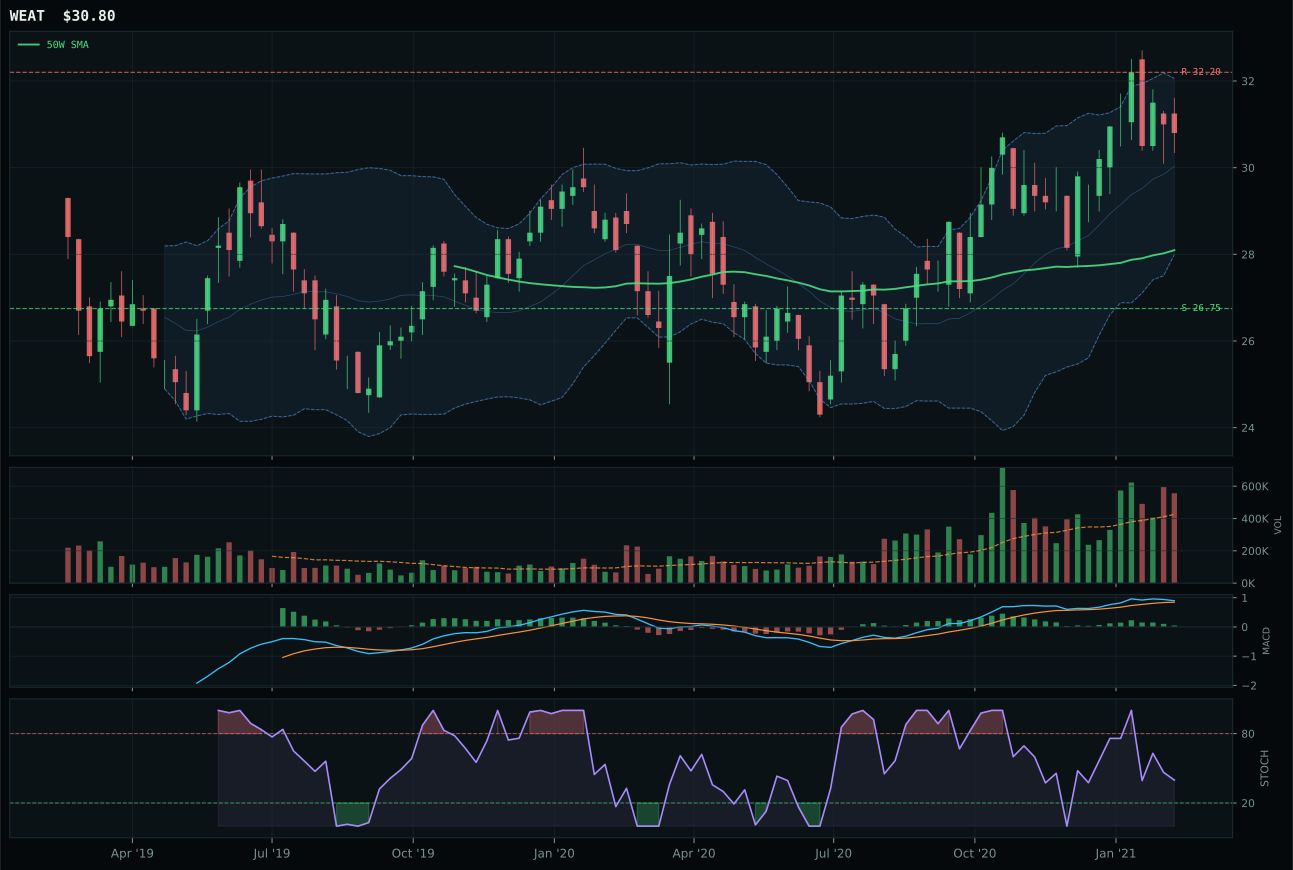
WEAT has a neutral structure profile with -4.7% 13-week relative strength versus SPY.
A failed hold above support would weaken the setup.
Actionable but governed by invalidation levels.
MOO wins Agriculture & Livestock by a 15.6-point margin over VEGI, claiming the category despite trading at a 29.8% extension above the 50W—a compressed win driven by MOO's superior entry position and macro sponsorship fit. VEGI is further extended at 34.8% and shows stronger absolute momentum (21.3% thirteen-week return, 11.6% SPY relative strength, above-average volume participation), yet those strengths become liabilities when the category reasoning layer weights timing heavily during overbought regimes. MOO's MACD is bullish but flattening and stochastic RSI falling toward neutral, signaling controlled momentum rather than late-stage euphoria; the thin volume participation at 0.61x average is a detractor, but not fatal when macro descriptors—supply shortage (+8), inflation pressure (+7), real asset sponsorship (+5)—provide a tailwind that VEGI's broader commodity beta cannot match. Critically, MOO owns 0.0% category-relative strength while VEGI shows +3.6%, yet the allocator penalizes VEGI's overextension enough to favor MOO's slightly less stretched chart despite its weaker momentum proof.
Agriculture & Livestock holds 5% tier-2 allocation on a 59.2 final score, buoyed by an exceptional 86.0/100 category macro fit—the highest macro score across this week's allocation. Supply shortage and inflation pressure are firing at +13 and +10 respectively, with real asset sponsorship and commodity breadth positive adding further tailwinds. This category is a direct beneficiary of the regime pivot toward stagflation expectations and supply-constrained real assets, making the macro narrative one of the portfolio's strongest. MOO's positioning—bullish but flattening, thin participation, neutral category relative strength—reflects a setup that is technically mature but narratively compelling in a world where food inflation and agricultural scarcity are accelerating. The 5% allocation captures this macro beta without overcommitting to an entry that is extended; the category would earn a top-2 promotion if volume confirmation widened or if the macro descriptors intensified further, particularly around commodity breadth positive and energy scarcity, which would justify the stretch.
Technology — IGV
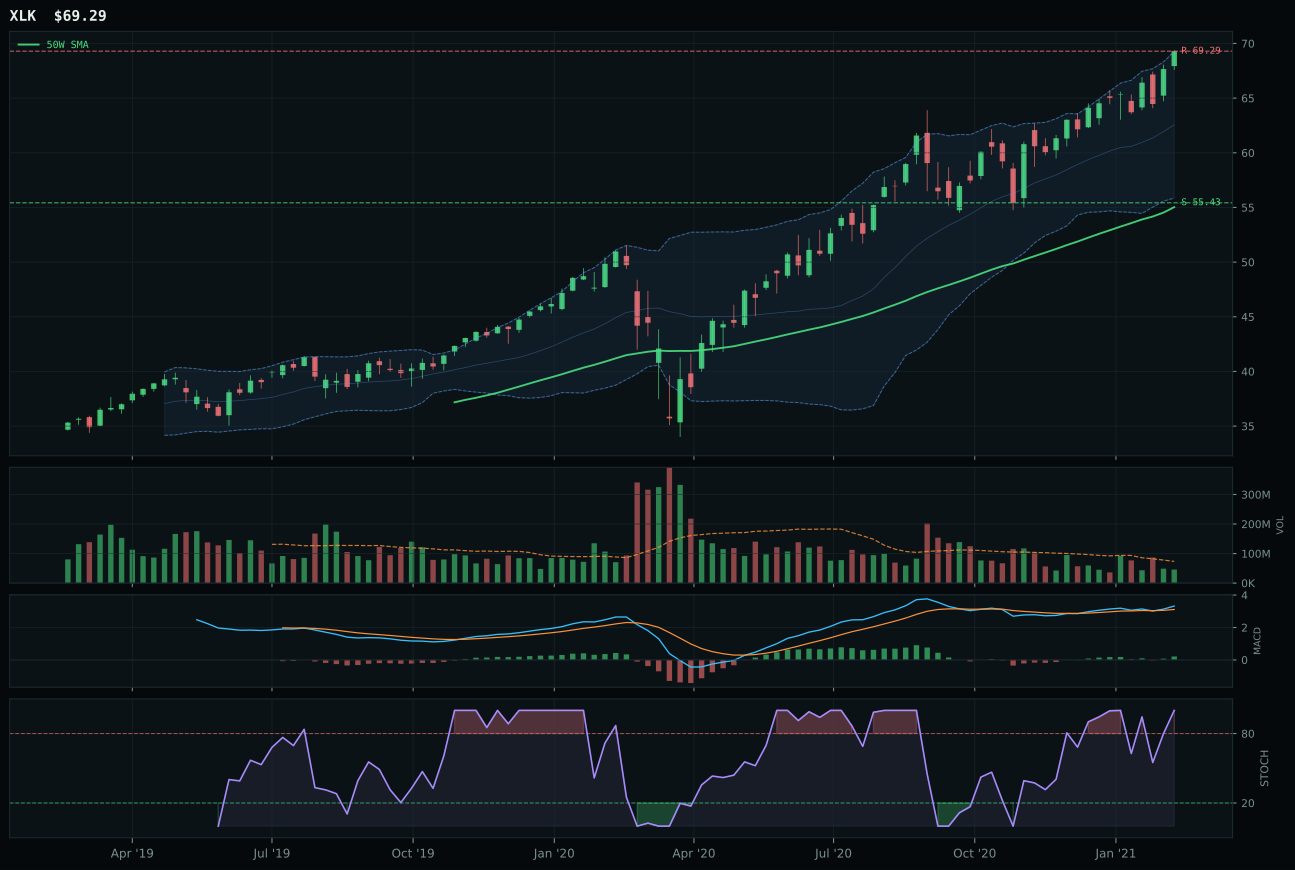
XLK has a vertical extension profile with 4.7% 13-week relative strength versus SPY.
A failed hold above support would weaken the setup.
Actionable but governed by invalidation levels.
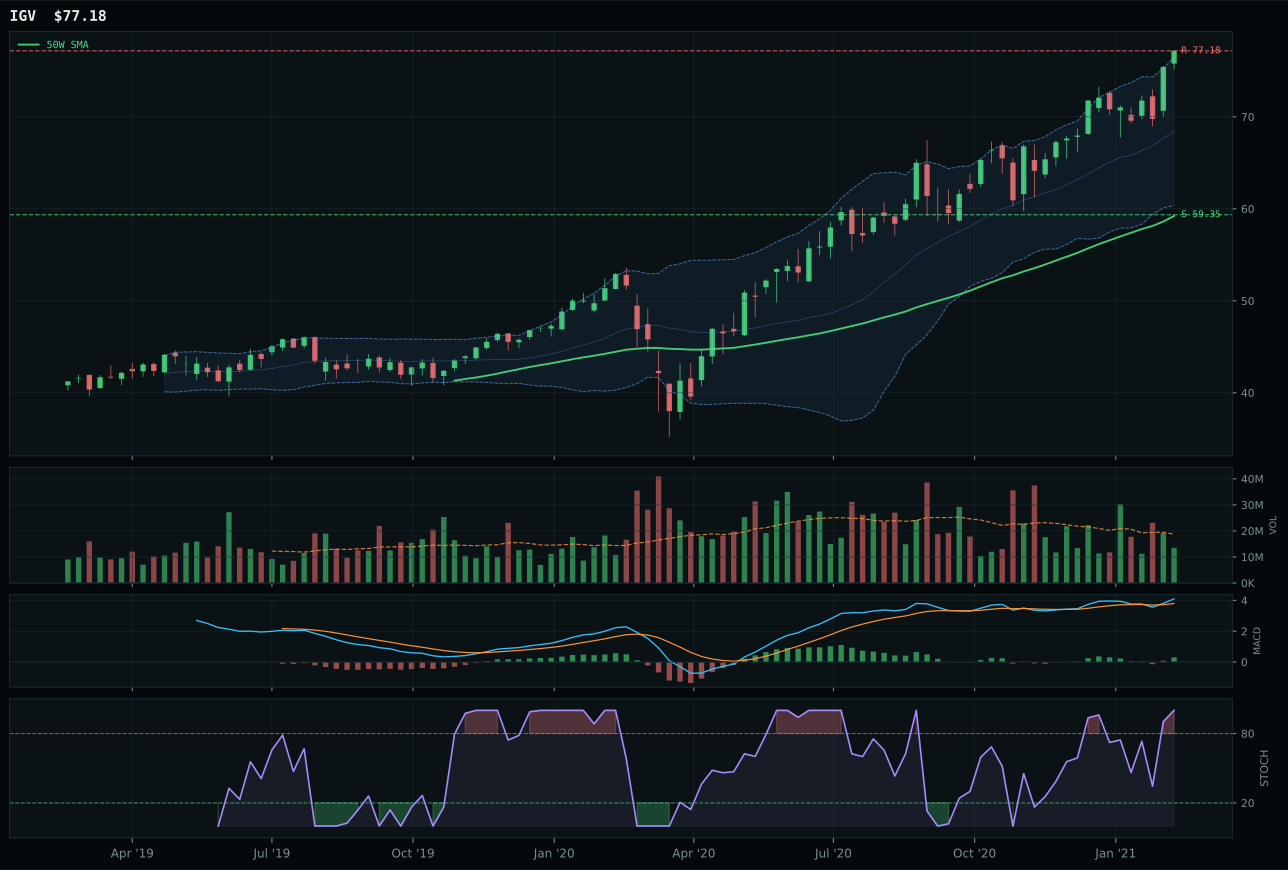
IGV has a vertical extension profile with 10.7% 13-week relative strength versus SPY.
A failed hold above support would weaken the setup.
Actionable but governed by invalidation levels.
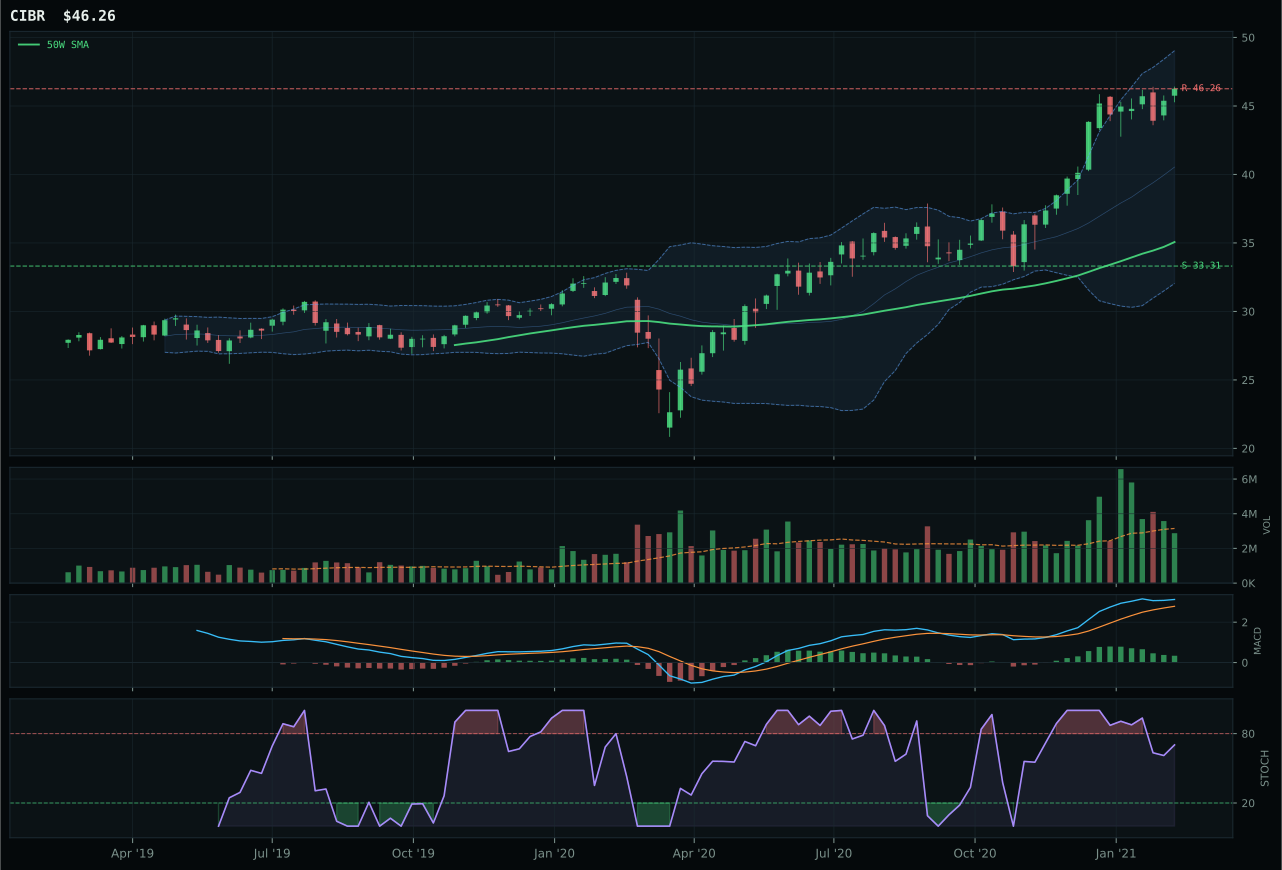
CIBR has a vertical extension profile with 17.7% 13-week relative strength versus SPY.
A failed hold above support would weaken the setup.
Actionable but governed by invalidation levels.
IGV wins the category on the strength of a 10.7% relative advantage versus SPY paired with neutral category-relative strength, delivering the clearest technical proof inside a crowded three-horse basket. The 20.3% thirteen-week return sits on trend confirmation—price above both the 50W and 200W with a clean 1.0% slope—but the cost is real: at 30.3% extension above the 50W, every new buyer is stepping into a near-vertical setup where upside to resistance reads at zero. MACD is bullish and improving with stochastic RSI overbought, which sustains the momentum narrative, yet thin volume at 0.72x its twenty-week average signals that this move has printed without the sponsorship needed to hold it during rotation risk. XLK lost because its category-relative strength fell negative by 6.0%, meaning it underperformed its own peer set despite posting a respectable 4.7% SPY edge; the technical differentiator—momentum at 14.3% thirteen-week versus IGV's 20.3%—combined with weaker structure to hand the category to IGV by a clear 3.0-point margin.
Technology ranks tier-2 at 5% allocation, held despite a 58.4 final score that trails the top-2 leaders significantly. The category earns its slot on trend conviction—IGV's price-above-both-moving-averages setup is unambiguous—but the allocation cap reflects the entry risk baked into a 30.3% extension. Risk appetite and AI growth sponsorship are active macro tailwinds, yet they collide directly with active credit stress signaling, creating a tense macro picture in Transition / Mixed regime. The category macro fit measures 54.0/100, meaning technical evidence (62% weighted) is pulling harder than narrative support. To earn a top-2 promotion, this category would need either a pullback into structure to reset entry mechanics or a significant macro shift that tips the credit-stress calculus decisively positive. For now, it holds its tier-2 5% slot as a liquidity and trend-following position that adds breadth without concentrating into what is clearly an extended and crowded trade.
Defense & Aerospace — XAR
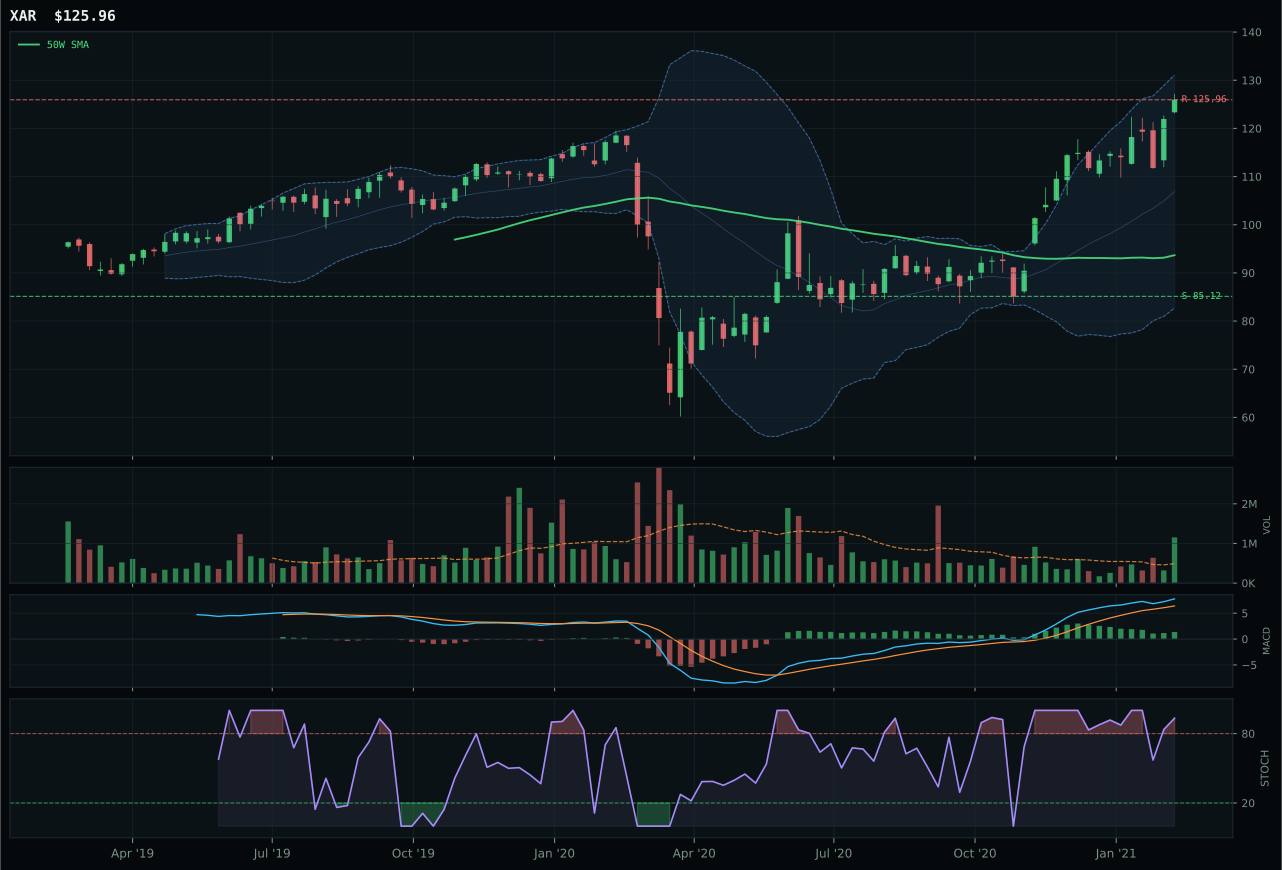
XAR has a vertical extension profile with 14.6% 13-week relative strength versus SPY.
A failed hold above support would weaken the setup.
Actionable but governed by invalidation levels.
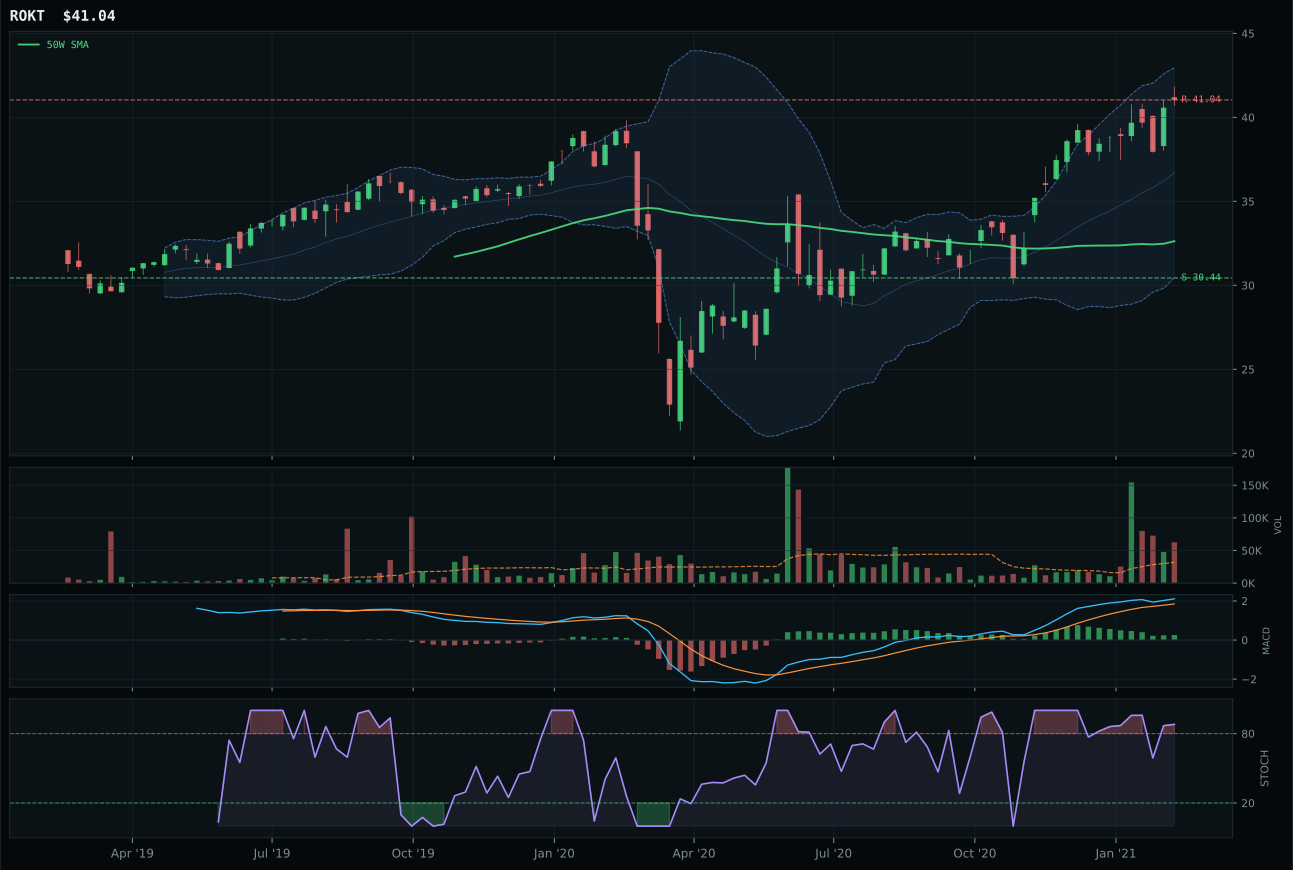
ROKT has a vertical extension profile with 6.9% 13-week relative strength versus SPY.
A failed hold above support would weaken the setup.
Tracked, but not top-2 eligible because: .
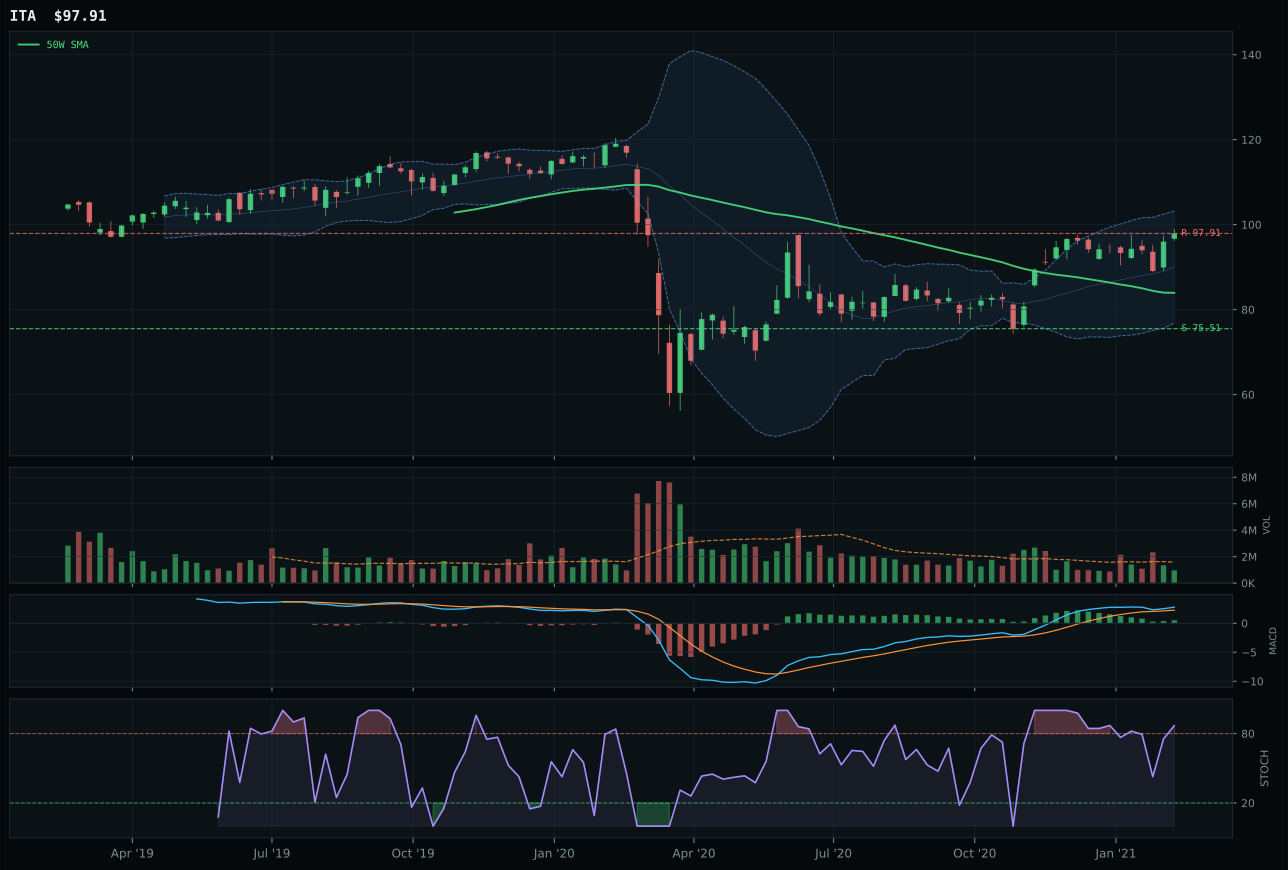
ITA has a vertical extension profile with -0.1% 13-week relative strength versus SPY.
A failed hold above support would weaken the setup.
Actionable but governed by invalidation levels.
XAR wins Defense & Aerospace with a commanding 27.1-point lead over ROKT, powered by a 7.7% category-relative strength edge and exceptional volume confirmation at 2.34x its twenty-week average—a signature of institutional accumulation rather than retail bounce. The 24.3% thirteen-week return sits atop trend (price above both the 50W and 200W at a 0.6% slope) and lands at 34.5% extension, which is material but cushioned by the strong volume evidence that sellers are not stepping in front of this move. MACD is bullish but flattening and stochastic RSI is rolling over from overbought at 0.93, a warning that near-term momentum is transitioning, yet the 92.2% persistence score—combining trend, relative strength, MACD, and volume sponsorship—indicates the underlying move has legs. ROKT lost not on technical setup (both share vertical extension and similar MACD shape) but purely on relative leadership: its category-relative strength measures 0.0% while XAR delivers 7.7%, indicating XAR is the name that actual capital is choosing within this tactical group.
Defense & Aerospace earns 5% tier-2 allocation on a 53.1 final score, placing it firmly in the middle tier but outside the top-2 overweights. The category macro fit registers at 55.0/100, with Transition / Mixed regime helping slightly (+3) and credit stress adding a +2 surprise benefit—a rare positive signal that suggests defense sectors benefit from flight-to-quality trades when risk appetite is mixed. XAR's technical evidence is robust at 73.1/100, but the 50.0/100 macro narrative fit (neutral descriptor profile) caps the category's upside scoring potential. This is a sector that owns strong technicals but operates in macro ambiguity; it holds its tier-2 slot as a tactical risk-appetite hedge and a proxy for supply-chain intensity. For promotion to top-2, the category would need either sharper volume expansion across the three-ETF basket or a decisive macro swing toward supply-shortage and energy-scarcity dominance—themes that would elevate the narrative fit above its current neutral footing.
Utilities & Infrastructure — XLU
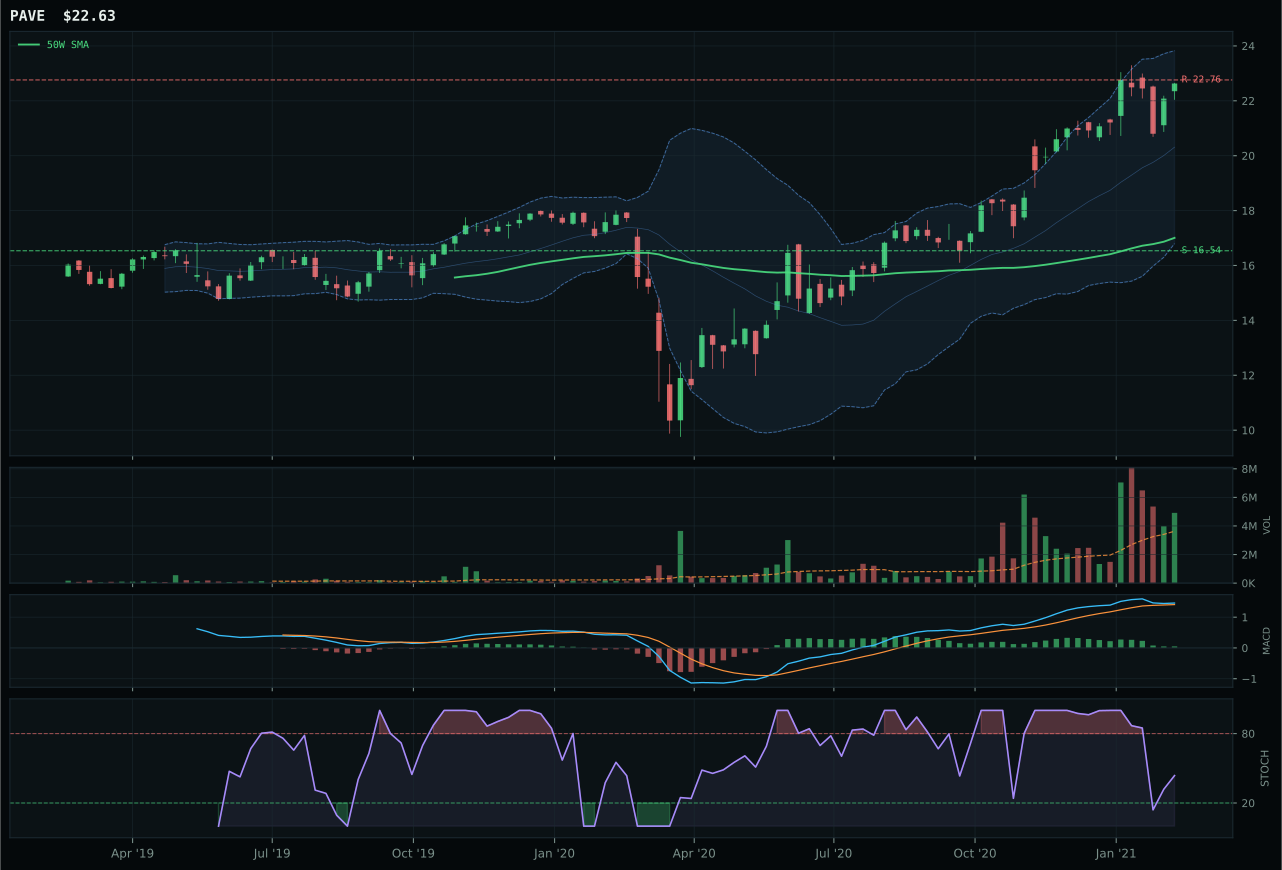
PAVE has a vertical extension profile with 6.6% 13-week relative strength versus SPY.
A failed hold above support would weaken the setup.
Actionable but governed by invalidation levels.
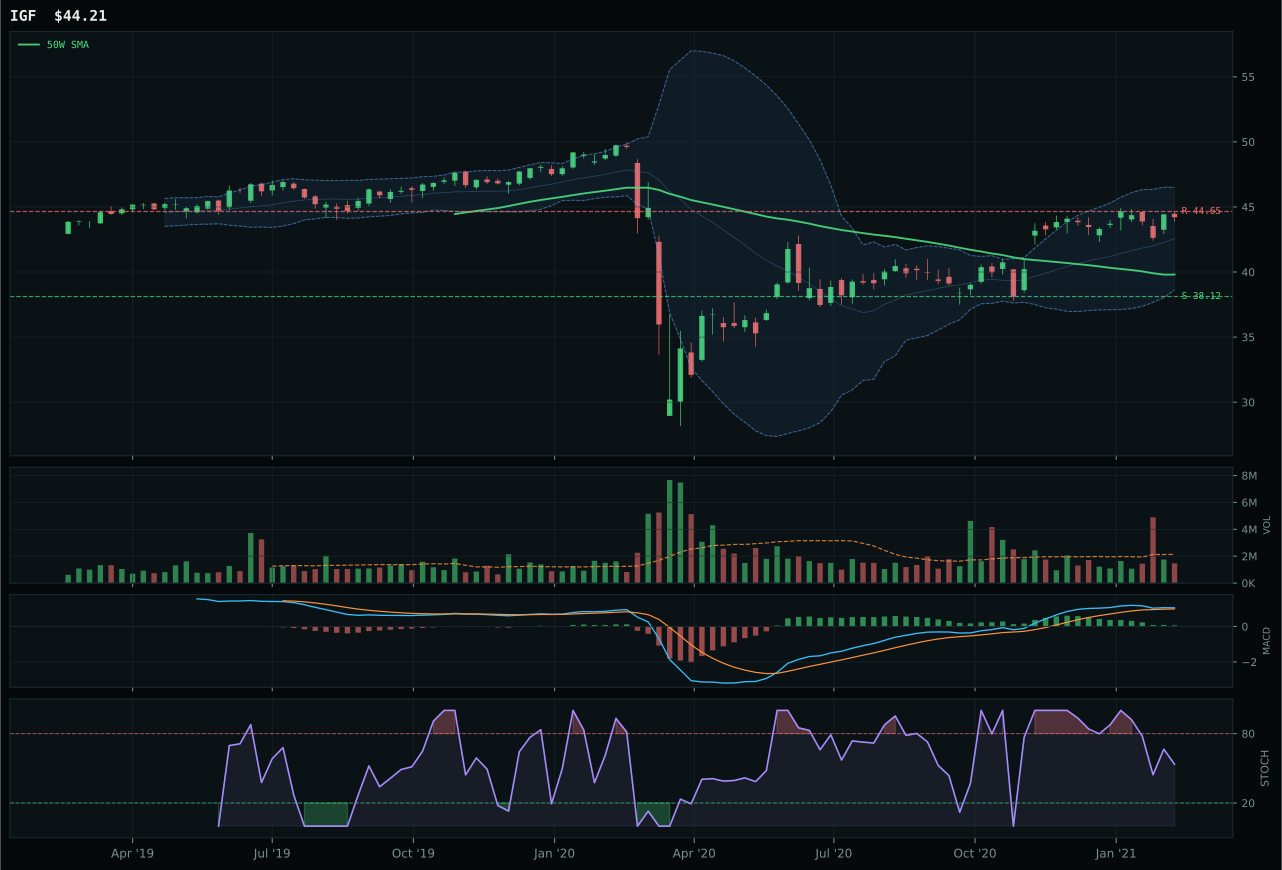
IGF has a neutral structure profile with -7.2% 13-week relative strength versus SPY.
A failed hold above support would weaken the setup.
Actionable but governed by invalidation levels.
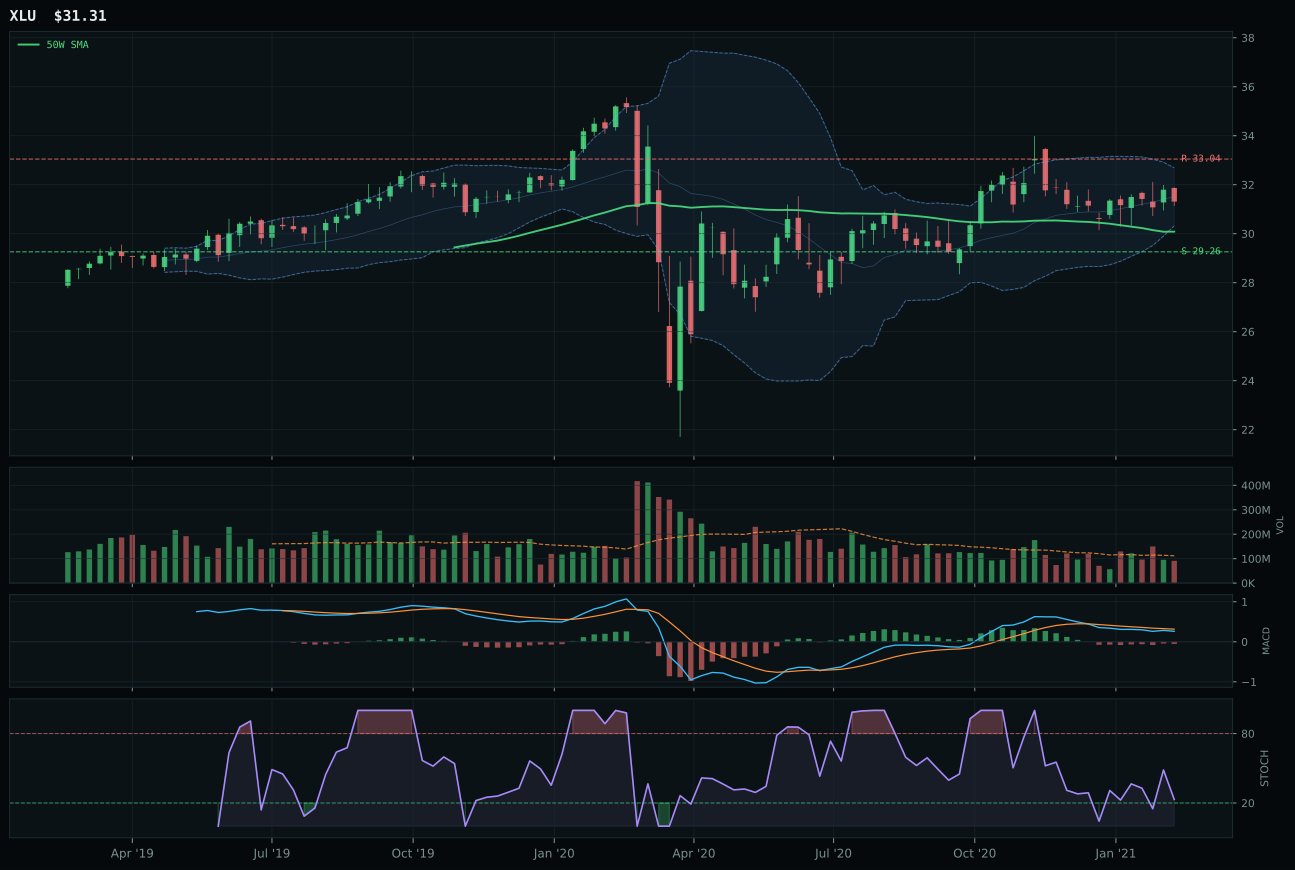
XLU has a neutral structure profile with -14.9% 13-week relative strength versus SPY.
A failed hold above support would weaken the setup.
Actionable but governed by invalidation levels.
XLU wins Utilities & Infrastructure in the category's clearest signal of defensive positioning, claiming victory over PAVE despite severe momentum underperformance (-5.3% thirteen-week return vs PAVE's +16.2%) on the basis of superior timing and a risk/reward profile that reflects a fundamentally different setup. XLU trades at just 4.1% above its 50W with a 90/100 timing score—the highest timing score in the entire portfolio—reflecting a pullback-into-support structure where MACD is bearish but improving and stochastic RSI is falling into the sweet spot for mean reversion. PAVE, in contrast, sits at 33.1% extension with timing of only 40/100, and while its 16.2% thirteen-week return and volume participation (above-average) are compelling on momentum, they are disqualified by entry risk in a category where the allocator is clearly hunting for mean-reversion opportunities rather than momentum continuation. The category-relative strength gap favors PAVE at +13.8% versus XLU's -7.7%, yet that relative underperformance is exactly why XLU wins: it is priced to offer value when this category rotates.
Utilities & Infrastructure receives 5% tier-2 allocation on a 50.8 final score, the lowest among all categories earning allocation, reflecting a portfolio that is willing to hold defensive beta only as a secondary position. The category macro fit measures 46.0/100, dragged down by inflation pressure at -6 and risk appetite positive at -2, creating a macro headwind in a regime still titled toward real assets and scarcity. XLU's 78.0 trend score is respectable, yet its -14.9% SPY relative strength and -5.3% thirteen-week return confirm this is a sector losing to the market broadly. The allocation reflects not conviction but discipline: in a mixed regime with credit stress and inflation pressure both active, owning some defensive dampener is prudent even when the category ranks seventh overall. XLU's exceptional timing score (90/100) and tight proximity to support (4.1% above the 50W) create a potential mean-reversion thesis, but it is underbaked relative to the portfolio's commodity tilt. To earn promotion, this category would need either sharper deterioration in risk appetite or a shift in the inflation descriptor that flips from negative to neutral—thresholds that seem unlikely in the near term.
Precious Metals — SLV
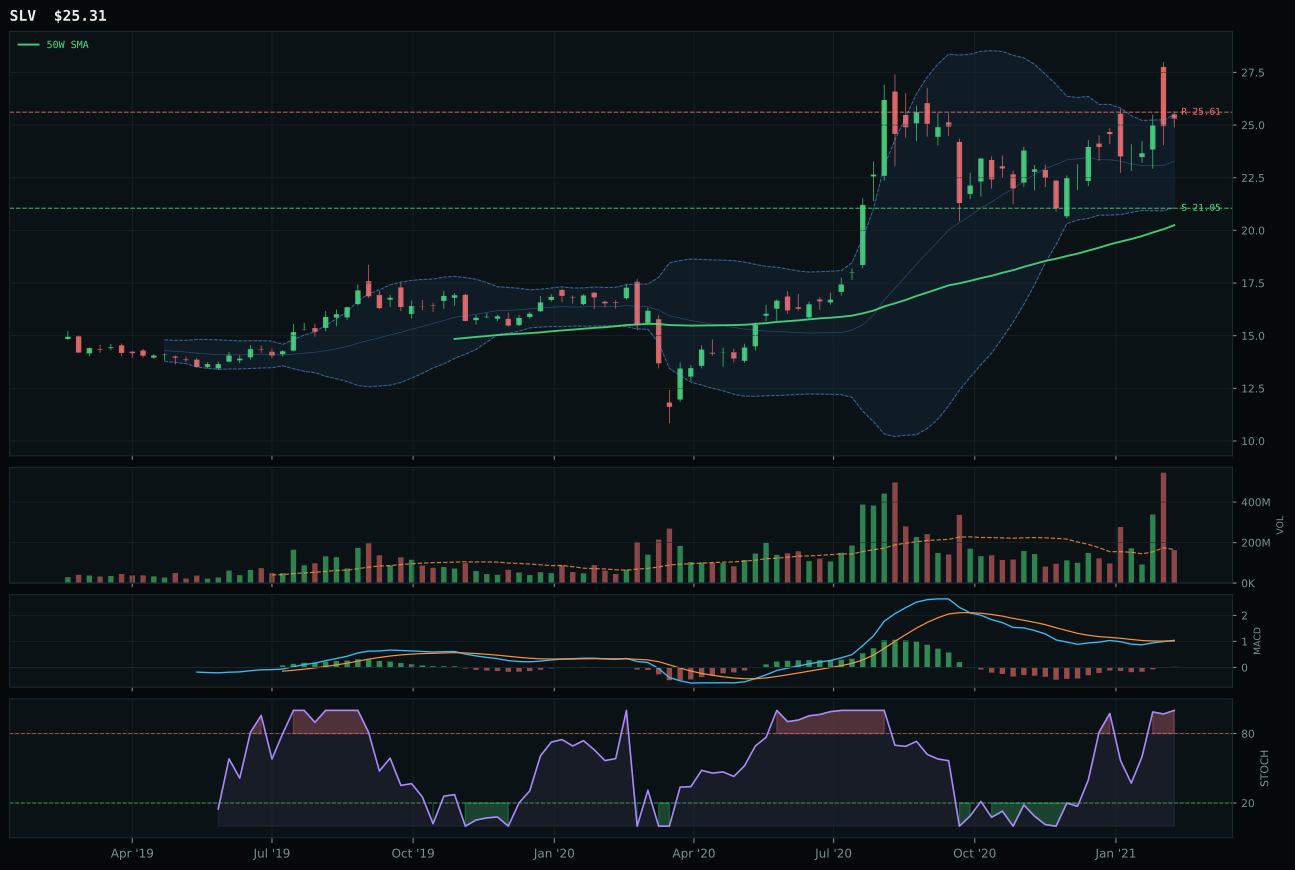
SLV has a vertical extension profile with 0.9% 13-week relative strength versus SPY.
A failed hold above support would weaken the setup.
Actionable but governed by invalidation levels.
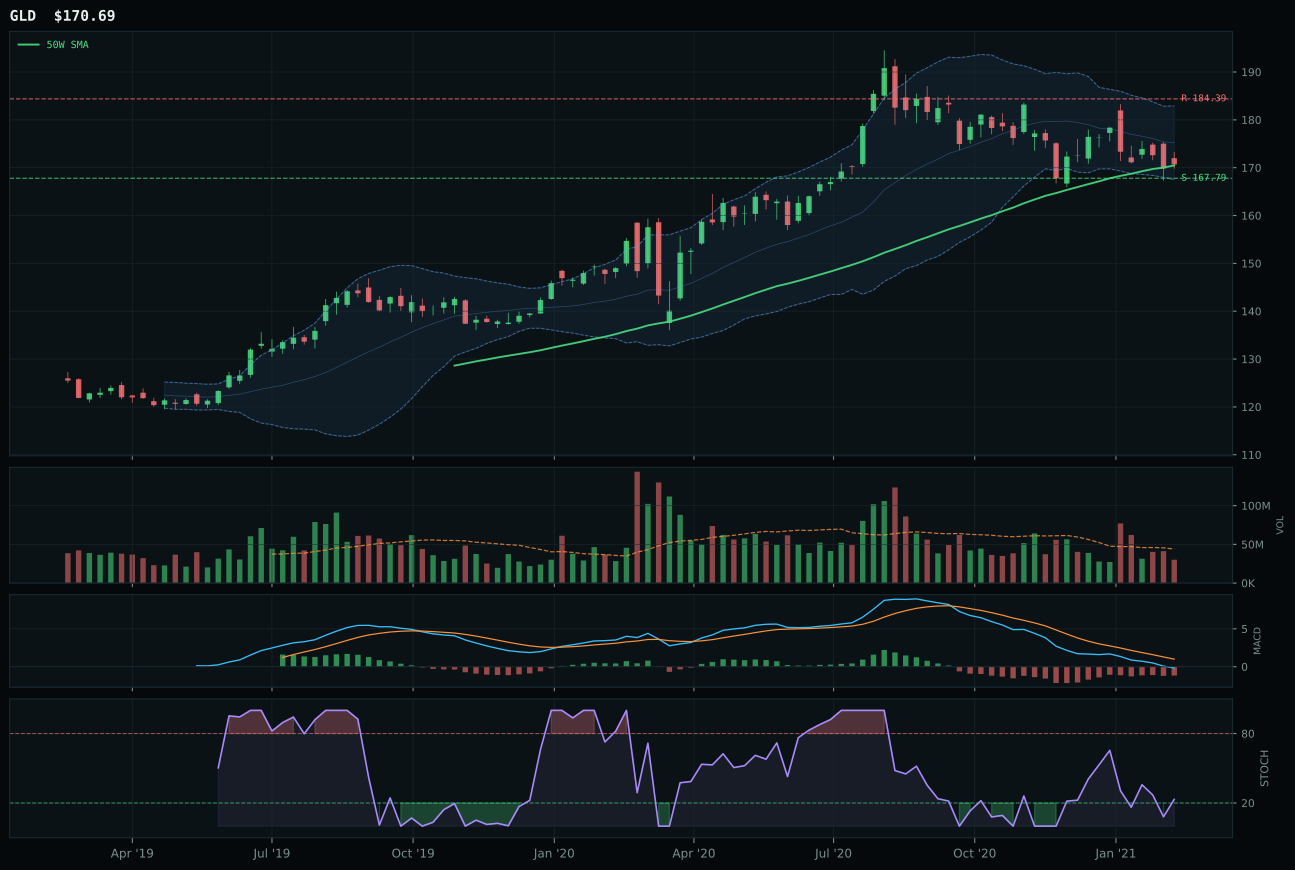
GLD has a pullback into support profile with -13.3% 13-week relative strength versus SPY.
A failed hold above support would weaken the setup.
Actionable but governed by invalidation levels.
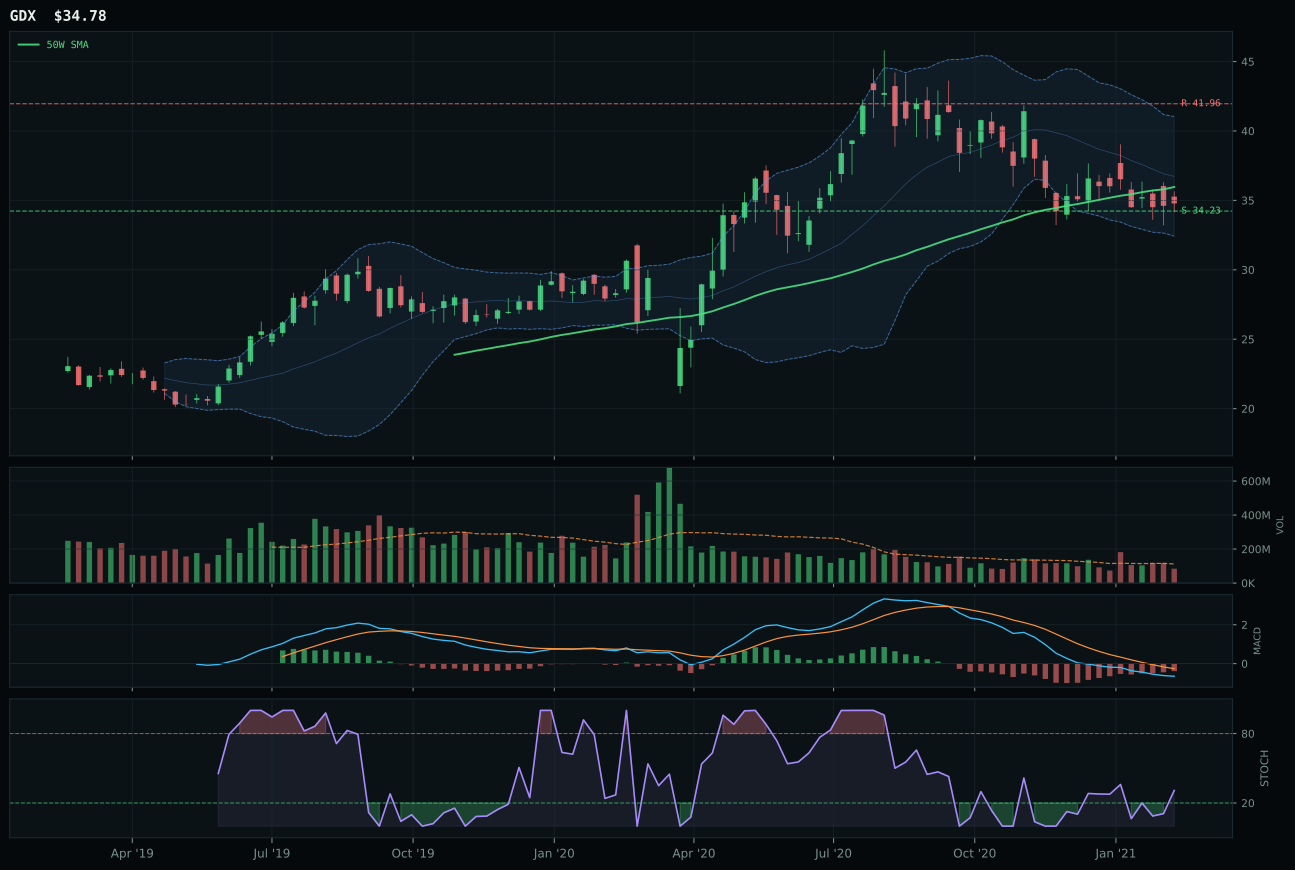
GDX has a pullback into support profile with -18.1% 13-week relative strength versus SPY.
A failed hold above support would weaken the setup.
Actionable but governed by invalidation levels.
SLV wins Precious Metals by a narrow 8.6 points over GLD, with both sitting on the edge of allocability and SLV claiming victory on cleaner structure (70.9 vs 70.5) and stronger momentum proof. The 10.5% thirteen-week return paired with a +14.2% category-relative strength advantage confirms that market participants are rotating into the silver hybrid of monetary and industrial demand rather than gold's pure monetary hedge. At 25.0% extension above the 50W and trading at negative-0.9% upside to resistance, SLV is geometrically constrained, yet MACD is bullish and improving with stochastic RSI overbought at 1.00, creating a momentum confirmation even as the chart sits at zero remaining upside. GLD's 13W return is negative at -3.7% paired with -13.3% SPY relative strength—a deterioration that MACD's bearish-but-improving posture cannot disguise. Volume participation is neutral for SLV versus thin for GLD, another small but material differentiator when both setups are fighting against risk-appetite headwinds.
Precious Metals receives 0% allocation this week, ranking 9th or 10th across the portfolio, excluded entirely despite SLV's narrow technical win over GLD. The 48.8 final score reflects a category macro fit of just 46.0/100, poisoned by an active risk-appetite-positive descriptor that registers at -4, creating a macro headwind that overwhelms the technical evidence (75.4/100 for SLV). In an AltSeason regime with 50% crypto overlay active and a Transition / Mixed macro state that still favors real assets and commodities, precious metals lack the compelling narrative needed to compete against industrial metals and energy that are scoring in the 75–82 range. The category would need either a sharp risk-off reversal that flips the risk-appetite descriptor negative or a surge in credit-stress intensity to earn reallocation. For now, it sits on the sidelines; SLV's technical merit is noted, but narrative conviction is absent.
Nuclear Energy — URA
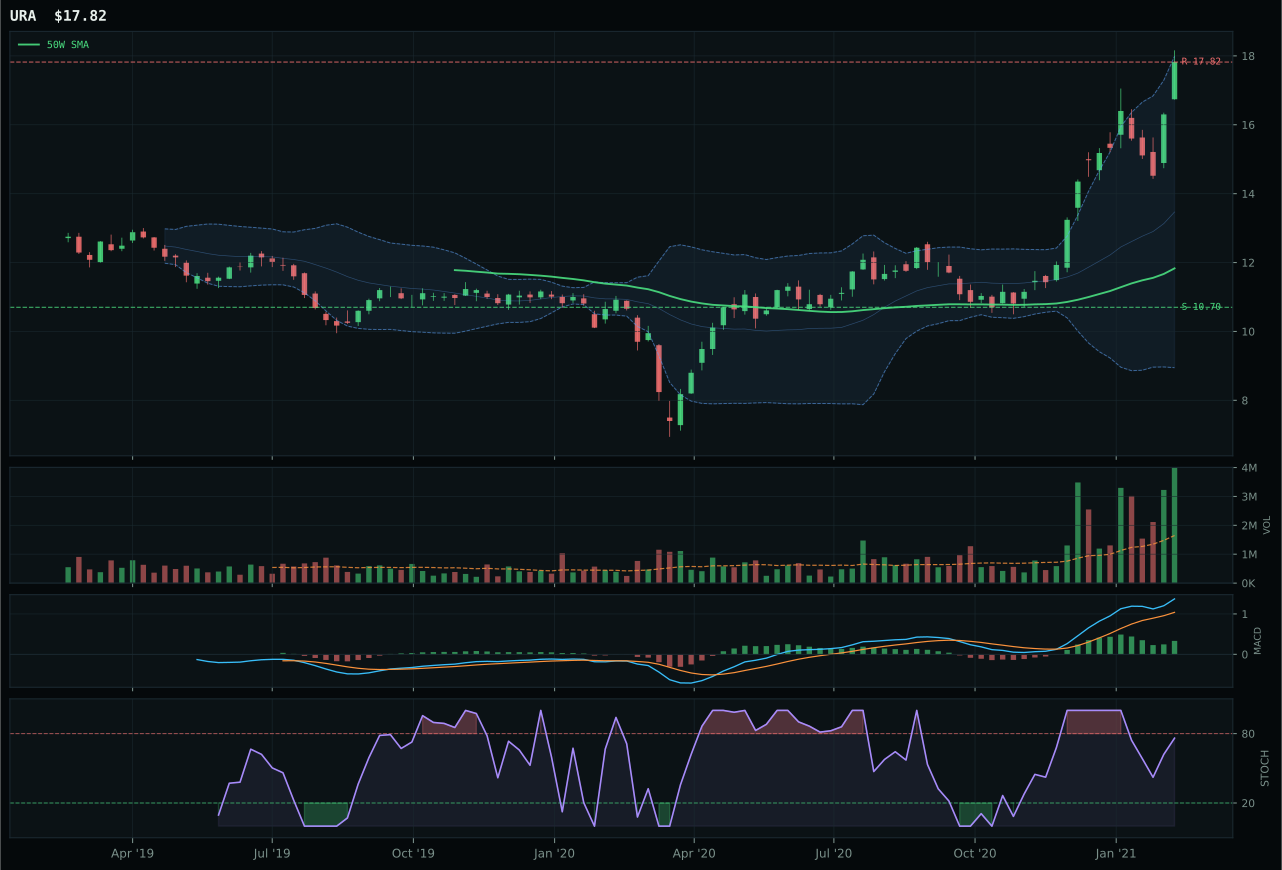
URA has a vertical extension profile with 45.7% 13-week relative strength versus SPY.
A failed hold above support would weaken the setup.
Actionable but governed by invalidation levels.
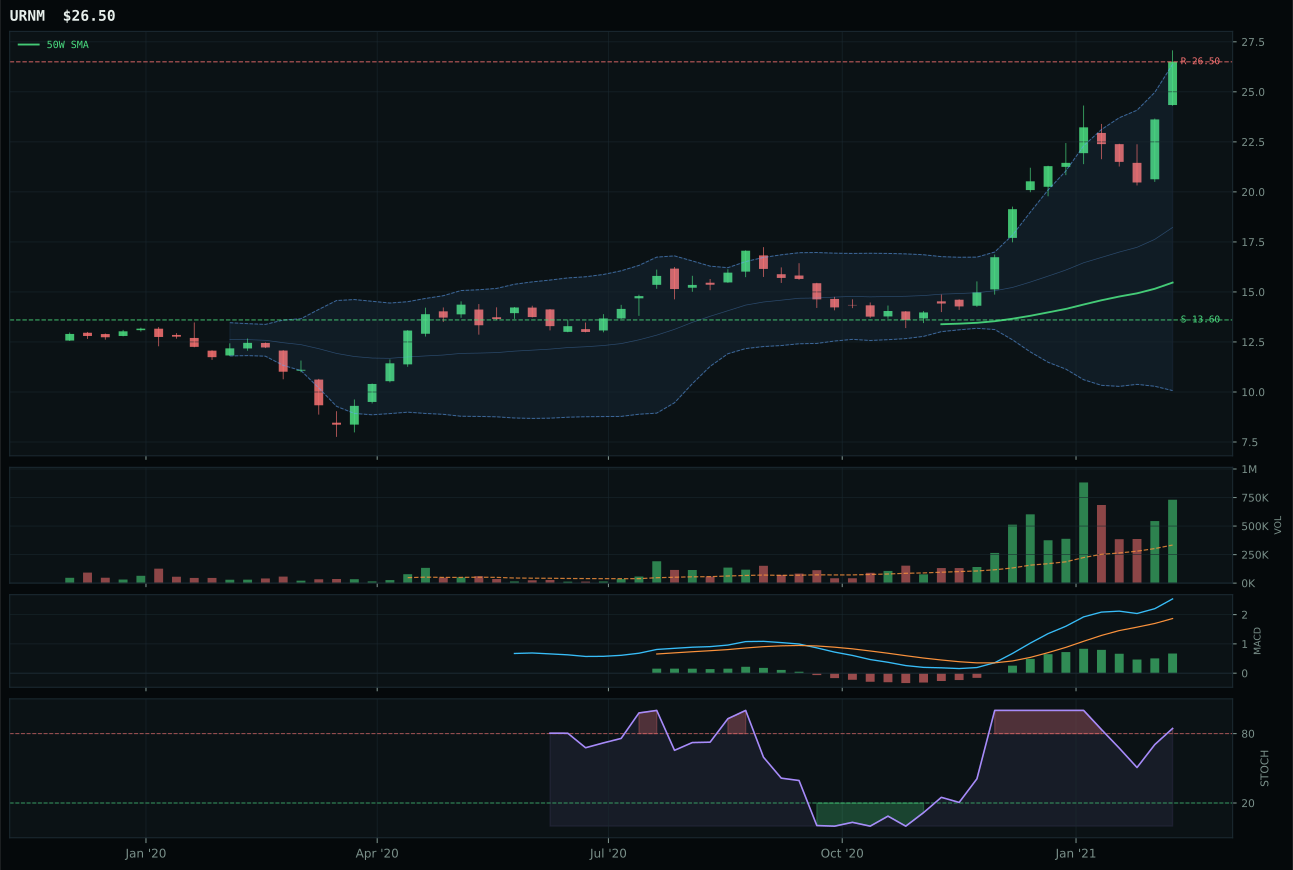
URNM has a vertical extension profile with 74.1% 13-week relative strength versus SPY.
A failed hold above support would weaken the setup.
Tracked, but not top-2 eligible because: .
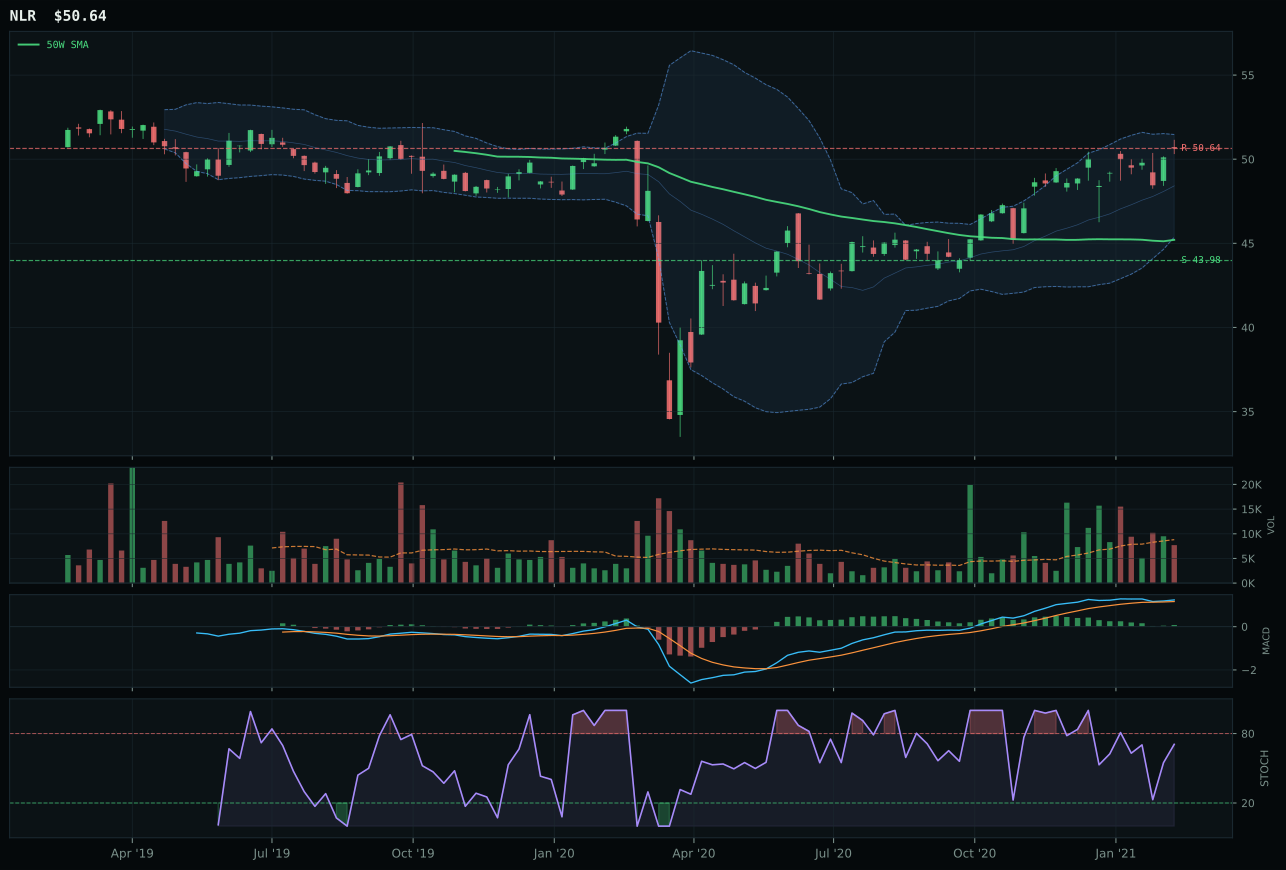
NLR has a neutral structure profile with -5.5% 13-week relative strength versus SPY.
A failed hold above support would weaken the setup.
Tracked, but not top-2 eligible because: .
URA wins Nuclear Energy with a decisive 32.3-point technical lead over URNM, anchored by superior timing (48.0 vs 32.0) and cleaner structure (83.2 vs 81.9) despite URNM's far more spectacular momentum (83.8% thirteen-week return vs 55.4%). The differentiator is geometric restraint: URA sits at 50.6% extension while URNM trades at 71.3%, and when both are rising on the same accumulation-strength volume narrative, the allocator penalizes URNM's overbought stochastic RSI (1.00 vs URA's 0.76 mid-zone). Both charts sit on accumulation volume exceeding 2.6x their twenty-week average, yet URA's falling-toward-neutral stochastic against URNM's overbought configuration creates a timing advantage that the reasoning layer weights heavily when entries are equally extended. URA's 45.7% SPY relative strength and 55.4% thirteen-week return represent a sober capture of uranium sentiment, while URNM's 74.1% SPY edge is the sign of late-stage euphoria that technical discipline must reject.
Nuclear Energy receives 0% allocation this week, ranking outside the investable tier despite URA's strong 66/100 composite and 91.7/100 technical evidence. The 43.8 final score reflects a category macro fit of 69.0/100, which is respectable and aided by energy scarcity (+9), real asset sponsorship (+7), and AI growth sponsorship (+5), yet it is insufficient to overcome the category's ninth or tenth-place rank. The macro narrative is present—uranium supply, clean energy infrastructure, AI data-center power demand—but in a portfolio that is already committing to energy and commodities through REMX and XOP at top-2 weights, adding nuclear complexity is a diversification tax rather than an edge. URA's setup is clean and its volume is accumulating, but the category lacks the final push needed to justify a 5% tranche in an already-tilted allocation. For reallocation, this category would need either a sharp pullback that resets technicals or a macro catalyst (grid failures, energy transition acceleration) that elevates uranium from 'interesting' to 'essential portfolio hedge.'