
2021-02-05
Informational purposes only. The content in this report, including allocations, analysis, and commentary, is provided solely for informational and educational purposes. It does not constitute financial advice, investment advice, trading advice, or any other type of advice. Past performance does not guarantee future results. Always conduct your own research and consult a qualified financial professional before making investment decisions.
Some tracked tickers were excluded due to missing live weekly price data: SGOV: Historical cache SGOV has only 36 usable weekly bars
Weekly Allocation
| Ticker | Category | Weight | Role |
|---|---|---|---|
| FSOL | 50% | Overlay | |
| COPX | Industrial Metals | 10% | Top-2 (10%) |
| XOP | Traditional Energy | 10% | Top-2 (10%) |
| IEMG | Emerging Markets | 5% | Tier-2 (5%) |
| MOO | Agriculture & Livestock | 5% | Tier-2 (5%) |
| IGV | Technology | 5% | Tier-2 (5%) |
| SMH | AI | 5% | Tier-2 (5%) |
| ITA | Defense & Aerospace | 5% | Tier-2 (5%) |
| XLU | Utilities & Infrastructure | 5% | Tier-2 (5%) |
Trade Instructions — Monday Open
Sell the tranche from 2021-01-08 (completing its 4-week hold). Buy the new tranche. Instructions show net portfolio changes — same-asset positions cancel, weight changes show the delta.
| Action | Ticker | Instruction |
|---|---|---|
| SELL | REMX | Sell 50% of REMX position (reduce 5.00% → 2.50%) |
| SELL | XLE | Sell entire XLE position (2.50% of portfolio) |
| SELL | INDA | Sell entire INDA position (1.25% of portfolio) |
| SELL | CIBR | Sell entire CIBR position (1.25% of portfolio) |
| SELL | PAVE | Sell entire PAVE position (1.25% of portfolio) |
| BUY | XOP | Buy XOP — 28.57% of freed cash (adds 2.50% to portfolio) |
| BUY | COPX | Buy COPX — 28.57% of freed cash (adds 2.50% to portfolio) |
| BUY | IEMG | Buy IEMG — 14.29% of freed cash (adds 1.25% to portfolio) |
| BUY | XLU | Buy XLU — 14.29% of freed cash (adds 1.25% to portfolio) |
| BUY | IGV | Buy IGV — 14.29% of freed cash (adds 1.25% to portfolio) |
Current Portfolio After Trade
Combined holdings across all 4 active tranches. Each tranche is 25% of the portfolio.
| Ticker | % of Portfolio | Weight Bar |
|---|---|---|
| FSOL | 37.50% | |
| FBTC | 12.50% | |
| XOP | 7.50% | |
| COPX | 6.25% | |
| SMH | 5.00% | |
| IEMG | 5.00% | |
| MOO | 3.75% | |
| XAR | 3.75% | |
| XLK | 3.75% | |
| REMX | 2.50% | |
| URA | 2.50% | |
| FCG | 2.50% | |
| XLU | 2.50% | |
| WEAT | 1.25% | |
| GLD | 1.25% | |
| IGV | 1.25% | |
| ITA | 1.25% |
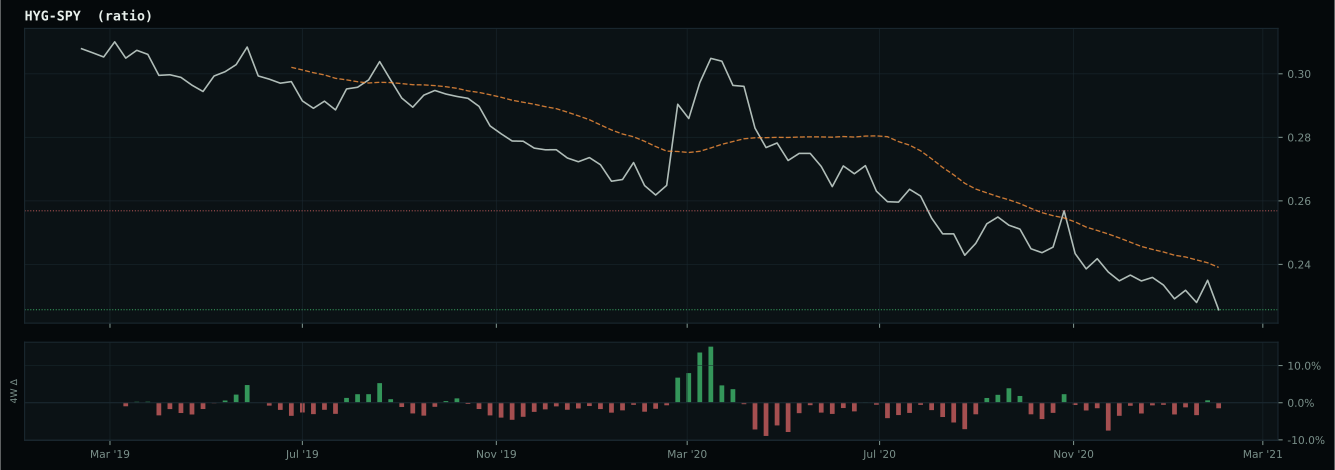
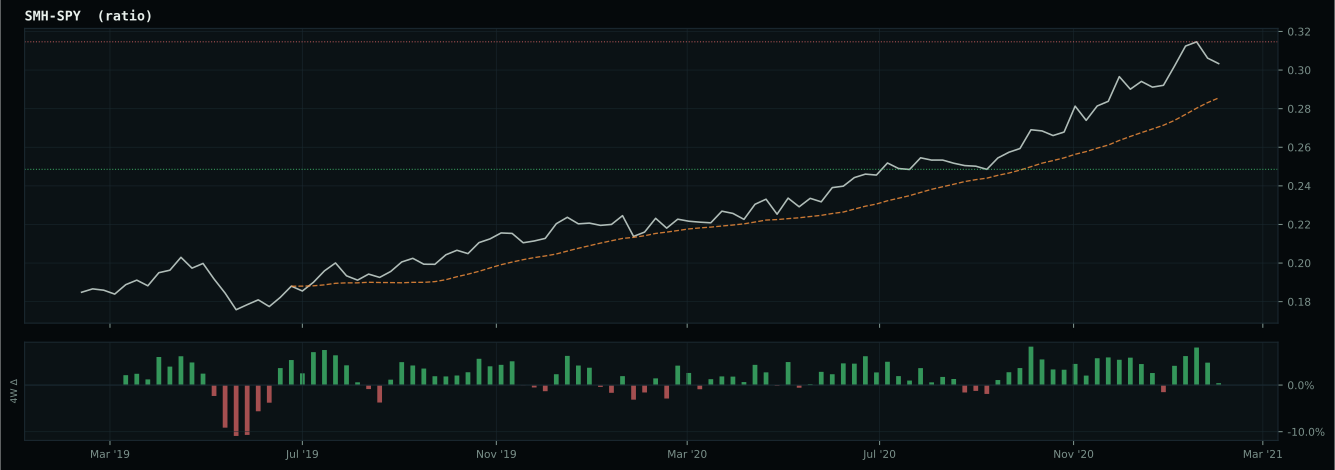
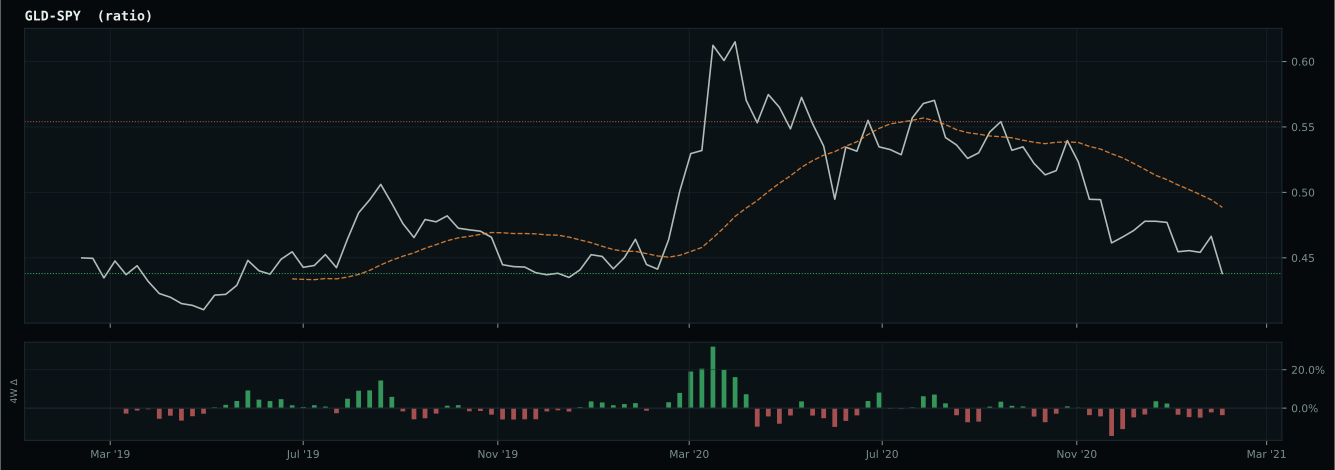
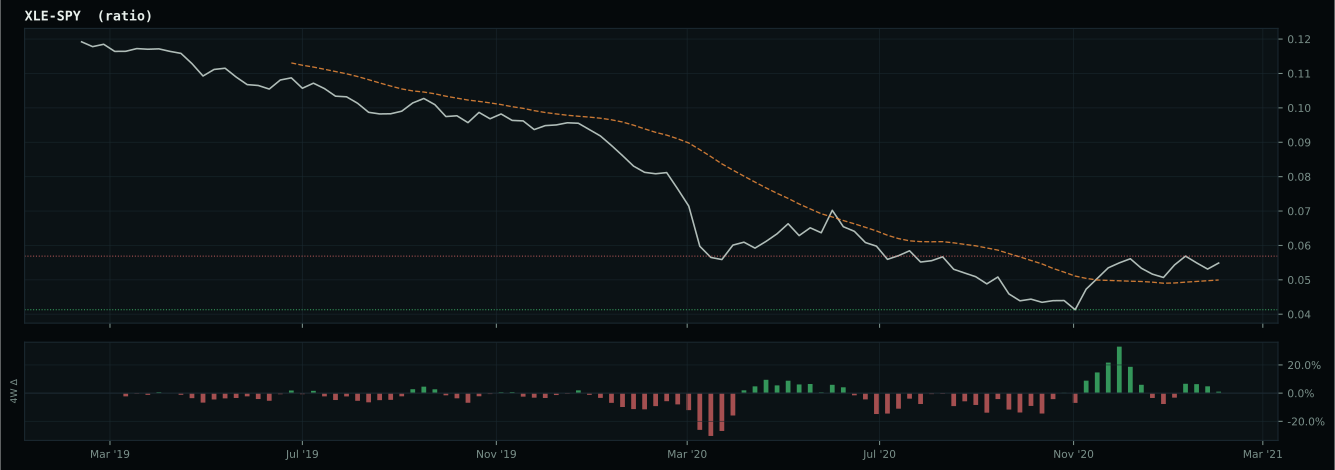
Macro Regime — Transition / Mixed
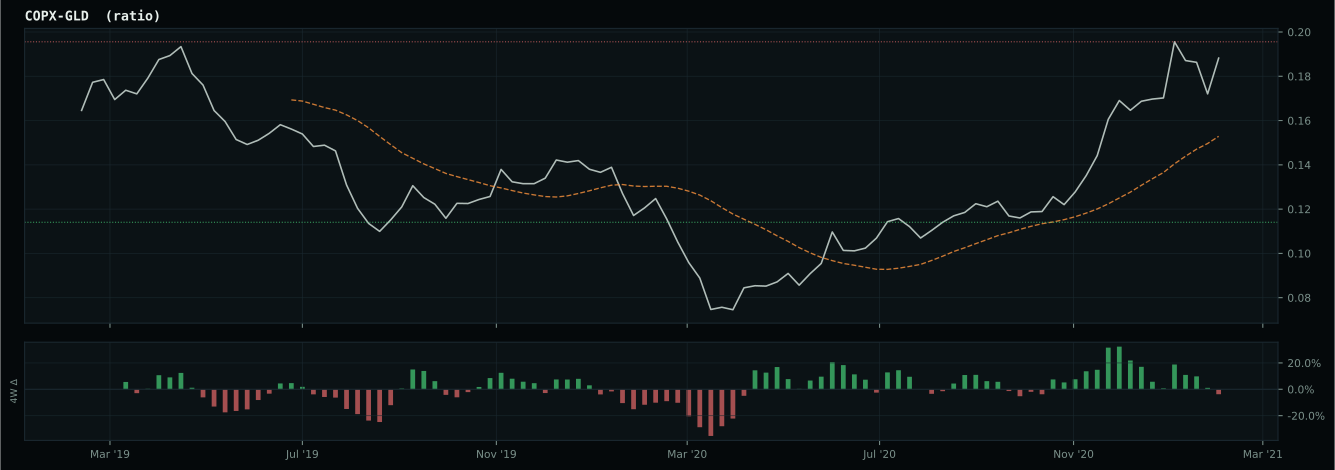
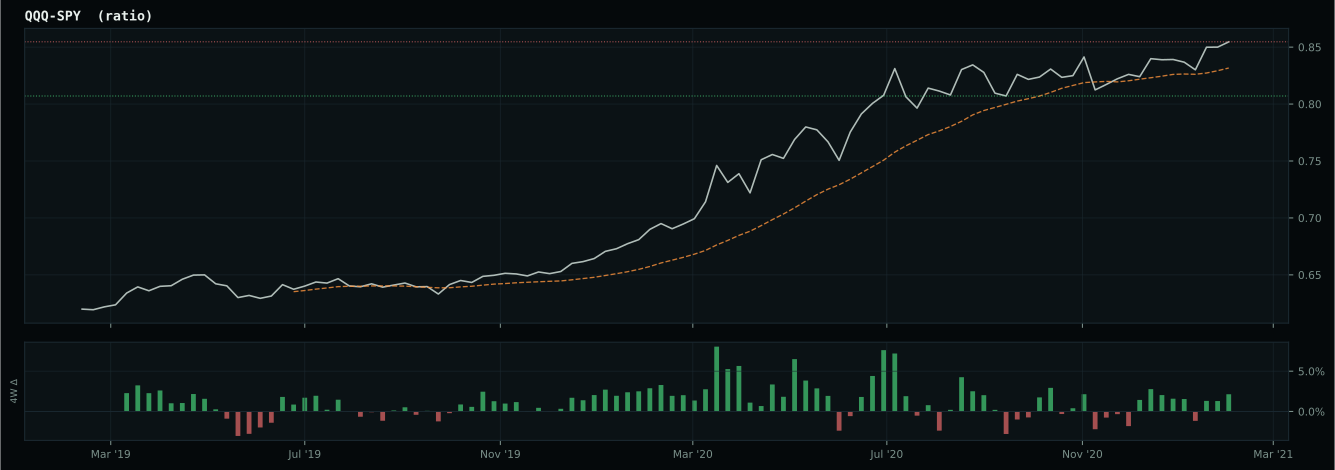
Macro Evidence Charts
Market-implied signals behind the macro regime scores. Each ratio compares two assets; the direction and slope of the ratio is what the macro engine reads.
Crypto Regime — AltSeason
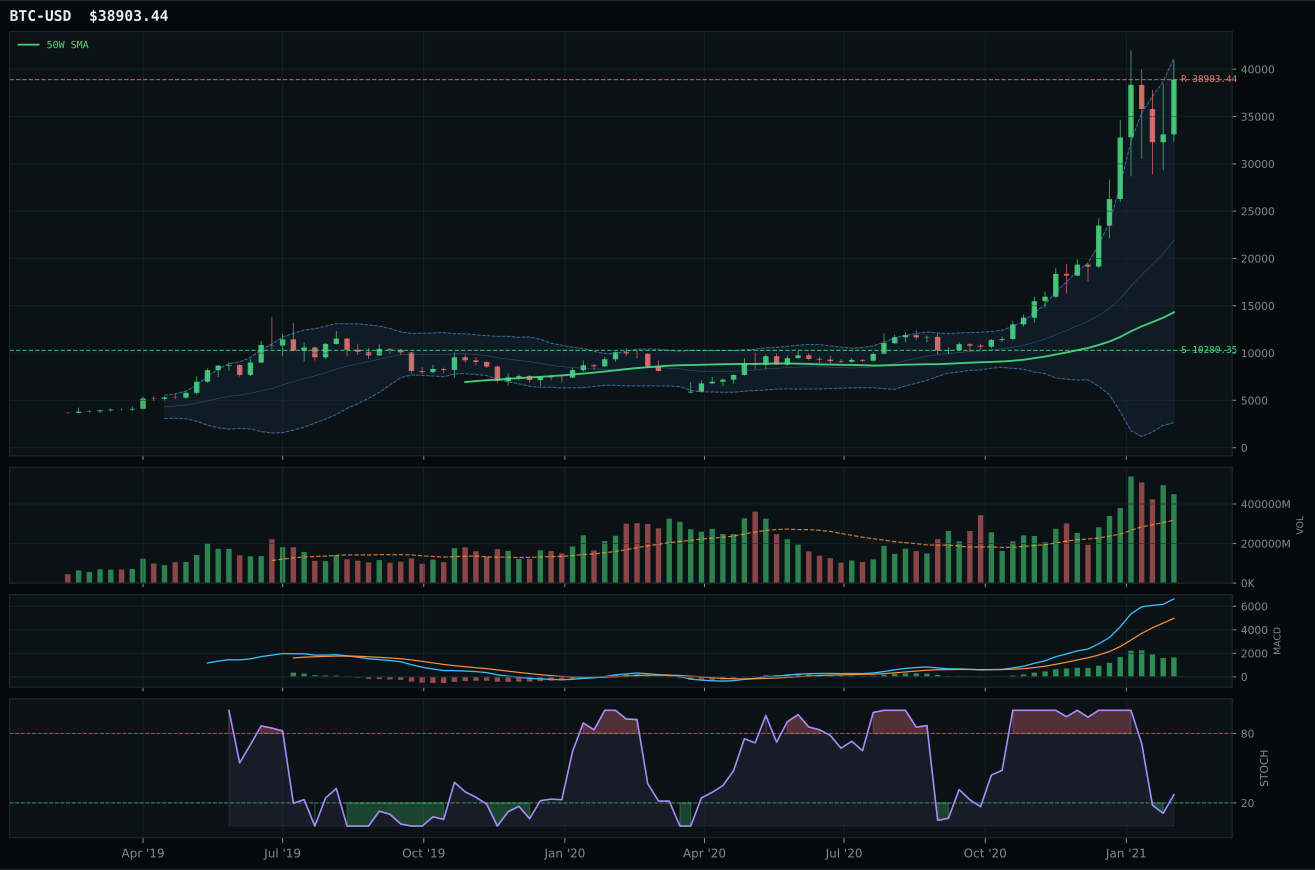
post-touch structure is too wide to count as a range; max/min close ratio is 7.11
TrendBTC confirmed: 2 consecutive closes above rising/flat 50W SMA
all available AltSeason conditions pass; missing optional confirmations skipped

Category Rankings
| Rank | Category | Winner | Score | Alloc | 4W Ret | Peers (4W) |
|---|---|---|---|---|---|---|
| 1 | Industrial Metals | COPX | 79.5 | 20% | +12.45% | REMX -2.5% · PICK +7.8% |
| 2 | Traditional Energy | XOP | 76.3 | 20% | +27.79% | FCG +29.5% · XLE +23.8% |
| 3 | Emerging Markets | IEMG | 62.6 | 10% | -5.21% | INDA +0.1% · ILF -6.3% |
| 4 | Agriculture & Livestock | MOO | 61.4 | 10% | +1.81% | VEGI +3.9% · WEAT +0.6% |
| 5 | Technology | IGV | 58.5 | 10% | -11.27% | CIBR -10.9% · XLK -5.2% |
| 6 | AI | SMH | 54.5 | 10% | -4.20% | AIQ -6.5% · BOTZ -9.1% |
| 7 | Defense & Aerospace | ITA | 53.5 | 10% | +2.28% | ROKT -5.1% · XAR -2.4% |
| 8 | Utilities & Infrastructure | XLU | 52.7 | 10% | -6.09% | IGF -1.7% · PAVE +5.9% |
| 9 | Nuclear Energy | URA | 46.6 | 0% | +7.59% | URNM +10.3% · NLR -3.7% |
| 10 | Precious Metals | SLV | 37.3 | 0% | -8.15% | GLD -7.8% · GDX -10.5% |
Industrial Metals — COPX
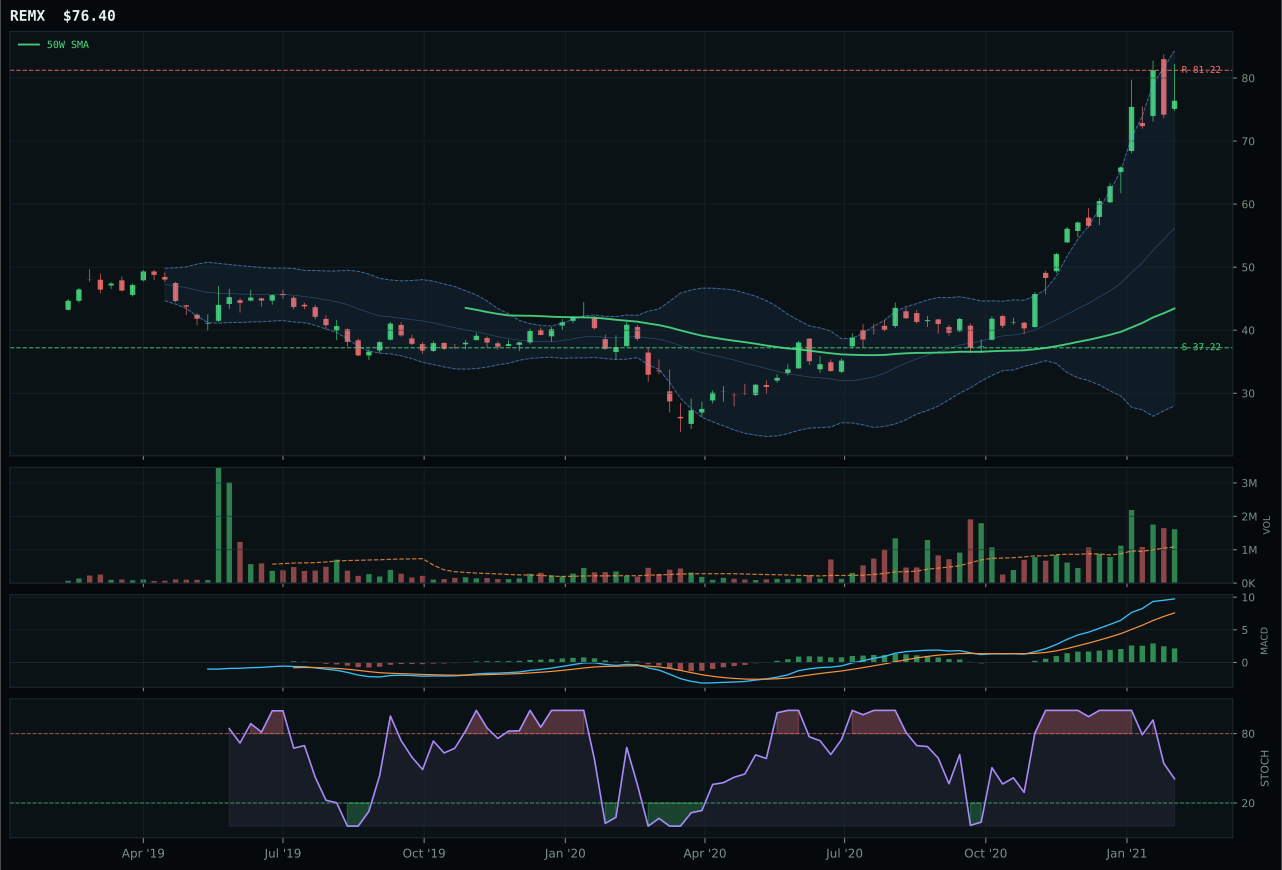
REMX has a vertical extension profile with 56.3% 13-week relative strength versus SPY.
A failed hold above support would weaken the setup.
Actionable but governed by invalidation levels.
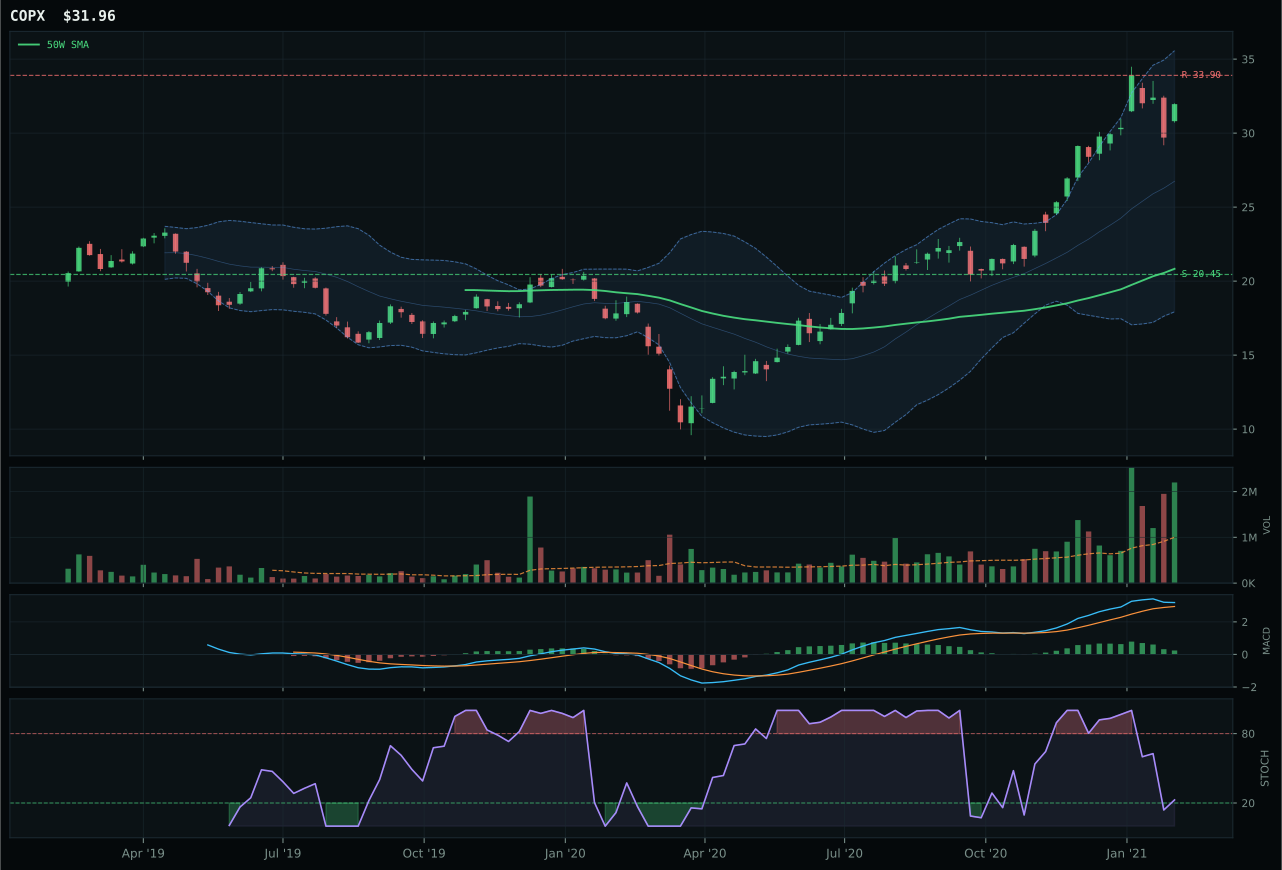
COPX has a vertical extension profile with 25.9% 13-week relative strength versus SPY.
A failed hold above support would weaken the setup.
Actionable but governed by invalidation levels.
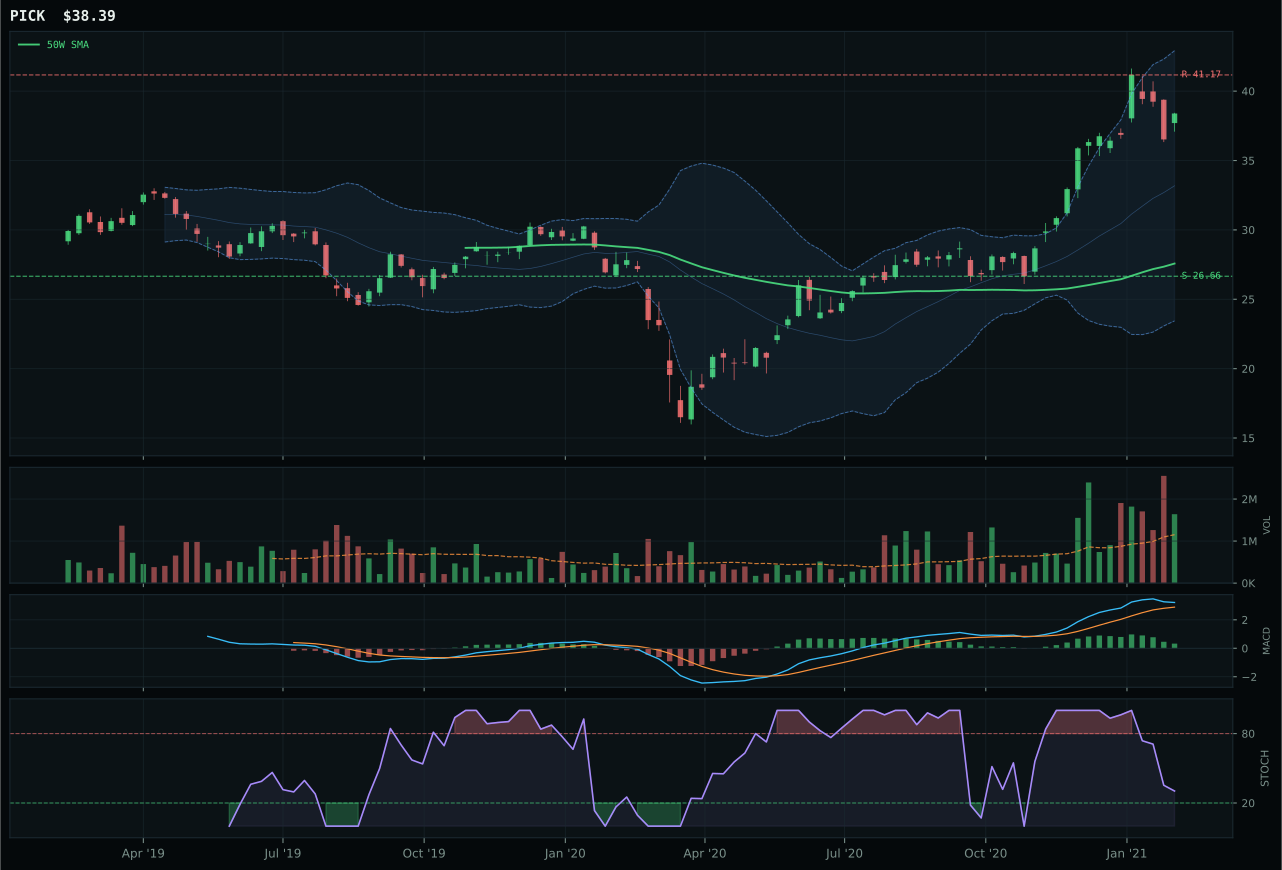
PICK has a vertical extension profile with 23.2% 13-week relative strength versus SPY.
A failed hold above support would weaken the setup.
Actionable but governed by invalidation levels.
COPX wins despite REMX's superior individual technical evidence score (89.1 vs 74.6) because risk/reward and volume confirmation tell the truer story of institutional commitment. COPX trades at 2.19x 20-week volume with accumulation/confirmation versus REMX's above-average participation; when MACD is bullish but flattening in both names and stochastic RSI is falling/neutral, the volume distinction separates real demand from mere short-covering. REMX's 75.8% extension above the 50-week moving average versus COPX's 53.4% is visually stunning—67.1% 13-week return versus 36.6%—but that extension is the problem, not the feature. New buyers in REMX face zero upside to resistance (-5.7% headroom) while COPX offers slightly better asymmetry (also -5.7%, but COPX's support is 56.3% downside, offering traders a defined stop level). The category-level macro (metals scarcity +14, commodity breadth +10) favors both, but COPX's 25.9% SPY relative strength versus REMX's 56.3% suggests that copper's scarcity narrative is being priced more efficiently by consensus than rare earths' supply crisis. PICK's competitive structure score (100 vs 100 trend) fails to overcome its -23.2% category-relative strength disadvantage.
Industrial Metals receives 10% allocation as a top-2 overweight, the highest tier in the 50% overlay regime where normal 20%/10%/5% tiers are halved. The category score of 79.5 ranks 2nd overall, behind only the broader energy complex, and macro justification is overwhelming: metals scarcity (+14), commodity breadth positive (+10), real asset sponsorship (+6), and supply shortage thematic all converge. COPX's 36.6% 13-week return with 2.19x accumulation volume marks this as a category where institutional capital is rotating into supply-constrained assets; the 25.9% SPY relative strength confirms that copper is not rising because equities are rising, but rather because copper faces genuine industrial demand (EV, green infrastructure) colliding with constrained supply. The 10% position reflects the allocator's view that this is a structural, multi-year theme rather than a near-term squeeze; a breakdown below COPX's 20.45 support level or a sharp reversal in commodity breadth would likely trigger a quick reduction to the tier-3 level (5%), but current volume sponsorship and macro tailwinds justify full conviction sizing. This is the second largest holding in the portfolio for legitimate macro and technical reasons.
Traditional Energy — XOP
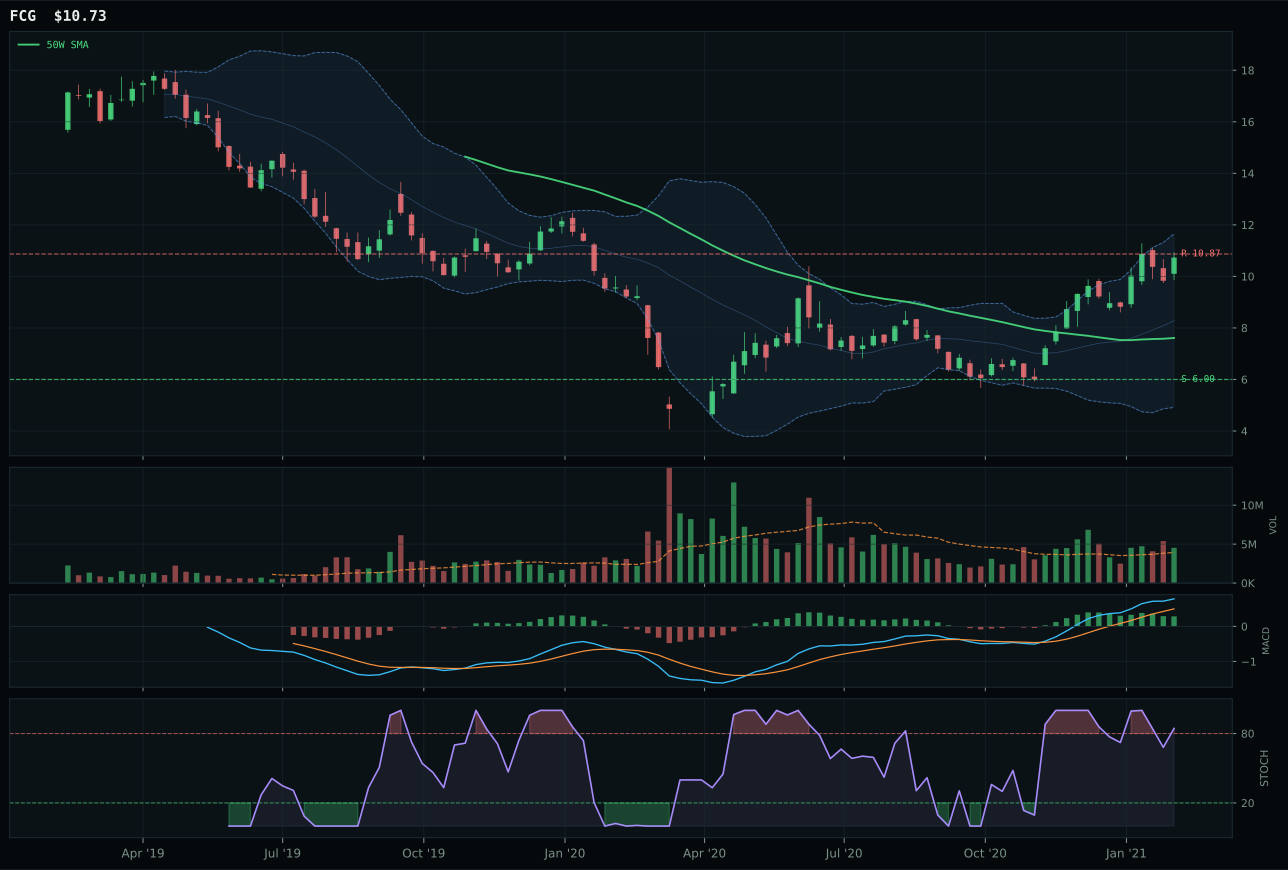
FCG has a vertical extension profile with 68.1% 13-week relative strength versus SPY.
A failed hold above support would weaken the setup.
Actionable but governed by invalidation levels.
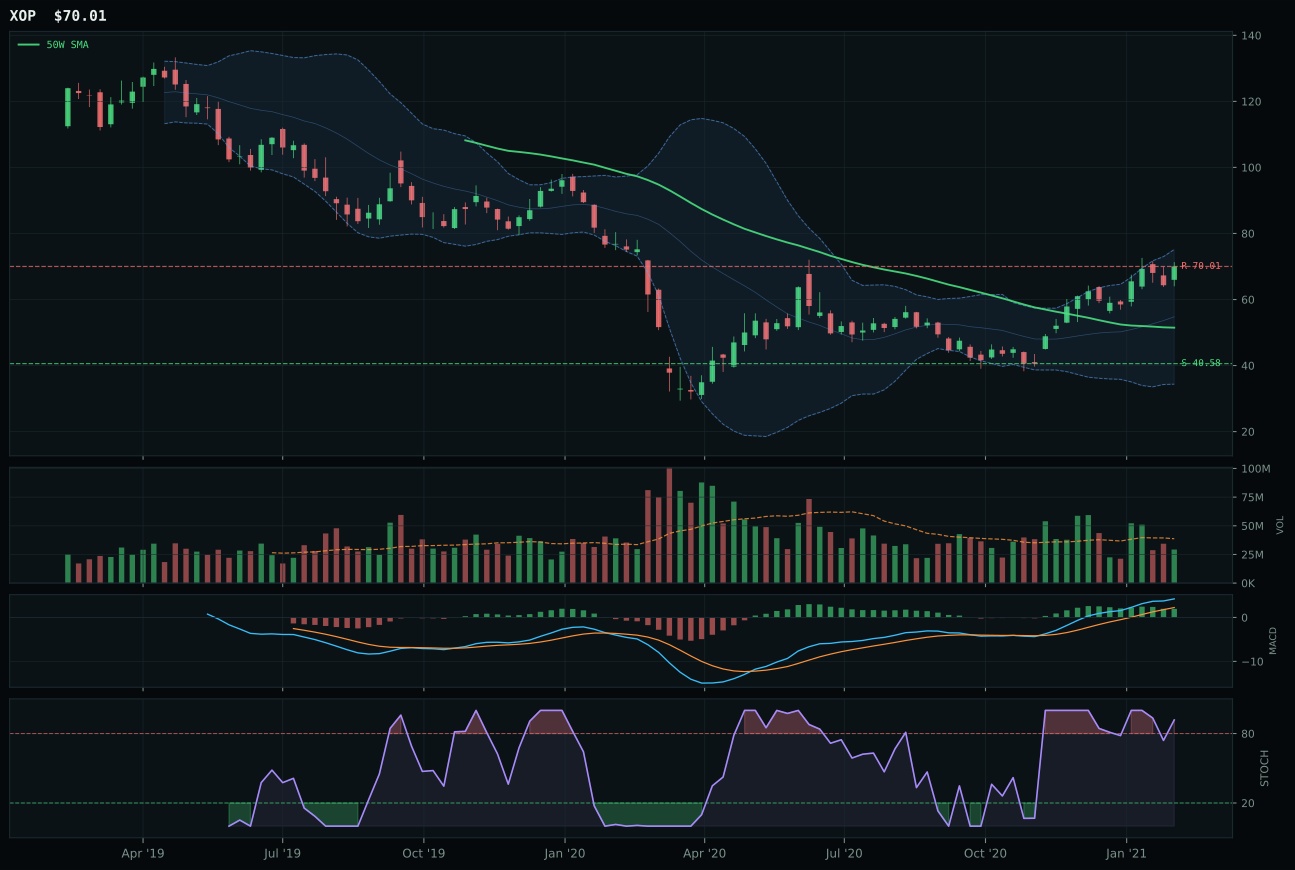
XOP has a vertical extension profile with 61.8% 13-week relative strength versus SPY.
A failed hold above support would weaken the setup.
Actionable but governed by invalidation levels.
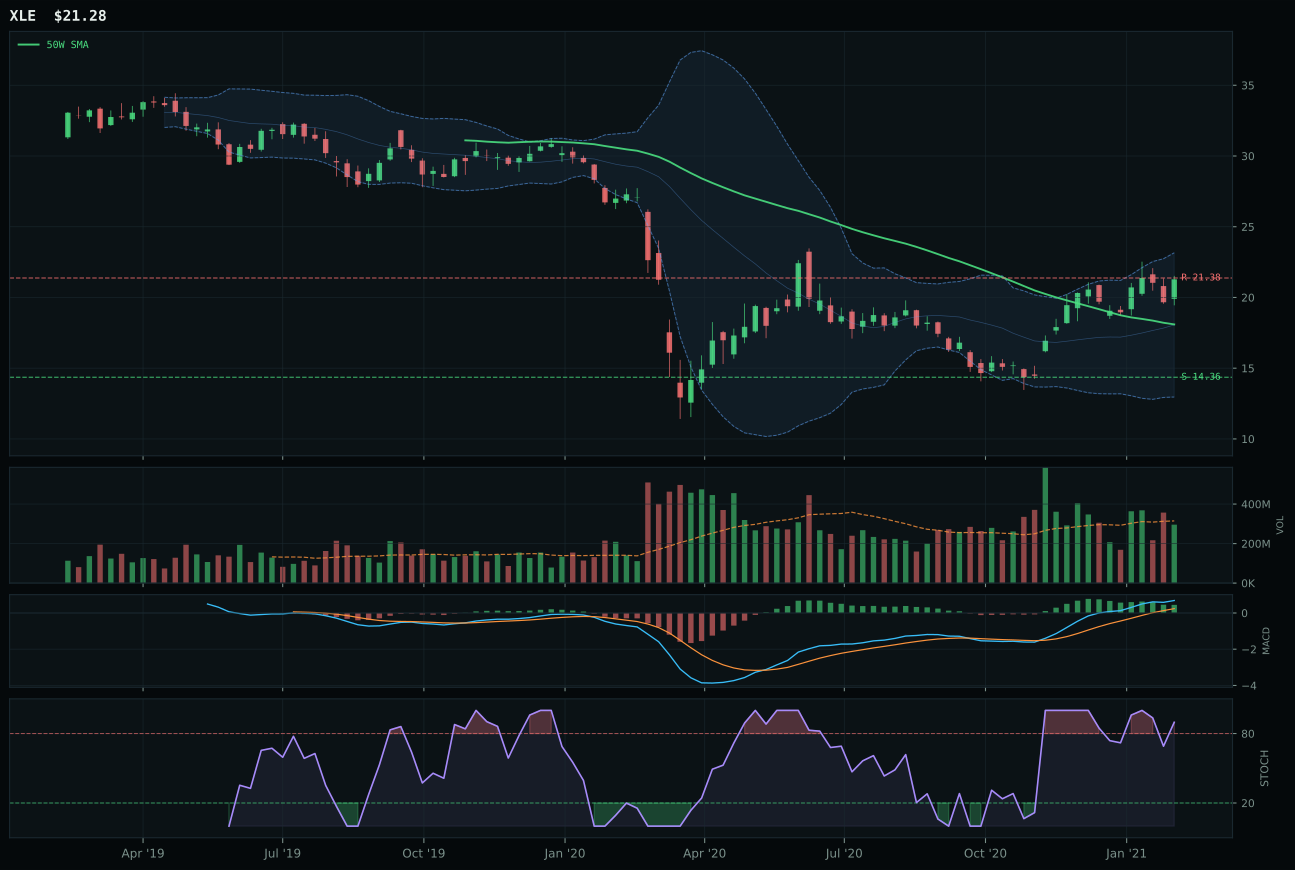
XLE has a vertical extension profile with 36.4% 13-week relative strength versus SPY.
A failed hold above support would weaken the setup.
Actionable but governed by invalidation levels.
XOP wins the category despite trailing FCG in technical evidence (52.9 vs 67.7) because timing and risk/reward structure provide a firmer foundation when both names are extended and both show overbought-rolling-over momentum. FCG is extended 43.5% above the 50-week moving average with 78.8% 13-week return and 68.1% SPY relative strength—an eye-catching setup that immediately triggers timing risk (22.0/100 timing score). XOP at 36.0% extension and 72.5% 13-week return offers better risk/reward (32.0 vs 22.3) because its 40.58-to-70.01 support/resistance band is wider and more navigable than FCG's 6.00-to-10.87 structure. The category-level macro (energy scarcity +16, inflation pressure +10, supply shortage +9) overwhelmingly favors both, yet XOP's persistence score of 100.0/100 versus FCG's implied lower reflects sustained buying momentum that neither volume weakness (XOP at 0.76x, FCG at above-average) nor MACD flattening can invalidate. XLE's 36.4% SPY relative strength trails both leaders, and its neutral structure provides no timing edge; XOP's edge is durability, not velocity.
Traditional Energy receives 10% allocation as a top-2 overweight, matching Industrial Metals in portfolio conviction. The category score of 76.3 ranks 2nd among all categories, directly behind COPX (79.5), and the macro case is unassailable: energy scarcity is the most aggressively priced theme in this regime, with +16 weighting, plus real asset sponsorship, supply shortage, and inflation pressure all converging. XOP's 72.5% 13-week return and 61.8% SPY relative strength confirm that exploration beta (the highest-leverage energy play) is where marginal buyers are accumulating; the fact that XOP achieved this return despite below-average volume (0.76x) suggests conviction rather than momentum chasing. The 10% position reflects the allocator's assessment that energy supply constraints are real (not sentiment-driven) and will persist through this macro regime. However, there is meaningful execution risk: XOP's support at 40.58 offers only 29.7% downside protection relative to current levels, and its overbought-rolling-over stochastic RSI (0.92) could trigger sharp reversals on any credit-stress catalyst. This allocation is a full conviction bet on energy scarcity persisting; any sign that crude inventories are normalizing or that recession fears are rising would trigger a quick exit toward COPX's superior risk/reward structure.
Emerging Markets — IEMG
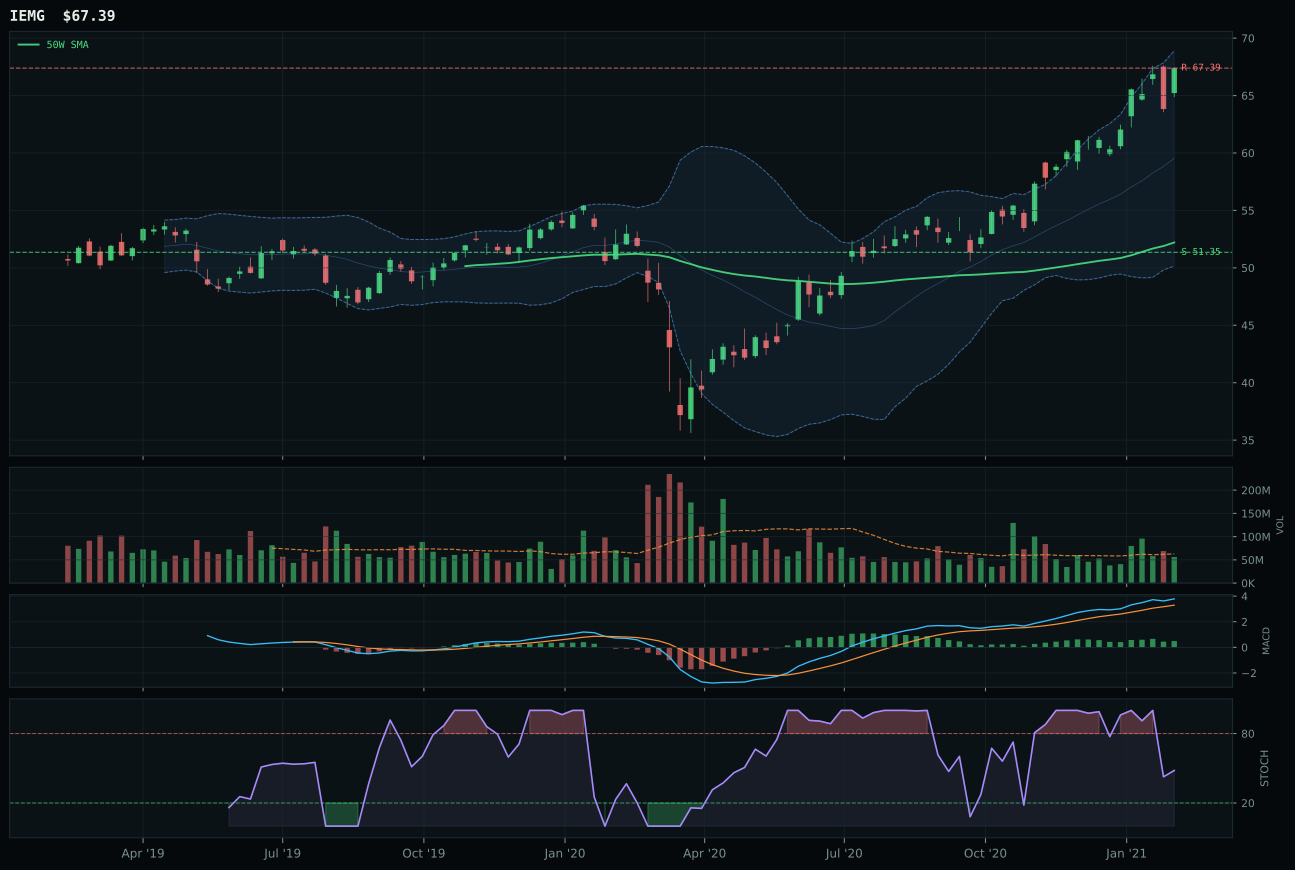
IEMG has a vertical extension profile with 6.8% 13-week relative strength versus SPY.
A failed hold above support would weaken the setup.
Actionable but governed by invalidation levels.
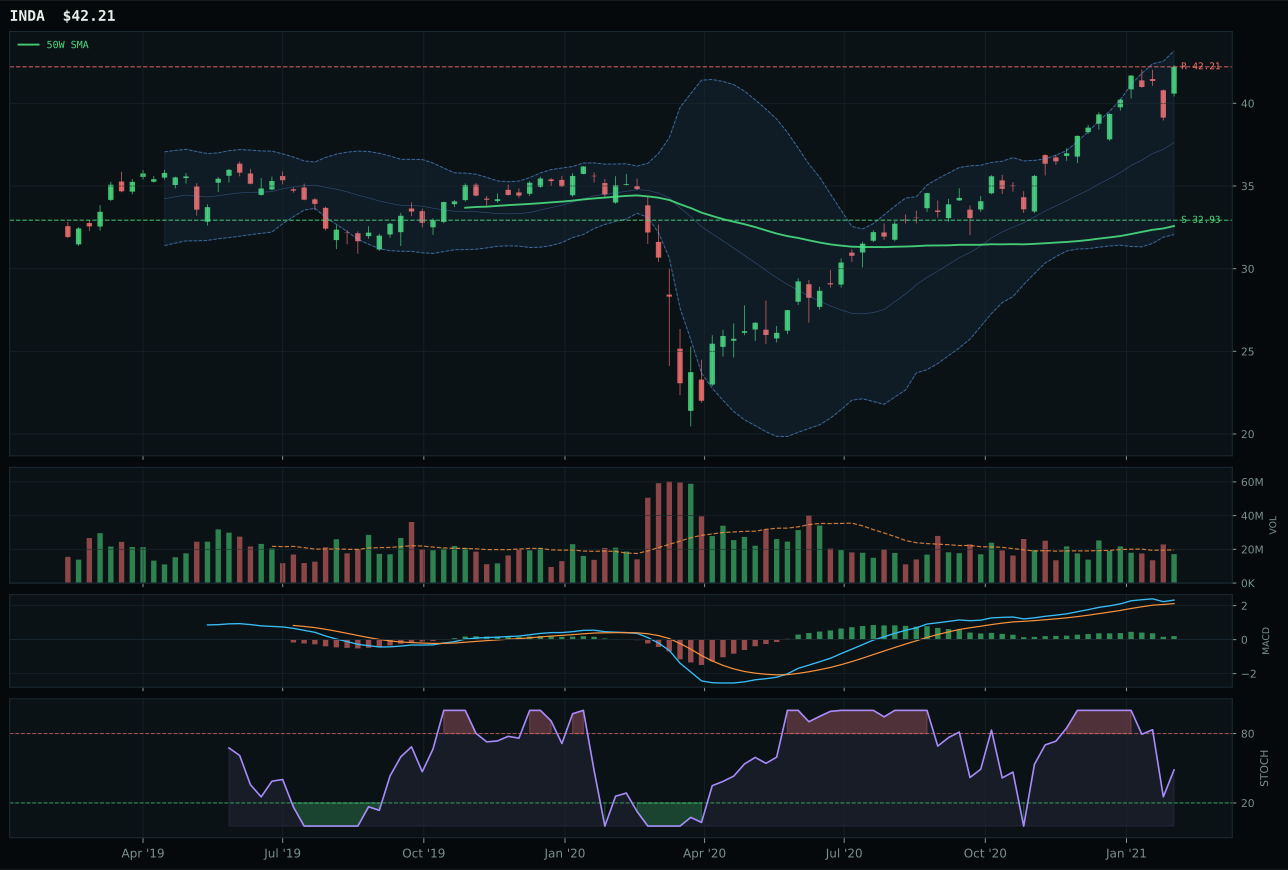
INDA has a vertical extension profile with 7.8% 13-week relative strength versus SPY.
A failed hold above support would weaken the setup.
Actionable but governed by invalidation levels.
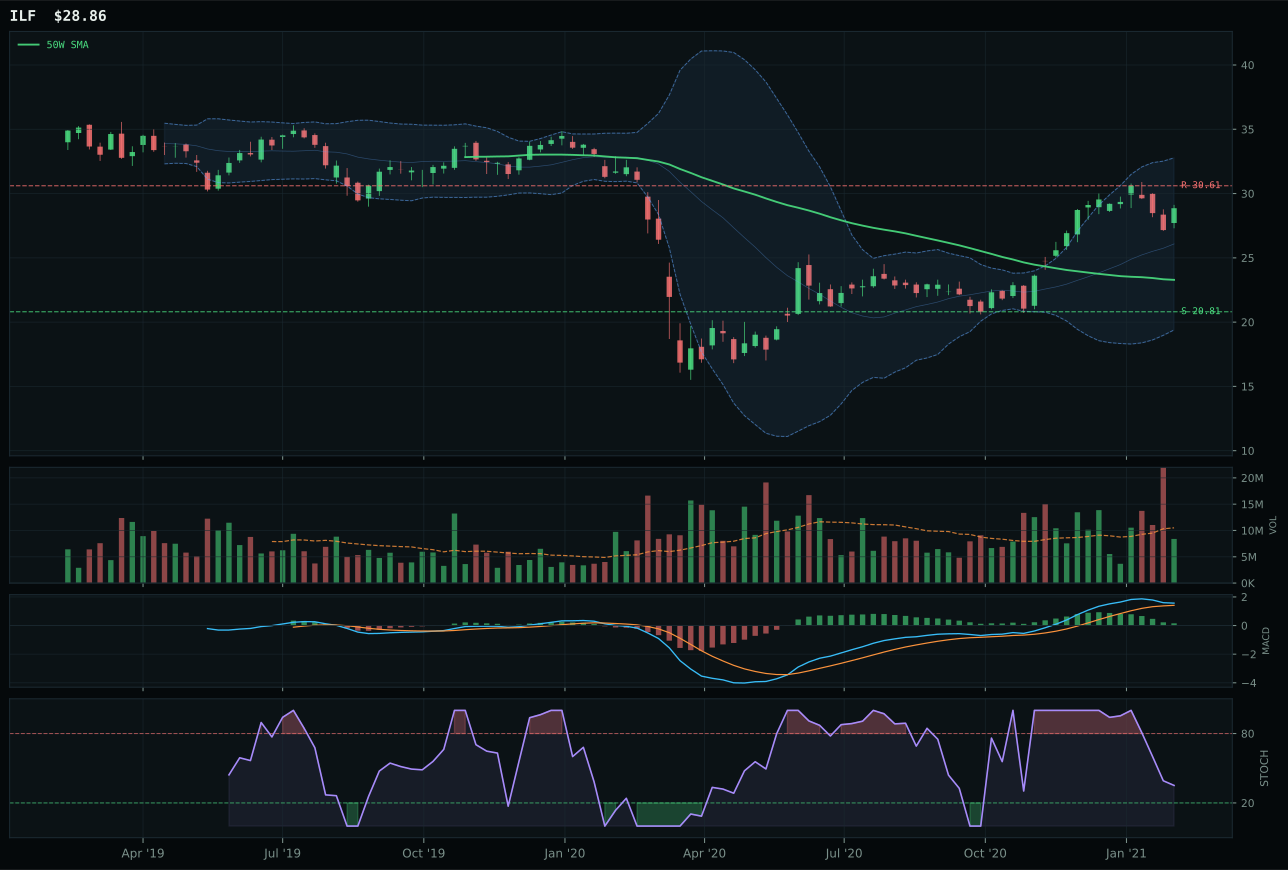
ILF has a vertical extension profile with 11.5% 13-week relative strength versus SPY.
A failed hold above support would weaken the setup.
Actionable but governed by invalidation levels.
IEMG wins by the narrowest margin (-1.2 points behind INDA in the reasoned ETF proof order) because its technical evidence synthesis edges out INDA's marginally sharper momentum. Both deliver 100.0/100 trend scores with 17.5% and 18.5% 13-week returns respectively and identical 40/100 timing scores (both extended roughly 29-30% above the 50-week moving average). The winning factor is volume-price confirmation and persistence: IEMG's 67.2/100 volume-price confirmation reflects neutral participation (0.89x average) paired with clean vertical extension, signaling disciplined accumulation. INDA matches this structure but carries category-relative weakness (-1.0% vs IEMG's 0.0%), a micro-disadvantage that compounds when both momentum and macro profiles are nearly identical. ILF's 11.5% SPY relative strength and 22.2% 13-week return are the headline attraction, yet its structure score (76 trend vs 100) and timing score (48 vs 40) reveal that this leadership is built on momentum exhaustion rather than fresh support construction. The 62.6 category score masks that this is a tight competition where INDA and IEMG are essentially interchangeable.
Emerging Markets receives 5% allocation as a tier-2 holding, ranked 5th among the 10 categories. The category score of 62.6 is respectable, but it loses the top-2 race to COPX (79.5), XOP (76.3), MOO (61.4), and IEMG itself (62.6 category score, but top-2 slots are already filled). The macro case is mixed: EM liquidity support (+14 weighting) and risk appetite positive (+8) both favor exposure, yet credit stress (-10) creates a meaningful headwind that separates this from the conviction-level allocations. IEMG's 6.8% SPY relative strength is modest—nearly half of what COPX or XOP deliver—confirming that emerging markets are participating in the risk-on move without leading it. The 5% position reflects the allocator's view that EM exposure provides portfolio diversification and exposure to commodity-driven growth narratives (India's quality growth through INDA-like positioning), but without the urgency of energy or metals scarcity themes. If credit stress escalated sharply or if EM currency weakness accelerated, this allocation would likely compress to zero; conversely, a sharp acceleration in commodity breadth or a breakdown in dollar strength would upgrade this to a top-2 conviction position. For now, IEMG serves as a satellite exposure rather than a core conviction.
Agriculture & Livestock — MOO
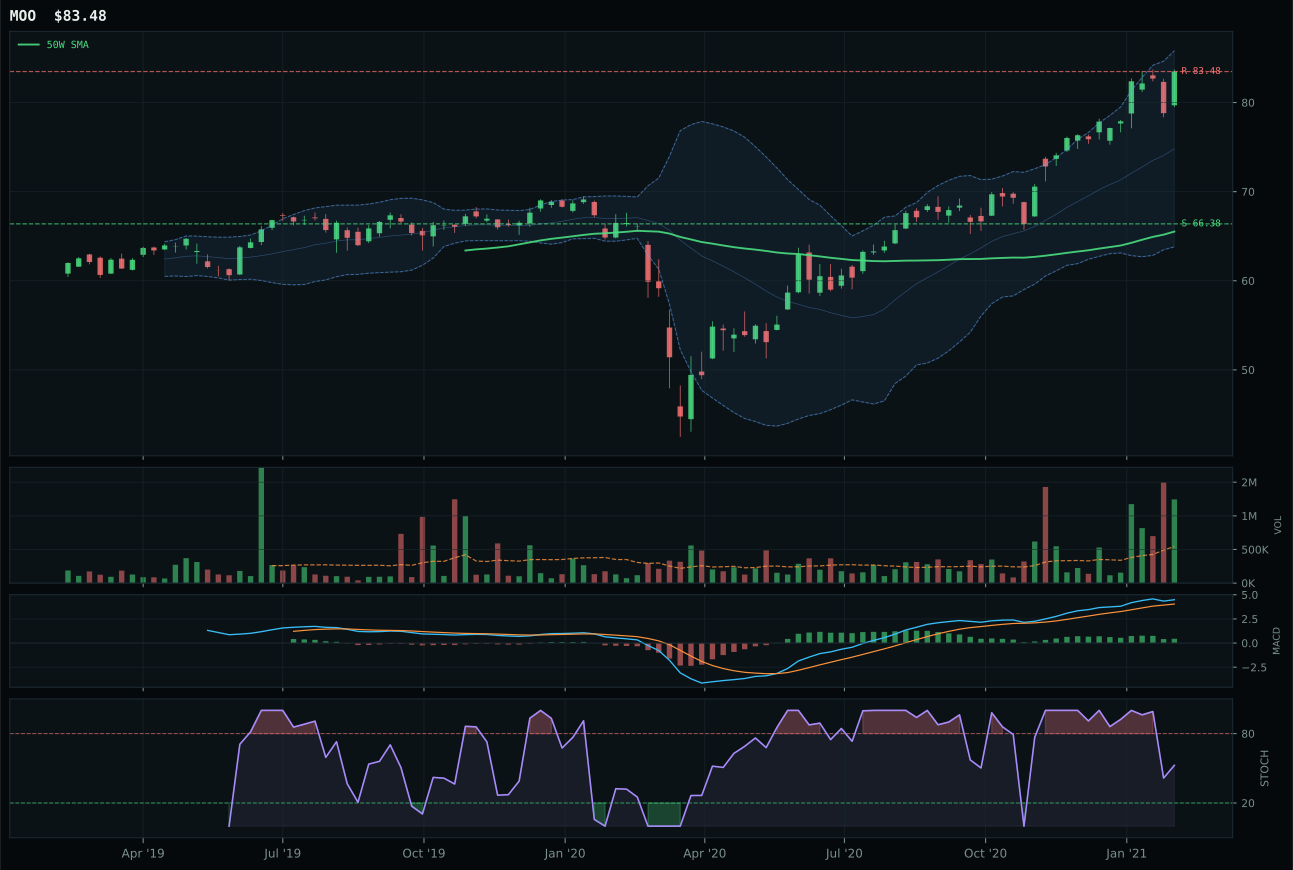
MOO has a vertical extension profile with 7.6% 13-week relative strength versus SPY.
A failed hold above support would weaken the setup.
Actionable but governed by invalidation levels.
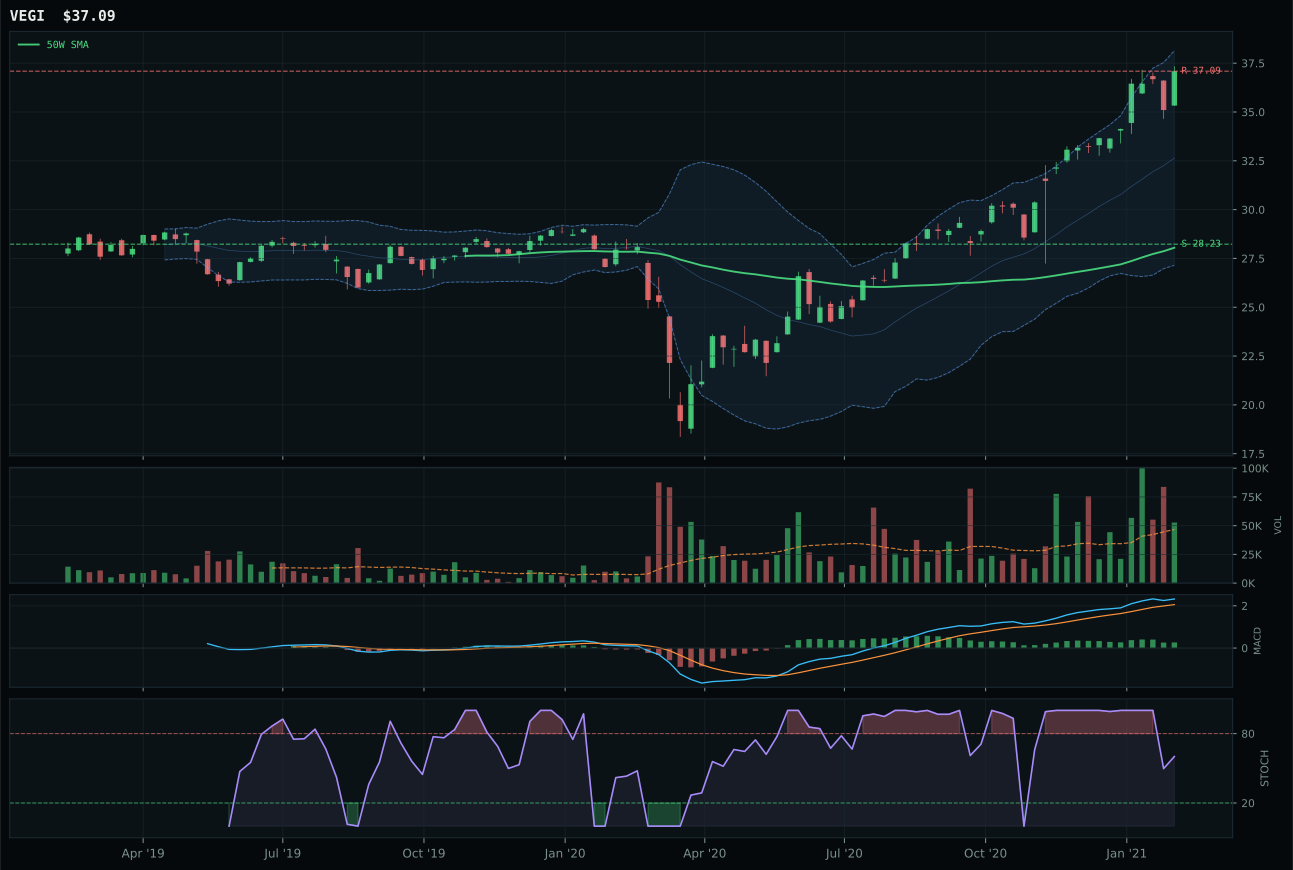
VEGI has a vertical extension profile with 11.4% 13-week relative strength versus SPY.
A failed hold above support would weaken the setup.
Tracked, but not top-2 eligible because: .
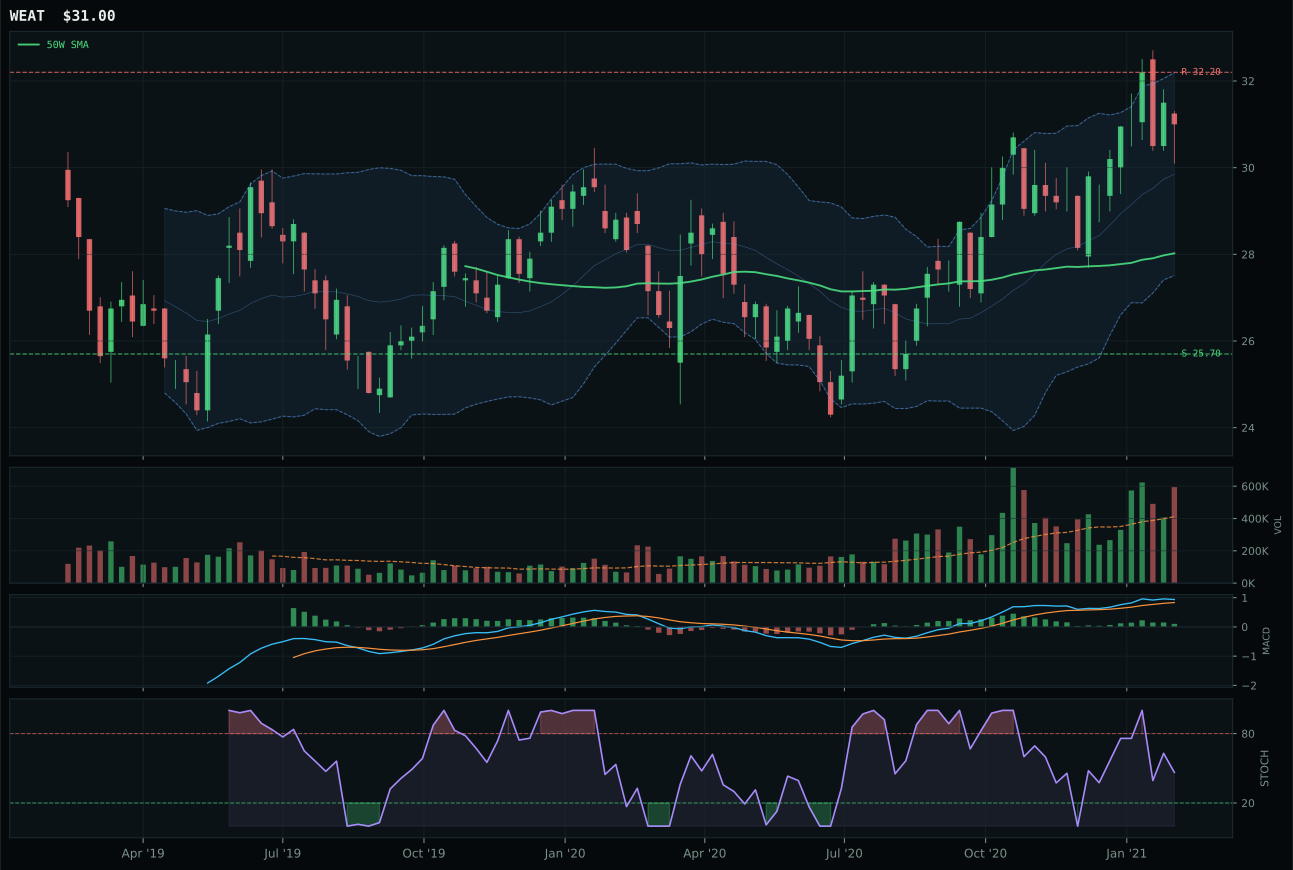
WEAT has a neutral structure profile with -6.0% 13-week relative strength versus SPY.
A failed hold above support would weaken the setup.
Actionable but governed by invalidation levels.
MOO wins because it combines category-leading macro fit (real asset sponsorship +5, supply shortage +8, inflation pressure +7) with superior volume confirmation that VEGI cannot match. Both sit in vertical extension setups roughly 27-29% above their 50-week moving averages, but MOO trades at 2.29x 20-week average volume (accumulation/confirmation) versus VEGI's above-average participation—a distinction that matters when MACD is bullish but flattening in both names. The category-relative strength of 0.0% for MOO versus 3.8% for VEGI is negligible; the true separation is in volume-price confirmation (85.3 vs implied lower) and persistence (80.8), which measure whether committed buyers are stepping in or whether the move is mere momentum exhaustion. WEAT's 4.7% 13-week return and -6.0% SPY relative strength disqualify it entirely despite neutral structure; the macro regime favors agribusiness equity (MOO) over single-commodity speculation (WEAT). MOO's risk/reward (47.6/100) edges VEGI's (41.6/100) because the downside to support is 25.8% while offering zero upside headroom—a risk asymmetry that only resolves favorably if accumulation persists.
Agriculture & Livestock earns 5% allocation as tier-2, yet the category score of 61.4 places it 4th—a paradox explained by the overlay system. The 50% crypto overlay (AltSeason) halves every normal tier from 20%/10%/5% to 10%/5%/2.5%, meaning only the two highest-scoring categories (COPX at 79.5 and XOP at 76.3) receive 10% each while the next tier receives 5%. MOO's category score is respectable, but it loses out to categories with higher macro velocity: Industrial Metals and Traditional Energy both score above 76 because supply shortage and energy scarcity are more explosively priced into the market this week than inflation-driven agricultural inputs. The 5% allocation reflects the allocator's acknowledgment that real-asset inflation is real (macro fit 86.0/100), but the absence of a structural undersupply crisis in agriculture—unlike copper (COPX's 25.9% SPY relative strength) or crude (XOP's 61.8%)—limits the conviction. MOO's 2.29x volume confirmation suggests institutional accumulation, enough to justify the position; a continued deceleration in commodity breadth or a breakdown in agricultural export narratives would likely eliminate this allocation entirely.
Technology — IGV
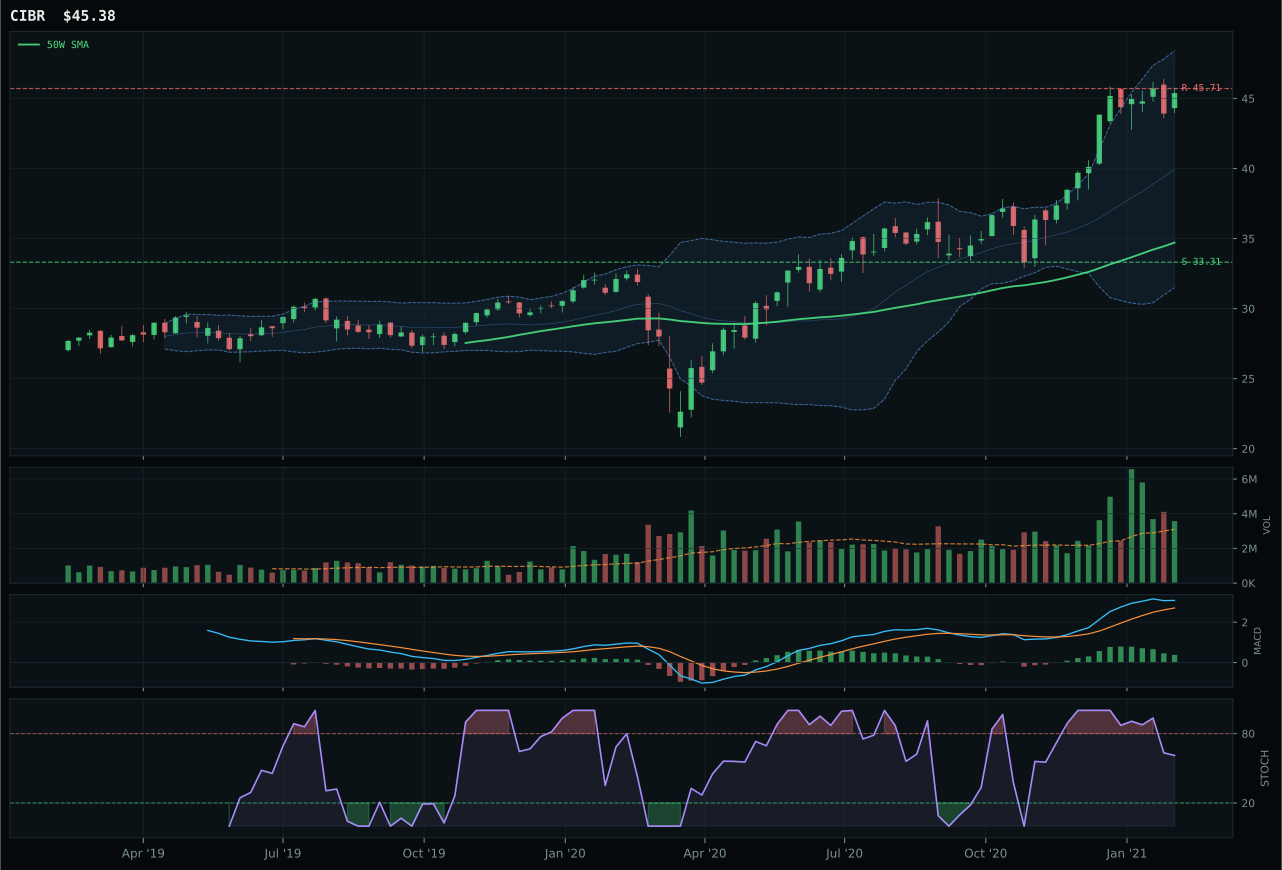
CIBR has a vertical extension profile with 14.1% 13-week relative strength versus SPY.
A failed hold above support would weaken the setup.
Actionable but governed by invalidation levels.
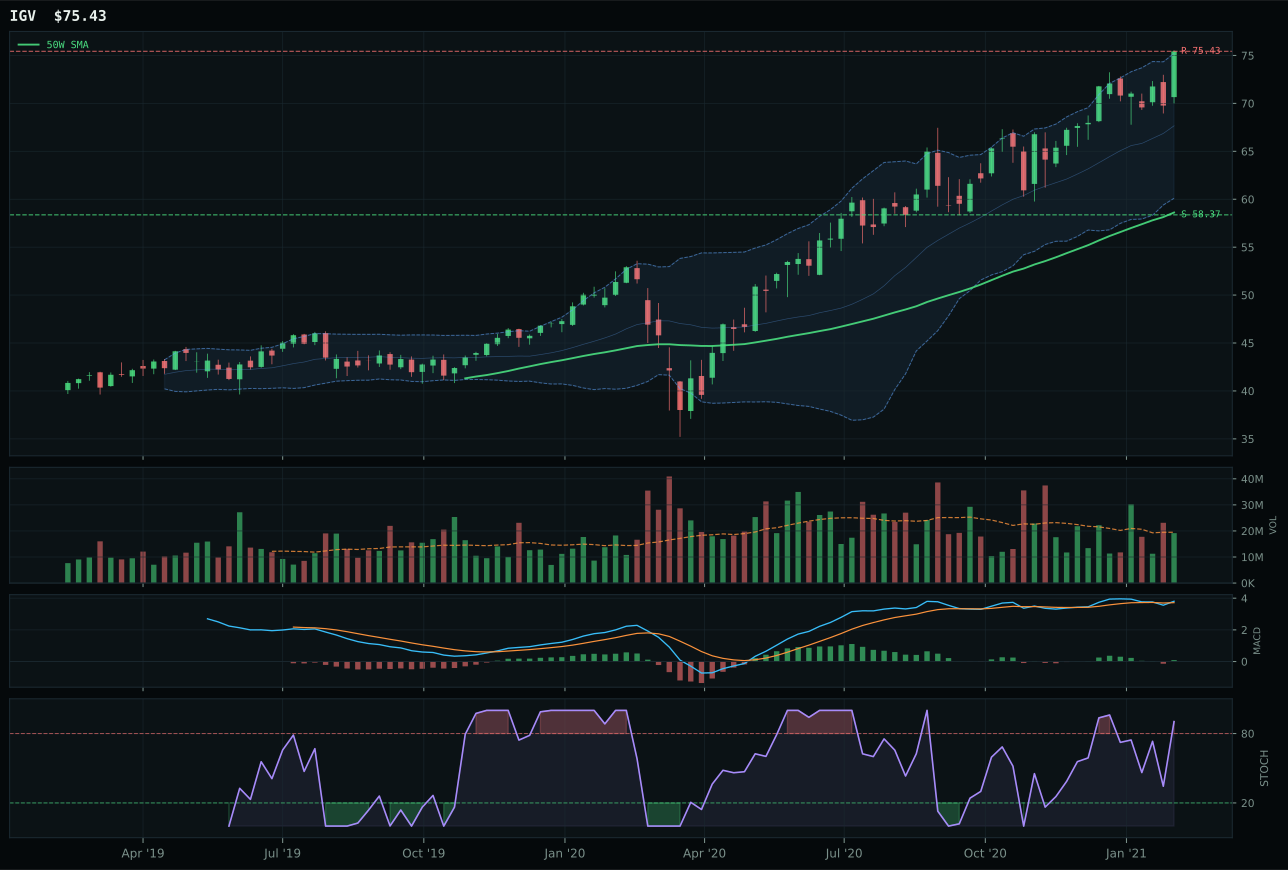
IGV has a vertical extension profile with 2.2% 13-week relative strength versus SPY.
A failed hold above support would weaken the setup.
Actionable but governed by invalidation levels.
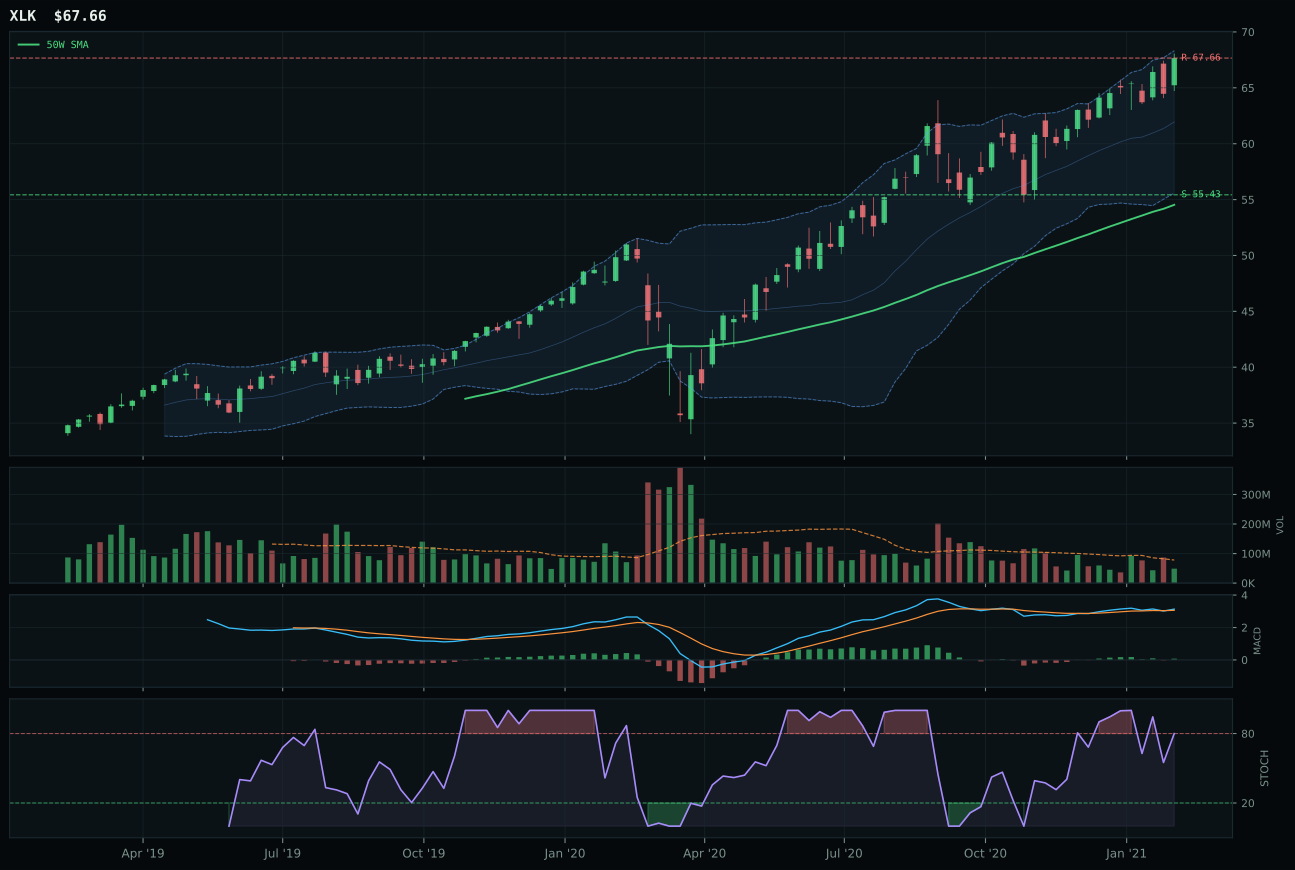
XLK has a vertical extension profile with 0.6% 13-week relative strength versus SPY.
A failed hold above support would weaken the setup.
Actionable but governed by invalidation levels.
IGV wins the category because it holds a cleanly above-average trend score (99.3/100) while facing the penalty that matters most: entry risk. The chart sits 28.7% above the 50-week moving average in a vertical extension setup, which explains why its composite score of 58 trails CIBR's 64 despite superior risk/reward positioning (41.9 vs 37.4). The real separation comes from volume confirmation—IGV trades at neutral participation (0.98x 20-week average) while CIBR carries above-average volume, a critical distinction when MACD is bullish but flattening across both names. What makes this win meaningful is the category's macro backdrop: risk appetite positive and AI growth sponsorship are both active, yet credit stress remains live at -9 points for IGV. The allocator chose measured entry timing over raw momentum breadth.
Technology earns 5% allocation this week, positioned as a tier-2 holding despite a respectable category score of 58.5. The category's macro fit (54.0/100) reveals the tension: while AI growth sponsorship and positive risk appetite support growth exposure, credit stress and inflation pressure both drag on the narrative. At a 5% allocation size within the 50% overlay sleeve, this represents a meaningful but defensive sizing—large enough to capture upside participation, small enough to reflect the timing risk that cost the category a top-2 position. Superior categories ranked higher because they offered either cleaner entry setups or stronger macro tailwinds; Technology's 28.7% extension above the 50-week moving average put new buyers at a structural disadvantage relative to industrial metals or energy, which offered better risk-adjusted entry points this week.
AI — SMH
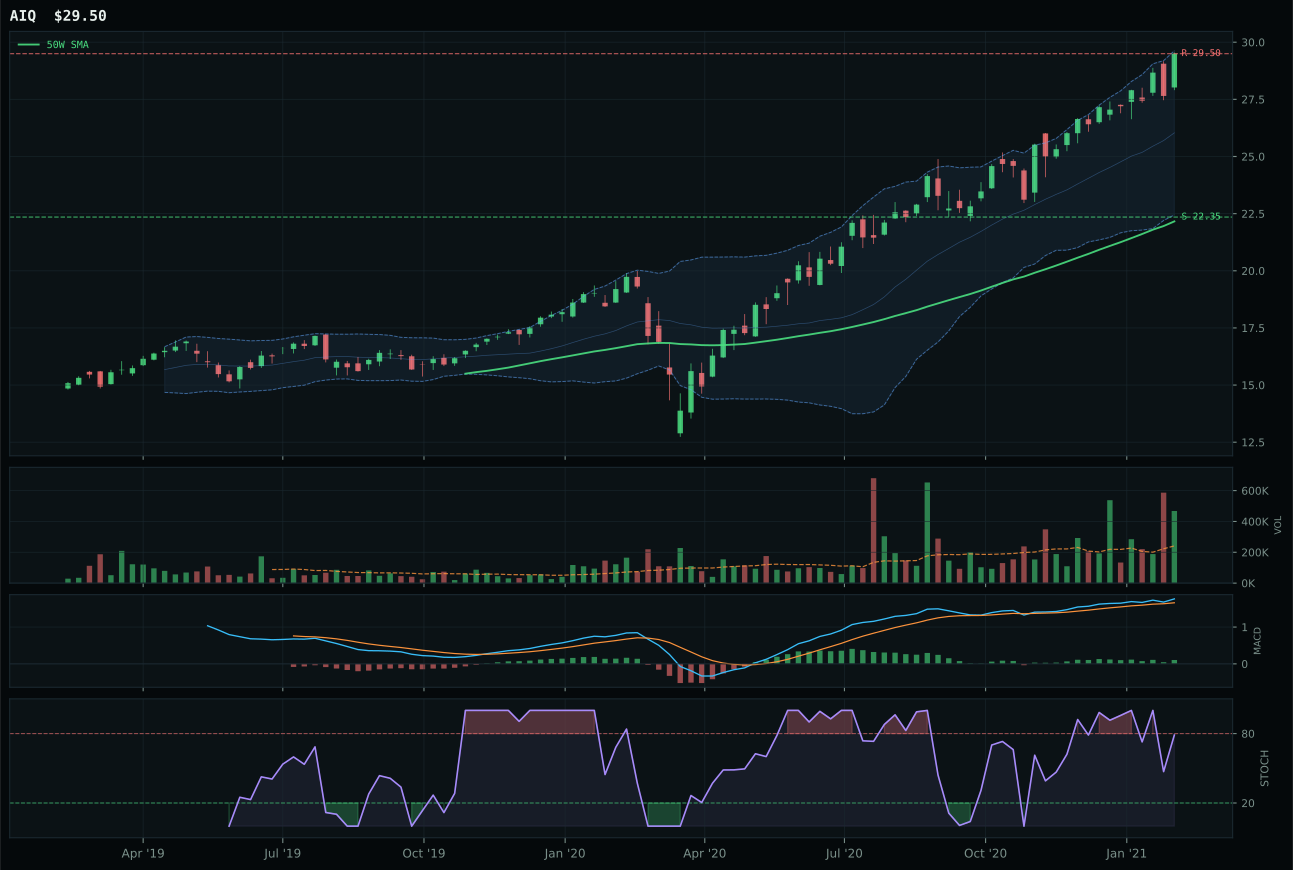
AIQ has a vertical extension profile with 4.9% 13-week relative strength versus SPY.
A failed hold above support would weaken the setup.
Tracked, but not top-2 eligible because: .
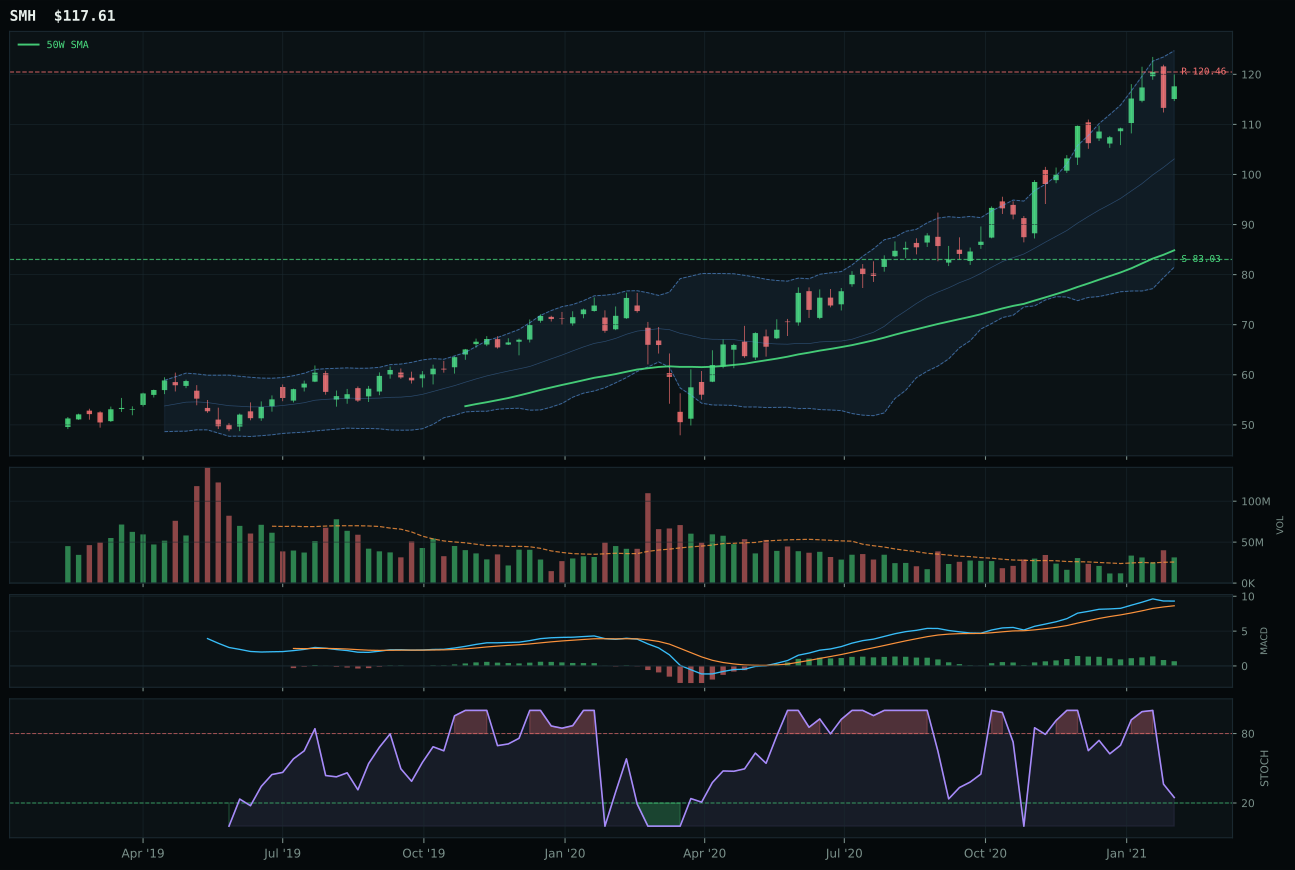
SMH has a vertical extension profile with 8.7% 13-week relative strength versus SPY.
A failed hold above support would weaken the setup.
Actionable but governed by invalidation levels.
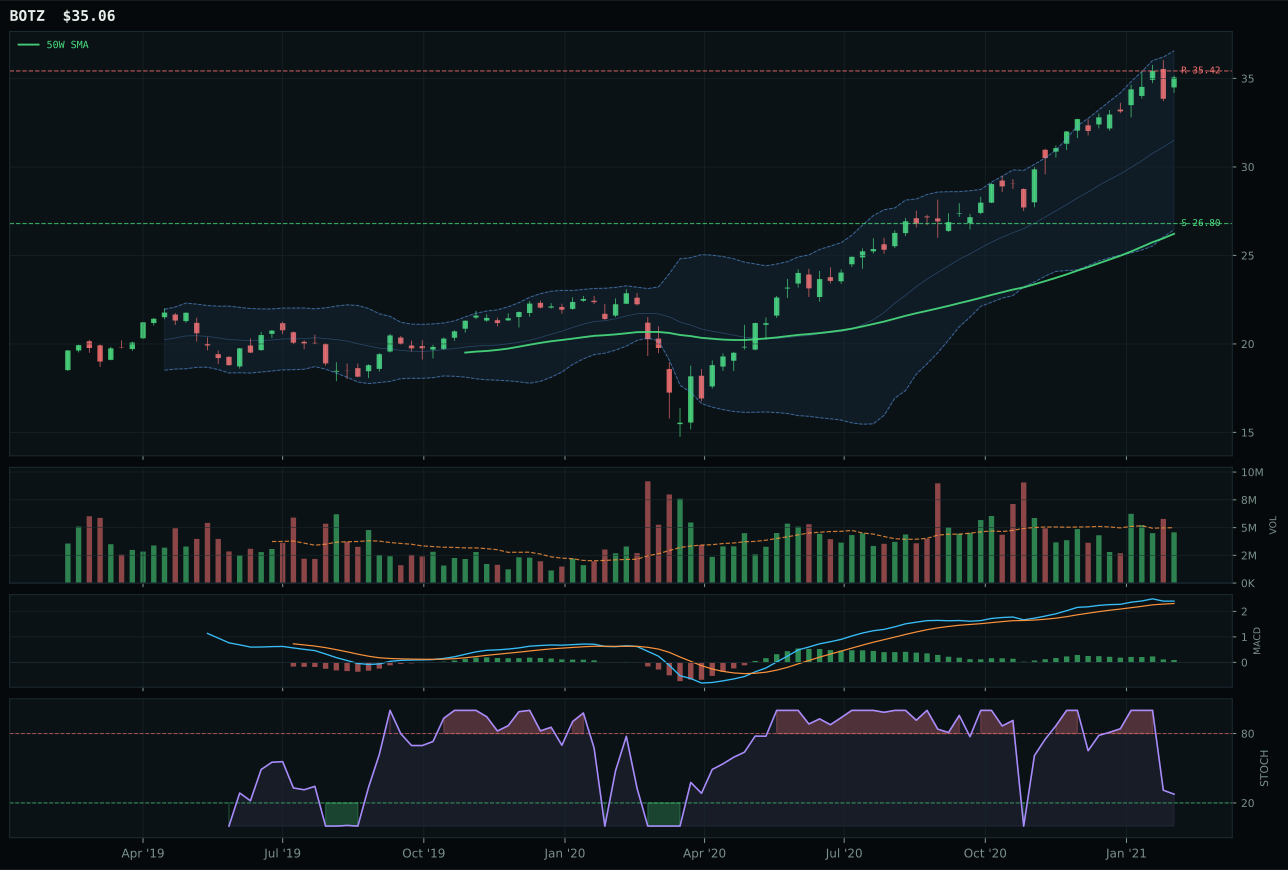
BOTZ has a vertical extension profile with 6.7% 13-week relative strength versus SPY.
A failed hold above support would weaken the setup.
Actionable but governed by invalidation levels.
SMH wins cleanly because its trend score of 100.0/100 pairs with category-relative strength that outpaces both AIQ (-1.8%) and BOTZ (implied weaker). The semiconductor angle delivers 8.7% relative strength versus SPY and a 19.4% 13-week return, supported by above-average volume participation at 1.22x the 20-week average—the only name in the basket showing genuine accumulation rather than mere bounce. BOTZ trails with neutral volume despite matching the momentum score, while AIQ's technical evidence score of 45.0/100 betrays soft internal structure: rising mid-zone stochastic RSI looks promising until you see the category-relative strength collapse to -1.8%, signaling that AI software peers are outperforming it. Both macro (+14 for AI growth sponsorship) and technicals align for SMH, but the competition from an extended REMX in Industrial Metals and the energy complex's explosive persistence kept this category out of the top-2 despite legitimate strength.
AI receives 5% allocation as a tier-2 holding, ranking behind Industrial Metals (79.5) and Traditional Energy (76.3) despite a credible category score of 54.5. The macro regime (Transition/Mixed) does not favor pure growth exposure when real assets are simultaneously scarce and inflationary; risk appetite positive alone cannot overcome the structural headwind of credit stress (-8 at the category level). SMH's 38.6% extension above the 50-week moving average, while supported by strong momentum confirmation (100/100), penalizes entry timing relative to categories offering pullback-into-support structures. The 5% position reflects the allocator's view that AI leadership (URA and SMH leading their respective categories) merits exposure, but the macro regime—mixed between risk-on energy and risk-off shelter—does not justify enlarging this sleeve beyond tier-2 sizing. A sustained decline in real-asset sponsorship or a sharp break below the 50-week moving average would demote this allocation entirely.
Defense & Aerospace — ITA
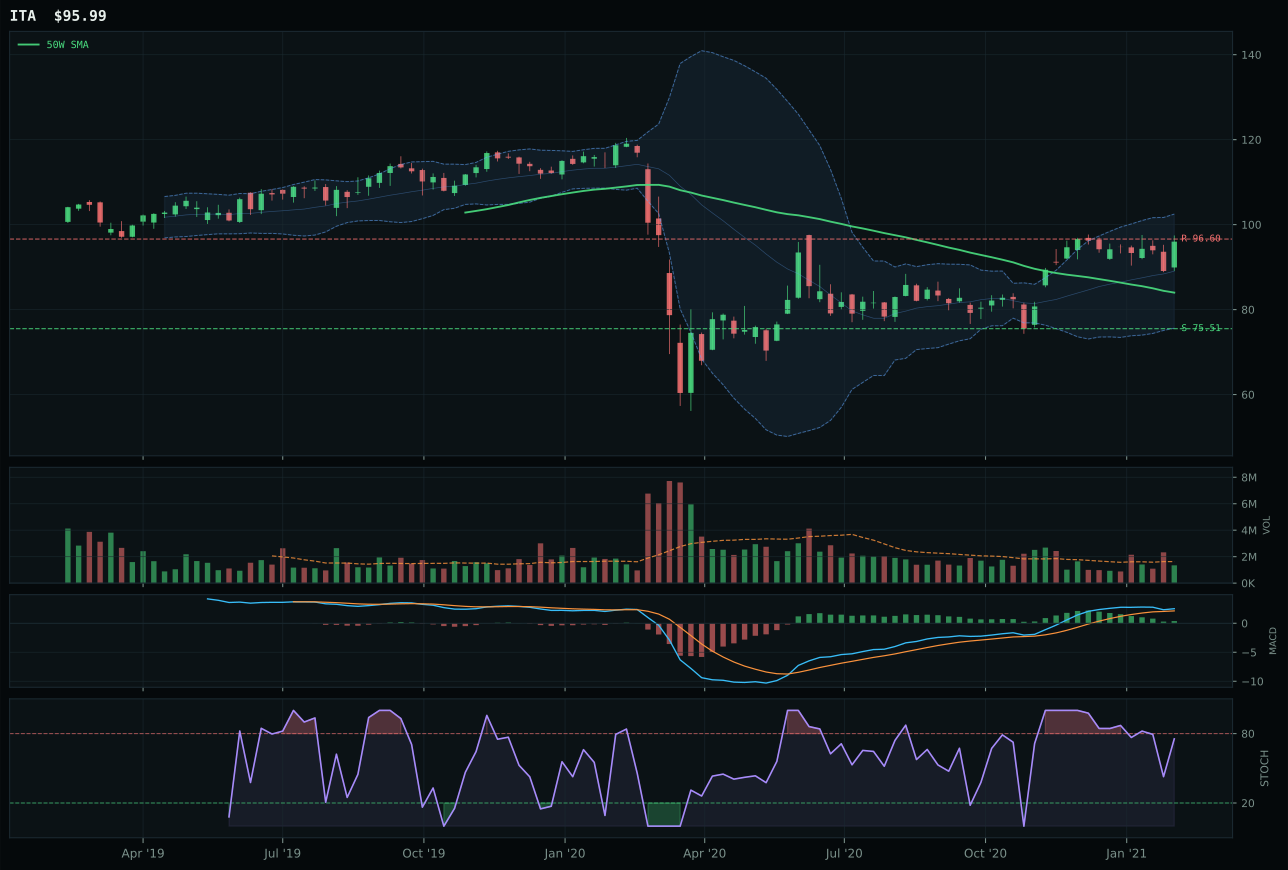
ITA has a neutral structure profile with 8.2% 13-week relative strength versus SPY.
A failed hold above support would weaken the setup.
Actionable but governed by invalidation levels.
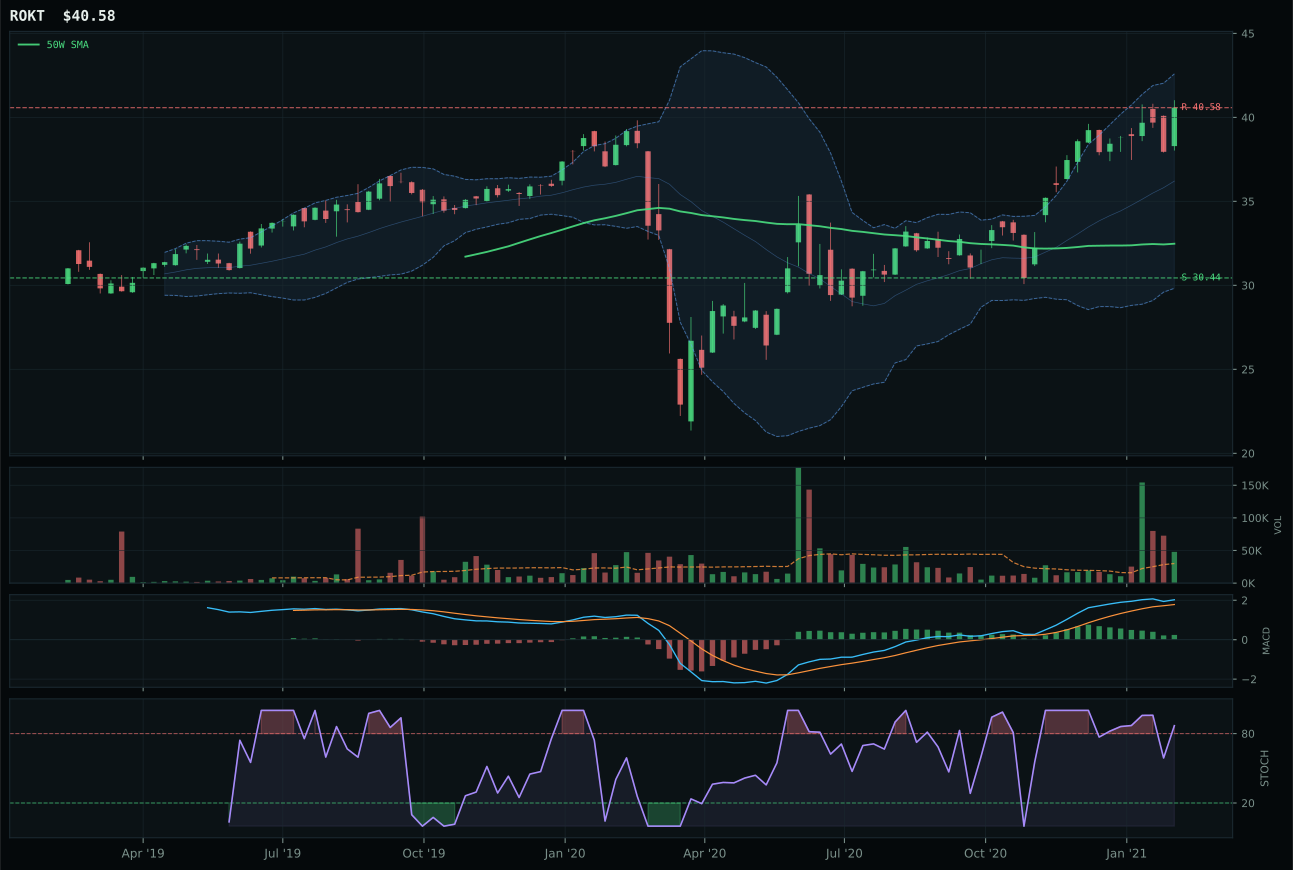
ROKT has a vertical extension profile with 15.2% 13-week relative strength versus SPY.
A failed hold above support would weaken the setup.
Tracked, but not top-2 eligible because: .
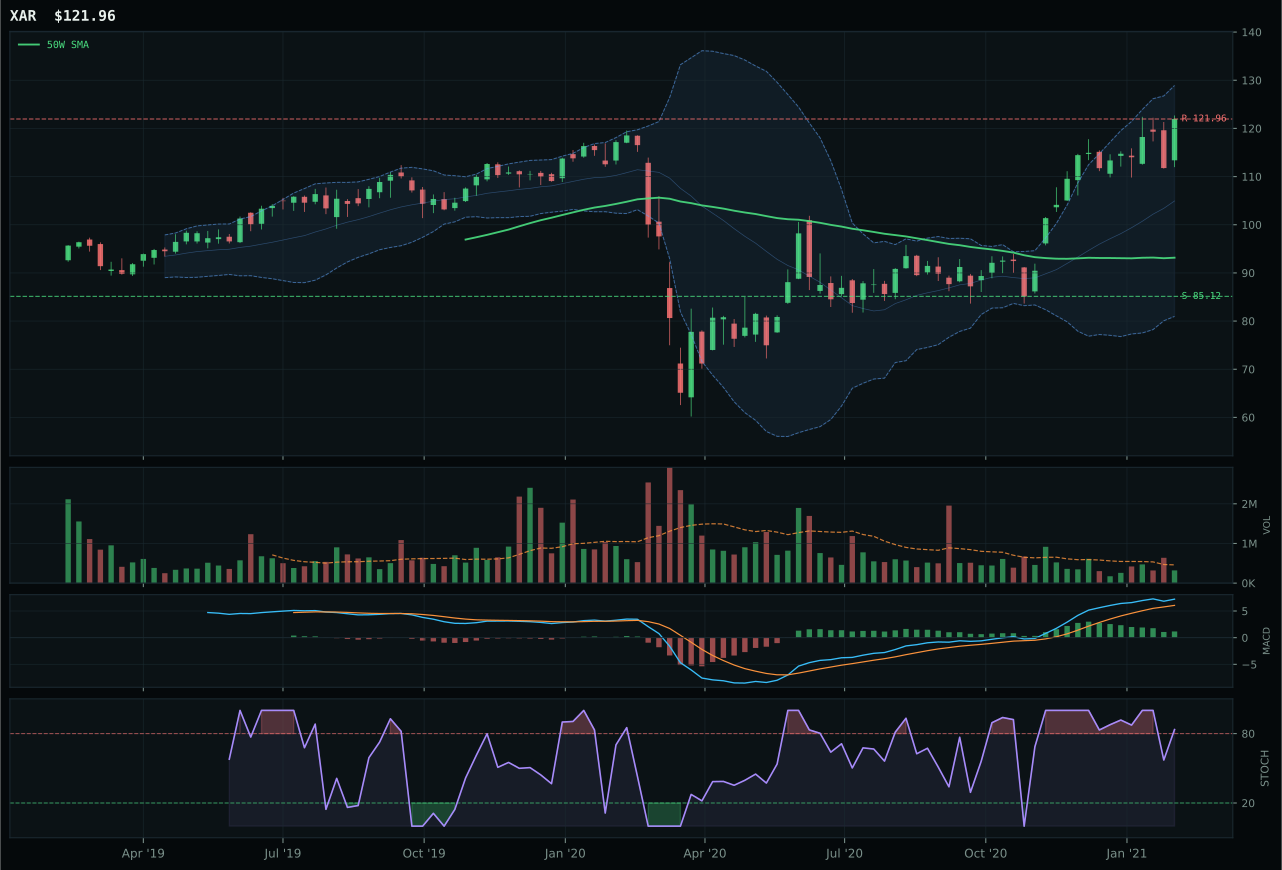
XAR has a vertical extension profile with 24.1% 13-week relative strength versus SPY.
A failed hold above support would weaken the setup.
Actionable but governed by invalidation levels.
ITA wins by timing advantage and setup cleanliness. While ROKT delivers superior 13-week relative strength (15.2% vs 8.2% on SPY, 25.9% absolute return vs 18.9%), it sits 24.9% extended above the 50-week moving average compared to ITA's more modest 14.3%—a critical structural difference that depresses ROKT's timing score to 22.0 versus ITA's 70.0. ITA's neutral structure setup, though less visually impressive than ROKT's vertical extension, actually provides a firmer foundation when stochastic RSI is falling/neutral at 0.75 rather than overbought-rolling-over. The risk/reward profiles echo this: ITA's 45.4/100 edges ROKT's 46.0, but ITA's volume is neutral (0.83x) while ROKT shows accumulation/confirmation—in a mixed macro regime, steady accumulation without distribution pressure signals more committed buyers than explosive confirmation alone. XAR's 24.1% SPY relative strength is subordinate to its catastrophic timing score (22/100) when stretched 24.9% from the 50-week.
Defense & Aerospace receives 5% allocation as tier-2, ranked 3rd among the 10 categories. The category score of 53.5 masks a straightforward portfolio logic: this sector carries no strong macro tailwind in the Transition/Mixed regime, where neither credit stress nor real-asset scarcity drives positioning, yet ITA's neutral structure and proximity to the 50-week moving average (5.7% vs ROKT's 24.9%) make it a safer hold than purely momentum-chased names. The allocator maintains the position because defense durability remains a reasonable hedge in a mixed macro environment, but 5% (the same tier given to Technology and Agriculture) signals this is not a conviction holding. If credit stress reversed sharply or if risk appetite showed fatigue, this allocation would likely shrink; conversely, a breakdown in the broader market that pushed buyers toward defensive positions would upgrade this to a top-2 sleeve. For now, ITA's lower timing risk and steady 18.9% 13-week return justify the seat at the table, nothing more.
Utilities & Infrastructure — XLU
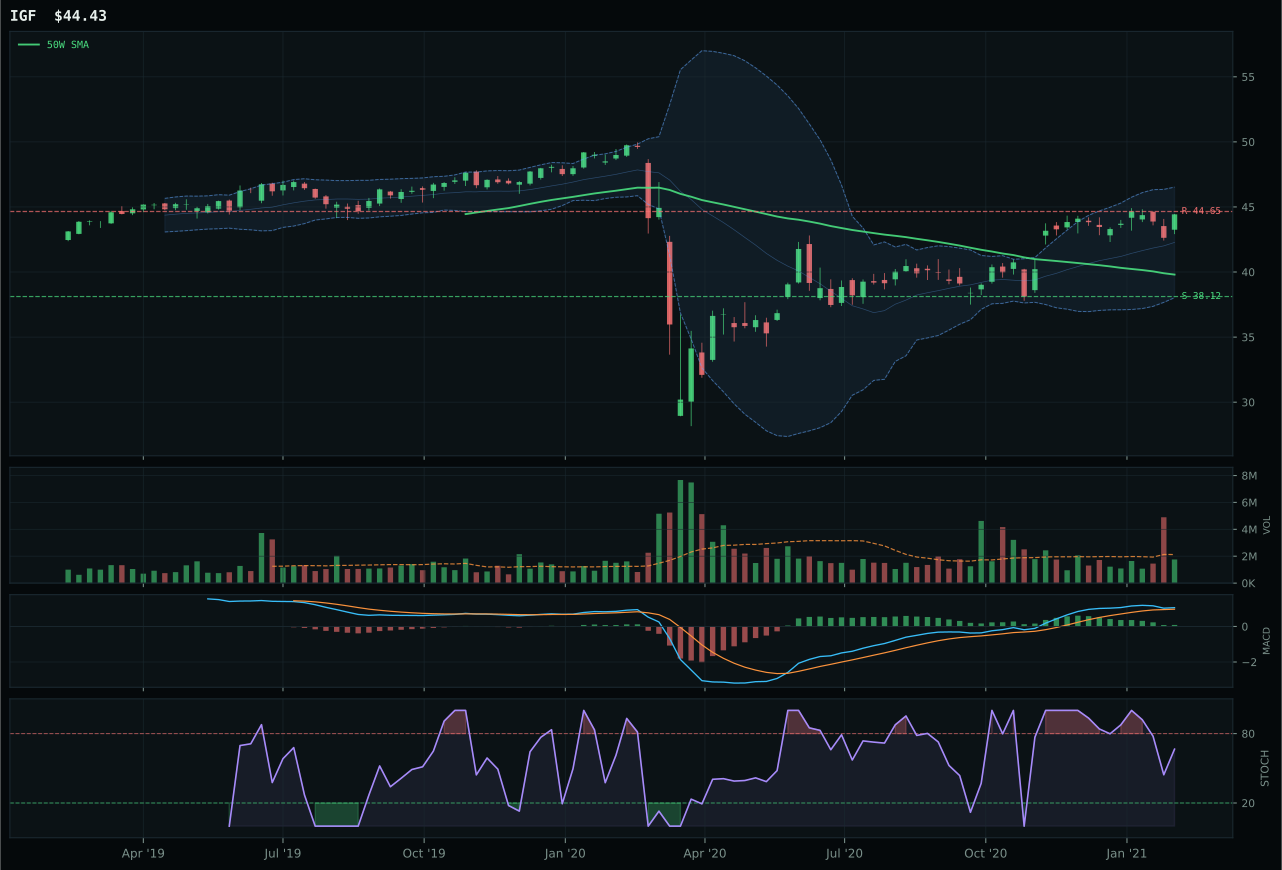
IGF has a neutral structure profile with -0.3% 13-week relative strength versus SPY.
A failed hold above support would weaken the setup.
Actionable but governed by invalidation levels.
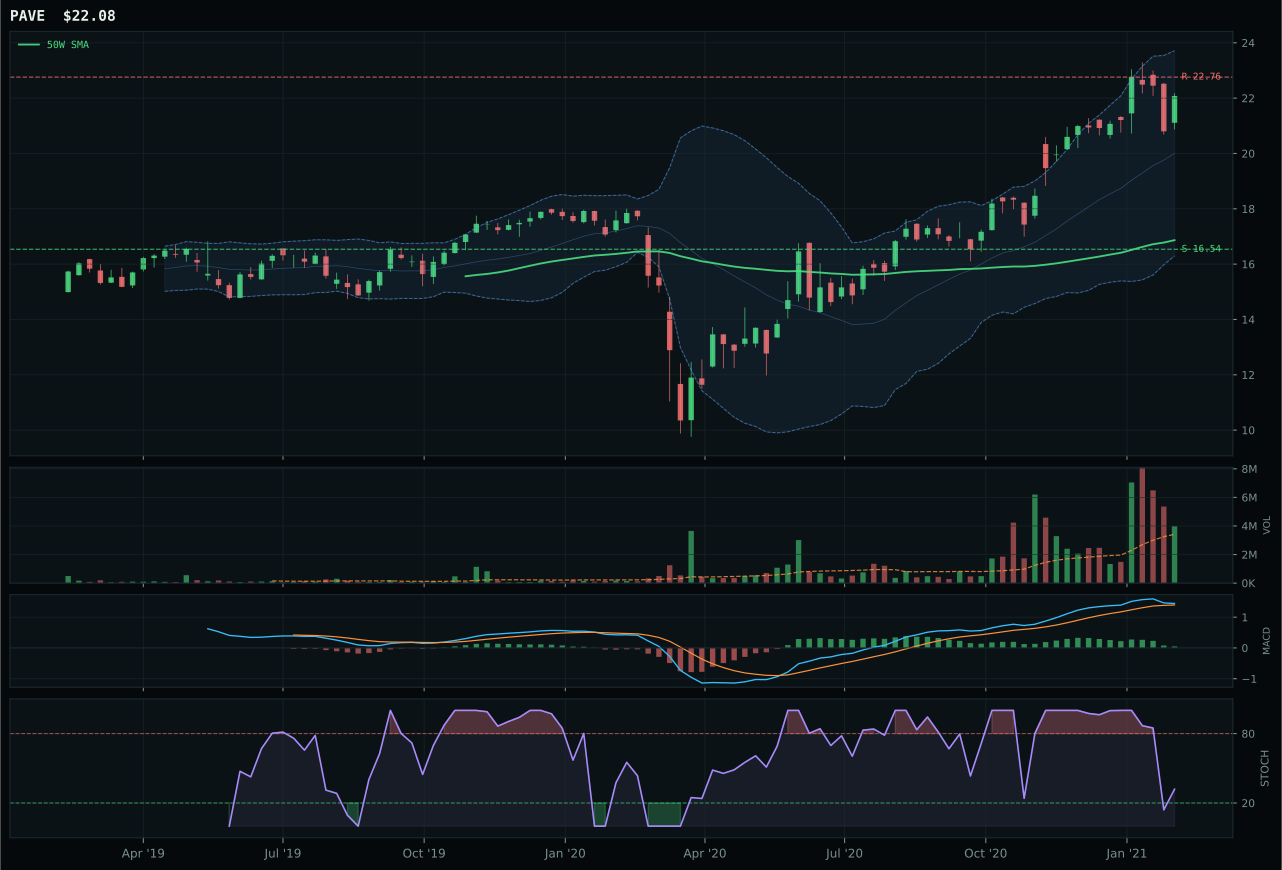
PAVE has a vertical extension profile with 8.8% 13-week relative strength versus SPY.
A failed hold above support would weaken the setup.
Actionable but governed by invalidation levels.
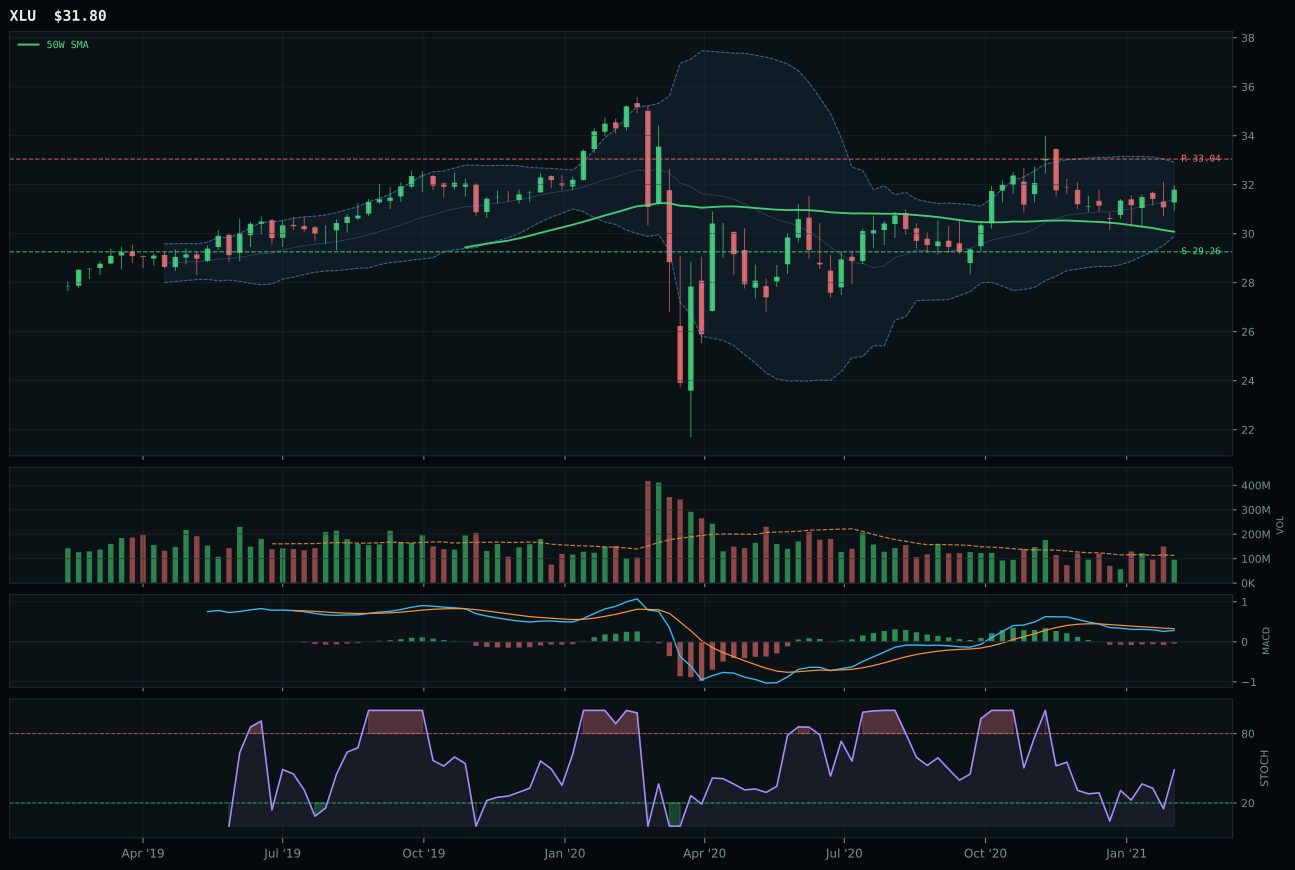
XLU has a neutral structure profile with -11.6% 13-week relative strength versus SPY.
A failed hold above support would weaken the setup.
Actionable but governed by invalidation levels.
XLU wins a category where no name delivers compelling conviction, beating IGF primarily on timing advantage rather than absolute strength. XLU sits just 5.7% above the 50-week moving average with a 83.0/100 timing score fueled by proximity to support and rising mid-zone stochastic RSI (0.49), suggesting incipient mean reversion. IGF, extended 11.6% from the 50-week with falling/neutral stochastic RSI, generates a 70.0/100 timing score that penalizes the extra distance. Both trade at neutral volume; both deliver modest returns (-0.8% vs 10.5% 13-week, a gap explained by IGF's infrastructure infrastructure tilt versus XLU's regulated utility defensiveness). The critical distinction is momentum confirmation: XLU's -11.6% SPY relative strength and -11.3% category-relative strength are genuinely abysmal, yet the allocator chose this name because PAVE's vertical extension setup (19.5% 13-week return, 8.8% SPY relative strength) represents momentum that contradicts the category's defensive posture. XLU's neutral structure and proximity to support provide a safer entry for defensive capital than PAVE's extended extension. PAVE's 39.0/100 risk/reward versus XLU's 52.9/100 reveals that the momentum play offers zero margin of safety.
Utilities & Infrastructure receives 5% allocation as tier-2, ranked 6th among the 10 categories. The category score of 52.7 reflects a macro regime actively hostile to defensive income positioning: inflation pressure (-6 weighting), risk appetite positive context, and the absence of credit-stress urgency all penalize XLU's regulated utility thesis. At -11.6% SPY relative strength, XLU is underperforming even as equities rise, a clear signal that defensive rotation is not the market's primary narrative. The 5% allocation is a tactical hedge rather than a conviction position—large enough to provide portfolio stability if risk appetite reverses sharply, small enough to reflect the allocator's bias toward real-asset and cyclical themes. The opportunity cost is meaningful: PAVE's infrastructure position (scored 61.3 in the reasoned order) is being starved of capital because its vertical extension conflicts with the category's defensive mandate. If credit stress indicators sharply deteriorated or if commodity breadth rolled over dramatically, this allocation could expand to 10% as investors rotate toward safe-haven infrastructure; conversely, a continued surge in energy and commodity breadth would likely eliminate this position entirely in favor of COPX or XOP overweighting. XLU is currently a parking lot for defensive capital, not a conviction holding.
Nuclear Energy — URA
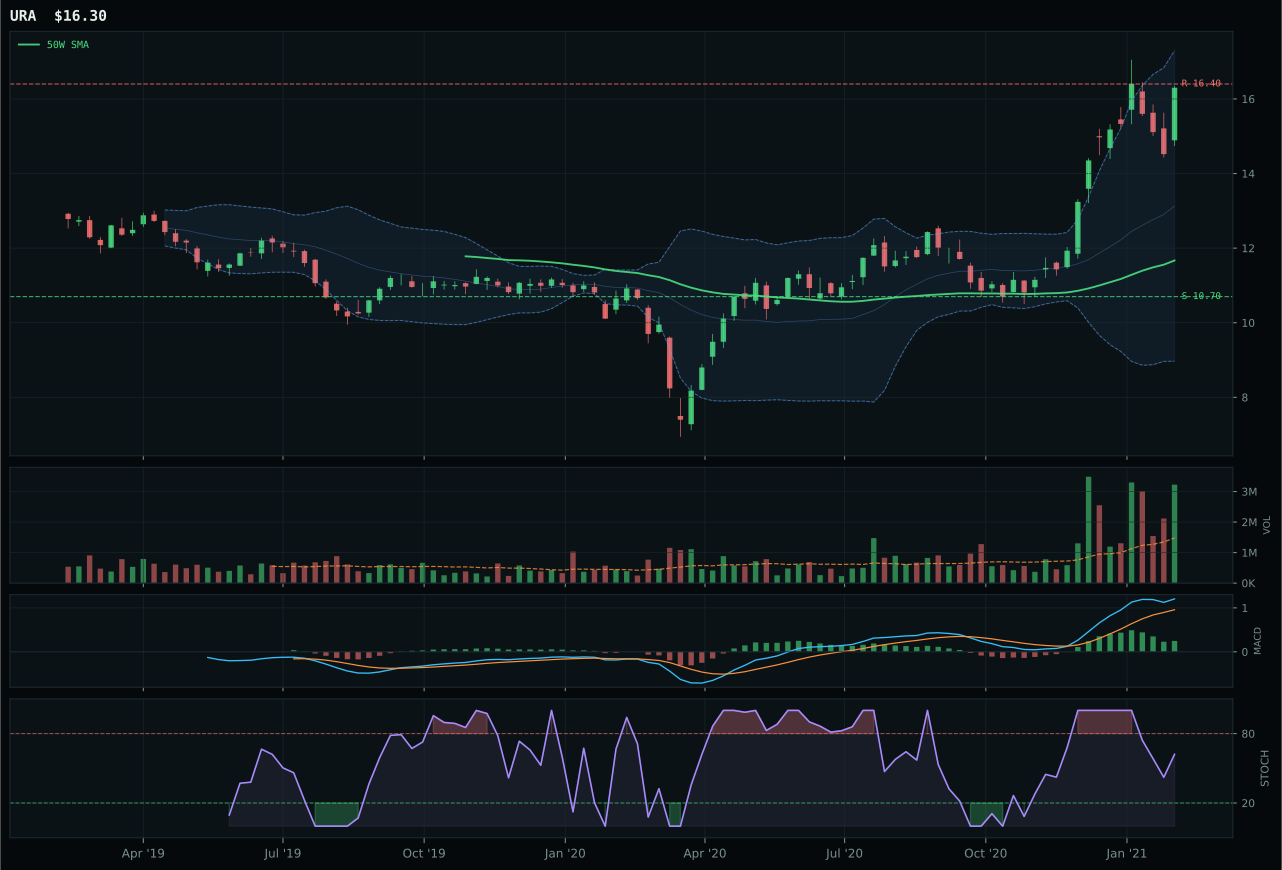
URA has a vertical extension profile with 35.5% 13-week relative strength versus SPY.
A failed hold above support would weaken the setup.
Actionable but governed by invalidation levels.
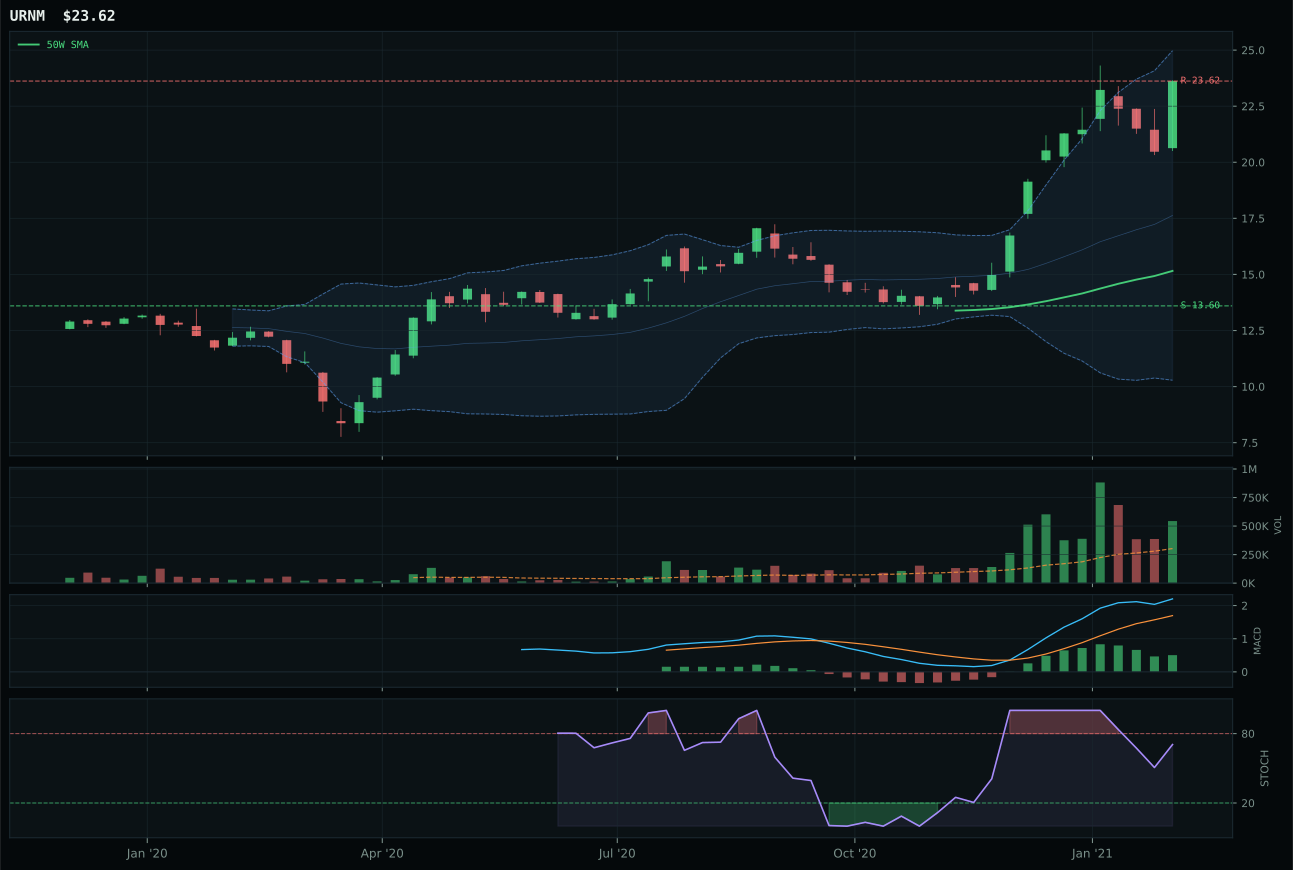
URNM has a vertical extension profile with 58.3% 13-week relative strength versus SPY.
A failed hold above support would weaken the setup.
Tracked, but not top-2 eligible because: .
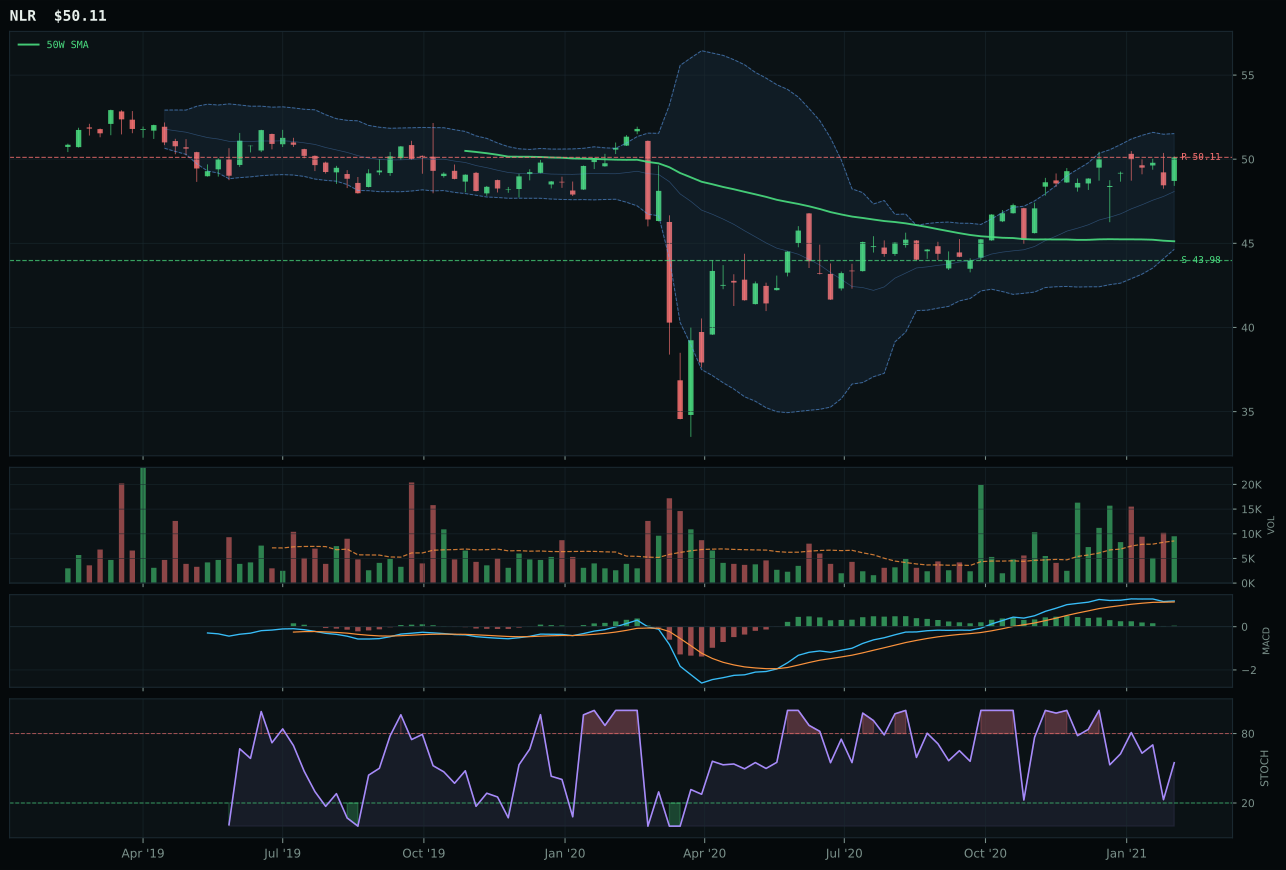
NLR has a neutral structure profile with -4.3% 13-week relative strength versus SPY.
A failed hold above support would weaken the setup.
Tracked, but not top-2 eligible because: .
URA wins the category decisively (46.6 score gap versus URNM) because its technical evidence of 75.9/100 towers over the runners-up while maintaining a cleaner entry setup than URNM's more extended structure. Both URA and URNM deliver perfect momentum scores (100/100) with 46.2% and 69.0% 13-week returns respectively, but URA's 39.7% extension above the 50-week moving average versus URNM's 55.8% is the decisive structural difference. URA's 90.5/100 volume-price confirmation (accumulation/confirmation at 2.18x average) and perfect 100/100 persistence score reflect sustained institutional buying, while URNM's equivalent metrics are weaker despite comparable volume. The setup quality separation is clear: URA sits near the 52W high in Fib extension territory with falling/neutral stochastic RSI, a bullish setup; URNM is further extended with the same momentum structure, creating the timing penalty that explains its 45.0/100 technical evidence score. NLR's 47-point disadvantage (6.4% return, -4.3% SPY relative strength, neutral macro profile) removes it from contention entirely.
Nuclear Energy receives 0% allocation this week, ranked outside the top-8 and excluded entirely from the portfolio despite URA's compelling technical setup. The category score of 46.6 places it 8th or 9th, above only Precious Metals (37.3), because the macro regime does not yet favor nuclear as a standalone energy narrative. While energy scarcity is the dominant theme (+16 weighting), that tailwind is being captured more efficiently by traditional energy (XOP at 10%) and industrial metals (COPX at 10%), which offer more liquid, consensus-driven positioning. Nuclear Energy's 69.0/100 macro fit is respectable (real asset sponsorship +7, energy scarcity +9), but the Transition/Mixed regime lacks the credit-stress catalyst or demand-shock urgency that would trigger portfolio rotation into nuclear as a pure play. URA's 35.5% SPY relative strength and 46.2% 13-week return are real, but they are following-the-leader moves in a broader risk-on environment rather than fundamental re-rating of nuclear's energy supply role. For this allocation to reopen, nuclear would need either a sharp escalation in traditional energy scarcity (forcing demand toward nuclear base-load generation) or a structural shift in macro descriptors (e.g., increasing grid-demand themes). Today, the allocator prefers the higher-conviction energy and commodity plays to the more speculative nuclear beta story.
Precious Metals — SLV
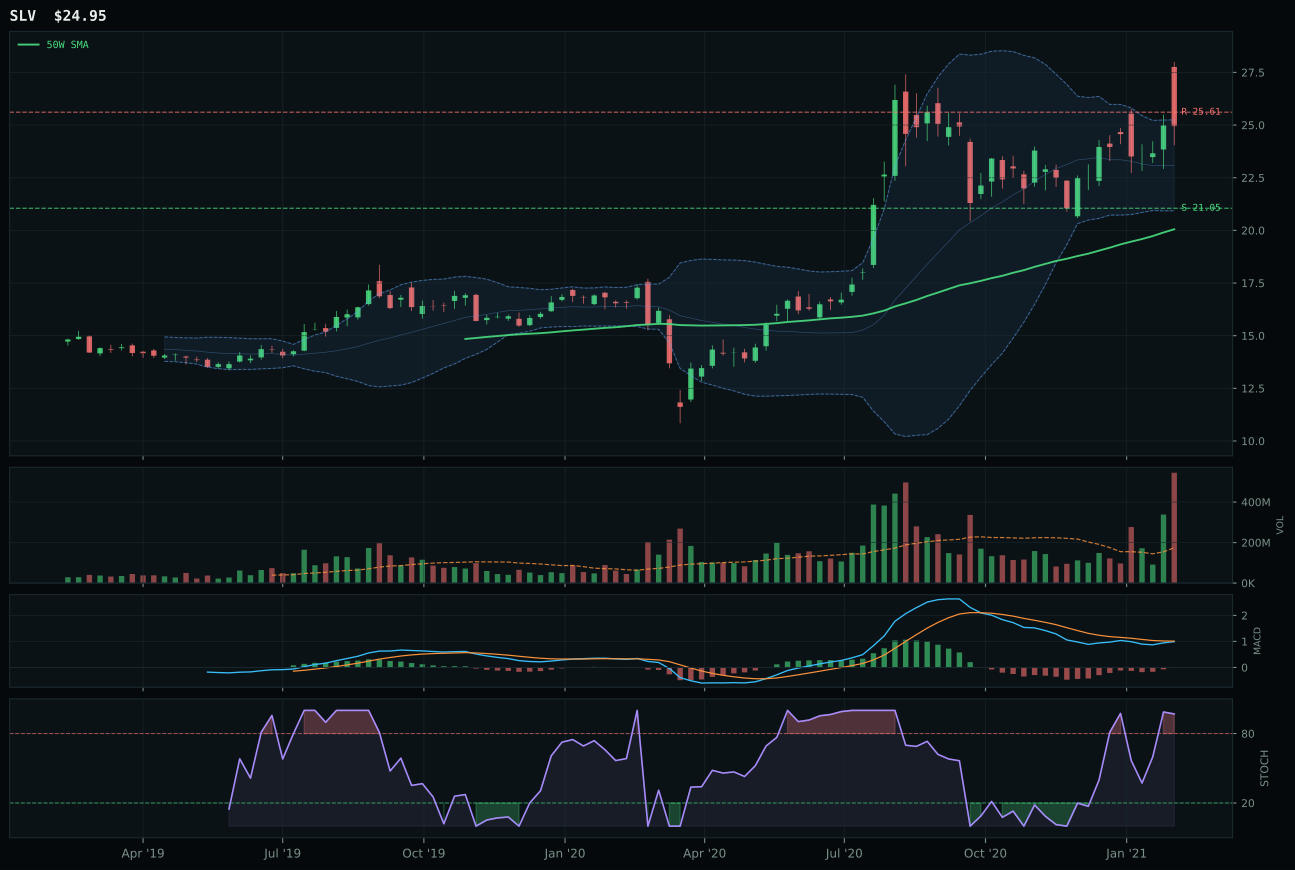
SLV has a vertical extension profile with -5.8% 13-week relative strength versus SPY.
A failed hold above support would weaken the setup.
Actionable but governed by invalidation levels.
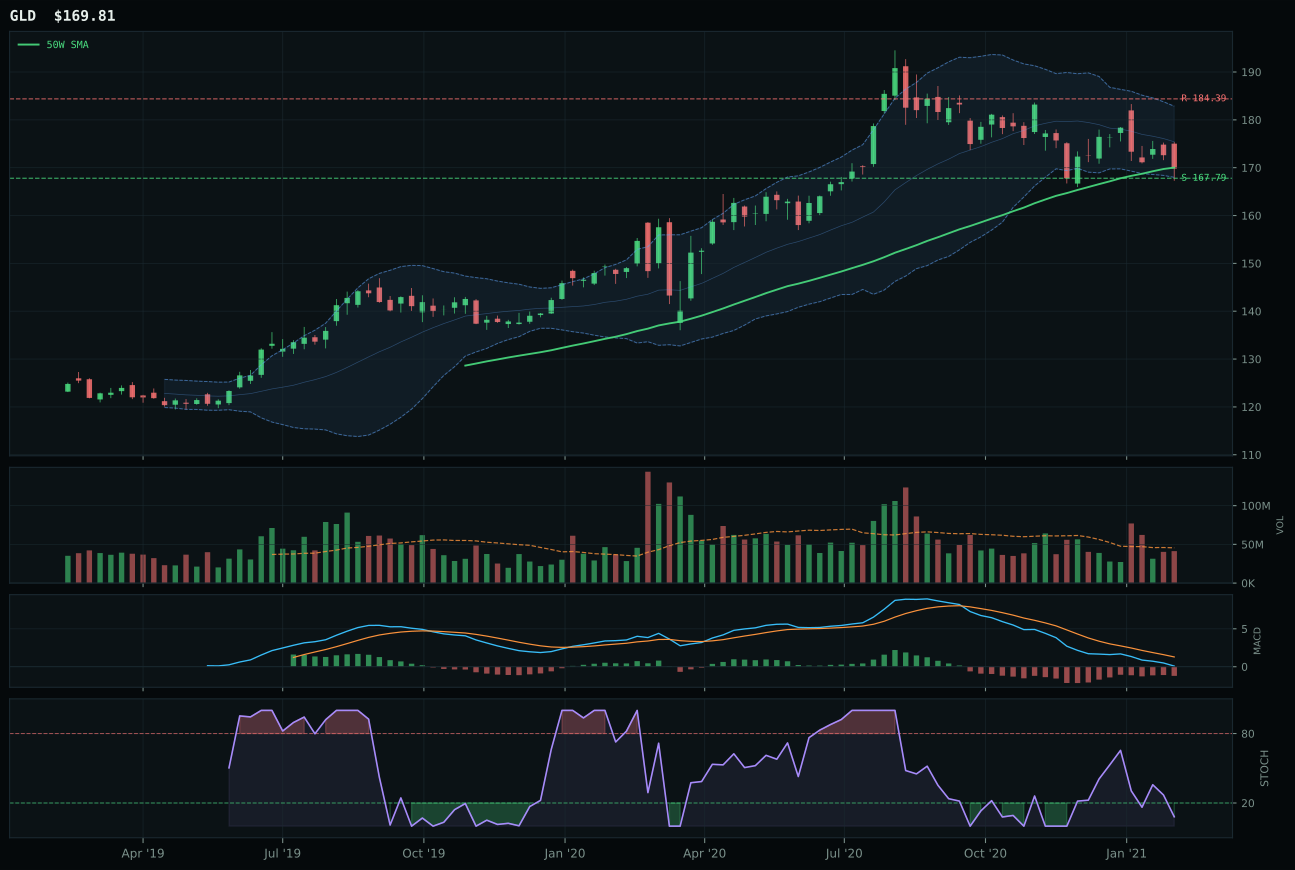
GLD has a pullback into support profile with -18.0% 13-week relative strength versus SPY.
A failed hold above support would weaken the setup.
Actionable but governed by invalidation levels.
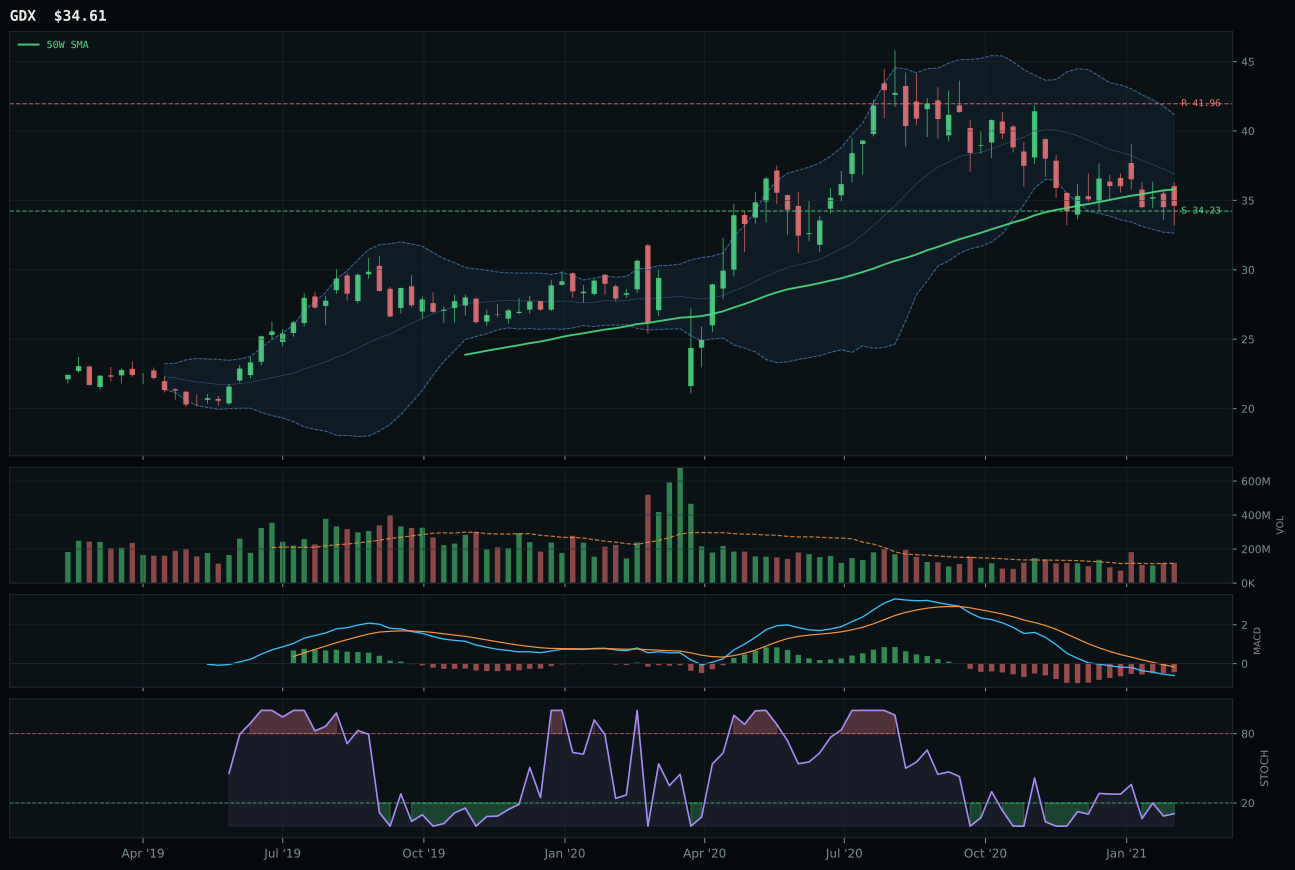
GDX has a pullback into support profile with -27.2% 13-week relative strength versus SPY.
A failed hold above support would weaken the setup.
Actionable but governed by invalidation levels.
SLV wins a weak category by the narrowest margin (0.8 points over GLD), a victory that masks fundamental weakness across the entire complex. SLV's 12.2% category-relative strength versus GLD's 0.0% is the deciding factor, but this advantage comes with a painful cost: 3.12x 20-week volume at distribution pressure. The chart sits 24.4% above the 50-week moving average with stochastic RSI overbought at 0.97 and MACD bearish-but-improving, a combination that screams late-stage accumulation break rather than fresh institutional demand. GLD's oversold condition (-18.0% SPY relative strength, 13-week return of -7.3%) at least offers a pullback-into-support setup (Fib middle retracement) with fresh mean-reversion upside; SLV's distribution pressure volume at extension suggests exhaustion. The category-level macro fit is only 46.0/100, where risk appetite positive actively penalizes precious metals (-4 points), reflecting that any rally in equities or commodities starves safe-haven demand. This is not a category win worth celebrating; it is a situation where the least bad option (SLV's hybrid monetary and industrial beta) barely beats the category anchor.
Precious Metals receives 0% allocation this week, ranked 9th or 10th among the 10 categories and excluded entirely from the portfolio. The category score of 37.3 reflects a macro regime hostile to the precious metals narrative: in a Transition/Mixed environment where risk appetite is positive and energy scarcity dominates real-asset allocation, monetary hedges compress. GLD's oversold condition (-18.0% SPY relative strength) would normally signal a mean-reversion candidate, but the macro backdrop offers no catalyst for fresh demand—credit stress is not acute enough to drive safe-haven buying, and inflation pressure alone does not justify holding non-yielding gold when agricultural and industrial metals are simultaneously scarce. SLV's distribution-pressure volume at extension (3.12x average) further confirms that any buyers stepping in here are likely late-cycle speculators rather than macro hedge funds. For this allocation slot to reopen, precious metals would need either a sharp credit-stress escalation, a collapse in equity risk appetite, or a breakdown in commodity breadth that repositions investors toward monetary insurance rather than industrial input hoarding. None of those conditions are present today.