
2021-01-29
Informational purposes only. The content in this report, including allocations, analysis, and commentary, is provided solely for informational and educational purposes. It does not constitute financial advice, investment advice, trading advice, or any other type of advice. Past performance does not guarantee future results. Always conduct your own research and consult a qualified financial professional before making investment decisions.
Some tracked tickers were excluded due to missing live weekly price data: SGOV: Historical cache SGOV has only 35 usable weekly bars
Weekly Allocation
| Ticker | Category | Weight | Role |
|---|---|---|---|
| FSOL | 50% | Overlay | |
| FCG | Traditional Energy | 10% | Top-2 (10%) |
| IEMG | Emerging Markets | 10% | Top-2 (10%) |
| COPX | Industrial Metals | 5% | Tier-2 (5%) |
| MOO | Agriculture & Livestock | 5% | Tier-2 (5%) |
| XAR | Defense & Aerospace | 5% | Tier-2 (5%) |
| XLK | Technology | 5% | Tier-2 (5%) |
| SMH | AI | 5% | Tier-2 (5%) |
| XLU | Utilities & Infrastructure | 5% | Tier-2 (5%) |
Trade Instructions — Monday Open
Sell the tranche from 2021-01-01 (completing its 4-week hold). Buy the new tranche. Instructions show net portfolio changes — same-asset positions cancel, weight changes show the delta.
| Action | Ticker | Instruction |
|---|---|---|
| SELL | REMX | Sell 33% of REMX position (reduce 7.50% → 5.00%) |
| SELL | XLE | Sell 50% of XLE position (reduce 5.00% → 2.50%) |
| SELL | WEAT | Sell 50% of WEAT position (reduce 2.50% → 1.25%) |
| SELL | INDA | Sell 50% of INDA position (reduce 2.50% → 1.25%) |
| SELL | CIBR | Sell 50% of CIBR position (reduce 2.50% → 1.25%) |
| SELL | BOTZ | Sell entire BOTZ position (1.25% of portfolio) |
| SELL | ITA | Sell 50% of ITA position (reduce 2.50% → 1.25%) |
| BUY | MOO | Buy MOO — 11.11% of freed cash (adds 1.25% to portfolio) |
| BUY | SMH | Buy SMH — 11.11% of freed cash (adds 1.25% to portfolio) |
| BUY | XAR | Buy XAR — 11.11% of freed cash (adds 1.25% to portfolio) |
| BUY | XLK | Buy XLK — 11.11% of freed cash (adds 1.25% to portfolio) |
| BUY | COPX | Buy COPX — 11.11% of freed cash (adds 1.25% to portfolio) |
| BUY | IEMG | Buy IEMG — 22.22% of freed cash (adds 2.50% to portfolio) |
| BUY | FCG | Buy FCG — 22.22% of freed cash (adds 2.50% to portfolio) |
Current Portfolio After Trade
Combined holdings across all 4 active tranches. Each tranche is 25% of the portfolio.
| Ticker | % of Portfolio | Weight Bar |
|---|---|---|
| FSOL | 37.50% | |
| FBTC | 12.50% | |
| REMX | 5.00% | |
| SMH | 5.00% | |
| XOP | 5.00% | |
| MOO | 3.75% | |
| XAR | 3.75% | |
| XLK | 3.75% | |
| COPX | 3.75% | |
| IEMG | 3.75% | |
| XLE | 2.50% | |
| URA | 2.50% | |
| FCG | 2.50% | |
| WEAT | 1.25% | |
| INDA | 1.25% | |
| CIBR | 1.25% | |
| ITA | 1.25% | |
| PAVE | 1.25% | |
| GLD | 1.25% | |
| XLU | 1.25% |
Macro Regime — Transition / Mixed
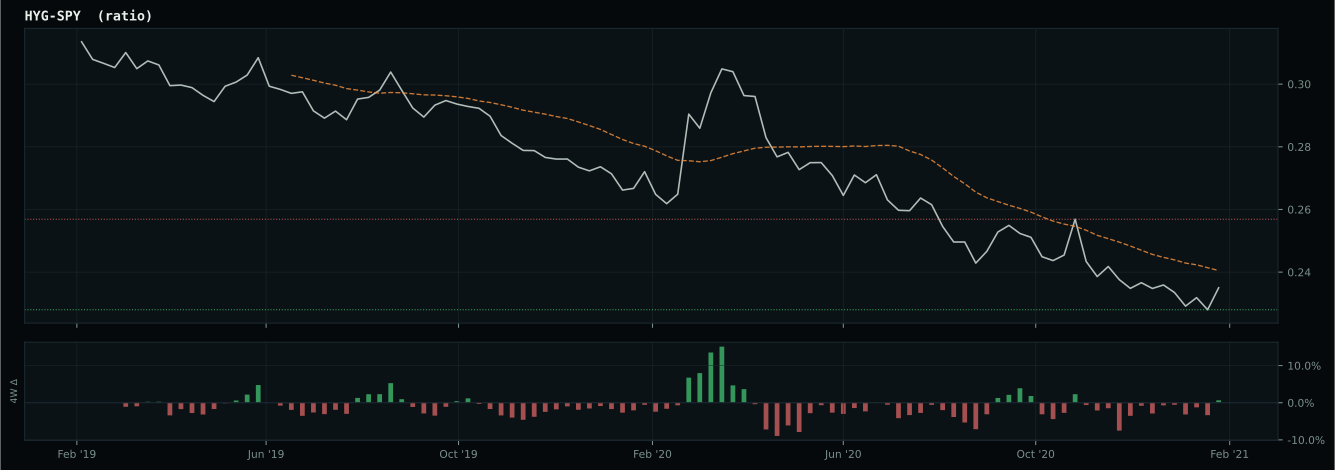
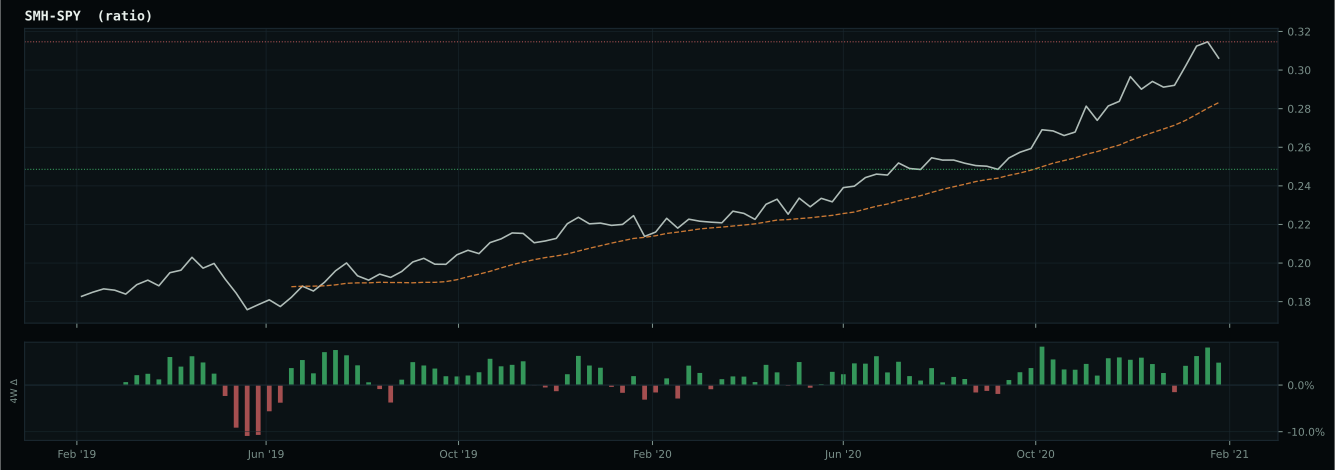
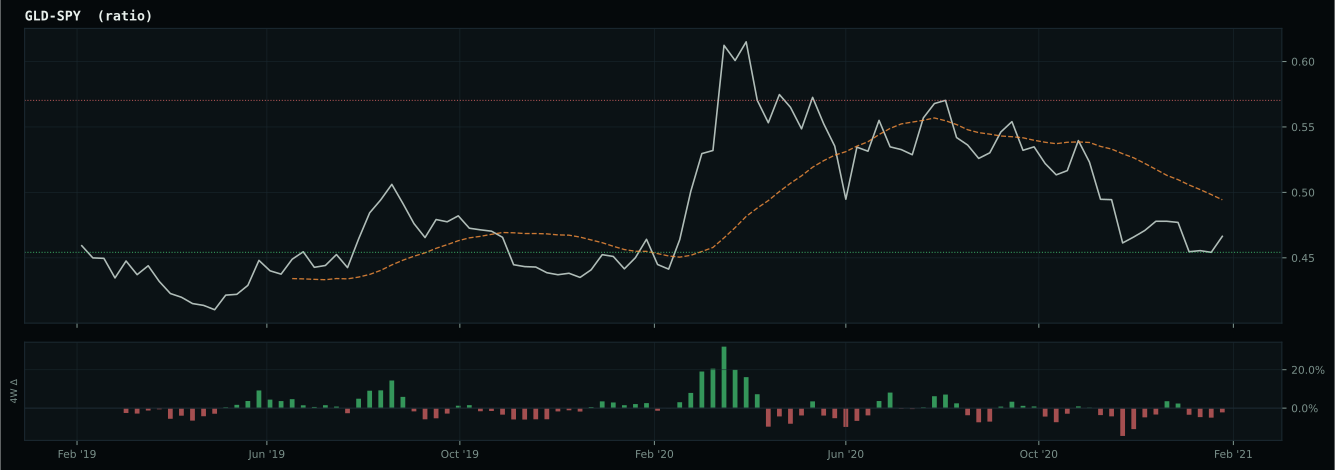
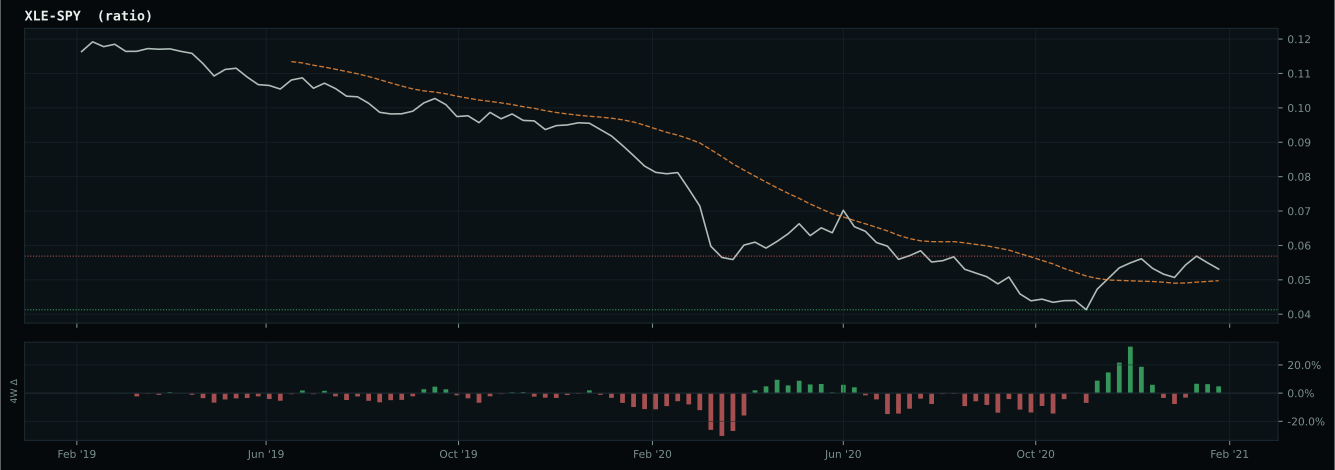
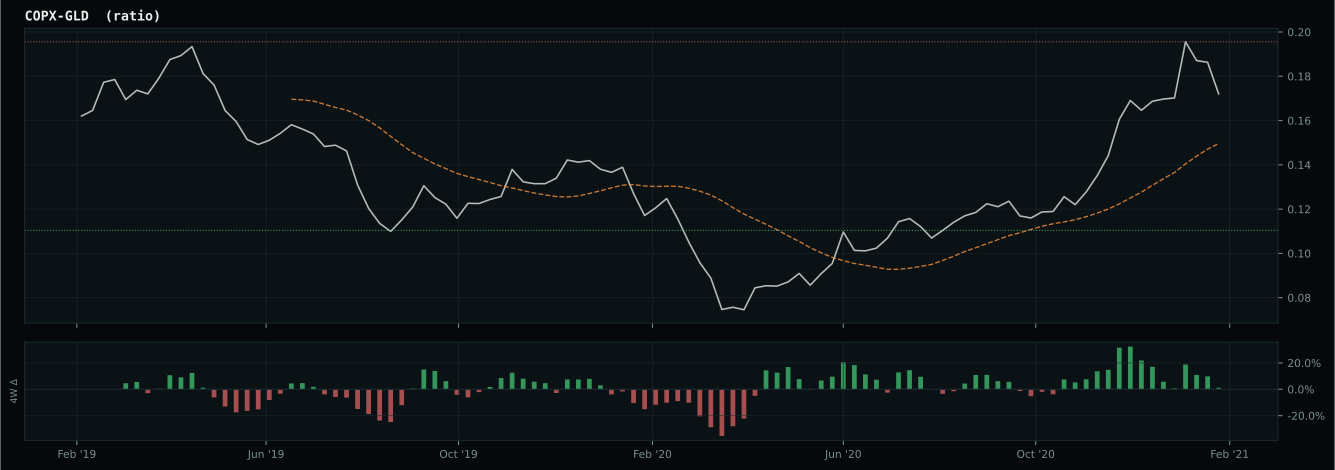
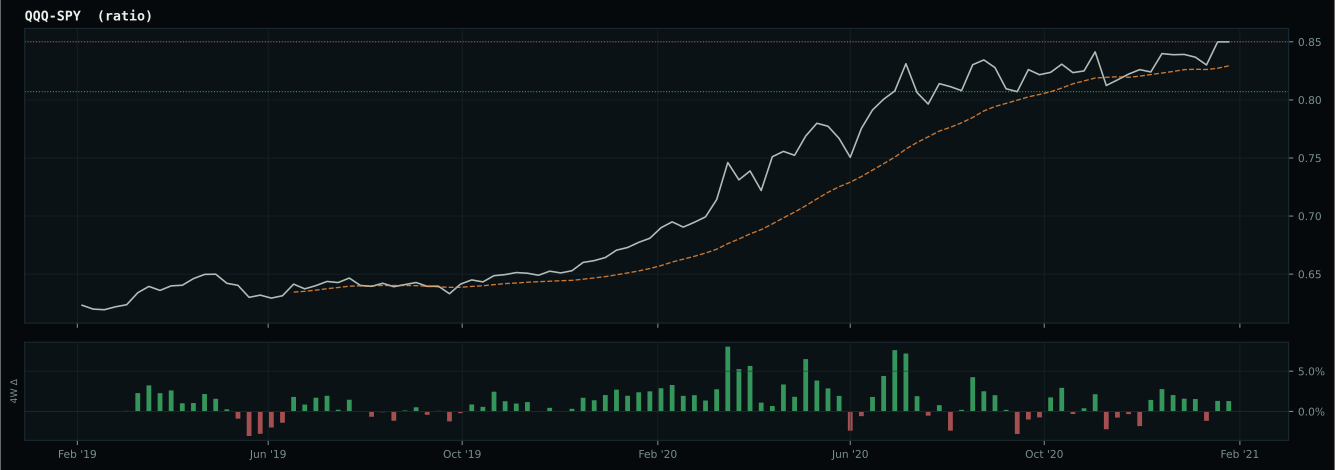
Macro Evidence Charts
Market-implied signals behind the macro regime scores. Each ratio compares two assets; the direction and slope of the ratio is what the macro engine reads.
Crypto Regime — AltSeason
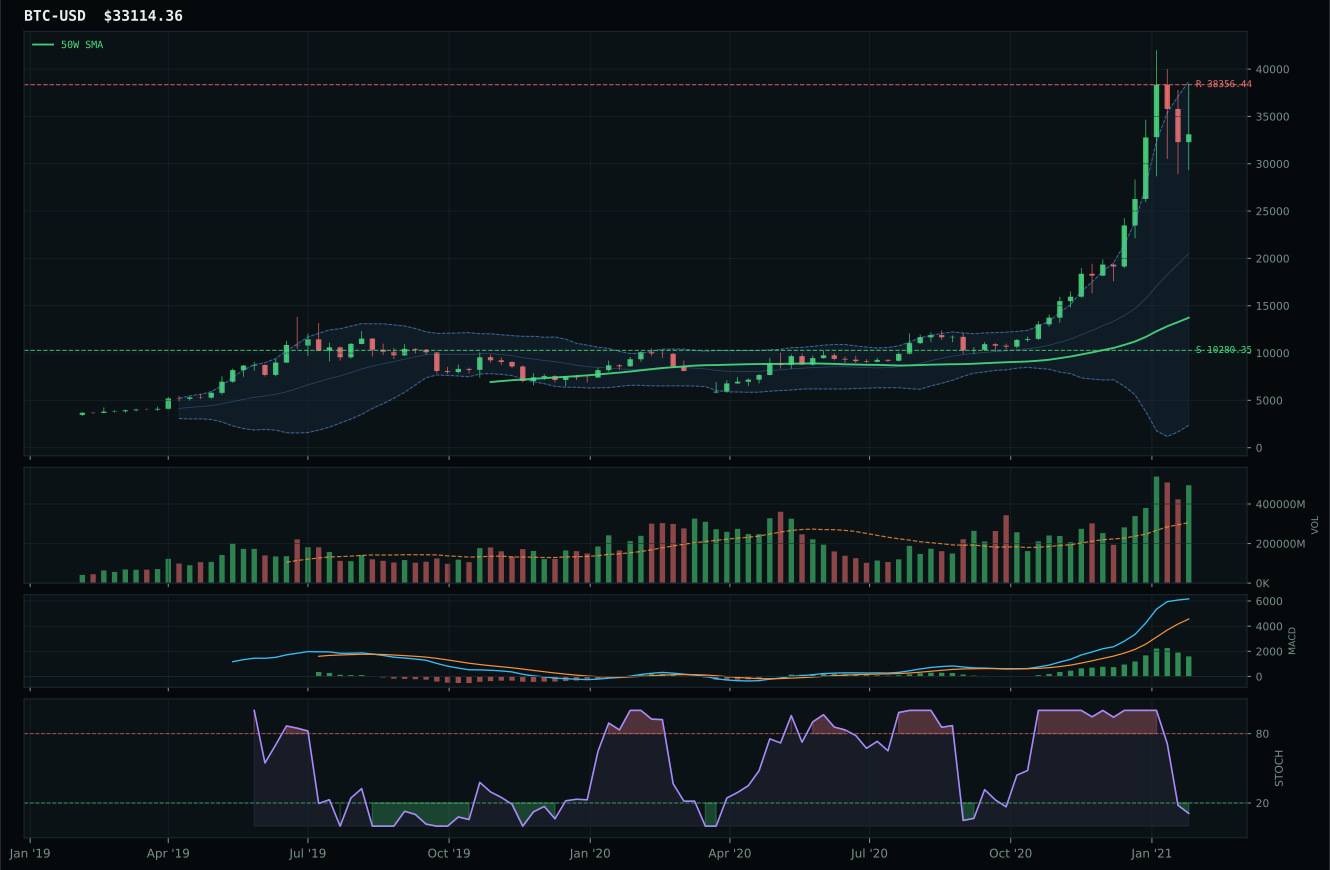
post-touch structure is too wide to count as a range; max/min close ratio is 7.11
TrendBTC confirmed: 2 consecutive closes above rising/flat 50W SMA
all available AltSeason conditions pass; missing optional confirmations skipped

Category Rankings
| Rank | Category | Winner | Score | Alloc | 4W Ret | Peers (4W) |
|---|---|---|---|---|---|---|
| 1 | Traditional Energy | FCG | 81.6 | 20% | +25.45% | XOP +25.0% · XLE +24.2% |
| 2 | Emerging Markets | IEMG | 66.7 | 20% | +1.21% | ILF -3.0% · INDA +2.7% |
| 3 | Industrial Metals | COPX | 58.7 | 10% | +22.49% | REMX +15.5% · PICK +13.0% |
| 4 | Agriculture & Livestock | MOO | 55.9 | 10% | +8.12% | WEAT +1.6% · VEGI +10.9% |
| 5 | Defense & Aerospace | XAR | 53.7 | 10% | +7.16% | ROKT +5.2% · ITA +8.4% |
| 6 | Technology | XLK | 50.8 | 10% | +1.88% | CIBR -3.2% · IGV +2.0% |
| 7 | AI | SMH | 49.4 | 10% | +6.32% | BOTZ -1.4% · AIQ +3.7% |
| 8 | Utilities & Infrastructure | XLU | 40.8 | 10% | -5.52% | PAVE +10.1% · IGF +0.6% |
| 9 | Nuclear Energy | URA | 39.8 | 0% | +21.83% | URNM +36.0% · NLR -1.0% |
| 10 | Precious Metals | SLV | 38.4 | 0% | -10.09% | GLD -6.9% · GDX -12.5% |
Traditional Energy — FCG
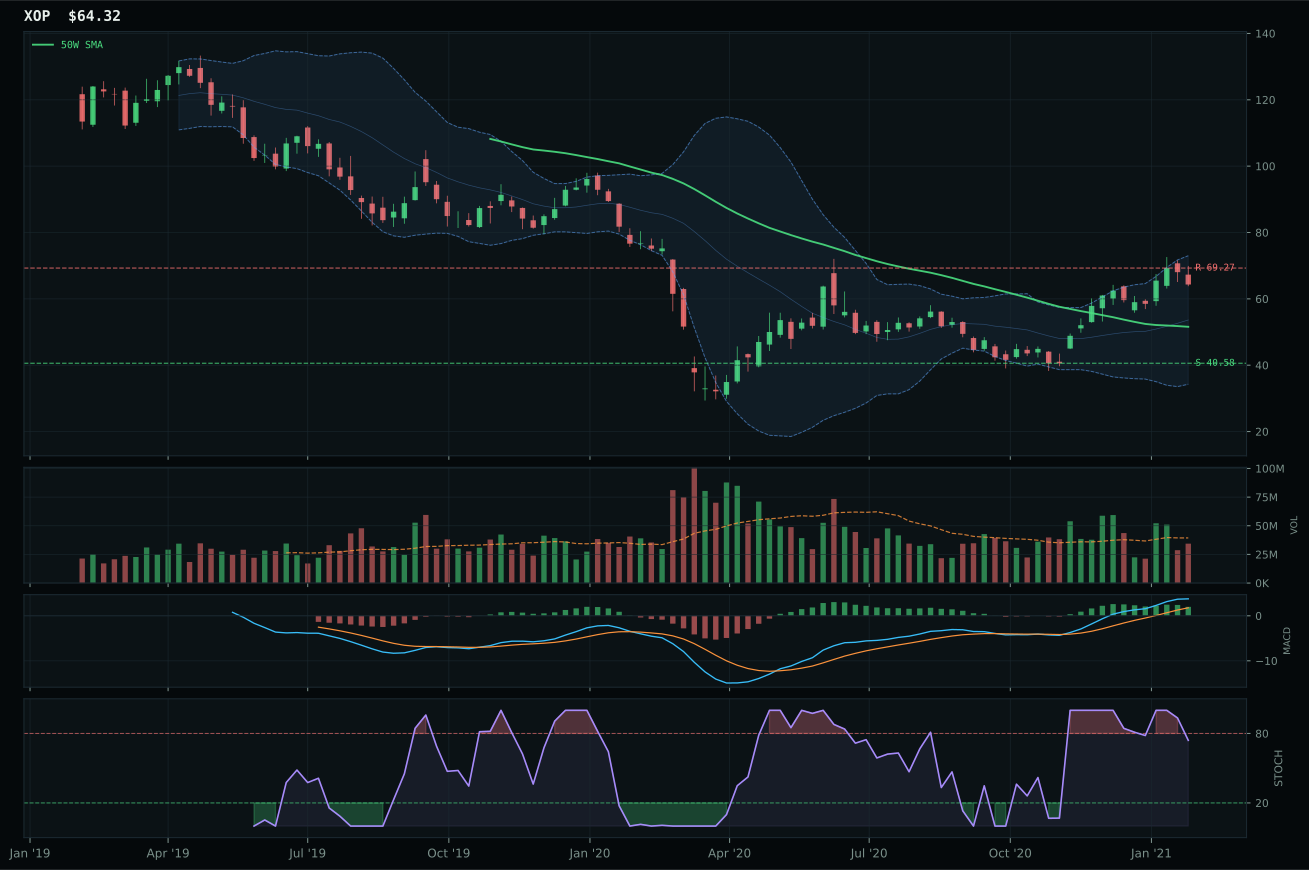
XOP has a vertical extension profile with 45.2% 13-week relative strength versus SPY.
A failed hold above support would weaken the setup.
Actionable but governed by invalidation levels.
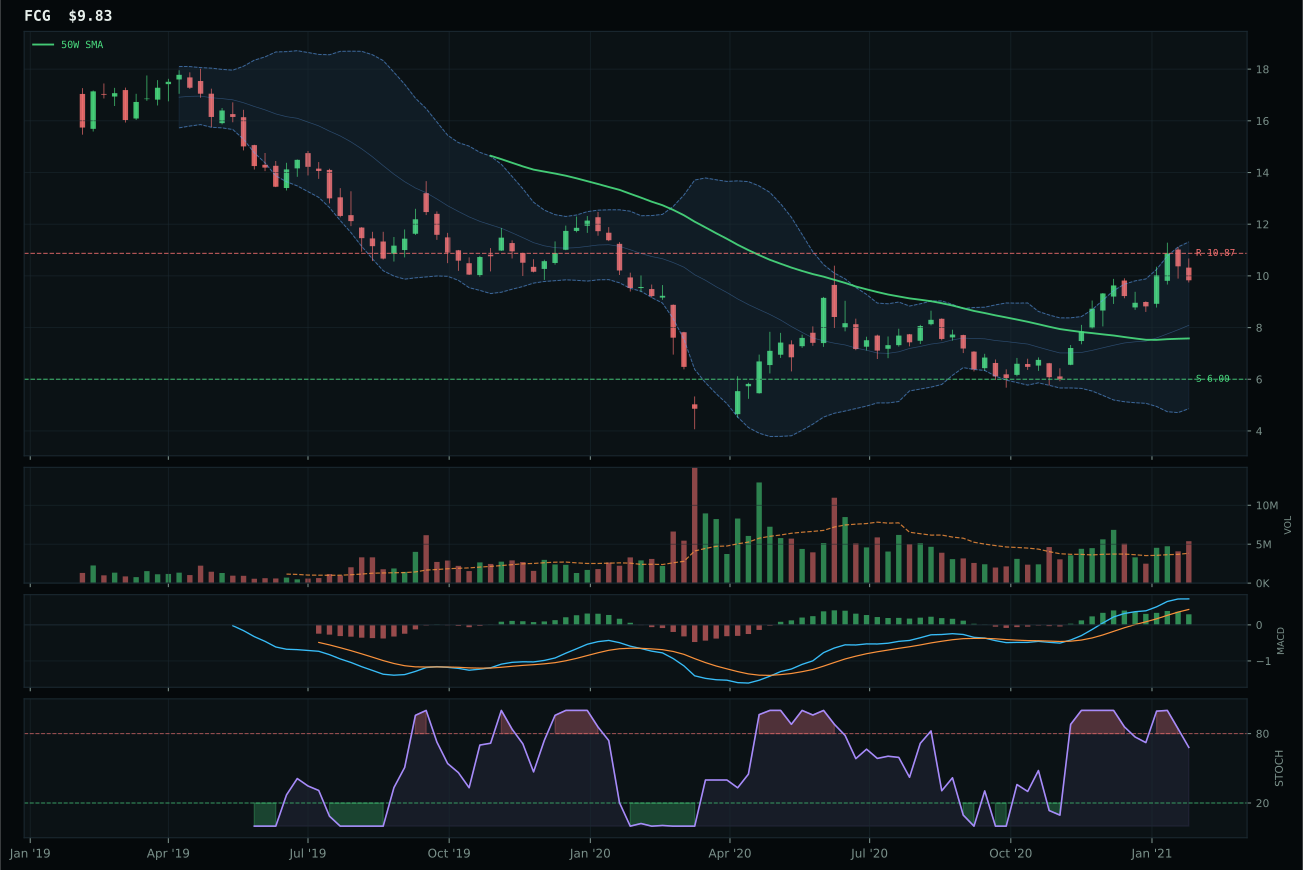
FCG has a vertical extension profile with 48.3% 13-week relative strength versus SPY.
A failed hold above support would weaken the setup.
Actionable but governed by invalidation levels.
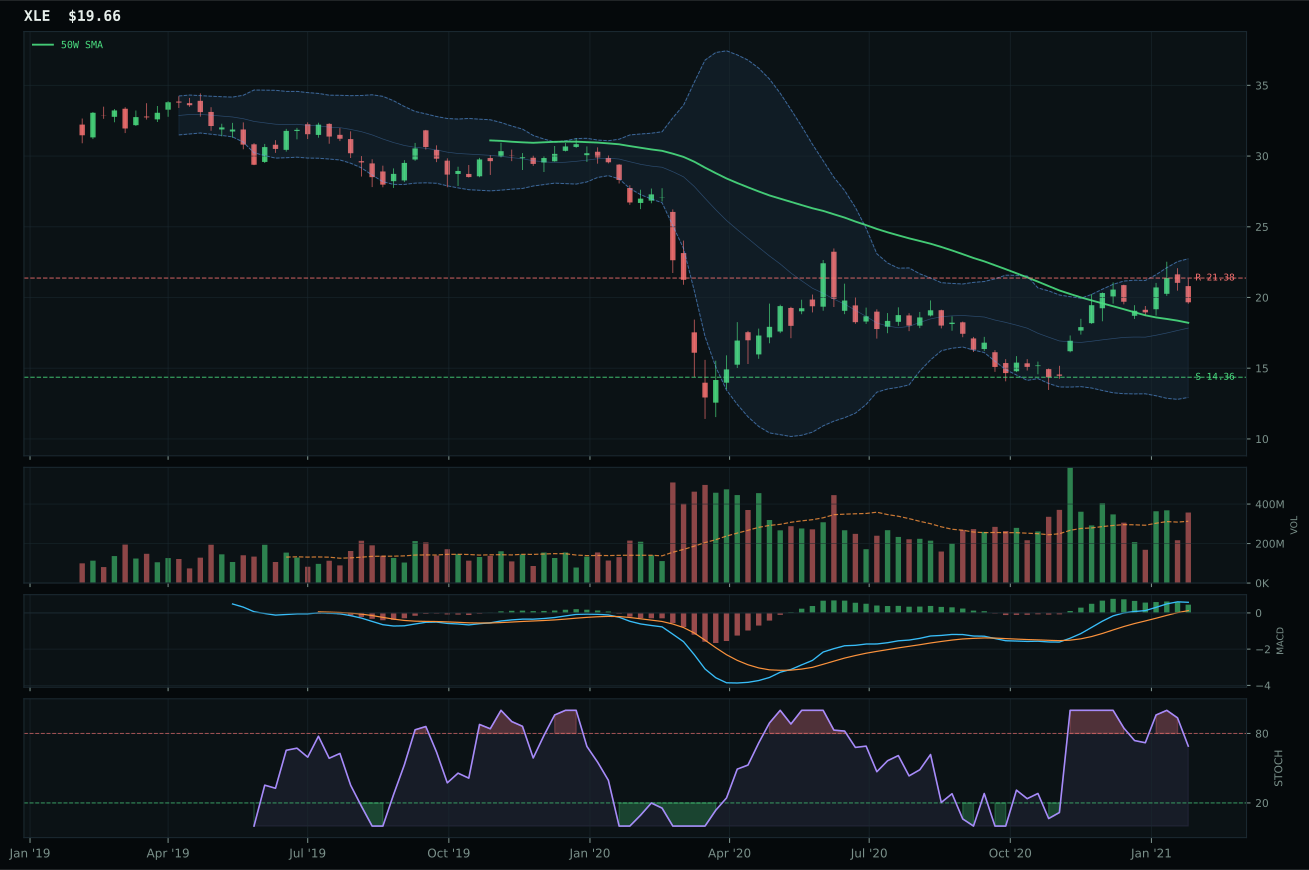
XLE has a neutral structure profile with 23.6% 13-week relative strength versus SPY.
A failed hold above support would weaken the setup.
Actionable but governed by invalidation levels.
FCG claimed Traditional Energy category leadership by posting the highest category-relative strength at 3.2% and delivering real volume-price confirmation at 1.40x participation against a field showing neutral or distribution patterns. The 61.7% 13-week return and 48.3% SPY-relative strength told a story of capital decisively rotating into energy, with FCG capturing that flow more consistently than XOP or XLE. XOP's technical evidence at 67.7 slightly exceeded FCG's 67.3, yet XOP's volume was neutral—a critical deficiency suggesting the 45.2% SPY-relative return was being driven by price alone, not accumulation. FCG's setup showed the same vertical extension pattern as XOP, with identical MACD and stochastic profiles, yet FCG's above-average participation changed the conviction signal materially. Structure cleanliness favored FCG at 70.0 versus XOP's 67.7, and persistence at 100.0 versus XOP's implicit score confirmed that natural gas positioning was being sustained rather than churned. Price sat 32.0% above the 50W with support at 6.00 and resistance at 10.87—a wide support zone that allowed room for pullback without invalidating the longer-term setup. The score gap of 3.3 points was clear enough to justify the selection despite FCG sitting below the 200W moving average, a structural warning that MACD bullish-but-flattening cannot ignore.
Traditional Energy earned 10% allocation as a top-2 overweight, the portfolio's highest conviction macro call of the week. The final category score of 81.6 ranks it second overall, supported by exceptional category macro fit of 85.0—energy scarcity, inflation pressure, supply shortage, and real asset sponsorship all converging on a single thesis. FCG's 100.0 momentum confirmation and 75.8 volume-price confirmation provide technical validation, yet the real driver is the macro regime: Transition / Mixed with risk appetite positive is creating a rare bifurcated opportunity where both cyclicals and commodities are winning simultaneously. FCG's 13W return of 61.7% and SPY-relative strength of 48.3% translate to real capital flows that institutional allocators cannot ignore. The timing score of 48.0 and risk-reward of 32.7 are modest—FCG sits extended and has limited room to resistance—yet the persistence at 100.0 signals that this is not a final-wave blow-off but rather the foundation of a sustained energy reallocation. Energy maintains this top-2 slot as long as energy scarcity remains active as a macro descriptor and risk appetite continues to favor commodity cycles; a pivot to defensive mode or deflationary signals would immediately demote it. For now, it represents the portfolio's most conviction-backed macro exposure.
Emerging Markets — IEMG
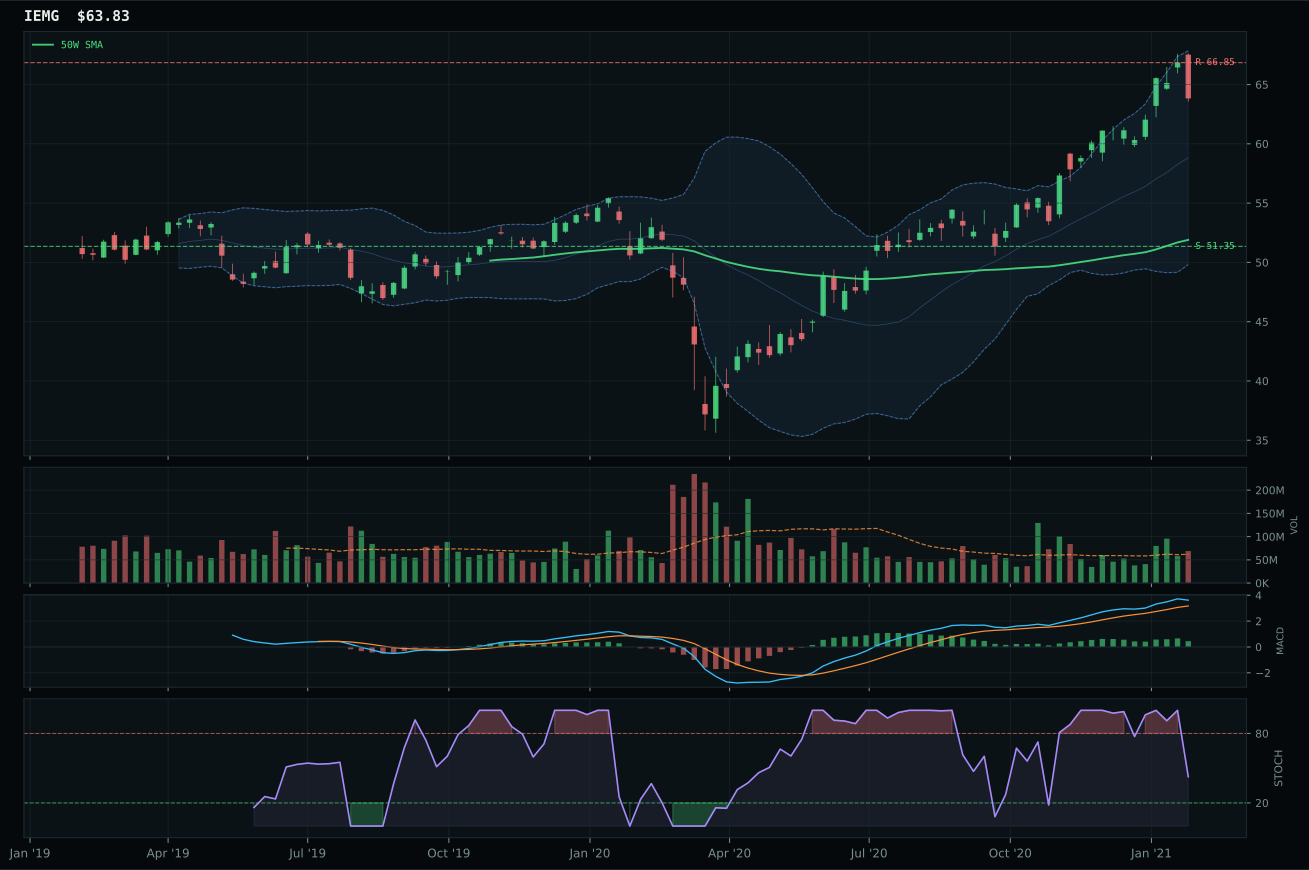
IEMG has a vertical extension profile with 6.0% 13-week relative strength versus SPY.
A failed hold above support would weaken the setup.
Actionable but governed by invalidation levels.
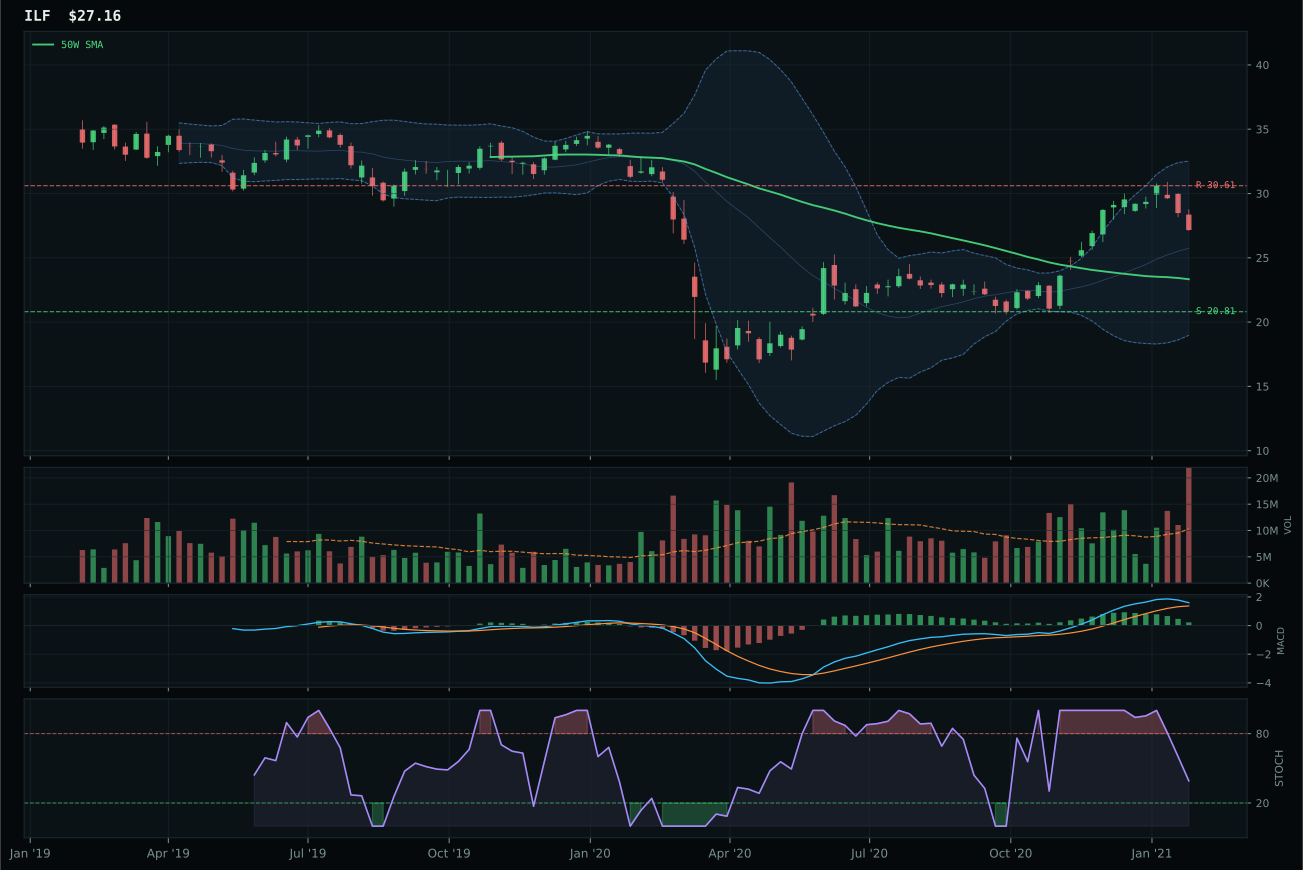
ILF has a vertical extension profile with 15.7% 13-week relative strength versus SPY.
A failed hold above support would weaken the setup.
Actionable but governed by invalidation levels.
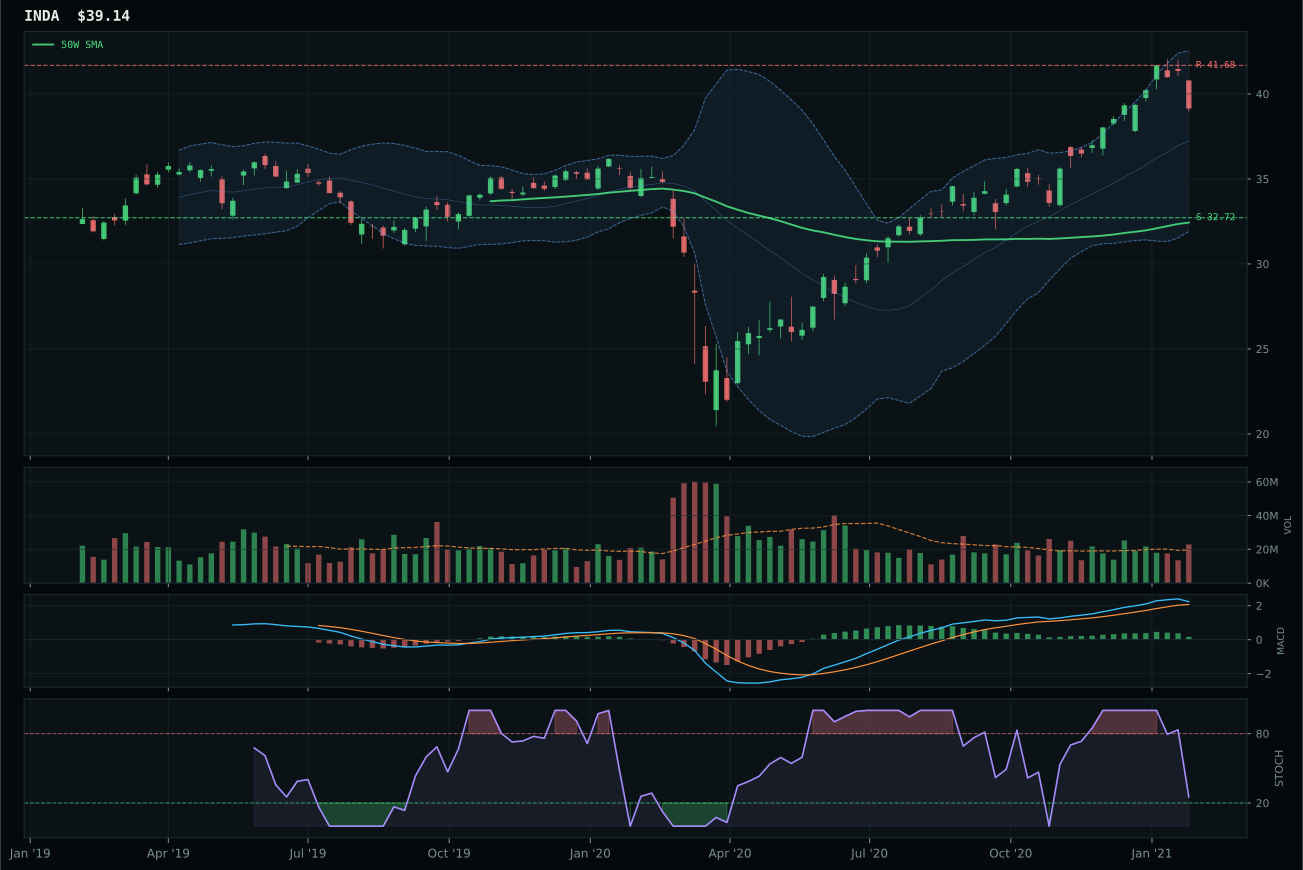
INDA has a vertical extension profile with 3.2% 13-week relative strength versus SPY.
A failed hold above support would weaken the setup.
Actionable but governed by invalidation levels.
IEMG captured Emerging Markets by posting the strongest technical evidence at 86.0 and delivering the cleanest setup across trend, structure, and confirmation metrics. ILF led the deterministic reasoning layer at 45.0 versus IEMG's implicit lower ranking, yet IEMG's category-relative strength of 0.0% was paired with superior MACD confirmation—bullish and improving rather than bullish but flattening—signaling that broad emerging-market beta (IEMG's thesis) was being accumulated more actively than Latin America commodity exposure (ILF). IEMG's 19.4% 13W return, 6.0% SPY-relative strength, and 98.9 momentum confirmation conveyed institutional confidence in the broad EM narrative rather than specialized commodity tailwinds. Structure cleanliness favored IEMG at 66.7 versus ILF's implicit lower score, with IEMG showing compression of 82.3 and a tight support zone at 51.35—metrics suggesting the range was being built with conviction. Persistence at 70.5 versus ILF's distribution pressure volume pattern indicated IEMG's buyers were accumulating for the medium term, not trading the bounce. IEMG's timing score of 53.0 exceeded ILF's 48.0, rooted in MACD improving rather than flattening and support structure more relevant to current price action. The score gap of 23.7 points was decisive, reflecting EM liquidity support and risk appetite positive both favoring the broader mandate over commodity-cyclical specialization.
Emerging Markets earned 10% allocation as a top-2 overweight, the second-highest conviction position in the portfolio and a direct expression of the EM liquidity support macro signal now active. The final category score of 66.7 ranks it second or third overall, supported by category macro fit of 62.0 and IEMG's technical evidence at 86.0—among the highest in the ten-category framework. The macro narrative is powerful: EM liquidity support is active with a +14 signal, risk appetite positive is active, and credit stress is marked at -10, creating an asymmetric payoff for broad emerging-market exposure. IEMG's setup validates that narrative: trend at 100.0 from price above both 50W and 200W with a positive 0.4% 50W slope, structure at 79.8 showing clean compression, and timing at 53.0 reflecting improving MACD rather than stalling momentum. The 23.0% extension above the 50W is material, yet 19.4% 13W returns and above-average participation at 1.11x volume show that late-money is accumulating rather than capitulating. IEMG holds this top-2 slot as long as EM liquidity support remains active and risk appetite positive continues; a reversal to credit stress primacy or a deleveraging event would immediately demote it. For now, it represents the portfolio's second core conviction—a diversified bet that emerging-market capital flows are shifting structurally toward higher real returns in developing economies.
Industrial Metals — COPX
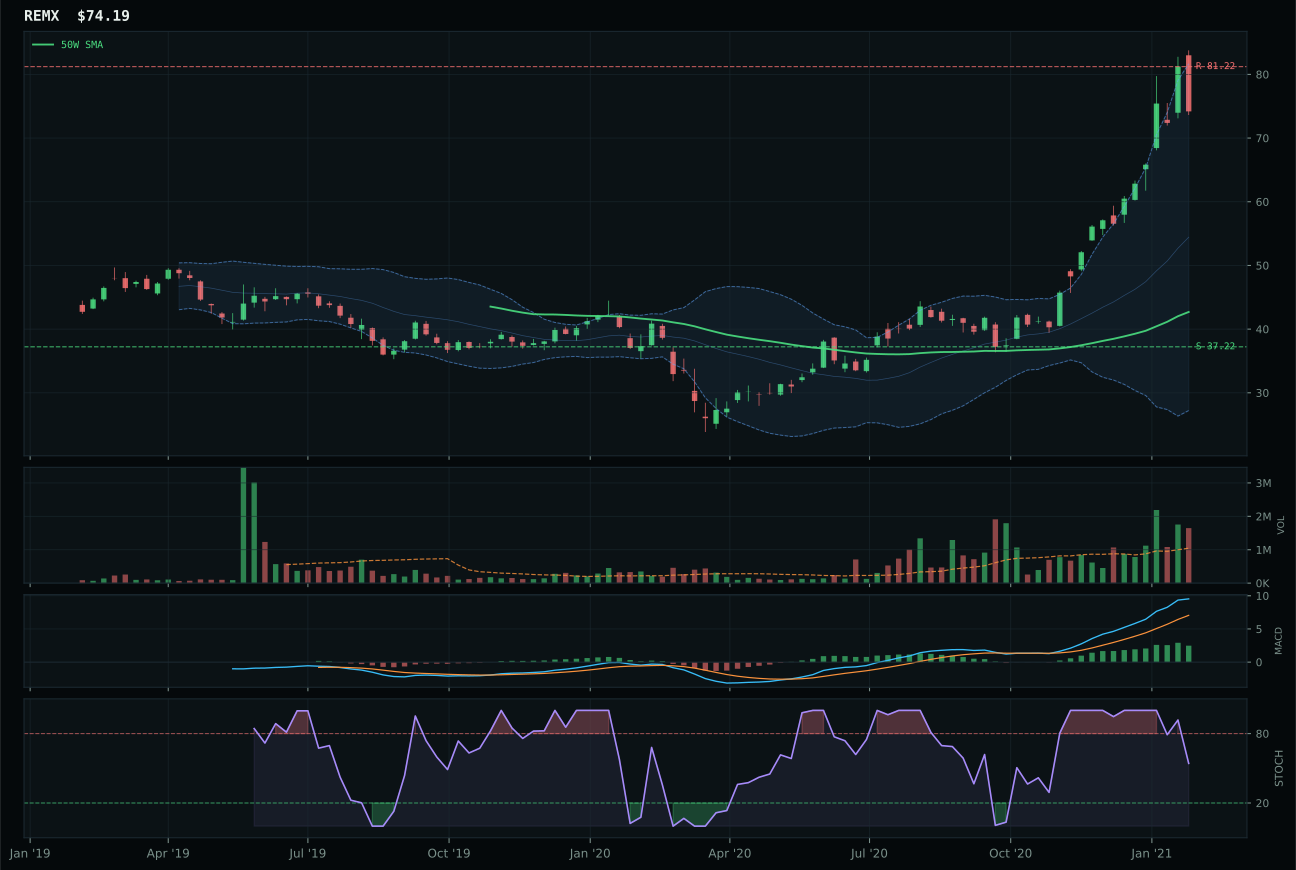
REMX has a vertical extension profile with 70.8% 13-week relative strength versus SPY.
A failed hold above support would weaken the setup.
Actionable but governed by invalidation levels.
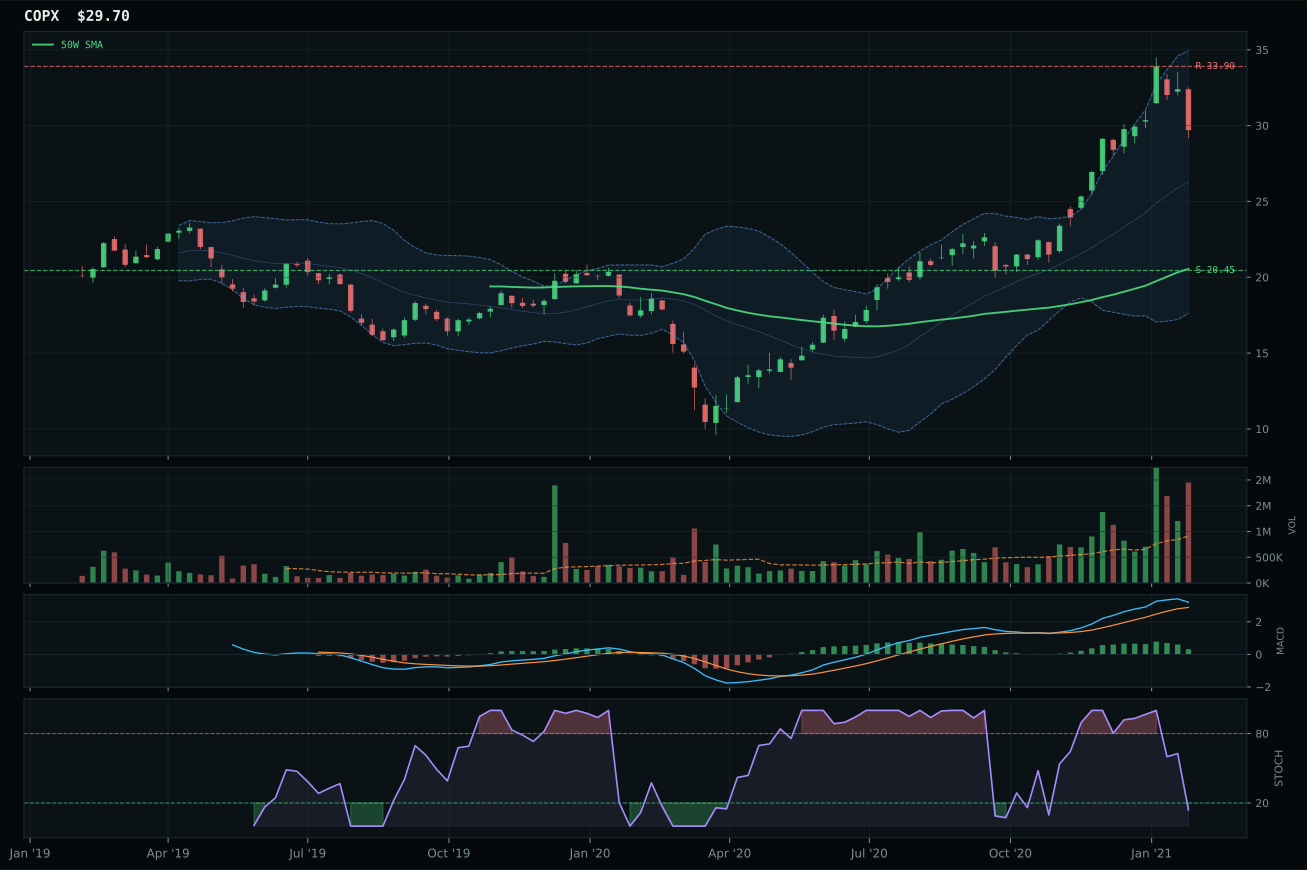
COPX has a vertical extension profile with 24.8% 13-week relative strength versus SPY.
A failed hold above support would weaken the setup.
Actionable but governed by invalidation levels.
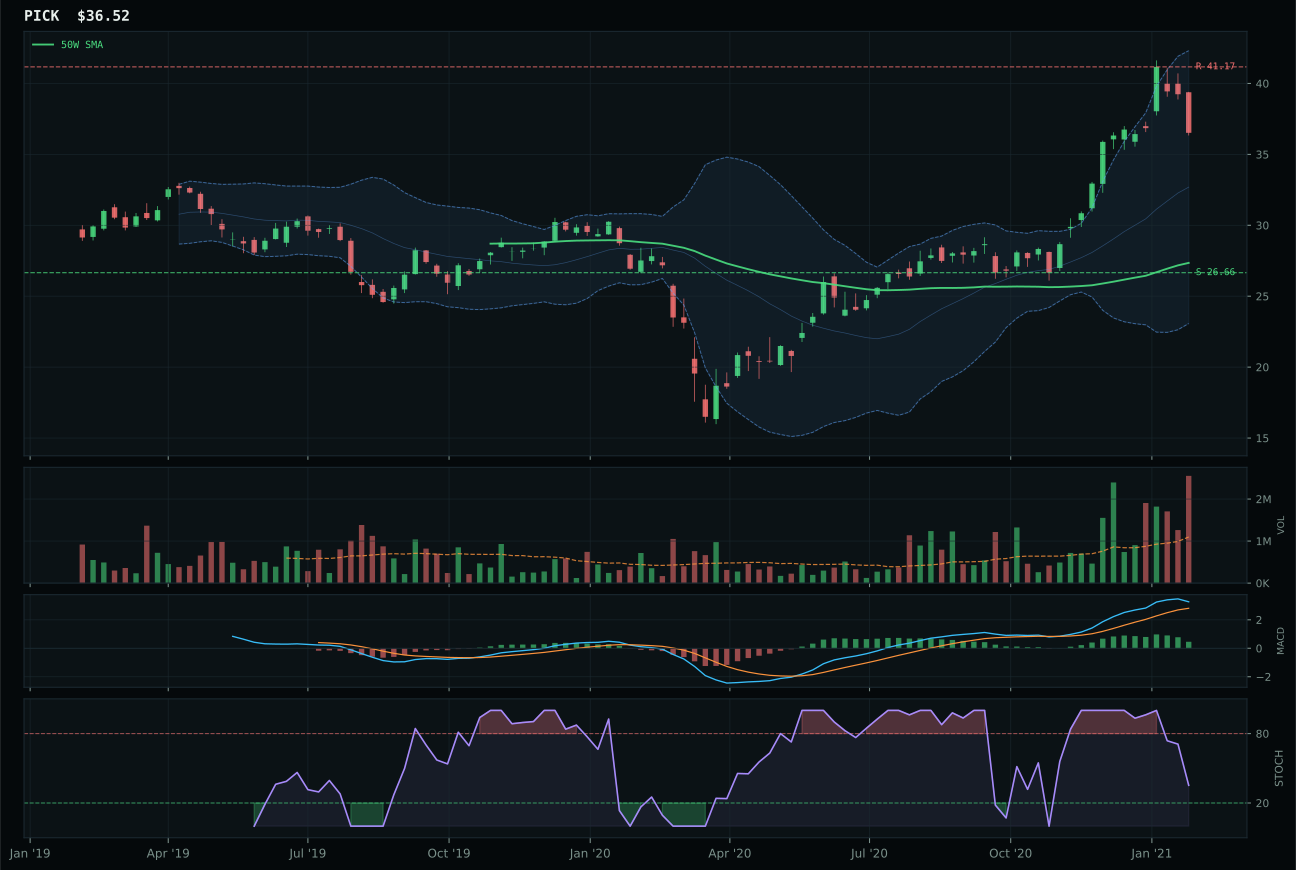
PICK has a vertical extension profile with 23.7% 13-week relative strength versus SPY.
A failed hold above support would weaken the setup.
Actionable but governed by invalidation levels.
COPX won Industrial Metals in a photo finish against REMX by maintaining better risk-reward geometry and momentum structure despite sitting less extended from its 50W. The 44.5% extension above the 50W is severe, yet COPX's risk-reward at 41.9 edged REMX's 38.6 because the support zone at 20.45 was closer relative to resistance at 33.90—tighter risk-reward math that matters when both are in distribution pressure volume patterns. REMX's story is seductive: 70.8% SPY-relative strength and 84.1% 13W return that dwarfs COPX's 24.8% and 38.1%, yet that outperformance came with a 73.8% extension above the 50W, placing it in a far more precarious technical position. COPX's 100.0 trend and 100.0 momentum confirmation equal REMX's on the surface, but COPX's MACD bullish but flattening versus REMX's bullish and improving suggests copper scarcity is maturing while rare earth enthusiasm is still accelerating. Volume profiles matched at distribution pressure, yet COPX's structure at 73.8 edged REMX's 73.0, and persistence at 71.2 versus REMX's implicit score favored the tighter technical picture. The category macro fit of 73.0 is extraordinary—metals scarcity, commodity breadth, and real asset sponsorship all firing—but COPX's representativeness within that setup proved more durable.
Industrial Metals received 5% allocation as tier-2, a position that contradicts the category's exceptional macro fit of 73.0—among the highest in the portfolio—yet reflects a critical timing tension. The final category score of 58.7 ranks it third or fourth overall, technically strong enough to merit consideration, yet the technical ETF evidence for the representative sits at only 38.0 out of 100, the weakest expression of a high-conviction macro case. COPX itself has a momentum confirmation of 100.0 and trend of 100.0, yet timing at 48.0 and risk-reward at 41.9 are ordinary, and persistence at 71.2 suggests the move is aging. REMX ranked higher in the reasoning layer at 73.0 versus COPX's 48.0, which means the category is being held at a representativeness mismatch—the macro case is real, but the technical entry point is stale. For industrial metals to climb into top-2, COPX would need to either consolidate and build a tighter range showing accumulation at lower levels, or REMX would need to reset on a pullback that reinstates better risk-reward geometry. Until that mean-reversion occurs, the category is allocated as a macro satellite—acknowledged as backed by scarcity and stimulus, but technically extended and prudently sized at 5% rather than overweighted.
Agriculture & Livestock — MOO
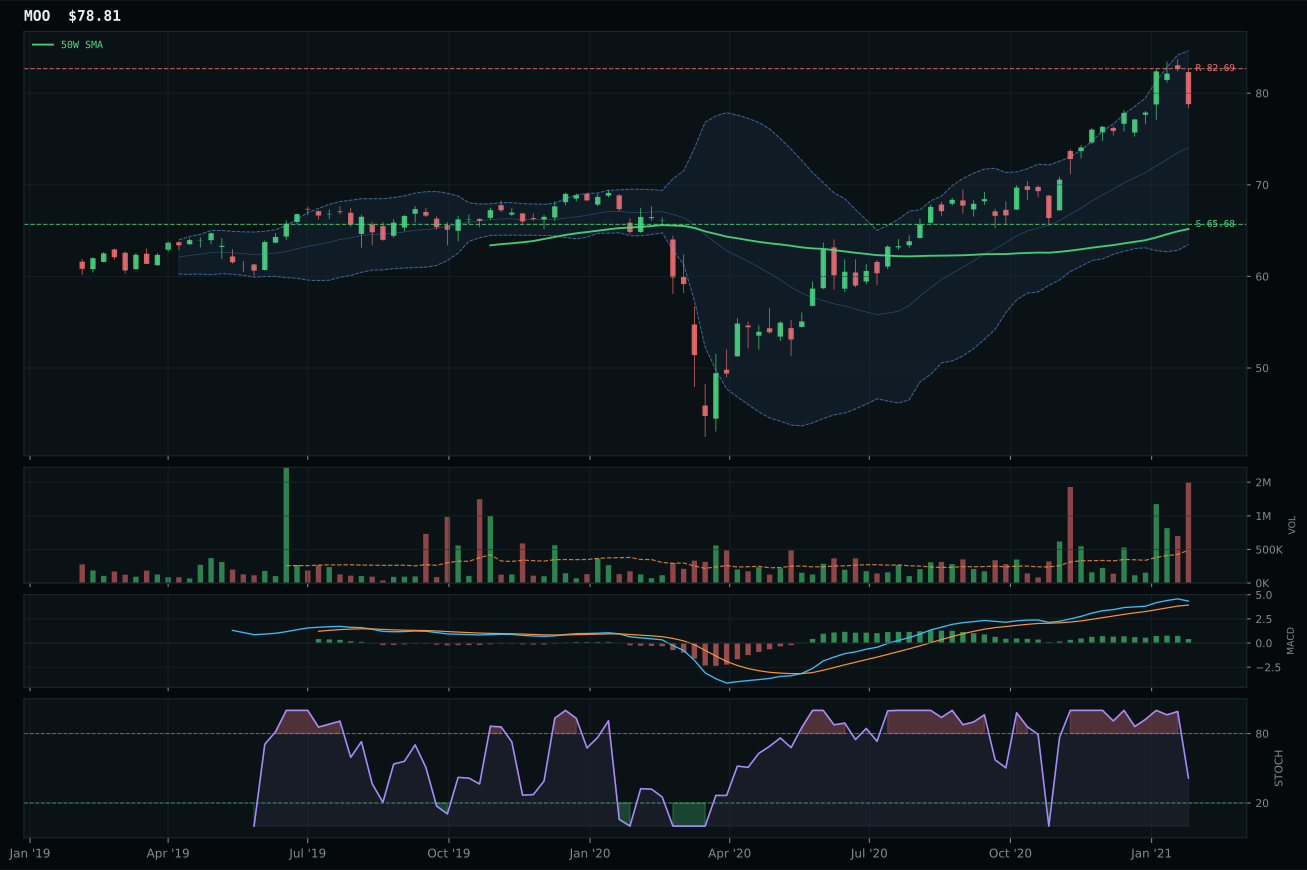
MOO has a vertical extension profile with 5.4% 13-week relative strength versus SPY.
A failed hold above support would weaken the setup.
Actionable but governed by invalidation levels.
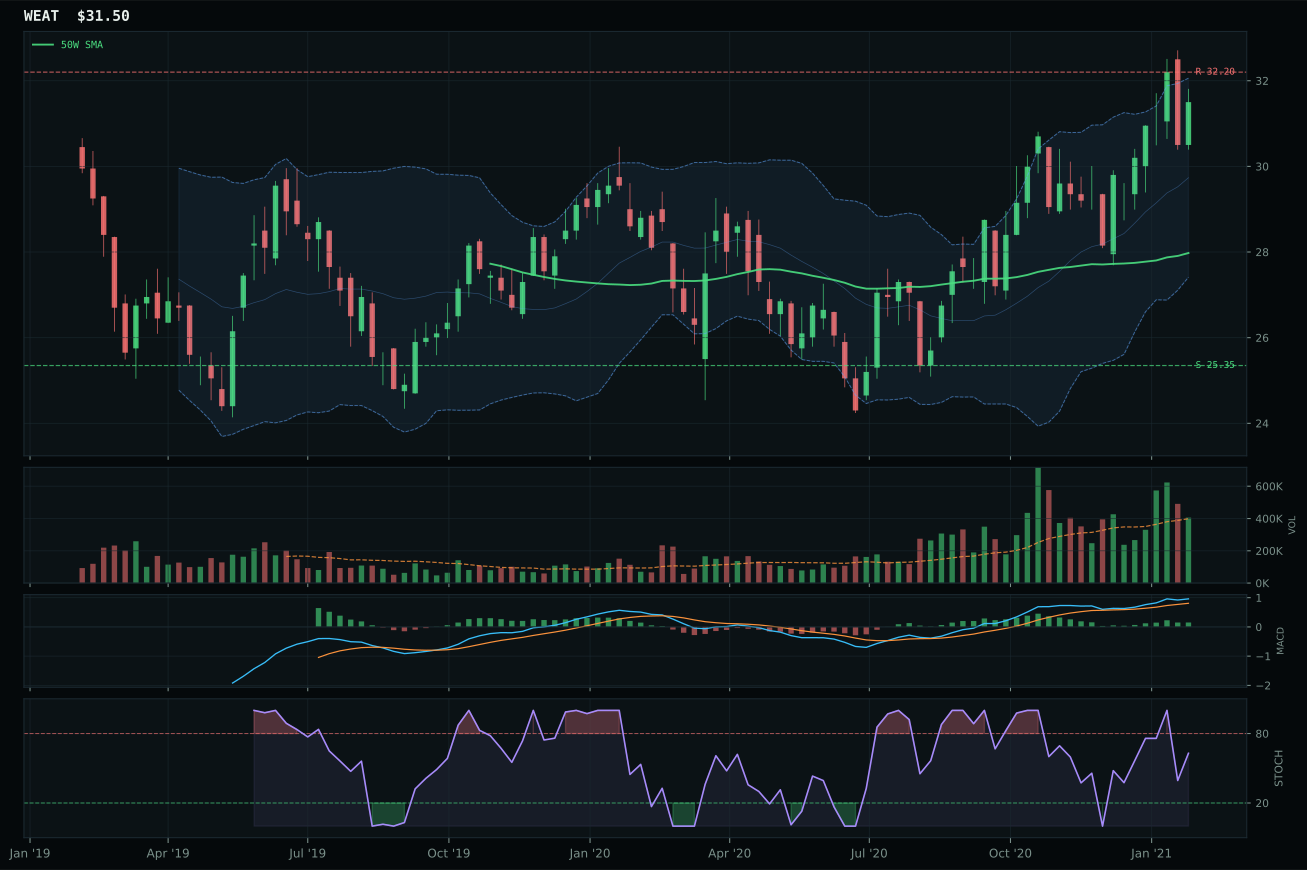
WEAT has a neutral structure profile with -4.9% 13-week relative strength versus SPY.
A failed hold above support would weaken the setup.
Actionable but governed by invalidation levels.
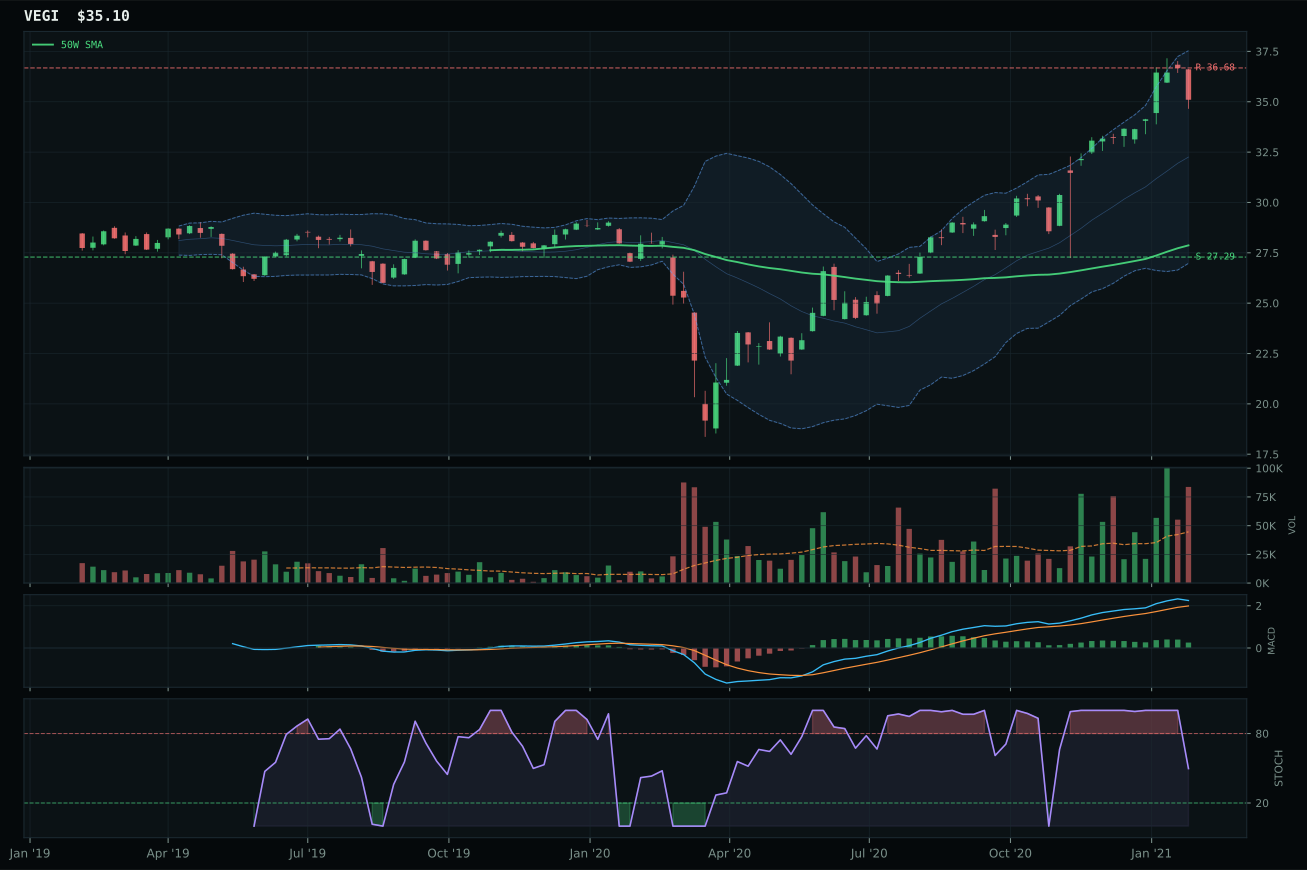
VEGI has a vertical extension profile with 9.5% 13-week relative strength versus SPY.
A failed hold above support would weaken the setup.
Tracked, but not top-2 eligible because: .
MOO won a close decision over WEAT by maintaining category-relative strength parity while WEAT's RS versus the category median fell -10.3% in the red. Both showed vertical extension setups with bullish MACD signals, yet MOO's MACD profile—bullish but flattening—paired with its 18.7% 13-week return and 5.4% SPY-relative strength delivered more conviction than WEAT's narrower win. WEAT's structure score at 73.4 lagged MOO's 74.6 by a single point, barely material on its surface, but the divergence in volume patterns proved decisive: MOO's distribution pressure at 3.05x the 20W average showed willing absorption of supply, while WEAT's neutral volume suggested hesitancy. Both sat in the upper retracement zone near Fib 0.236, yet MOO's momentum confirmation at 73.2 beat WEAT's 49.0, indicating that agribusiness equity (MOO's thesis) was accumulating faster than pure wheat futures exposure (WEAT). The score gap of only 1.2 points reflects how close this call was; MOO advanced by being the more liquid, faster-turning expression of the commodity breadth that's currently active.
Agriculture & Livestock earned 5% allocation as tier-2, supported by the highest category-level macro fit in the entire portfolio at 86.0—a score driven by supply shortage, inflation pressure, real asset sponsorship, and commodity breadth all firing simultaneously. That macro conviction, however, did not translate into a top-2 ranking because the technical ETF evidence sits at only 32.6 out of 100 for the representative, meaning the category is macro-driven rather than technically validated. MOO's 100.0 trend score and 73.2 momentum confirmation are strong, yet the timing score of 48.0 and risk-reward of 41.2 are pedestrian, and persistence at 51.4 suggests the move lacks staying power. For agriculture to climb into top-2, either the technical evidence scores would need to improve through fresh breakout confirmation with volume accumulation replacing distribution, or the macro regime would need to shift away from risk-appetite positive into a deeper flight-to-safety environment that puts a premium on real assets. For now, this category sits as a macro satellite—acknowledged as benefiting from scarcity and inflation, but structurally weaker than the energy complex and less technically proven.
Defense & Aerospace — XAR
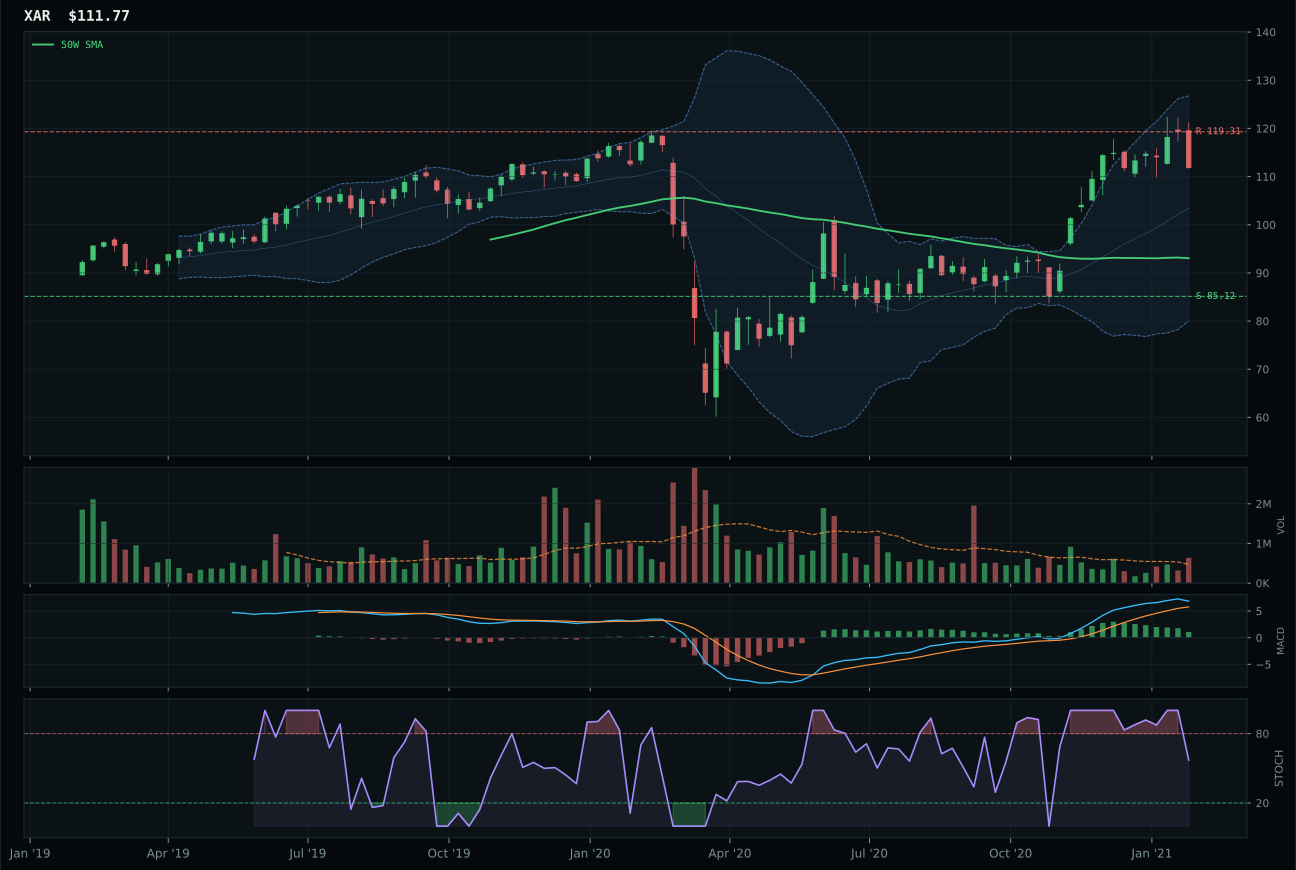
XAR has a vertical extension profile with 18.0% 13-week relative strength versus SPY.
A failed hold above support would weaken the setup.
Actionable but governed by invalidation levels.
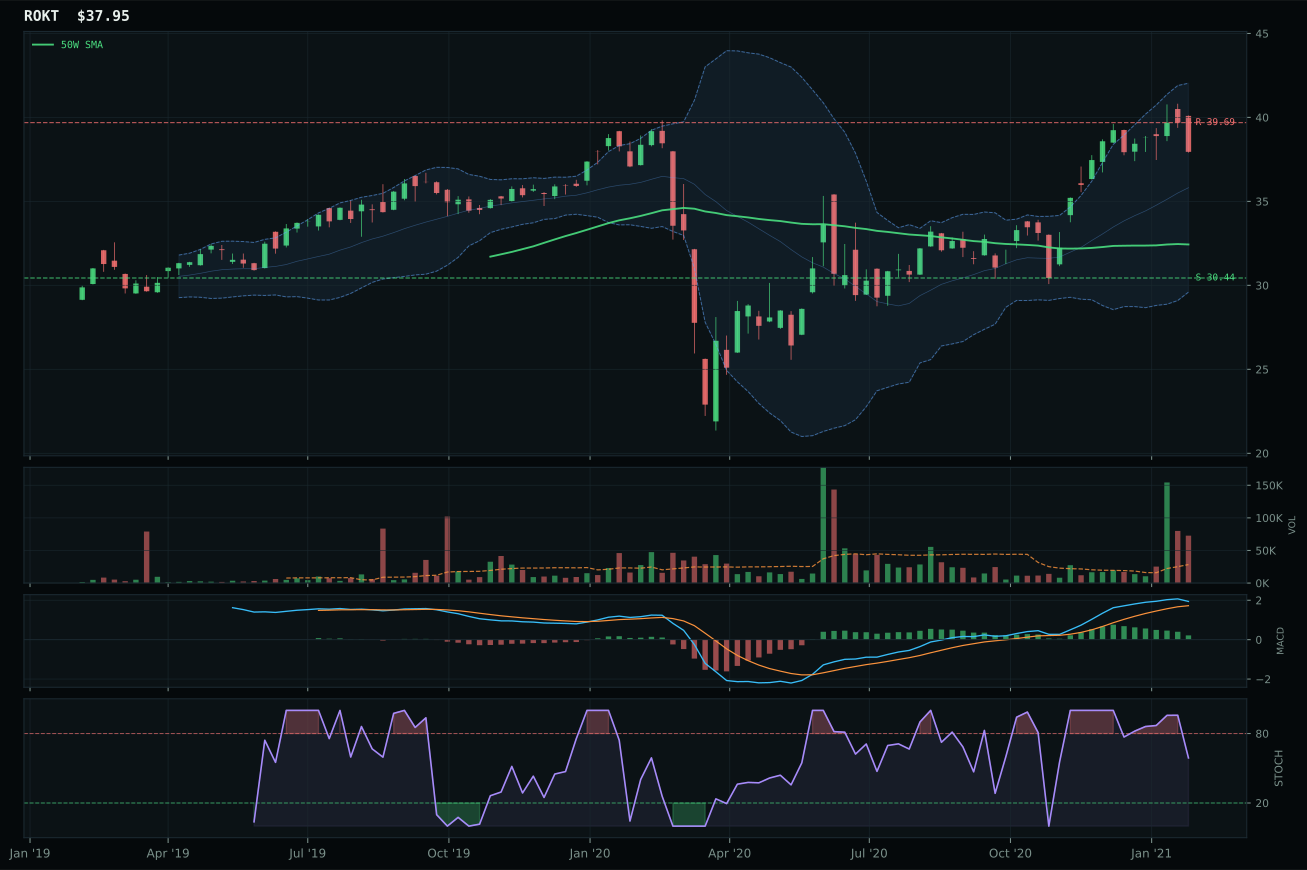
ROKT has a vertical extension profile with 11.3% 13-week relative strength versus SPY.
A failed hold above support would weaken the setup.
Tracked, but not top-2 eligible because: .
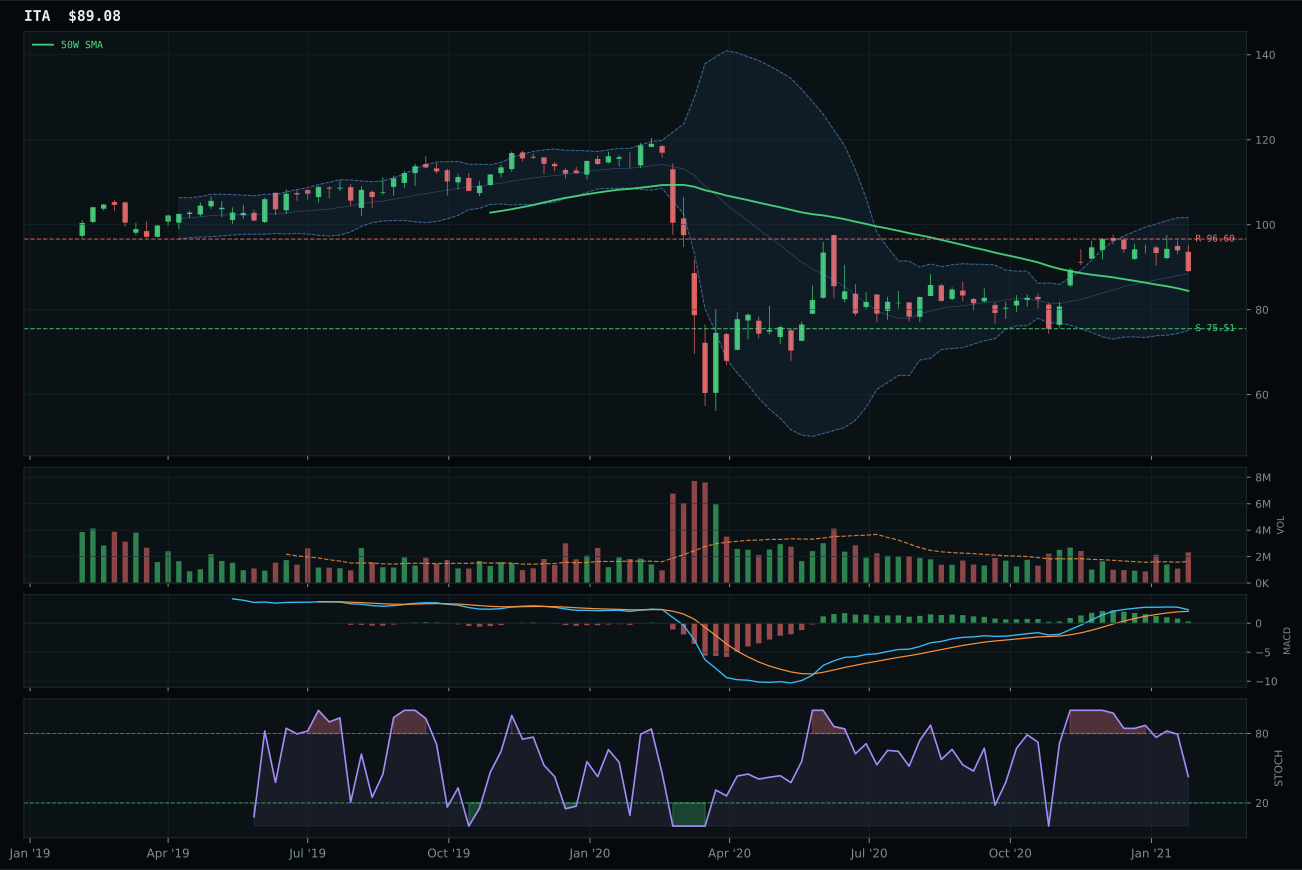
ITA has a neutral structure profile with 4.6% 13-week relative strength versus SPY.
A failed hold above support would weaken the setup.
Actionable but governed by invalidation levels.
XAR won the Defense & Aerospace category on the strength of superior structure, momentum confirmation, and volume verification against a crowded field. The 31.3% 13-week return and 18.0% SPY-relative strength told a story of capital flowing into the thesis, while category-relative strength of 6.6% confirmed XAR was the primary beneficiary of that flow. ROKT, the runner-up, posted a much weaker category-relative reading of 0.0% despite a respectable 11.3% RS versus SPY, which meant it was being carried by the tide rather than pulling it. XAR's risk-reward at 48.6 dominated ROKT's 40.2, and more critically, XAR's volume profile showed above-average participation at 1.36x the 20-week average while ROKT's distribution pressure suggested late-stage accumulation turning to distribution. The trend score differential was dramatic: XAR at 96.0 versus ROKT's 76.0, rooted in a non-deteriorating 50W slope and price sitting above both major moving averages. Structure cleanliness favored XAR at 75.0 points—compression tight, support and resistance clearly defined—while ROKT's support/resistance zone at 30.44/39.69 looked wider and less actionable.
Defense & Aerospace claimed 5% as tier-2, a holding position that reflects adequate technical sponsorship but insufficient categorical weight to justify a top-2 overweight. The final score of 53.7 ranks it mid-pack among the ten categories, driven by a category macro fit of 55.0 and technical ETF evidence of 78.9 for the representative. The macro backdrop helped slightly—Transition / Mixed plus credit stress active—but the category lacks the scarcity premium or energy crisis sponsorship that's pushing energy and metals higher. XAR's setup is undeniably clean: perfect 100.0 momentum confirmation, solid 100.0 volume-price confirmation, and persistence at 83.5 all point to real accumulation. Yet the extension at 20.1% above the 50W and the flattening MACD are cautionary signals that this move may be maturing. For defense to move up to tier-1, either geopolitical escalation would need to activate as a fresh macro descriptor, or the category would need to show relative strength beginning to compress as capital-weighted consolidation replaces breakout buying.
Technology — XLK
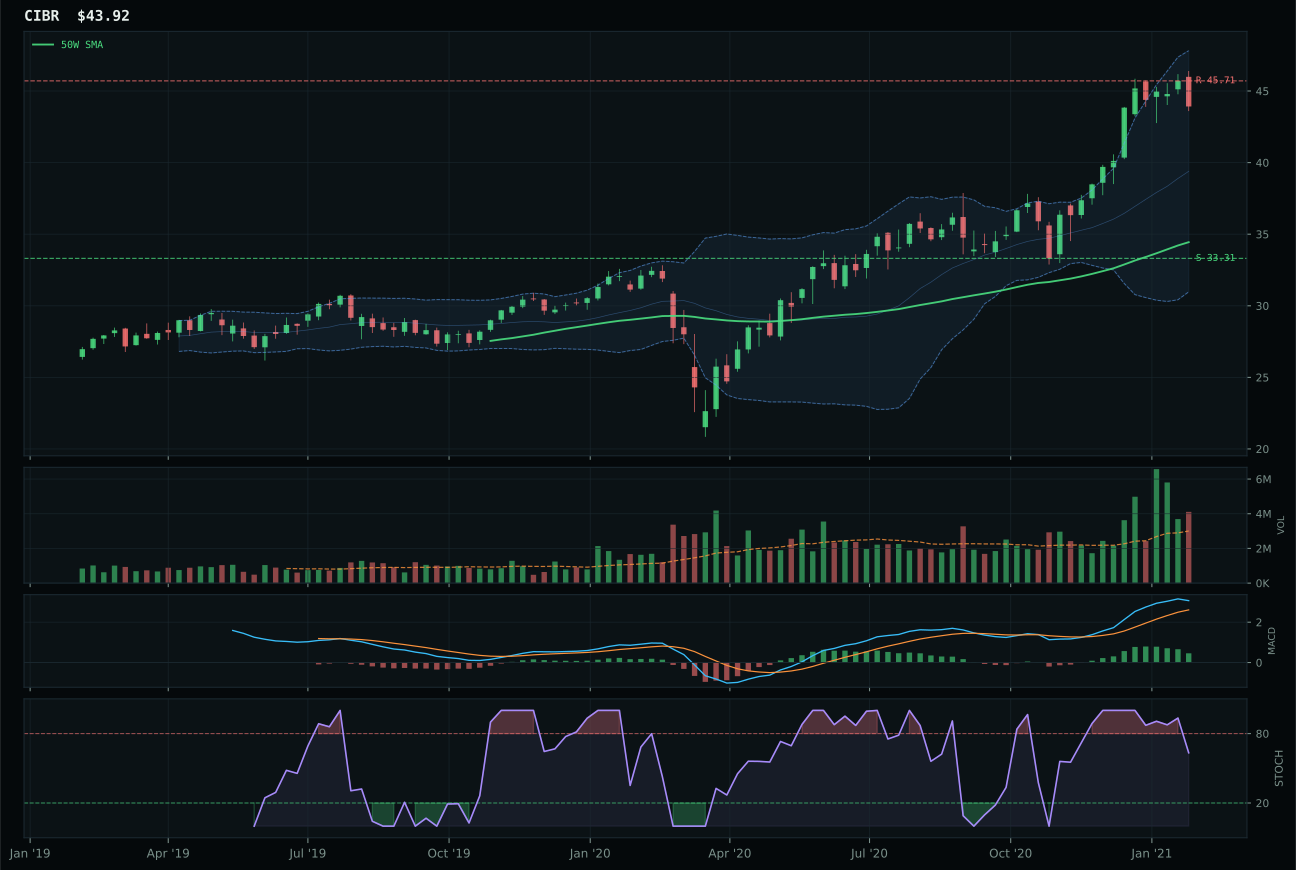
CIBR has a vertical extension profile with 18.5% 13-week relative strength versus SPY.
A failed hold above support would weaken the setup.
Actionable but governed by invalidation levels.
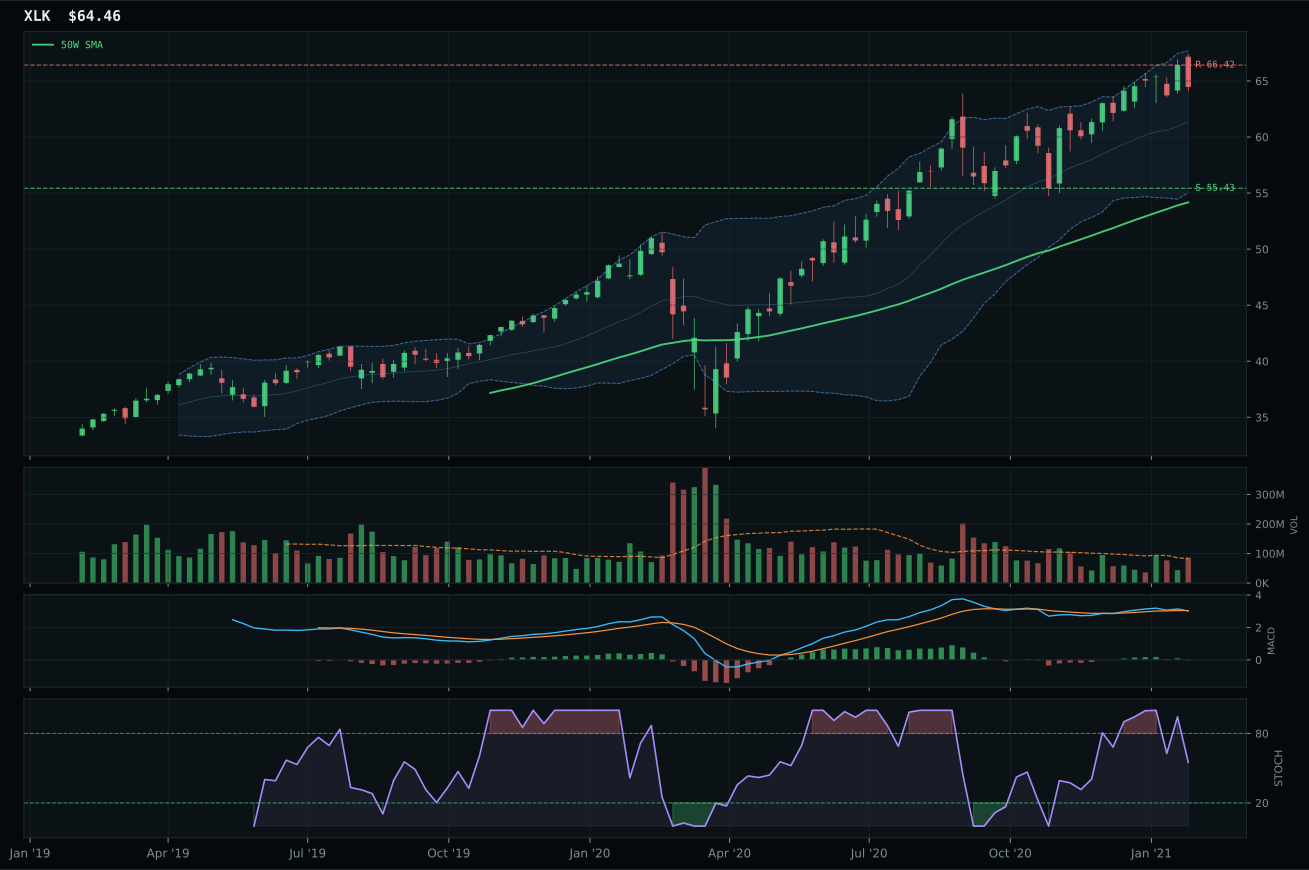
XLK has a vertical extension profile with 3.0% 13-week relative strength versus SPY.
A failed hold above support would weaken the setup.
Actionable but governed by invalidation levels.
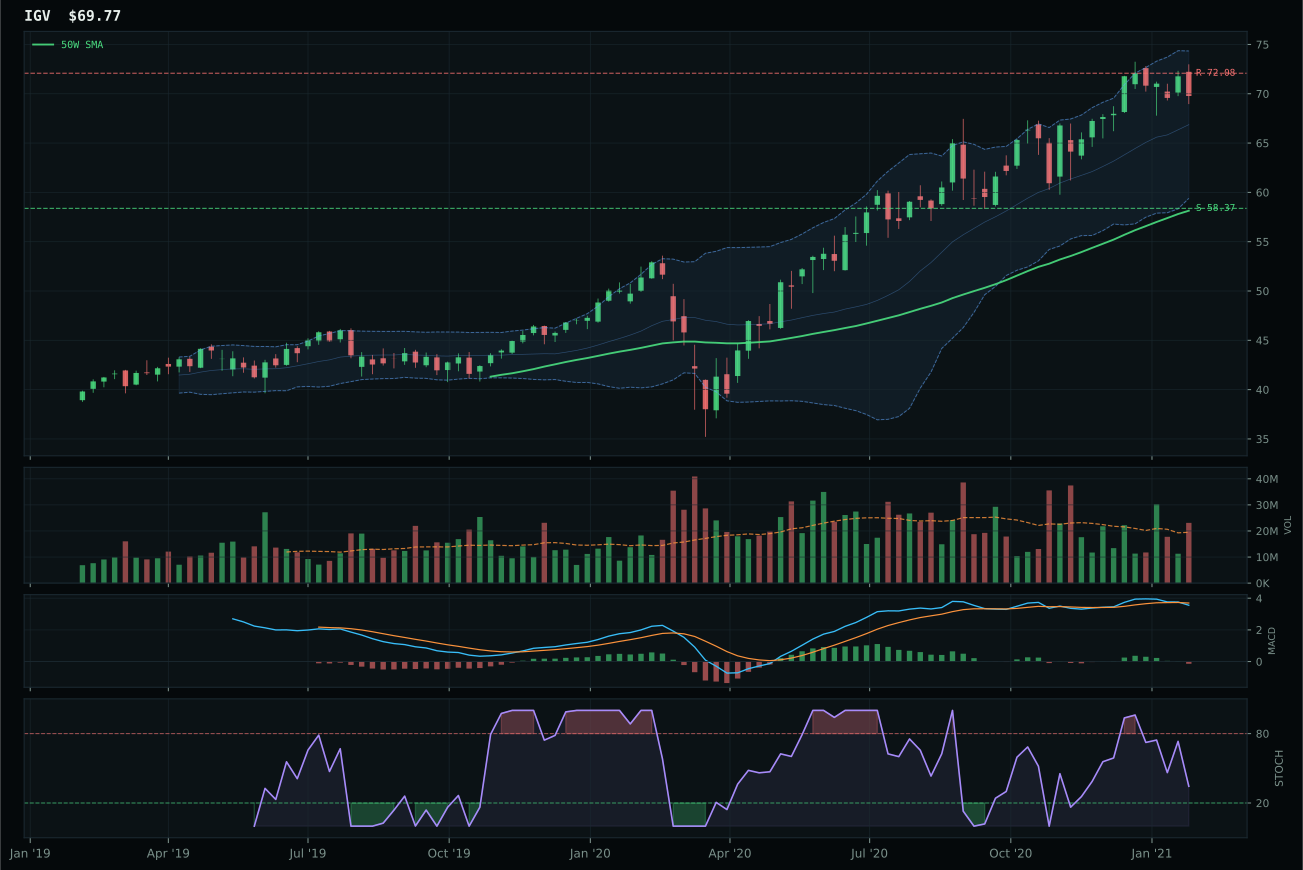
IGV has a vertical extension profile with 1.2% 13-week relative strength versus SPY.
A failed hold above support would weaken the setup.
Actionable but governed by invalidation levels.
XLK claimed the category by delivering modest but clean relative strength inside its three-ETF basket while sitting at a defensible technical level. CIBR outpaced it in raw momentum—31.9% over 13 weeks versus XLK's 16.3%—but that stretch came with a cost: CIBR sat 27.5% above its 50-week moving average compared to XLK's 19.0%, meaning every incremental buyer was paying a steeper premium for entry. The cybersecurity ETF's risk-reward math also deteriorated at the margin; with only 39.2 points of cushion between upside resistance and downside support versus XLK's 40.2, the trade-off between potential gain and loss exposure tipped against it. XLK's MACD bearish-weakening signal and flat stochastic RSI matched CIBR's pattern, but the broader category composition favored the balanced scorecard: trend strength at 86.5, structure at 73.7, and persistence at 55.6 kept the representative decision grounded in sustainability rather than pure momentum spray.
Technology earned 5% allocation as a tier-2 category, holding its position despite a final score of 50.8 that ranked it outside the top two. The macro regime—Transition / Mixed with risk appetite positive and AI growth sponsorship both active—offered tailwinds, yet credit stress and inflation pressure headwinds offset much of the upside case. At this juncture, technology's technical evidence checked in at only 37.3 out of 100, a material structural weakness that no amount of positive narrative could overcome. For technology to reclaim a top-2 slot, the MACD deterioration across the category's three ETFs would need to reverse into bullish confirmation, category-relative strength gaps would need to narrow, and setup cleanliness would need to improve. Right now the sector is being held as a satellite position—acknowledged as part of the risk landscape, but not prioritized against the more decisive opportunities in energy and emerging markets.
AI — SMH
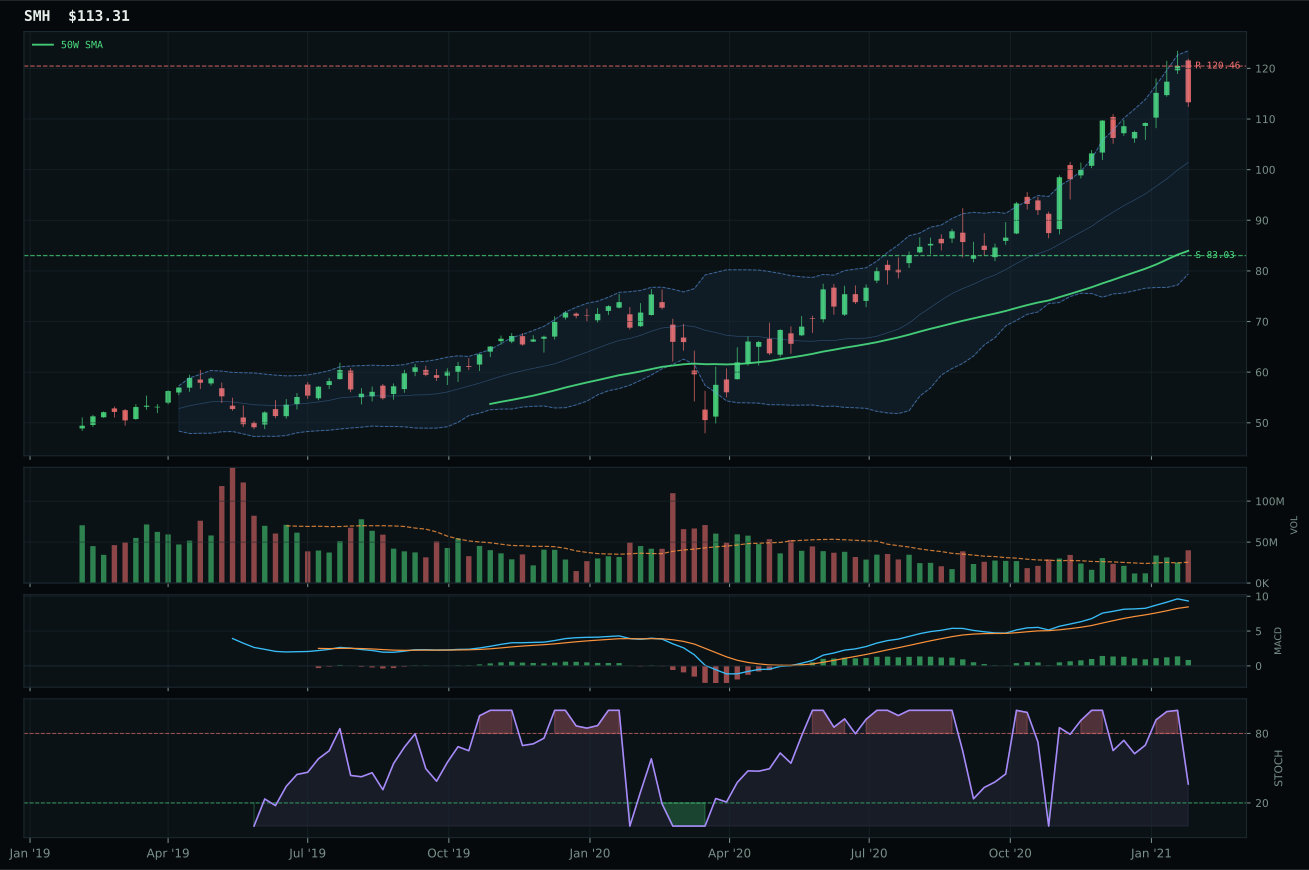
SMH has a vertical extension profile with 16.2% 13-week relative strength versus SPY.
A failed hold above support would weaken the setup.
Actionable but governed by invalidation levels.
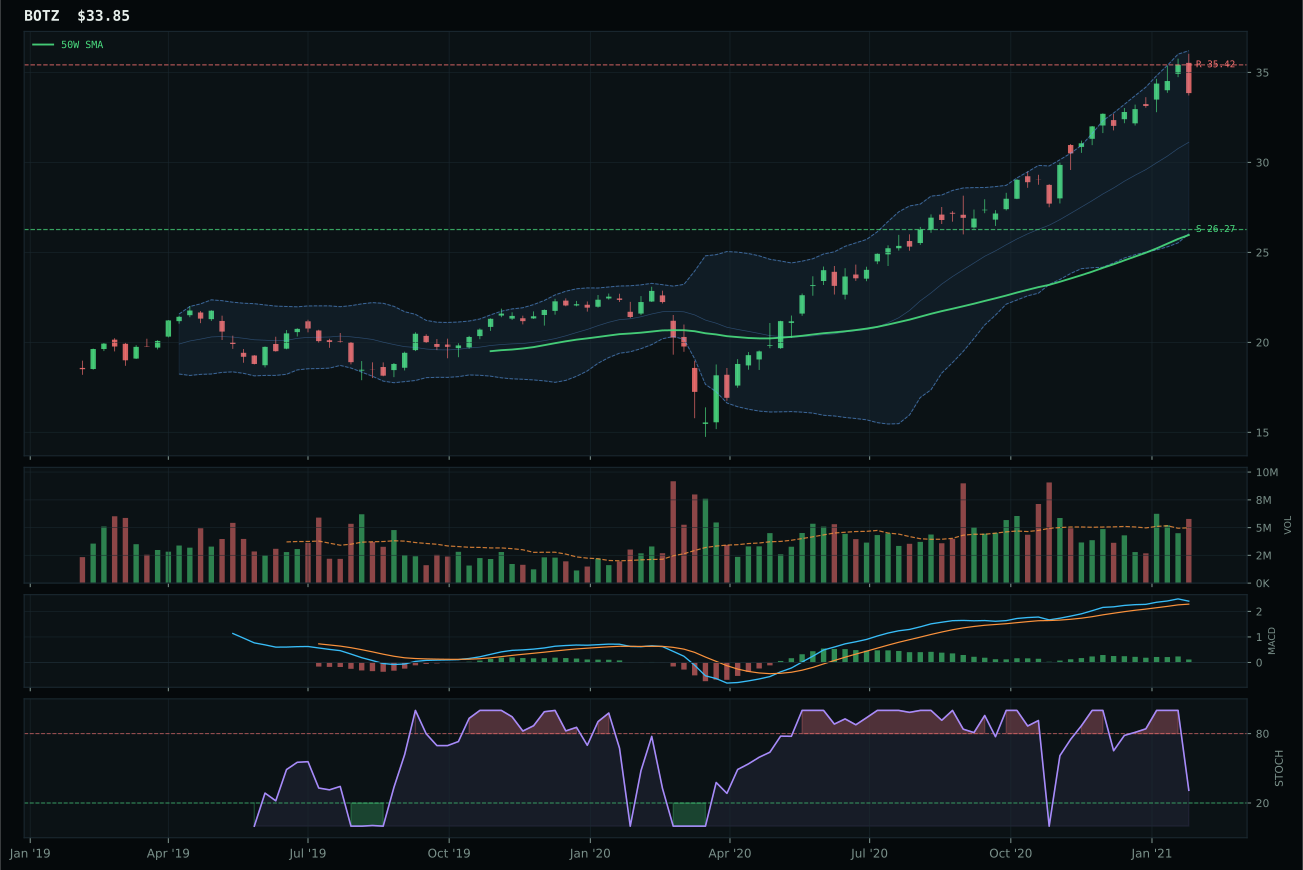
BOTZ has a vertical extension profile with 8.8% 13-week relative strength versus SPY.
A failed hold above support would weaken the setup.
Actionable but governed by invalidation levels.
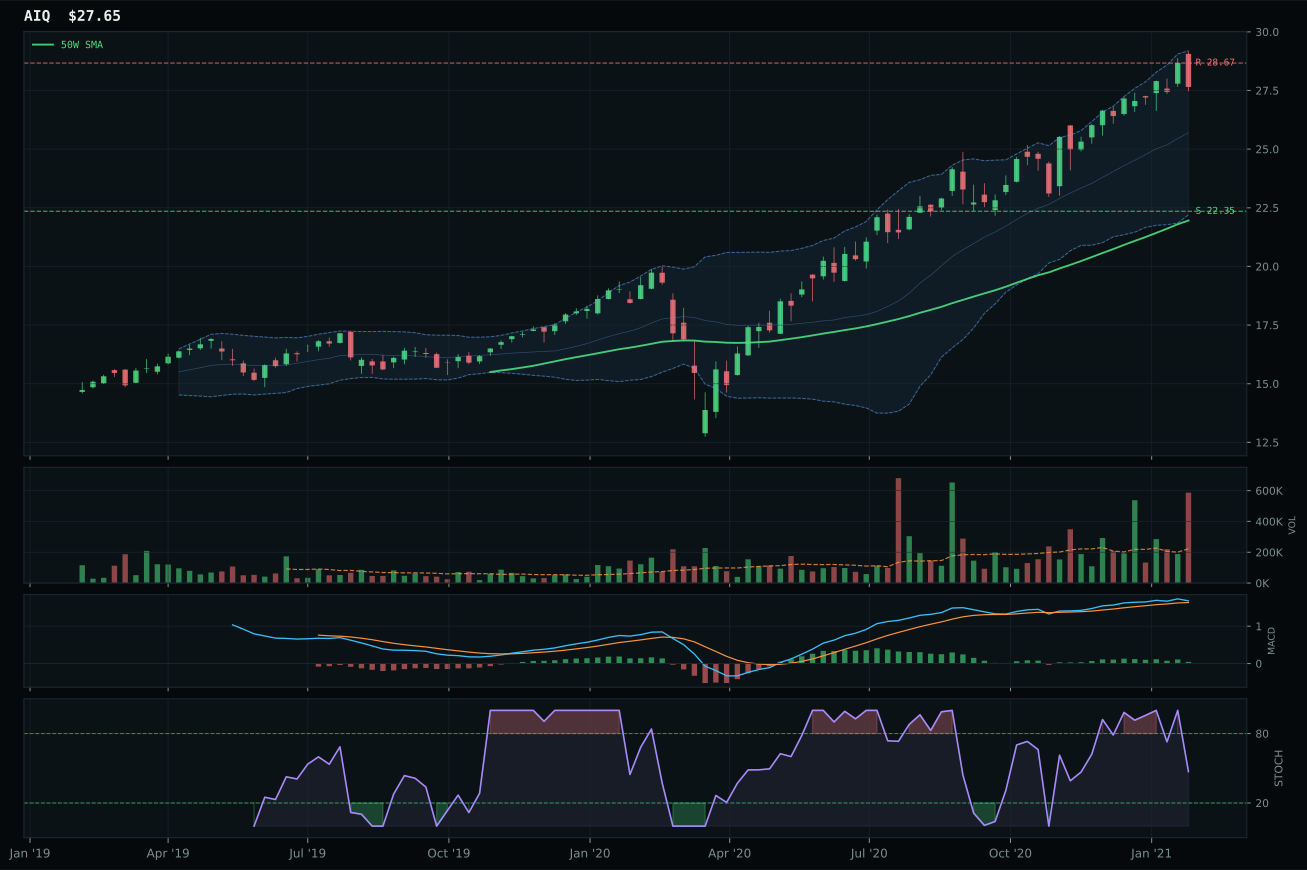
AIQ has a vertical extension profile with 6.3% 13-week relative strength versus SPY.
A failed hold above support would weaken the setup.
Tracked, but not top-2 eligible because: .
SMH captured AI leadership not because it was the cleanest technician in the basket but because it delivered the highest relative strength sponsorship inside the category itself. BOTZ ranked higher in the deterministic reasoning layer at 67.4 versus SMH's 46.8, yet SMH's category-relative strength of 7.4% versus BOTZ's 0.0% proved decisive in the final composite score. Semiconductors showed the stronger 13-week return at 29.5%, paired with 16.2% RS versus SPY—material outperformance that signaled where capital was actually flowing. BOTZ's robotics thesis posted an 8.8% SPY-relative gain and 22.2% 13W return, respectable fundamentals, yet it lacked the conviction that peer selection delivered to SMH. Both carried identical MACD and stochastic profiles—bullish but flattening, stochastic falling neutral—so the decision hinged on breadth and sponsorship. SMH sits extended 34.9% above its 50W, placing it deep in the risk zone, but the distribution pressure at 1.57x volume and the 100.0 momentum confirmation score validated that accumulation was real rather than retail rotation.
AI received 5% allocation as tier-2, a ranking that reflects genuine tension between strong technical setup and poor category-level timing. The final score of 49.4 missed top-2 entirely, which speaks to the macro fit problem: while AI growth sponsorship is active and risk appetite positive, the category's macro fit sits at only 66.0 out of 100, and its extension into overbought territory—with BOTZ at 37.1% and SMH at 34.9% above their 50W averages—signals late-stage momentum rather than fresh entry. For AI to climb into the top-2 overweight tier, one of three things would need to shift: either the MACD weakness would need to flip back to bullish confirmation, giving fresh trend evidence; the stochastic oversold conditions would need to produce a clean reversion bounce with volume sponsorship; or a macro shock would need to crater SPY-relative performance, resetting entry risk. Until one of those occurs, AI remains a holding pattern—acknowledged as having real growth drivers, but priced where the risk-reward has already compressed.
Utilities & Infrastructure — XLU
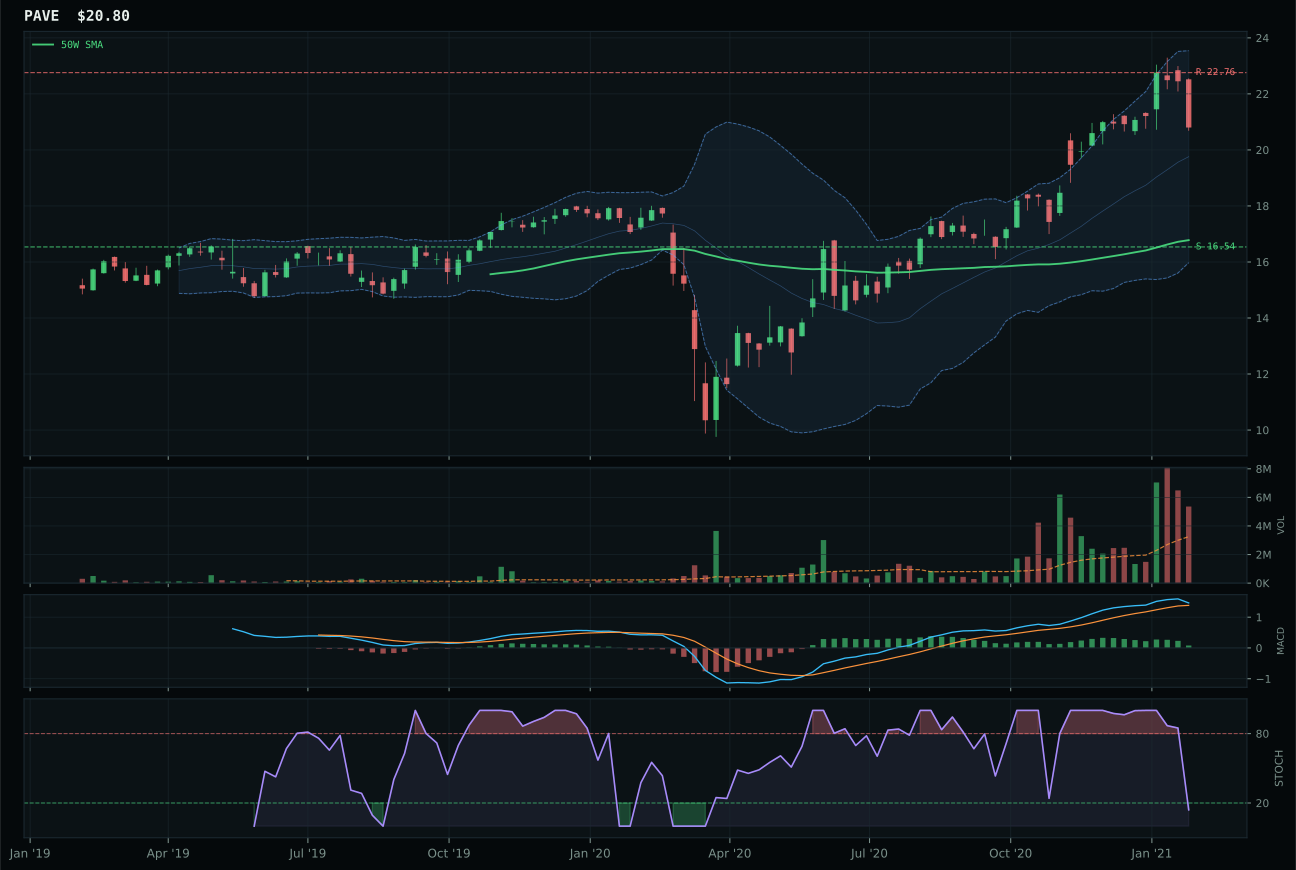
PAVE has a vertical extension profile with 6.0% 13-week relative strength versus SPY.
A failed hold above support would weaken the setup.
Actionable but governed by invalidation levels.
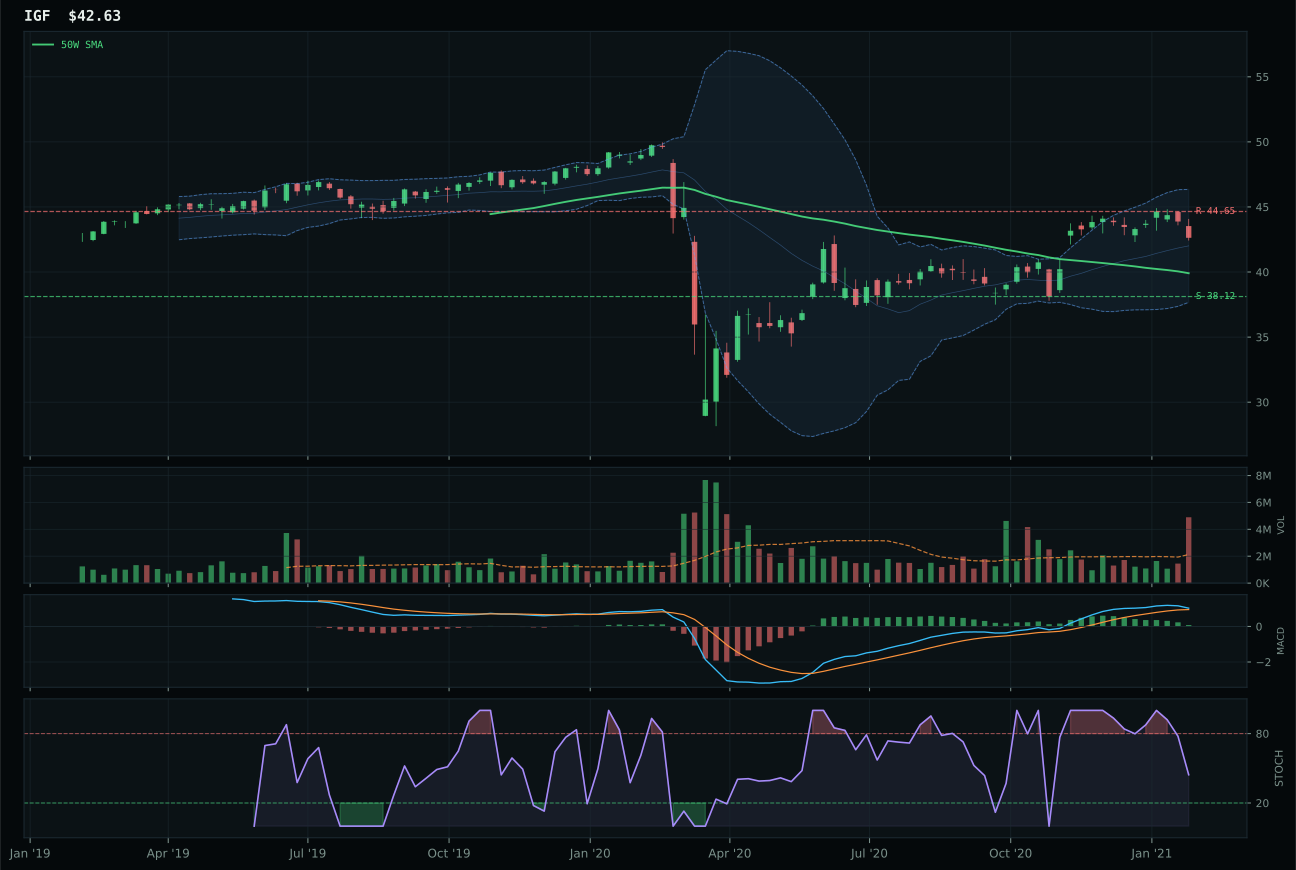
IGF has a neutral structure profile with -1.5% 13-week relative strength versus SPY.
A failed hold above support would weaken the setup.
Actionable but governed by invalidation levels.
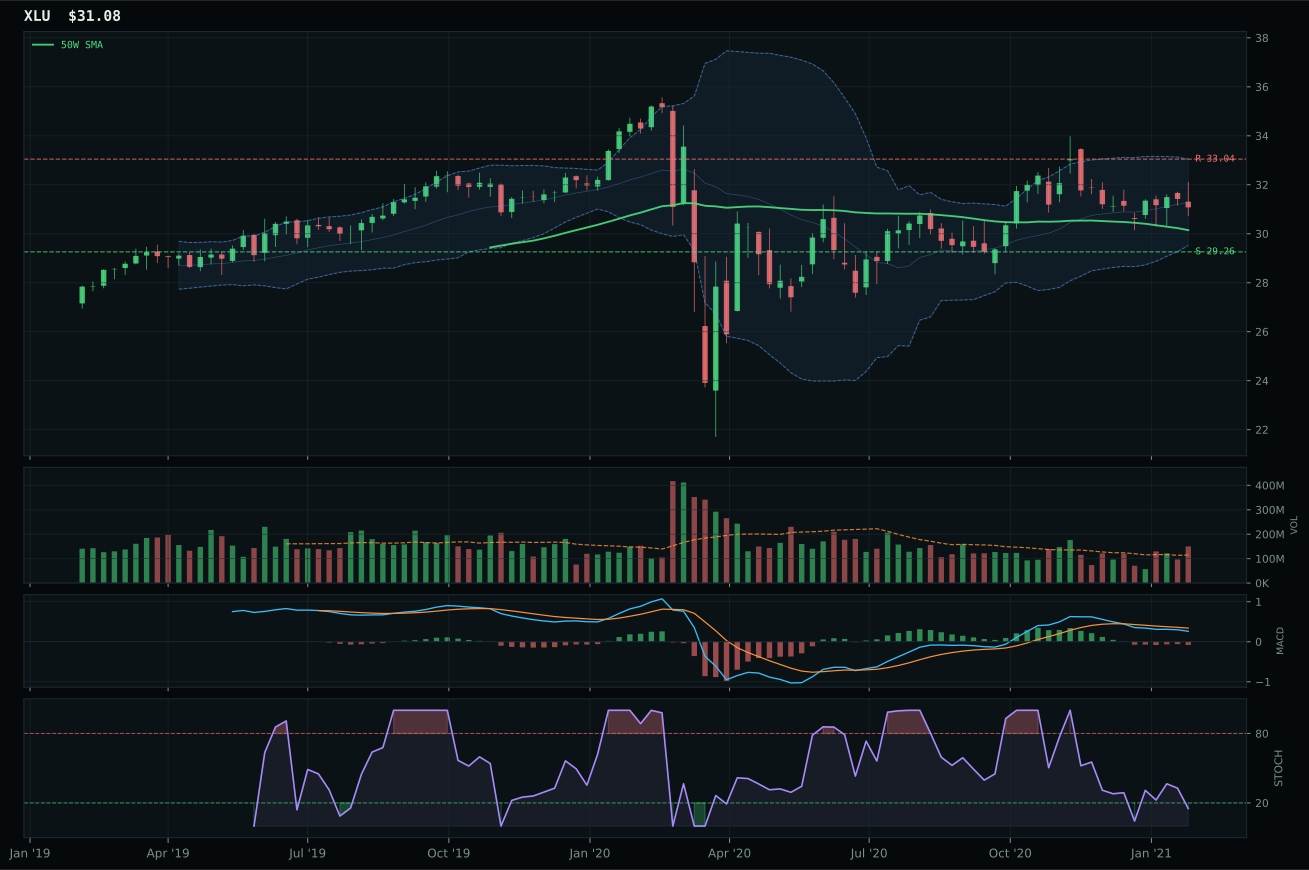
XLU has a neutral structure profile with -13.7% 13-week relative strength versus SPY.
A failed hold above support would weaken the setup.
Actionable but governed by invalidation levels.
XLU won Utilities & Infrastructure not through strength but through defensibility in an inherently weak category field. With a -0.4% 13W return and -13.7% SPY-relative performance, XLU is the category's worst technical performer, yet it claimed the representative crown because PAVE and IGF were even more compromised. PAVE sits extended 24.0% above its 50W, vertically stretched in distribution pressure volume, and flattening in MACD while XLU sits only 3.1% above its 50W with oversold stochastic RSI at 0.15—a proximity to support that earned a 85.0 timing score versus PAVE's 48.0. XLU's structure at 72.0, though neutral rather than showing extension, proved tighter than PAVE's architecture at 69.9. The decision centered on risk-reward: XLU's 62.3 points reflected a 6.0% upside to resistance against 6.2% downside to support—a balanced, almost symmetric payoff that appeals when absolute conviction is low. PAVE's 43.0 risk-reward showed more downside skew despite its extended price, a structural warning that the infrastructure narrative had overextended beyond its technical support. Both showed negative category-relative strength, yet XLU's -12.2% versus PAVE's +7.5% meant PAVE was the category's relative leader while XLU was its relative laggard—a paradoxical selection that proved category representativeness requires relative weakness to be measured against the field, not absolute performance.
Utilities & Infrastructure received 5% allocation as tier-2, a position that reflects the category's fundamental weakness rather than any conviction in the representative. The final category score of 40.8 ranks it 8th or lower, driven by category macro fit of only 46.0 and XLU's technical evidence at just 20.4 out of 100—the weakest representative score in the entire portfolio. The macro headwinds are explicit: inflation pressure is marked as active with a -6 signal, risk appetite positive carries a -2 signal, meaning growth exposure is preferred over defensive utilities. XLU's 0.0 momentum confirmation and 30.3 persistence are abysmal, signaling that any recent strength is purely technical mean reversion rather than institutional accumulation. The -0.4% 13W return and -13.7% SPY-relative performance confirm utilities are laggards in the current regime. XLU's sole merit is timing at 85.0 from being oversold; this reflects a potential mean-reversion setup rather than a conviction-backed allocation. For utilities to climb into tier-1, either inflation pressure would need to reverse and be marked as a supportive signal for rate-sensitive names, or a major equity market correction would need to flip risk appetite negative, forcing defensive rotation. Until that macro shift occurs, utilities remain the portfolio's weakest holding—allocated purely as a residual hedge against tail risk, with no expected outperformance relative to broad equities.
Nuclear Energy — URA
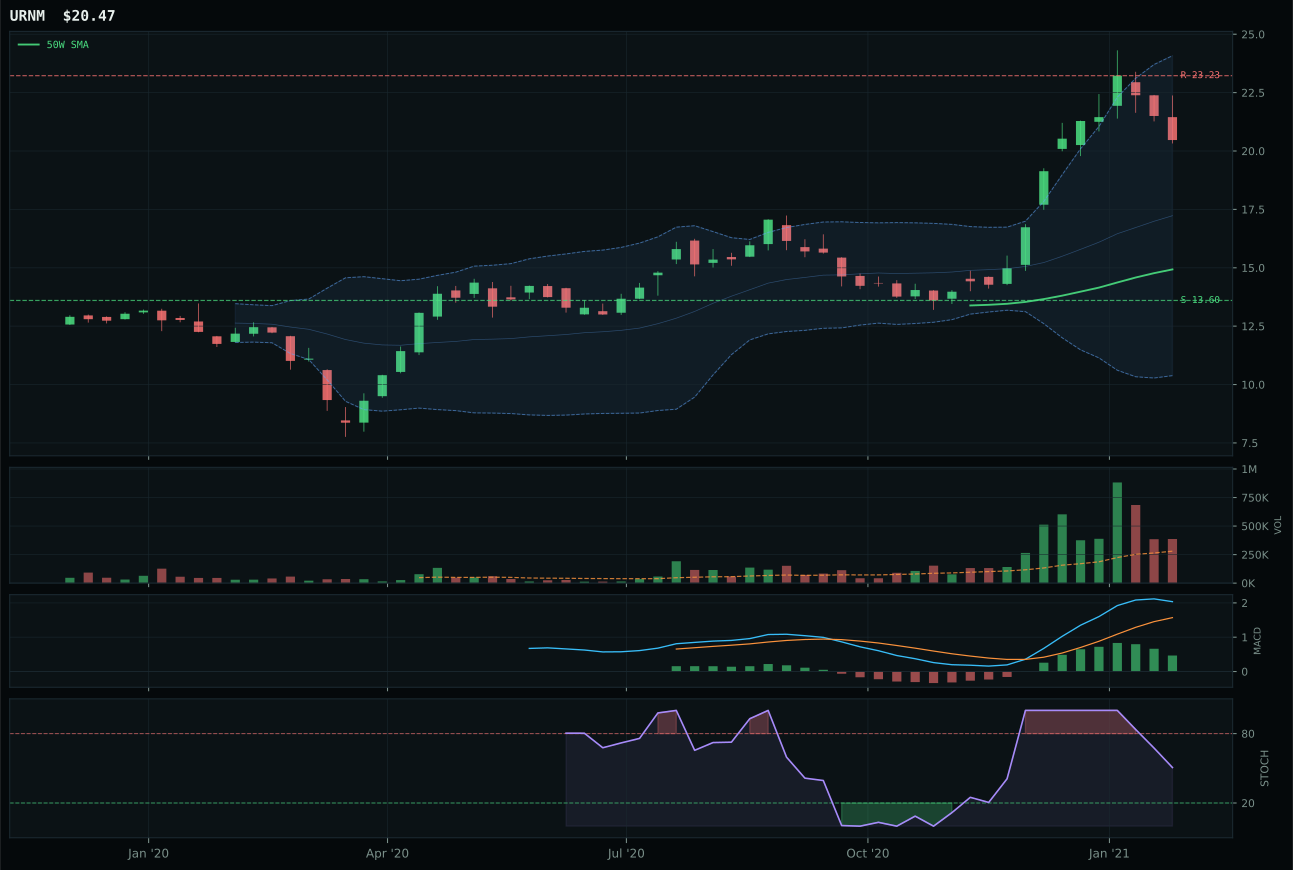
URNM has a vertical extension profile with 37.2% 13-week relative strength versus SPY.
A failed hold above support would weaken the setup.
Tracked, but not top-2 eligible because: .
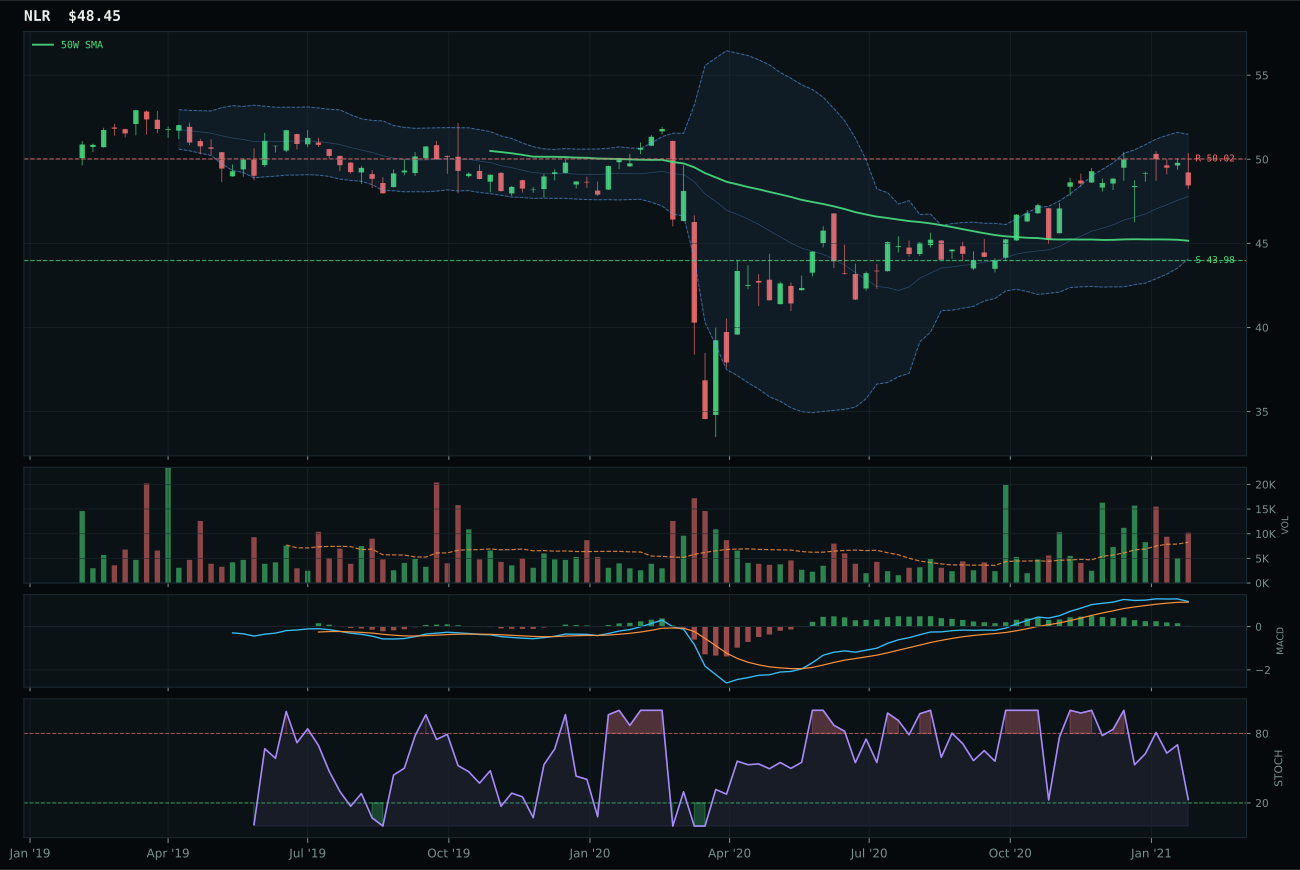
NLR has a neutral structure profile with -6.2% 13-week relative strength versus SPY.
A failed hold above support would weaken the setup.
Tracked, but not top-2 eligible because: .
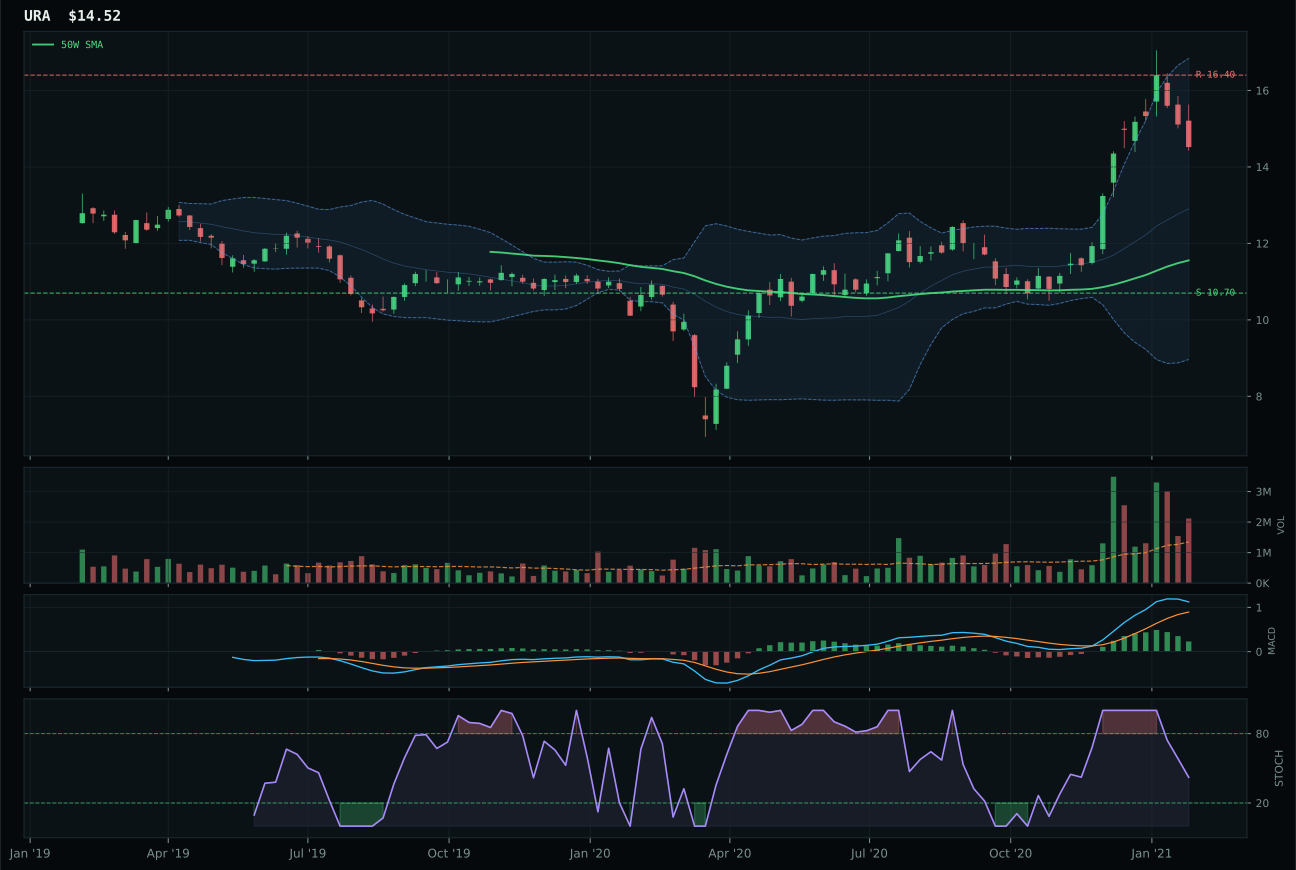
URA has a vertical extension profile with 21.0% 13-week relative strength versus SPY.
A failed hold above support would weaken the setup.
Actionable but governed by invalidation levels.
URA prevailed in Nuclear Energy by posting the cleanest technical structure despite a wide score differential versus URNM's reasoning-layer ranking. URA's setup—vertical extension at 25.6% above the 50W—was tighter than URNM's 37.1%, a critical distinction that separated sustainable strength from overextended enthusiasm. Both delivered 100.0 momentum confirmation, yet URA's category-relative strength of 0.0% and 34.3% 13W return, paired with 21.0% SPY-relative performance, suggested measured sponsorship rather than the frothy 37.2% SPY-relative and 50.5% 13W return that URNM displayed. URA's structure score of 71.6 exceeded URNM's implied score, driven by cleanliness and compression metrics that suggested the range was building methodically rather than exploding. URNM's macro narrative fit at 69.0 dominated URA's 50.0, backed by energy scarcity and real asset sponsorship signals; yet that narrative advantage could not overcome the technical risk asymmetry. Volume distribution pressure was identical, MACD profiles matched, yet URA's 35.7% downside to support versus URNM's wider risk zone tilted risk-reward into safer territory. The persistence score of 56.5 for both indicated neither was delivering highly sticky flows, a red flag for category conviction overall.
Nuclear Energy received 0% allocation this week, excluded entirely from the portfolio despite carrying real macro merit on paper. The final category score of 39.8 ranks it 9th or 10th, a position driven by technical evidence at only 33.8 out of 100 for the representative—among the weakest in the entire framework. While category macro fit of 69.0 is respectable, backed by energy scarcity and real asset sponsorship, the technical validation is simply not present: URA's persistence at 56.5 suggests flows are not sticking, momentum confirmation of 100.0 masks a 0.0% category-relative strength that shows zero peer sponsorship, and the 4W return of negative 5.3% signals very recent weakness. For nuclear to earn a portfolio position, one of two things must occur: either the technical scores must stabilize through a consolidation pattern that shows accumulation and fresh momentum confirmation, or a dedicated energy supply crisis would need to activate as a secondary macro descriptor giving uranium scarcity explicit portfolio relevance. Right now, the category ranks below utilities, below precious metals, below every tier-2 allocation—a reflection that nuclear's macro case has not yet translated into market conviction. It sits as a watch list position, acknowledged as potentially powerful if the energy regime deteriorates further, but currently underweight despite theoretical appeal.
Precious Metals — SLV
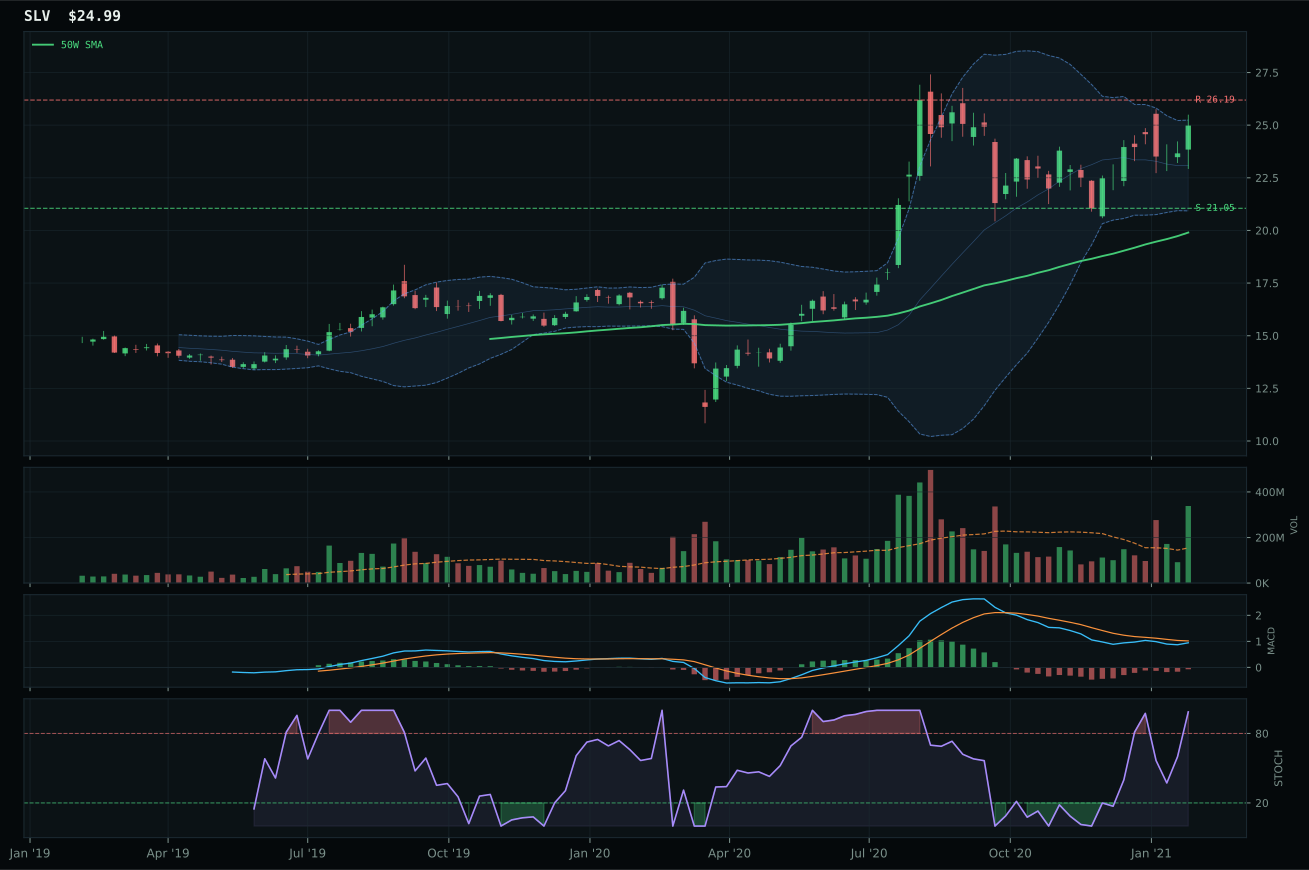
SLV has a vertical extension profile with 0.3% 13-week relative strength versus SPY.
A failed hold above support would weaken the setup.
Actionable but governed by invalidation levels.
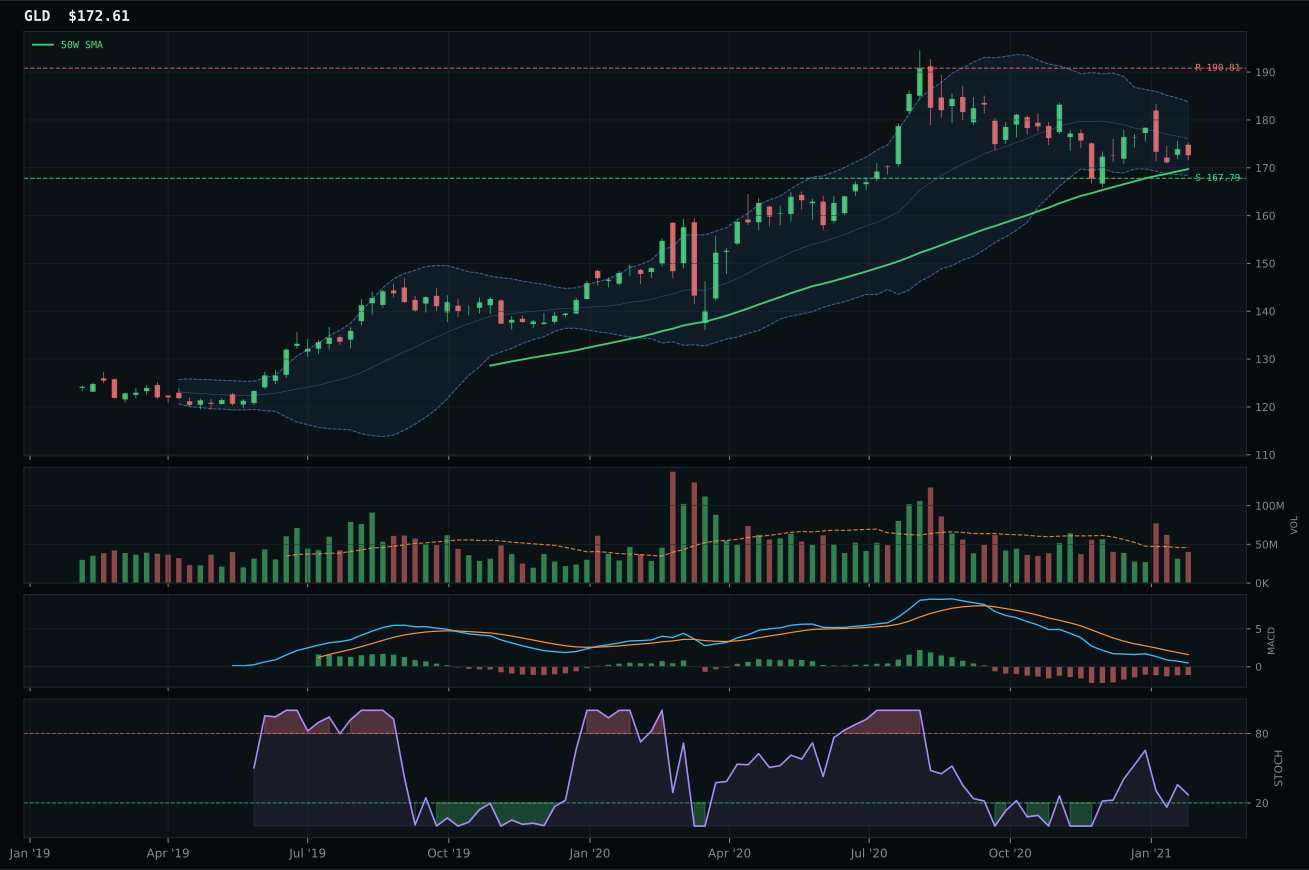
GLD has a pullback into support profile with -15.4% 13-week relative strength versus SPY.
A failed hold above support would weaken the setup.
Actionable but governed by invalidation levels.
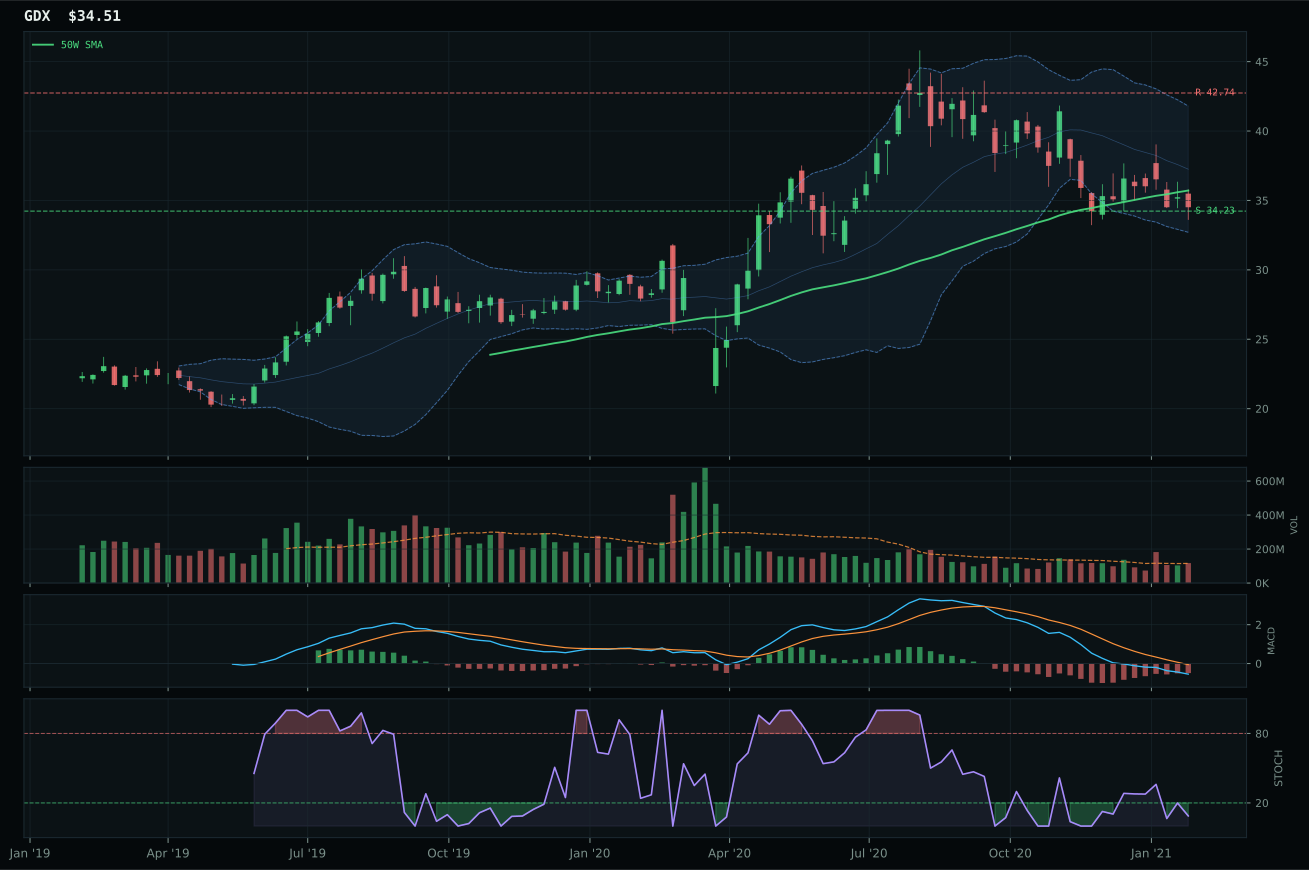
GDX has a pullback into support profile with -21.3% 13-week relative strength versus SPY.
A failed hold above support would weaken the setup.
Actionable but governed by invalidation levels.
SLV defeated GLD despite a more muted SPY-relative performance by posting superior category-relative strength and the only positive volume-price confirmation in the basket. SLV's 15.7% category-relative strength towers over GLD's 0.0%, a gap rooted in silver's hybrid monetary and industrial positioning: inflation pressure provides the bid while supply shortage supports the technical case. GLD's setup was structurally inferior—a pullback into support rather than vertical extension—and its 13-week return of -2.0% versus SLV's 13.6% meant gold-as-pure-hedge was losing the relative race to silver-as-inflation-hedge. Volume told the story: SLV's accumulation/confirmation at 2.19x the 20W average showed conviction buying despite the extended 25.6% move above the 50W, while GLD's neutral volume coupled with bearish-weakening MACD signaled passive liquidation. SLV's momentum confirmation score of 99.4 dwarfed GLD's 2.0, a chasm reflecting real institutional positioning. Structure favored SLV at 74.9 versus GLD's 69.8; the cleanliness differential was particularly telling—SLV at 50.0 versus GLD at 50.0 showed both were somewhat choppy, yet SLV's compression tighter and support/resistance zones more relevant.
Precious Metals received 0% allocation this week, excluded entirely from the portfolio despite SLV's technical strength. The final category score of 38.4 ranks it 9th or 10th depending on comparative standings, a designation that reflects the macro regime working actively against precious metals as a whole. Risk appetite positive is the decisive headwind: it's marked as active with a negative signal, meaning equities are favored over monetary hedges in the current Transition / Mixed environment. SLV's 73.8 reasoning-layer score and strong 82.7 technical evidence cannot overcome that categorical macro fit of only 46.0—the lowest among all ten categories. While inflation pressure and metals scarcity are active, they are being dominated by the positive risk appetite signal that argues for cyclical outperformance over defensive positioning. For precious metals to earn a portfolio slot, either the macro regime would need to shift into a defensive posture with risk appetite turning negative, or a credit stress event would need to activate as a primary descriptor, forcing a flight-to-safety rotation. Until one of those occurs, metals remain on the sidelines despite their technical merit in isolation.