
2021-01-22
Informational purposes only. The content in this report, including allocations, analysis, and commentary, is provided solely for informational and educational purposes. It does not constitute financial advice, investment advice, trading advice, or any other type of advice. Past performance does not guarantee future results. Always conduct your own research and consult a qualified financial professional before making investment decisions.
Some tracked tickers were excluded due to missing live weekly price data: SGOV: Historical cache SGOV has only 34 usable weekly bars
Weekly Allocation
| Ticker | Category | Weight | Role |
|---|---|---|---|
| FSOL | 50% | Overlay | |
| COPX | Industrial Metals | 10% | Top-2 (10%) |
| XOP | Traditional Energy | 10% | Top-2 (10%) |
| IEMG | Emerging Markets | 5% | Tier-2 (5%) |
| SMH | AI | 5% | Tier-2 (5%) |
| MOO | Agriculture & Livestock | 5% | Tier-2 (5%) |
| XLK | Technology | 5% | Tier-2 (5%) |
| XAR | Defense & Aerospace | 5% | Tier-2 (5%) |
| URA | Nuclear Energy | 5% | Tier-2 (5%) |
Trade Instructions — Monday Open
Sell the tranche from 2020-12-25 (completing its 4-week hold). Buy the new tranche. Instructions show net portfolio changes — same-asset positions cancel, weight changes show the delta.
| Action | Ticker | Instruction |
|---|---|---|
| SELL | XLE | Sell 33% of XLE position (reduce 7.50% → 5.00%) |
| SELL | REMX | Sell 25% of REMX position (reduce 10.00% → 7.50%) |
| SELL | INDA | Sell 33% of INDA position (reduce 3.75% → 2.50%) |
| SELL | CIBR | Sell 33% of CIBR position (reduce 3.75% → 2.50%) |
| SELL | XLU | Sell 50% of XLU position (reduce 2.50% → 1.25%) |
| BUY | XOP | Buy XOP — 28.57% of freed cash (adds 2.50% to portfolio) |
| BUY | XLK | Buy XLK — 14.29% of freed cash (adds 1.25% to portfolio) |
| BUY | URA | Buy URA — 14.29% of freed cash (adds 1.25% to portfolio) |
| BUY | COPX | Buy COPX — 28.57% of freed cash (adds 2.50% to portfolio) |
| BUY | IEMG | Buy IEMG — 14.29% of freed cash (adds 1.25% to portfolio) |
Current Portfolio After Trade
Combined holdings across all 4 active tranches. Each tranche is 25% of the portfolio.
| Ticker | % of Portfolio | Weight Bar |
|---|---|---|
| FSOL | 37.50% | |
| FBTC | 12.50% | |
| REMX | 7.50% | |
| XLE | 5.00% | |
| XOP | 5.00% | |
| SMH | 3.75% | |
| INDA | 2.50% | |
| CIBR | 2.50% | |
| MOO | 2.50% | |
| XAR | 2.50% | |
| WEAT | 2.50% | |
| ITA | 2.50% | |
| XLK | 2.50% | |
| URA | 2.50% | |
| COPX | 2.50% | |
| XLU | 1.25% | |
| BOTZ | 1.25% | |
| PAVE | 1.25% | |
| GLD | 1.25% | |
| IEMG | 1.25% |
Macro Regime — Transition / Mixed
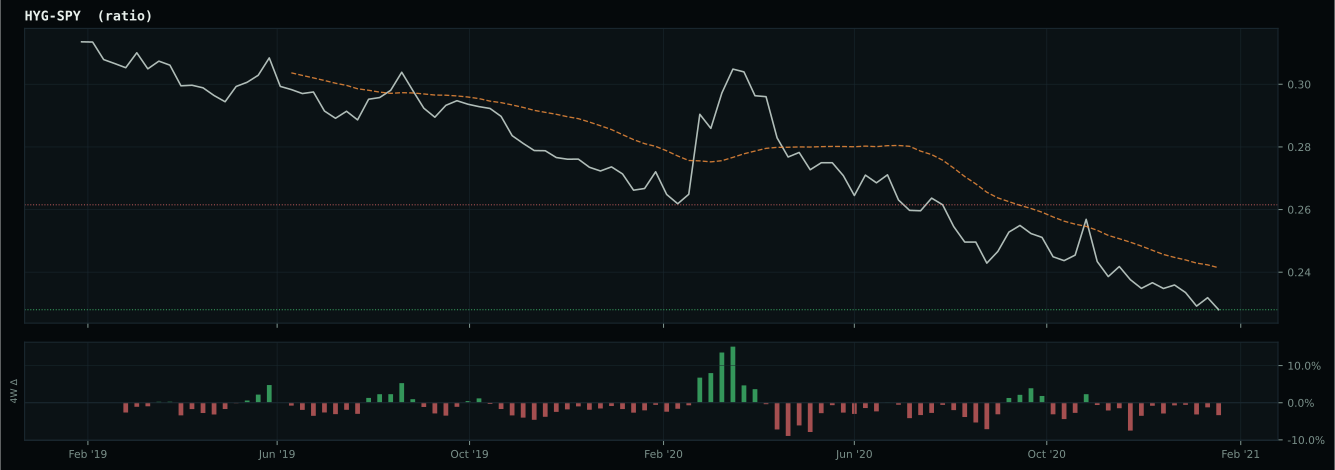
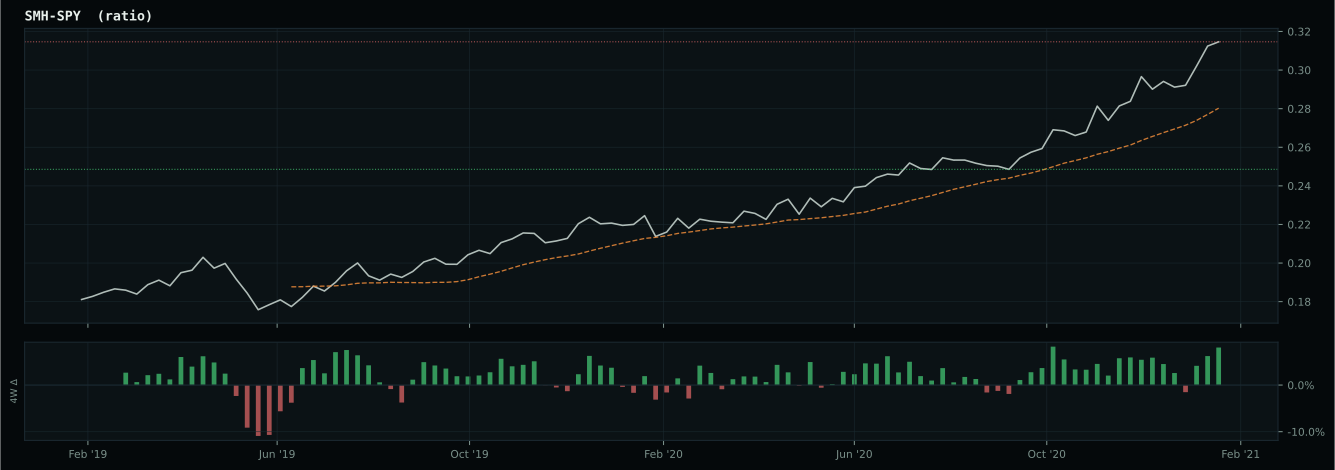
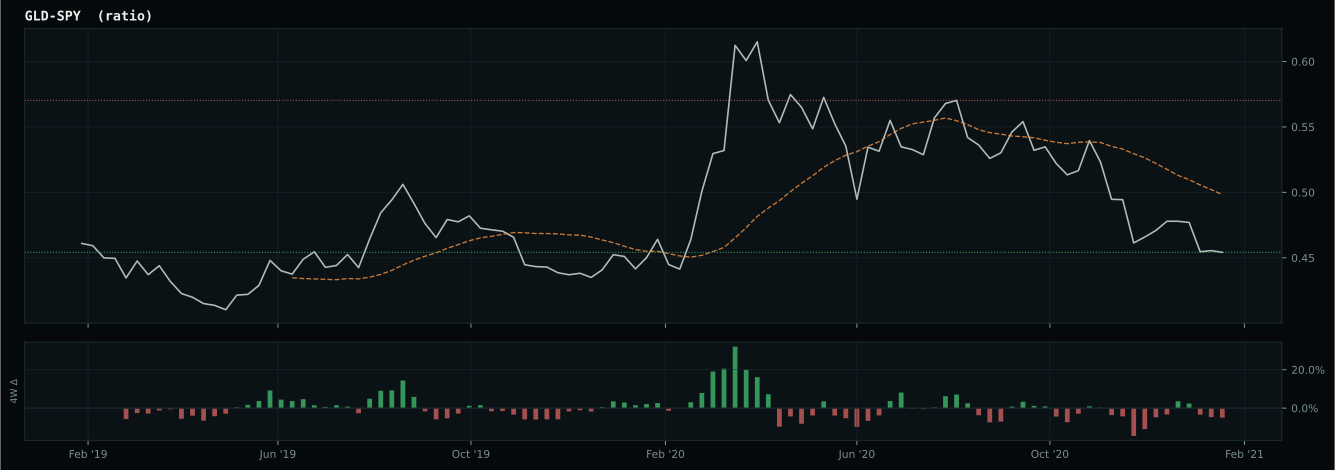
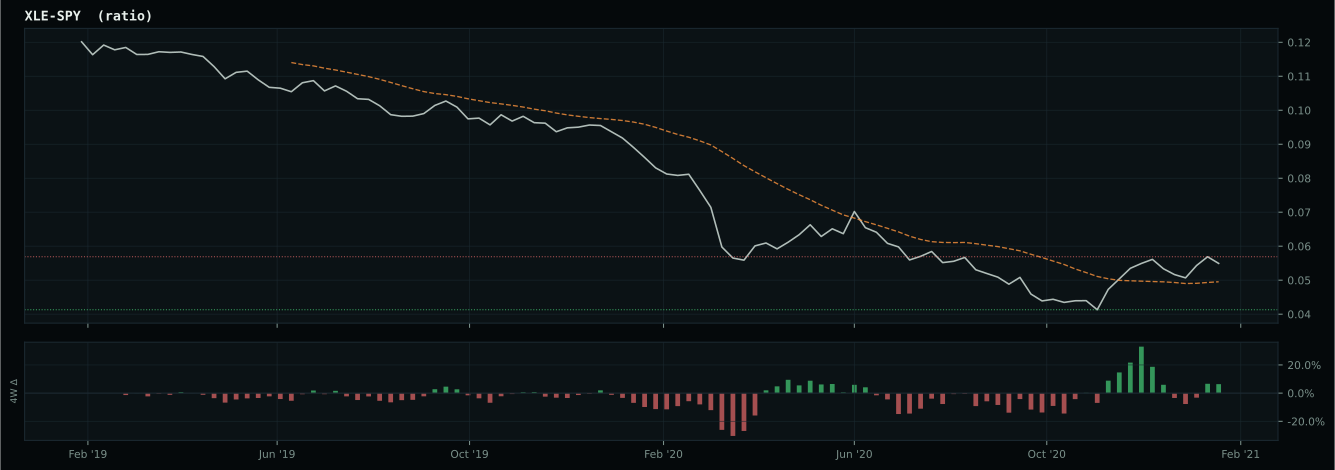
Macro Evidence Charts
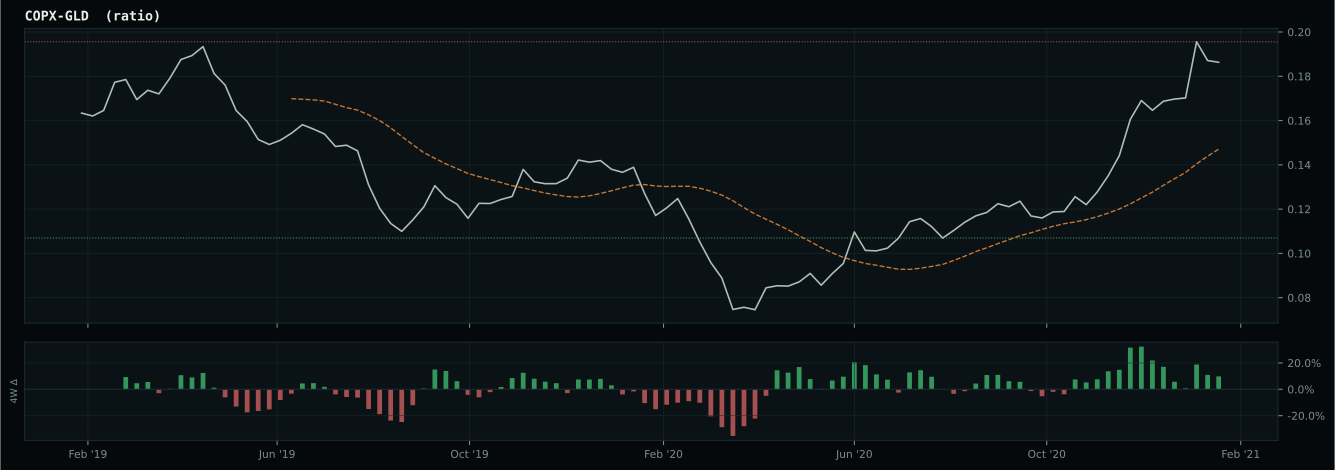
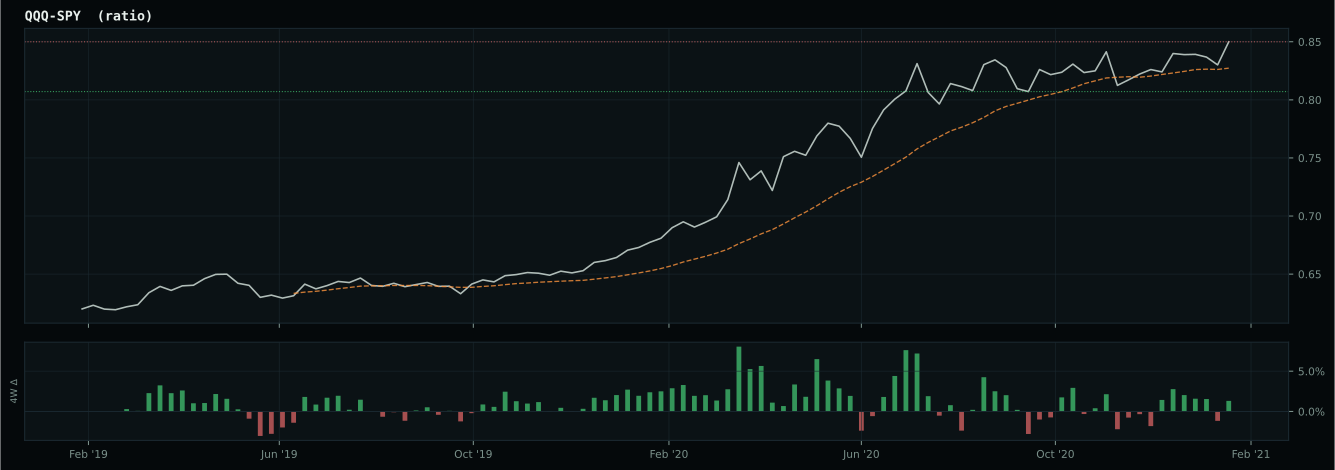
Market-implied signals behind the macro regime scores. Each ratio compares two assets; the direction and slope of the ratio is what the macro engine reads.
Crypto Regime — AltSeason
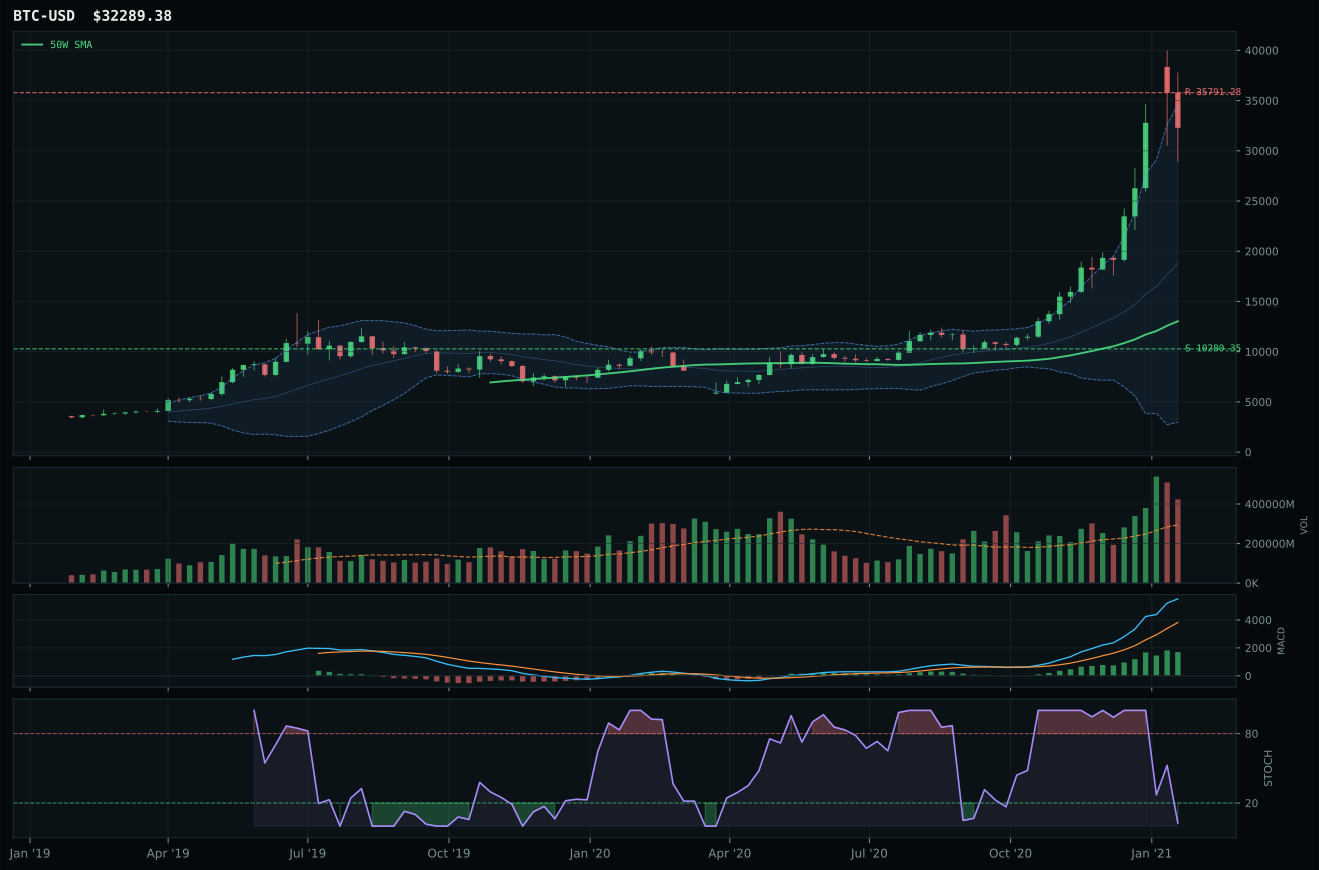
post-touch structure is too wide to count as a range; max/min close ratio is 7.11
TrendBTC confirmed: 2 consecutive closes above rising/flat 50W SMA
all available AltSeason conditions pass; missing optional confirmations skipped

Category Rankings
| Rank | Category | Winner | Score | Alloc | 4W Ret | Peers (4W) |
|---|---|---|---|---|---|---|
| 1 | Industrial Metals | COPX | 81.7 | 20% | +26.05% | REMX +10.9% · PICK +9.5% |
| 2 | Traditional Energy | XOP | 80.9 | 20% | +15.94% | FCG +14.3% · XLE +11.7% |
| 3 | Emerging Markets | IEMG | 63.6 | 10% | -0.24% | ILF -4.1% · INDA +2.7% |
| 4 | AI | SMH | 62.2 | 10% | +3.03% | BOTZ -0.4% · AIQ +3.0% |
| 5 | Agriculture & Livestock | MOO | 59.2 | 10% | +4.70% | WEAT +3.3% · VEGI +5.6% |
| 6 | Technology | XLK | 56.6 | 10% | +0.04% | CIBR -1.7% · IGV +4.1% |
| 7 | Defense & Aerospace | XAR | 53.6 | 10% | +3.67% | ITA +4.2% · ROKT +1.8% |
| 8 | Nuclear Energy | URA | 47.1 | 10% | +22.29% | URNM +33.9% · NLR +1.1% |
| 9 | Utilities & Infrastructure | XLU | 47.1 | 0% | -2.20% | IGF +0.4% · PAVE +1.0% |
| 10 | Precious Metals | GLD | 43.8 | 0% | -3.59% | SLV +6.9% · GDX -6.3% |
Industrial Metals — COPX
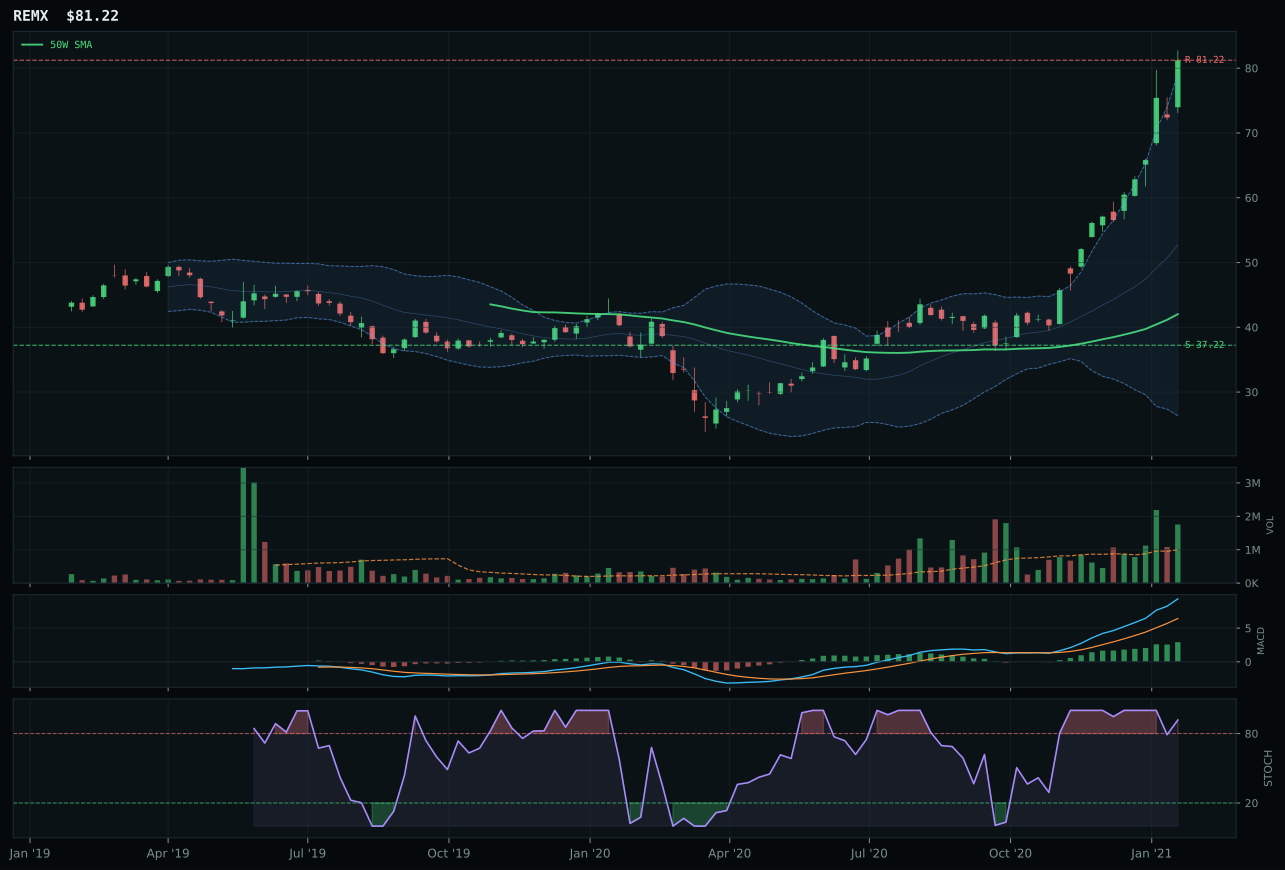
REMX has a vertical extension profile with 86.3% 13-week relative strength versus SPY.
A failed hold above support would weaken the setup.
Actionable but governed by invalidation levels.
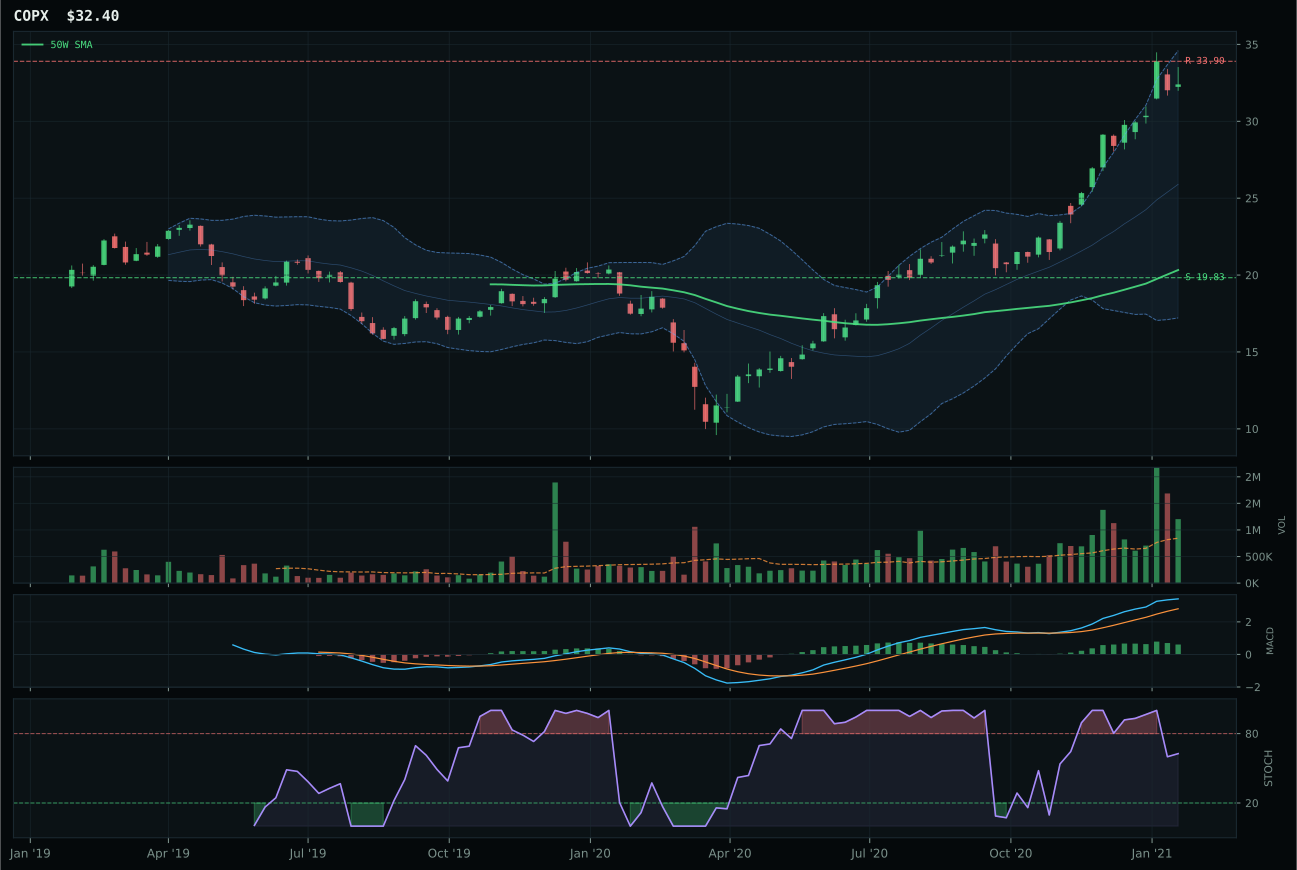
COPX has a vertical extension profile with 33.7% 13-week relative strength versus SPY.
A failed hold above support would weaken the setup.
Actionable but governed by invalidation levels.
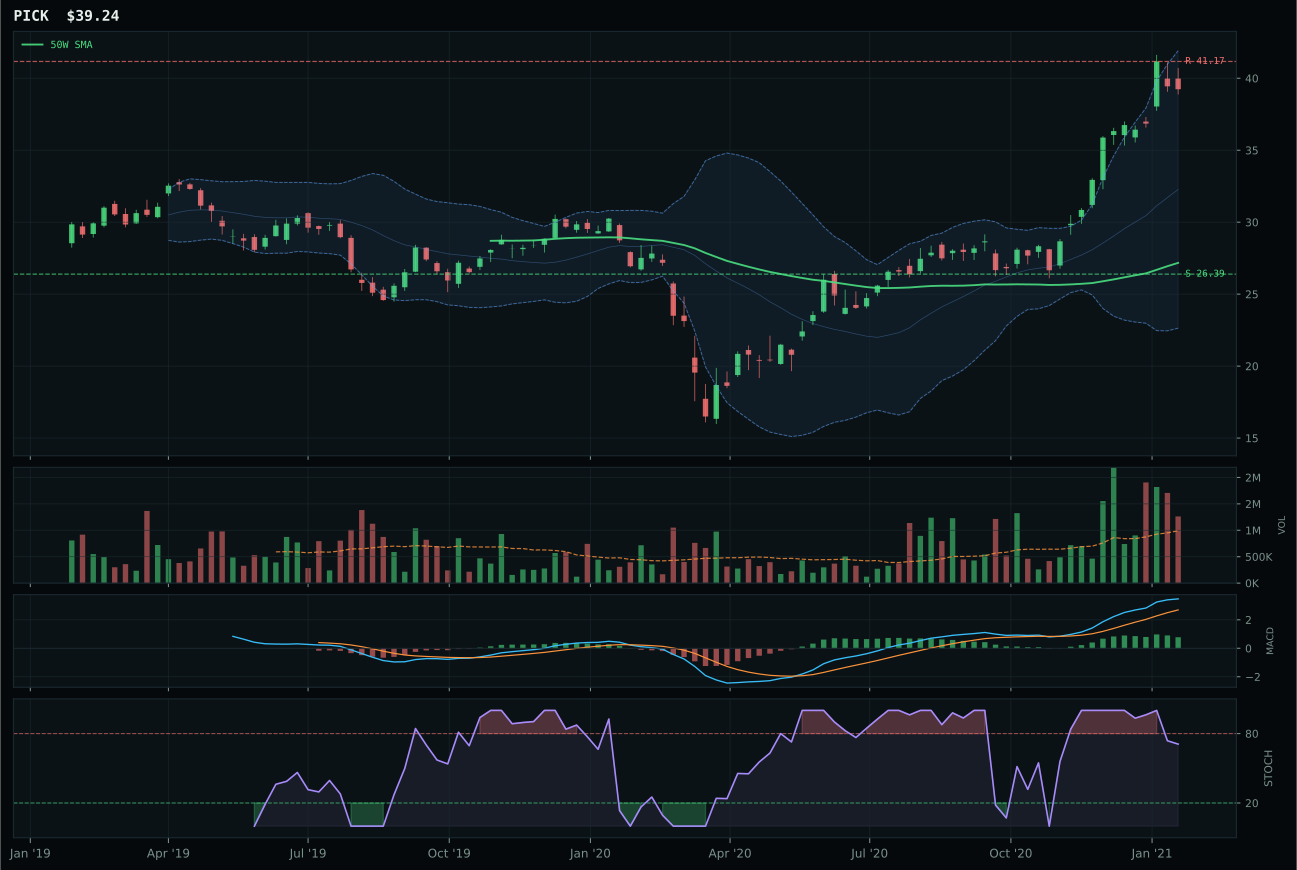
PICK has a vertical extension profile with 27.8% 13-week relative strength versus SPY.
A failed hold above support would weaken the setup.
Actionable but governed by invalidation levels.
COPX earned the top-2 allocation by posting the most persistent technical setup in the entire portfolio: 100.0 trend score, 100.0 momentum confirmation, and 97.0 persistence—meaning relative strength, MACD bull signal, and price above both moving averages have been continuously confirmed week after week without deterioration. Its 44.4% 13-week return with 33.7% SPY-relative strength comes paired with 1.43x volume (above-average participation but not euphoric), suggesting institutional capital is rotating into copper scarcity rather than retail panic-buying. REMX posted higher technical evidence (100.0) but undermined itself with 93.3% extension above the 50-week—so far extended that the risk/reward inverted: only 0.0% upside to resistance versus 63.4% downside to support. COPX, at 59.4% extension, maintains a 63.4% downside buffer, creating an asymmetric setup where the loss if wrong is defined while the win if right remains substantial. The category-level macro fit of 73.0 (metals scarcity +14, commodity breadth +10) provides the conviction that rare earth's momentum (REMX: +97.0% 13-week) is actually a speculative blow-off rather than the disciplined accumulation visible in COPX.
Industrial Metals ranked second overall with a score of 81.7 and earned a top-2 allocation slot of 10%. Category macro fit is strong at 73.0/100, supported by metals scarcity (+14), commodity breadth positive (+10), real-asset sponsorship (+6), and only a modest credit stress headwind (-7). The 3/2/1 weighted basket starts at 82.1 before final validation, and COPX's technical evidence of 76.7/100 provides sufficient conviction to warrant a significant allocation. The macro regime of Transition/Mixed is neutral-to-helpful for industrial metals, as supply-side constraints and inflation pressure support real-asset allocation. However, the risk is real: COPX is 59.4% extended from the 50W with only 38.3% risk-reward (upside compressed to -4.4% vs downside of 63.4%). The 10% allocation reflects the strength of the copper scarcity narrative and the category's rank, but it is a contested position; if COPX closes below support at 19.83 or macro risks deteriorate, this allocation would shrink immediately to make room for later-cycle setups.
Traditional Energy — XOP
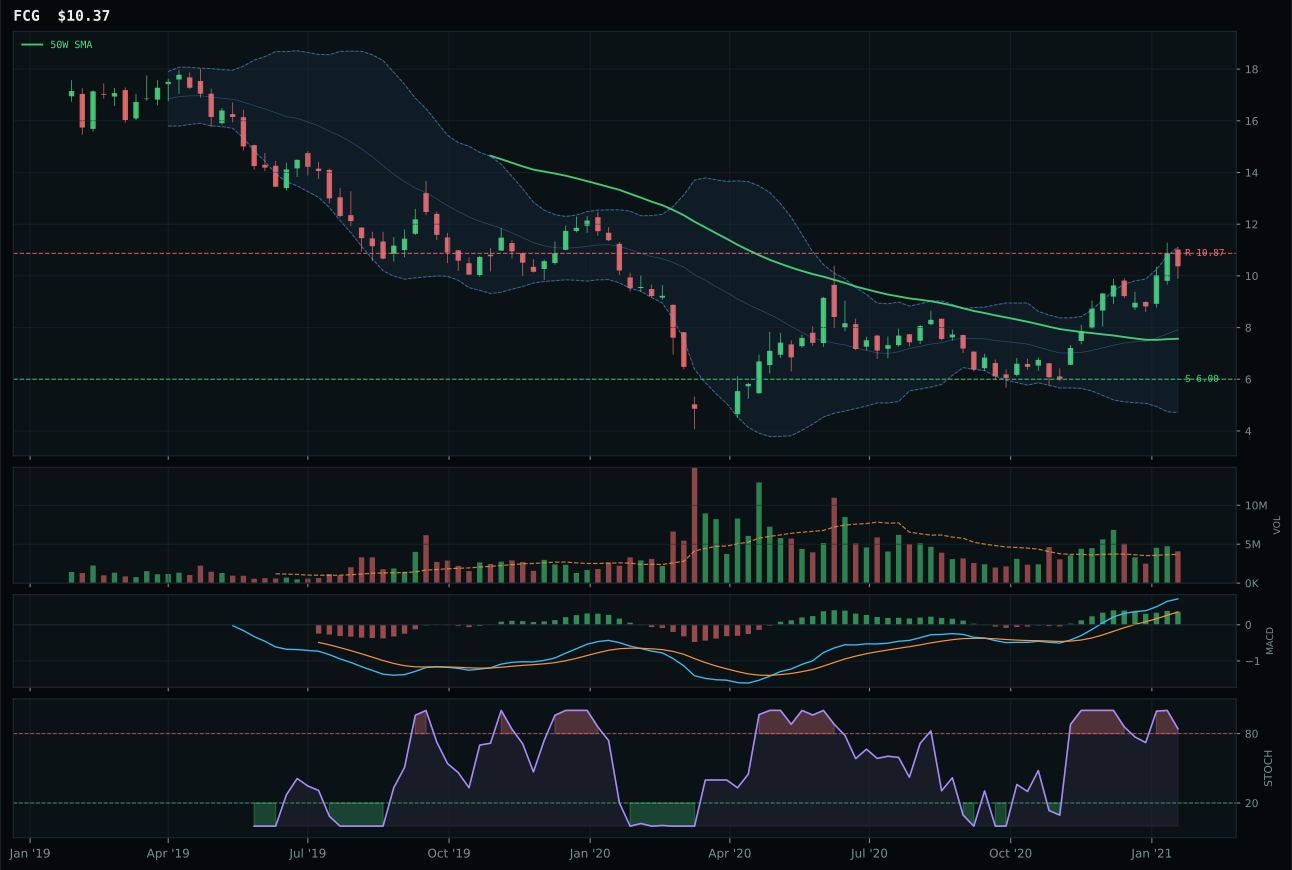
FCG has a vertical extension profile with 42.9% 13-week relative strength versus SPY.
A failed hold above support would weaken the setup.
Actionable but governed by invalidation levels.
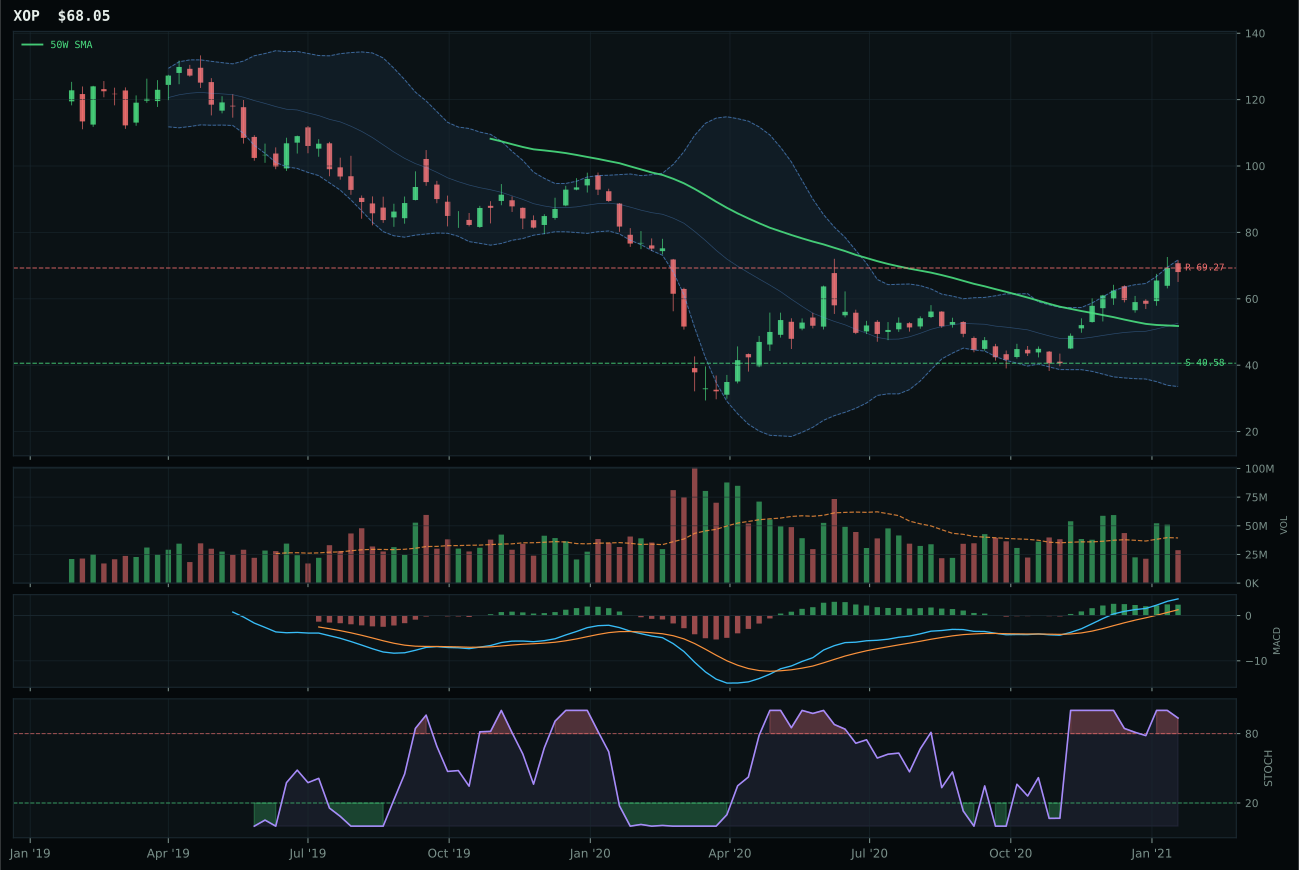
XOP has a vertical extension profile with 40.8% 13-week relative strength versus SPY.
A failed hold above support would weaken the setup.
Actionable but governed by invalidation levels.
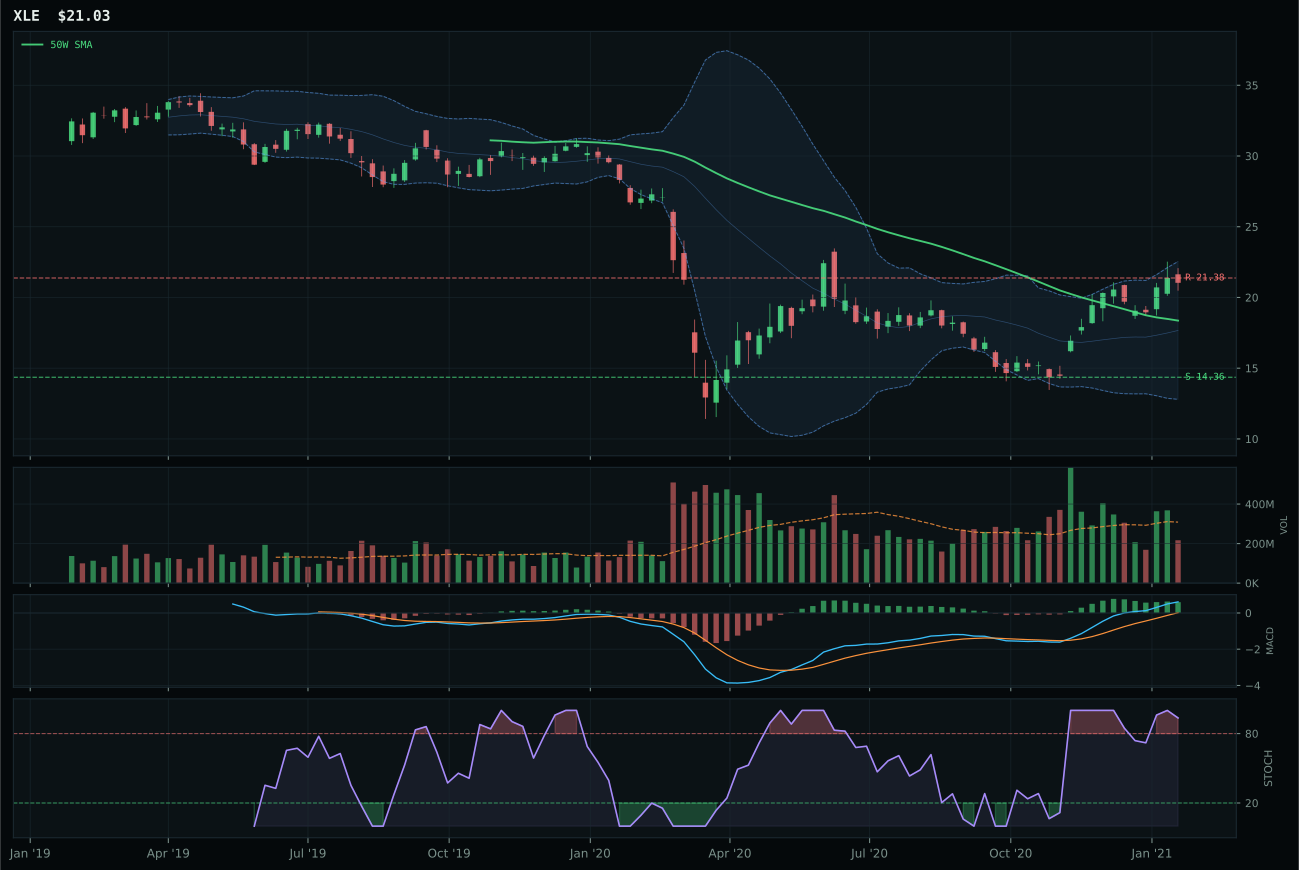
XLE has a neutral structure profile with 27.7% 13-week relative strength versus SPY.
A failed hold above support would weaken the setup.
Actionable but governed by invalidation levels.
XOP earned top-2 status by posting the highest SPY-relative strength in its category basket (40.8%) while delivering 51.5% 13-week returns—a performance that matters because it proves XOP's move is not just riding the SPY rally but outrunning the broader index by 40 full percentage points. FCG posted technically superior evidence (83.0 vs 58.4) with 42.9% SPY-relative strength and 53.6% 13-week performance, but it sits 39.5% above its 50-week moving average versus XOP's 31.4%, meaning FCG has already priced the entire energy move while XOP still carries cyclical optionality. Both feature bullish and improving MACD and overbought stochastic momentum, but XOP's thin participation (0.73x volume) suggests selective institutional buying rather than FCG's above-average participation, which often precedes momentum exhaustion. The category-level macro fit of 85.0 is the highest among all 10 categories: energy scarcity (+16), inflation pressure (+10), supply shortage (+9)—a trifecta that validates XOP's relative weakness versus FCG is actually patience, not failure.
Traditional Energy scored 80.9 and earned the second top-2 allocation slot at 10%, ranking just behind Industrial Metals at 81.7. Category macro fit is exceptional at 85.0/100, driven by energy scarcity (+16), inflation pressure (+10), supply shortage (+9), and real-asset sponsorship (+7)—only a modest credit stress headwind (-7) tempers the conviction. This is the strongest macro tailwind in the entire portfolio for this week, reflecting the geopolitical and supply-side reality of tight energy. XOP's technical evidence of 58.4/100 is weaker than its industrial-metals peer COPX (76.7), and risk-reward is compressed (30.5/100) with only -1.8% upside to resistance versus 67.7% downside to support. This is not a comfortable setup, but the macro sponsorship is so strong that the allocator is willing to accept it. The 10% allocation is the maximum prudent commitment; any deterioration in energy scarcity narratives or macro risk-off would require immediate reduction. The category is held for its AltSeason energy narrative and real-asset sponsorship, not for technical beauty.
Emerging Markets — IEMG
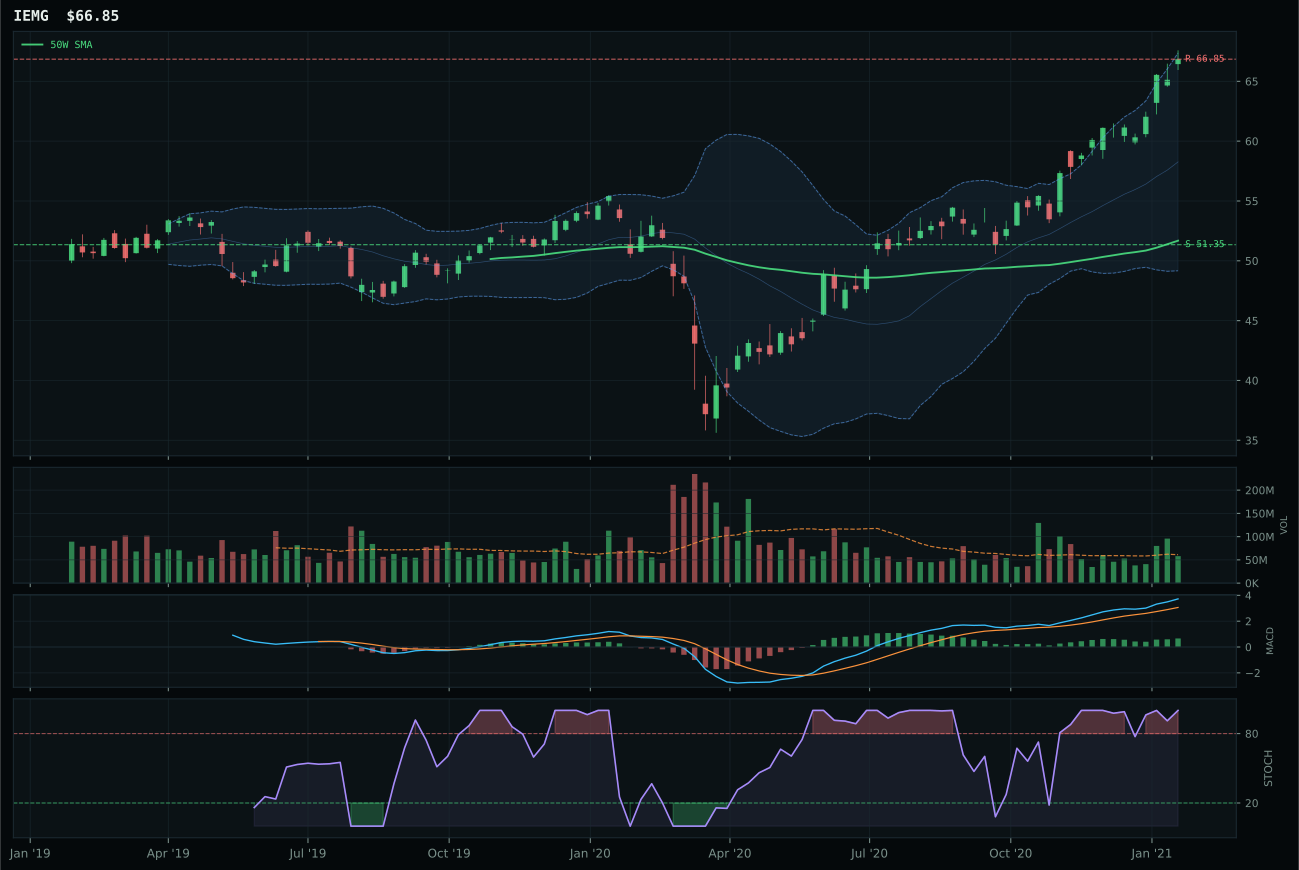
IEMG has a vertical extension profile with 9.9% 13-week relative strength versus SPY.
A failed hold above support would weaken the setup.
Actionable but governed by invalidation levels.
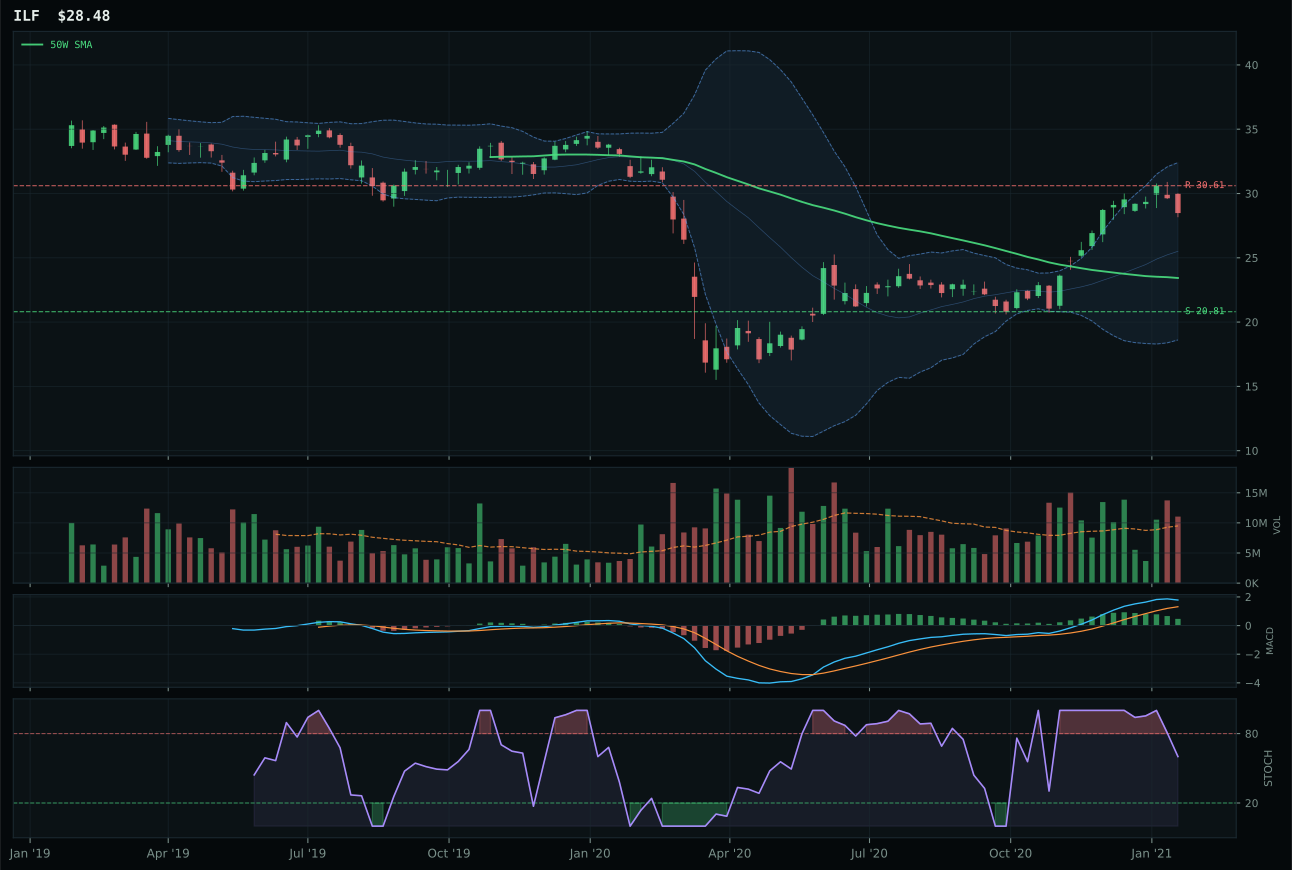
ILF has a vertical extension profile with 13.8% 13-week relative strength versus SPY.
A failed hold above support would weaken the setup.
Actionable but governed by invalidation levels.
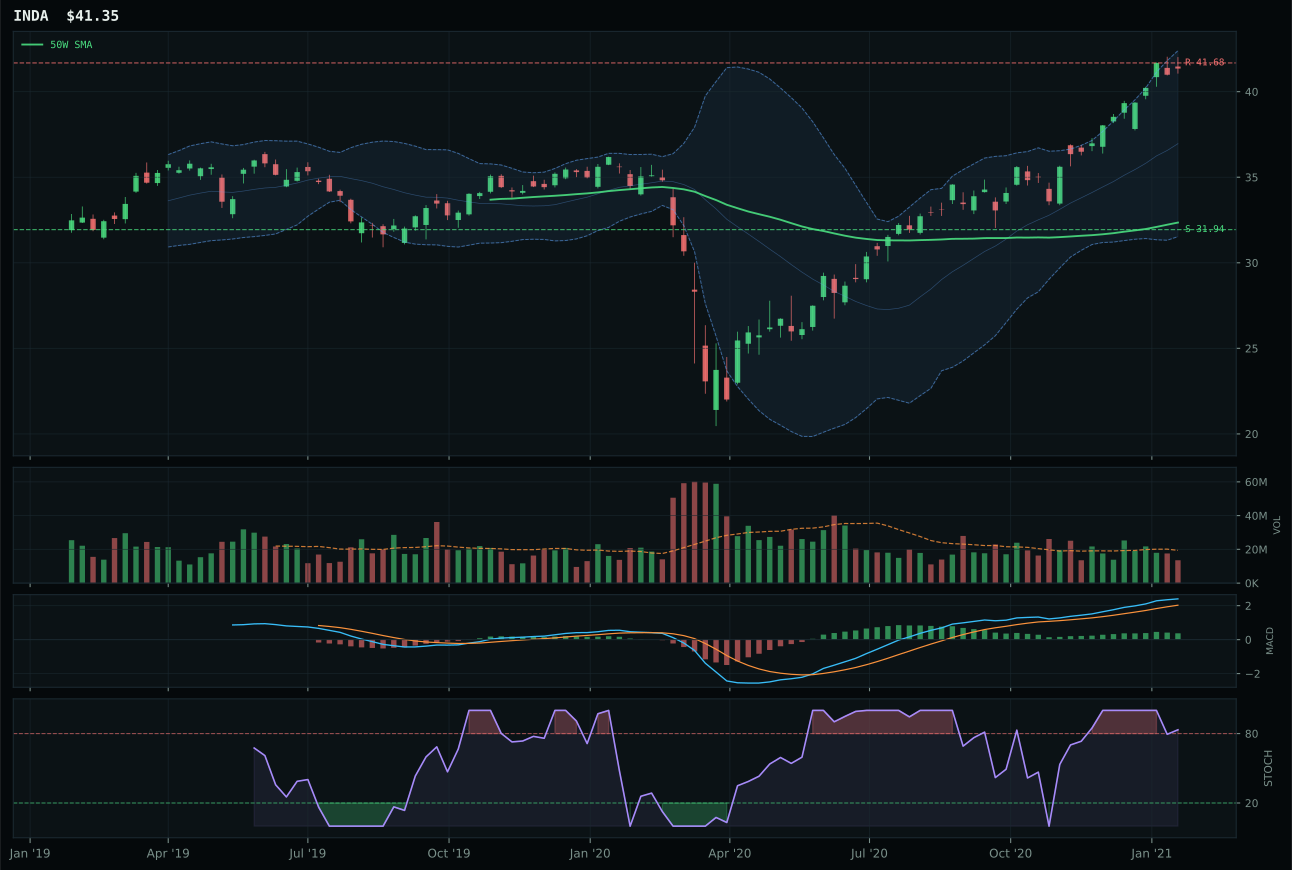
INDA has a vertical extension profile with 7.4% 13-week relative strength versus SPY.
A failed hold above support would weaken the setup.
Actionable but governed by invalidation levels.
IEMG won Emerging Markets narrowly over ILF (by just 1.3 points) by virtue of superior MACD confirmation: bullish and improving versus ILF's bullish but flattening. Both sit in vertical extension at 29-30% above their 50-week moving averages with perfect 100.0 trend scores and 100.0 momentum confirmation, but IEMG's 20.6% 13-week return, 9.9% SPY-relative strength, and overbought stochastic RSI (1.00) versus ILF's falling/neutral reading (0.58) reveal that IEMG's buyers have more conviction. ILF's 24.5% 13-week return and 13.8% SPY-relative strength are superior on paper, but the MACD deterioration and volume weakness (above-average participation) signal rollover risk. Both offered identical 80.0+ structure scores, but IEMG's neutral volume (0.95x) provided better orderliness than ILF's above-average participation—a subtle but critical difference when timing a momentum peak. The 1.3-point gap understates the technical advantage: IEMG is building while ILF is already fading.
Emerging Markets scored 63.6, ranking fifth among ten categories, and received 5% allocation. Category macro fit is 62.0/100, driven by EM liquidity support (+14) and risk appetite (+8), partially offset by credit stress (-10). The category's score is respectable but trails the top four by meaningful margins, reflecting a mixed setup where broad EM beta is accumulating (IEMG) but with limited conviction. IEMG's technical evidence of 66.8/100 is decent, with perfect trend (100.0) and momentum confirmation (100.0) offset by weak timing (37.0) due to 29.3% extension and mediocre risk-reward (41.8/100). The 5% allocation reflects the EM liquidity support in the current AltSeason regime, but the extended setup and lack of top-2 ranking mean this is a tactical hold rather than a conviction position. Any deterioration in the EM liquidity narrative or rotation toward risk-off would require immediate reduction; conversely, a pullback into the 50W with improving stochastic would warrant rotation capital.
AI — SMH
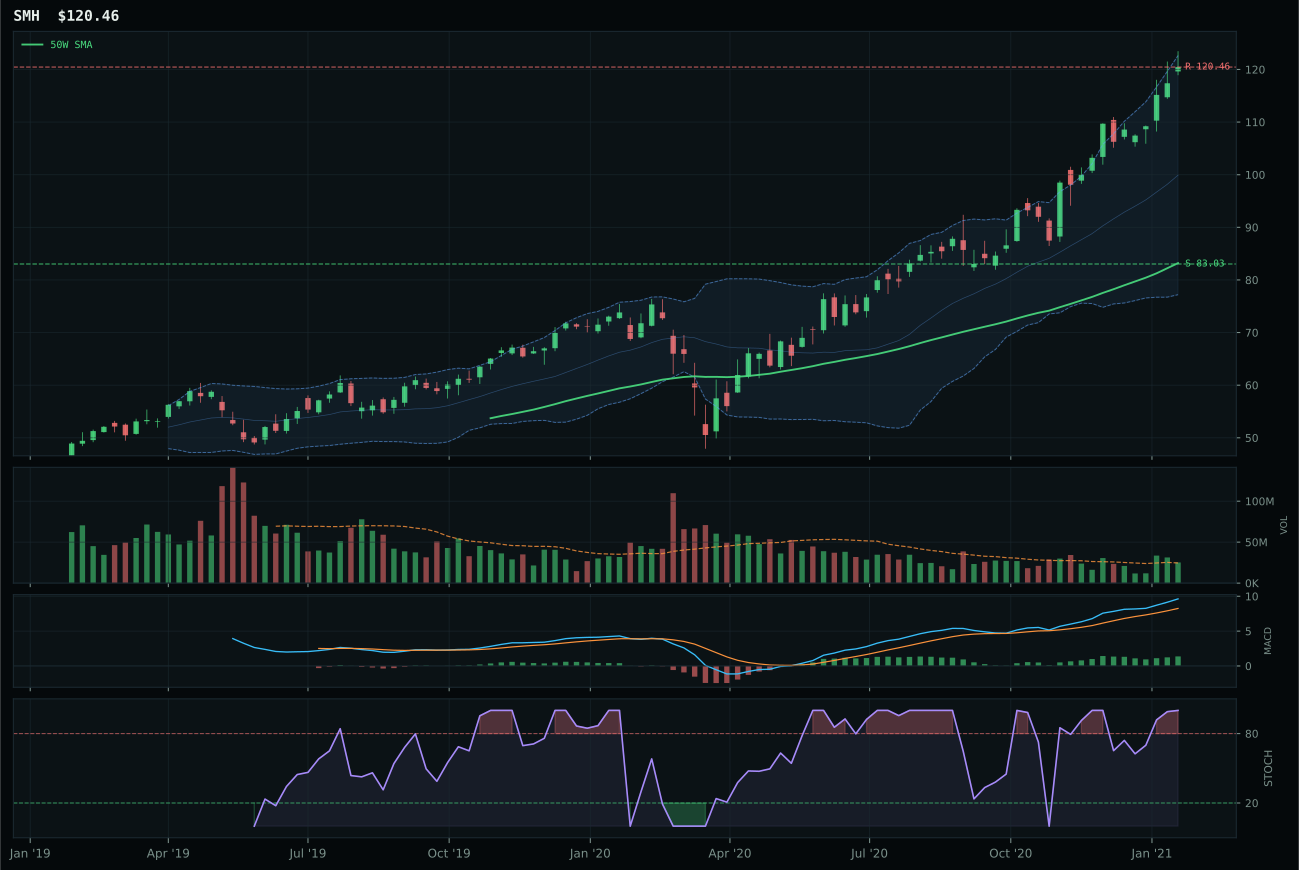
SMH has a vertical extension profile with 20.2% 13-week relative strength versus SPY.
A failed hold above support would weaken the setup.
Actionable but governed by invalidation levels.
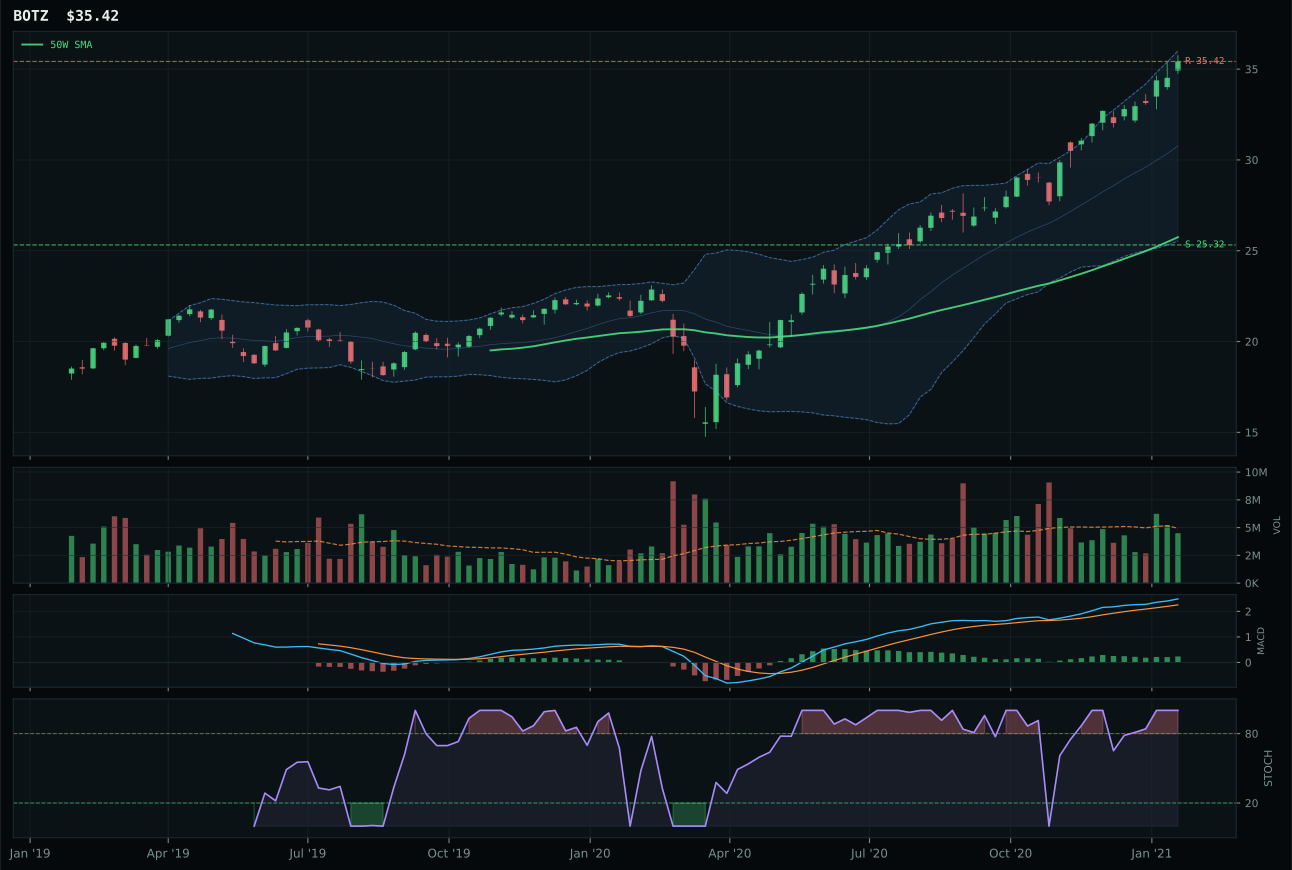
BOTZ has a vertical extension profile with 11.2% 13-week relative strength versus SPY.
A failed hold above support would weaken the setup.
Actionable but governed by invalidation levels.
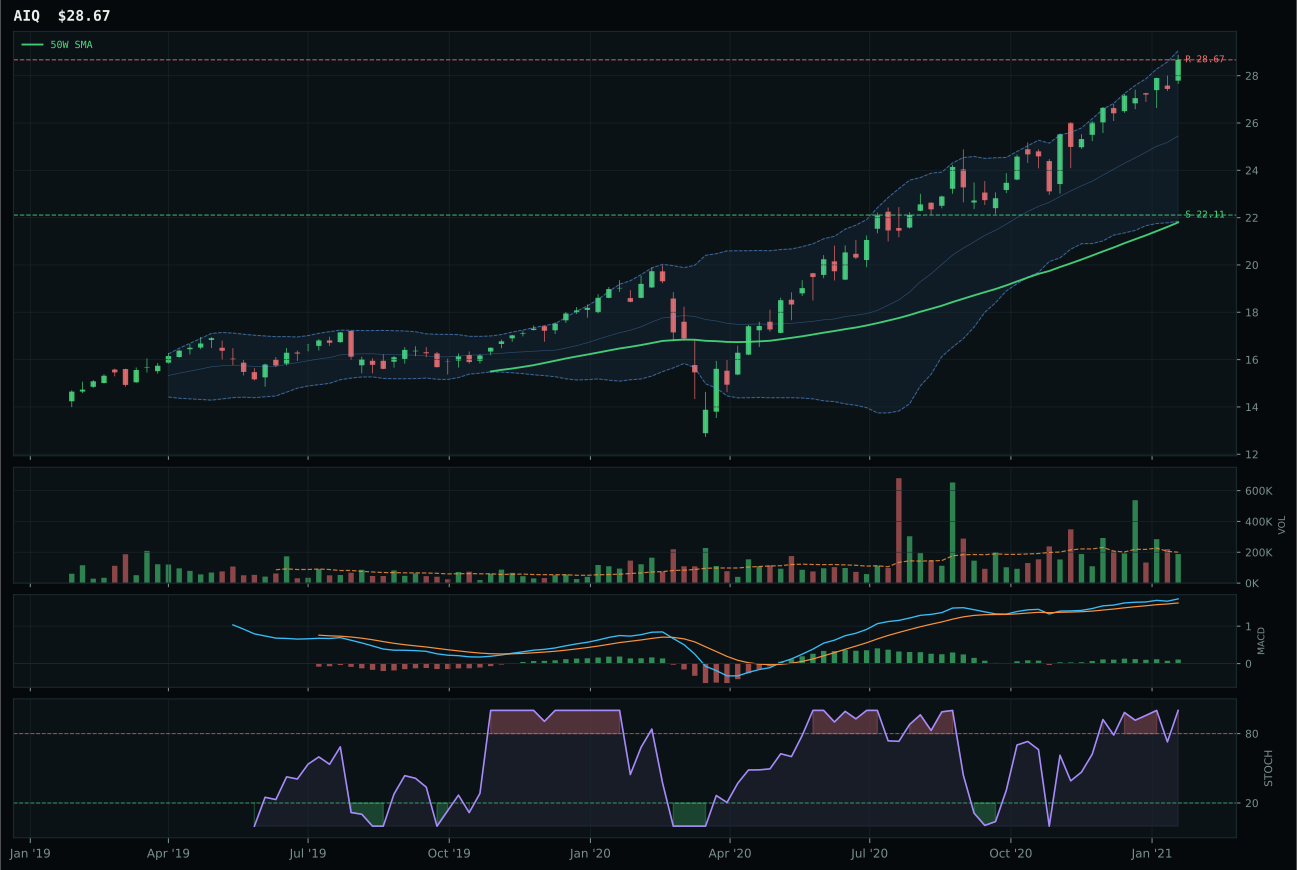
AIQ has a vertical extension profile with 5.9% 13-week relative strength versus SPY.
A failed hold above support would weaken the setup.
Tracked, but not top-2 eligible because: .
SMH won AI by delivering 20.2% SPY-relative strength—the highest in its three-ETF basket—paired with flawless momentum confirmation: 30.9% 13-week return, bullish and improving MACD, and perfect 100.0 momentum confirmation score despite sitting at the overbought extreme. BOTZ posted identical trend and timing scores but underperformed critically on category-relative strength, posting 0.0% versus SMH's 9.0%, which reveals that buyers are actively rotating into semiconductor compute infrastructure while robotics cycles sideways. Volume at 1.02x the 20-week average provides neutral confirmation—not spectacular, but enough to validate that this 44.8% extension above the 50-week is being accumulated by real institutions rather than squeezed in by retail. The 1.2-point gap between SMH and BOTZ understates the quality difference: SMH's composition into chip leadership during an AI boom carries architectural advantage over BOTZ's mechanical cyclicality.
AI scored 62.2 and received 5% allocation as the third-highest category after the two top-2 slots, reflecting strong technical evidence (72.2 for SMH reasoned) and macro fit (68.0/100). The active AI growth sponsorship descriptor provides +14 tailwinds, supported by risk appetite and inflation pressure dynamics. However, the category did not reach top-2 status because both Industrial Metals (81.7) and Traditional Energy (80.9) posted stronger composite scores with better risk-reward setup and less extension risk. SMH's 44.8% distance from the 50-week average signals that every new buyer is late to the party, despite perfect momentum confirmation. The allocation is maintained at 5% as an alt-season hedge and a real-options bet on continued AI sponsorship, but the extended setup and macro transitions warrant restraint until either a pullback for accumulation or a clear breach higher confirms continuation.
Agriculture & Livestock — MOO
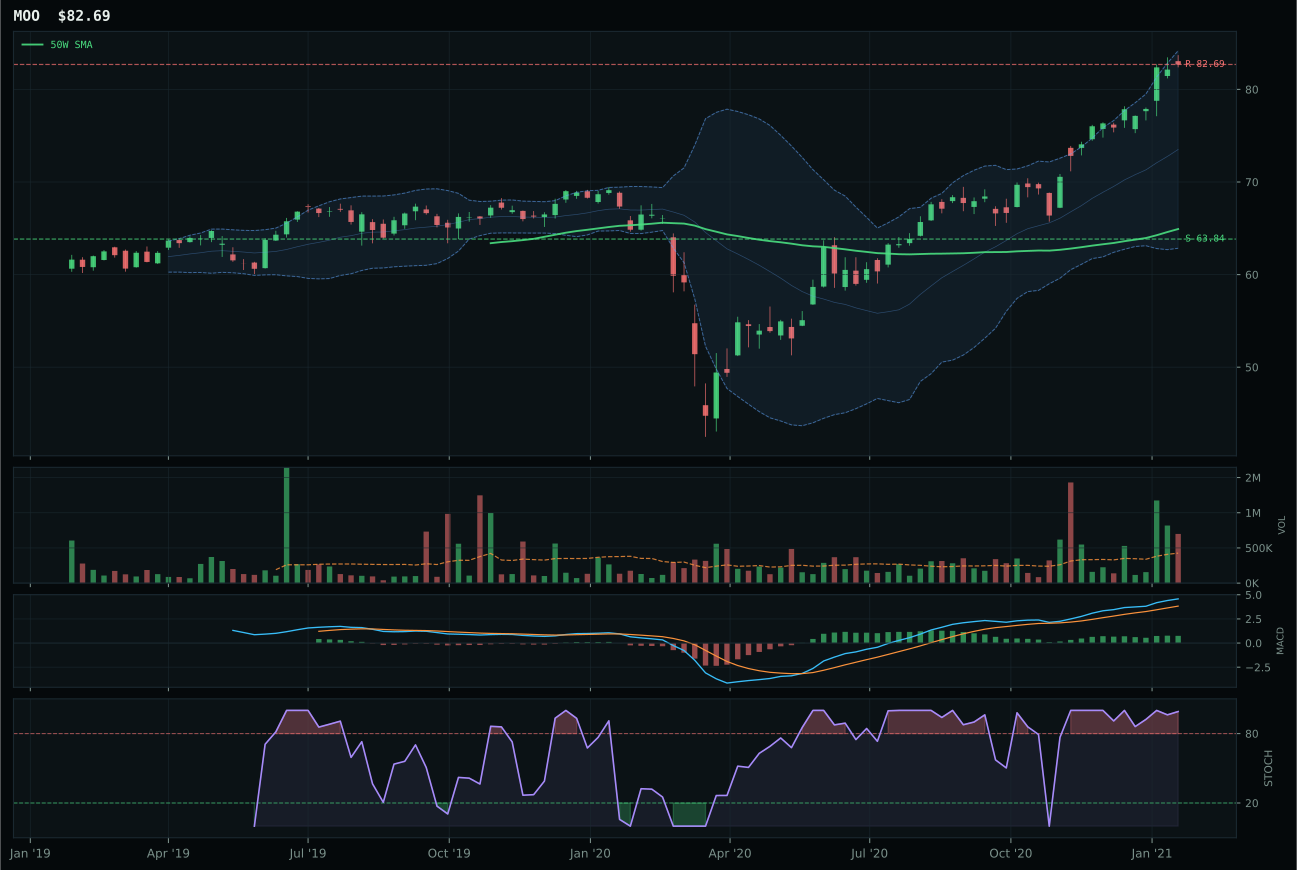
MOO has a vertical extension profile with 8.6% 13-week relative strength versus SPY.
A failed hold above support would weaken the setup.
Actionable but governed by invalidation levels.
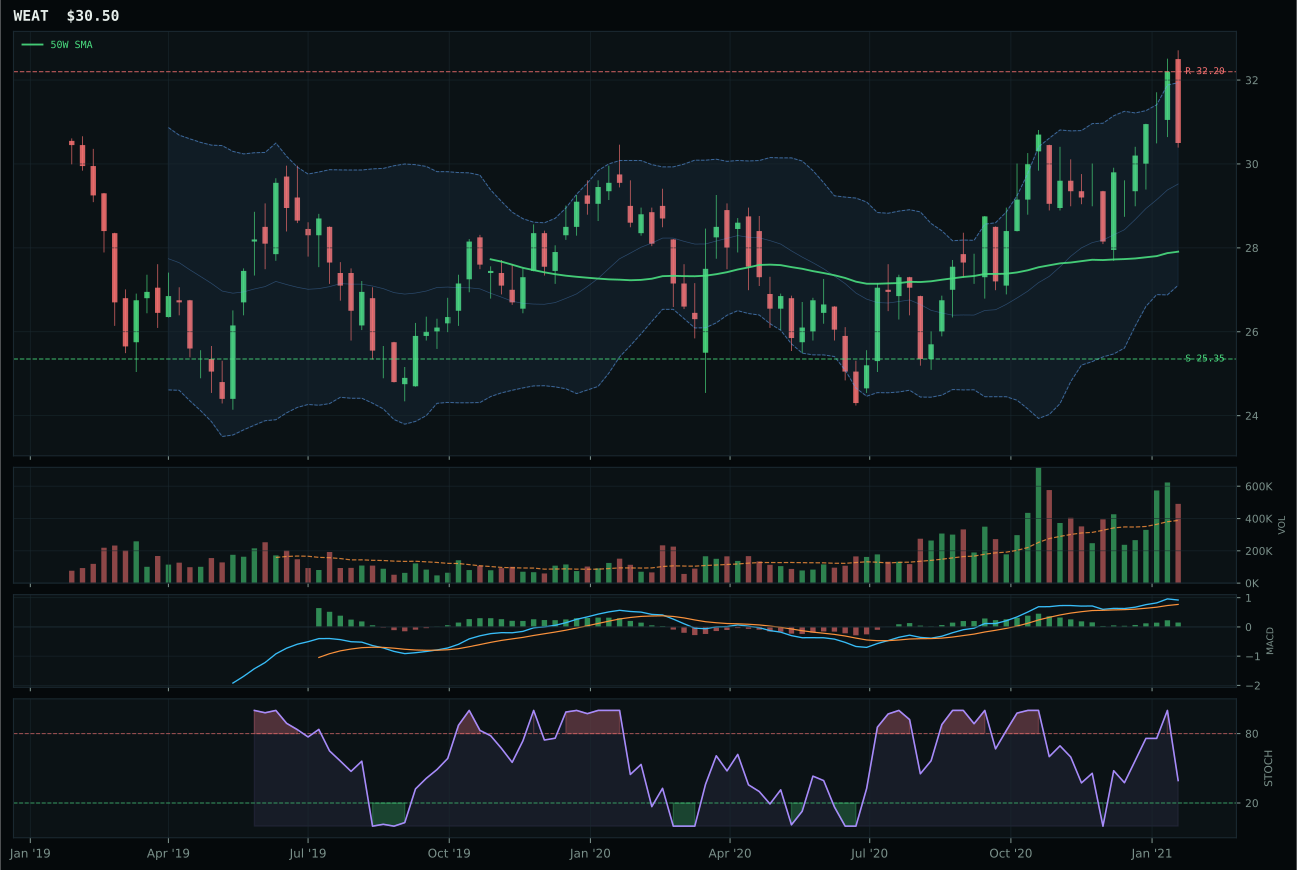
WEAT has a neutral structure profile with -11.4% 13-week relative strength versus SPY.
A failed hold above support would weaken the setup.
Actionable but governed by invalidation levels.
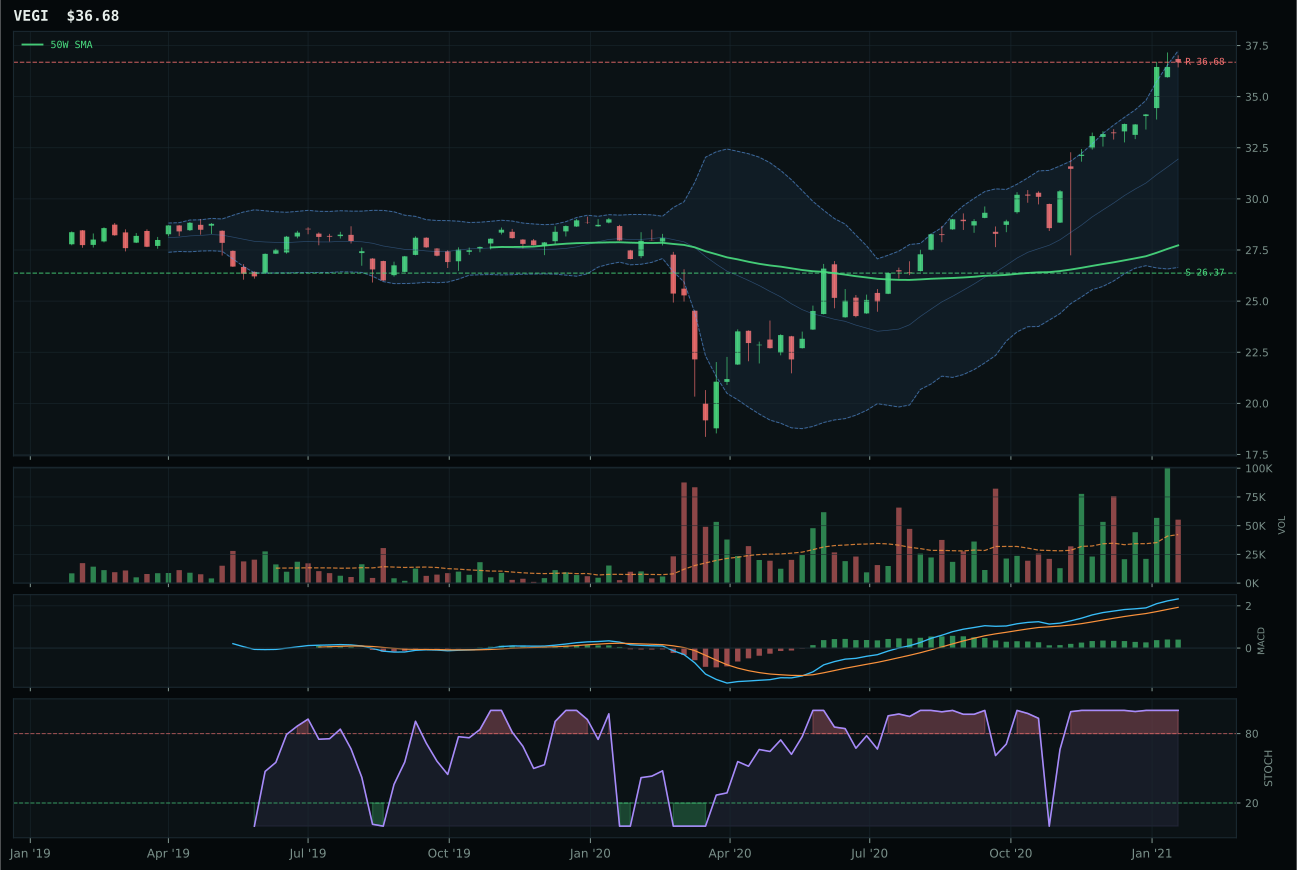
VEGI has a vertical extension profile with 11.1% 13-week relative strength versus SPY.
A failed hold above support would weaken the setup.
Tracked, but not top-2 eligible because: .
MOO dominated Agriculture & Livestock with the highest structure score in the entire portfolio (86.6/100) and genuine volume-price confirmation at 1.64x the 20-week average—actual accumulation rather than the hollow momentum visible in most extended equities. With 19.3% 13-week returns, 8.6% SPY-relative strength, and perfect 100.0 momentum confirmation, MOO married capital flow evidence to technical structure: MACD is bullish and improving, stochastic RSI sits at 0.99 overbought, and the risk/reward reads 46.9/100, meaning there's 29.5% of downside protection before support at 63.84 is tested. WEAT's -11.4% SPY-relative strength and -0.7% 13-week return represent outright failure to participate in the category's strength, while its structure deteriorated to 76.0 and volume confirmation weakened to above-average participation—the hallmark of momentum exhaustion. The 5.3-point category gap reflects MOO's status as the genuine accumulation vehicle while WEAT remains a sideways consolidation.
Agriculture & Livestock scored 59.2, ranking fourth and receiving 5% allocation. Category macro fit is exceptional at 86.0/100—the highest among all ten categories—driven by four active descriptors: supply shortage (+13), inflation pressure (+10), real-asset sponsorship (+8), and commodity breadth positive (+5). This strong macro alignment pushed the category into the conversation, but Industrial Metals and Traditional Energy still rank higher on pure technical composite scores (81.7 and 80.9 vs 59.2). MOO's setup is extended at 27.4% from the 50W, and its risk-reward (46.9/100) is acceptable but not exceptional; every buyer here is participating in a scarcity trade, not a value accumulation. The 5% allocation reflects confidence in the supply-shortage macro thesis and MOO's clean volume confirmation, but the lack of top-2 ranking means this remains a supporting position in the real-asset basket rather than a core conviction.
Technology — XLK
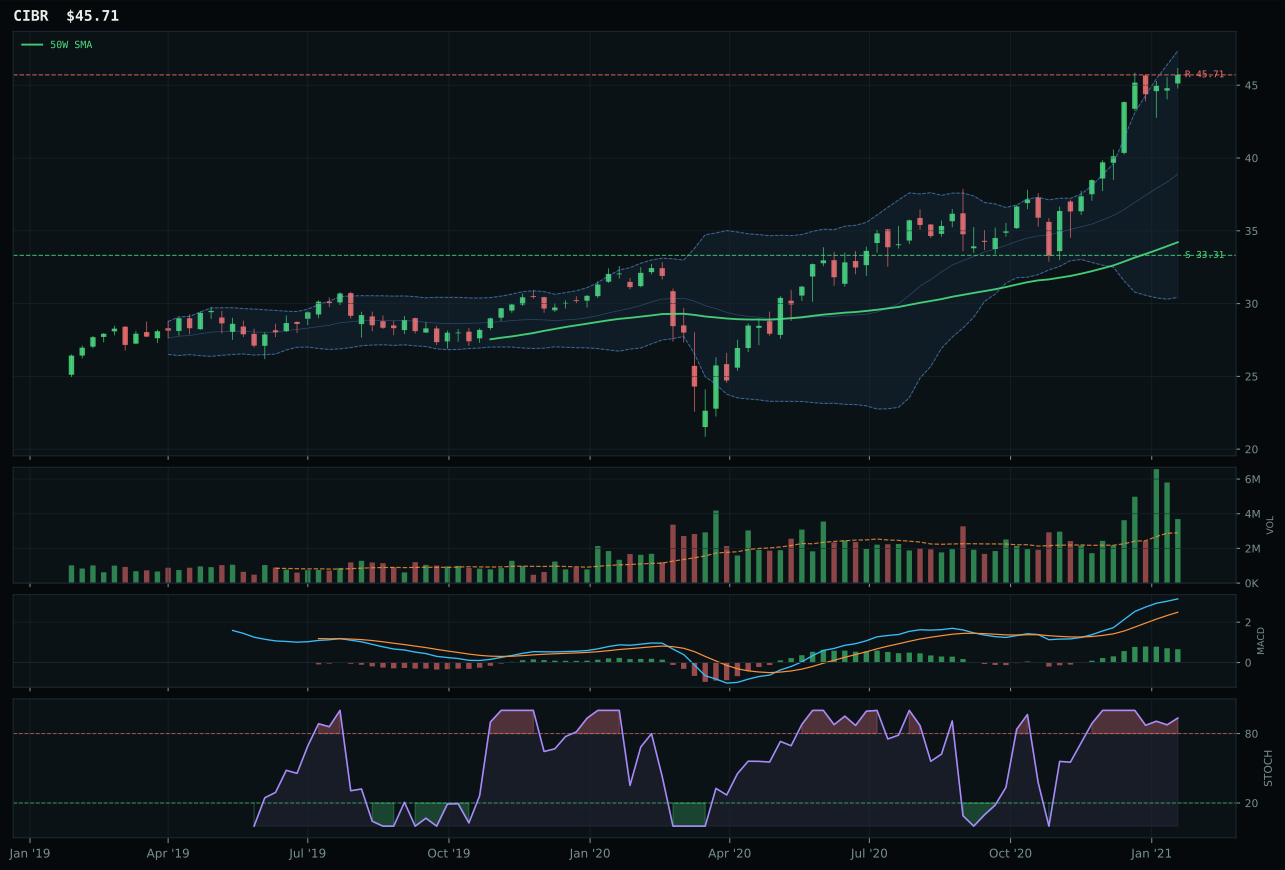
CIBR has a vertical extension profile with 16.6% 13-week relative strength versus SPY.
A failed hold above support would weaken the setup.
Actionable but governed by invalidation levels.
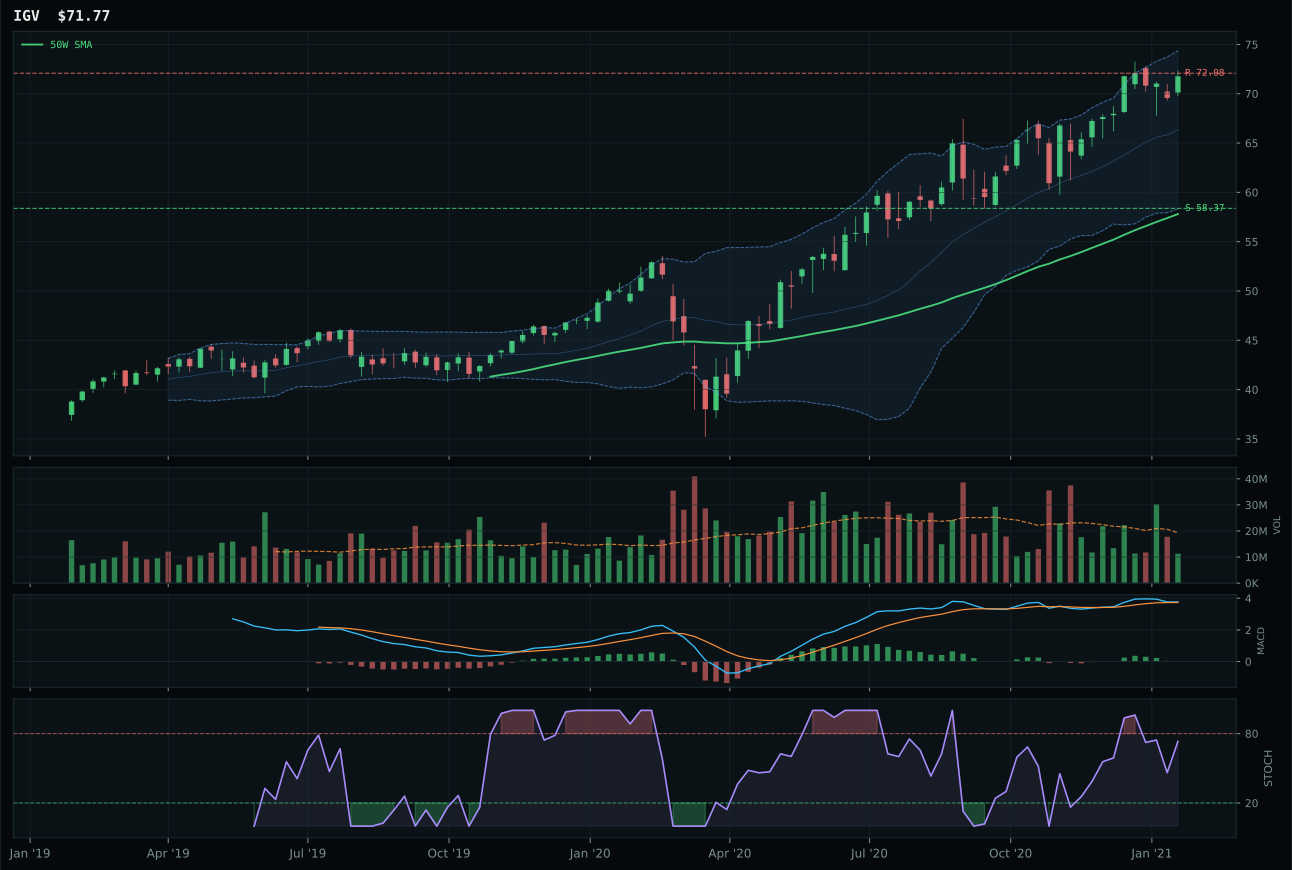
IGV has a vertical extension profile with -1.1% 13-week relative strength versus SPY.
A failed hold above support would weaken the setup.
Actionable but governed by invalidation levels.
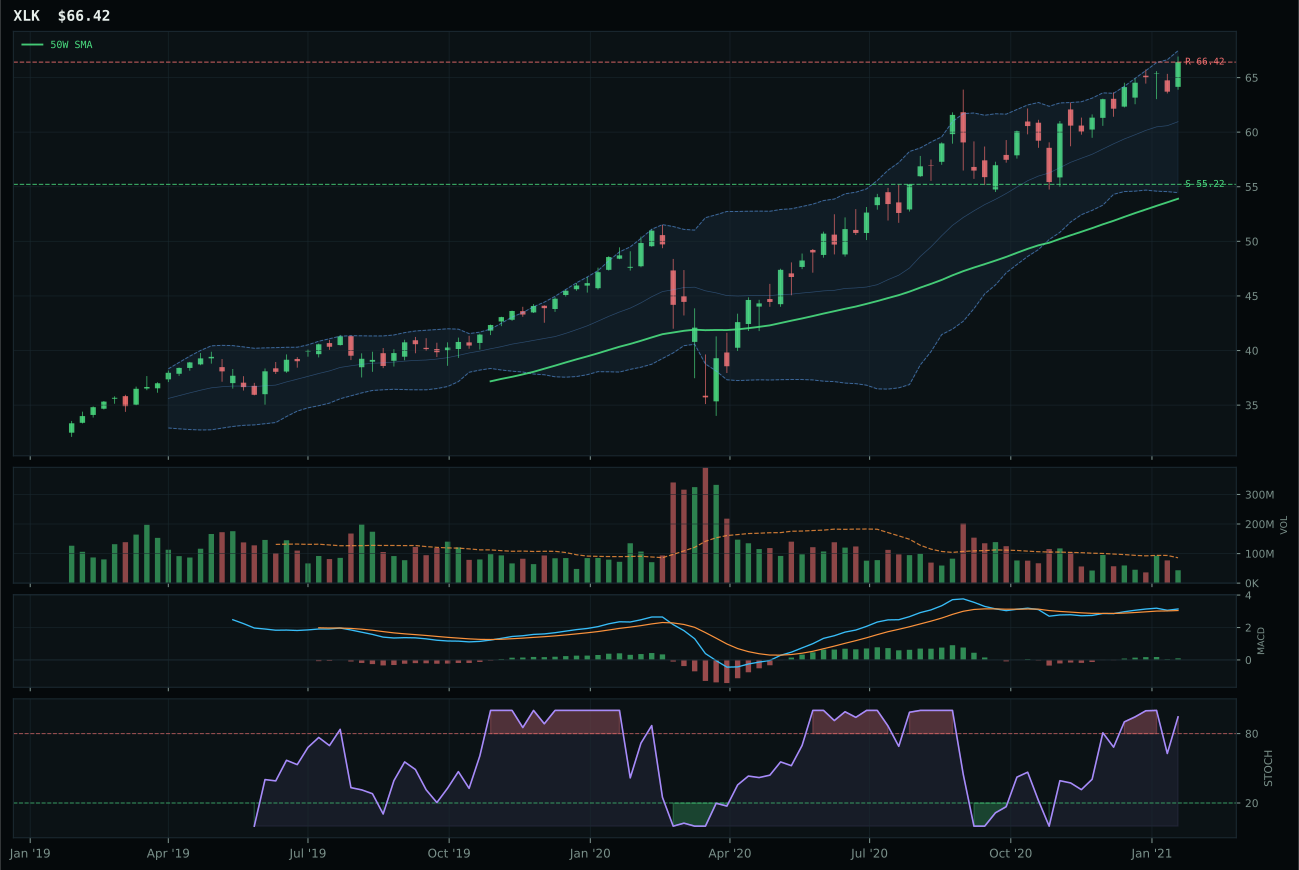
XLK has a vertical extension profile with 1.4% 13-week relative strength versus SPY.
A failed hold above support would weaken the setup.
Actionable but governed by invalidation levels.
XLK won the category by holding the cleaner technical structure despite being the least extended of its three-ETF peer group. While CIBR posted a stunning 27.3% 13-week return with 16.6% SPY-relative strength, it sat 33.6% above the 50-week moving average—a 10-point extension penalty that XLK avoided at 23.2% distance. XLK's 12.1% 13-week return paired with neutral category-relative strength suggests it's capturing profitable technology leadership without the speculative excess that has already priced in CIBR's cybersecurity narrative. Both charts sit in vertical extension with bullish but flattening MACD and overbought stochastic RSI readings, but XLK's 0.51x volume participation—while thin—represents orderly accumulation rather than the kind of above-average participation that often precedes momentum reversals. The 3.2-point score gap reflects a clear technical hierarchy: timing matters more than raw momentum when every fresh buyer in the extended names is arriving late.
Technology earned 5% allocation because it ranked fifth among ten categories with a composite score of 56.6, well below the two top-2 slots (Industrial Metals at 81.7 and Traditional Energy at 80.9). The category macro fit of 54.0/100 reflects mixed sponsorship: AI growth and risk appetite are active tailwinds, but credit stress and inflation pressure are headwinds that prevent conviction. The real problem is setup quality—all three ETFs display vertical extension into the 52-week high zone, leaving no margin for either continuation or mean reversion. Extended positioning, thin volume confirmation, and a timing score of only 22.0/100 for the representative signal that while trend is intact, the risk-reward has deteriorated enough to warrant a small holding rather than rotation capital. XLK is held defensively pending a pullback into the 50-week or a true volume accumulation signal.
Defense & Aerospace — XAR
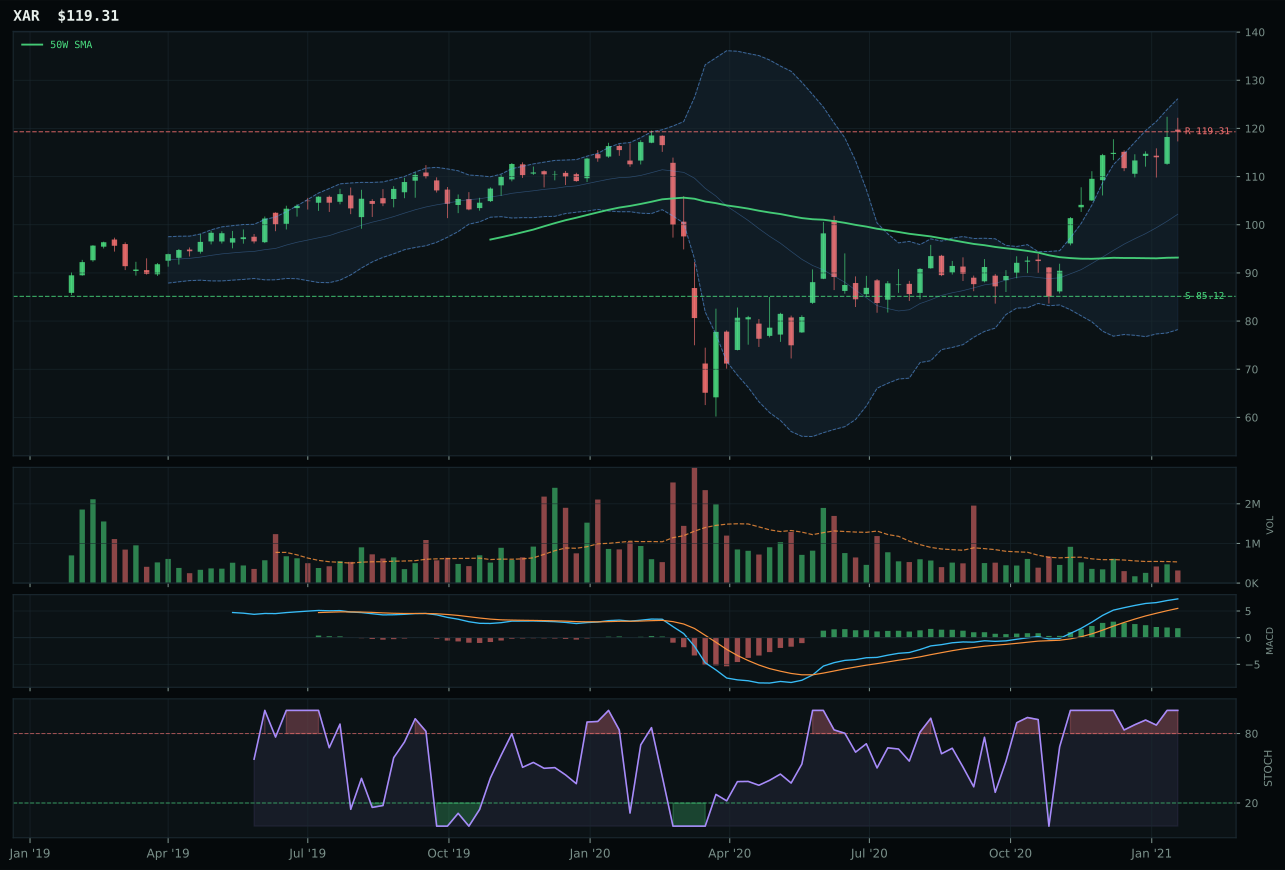
XAR has a vertical extension profile with 18.3% 13-week relative strength versus SPY.
A failed hold above support would weaken the setup.
Actionable but governed by invalidation levels.
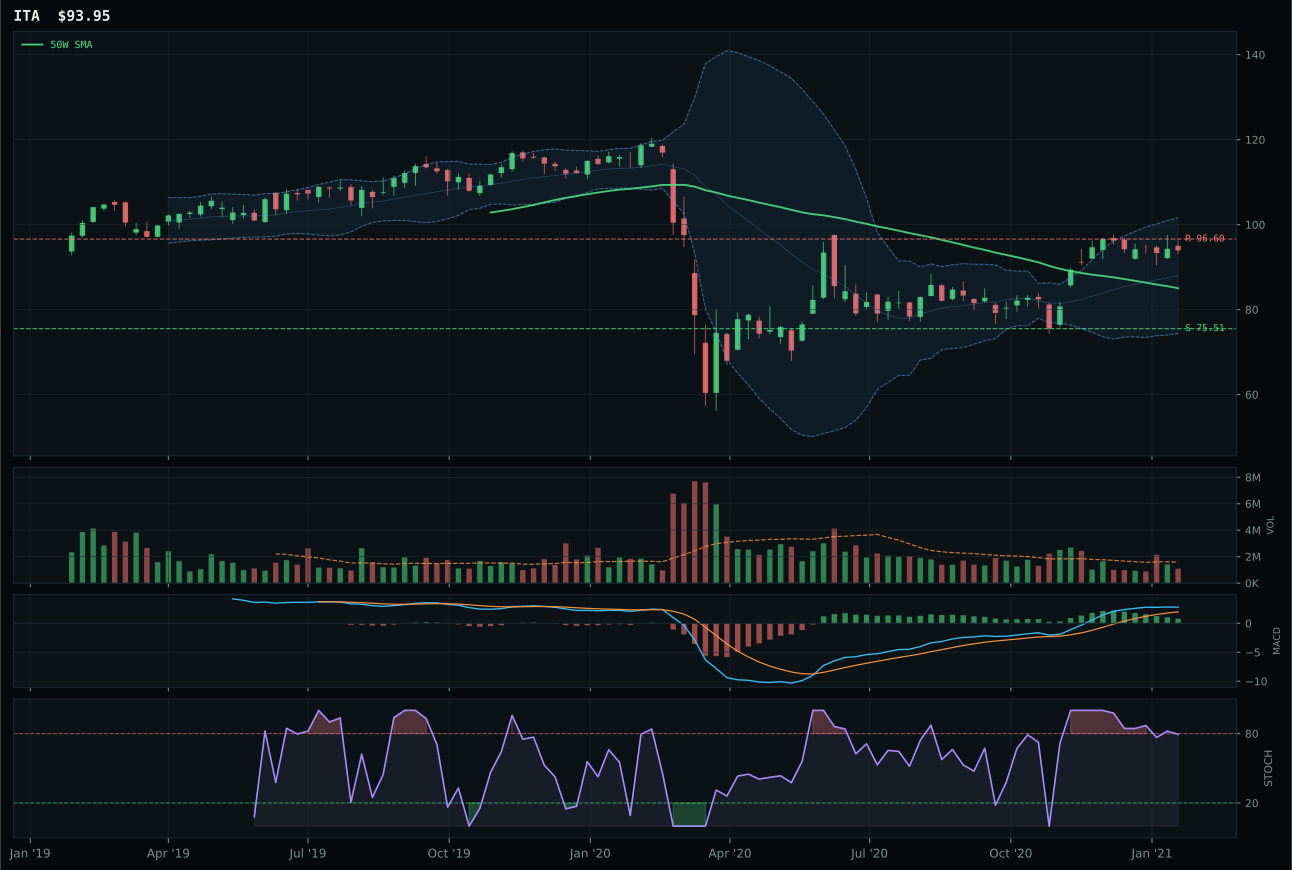
ITA has a neutral structure profile with 3.3% 13-week relative strength versus SPY.
A failed hold above support would weaken the setup.
Actionable but governed by invalidation levels.
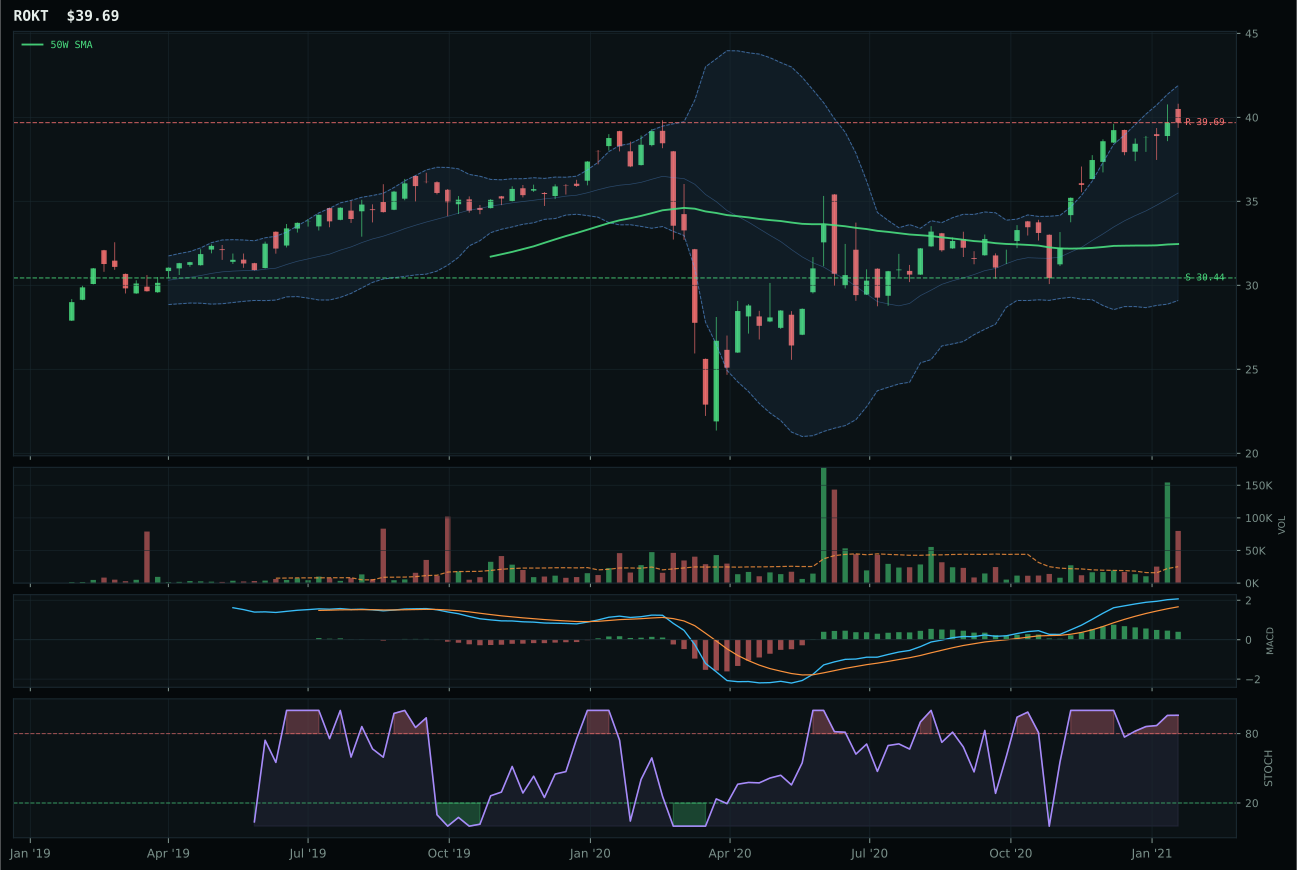
ROKT has a vertical extension profile with 9.1% 13-week relative strength versus SPY.
A failed hold above support would weaken the setup.
Tracked, but not top-2 eligible because: .
XAR won Defense & Aerospace by posting a perfect 100.0 trend score—price above both the 50-week and 200-week moving averages with a 0.0% slope reading—combined with 18.3% SPY-relative strength that beat ITA's 3.3% by 15 full points. While ITA offered cleaner structure in a neutral environment (71.2 versus XAR's 78.4), it failed the relative strength test, posting -5.8% category-relative strength versus XAR's 9.2%, suggesting capital rotation toward aerospace cyclicality rather than prime-contractor durability. XAR's MACD is bullish but flattening and stochastic RSI sits at overbought momentum (1.00), matching ITA's momentum setup but differing crucially in breadth: XAR's 29% 13-week return versus ITA's 14% indicates the market is pricing in actual cycle acceleration in exploration and production beta, not just defensive valuation. The 3.5-point gap reflects XAR's superior sponsorship of the momentum that's currently driving the entire category higher.
Defense & Aerospace scored 53.6, landing sixth overall and receiving 5% allocation as a hold position. Macro fit is neutral (50.0/100) because no category-specific descriptor profile boosted or penalized the exposure; the Transition regime itself added a modest +3 points. XAR's technical evidence of 57.4/100 is respectable but not compelling—it is supported by perfect trend and momentum but hampered by timing risk (32.0/100 due to 28.0% extension) and weak risk-reward (40.6/100). The category ranks below five others and will lose allocation priority if Industrial Metals or Traditional Energy weaken or if risk appetite deteriorates. The 5% allocation is maintained as a tactical real-asset play but offers no conviction upside; the portfolio would rotate this slot to higher-scoring categories at the next rebalance unless XAR either pulls back into support or the macro regime shifts to favor defense explicitly.
Nuclear Energy — URA
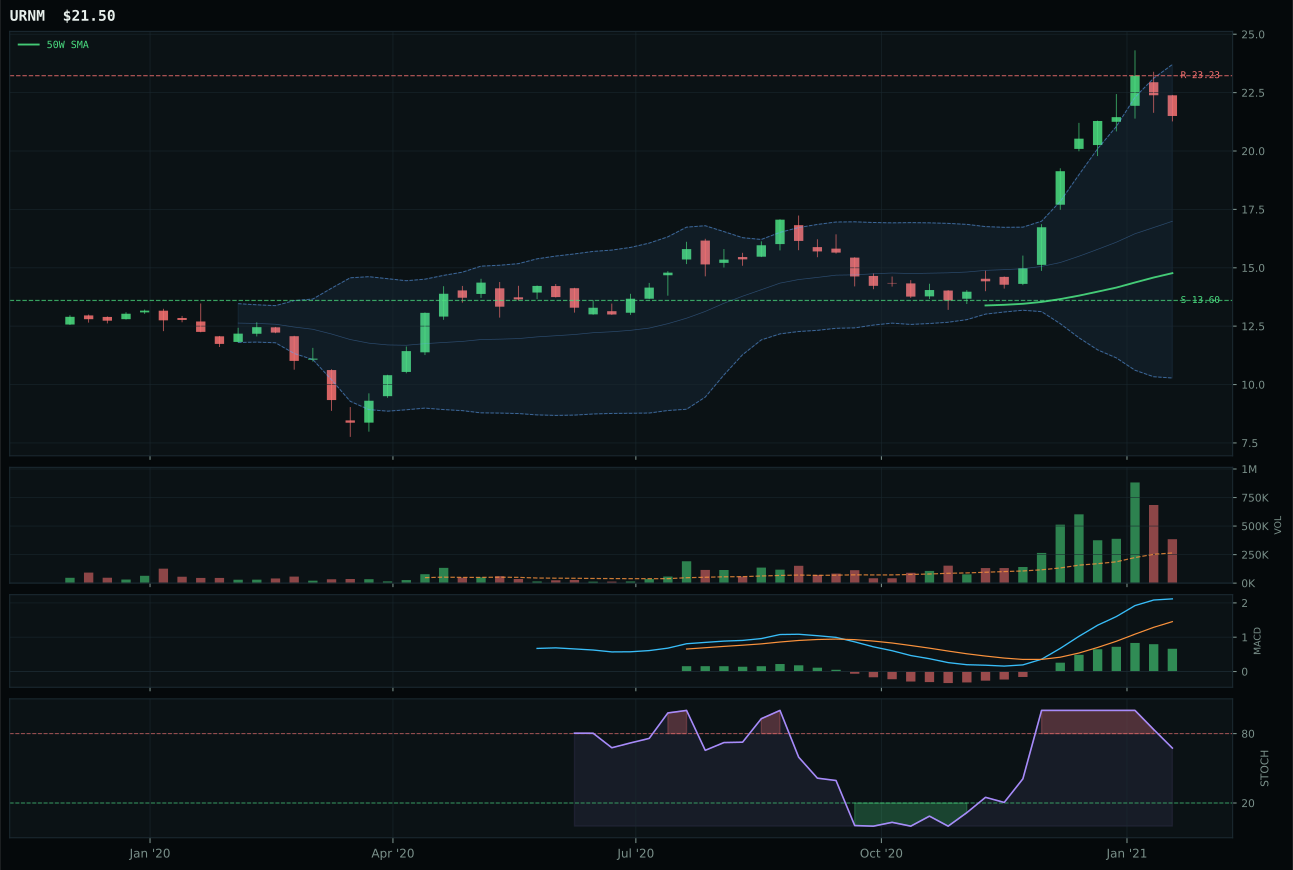
URNM has a vertical extension profile with 42.3% 13-week relative strength versus SPY.
A failed hold above support would weaken the setup.
Tracked, but not top-2 eligible because: .
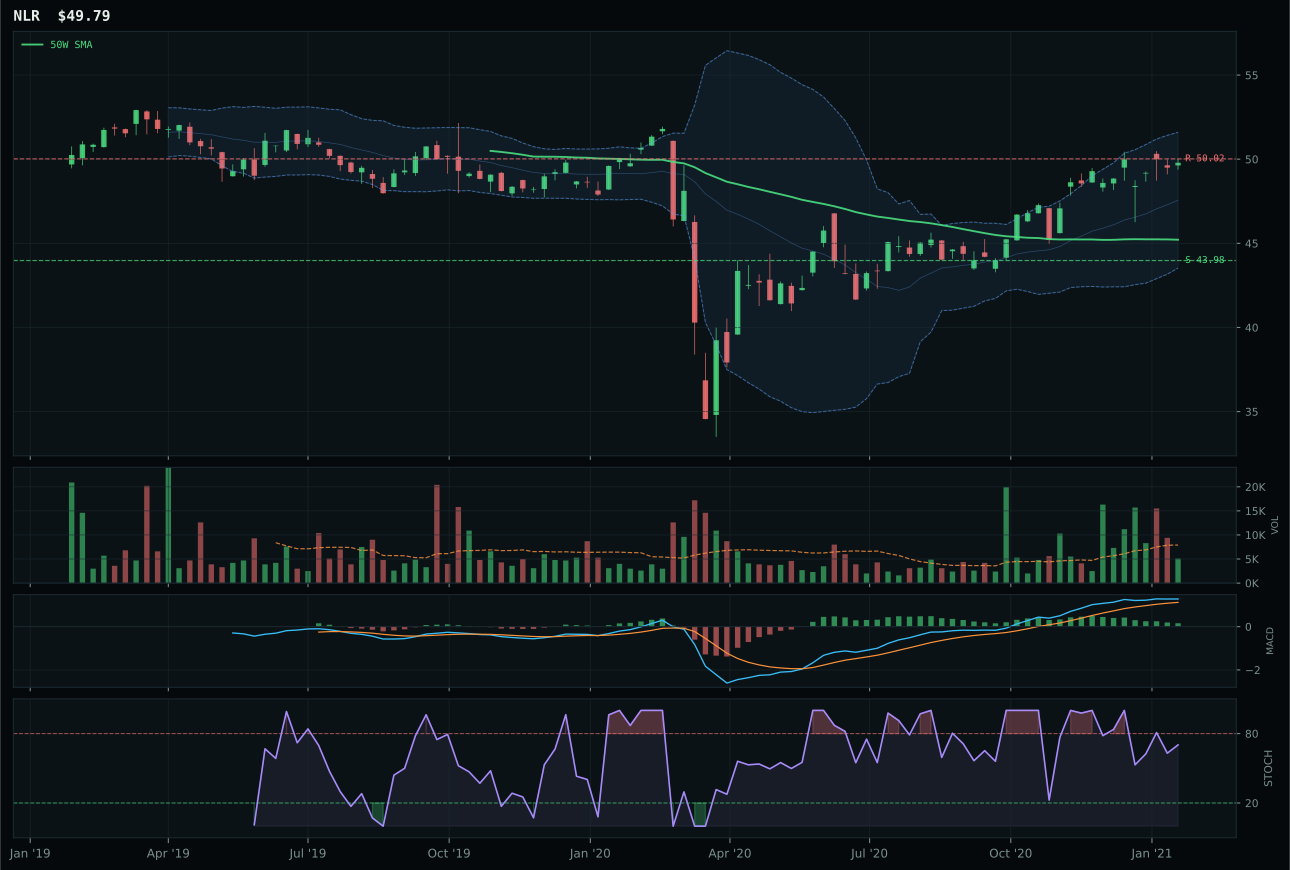
NLR has a neutral structure profile with -5.4% 13-week relative strength versus SPY.
A failed hold above support would weaken the setup.
Tracked, but not top-2 eligible because: .
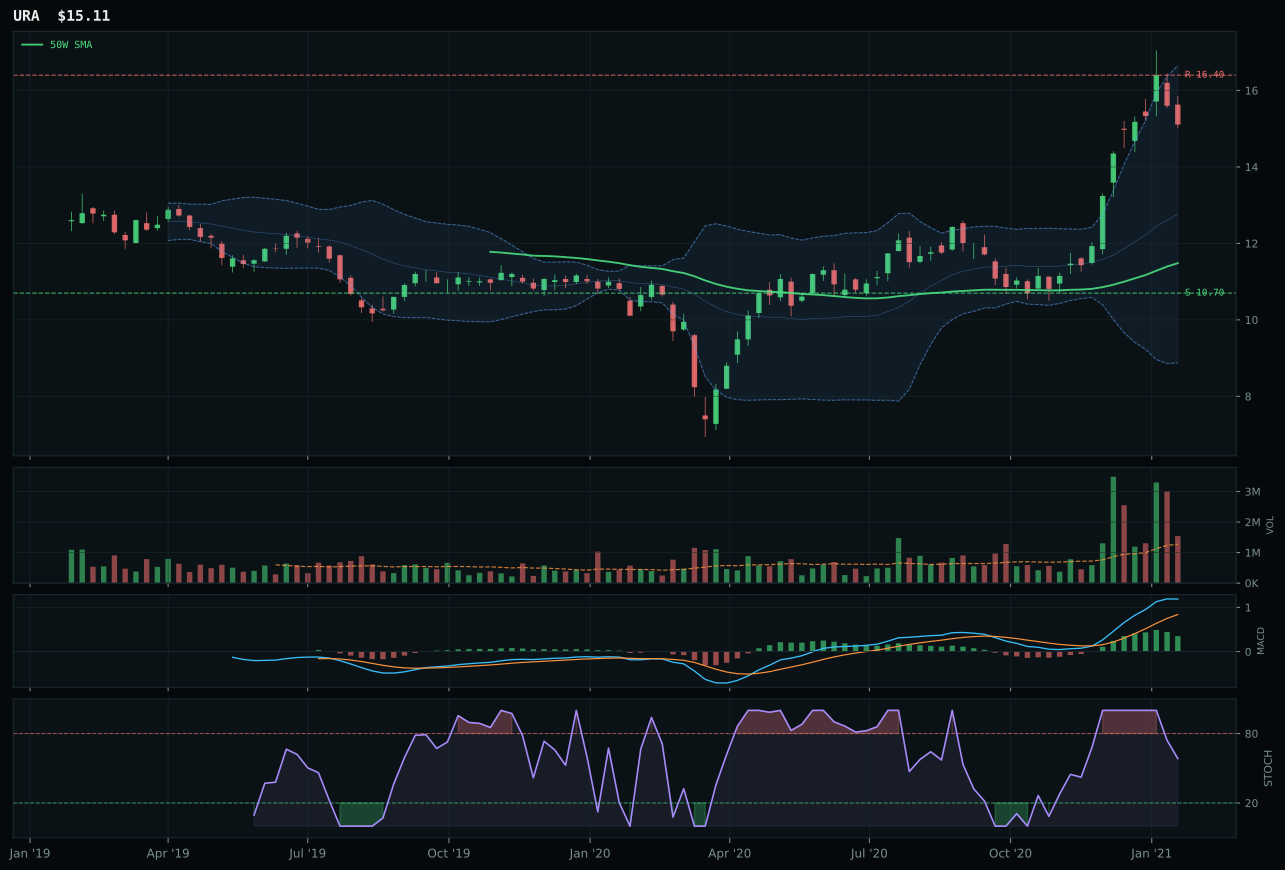
URA has a vertical extension profile with 24.8% 13-week relative strength versus SPY.
A failed hold above support would weaken the setup.
Actionable but governed by invalidation levels.
URA won Nuclear Energy by delivering the most balanced risk-reward setup among its peers: 96.0 trend score (price above both moving averages with strong relative strength at 24.8% SPY-relative), 100.0 momentum confirmation (35.5% 13-week return with bullish but flattening MACD), and 48.4 risk/reward—a measured entry with 41.2% downside buffer to 10.70 support. URNM posted superior SPY-relative strength (42.3% vs 24.8%) with dazzling 53.1% 13-week returns, but it sat 45.6% extended above the 50-week versus URA's 31.6%, pushing its risk/reward down to 47.3 and timing down to 53.0. NLR's 78-point timing score and -5.4% SPY-relative weakness revealed it as a value trap without conviction. URA's advantage lies in its structure score (80.0) paired with above-average but not euphoric volume (1.21x), suggesting genuine accumulation in a niche energy story rather than crowded momentum. The 24.7-point score gap versus URNM reflects quality discipline: when your peer offers double the returns at 50% more extension risk, the risk-adjusted choice is always the patient entry.
Nuclear Energy scored 47.1, ranking seventh among ten categories, and received 5% allocation. Category macro fit is 69.0/100, supported by energy scarcity (+9), real-asset sponsorship (+7), and AI growth sponsorship (+5 from potential power demand), but the allocation remains modest because the technical setup is mediocre and the category ranks below five others. URA's technical evidence is 67.5/100—respectable but not exceptional—hampered by weak timing (48.0) due to 31.6% extension and insufficient risk-reward confirmation. The 5% allocation is a real-options bet on nuclear energy as a secular growth tailwind in the decarbonization narrative, but it lacks the conviction needed for larger sizing. The category will remain at 5% unless either URA pulls back into the 50W for cleaner accumulation or macro shifts to favor energy security more aggressively. This is a patience position, not an accumulation position, held for optionality rather than conviction.
Utilities & Infrastructure — XLU
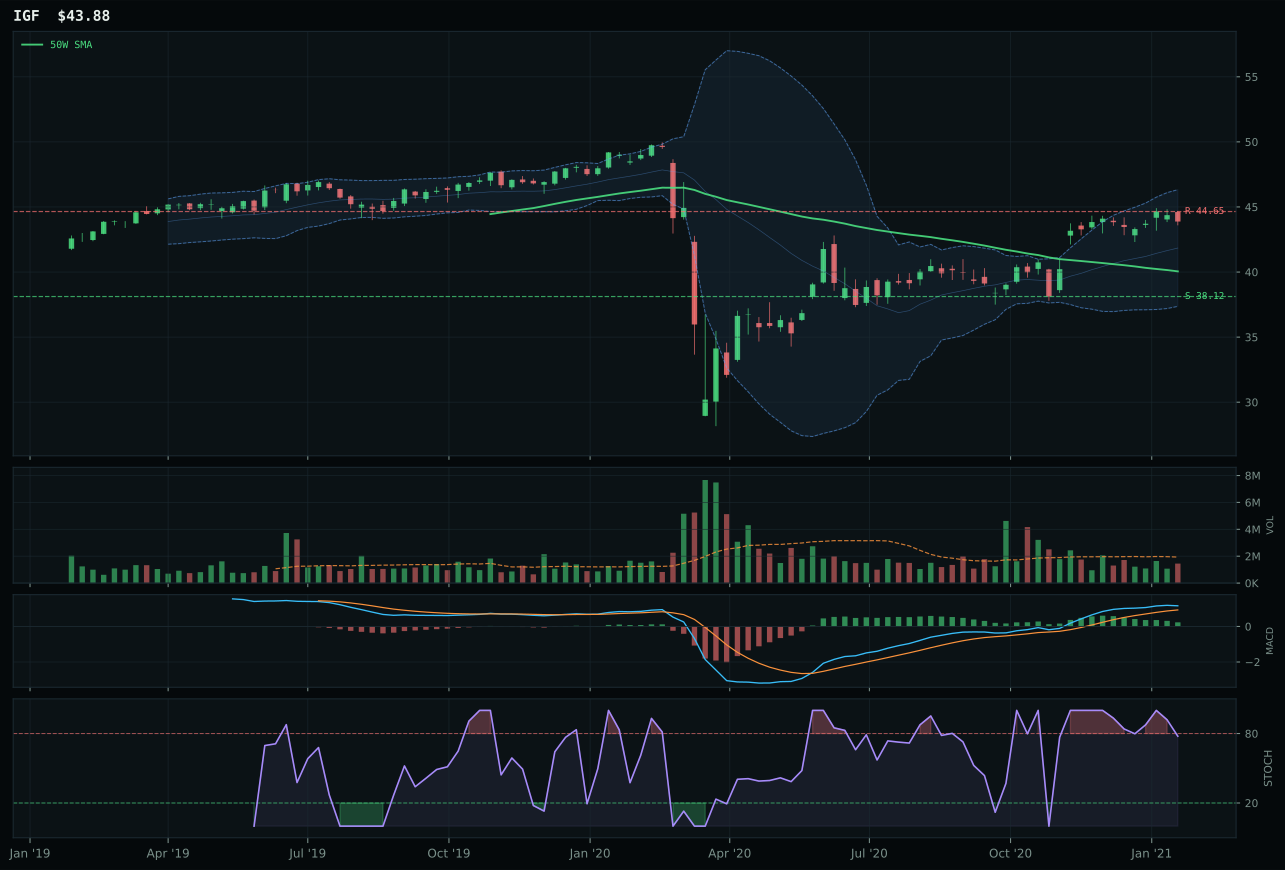
IGF has a neutral structure profile with -3.0% 13-week relative strength versus SPY.
A failed hold above support would weaken the setup.
Actionable but governed by invalidation levels.
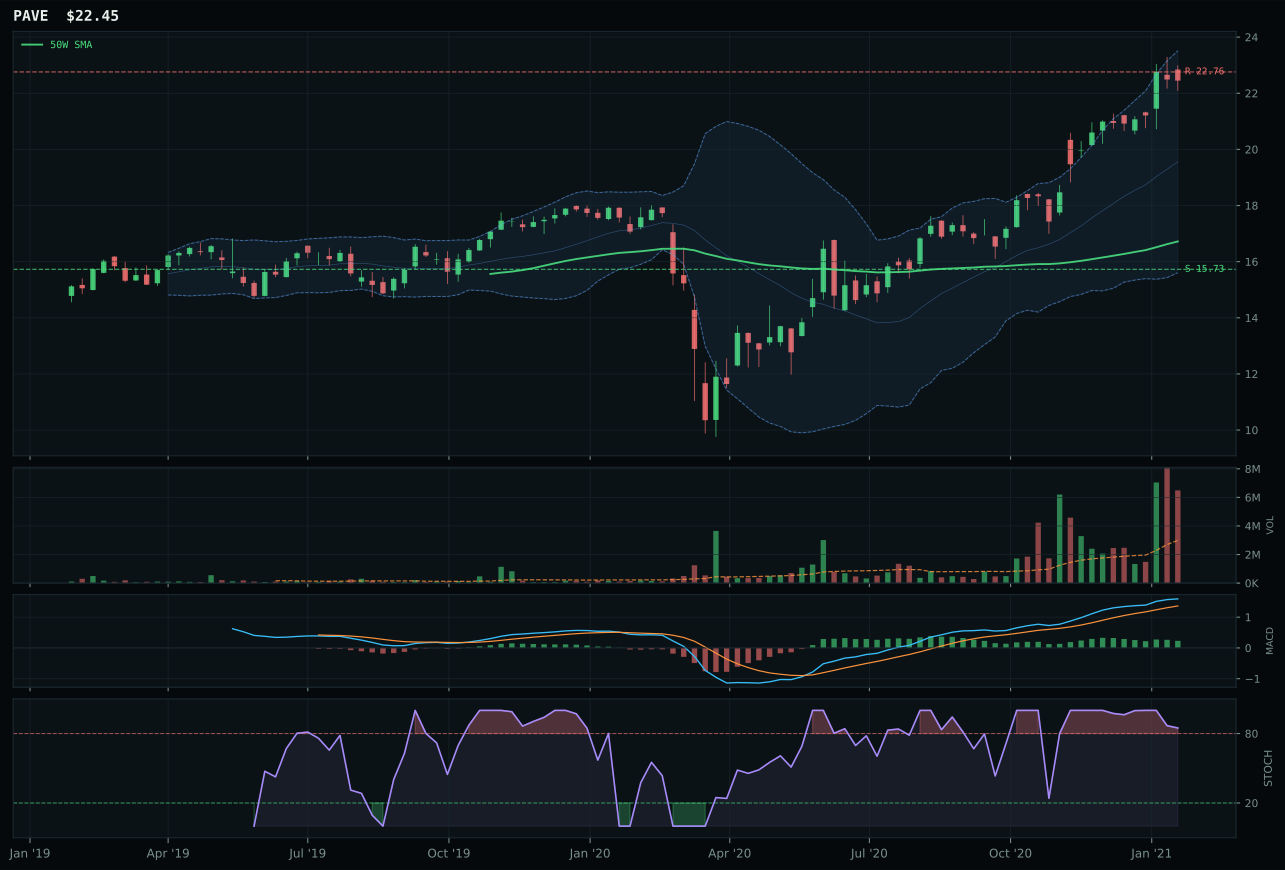
PAVE has a vertical extension profile with 11.7% 13-week relative strength versus SPY.
A failed hold above support would weaken the setup.
Actionable but governed by invalidation levels.
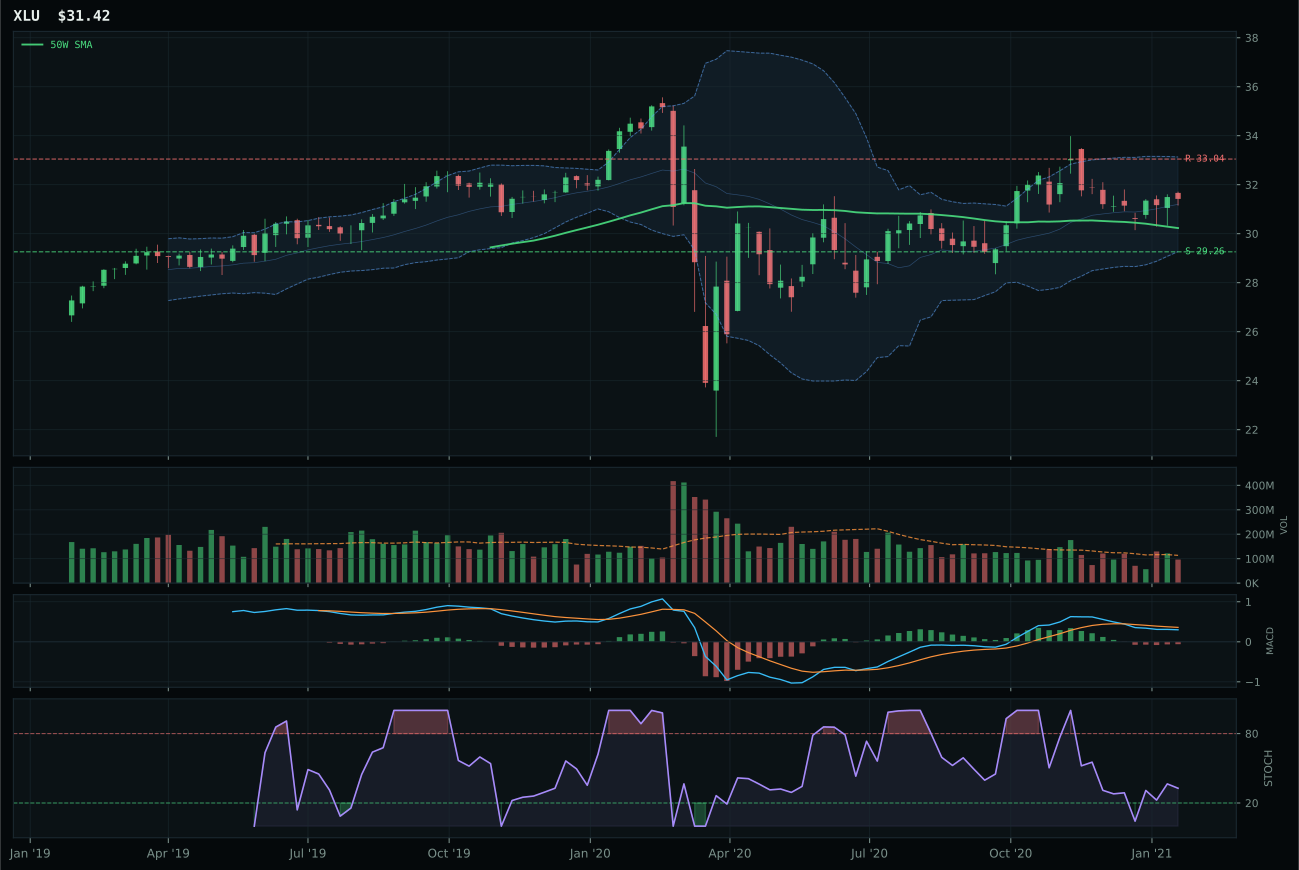
XLU has a neutral structure profile with -13.7% 13-week relative strength versus SPY.
A failed hold above support would weaken the setup.
Actionable but governed by invalidation levels.
XLU won Utilities & Infrastructure by posting a perfect 98.0 timing score—the highest timing score in the entire 10-category portfolio—generated by sitting only 3.9% above its 50-week moving average with MACD bearish but improving and stochastic RSI at the rising mid-zone (0.33). This matters because XLU is structurally weak (68.0 trend, -13.7% SPY-relative strength, -2.9% 13-week return), and timing is the only metric that saves it from dismissal. IGF, the runner-up, offered better trend (81) and momentum evidence (56) but undermined itself with 70.0 timing and 9.6% extension above the 50-week—less favorable entry risk in a setup that's already deteriorating. PAVE's 100.0 trend and 22.5% 13-week return look attractive on paper, but 11.7% SPY-relative strength paired with distribution pressure in volume revealed it as a crowded trade without institutional support. XLU's 0.85x volume is thin but orderly; its close proximity to the 50-week provides a defined, small-loss scenario (support at 29.26) that investors can easily defend.
Utilities & Infrastructure scored 47.1, matching Nuclear Energy but ranking lower due to negative macro conditions, and received zero allocation this week. Category macro fit is only 46.0/100, penalized by inflation pressure (-6) and risk appetite reversal (-2); the Transition regime adds a modest +4, but it is insufficient to overcome structural headwinds. XLU's technical evidence of 50.2/100 is poor: momentum confirmation is 14.9/100, and category-relative strength is -10.7%, meaning utilities are underwater in a risk-on environment. The category ranks ninth or tenth, outside the allocation, because it is a defensive play in an AltSeason regime where real assets and energy are rewarded, not regulated yield. The 0% allocation is correct; rebalancing capital into Utilities & Infrastructure would only occur if risk appetite inverted decisively or if inflation pressure reversed into deflation. Until then, this category will remain excluded in favor of higher-conviction real-asset and momentum exposures.
Precious Metals — GLD
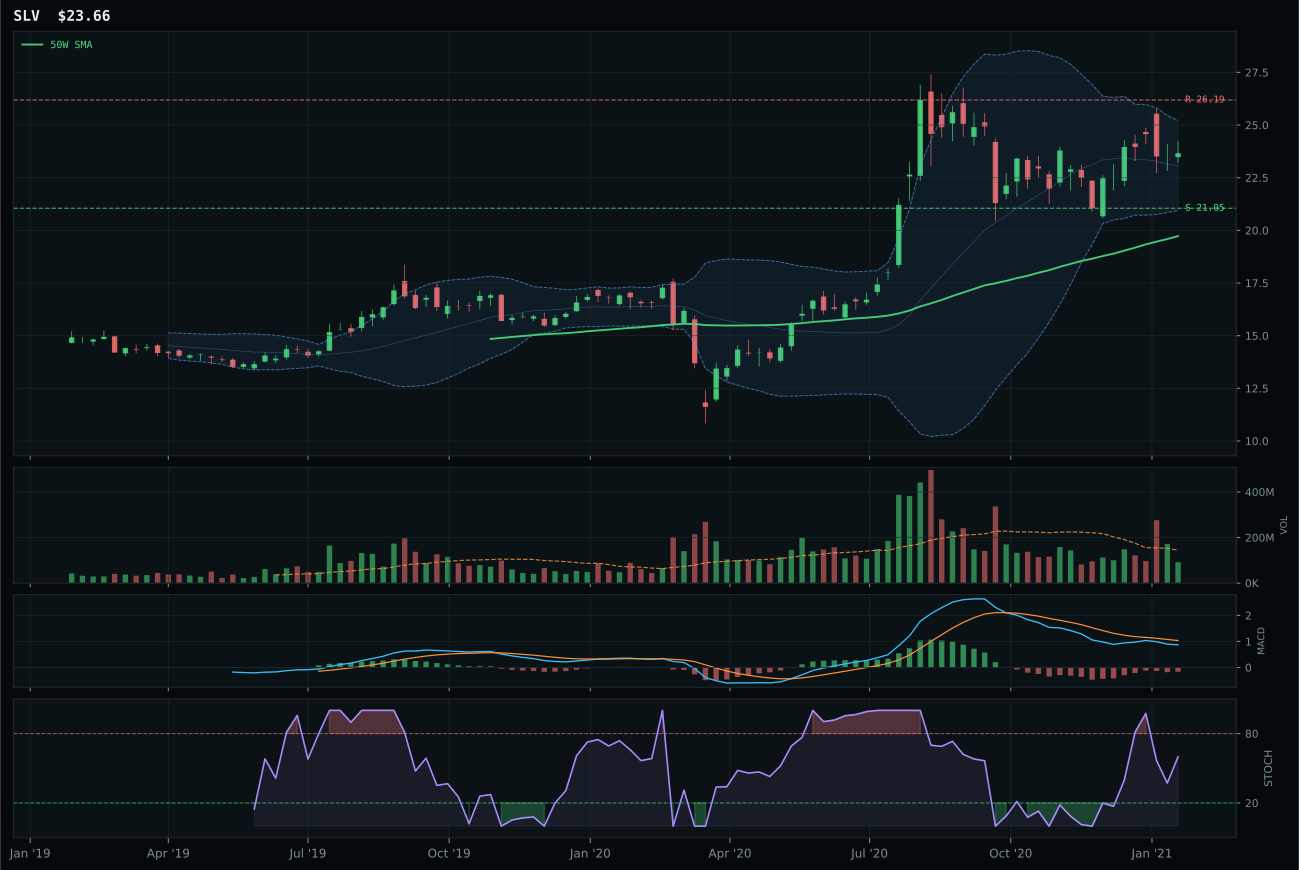
SLV has a vertical extension profile with -7.6% 13-week relative strength versus SPY.
A failed hold above support would weaken the setup.
Actionable but governed by invalidation levels.
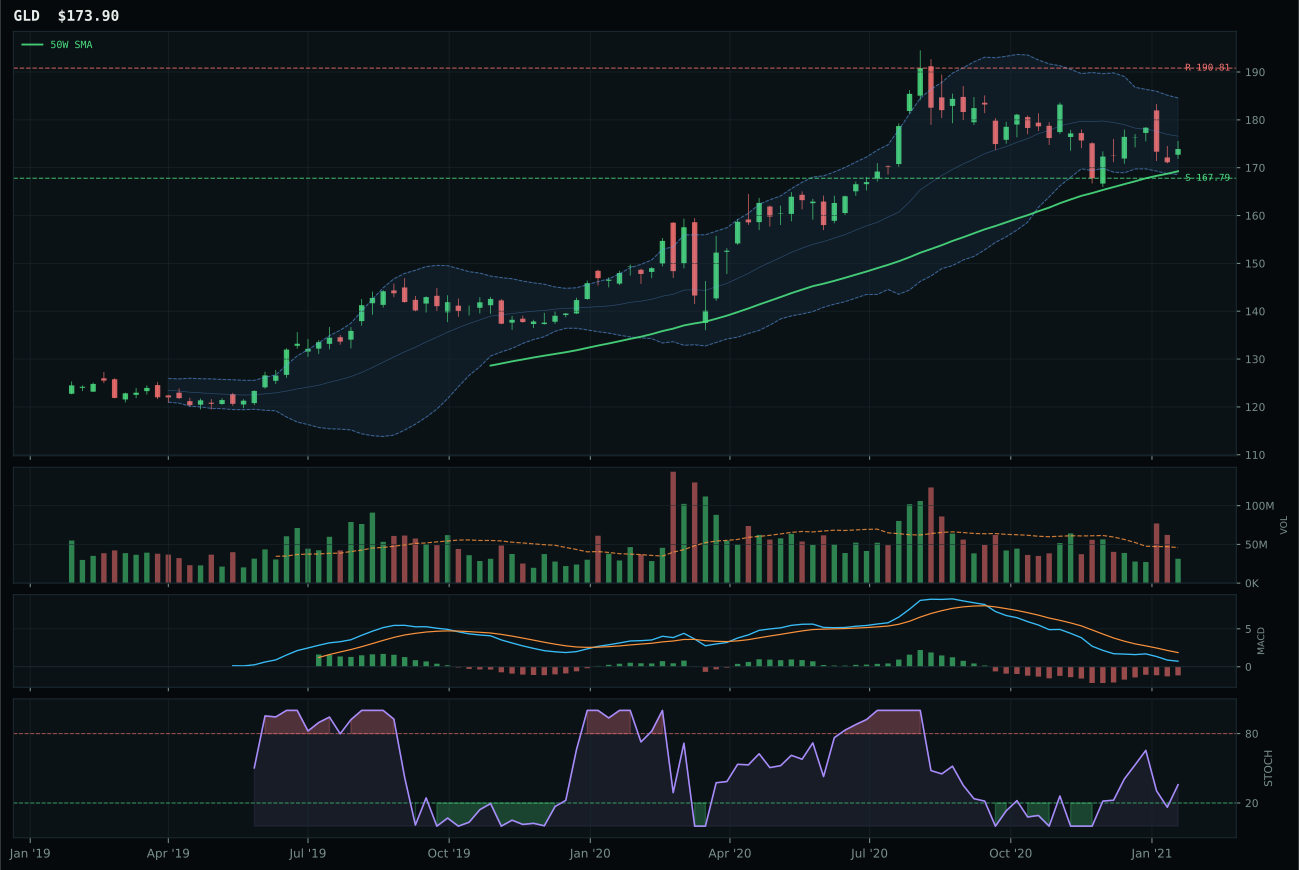
GLD has a pullback into support profile with -13.4% 13-week relative strength versus SPY.
A failed hold above support would weaken the setup.
Actionable but governed by invalidation levels.
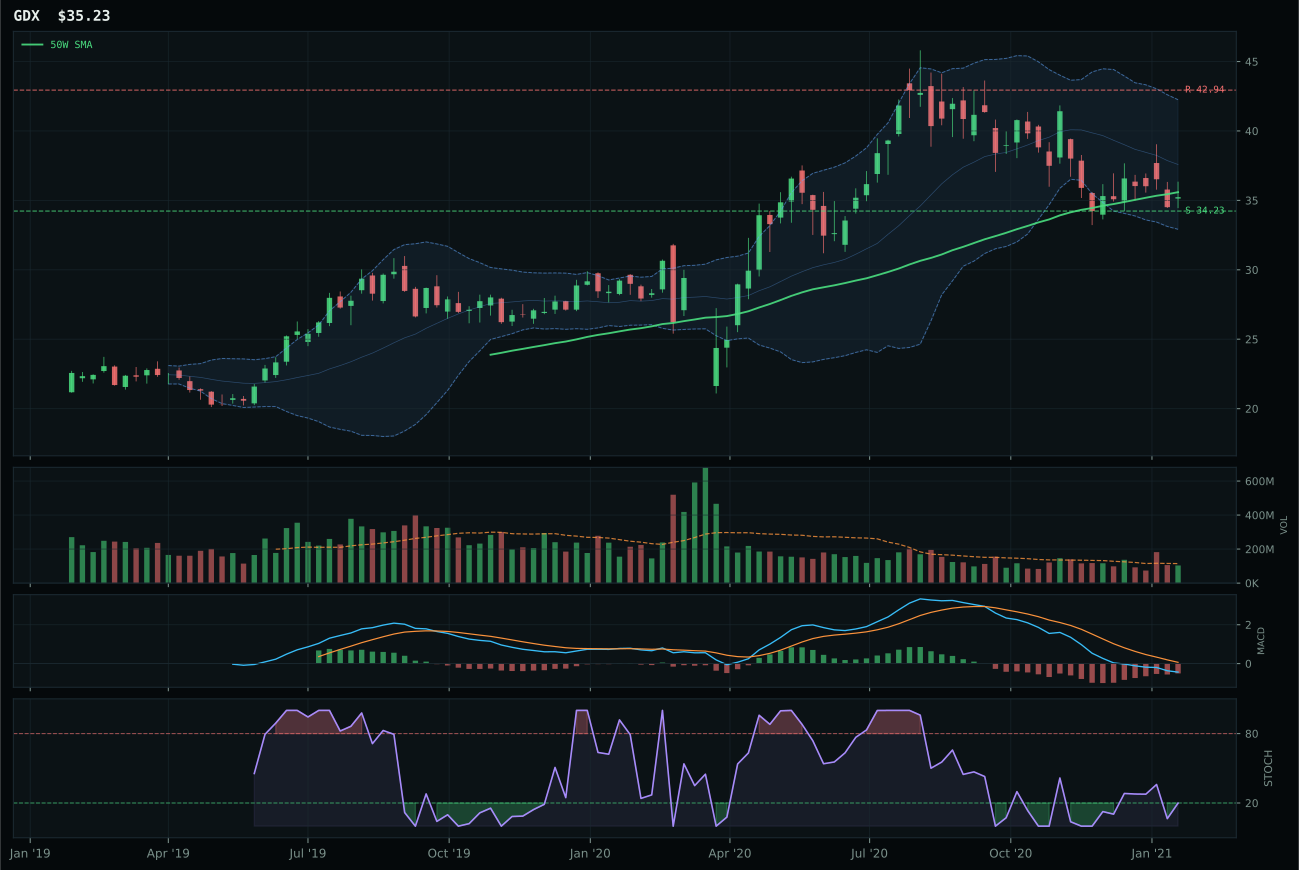
GDX has a pullback into support profile with -20.0% 13-week relative strength versus SPY.
A failed hold above support would weaken the setup.
Actionable but governed by invalidation levels.
GLD won Precious Metals by offering the most favorable timing setup in the entire 10-category suite: a perfect 100.0 timing score generated by sitting only 2.7% above the 50-week moving average (versus SLV's 19.9%), with MACD bearish but improving and stochastic RSI at the rising mid-zone (0.36) rather than exhausted overbought. This matters because both GLD and SLV sit in bearish intermediate trends, below the 200-week, with negative 13-week returns; in a deteriorating category, timing becomes the only edge. GLD's 88.8 risk/reward score—the best in category—comes from -8.9% upside to resistance paired with only 3.6% downside to support, creating a defined, small-loss scenario if the charts roll over further. SLV's vertical extension, above-average momentum, and materials scarcity narrative (+7 macro points) proved insufficient because the setup offers no invalidation area and worse entry risk. Both decline 13-week, but GLD's proximity to its moving average and improving stochastic RSI suggest it's absorbing selling pressure rather than extending into it.
Precious Metals scored 43.8 and received zero allocation this week, ranking either ninth or tenth among the ten categories. Category macro fit is only 46.0/100, dragged down by risk appetite being active as a headwind (-4 points); inflation pressure, supply shortage, and commodity breadth are neutral or absent from the descriptor checklist. GLD's perfect timing score cannot overcome the fundamental problem: bearish MACD, negative thirteen-week performance (-2.7%), and -13.4% underperformance versus SPY all signal that the category is in defensive mode, not accumulation. The allocator is right to exclude metals entirely when Industrial Metals, Traditional Energy, and AI are all outperforming and offering better risk-adjusted entry points. Precious metals will be reconsidered only if risk appetite flips decisively negative or if real yields compress sharply; until then, the category's 0% allocation reflects its rank outside the top eight.