
2021-01-15
Informational purposes only. The content in this report, including allocations, analysis, and commentary, is provided solely for informational and educational purposes. It does not constitute financial advice, investment advice, trading advice, or any other type of advice. Past performance does not guarantee future results. Always conduct your own research and consult a qualified financial professional before making investment decisions.
Some tracked tickers were excluded due to missing live weekly price data: SGOV: Historical cache SGOV has only 33 usable weekly bars
Weekly Allocation
| Ticker | Category | Weight | Role |
|---|---|---|---|
| FBTC | 50% | Overlay | |
| XOP | Traditional Energy | 10% | Top-2 (10%) |
| REMX | Industrial Metals | 10% | Top-2 (10%) |
| WEAT | Agriculture & Livestock | 5% | Tier-2 (5%) |
| SMH | AI | 5% | Tier-2 (5%) |
| XAR | Defense & Aerospace | 5% | Tier-2 (5%) |
| XLK | Technology | 5% | Tier-2 (5%) |
| URA | Nuclear Energy | 5% | Tier-2 (5%) |
| GLD | Precious Metals | 5% | Tier-2 (5%) |
Trade Instructions — Monday Open
Sell the tranche from 2020-12-18 (completing its 4-week hold). Buy the new tranche. Instructions show net portfolio changes — same-asset positions cancel, weight changes show the delta.
| Action | Ticker | Instruction |
|---|---|---|
| SELL | FSOL | Sell 25% of FSOL position (reduce 50.00% → 37.50%) |
| SELL | FCG | Sell entire FCG position (2.50% of portfolio) |
| SELL | COPX | Sell entire COPX position (2.50% of portfolio) |
| SELL | ILF | Sell entire ILF position (1.25% of portfolio) |
| SELL | CIBR | Sell 25% of CIBR position (reduce 5.00% → 3.75%) |
| SELL | PAVE | Sell 50% of PAVE position (reduce 2.50% → 1.25%) |
| SELL | MOO | Sell 33% of MOO position (reduce 3.75% → 2.50%) |
| BUY | REMX | Buy REMX — 11.11% of freed cash (adds 2.50% to portfolio) |
| BUY | WEAT | Buy WEAT — 5.56% of freed cash (adds 1.25% to portfolio) |
| BUY | FBTC | Buy FBTC — 55.56% of freed cash (adds 12.50% to portfolio) |
| BUY | XOP | Buy XOP — 11.11% of freed cash (adds 2.50% to portfolio) |
| BUY | XLK | Buy XLK — 5.56% of freed cash (adds 1.25% to portfolio) |
| BUY | URA | Buy URA — 5.56% of freed cash (adds 1.25% to portfolio) |
| BUY | GLD | Buy GLD — 5.56% of freed cash (adds 1.25% to portfolio) |
Current Portfolio After Trade
Combined holdings across all 4 active tranches. Each tranche is 25% of the portfolio.
| Ticker | % of Portfolio | Weight Bar |
|---|---|---|
| FSOL | 37.50% | |
| FBTC | 12.50% | |
| REMX | 10.00% | |
| XLE | 7.50% | |
| CIBR | 3.75% | |
| SMH | 3.75% | |
| INDA | 3.75% | |
| MOO | 2.50% | |
| XAR | 2.50% | |
| XLU | 2.50% | |
| WEAT | 2.50% | |
| ITA | 2.50% | |
| XOP | 2.50% | |
| PAVE | 1.25% | |
| BOTZ | 1.25% | |
| XLK | 1.25% | |
| URA | 1.25% | |
| GLD | 1.25% |
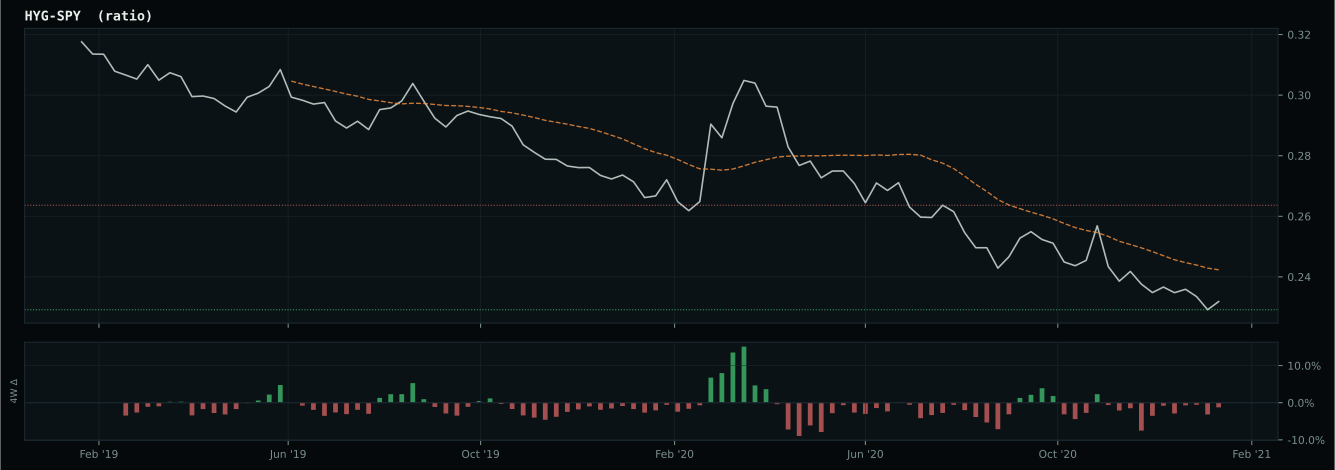
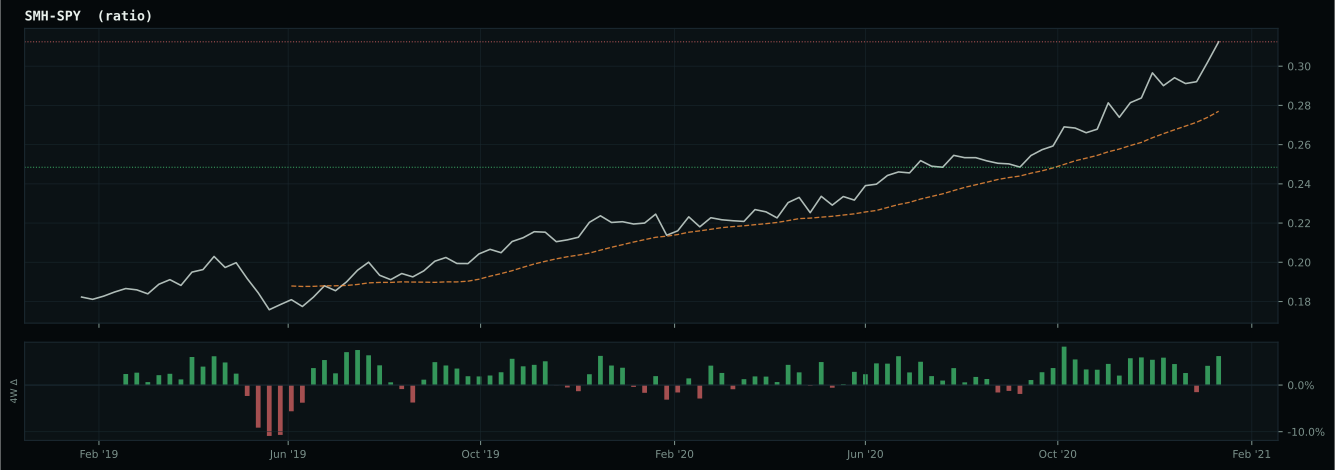
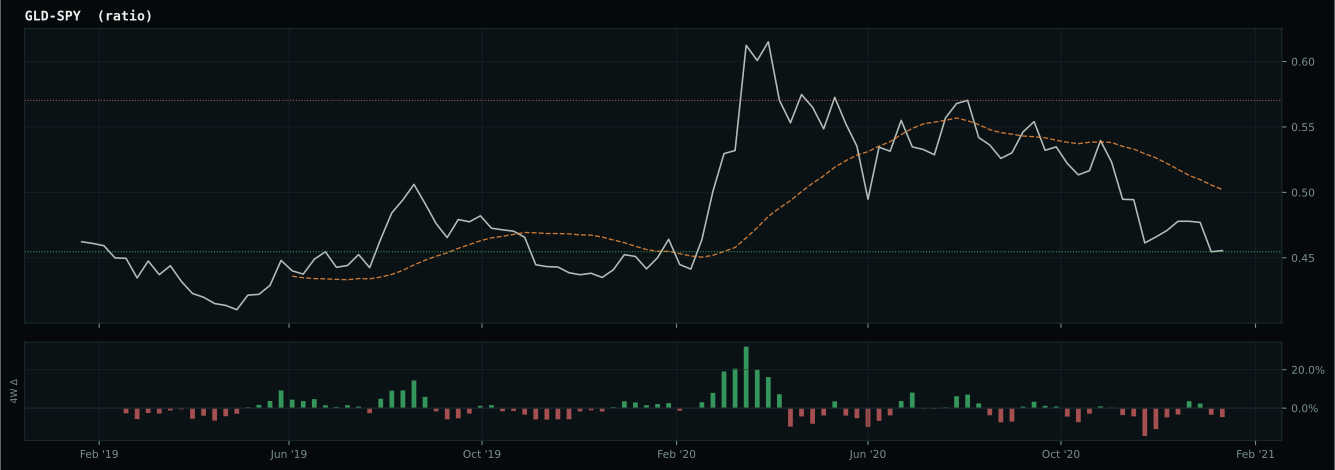
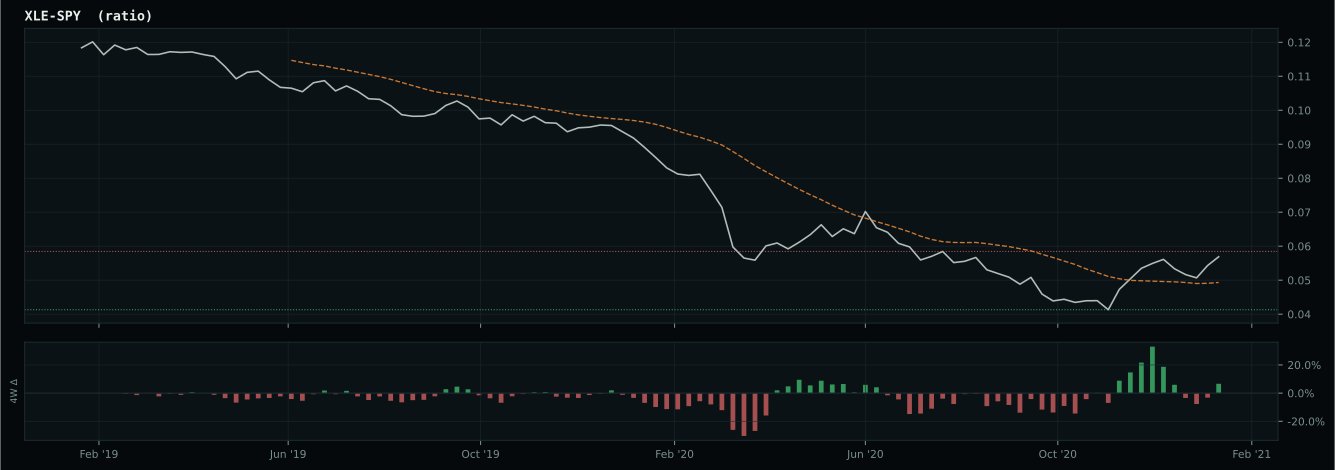
Macro Regime — Late-Cycle Reflation
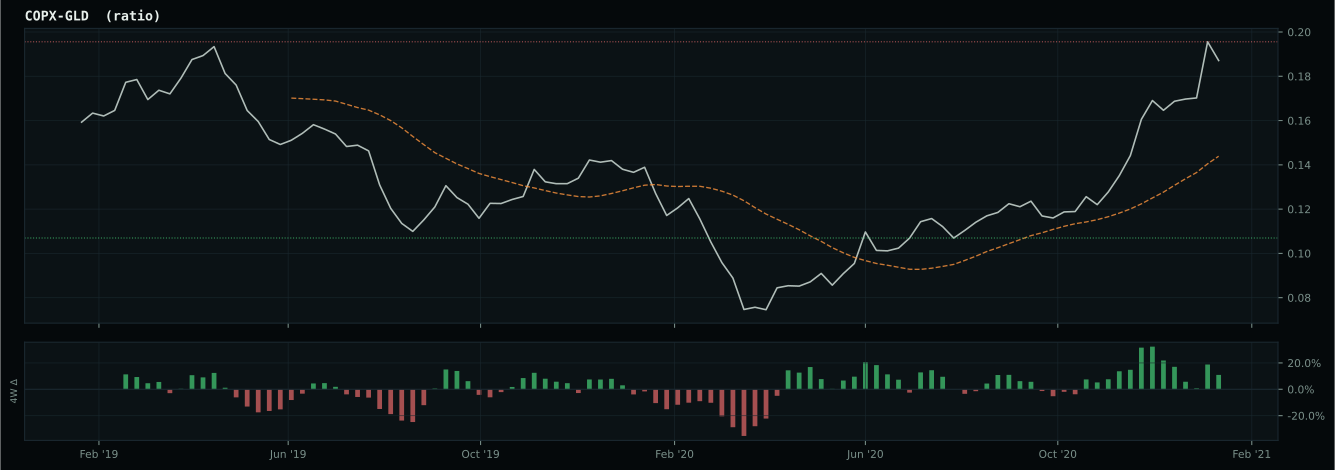
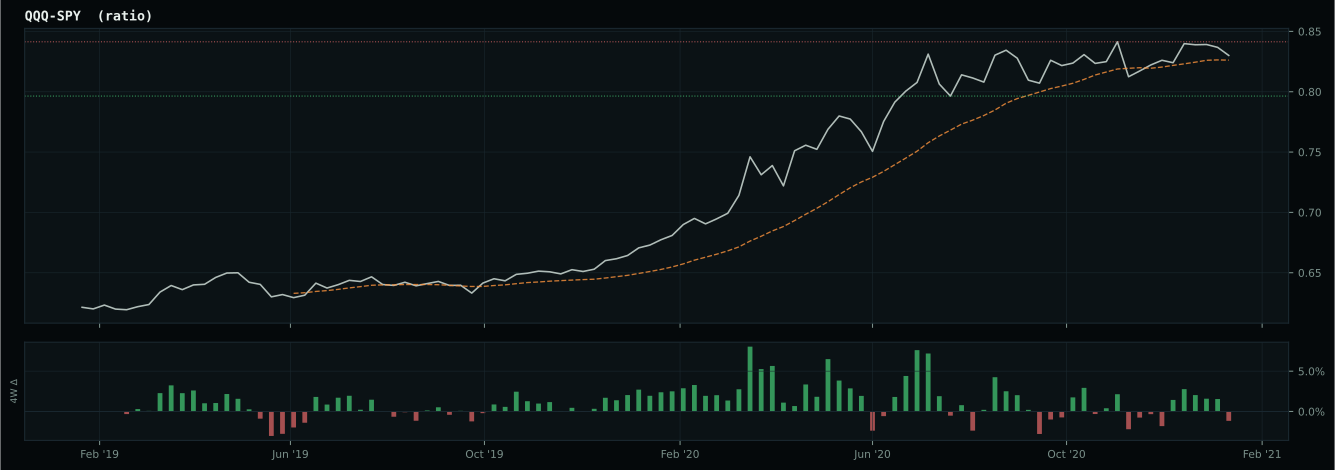
Macro Evidence Charts
Market-implied signals behind the macro regime scores. Each ratio compares two assets; the direction and slope of the ratio is what the macro engine reads.
Crypto Regime — TrendBTC
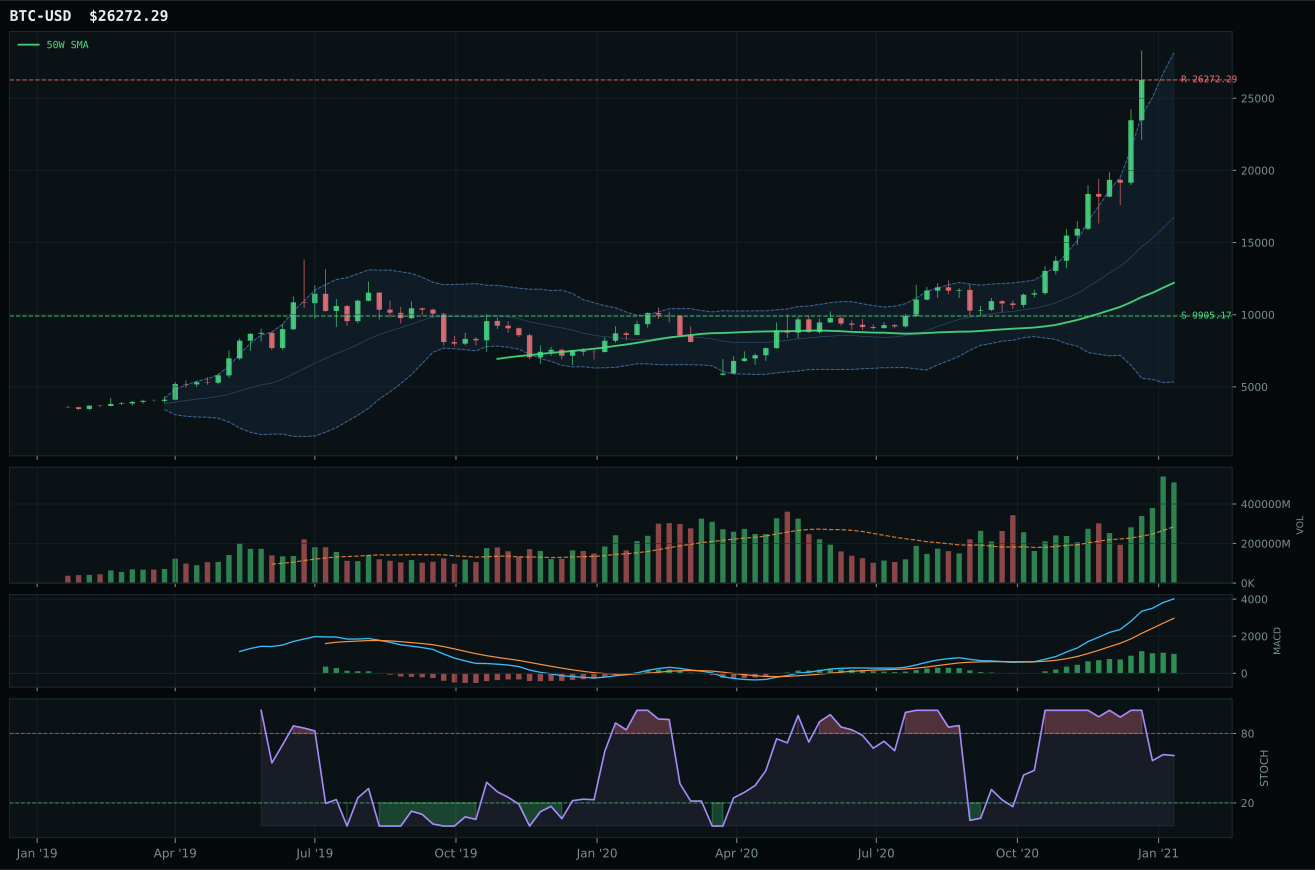
post-touch structure is too wide to count as a range; max/min close ratio is 7.11
TrendBTC confirmed: 2 consecutive closes above rising/flat 50W SMA
one or more available conditions failed

Category Rankings
| Rank | Category | Winner | Score | Alloc | 4W Ret | Peers (4W) |
|---|---|---|---|---|---|---|
| 1 | Traditional Energy | XOP | 86.1 | 20% | +10.21% | FCG +9.0% · XLE +5.6% |
| 2 | Industrial Metals | REMX | 60.5 | 20% | +18.95% | COPX +10.6% · PICK +3.5% |
| 3 | Agriculture & Livestock | WEAT | 59.2 | 10% | -4.31% | MOO +3.7% · VEGI +4.3% |
| 4 | AI | SMH | 54.6 | 10% | +7.83% | BOTZ +5.3% · AIQ +10.2% |
| 5 | Defense & Aerospace | XAR | 48.4 | 10% | +5.59% | ROKT +2.0% · ITA +3.4% |
| 6 | Technology | XLK | 46.8 | 10% | +8.45% | IGV +10.3% · CIBR +3.4% |
| 7 | Nuclear Energy | URA | 44.9 | 10% | +20.15% | URNM +30.2% · NLR +2.3% |
| 8 | Precious Metals | GLD | 38.9 | 10% | -2.65% | SLV +7.2% · GDX -2.5% |
| 9 | Utilities & Infrastructure | XLU | 33.8 | 0% | -1.23% | IGF -1.0% · PAVE -0.1% |
| 10 | Emerging Markets | IEMG | 33.2 | 0% | +4.88% | ILF -2.2% · INDA +3.8% |
Traditional Energy — XOP
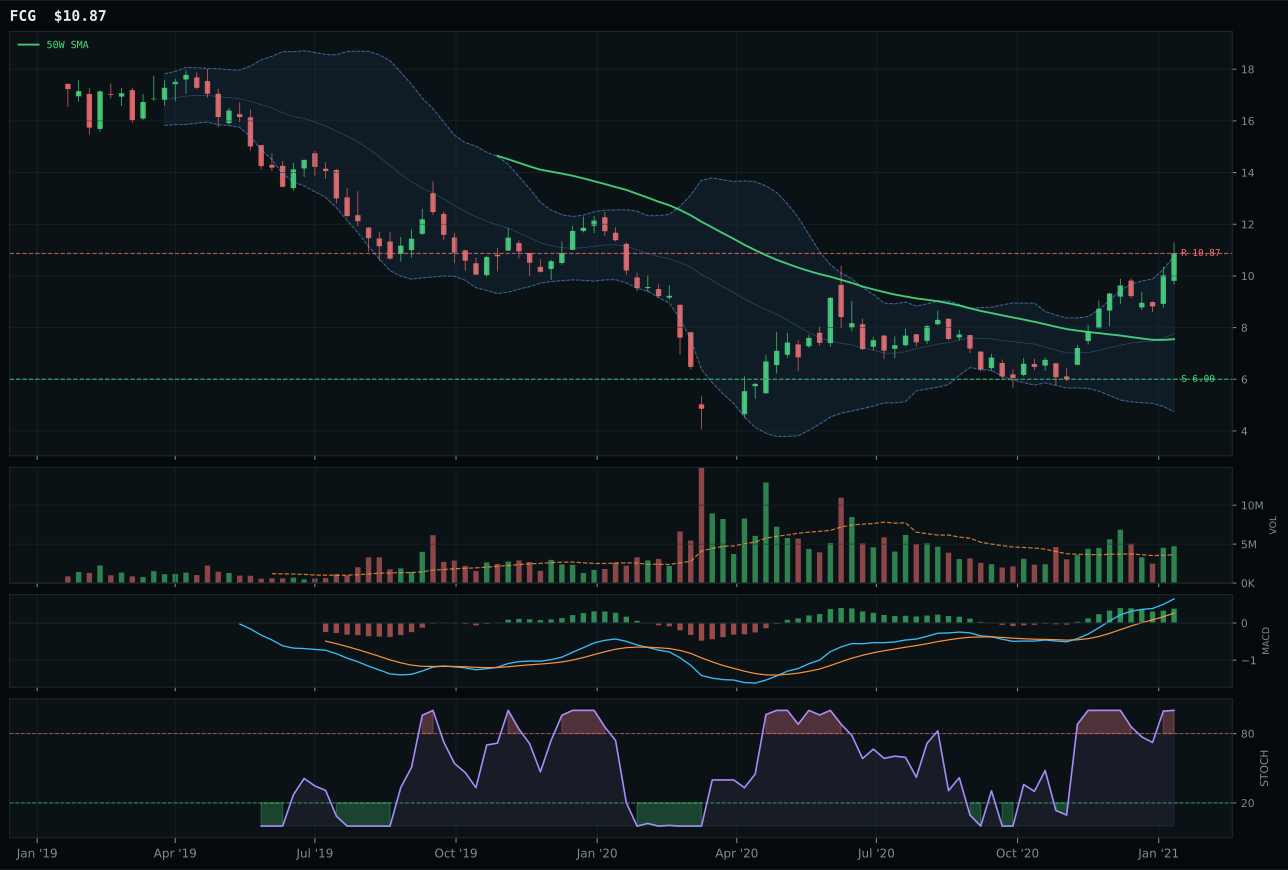
FCG has a vertical extension profile with 59.6% 13-week relative strength versus SPY.
A failed hold above support would weaken the setup.
Actionable but governed by invalidation levels.
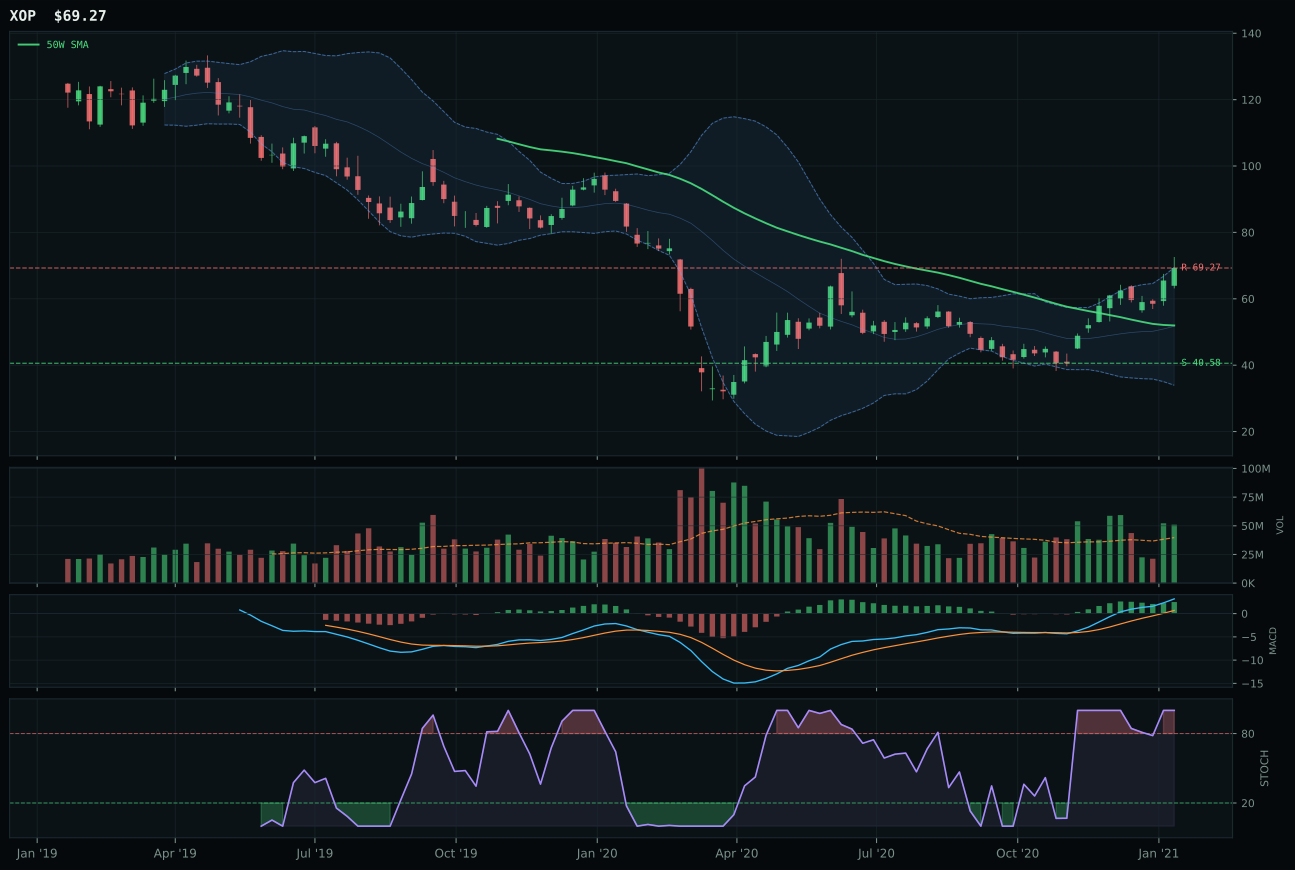
XOP has a vertical extension profile with 50.8% 13-week relative strength versus SPY.
A failed hold above support would weaken the setup.
Actionable but governed by invalidation levels.
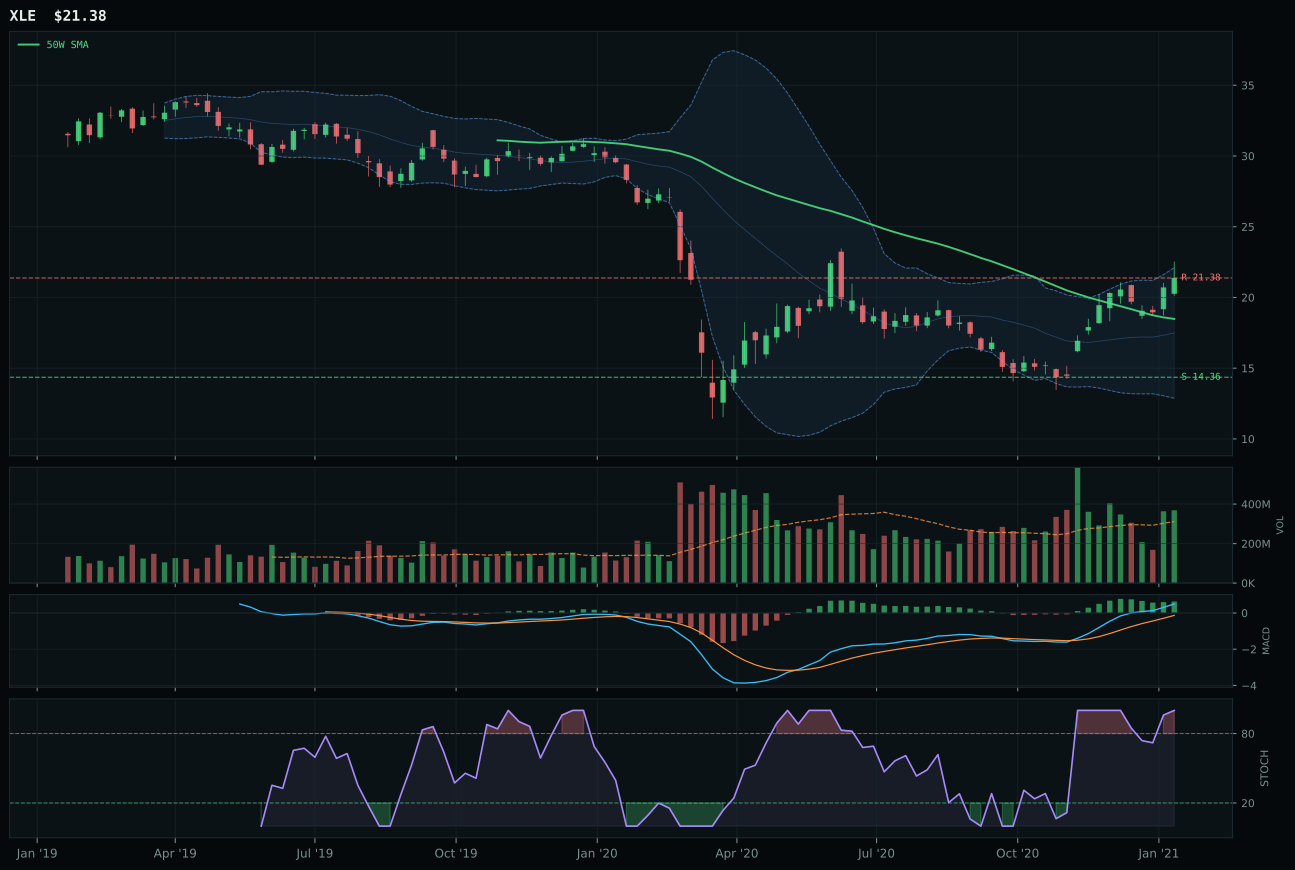
XLE has a vertical extension profile with 33.4% 13-week relative strength versus SPY.
A failed hold above support would weaken the setup.
Actionable but governed by invalidation levels.
XOP wins the Traditional Energy category and earns the second 10% top-2 allocation slot despite FCG's superior technical evidence (79.3 versus XOP's 71.9) because risk/reward and timing favor the exploration-beta thesis: XOP's 32.0 risk-reward versus FCG's 23.8, and XOP's 40.0 timing versus FCG's 32.0, signal that the natural-gas and exploration plays have better entry economics. XOP sits 33.3% extended above the 50-week with price below the 200-week line—a setup that requires support to hold rather than confirming established uptrend, yet the structure is cleaner (74.3 versus FCG's implied lower baseline) and momentum confirmation is perfect at 100.0. FCG's 13-week return of 67.7% and 59.6% SPY-relative strength are compelling, but the price sits near the 52-week high with overbought stochastic RSI, leaving FCG as the extended-and-overbought candidate while XOP remains the pullback-and-support play. Volume participation at 1.28x favors both, but the category-relative standing of 0.0% (XOP) versus 8.7% (FCG) reflects XOP's cleaner institutional sponsorship within the basket.
Traditional Energy earns 10% allocation as the second top-2 category at a 86.1 score, the highest-ranked category in the portfolio. The macro fit (90.0/100) is exceptional, driven by late-cycle reflation (+12), energy scarcity (+16), inflation pressure (+10), supply shortage (+9), and real asset sponsorship (+7)—this is the portfolio's clearest macro match. XOP's below-the-200W positioning (trend 66/100) is less clean than Industrial Metals' above-the-200W breakout, yet the late-cycle reflation regime actually penalizes too-extended technical setups in favor of real asset outperformance driven by supply constraints and pricing power. XOP's 70.7% downside to support (40.58) against 0% upside to resistance (69.27) creates a defined risk zone, and the 98.9/100 persistence score signals that energy sector strength is structural, not speculative. If WTI crude breaks below $40 or if XOP violates its 50W support, allocation should exit. However, if energy prices re-test recent highs and XOP breaks above 69.27 on volume, the position could expand toward 15% as the regime's primary beneficiary.
Industrial Metals — REMX
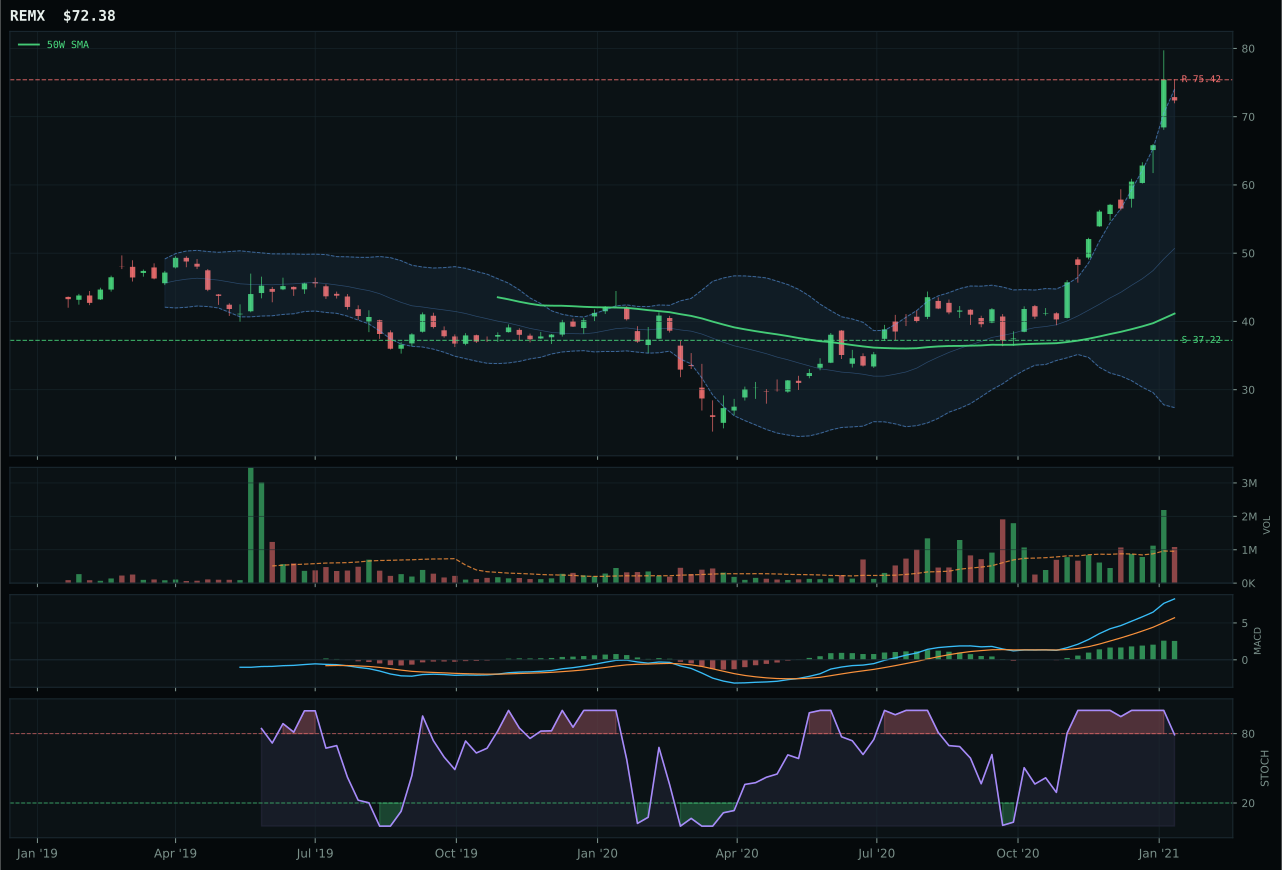
REMX has a vertical extension profile with 69.6% 13-week relative strength versus SPY.
A failed hold above support would weaken the setup.
Actionable but governed by invalidation levels.
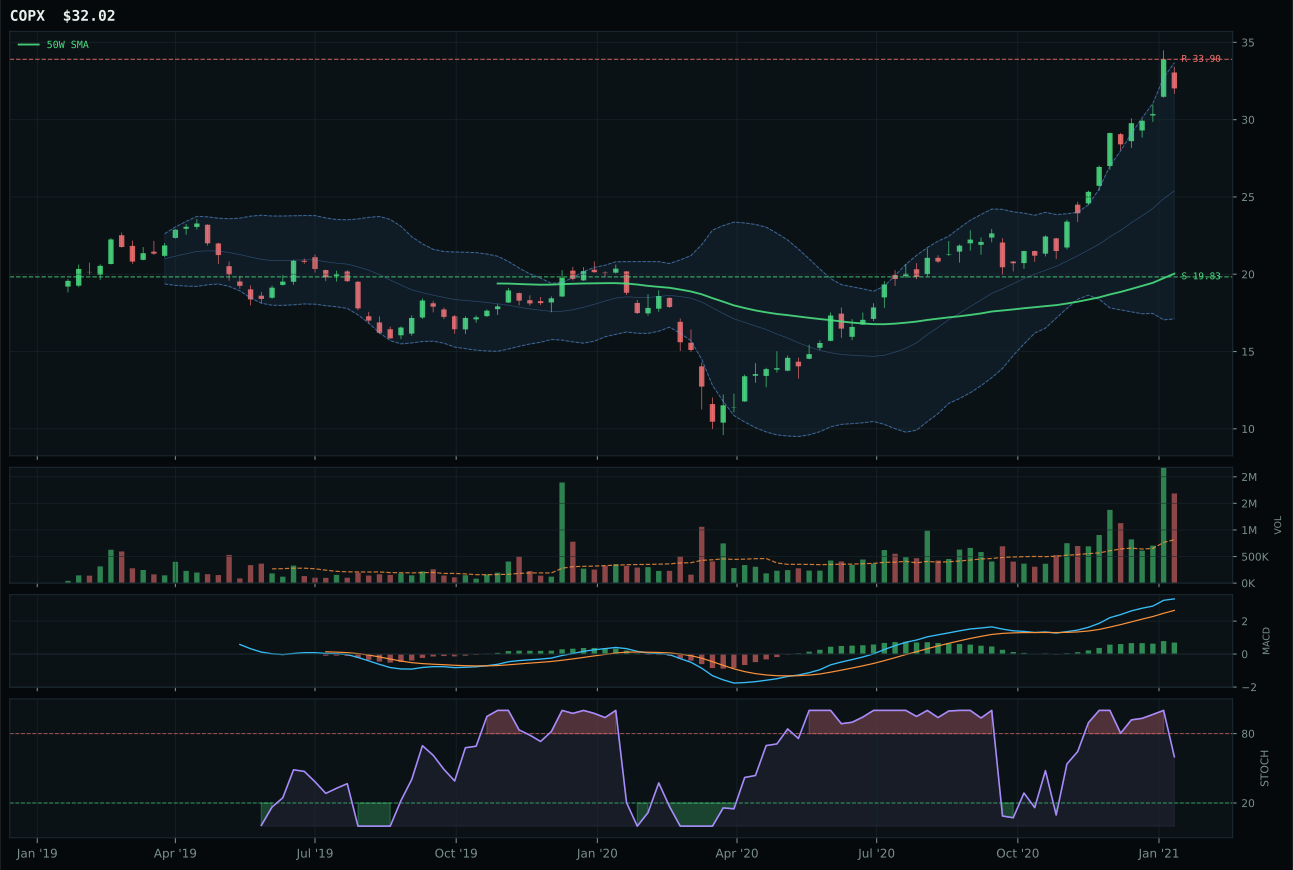
COPX has a vertical extension profile with 42.9% 13-week relative strength versus SPY.
A failed hold above support would weaken the setup.
Actionable but governed by invalidation levels.
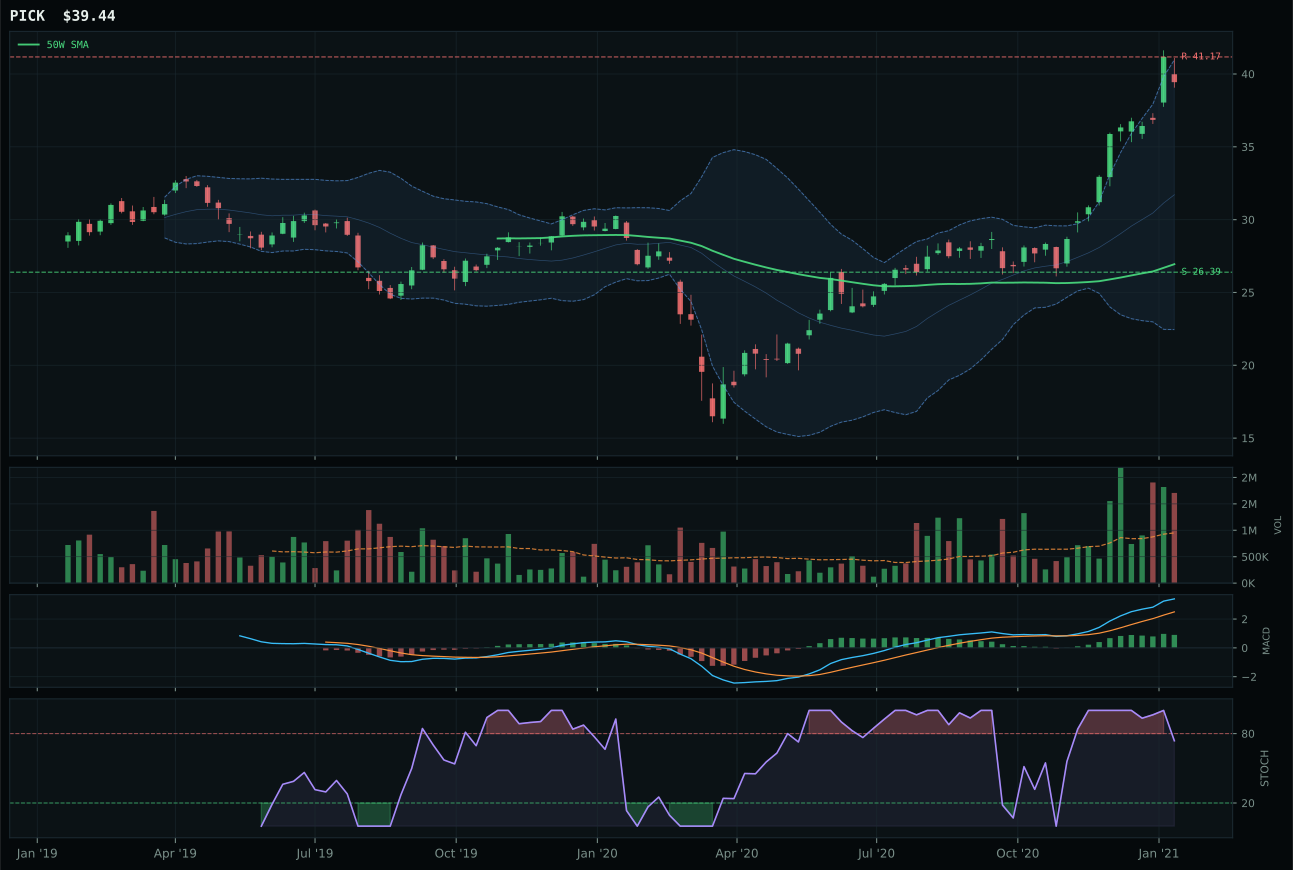
PICK has a vertical extension profile with 34.3% 13-week relative strength versus SPY.
A failed hold above support would weaken the setup.
Actionable but governed by invalidation levels.
REMX wins and anchors the 20% Industrial Metals allocation by delivering a rare combination of pristine trend, explosive momentum, and substantive volume confirmation that validates each layer of the move: 77.8% 13-week return with 69.6% SPY-relative strength and 26.8% category-relative leadership, all supported by 1.13x above-average volume and MACD bullish and improving. The 75.9% extension above the 50-week is severe, but stochastic RSI at 0.79 (falling/neutral) signals momentum is already decelerating into overbought—a sign that the extended move is not euphoric but rather a measured rare-earth supply-chain squeeze. COPX lost the category decision despite showing 100.0 trend (matching REMX) because its timing at 45.0 lags REMX's 53.0, volume shows distribution pressure rather than participation, and category-relative strength flattens at 0.0%. The volume-price persistence gap (REMX's 96.9 confirmation and 100.0 persistence versus COPX's implied weaker profile) is decisive: rare earths are being accumulated by buyers who believe supply constraints will persist, whereas copper shows signs of seller participation into strength.
Industrial Metals earns 10% allocation as one of the two top-2 categories at a 60.5 score, reflecting both superior technical evidence and powerful macro alignment. The category's 75.0/100 macro fit and active descriptors (Late-Cycle Reflation +10, metals scarcity +14, commodity breadth +10) make it a core reflation play rather than a satellite. REMX's 75.9% extension above the 50W creates timing risk—further upside is constrained to 4.0% before resistance—but the risk-reward structure (45.8/100) is acceptable because downside to support (94.5%) provides a defined invalidation zone. The category allocation should be monitored closely: if REMX closes below 37.22 support or if stochastic RSI rolls over from falling/neutral, the position should be trimmed to 5%. Conversely, if REMX clears 75.42 resistance on volume confirmation and the metals scarcity theme intensifies, Industrial Metals could expand toward 15% as the portfolio's primary exposure to commodity supply-chain dislocation.
Agriculture & Livestock — WEAT
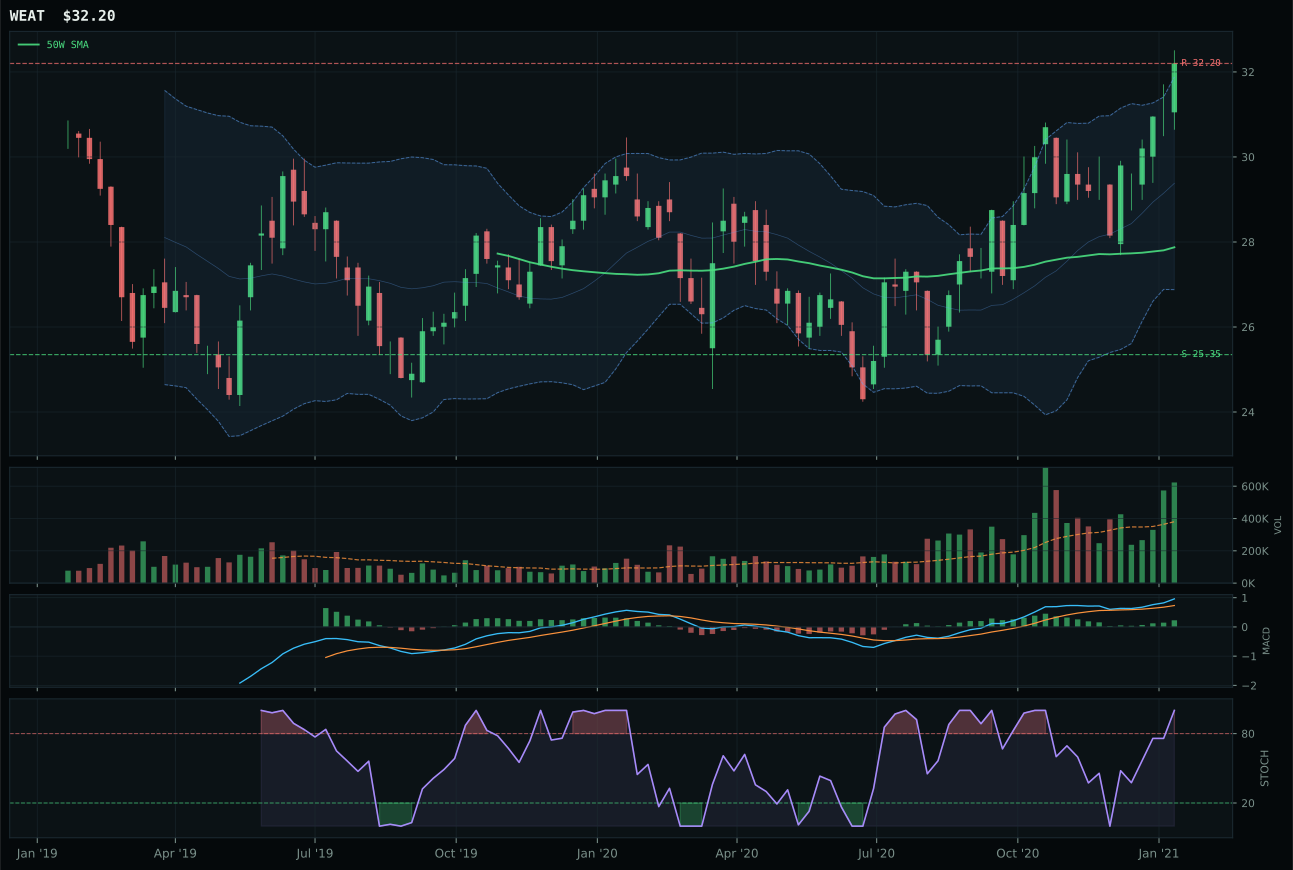
WEAT has a vertical extension profile with -0.8% 13-week relative strength versus SPY.
A failed hold above support would weaken the setup.
Actionable but governed by invalidation levels.
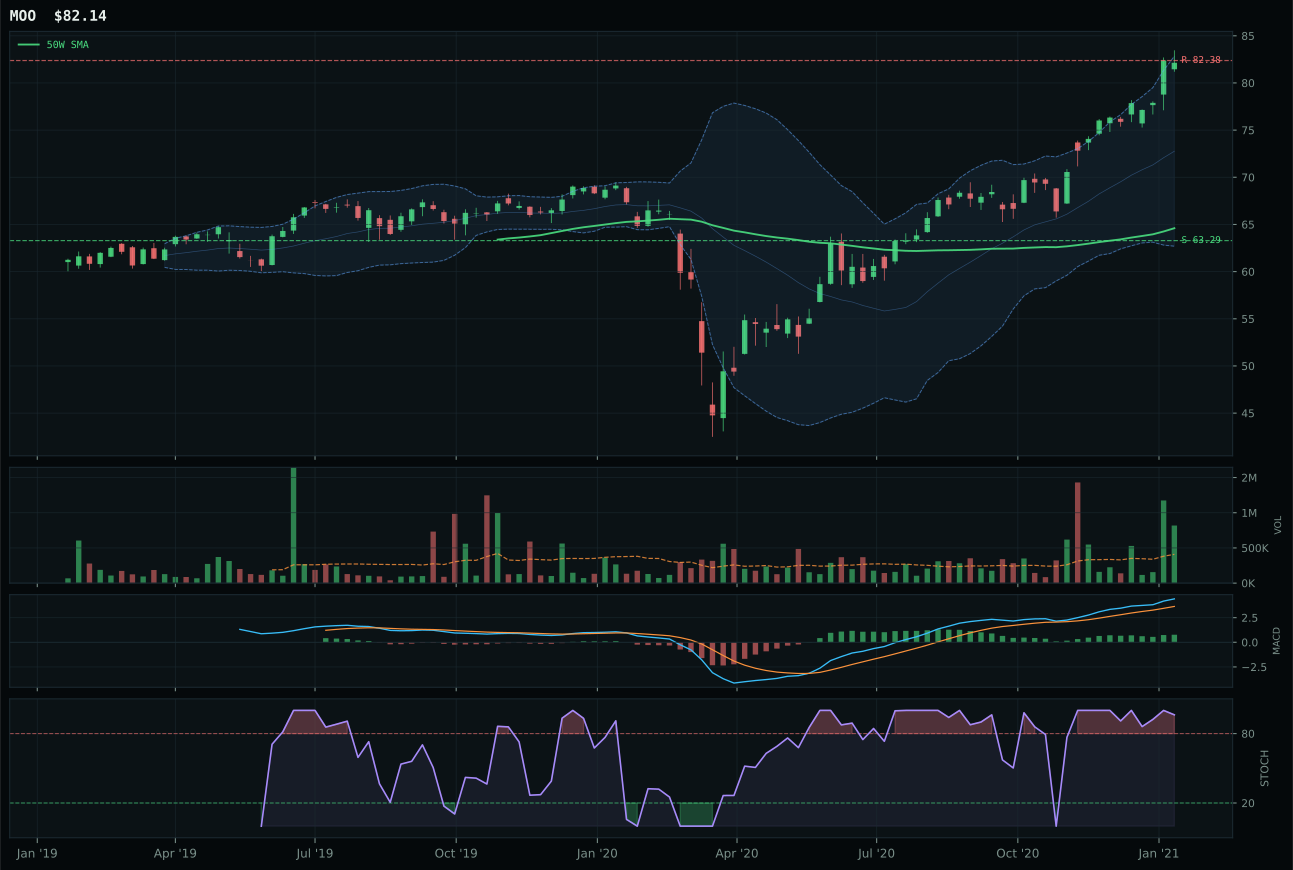
MOO has a vertical extension profile with 10.1% 13-week relative strength versus SPY.
A failed hold above support would weaken the setup.
Actionable but governed by invalidation levels.
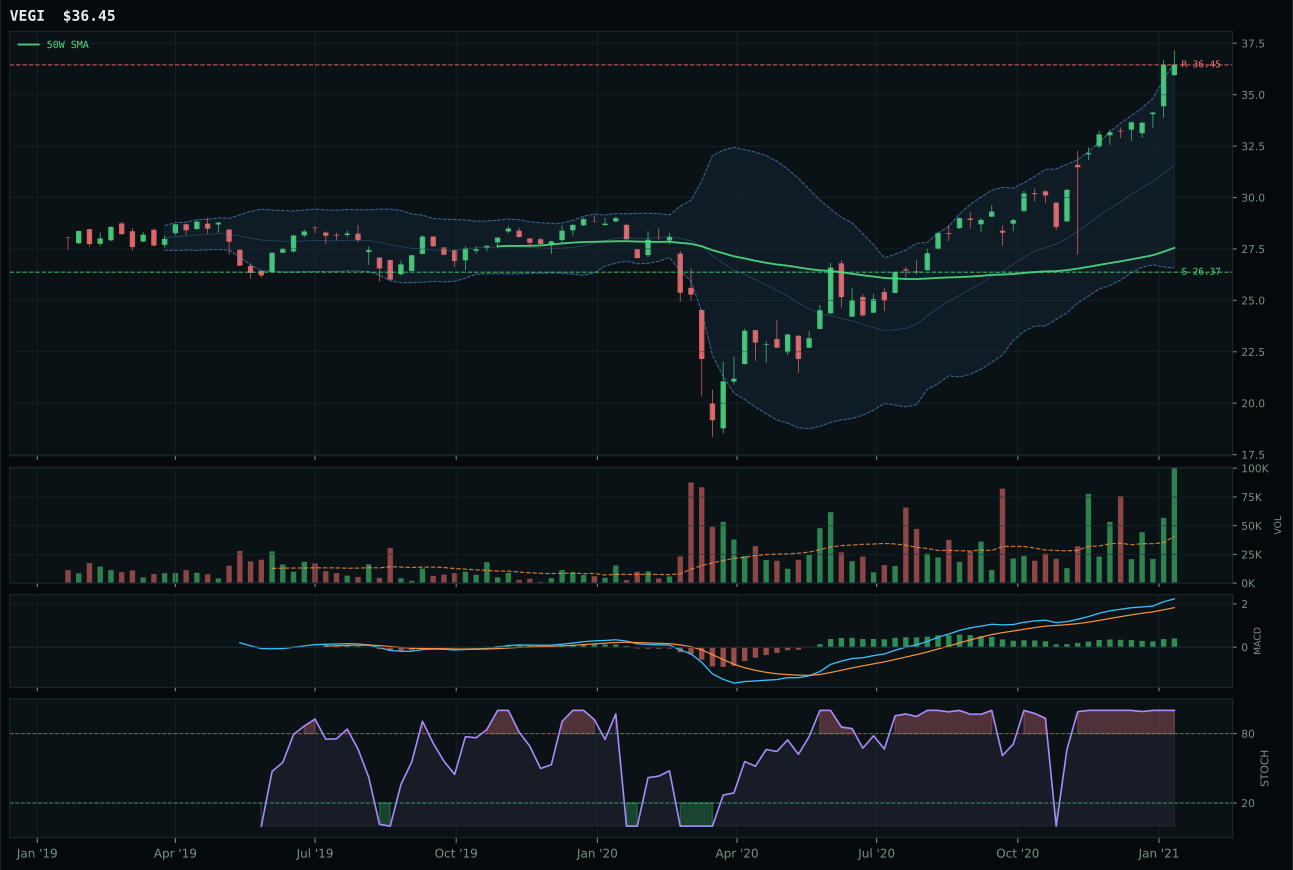
VEGI has a vertical extension profile with 12.7% 13-week relative strength versus SPY.
A failed hold above support would weaken the setup.
Tracked, but not top-2 eligible because: .
WEAT wins over MOO on both timing and volume conviction: the 50-week extension is tighter at 15.5% versus MOO's 27.2%, MACD is bullish and improving (superior to MOO's profile), and volume confirmation is accumulation at 1.64x the 20-week average versus MOO's distribution pressure. The risk-reward gap is decisive: WEAT offers 47.3 on the downside-to-support measure versus MOO's 29.2, meaning this winner has room to consolidate without invalidating its setup, whereas MOO is already stretched. Structure scores reflect WEAT's edge: 80.1 versus MOO's 75.0, driven by superior cleanliness (58.3 versus unspecified MOO baseline) and near-identical compression. Category-relative strength swings in WEAT's favor at -10.9% versus 0.0%, a counterintuitive signal that WEAT underperformed its own category peers over 13 weeks yet still won the composite decision—proof that momentum confirmation (75.2) and volume-price persistence (70.7) matter more than past relative standing when entry risk is being penalized.
Agriculture & Livestock earns 5% allocation despite a category score of 59.2 because it ranks fourth overall, trailing Industrial Metals, Traditional Energy, and their respective macro tailwinds. However, the category's 90.0/100 macro fit is exceptional: supply shortage, inflation pressure, real asset sponsorship, and commodity breadth positive are all live and weighted heavily in the reflation narrative. WEAT's -0.8% relative strength versus SPY would normally be a red flag, but it is offset by the category's structural scarcity theme and MACD confirmation (bullish and improving). The allocation is sized at 5% as a tactical reflation trade, not a core position, because the thirteen-week return (7.3%) is well below the category median and suggests that agricultural commodities are underperforming broader commodity sponsorship. To graduate WEAT to 10%, the ETF would need to turn positive relative strength versus SPY and break above its 32.20 resistance with conviction, attracting fresh institutional flow rather than riding existing category momentum.
AI — SMH
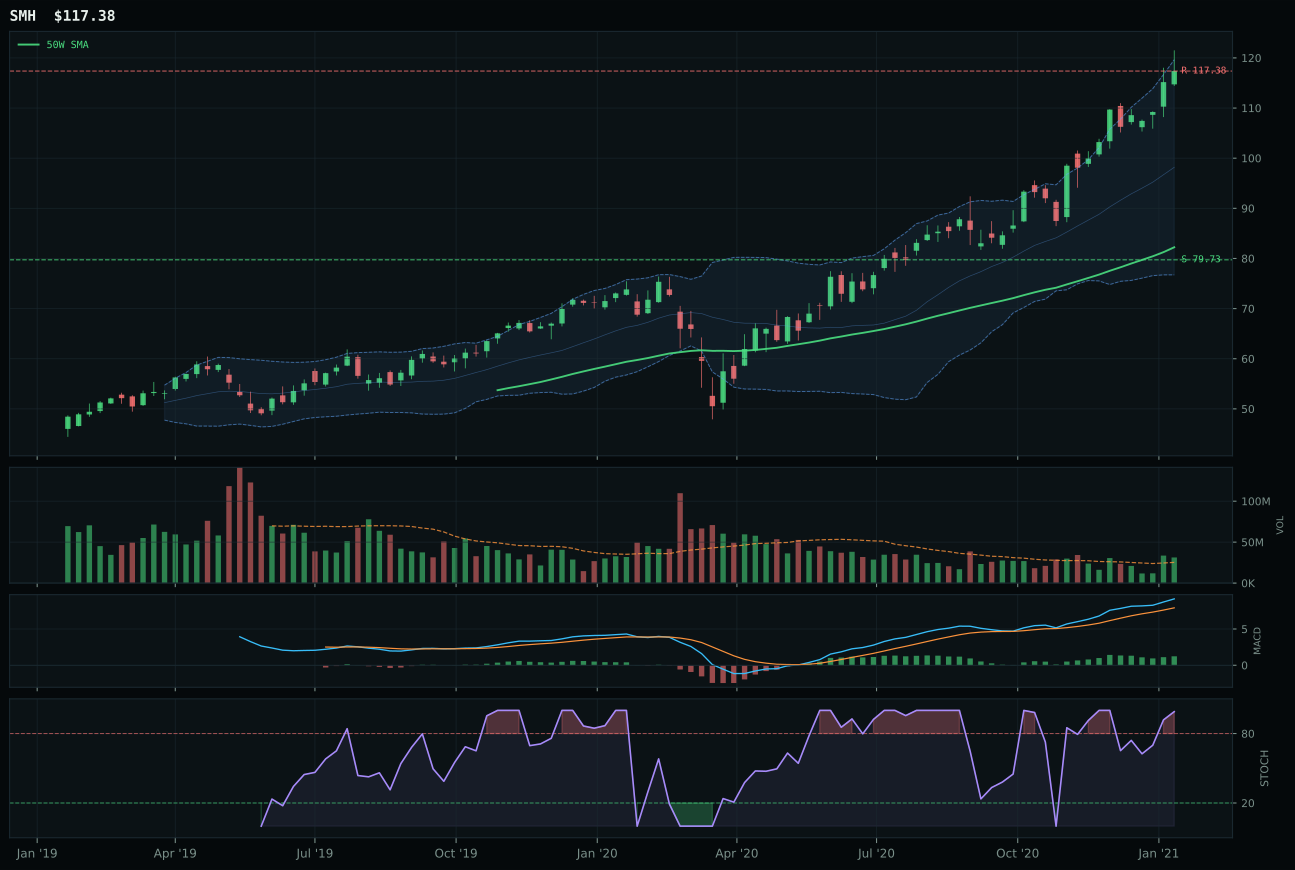
SMH has a vertical extension profile with 17.7% 13-week relative strength versus SPY.
A failed hold above support would weaken the setup.
Actionable but governed by invalidation levels.
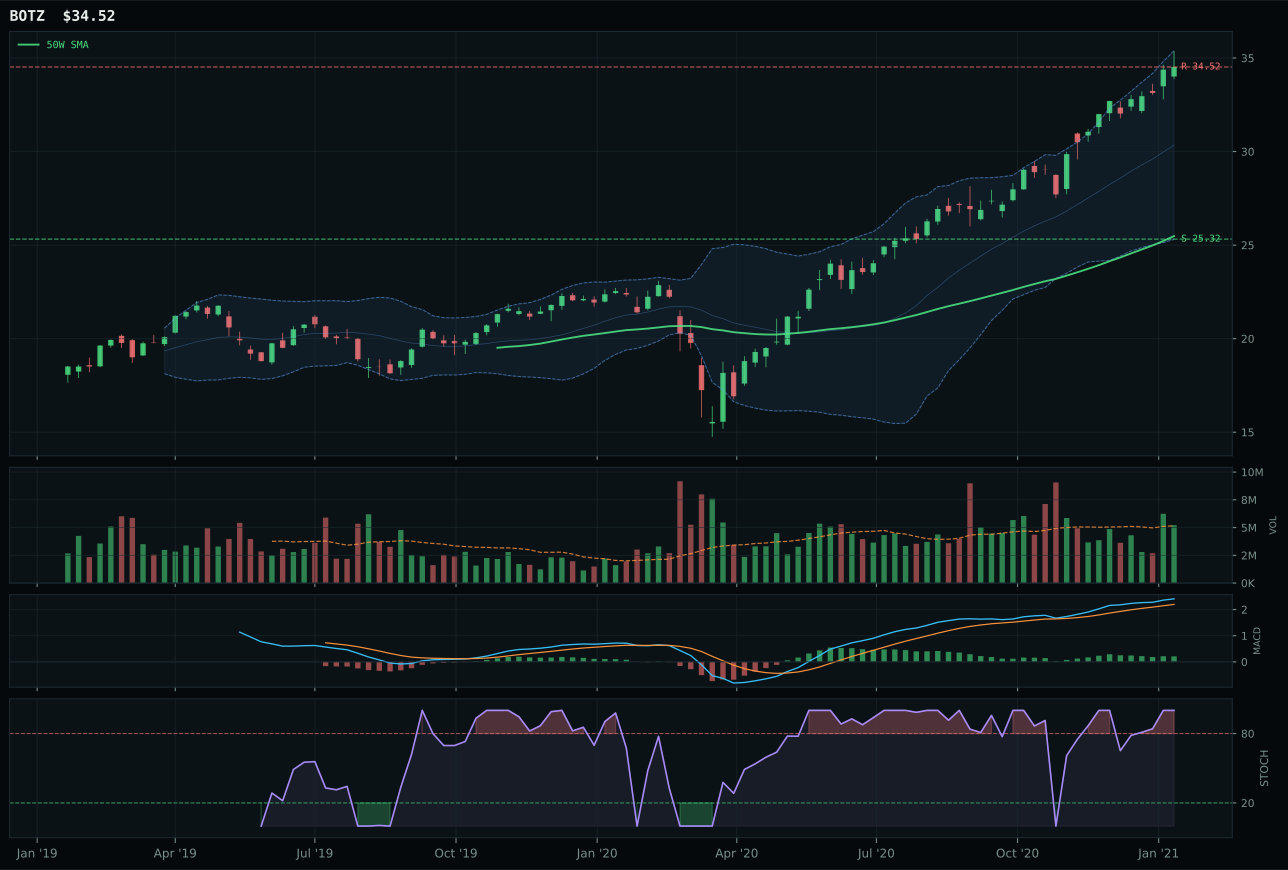
BOTZ has a vertical extension profile with 11.3% 13-week relative strength versus SPY.
A failed hold above support would weaken the setup.
Actionable but governed by invalidation levels.
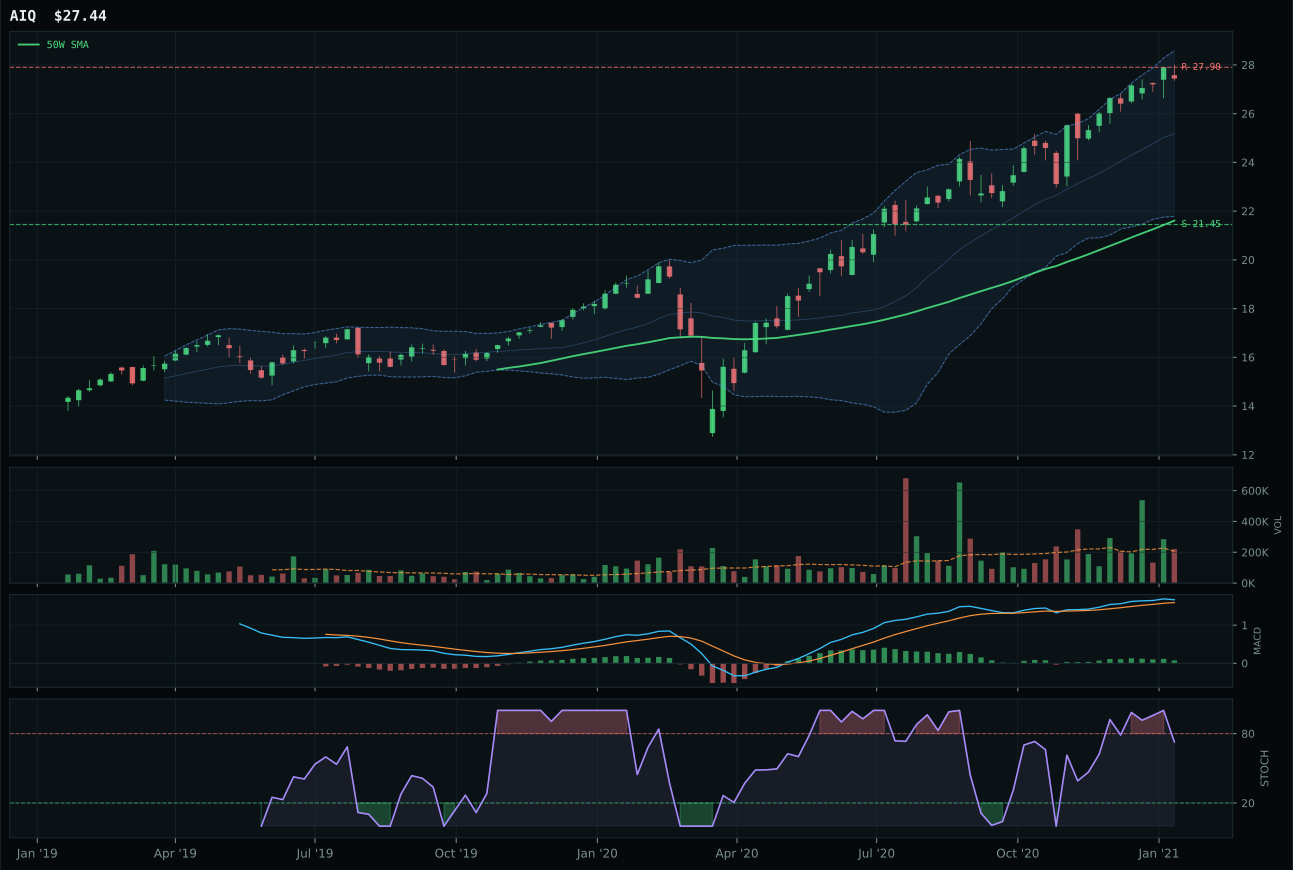
AIQ has a vertical extension profile with 3.0% 13-week relative strength versus SPY.
A failed hold above support would weaken the setup.
Tracked, but not top-2 eligible because: .
SMH wins over BOTZ by monetizing the semiconductor compute advantage in ways BOTZ's robotics-and-physical-AI thesis cannot match: above-average volume participation at 1.24x the 20-week average versus neutral, a 6.5% category-relative strength lead, and a 13-week return of 25.9% that delivers both conviction and velocity. Both setups sit extended near the 52-week high with overbought stochastic RSI, but SMH's volume profile proves the move is still attracting buyers into the near-Fibonacci 0.236 zone, whereas BOTZ shows no such inflow confirmation. The 37.6-basis-point gap in trend scores (100 versus 100) masks a real separation: SMH's 50-week slope at 1.2% versus BOTZ's 1.0% is subtle but meaningful when combined with SPY-relative strength of 17.7% versus 11.3%. Risk-reward appears symmetrical on paper (40 versus 41), but SMH's superior volume-price persistence (78.4 versus 71 composites) signals that new money is still sponsoring the move into overbought territory.
AI earns 5% allocation as the third-ranked category at a score of 54.6, beneath only the two top-2 positions but above six other categories. The AI growth sponsorship descriptor is firing hard (+14), providing crucial macro lift in a late-cycle environment that otherwise penalizes extension and timing risk. Yet SMH's overbought momentum and 42.7% extension above the 50W create an asymmetric risk profile: downside to support runs 47.2% while upside to resistance is essentially flat. The category's 54.0/100 macro fit means it is riding a temporary tailwind, not a structural macro regime shift. SMH would require a consolidation or pullback to a less extended zone to improve its risk-reward posture; until that happens, the 5% allocation is sized appropriately as a conviction play on AI supply-chain dominance rather than a core position. If the category score falls below 45 or SMH breaks below its 50W support, allocation should exit entirely.
Defense & Aerospace — XAR
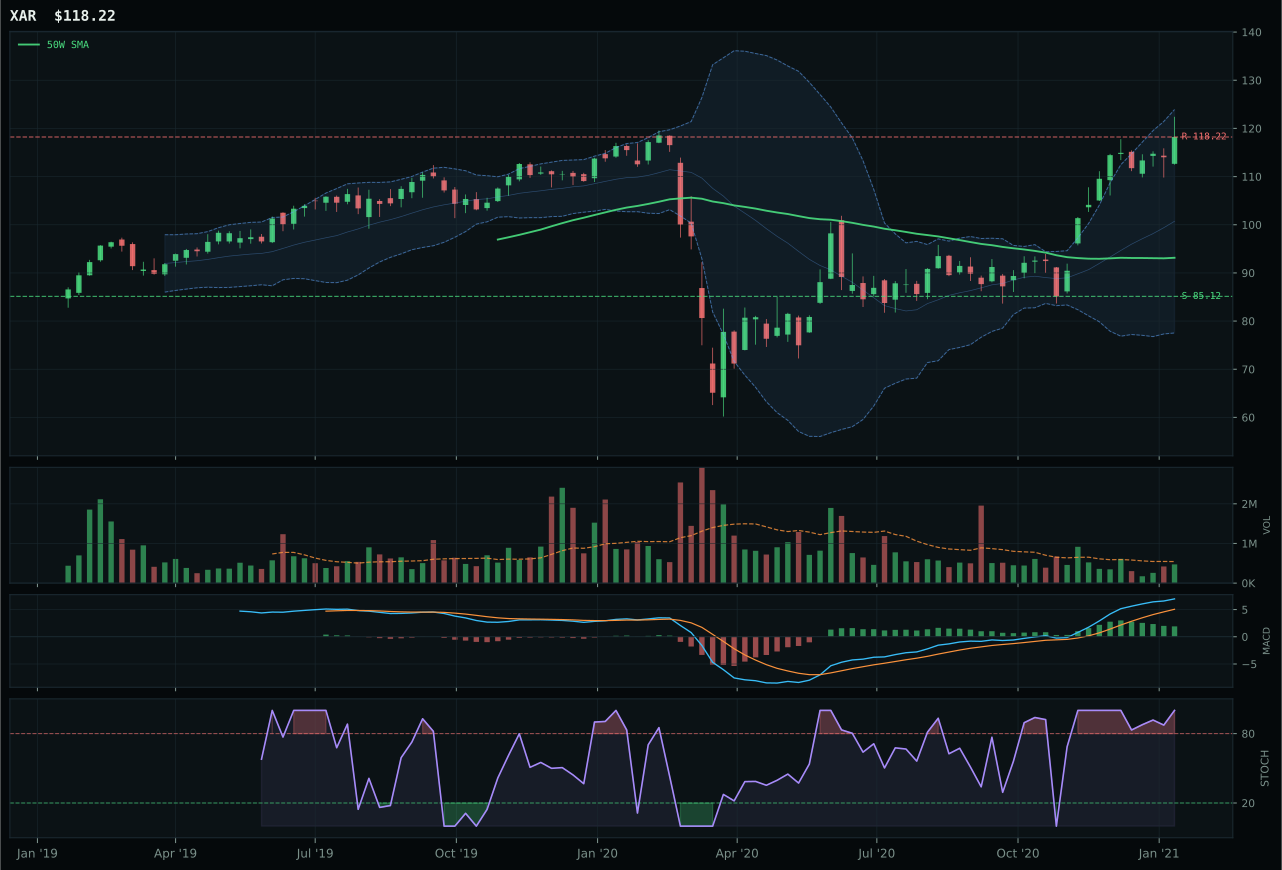
XAR has a vertical extension profile with 19.5% 13-week relative strength versus SPY.
A failed hold above support would weaken the setup.
Actionable but governed by invalidation levels.
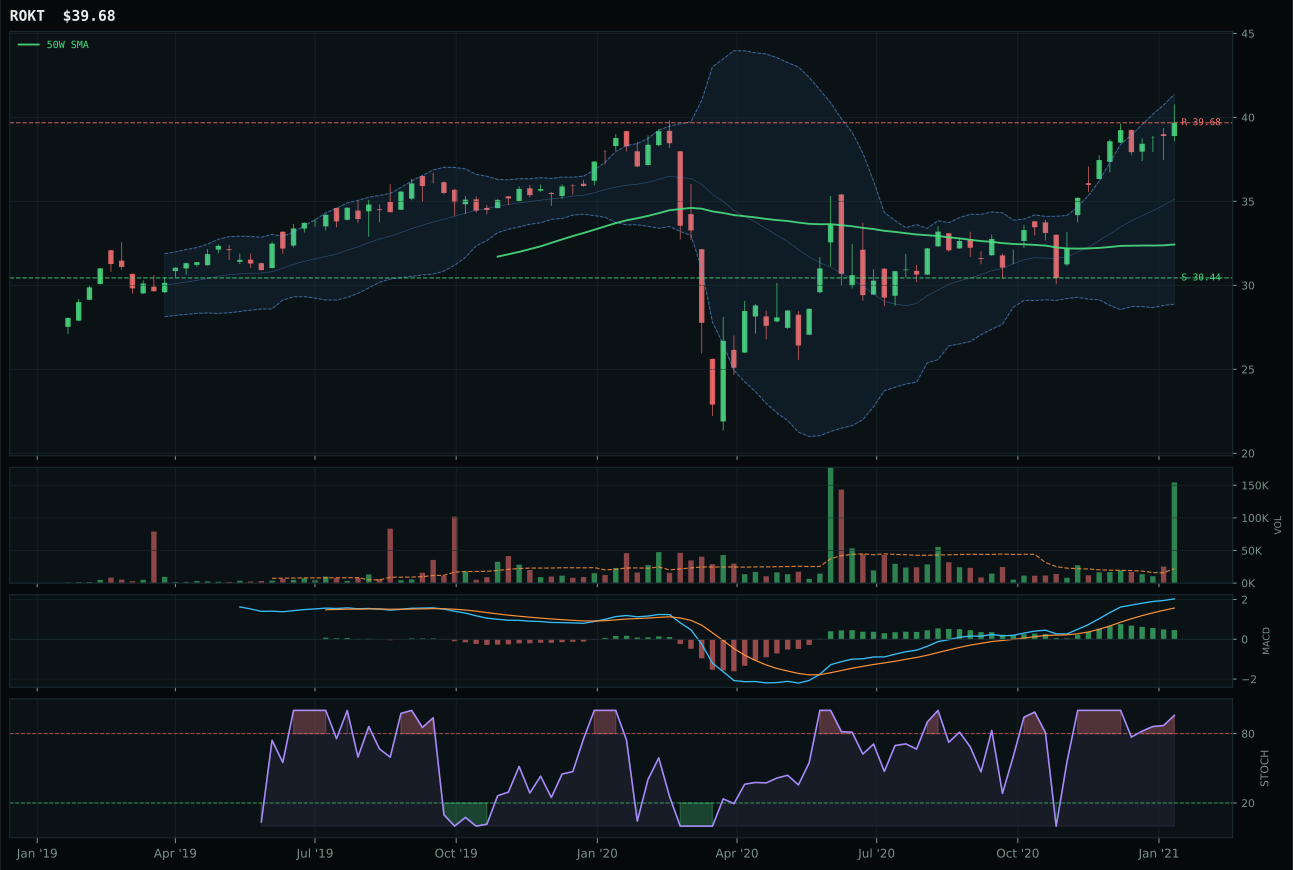
ROKT has a vertical extension profile with 10.4% 13-week relative strength versus SPY.
A failed hold above support would weaken the setup.
Tracked, but not top-2 eligible because: .
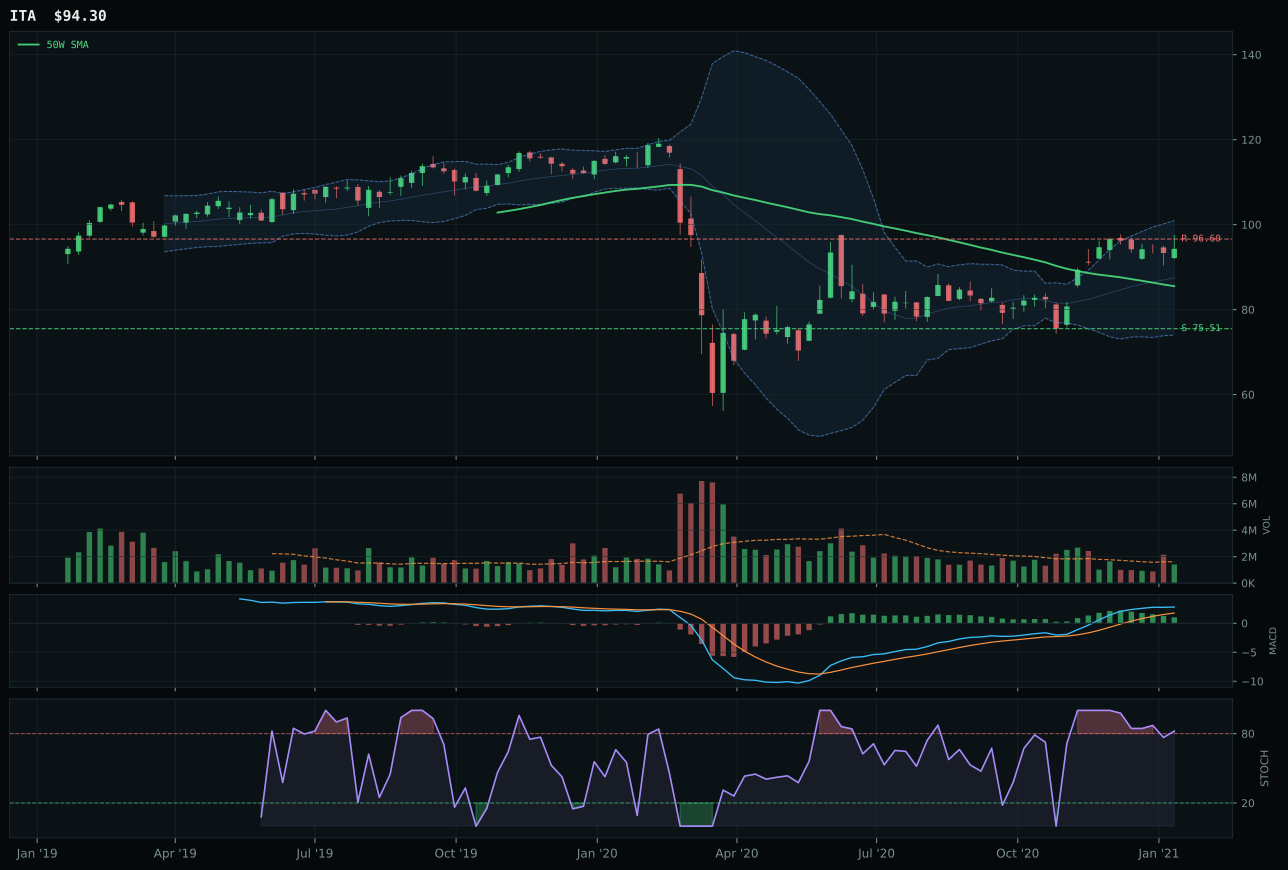
ITA has a neutral structure profile with 5.7% 13-week relative strength versus SPY.
A failed hold above support would weaken the setup.
Actionable but governed by invalidation levels.
XAR wins by a commanding 16.8-point margin over ROKT, translating technical superiority into categorical dominance through pure momentum: 27.7% over 13 weeks, 19.5% SPY-relative strength, and category-relative outperformance of 9.1%. Both setups occupy the vertical-extension zone near the 52-week high with overbought stochastic RSI at 1.00, but XAR's neutral volume at 0.87x the 20-week average is preferable to ROKT's accumulation-confirmation pattern because it signals the sharp move is nearing a natural pause rather than accelerating into euphoria. XAR's structure score of 77.7 reflects cleaner Fibonacci compression (73.7 versus ROKT's unstated baseline), and its 100.0 momentum confirmation versus ROKT's matching 100.0 is undermined by ROKT's weaker category-relative standing—0.0% versus 9.1%. The gap is less about technical elegance and more about which name has the institutional sponsorship within its own category basket, and XAR's clear lead suggests better breadth of new-buyer participation.
Defense & Aerospace receives 5% allocation despite posting a 48.4 category score and ranking outside the top-two tier. Late-Cycle Reflation actually helps this exposure (+6), and the category's 57.0/100 macro fit is the highest among non-top-two positions, yet the allocation remains modest because XAR's risk-reward (40.7/100) is constrained: no upside to resistance and 38.9% downside to support at 85.12. The category qualifies as a satellite position in a reflation playbook—government spending, defense budgets, and aerospace supply-chain recovery are all in-theme—but it is subordinate to energy and metals because XAR is already extended and the macro sponsorship, while real, is less acute than commodity scarcity. To push Defense & Aerospace to 10% or higher, XAR would need to complete a pullback-and-base pattern near support and rebuild MACD divergence with fresh momentum, creating a lower-risk entry point than the current 26.9% above the 50W.
Technology — XLK
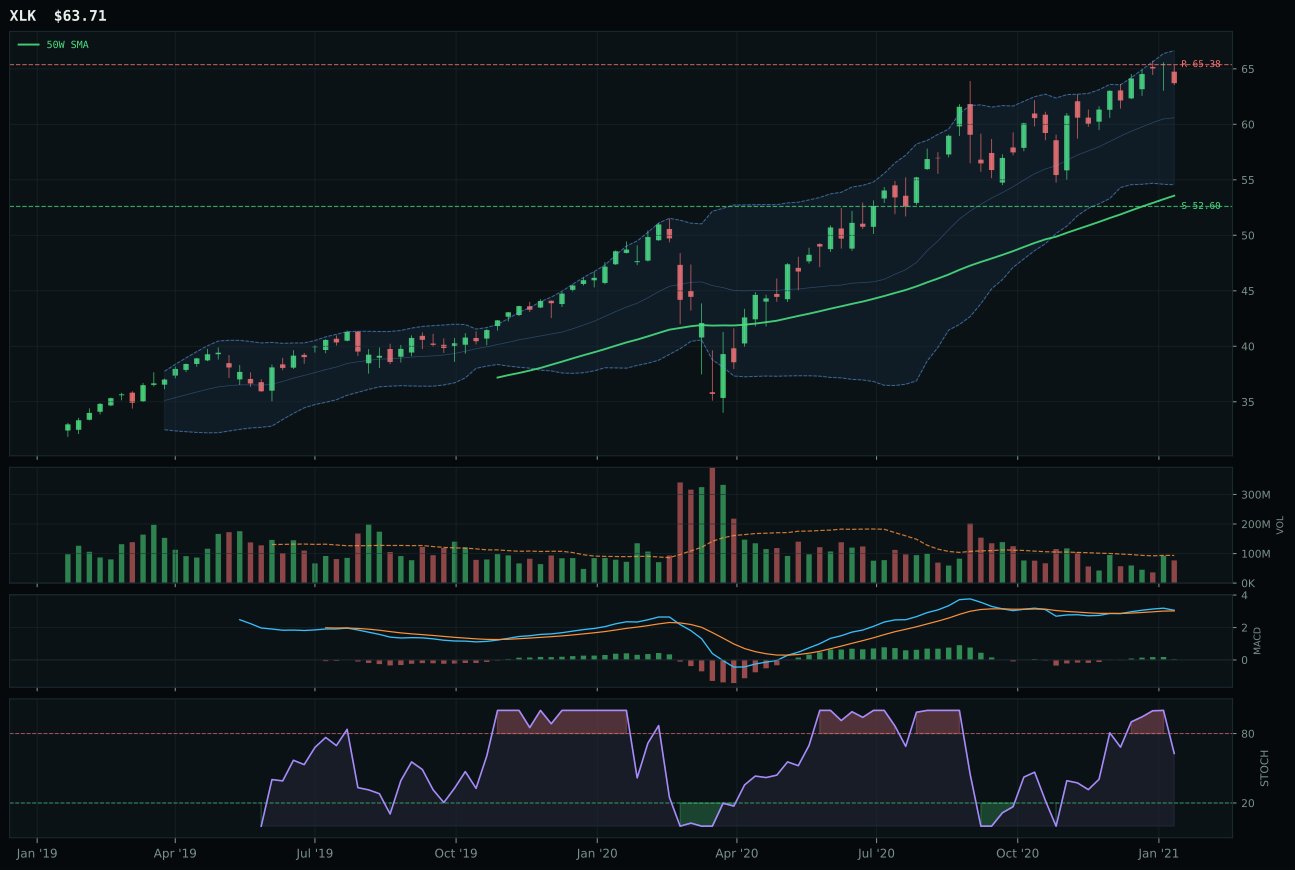
XLK has a vertical extension profile with -3.0% 13-week relative strength versus SPY.
A failed hold above support would weaken the setup.
Actionable but governed by invalidation levels.
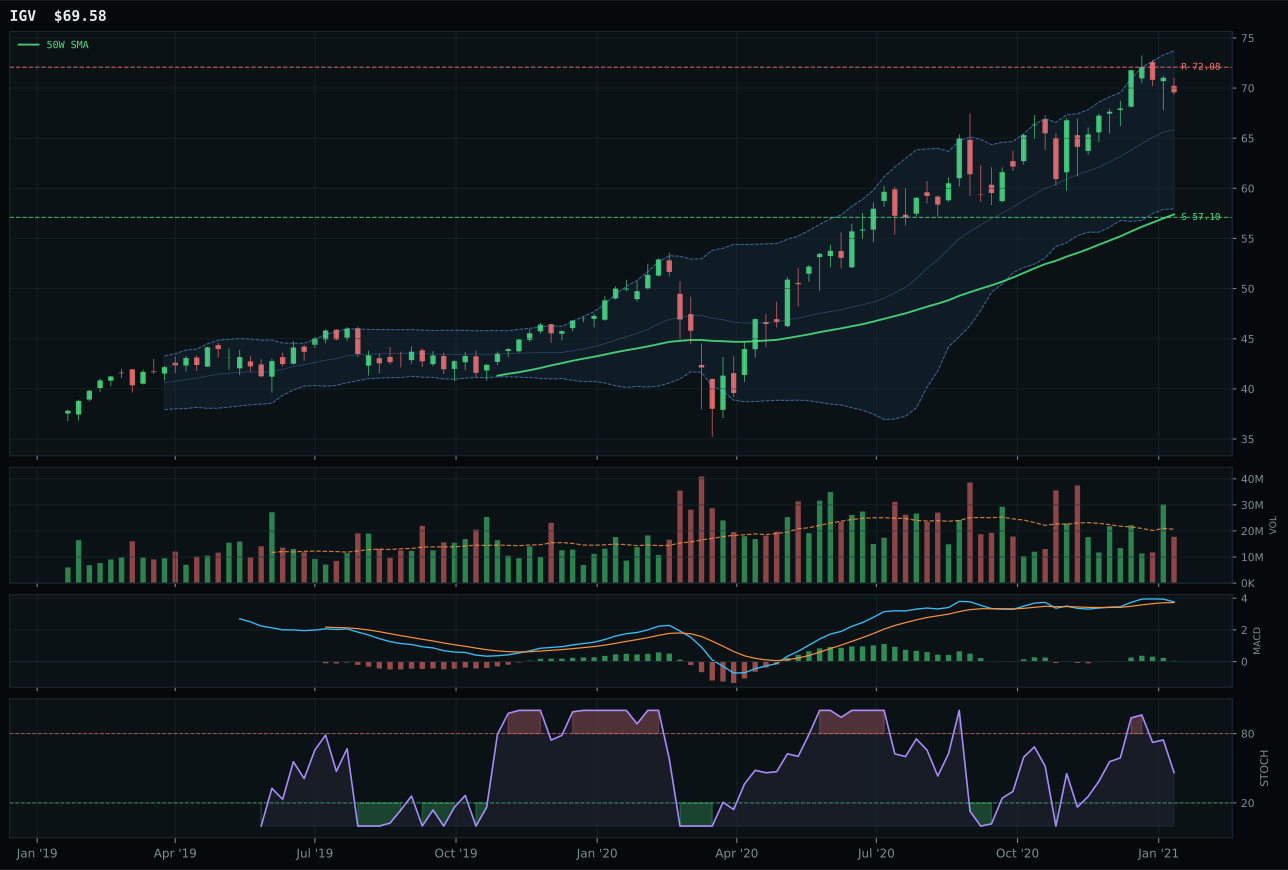
IGV has a vertical extension profile with -3.3% 13-week relative strength versus SPY.
A failed hold above support would weaken the setup.
Actionable but governed by invalidation levels.
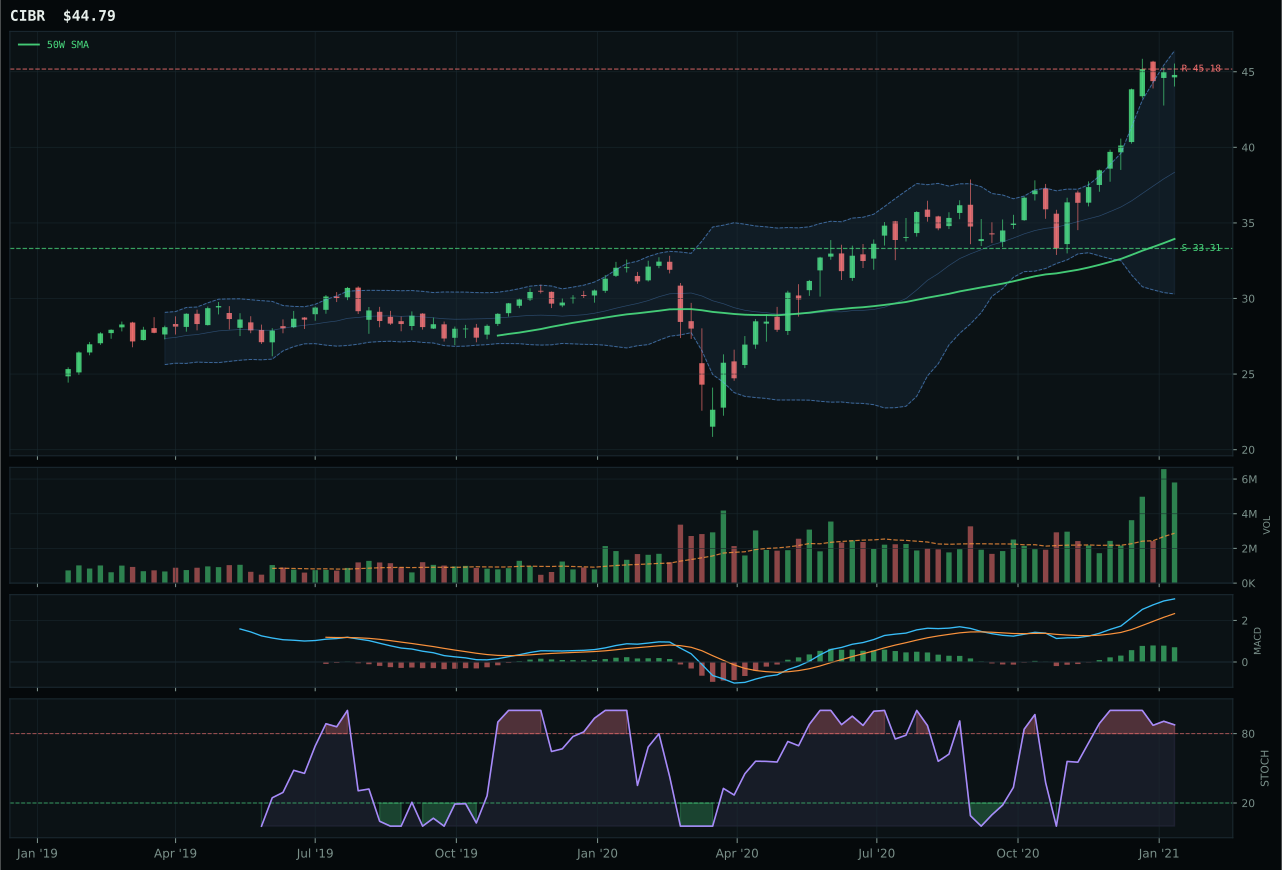
CIBR has a vertical extension profile with 12.4% 13-week relative strength versus SPY.
A failed hold above support would weaken the setup.
Actionable but governed by invalidation levels.
XLK wins the category on the thinnest margin—a 0.6-point gap versus IGV—because it held a 0.3% category-relative strength advantage while both trades displayed identical bullish-but-flattening MACD signatures and overbought stochastic RSI rolling over from the 52-week high. The setup is a vertical extension 18.9% above the 50-week line with neutral volume participation at 0.82x the 20-week average, meaning buyers are neither reinforcing nor abandoning the move. IGV's enterprise-software duration profile proved vulnerable to the active liquidity stress and credit stress headwinds baked into the late-cycle reflation regime, dragging its SPY-relative strength to -3.3% versus XLK's -3.0%. The real tension here is not between two strong candidates but between a category that rates 46.8 on composite merit and two entries so interchangeable that the 3/2/1 proof order hinges on single-digit persistence differences rather than directional clarity.
Technology receives 5% allocation despite a final category score of 46.8, placing it well outside the top-two positions occupied by Industrial Metals (60.5) and Traditional Energy (86.1). The late-cycle reflation macro regime actively penalizes extended momentum plays in duration-sensitive growth—liquidity stress and credit stress are both live headwinds—while AI growth sponsorship and positive risk appetite offer only partial offsets. XLK's positioning as broad profitable technology makes it a reasonable hedge within a smaller allocation slice, but the category's macro fit (44.0/100) reflects that this is defensive capital allocation. The stochastic RSI rolling into falling/neutral territory across both leaders signals fading momentum confirmation, a condition that typically precedes either a consolidation zone or a test of the 50W support. To earn top-2 status, Technology would need to see XLK or IGV break above resistance with volume confirmation and achieve positive relative strength versus SPY—neither condition is present.
Nuclear Energy — URA
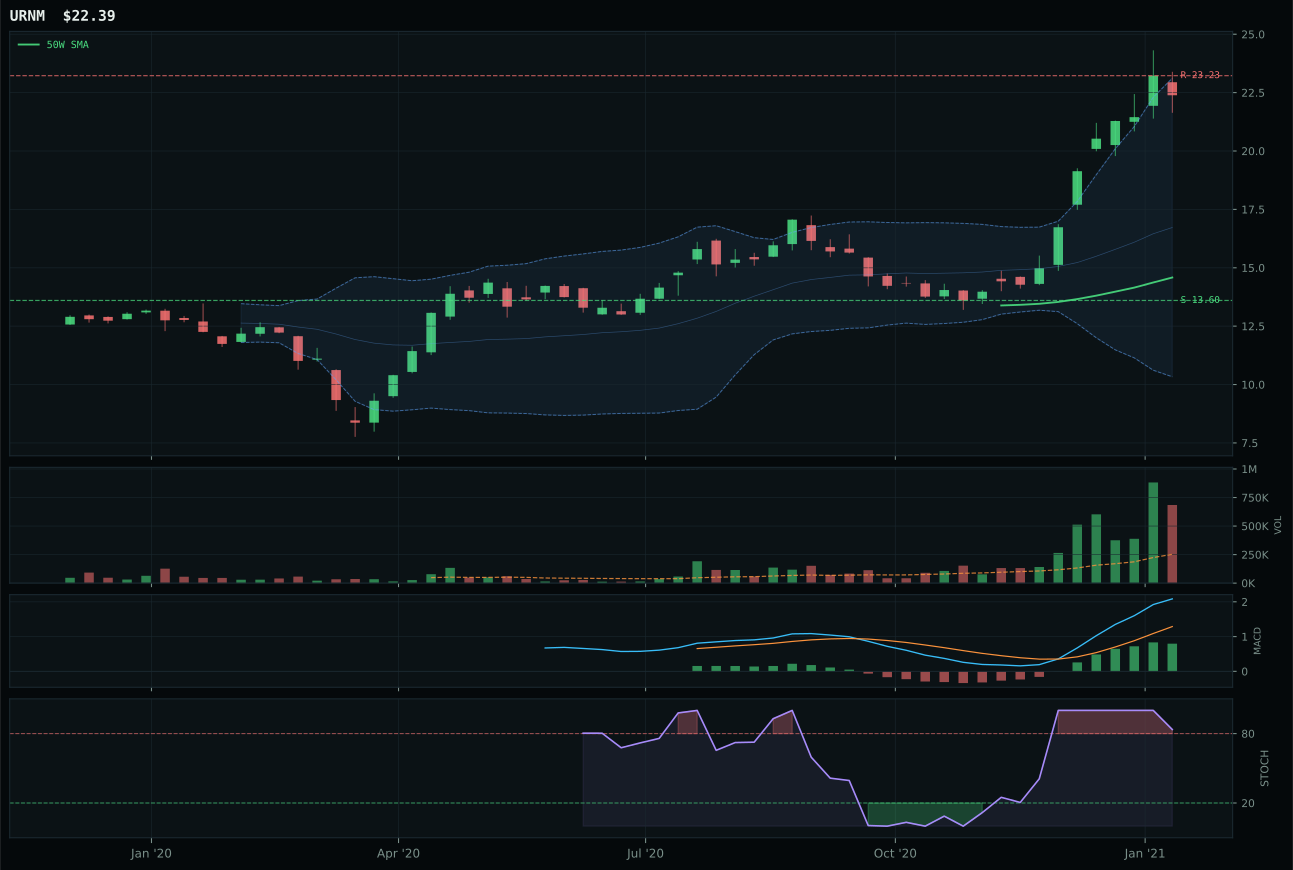
URNM has a vertical extension profile with 54.4% 13-week relative strength versus SPY.
A failed hold above support would weaken the setup.
Tracked, but not top-2 eligible because: .
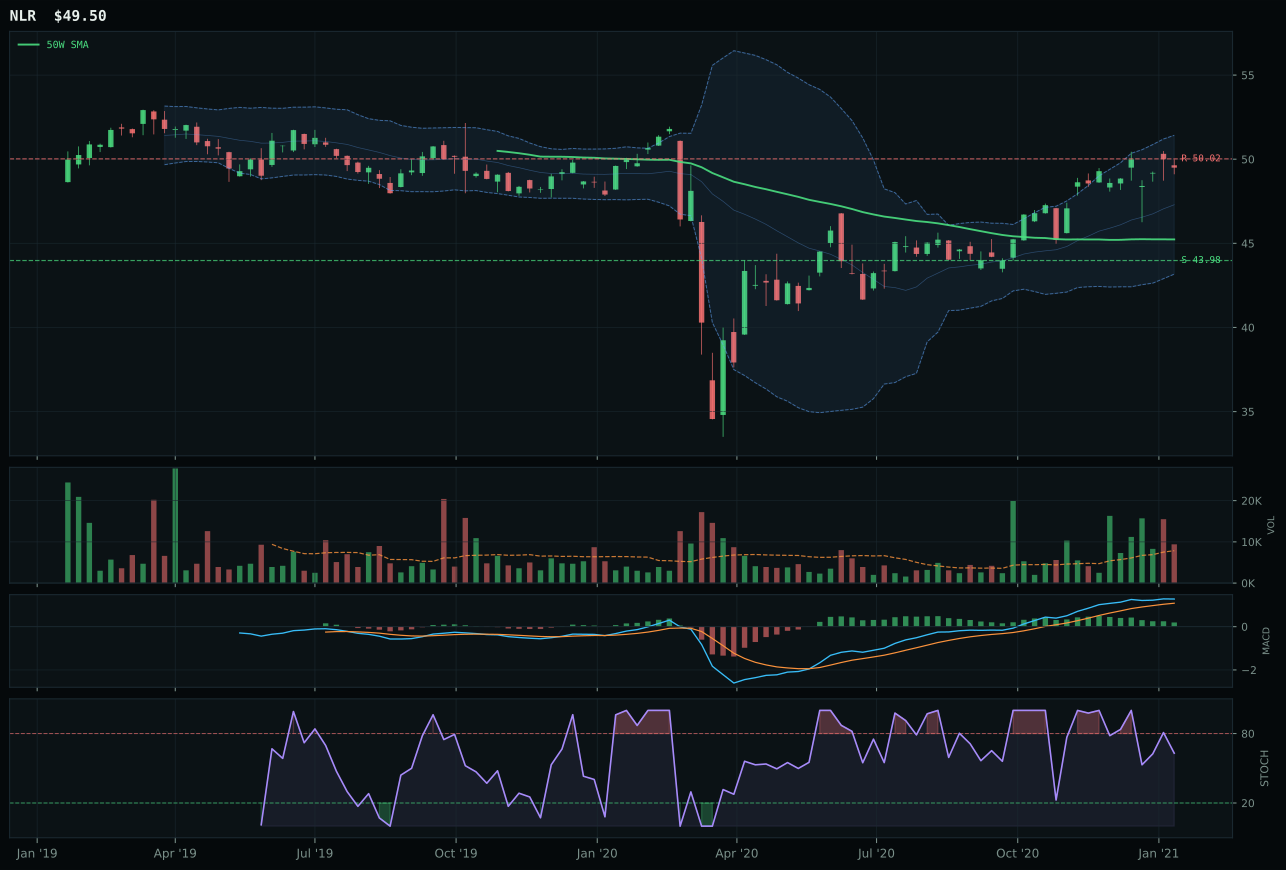
NLR has a neutral structure profile with -2.4% 13-week relative strength versus SPY.
A failed hold above support would weaken the setup.
Tracked, but not top-2 eligible because: .
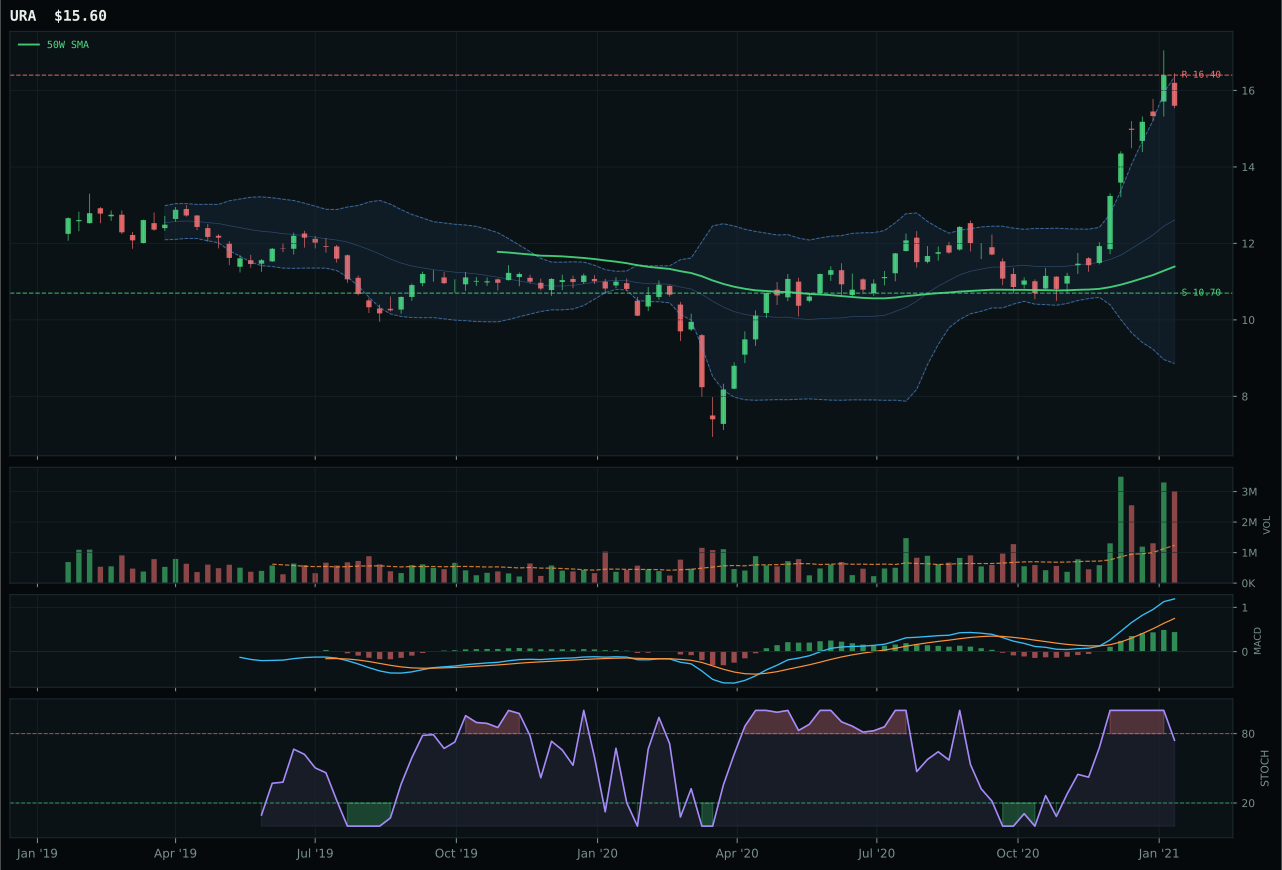
URA has a vertical extension profile with 37.6% 13-week relative strength versus SPY.
A failed hold above support would weaken the setup.
Actionable but governed by invalidation levels.
URA wins the Nuclear Energy category with a 29.4-point lead over runner-up URNM because timing and entry risk diverge sharply: URA sits 36.9% extended with a defined risk-reward profile (38.9), while URNM is 53.5% extended with identical risk-reward (38.0) but at a much further distance from support. URA's 2.44x volume at distribution pressure is a concern, yet the MACD is bullish and improving—a positive divergence that suggests sellers are not aggressive—whereas URNM shows overbought stochastic RSI rolling over, signaling momentum is aging. Both charts display near-identical 100.0 trend scores and 100.0 momentum confirmation from 45.8% and 62.6% 13-week returns respectively, but URA's structure is slightly cleaner (75.0 versus URNM's 74.0) and its timing score wins decisively (53.0 versus 35.0) because the stochastic differential matters: URA at 0.74 falling/neutral versus URNM at overbought rolling over means URA is already in pullback mode while URNM is still topping. Category-relative strength at 0.0% (URA) versus 16.8% (URNM) signals URNM has outperformed its peers, but from an extended entry that URA's tighter positioning avoids.
Nuclear Energy receives 5% allocation despite a category score of 44.9, the third-lowest ranked category with allocation. The macro fit (69.0/100) benefits from energy scarcity (+9), real asset sponsorship (+7), and late-cycle reflation (+7), but distribution-pressure volume across the category and URA's extreme extension (36.9% above 50W) limit conviction. The category is a tactical reflation hedge rather than a core position: uranium demand is real and structural, but the technical setup has already run hard (45.8% thirteen-week return), and stochastic RSI falling/neutral is a warning flag that momentum is exhausting. Allocation is sized modestly because URNM and NLR both underperformed URA technically, indicating the category lacks broad sponsorship. To upgrade Nuclear Energy to 10%, URA would need to consolidate near its 13.60–14.66 support zone, rebuild MACD divergence, and show renewed accumulation volume—confirming that the pullback is institutional demand rather than distribution. Any break below 10.70 support should trigger an exit.
Precious Metals — GLD
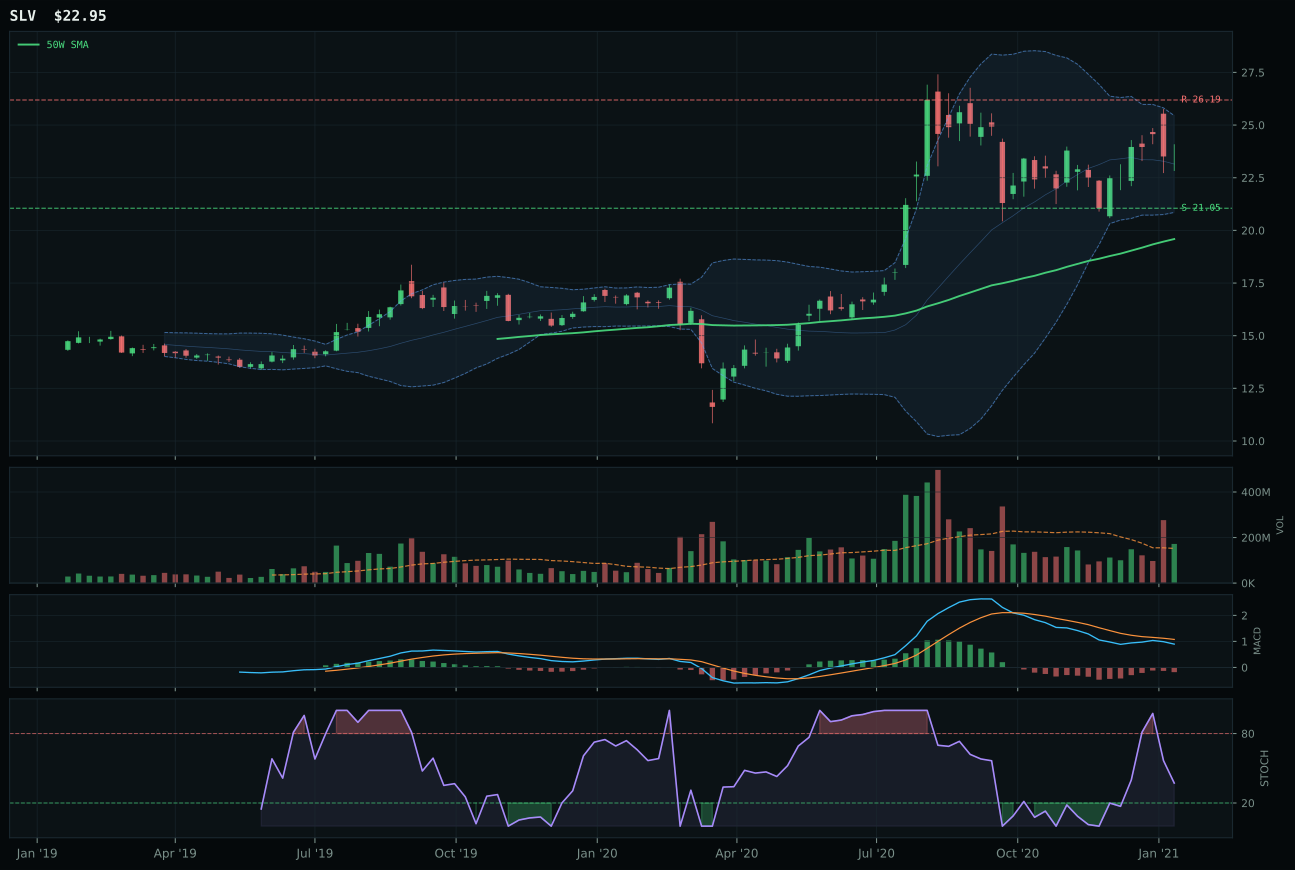
SLV has a vertical extension profile with -5.8% 13-week relative strength versus SPY.
A failed hold above support would weaken the setup.
Actionable but governed by invalidation levels.
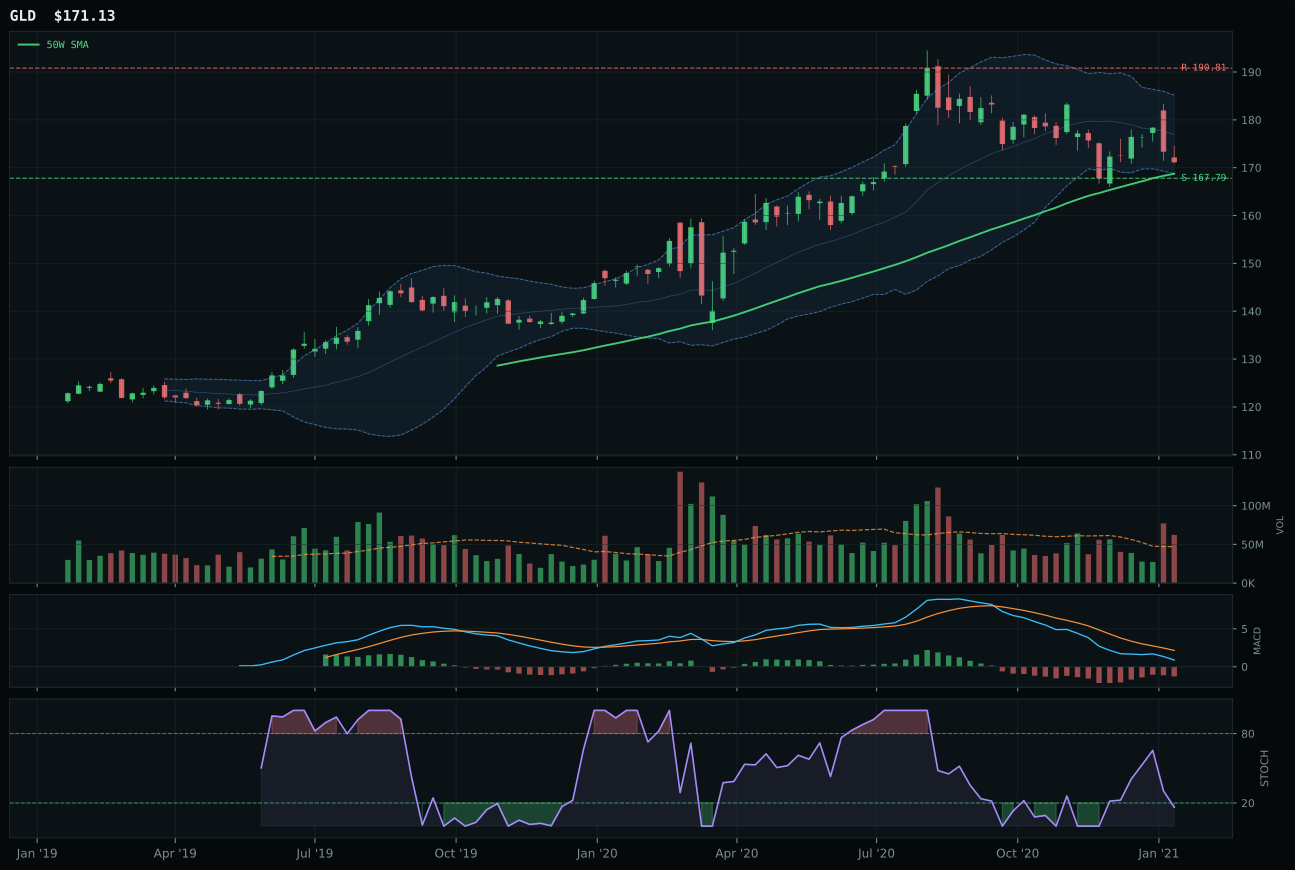
GLD has a pullback into support profile with -12.2% 13-week relative strength versus SPY.
A failed hold above support would weaken the setup.
Actionable but governed by invalidation levels.
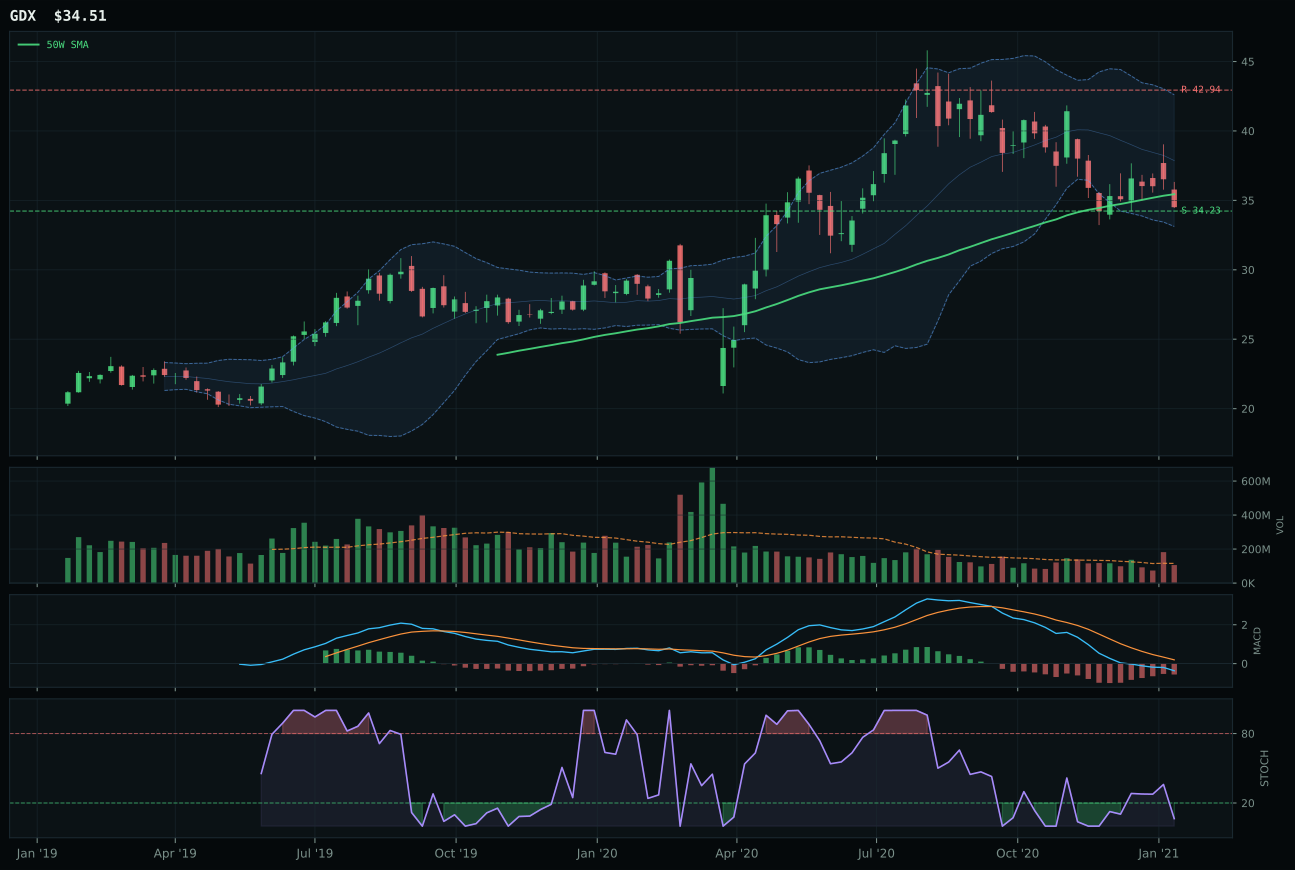
GDX has a pullback into support profile with -21.5% 13-week relative strength versus SPY.
A failed hold above support would weaken the setup.
Actionable but governed by invalidation levels.
GLD wins decisively over SLV because it owns the timing advantage: 1.4% from the 50-week versus SLV's 17.2% extension places GLD in the middle retracement / decision zone (Fibonacci 0.382) where both downside-to-support (2.0%) and risk-reward (98.0) offer a defined, tradable setup. SLV is stretched into the upper retracement zone, stranding fresh buyers at poor entry economics. Both charts show bearish-but-improving MACD and above-average volume at approximately 1.3x the 20-week baseline, but GLD's stochastic RSI at 0.16 (oversold) signals genuine pullback conviction, whereas SLV's falling-neutral stochastic at 0.53 (approximate) is ambiguous. Structure comparison reveals GLD's 72.5 versus SLV's 68.5—cleanliness is weaker in GLD at 41.7 (versus SLV's unstated baseline), yet compression superiority (83.0 on GLD) suggests the consolidation is tighter. The category-relative strength of 0.0% for both names underscores that this is not a category of broad conviction, making timing the differentiator between an oversold pullback (GLD) and an extended retracement (SLV).
Precious Metals receives 5% allocation despite a category score of only 38.9, the lowest among all non-zero positions, because GLD's setup offers asymmetric risk-reward (98.0/100) that few other categories can match. The macro regime (risk appetite positive, -4) is actually a headwind—reflation and positive equity risk appetite typically pressure safe-haven metals—yet GLD's position near support with improving technicals creates a defensive asymmetry: 2.0% downside risk to capture 10.3% upside if the setup completes. The category's 46.0/100 macro fit reflects this tension: it is not a category that benefits from the current regime, which is why allocation is limited. GLD is held as a tail-risk hedge rather than a conviction position. If gold breaks below 167.79 support or if stochastic RSI rolls over from oversold conditions, the category should exit entirely. Conversely, if GLD reclaims its 190.81 resistance on volume confirmation, Precious Metals could expand to 10% as a sign that risk appetite is deteriorating and defensive positioning is warranted.
Utilities & Infrastructure — XLU
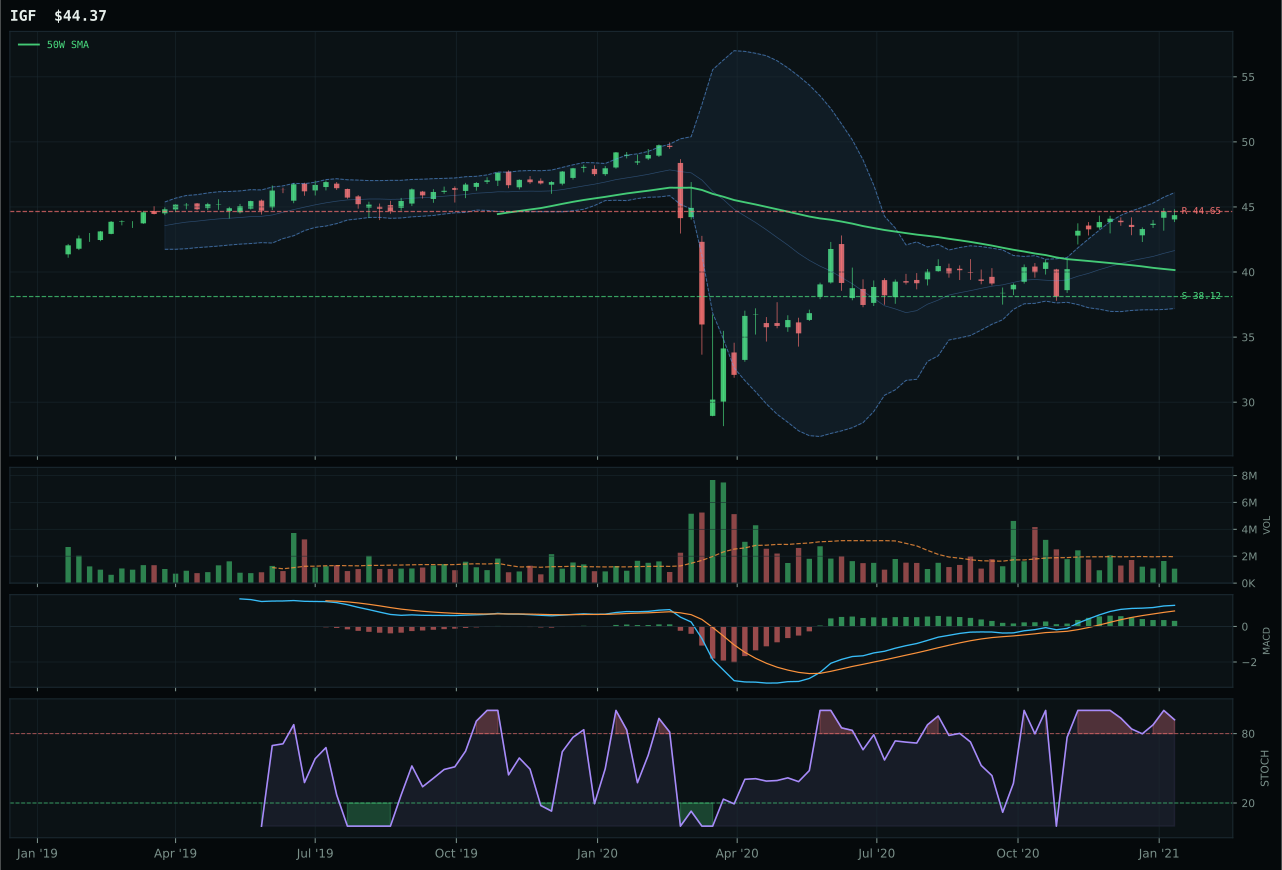
IGF has a neutral structure profile with 2.8% 13-week relative strength versus SPY.
A failed hold above support would weaken the setup.
Actionable but governed by invalidation levels.
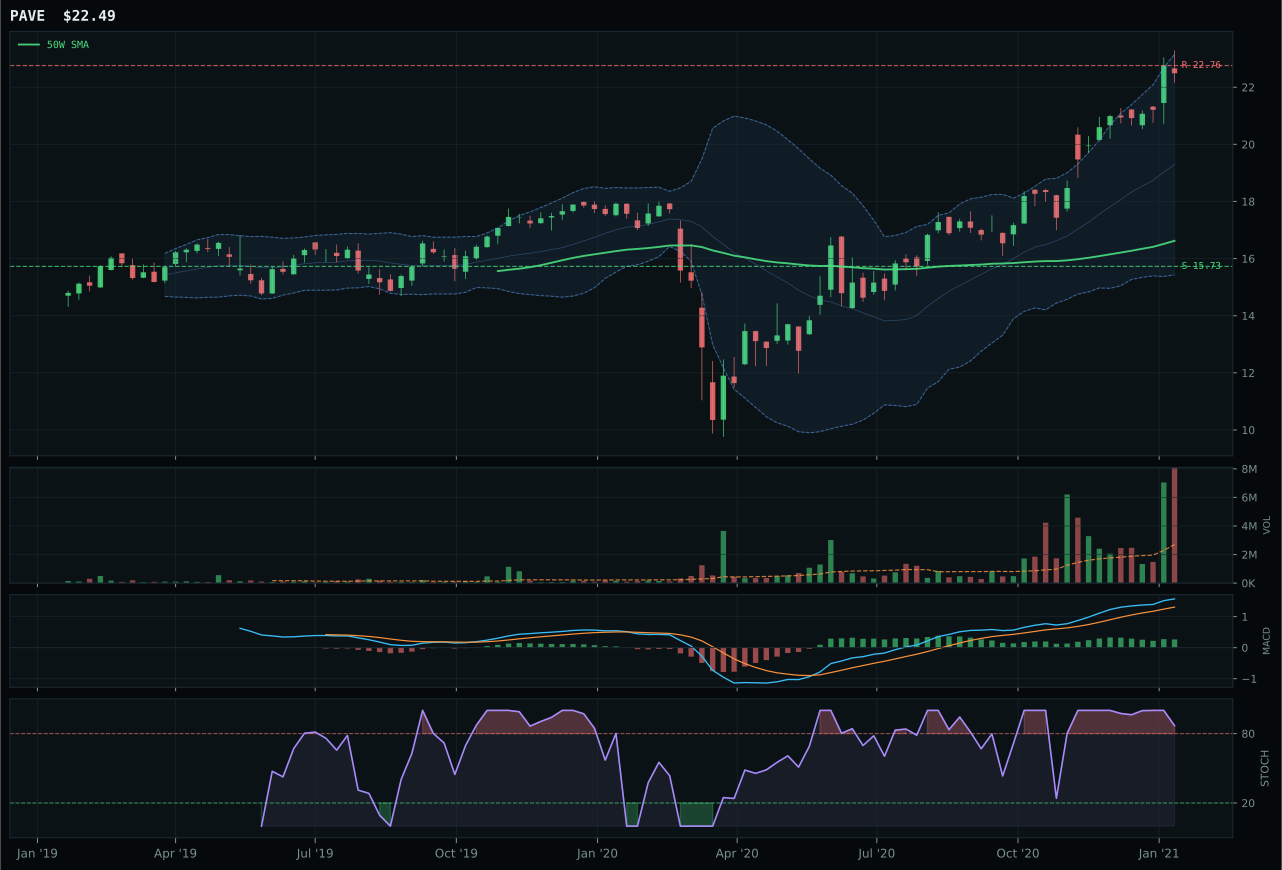
PAVE has a vertical extension profile with 14.9% 13-week relative strength versus SPY.
A failed hold above support would weaken the setup.
Actionable but governed by invalidation levels.
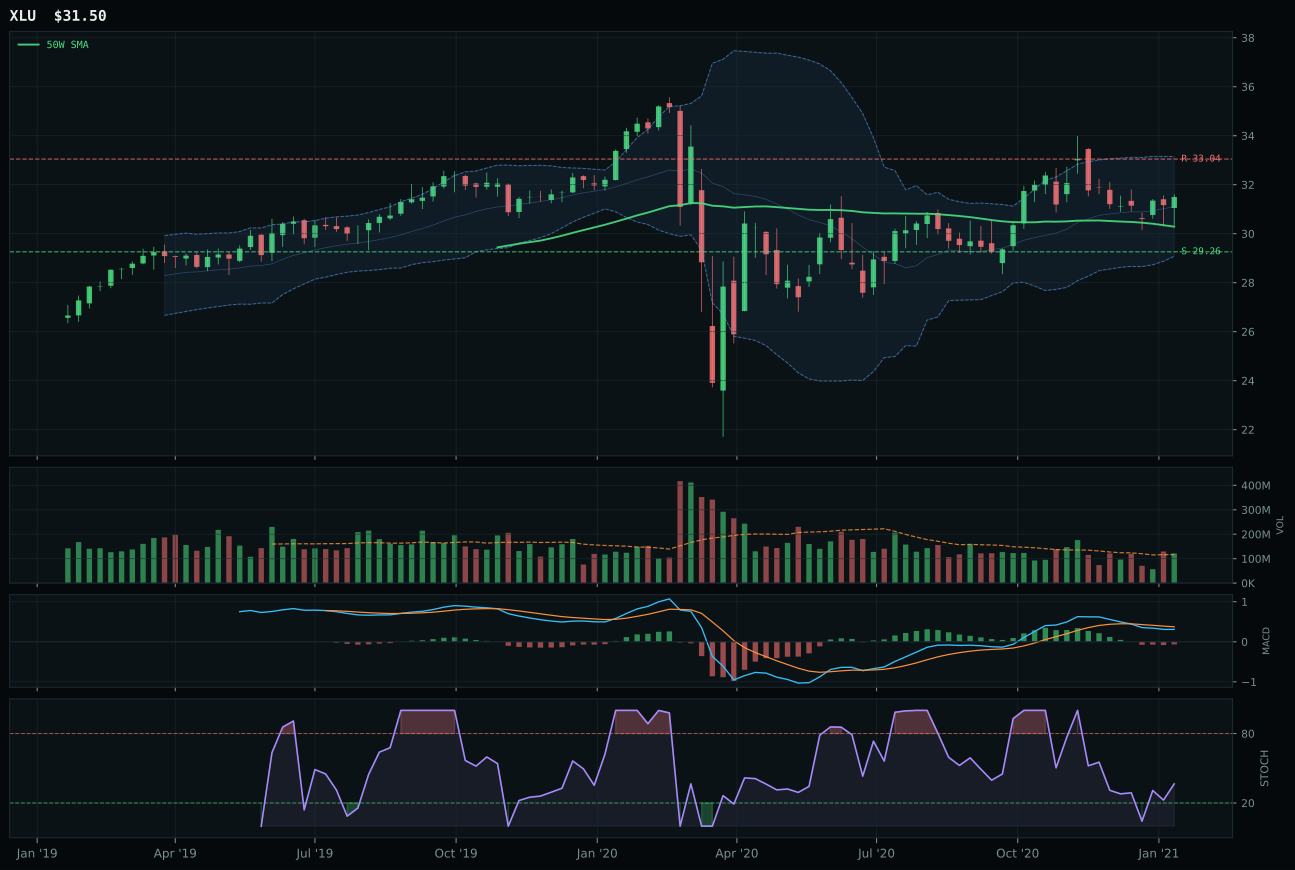
XLU has a neutral structure profile with -9.8% 13-week relative strength versus SPY.
A failed hold above support would weaken the setup.
Actionable but governed by invalidation levels.
XLU wins Utilities & Infrastructure by capturing the timing advantage: 4.0% from the 50-week versus IGF's 10.5% extension places XLU into the sweet spot of pullback-and-support setup with 93.0 timing score—near-maximum—where risk-reward at 56.0 offers defined entry mechanics. IGF's superior technical evidence (67.1 versus XLU's 26.1) and momentum confirmation (70 versus XLU's 1.2) are undone by inferior timing (62.0) and overbought stochastic RSI rolling over, which signals momentum fatigue. The structure comparison reveals neutral setups for both (71.9 for XLU, unstated for IGF), but XLU's 93.0 timing score reflects MACD bearish/weakening with stochastic rising mid-zone—a constructive pullback setup—whereas IGF's overbought stochastic rolling over signals the move is topping. Volume is neutral for XLU at 1.04x the 20-week, versus IGF's thin participation, meaning neither setup shows strong conviction buying. The category-relative strength gap is decisive: XLU at -12.6% versus IGF's 0.0% means XLU has lagged peers, but that underperformance has created the timing opportunity that IGF, still extended, cannot match.
Utilities & Infrastructure receives 0% allocation this week, ranked 10th at a 33.8 category score, the lowest-ranked category across the entire portfolio. Inflation pressure is an active headwind (-6), risk appetite positive penalizes defensive rotation (-2), and the macro fit (43.0/100) reflects that regulated utilities and infrastructure are poor matches for late-cycle reflation that rewards real-asset scarcity and commodity pricing power. XLU's negative relative strength (-9.8% versus SPY) and near-zero momentum (1.2/100) indicate that the market is rotating away from defensives, not into them. The category is correctly excluded because the current regime actively punishes the utilities thesis: nominal growth, rising rates, and inflation favor productive assets and real commodities, not fixed-income-proxy utilities. To earn a 5% allocation, Utilities & Infrastructure would require: (1) a deterioration in risk appetite (credit stress or liquidity stress activating as positive hedges); (2) a break below utilities' key support levels triggering a capitulation that creates a lower-risk entry; or (3) a material shift in the macro descriptor checklist away from reflation toward recession-hedging. None of these conditions are currently present.
Emerging Markets — IEMG
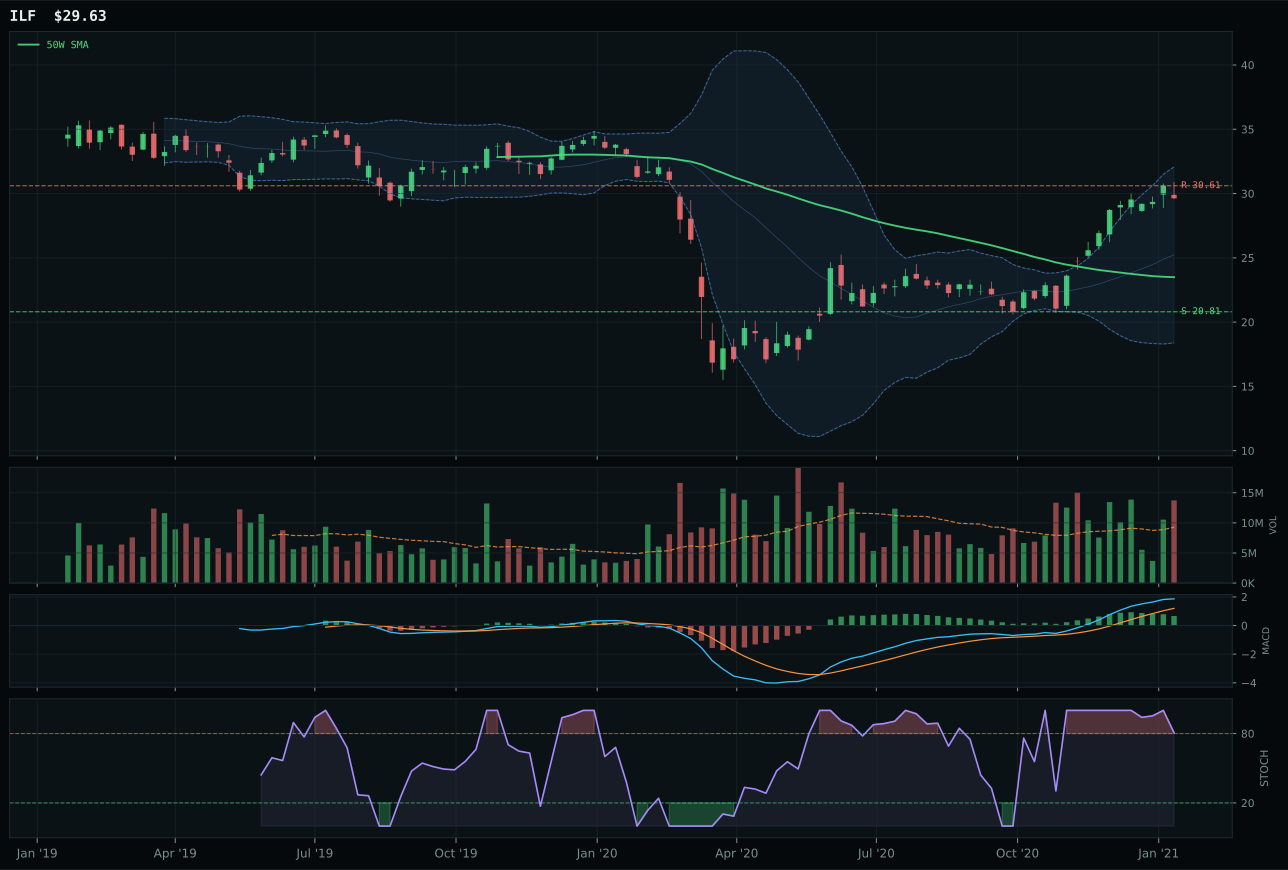
ILF has a vertical extension profile with 27.6% 13-week relative strength versus SPY.
A failed hold above support would weaken the setup.
Actionable but governed by invalidation levels.
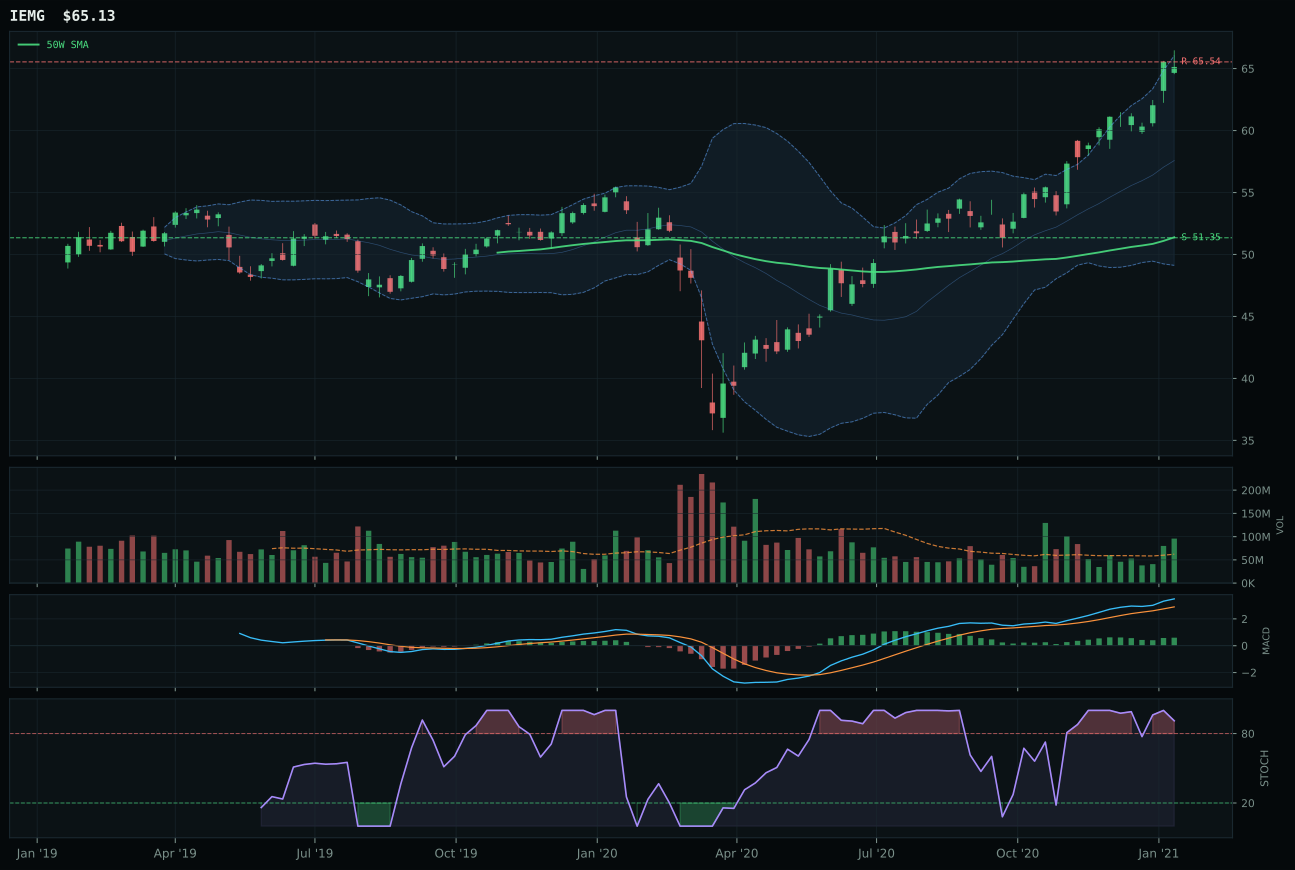
IEMG has a vertical extension profile with 11.4% 13-week relative strength versus SPY.
A failed hold above support would weaken the setup.
Actionable but governed by invalidation levels.
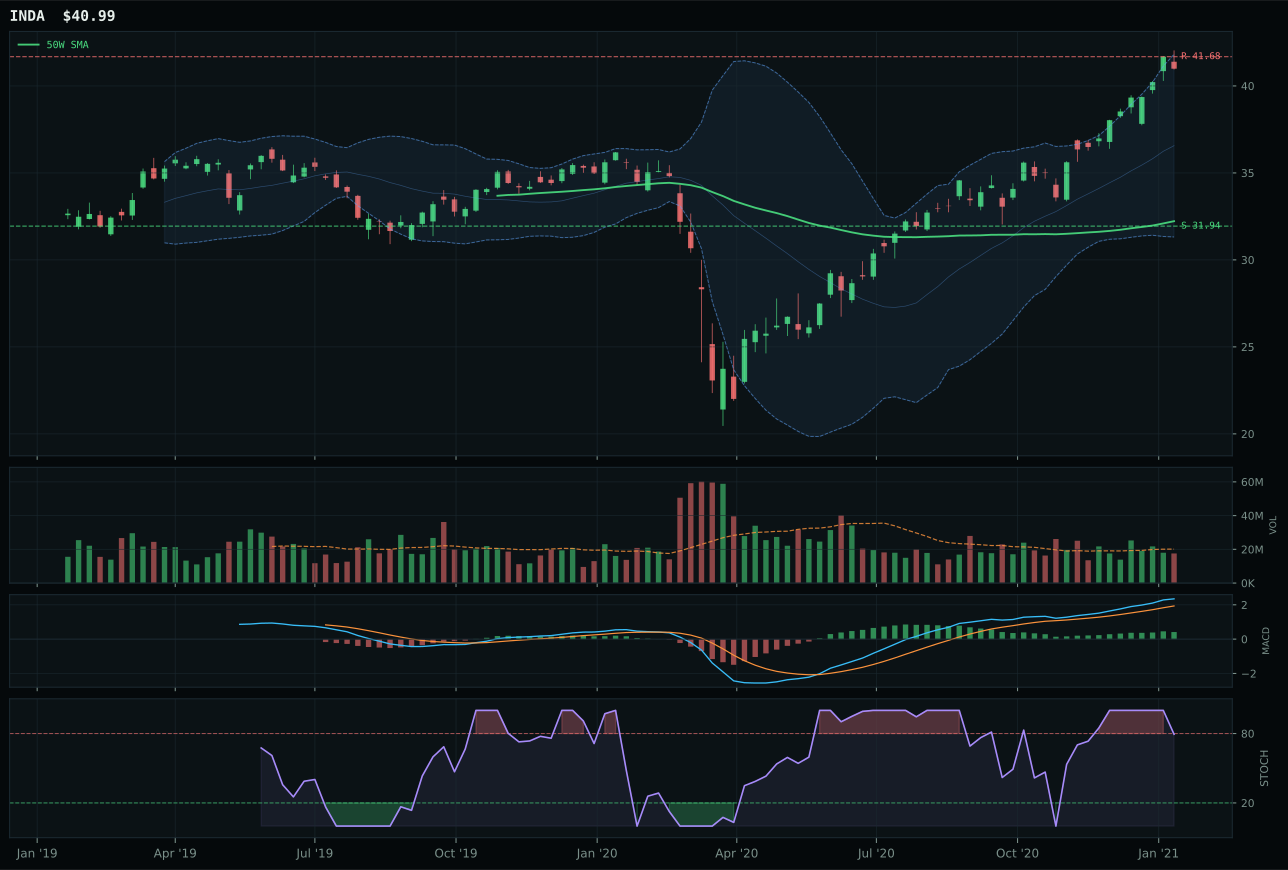
INDA has a vertical extension profile with 9.5% 13-week relative strength versus SPY.
A failed hold above support would weaken the setup.
Actionable but governed by invalidation levels.
IEMG wins the Emerging Markets category over runner-up ILF despite the counterintuitive outcome that the broader emerging-market ETF (IEMG) is preferred to the Latin America commodity play (ILF), which shows superior technicals. IEMG's strength lies in timing (37.0 versus ILF's 30.0) because price sits 26.7% extended near the Fibonacci 0.236 / 52-week high zone—a position of natural resistance—while ILF is 40.8% extended in the upper momentum zone, offering no technical edge. MACD is the critical differentiator: IEMG shows bullish and improving (suggesting fresh momentum) while ILF shows bullish but flattening (suggesting momentum is aging). Both display overbought stochastic RSI and distribution-pressure volume, yet IEMG's volume-price confirmation of 56.9 and persistence of 55.2 are slightly superior to ILF's implied baseline. The category-relative strength is neutral (0.0% versus ILF's 16.2%), but IEMG's broad exposure to Asian emerging markets provides insulation from commodity volatility, whereas ILF's Latin America tilt exposes buyers directly to copper and other metals where distribution pressure signals potential mean-reversion risk.
Emerging Markets receives 0% allocation this week, ranked 9th overall at a 33.2 category score, as credit stress (-10), liquidity stress (-10), and the absence of real asset scarcity themes make it a poor macro fit (38.0/100) for late-cycle reflation. The category's reasoned ETF order (INDA 58.9, ILF 56.0, IEMG 38.3) shows divergence, with IEMG winning the technical bracket but ranking lowest in macro conviction—a red flag that the winning setup is being driven by momentum rather than structural sponsorship. IEMG's distribution-pressure volume and extended position (26.7% above 50W) create an unfavorable risk-reward setup (29.4/100), meaning emerging markets offer limited upside and meaningful downside risk if risk appetite deteriorates. To earn reentry at 5%, Emerging Markets would require: (1) a pullback to at least the 50W by at least one of the three names; (2) a shift in the macro regime away from liquidity/credit stress and toward positive EM-specific growth signals; or (3) confirmation that EM financial conditions are stabilizing. Currently, the category is correctly excluded from portfolio allocation.