
2021-01-08
Informational purposes only. The content in this report, including allocations, analysis, and commentary, is provided solely for informational and educational purposes. It does not constitute financial advice, investment advice, trading advice, or any other type of advice. Past performance does not guarantee future results. Always conduct your own research and consult a qualified financial professional before making investment decisions.
Some tracked tickers were excluded due to missing live weekly price data: SGOV: Historical cache SGOV has only 32 usable weekly bars
Weekly Allocation
| Ticker | Category | Weight | Role |
|---|---|---|---|
| FSOL | 50% | Overlay | |
| REMX | Industrial Metals | 10% | Top-2 (10%) |
| XLE | Traditional Energy | 10% | Top-2 (10%) |
| MOO | Agriculture & Livestock | 5% | Tier-2 (5%) |
| INDA | Emerging Markets | 5% | Tier-2 (5%) |
| SMH | AI | 5% | Tier-2 (5%) |
| CIBR | Technology | 5% | Tier-2 (5%) |
| ITA | Defense & Aerospace | 5% | Tier-2 (5%) |
| PAVE | Utilities & Infrastructure | 5% | Tier-2 (5%) |
Trade Instructions — Monday Open
Sell the tranche from 2020-12-11 (completing its 4-week hold). Buy the new tranche. Instructions show net portfolio changes — same-asset positions cancel, weight changes show the delta.
| Action | Ticker | Instruction |
|---|---|---|
| SELL | FCG | Sell 50% of FCG position (reduce 5.00% → 2.50%) |
| SELL | PICK | Sell entire PICK position (2.50% of portfolio) |
| SELL | ILF | Sell 50% of ILF position (reduce 2.50% → 1.25%) |
| SELL | XAR | Sell 33% of XAR position (reduce 3.75% → 2.50%) |
| BUY | XLE | Buy XLE — 33.33% of freed cash (adds 2.50% to portfolio) |
| BUY | REMX | Buy REMX — 33.33% of freed cash (adds 2.50% to portfolio) |
| BUY | INDA | Buy INDA — 16.67% of freed cash (adds 1.25% to portfolio) |
| BUY | ITA | Buy ITA — 16.67% of freed cash (adds 1.25% to portfolio) |
Current Portfolio After Trade
Combined holdings across all 4 active tranches. Each tranche is 25% of the portfolio.
| Ticker | % of Portfolio | Weight Bar |
|---|---|---|
| FSOL | 50.00% | |
| XLE | 7.50% | |
| REMX | 7.50% | |
| CIBR | 5.00% | |
| SMH | 3.75% | |
| MOO | 3.75% | |
| INDA | 3.75% | |
| XAR | 2.50% | |
| FCG | 2.50% | |
| PAVE | 2.50% | |
| COPX | 2.50% | |
| XLU | 2.50% | |
| ITA | 2.50% | |
| ILF | 1.25% | |
| WEAT | 1.25% | |
| BOTZ | 1.25% |
Macro Regime — Transition / Mixed
Macro Evidence Charts
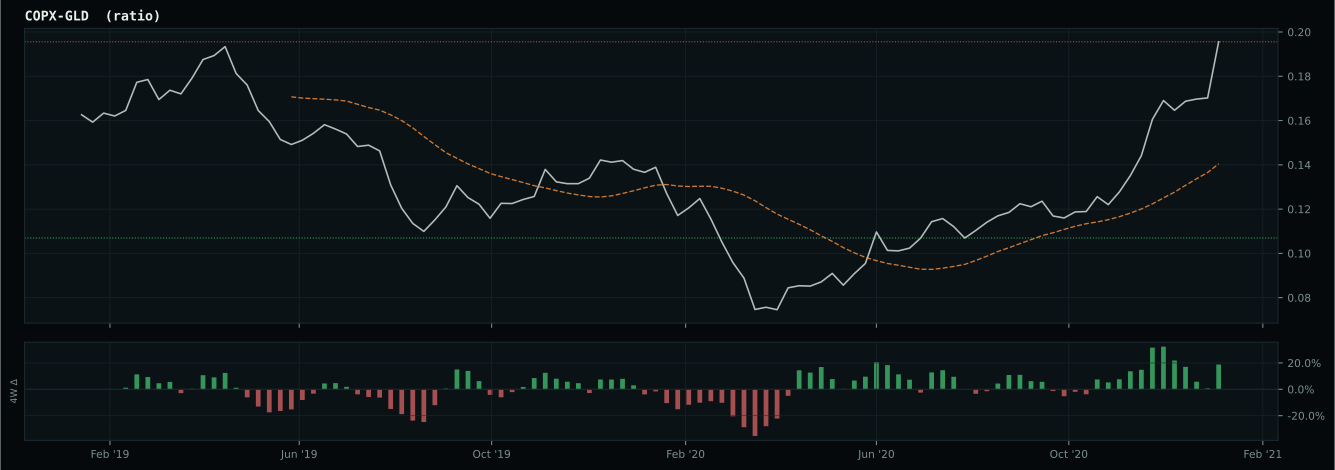
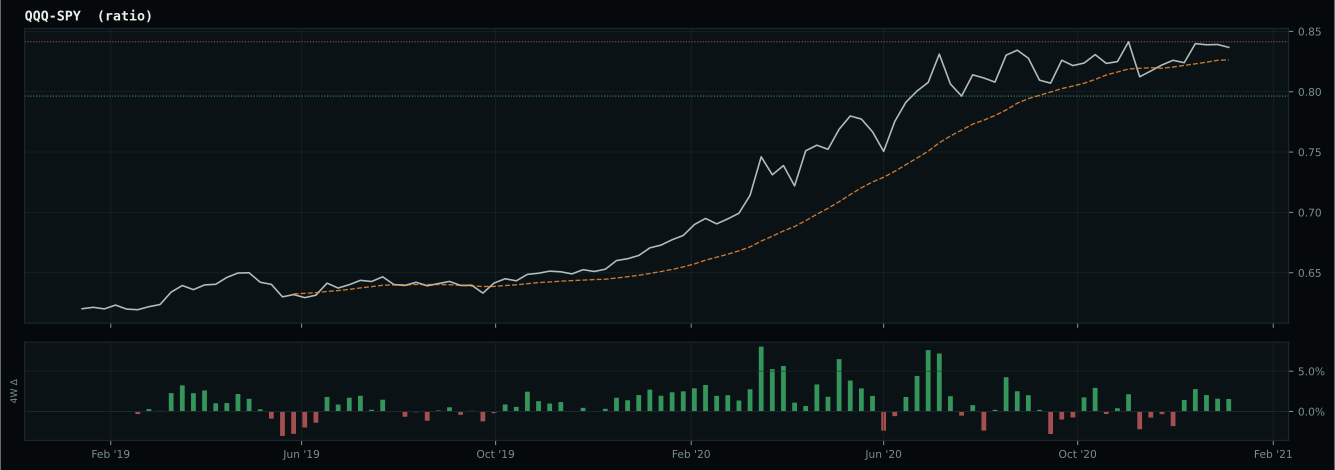
Market-implied signals behind the macro regime scores. Each ratio compares two assets; the direction and slope of the ratio is what the macro engine reads.
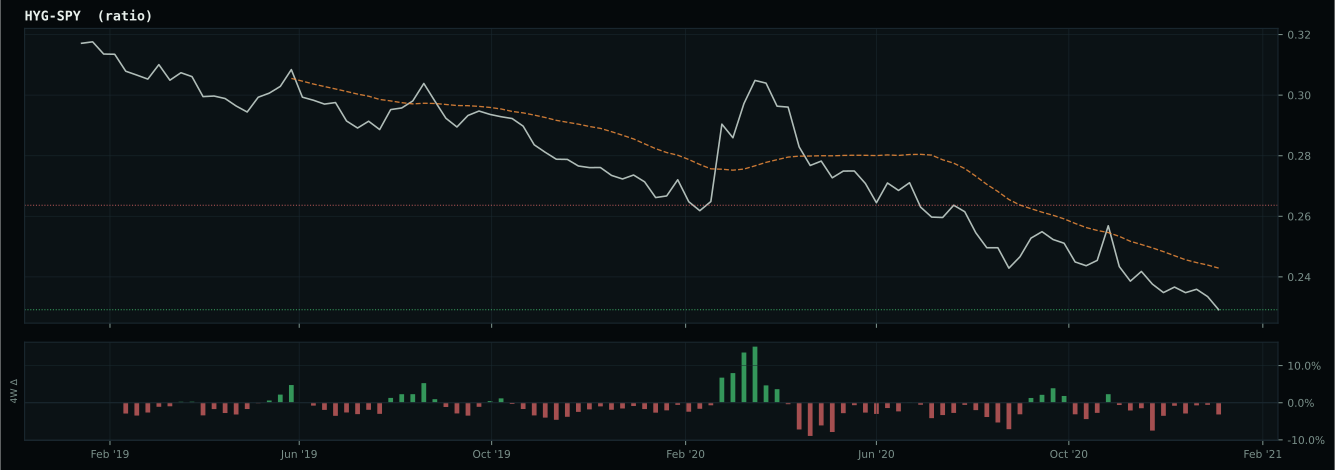
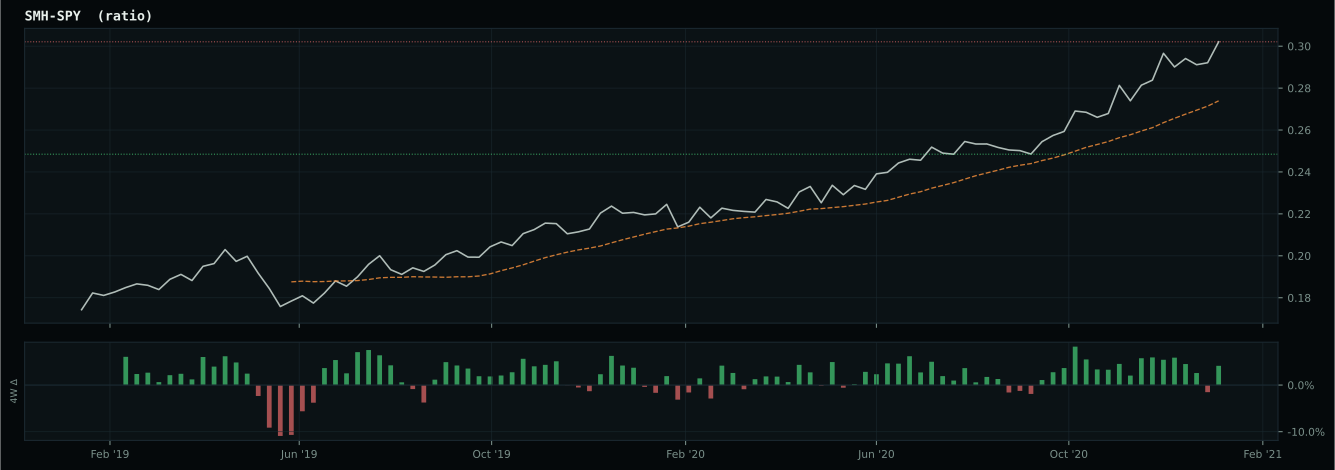
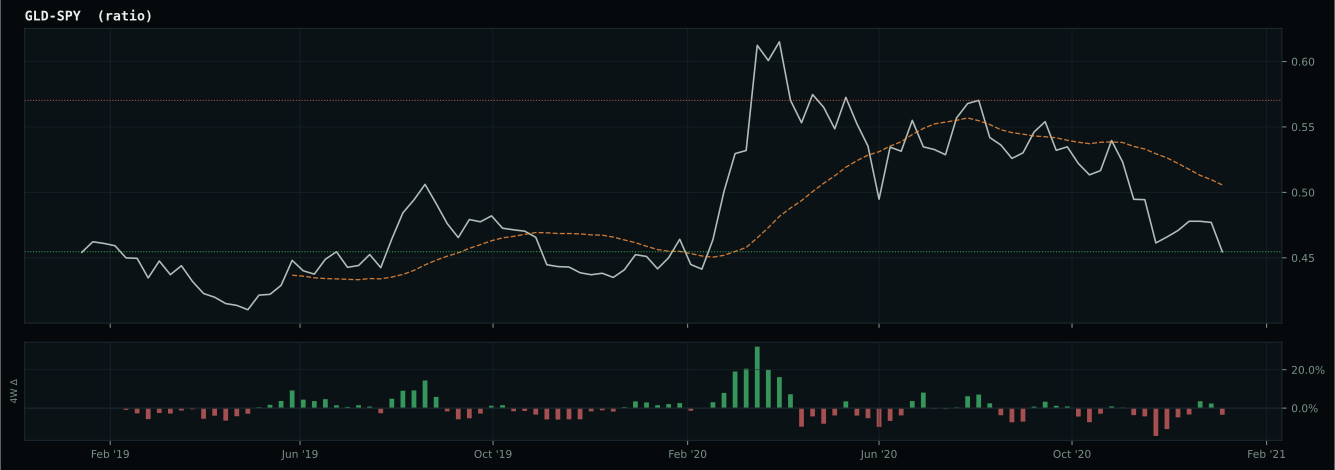
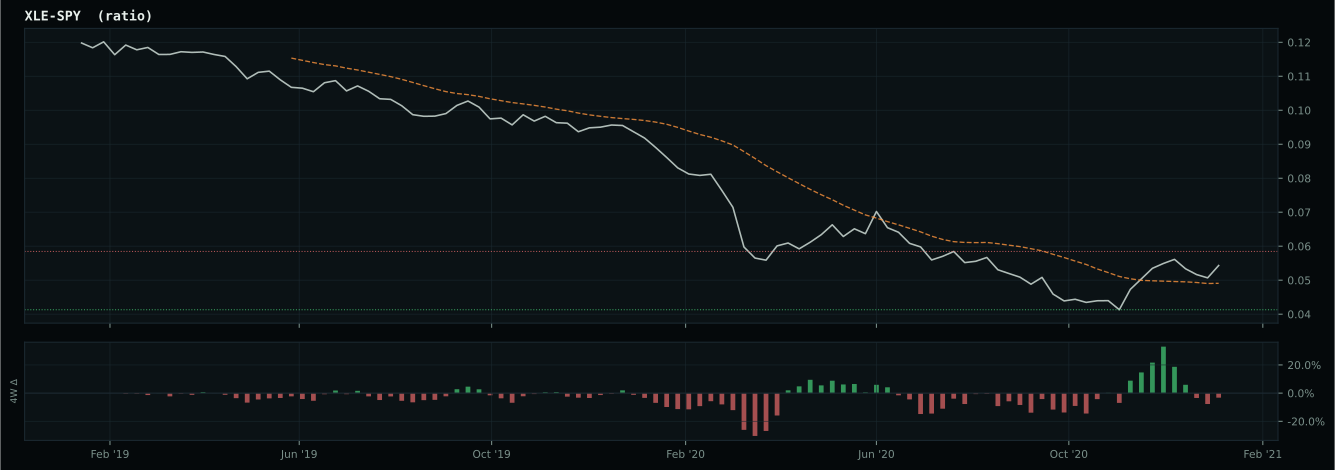
Crypto Regime — AltSeason
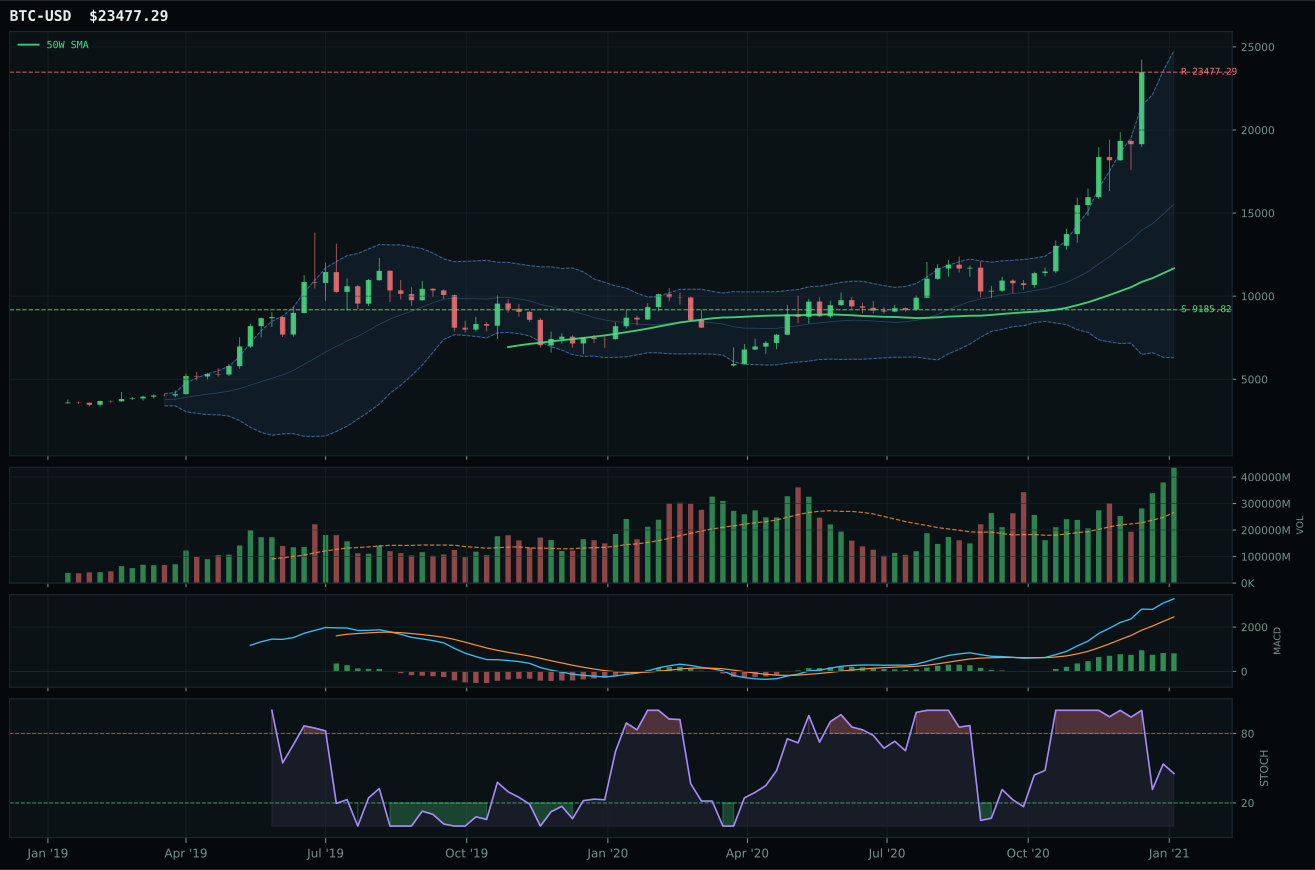
post-touch structure is too wide to count as a range; max/min close ratio is 6.08
TrendBTC confirmed: 2 consecutive closes above rising/flat 50W SMA
all available AltSeason conditions pass; missing optional confirmations skipped

Category Rankings
| Rank | Category | Winner | Score | Alloc | 4W Ret | Peers (4W) |
|---|---|---|---|---|---|---|
| 1 | Industrial Metals | REMX | 86.3 | 20% | +7.59% | COPX -2.3% · PICK -2.0% |
| 2 | Traditional Energy | XLE | 82.5 | 20% | +6.56% | XOP +11.3% · FCG +11.3% |
| 3 | Agriculture & Livestock | MOO | 74.9 | 10% | +3.27% | WEAT +0.6% · VEGI +4.4% |
| 4 | Emerging Markets | INDA | 71.1 | 10% | +2.90% | ILF -3.9% · IEMG +3.9% |
| 5 | AI | SMH | 65.0 | 10% | +3.52% | BOTZ +3.7% · AIQ +7.7% |
| 6 | Technology | CIBR | 63.6 | 10% | +2.51% | IGV +7.9% · XLK +4.9% |
| 7 | Defense & Aerospace | ITA | 55.0 | 10% | +4.92% | XAR +9.5% · ROKT +5.9% |
| 8 | Utilities & Infrastructure | PAVE | 53.7 | 10% | -1.37% | IGF +1.0% · XLU +2.6% |
| 9 | Nuclear Energy | URA | 44.1 | 0% | +3.33% | URNM +6.1% · NLR +2.2% |
| 10 | Precious Metals | GDX | 39.8 | 0% | -1.43% | SLV +11.2% · GLD -0.1% |
Industrial Metals — REMX
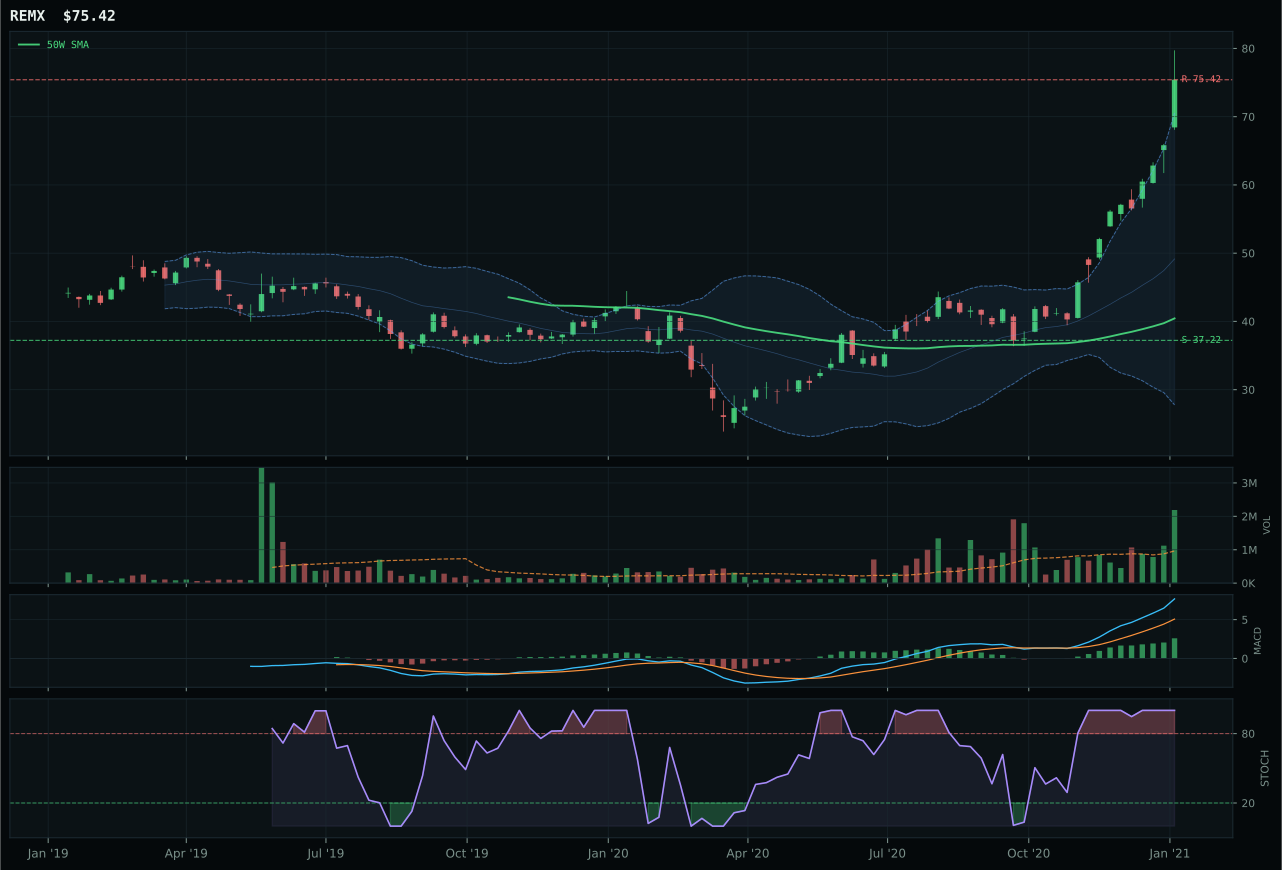
REMX has a vertical extension profile with 70.4% 13-week relative strength versus SPY.
A failed hold above support would weaken the setup.
Actionable but governed by invalidation levels.
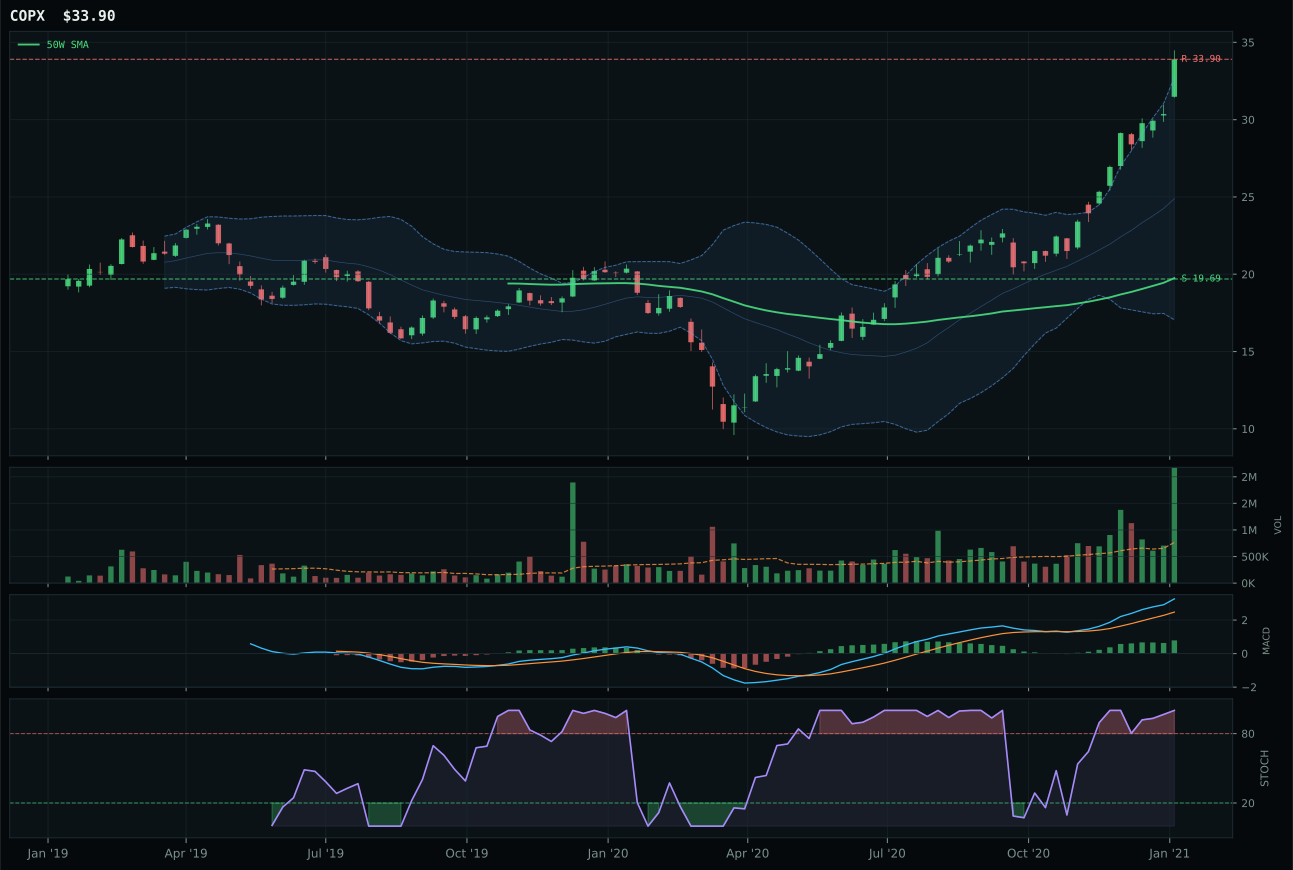
COPX has a vertical extension profile with 47.8% 13-week relative strength versus SPY.
A failed hold above support would weaken the setup.
Actionable but governed by invalidation levels.
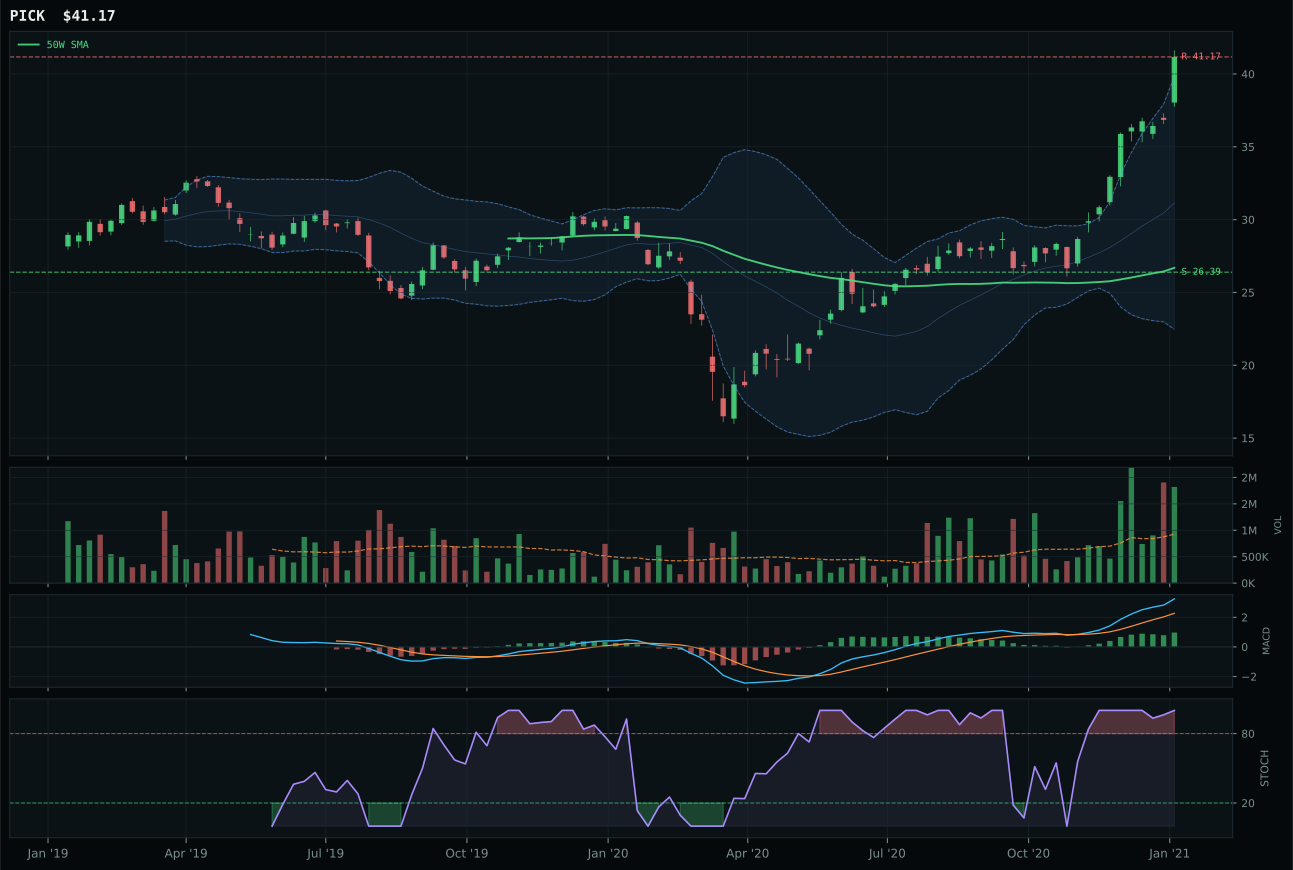
PICK has a vertical extension profile with 36.6% 13-week relative strength versus SPY.
A failed hold above support would weaken the setup.
Actionable but governed by invalidation levels.
REMX demolishes the category with a 90.7 reasoned score, claiming top-2 honors through world-class combination of trend, relative strength, and volume sponsorship. The rare earth supply-chain scarcity play posts a 100/100 trend score from price 86.5% above the 50-week with a blistering 1.8% positive slope — every bar higher — and 70.4% SPY-relative outperformance that dwarfs every other category winner in the portfolio. Volume confirmation at 2.45x the 20-week average and 100/100 volume-price confirmation score prove this is accumulated strength, not manipulative volatility. The 80.3% 13-week return and 22.7% category-relative edge over COPX signal that institutional capital has chosen rare earths as the AI metals play. Yes, the 43.4/100 risk/reward reflects zero upside room to resistance and the setup is extended, but the 100/100 persistence score means this move is refusing to roll over. COPX lost solely on relative strength: 47.8% SPY-relative versus 70.4% for REMX, a 22.6-point spread that no amount of copper scarcity narrative can overcome.
Industrial Metals earns 10% as a top-2 overweight category, ranked second among all ten with an 86.3 final score that reflects exceptional technical evidence of 100.0/100 weighted with 64.0/100 macro fit. The macro case is compelling: metals scarcity descriptor (+14), commodity breadth positive (+10), and real asset sponsorship (+6) offset credit stress (-7), yielding net positive momentum in a Transition/Mixed regime. REMX's position at the front of the AI metals supercycle — rare earths for semiconductor manufacturing and battery technology — makes it the proxy for emerging tech demand. The 10% allocation is warranted despite extended technicals because (1) the macro tailwind is structural, not cyclical, (2) volume and persistence confirm accumulation rather than speculation, and (3) AltSeason with supply-chain scarcity is the exact regime where hard asset producers outperform. Risk is defined: resistance at 75.42 provides a clean stop, and the downside to support of 102.6% is the real concern if growth collapses.
Traditional Energy — XLE
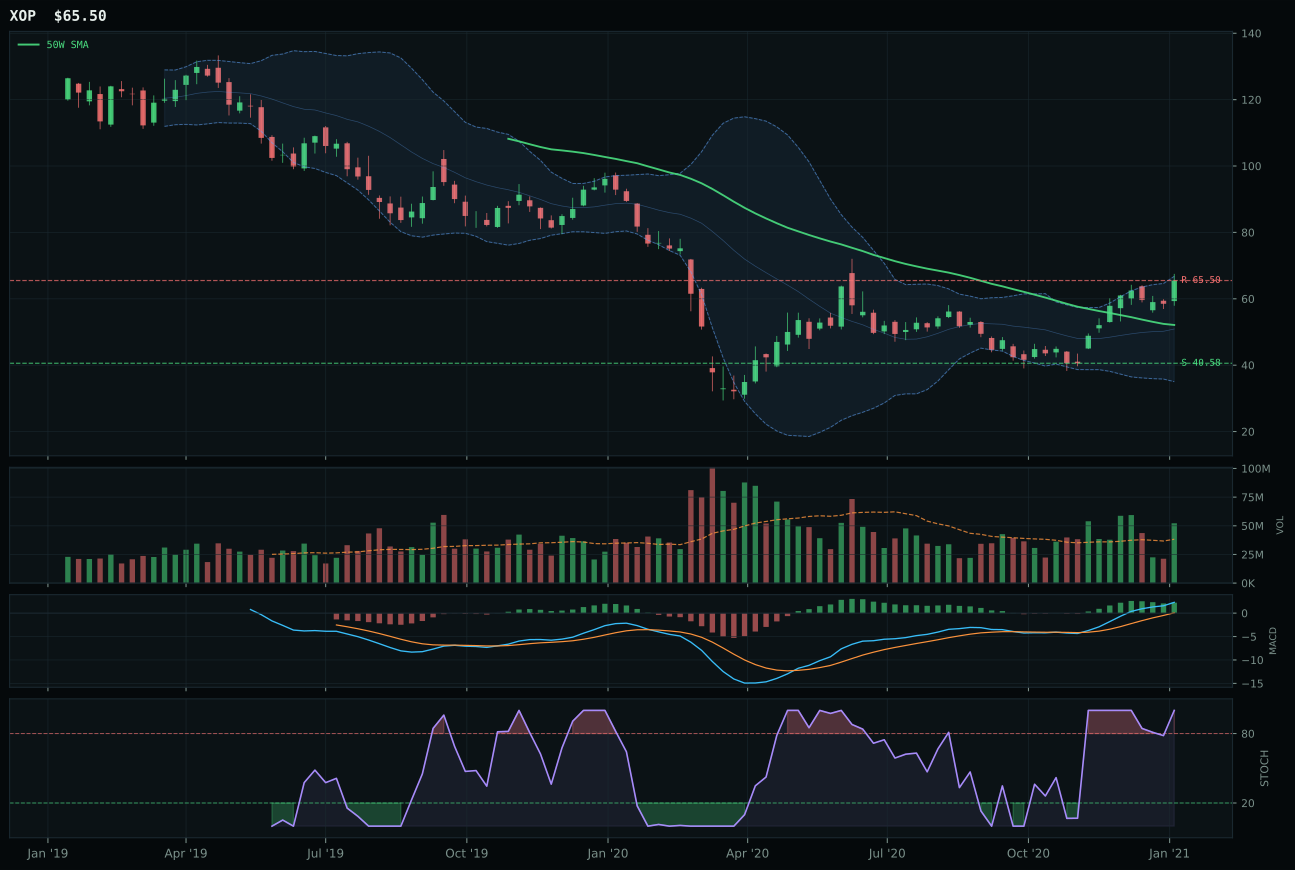
XOP has a vertical extension profile with 36.1% 13-week relative strength versus SPY.
A failed hold above support would weaken the setup.
Actionable but governed by invalidation levels.
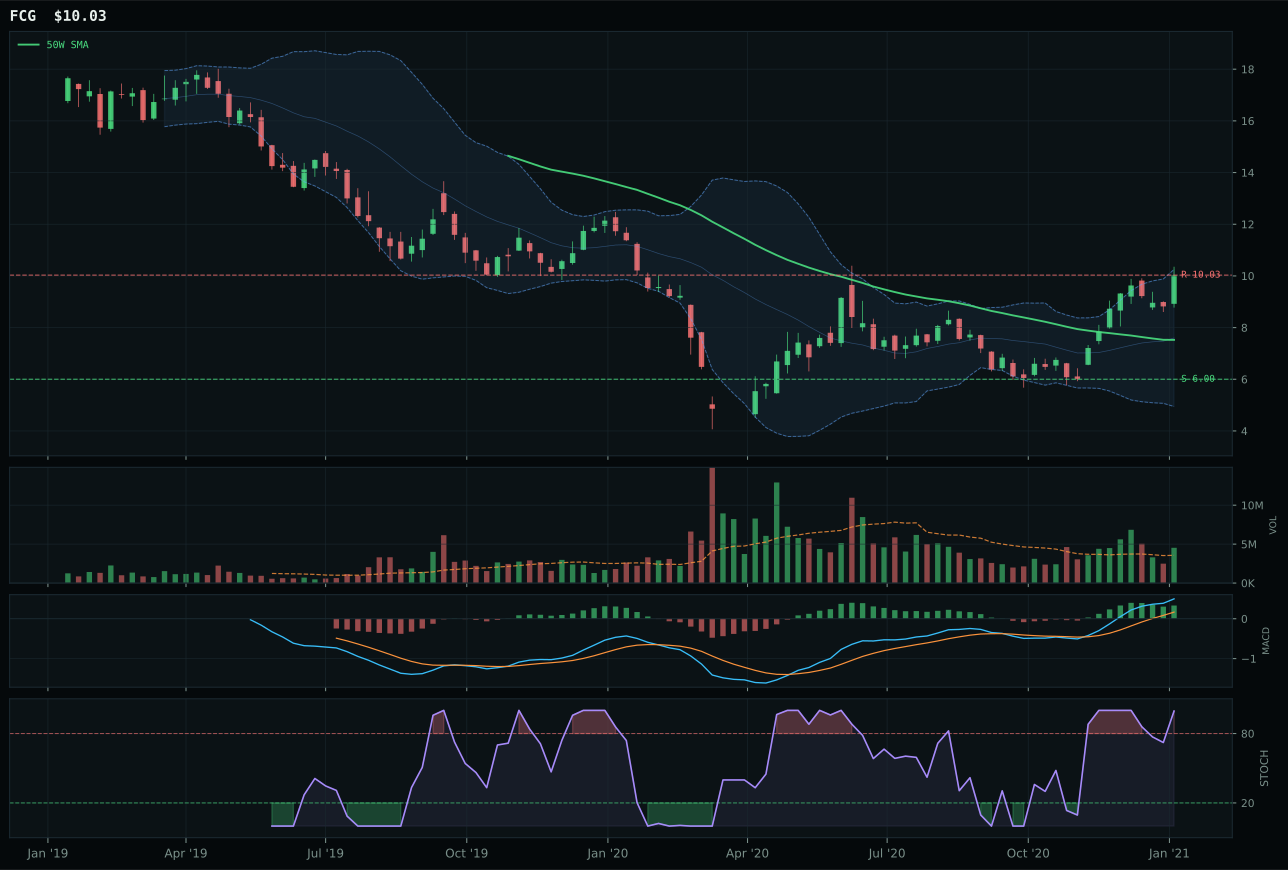
FCG has a vertical extension profile with 42.0% 13-week relative strength versus SPY.
A failed hold above support would weaken the setup.
Actionable but governed by invalidation levels.
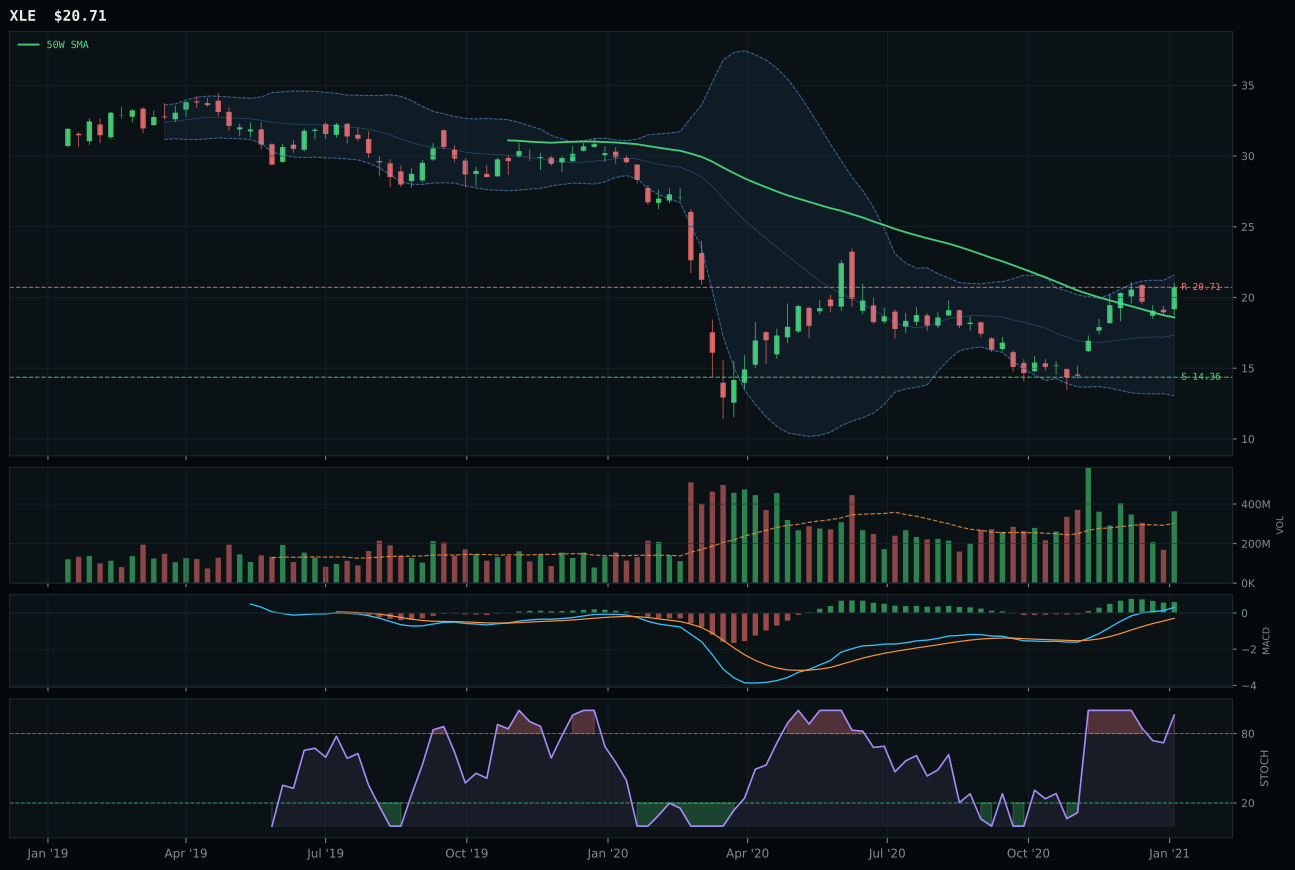
XLE has a neutral structure profile with 24.6% 13-week relative strength versus SPY.
A failed hold above support would weaken the setup.
Actionable but governed by invalidation levels.
XLE captures top-2 with a 75.2 reasoned score, a decisive 21.1-point rout of XOP that illustrates the value of conservative positioning in a volatile commodity complex. The integrated energy cash-flow defender sits only 11.4% above its 50-week in the middle retracement decision zone near Fib 0.500, placing it in prime mean-reversion territory despite its 34.5% 13-week pop and 24.6% SPY-relative strength. This proximity to the 50-week provides both safety and upside: 44.2% downside to support offers substantial room before pain, while upside to resistance at 0.0% means risk is defined. XOP's 25.7% extension above the 50-week and overbought momentum signal late entry risk, and its distribution-weighted relative strength of 36.1% cannot offset XLE's 1.7-point technical evidence advantage. MACD is bullish but flattening for both, stochastic RSI overbought for both, but XLE's neutral structure with 70.5% volume-price confirmation beats XOP's vertical extension stretched against neutral volume. XLE's 4W return of 0.7% masks institutional accumulation that favors defensive names over beta.
Traditional Energy earns 10% as a top-2 category, tied with Industrial Metals for the second-highest ranked slot, at 82.5 final score. The macro environment is exceptionally bullish for energy: energy scarcity (+16), inflation pressure (+10), supply shortage (+9), and real asset sponsorship (+7) yield 85.0/100 macro fit, the highest macro reading in the portfolio. XLE's 70.7/100 technical evidence combined with overwhelming macro tailwind justifies the 10% weighting despite extended sector dynamics. In a Transition/Mixed regime with AltSeason suppressing growth equity multiples, energy's inflation-pass-through and supply-constrained fundamentals provide uncorrelated return. The category macro score of 85.0 is so dominant that even tier-3 setups would warrant allocation; XLE's conservative positioning near the 50-week rather than extended like XOP makes this a top-2 conviction trade rather than FOMO. Risk: geopolitical de-escalation or demand destruction from recession would immediately reverse the energy bid; allocation can be exited cleanly at support if macro turns.
Agriculture & Livestock — MOO
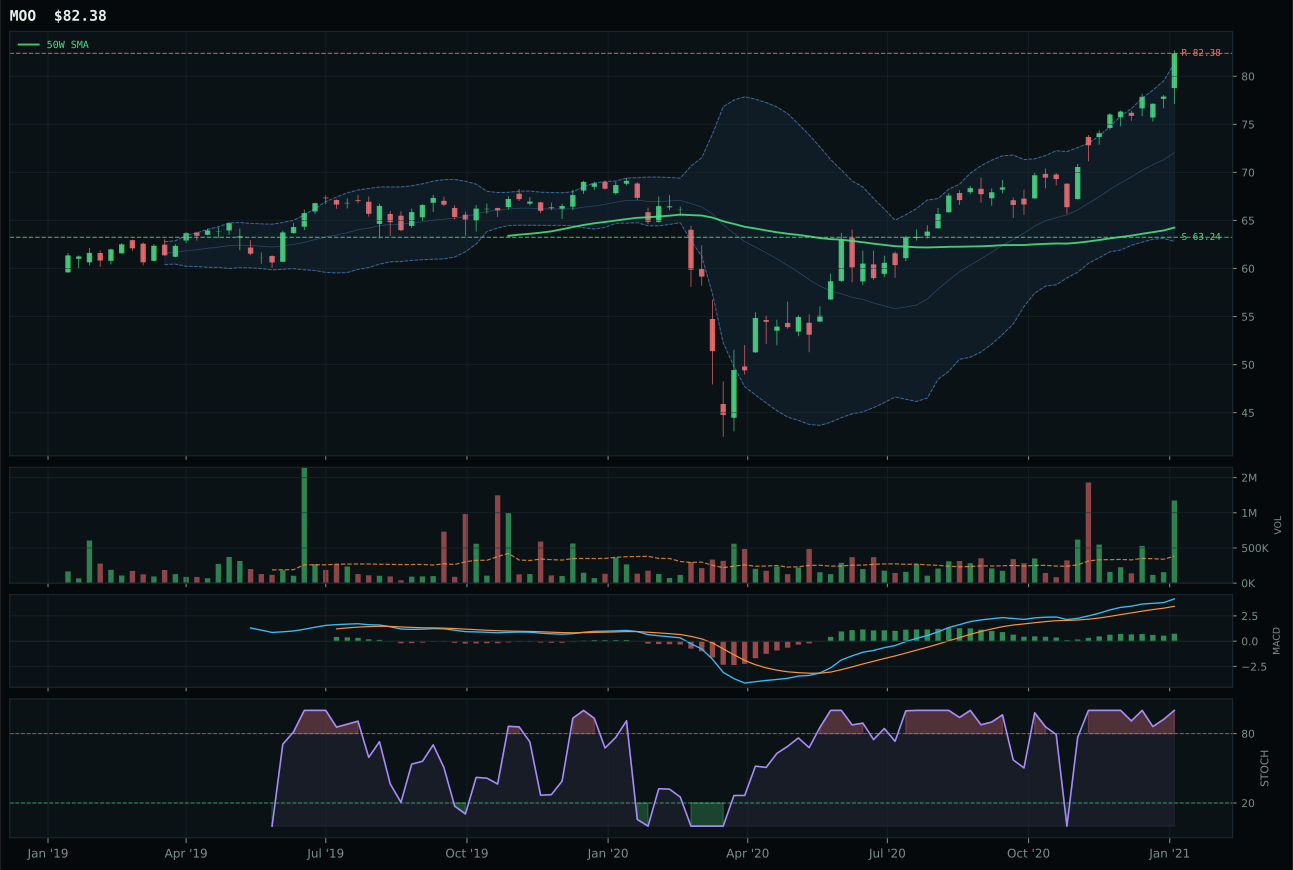
MOO has a vertical extension profile with 8.3% 13-week relative strength versus SPY.
A failed hold above support would weaken the setup.
Actionable but governed by invalidation levels.
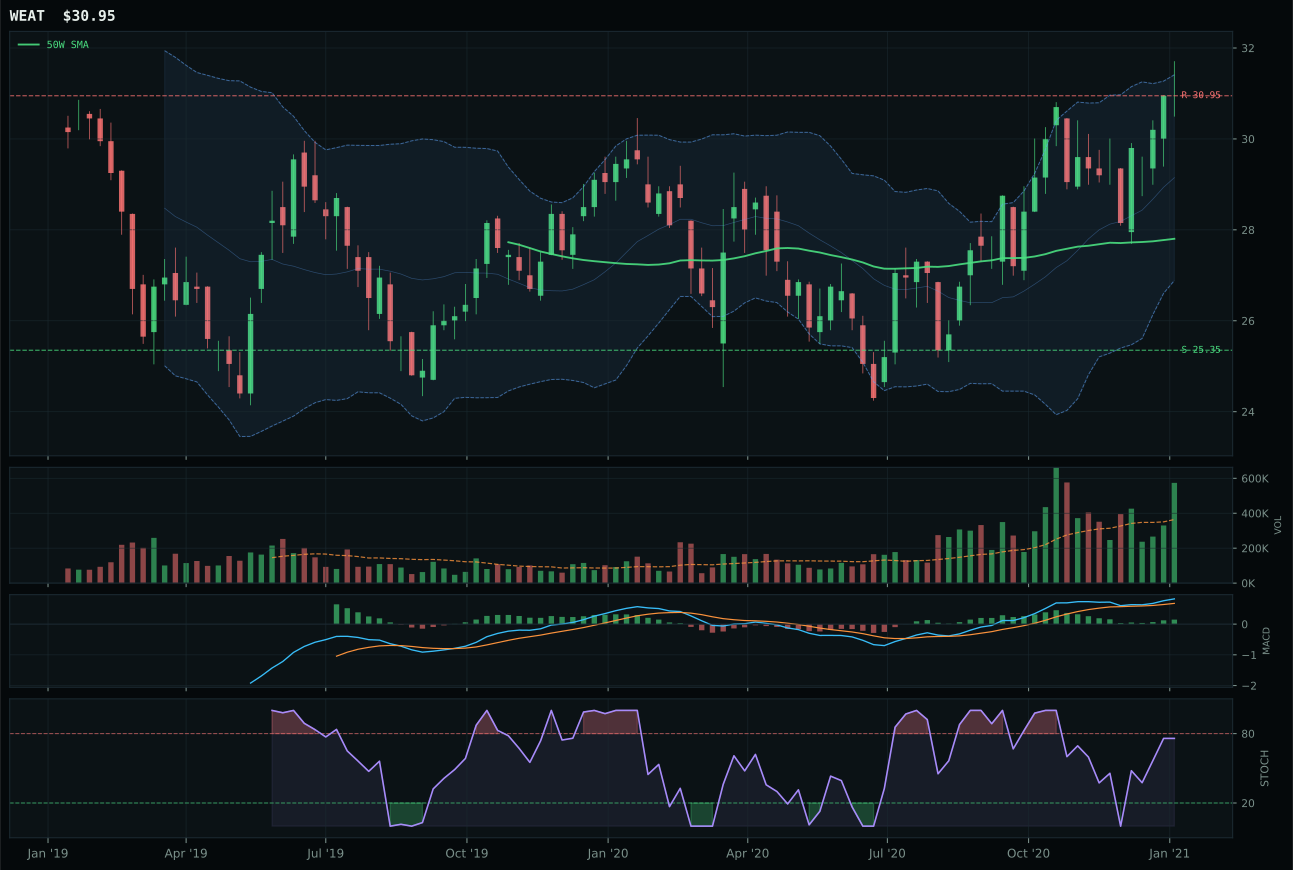
WEAT has a neutral structure profile with -3.7% 13-week relative strength versus SPY.
A failed hold above support would weaken the setup.
Actionable but governed by invalidation levels.
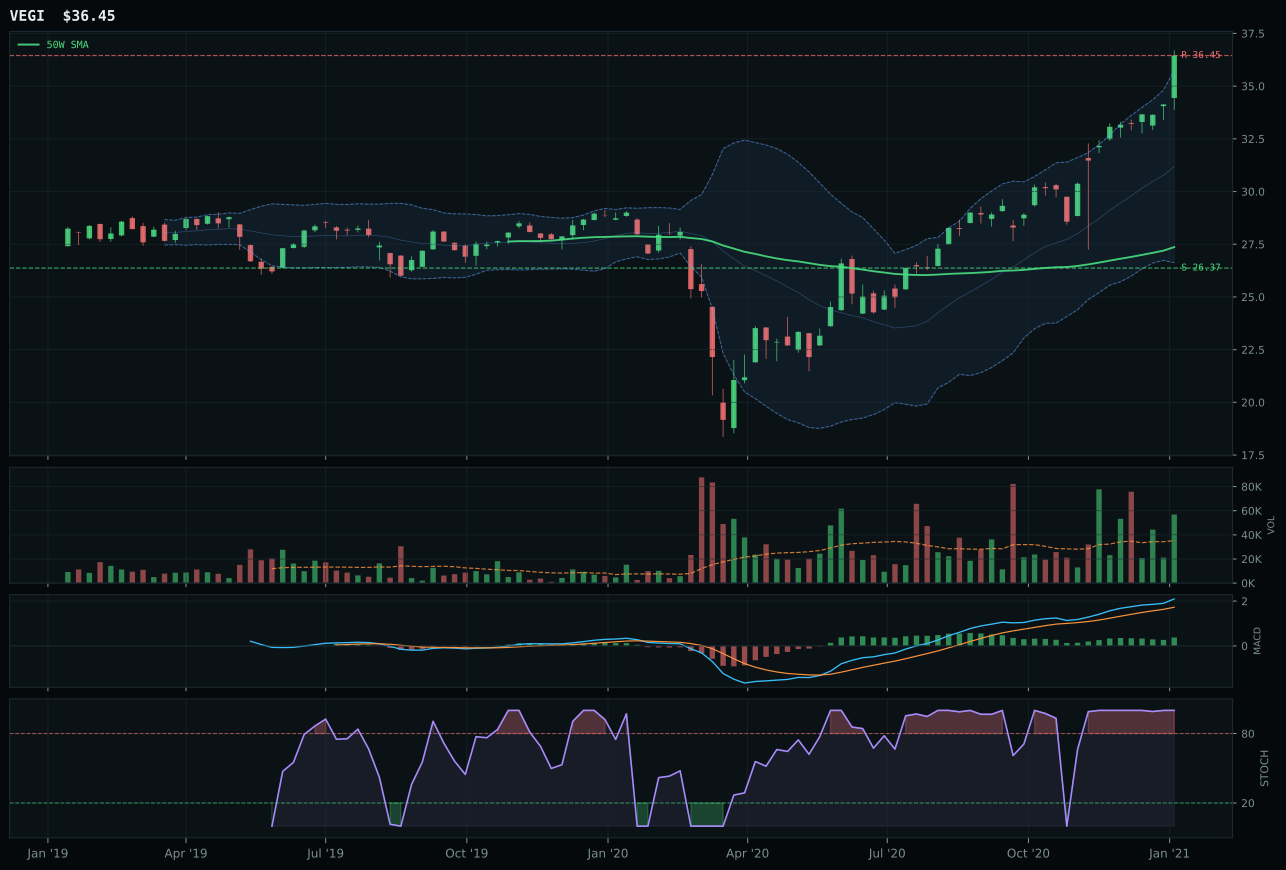
VEGI has a vertical extension profile with 10.8% 13-week relative strength versus SPY.
A failed hold above support would weaken the setup.
Tracked, but not top-2 eligible because: .
MOO dominates with an 82.9 reasoned score, a decisive 9.9-point lead over WEAT that reflects superior technical structure and volume sponsorship. The agribusiness equity ETF posts a pristine 100/100 trend score from price above both moving averages with a 0.5% positive 50-week slope, and critically, it exhibits accumulation/confirmation at 3.08x the 20-week volume average — the strongest volume signature in the entire allocation. Its 28.2% extension above the 50-week is aggressive, but the overbought stochastic RSI at 1.00 combined with bullish-improving MACD tells a story of sustained institutional buying rather than speculative saturation. WEAT's 76.4 structure score and above-average participation volume pale against MOO's 83.9 structure with accumulation confirmation. The category-relative strength delta of 12.4 points (0.0% versus -12.0%) proves the key discriminator: MOO wins because money is actively flowing into it, not because it's the only bullish setup.
Agriculture earns 5% as tier-2, a notable underweight given its exceptional 74.9 final category score and the macro case for real-asset protection. The category boasts 86.0/100 macro fit, the highest in the entire portfolio, fueled by supply shortage (+13), inflation pressure (+10), and real asset sponsorship (+8). MOO's technical evidence of 84.7/100 is outstanding, and the volume/price confirmation at 3.08x average rivals or exceeds the best setups in the allocation. The reason for tier-2 rather than top-2 is structural: in an AltSeason regime with crypto dominance, traditional commodities and agribusiness are being overlooked in favor of digital assets and leverage plays. Allocation will rise the moment inflation becomes undeniable or risk appetite shifts toward hard assets; for now, the 5% slot is a held position that respects both technical strength and macro headwinds.
Emerging Markets — INDA
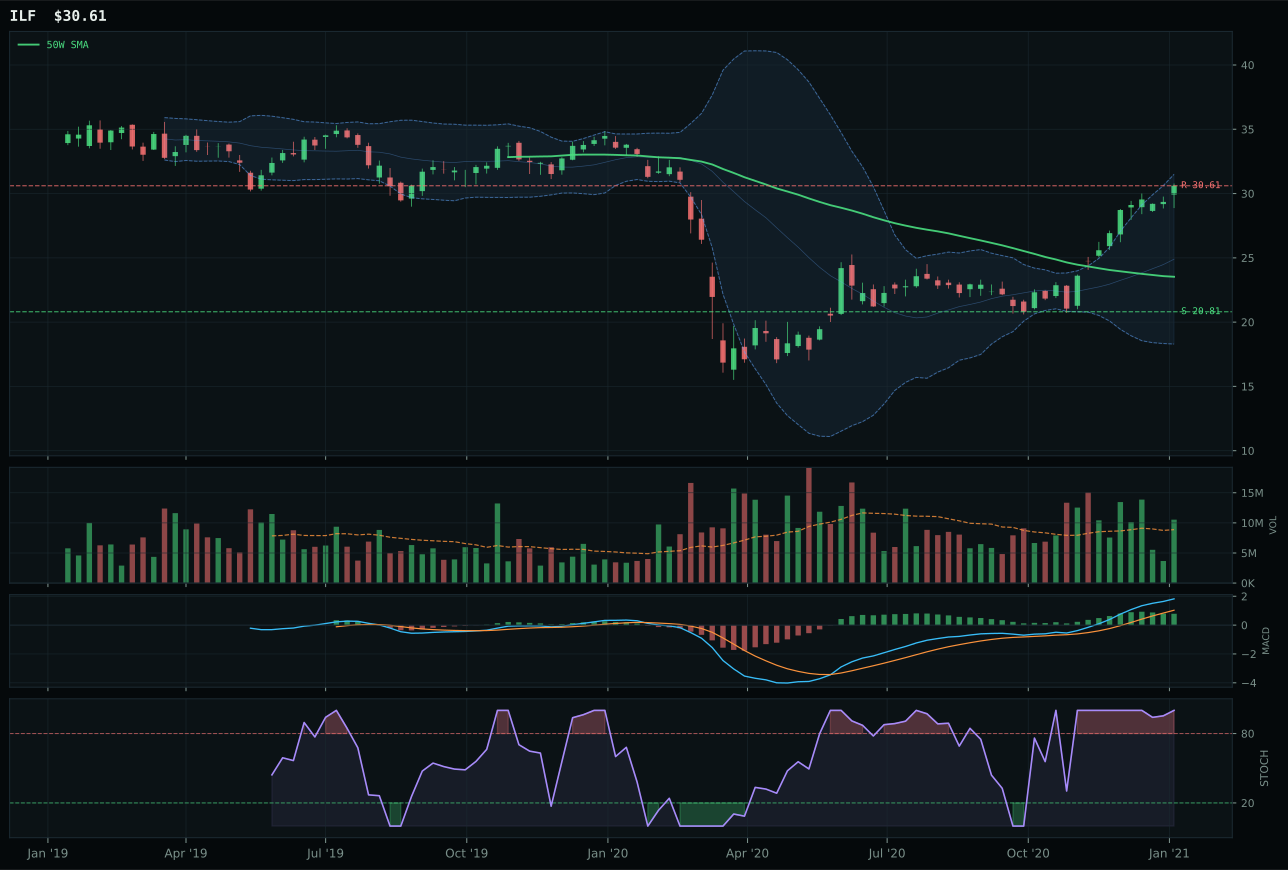
ILF has a vertical extension profile with 27.2% 13-week relative strength versus SPY.
A failed hold above support would weaken the setup.
Actionable but governed by invalidation levels.
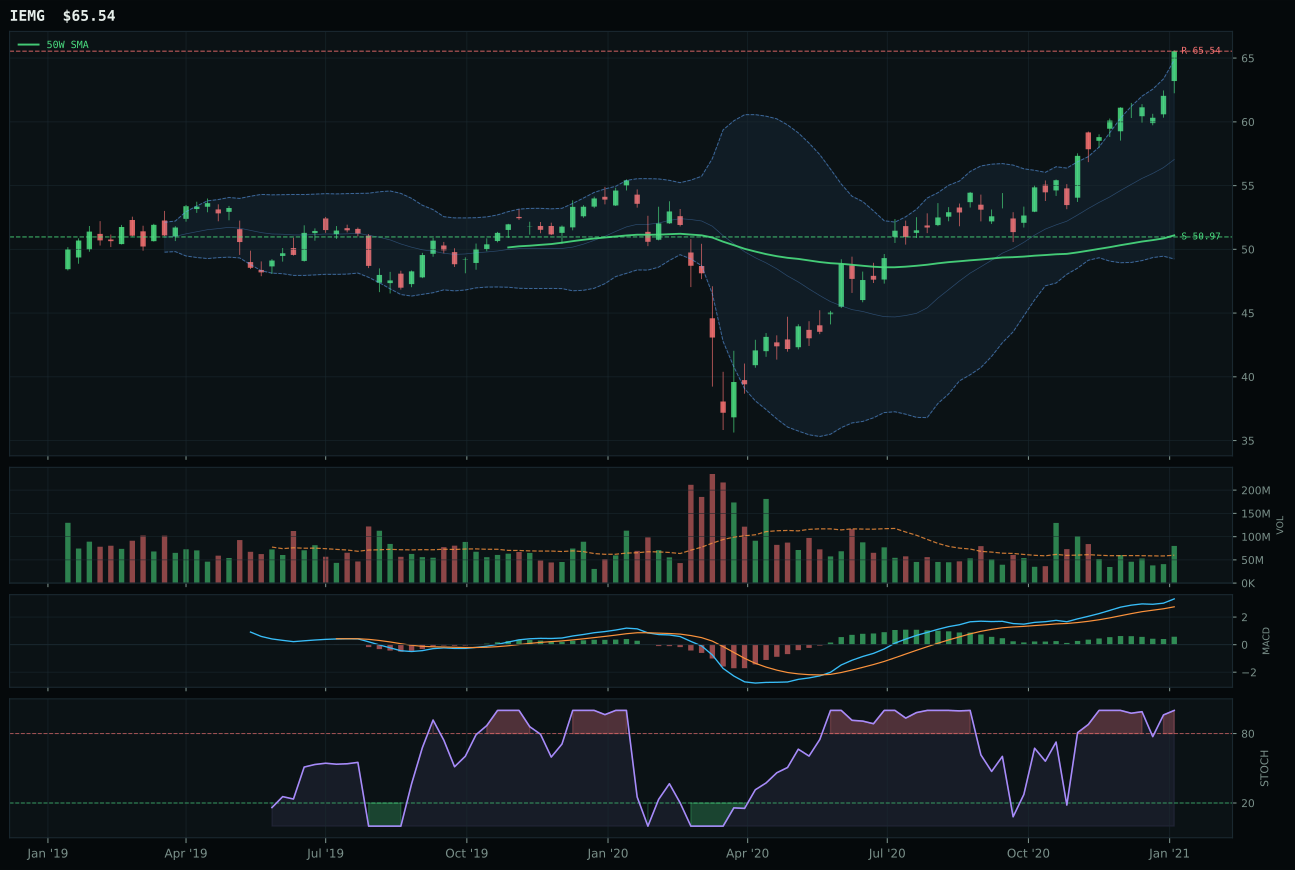
IEMG has a vertical extension profile with 9.5% 13-week relative strength versus SPY.
A failed hold above support would weaken the setup.
Actionable but governed by invalidation levels.
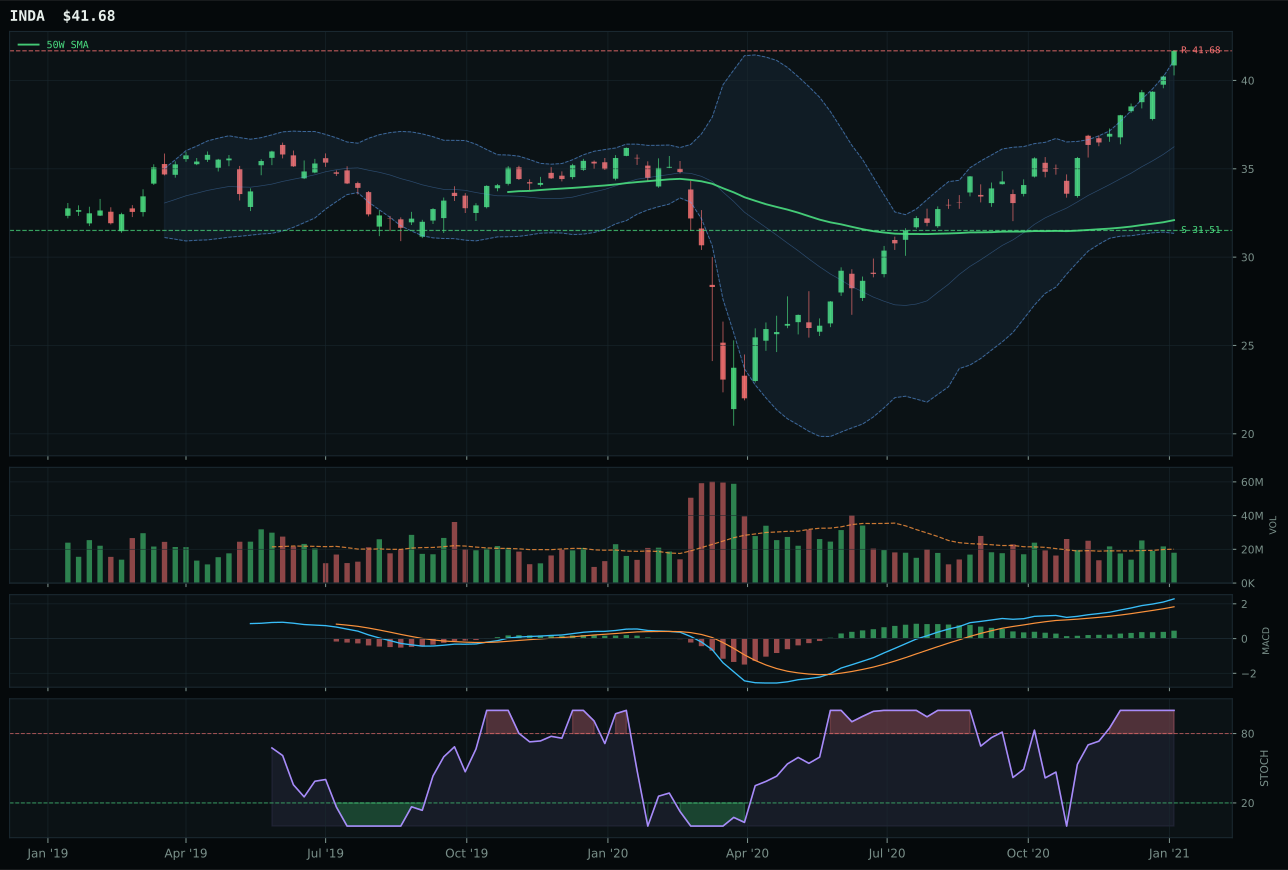
INDA has a vertical extension profile with 7.2% 13-week relative strength versus SPY.
A failed hold above support would weaken the setup.
Actionable but governed by invalidation levels.
INDA edges past ILF with a 63.8 reasoned score, a thin 9.4-point victory that hinges on MACD signal quality rather than outright momentum. The India quality-growth ETF posts a 100/100 trend score from price above both moving averages with 0.4% positive 50-week slope and 7.2% SPY-relative strength, paired with bullish-improving MACD that gives cleaner momentum confirmation than ILF's bullish-flattening signal. INDA's 17.1% 13-week return is modest relative to ILF's 37.1%, but category-relative strength of -2.4% versus ILF's 17.7% means INDA is losing to its peers — this is a tactical win not a category statement. The key differentiator is structure cleanliness: INDA's 85.3/100 structure score from 91.7 cleanliness and 85.5 compression beats ILF's 83.1. Volume is neutral for INDA (0.89x) versus above-average participation for ILF, which costs timing and momentum confirmation points but gains entry leverage. ILF is the better absolute performer (37.1% 13-week, 27.2% SPY-relative), but INDA's cleaner MACD and superior structural integrity give it category leadership despite being the technical laggard.
Emerging Markets receives 5% as tier-2, a modest allocation given the 71.1 final score and 62.0/100 macro fit. The category benefits from EM liquidity support (+14) and risk appetite positive (+8) but suffers credit stress headwinds (-10), netting a modest macro tailwind. INDA's 65.4/100 technical evidence is solid, and the India growth narrative has merit in a regime where Asia leads. However, ILF's superior absolute momentum (37.1% 13-week) and stronger relative strength (27.2% SPY-relative) suggest that Latin America commodity play is winning on a macro basis despite INDA's technical purity. The 5% allocation is conservative because emerging markets are a secondary play in AltSeason: crypto dominates risk appetite, and traditional EM currency and bond exposure lacks the inflation hedges that commodities provide. Allocation could rise to tier-2 (5%) or even tier-1 (10%) if macro shifts to EM currency stability and dollar weakness; for now, it's a diversifier holding rather than a conviction trade.
AI — SMH
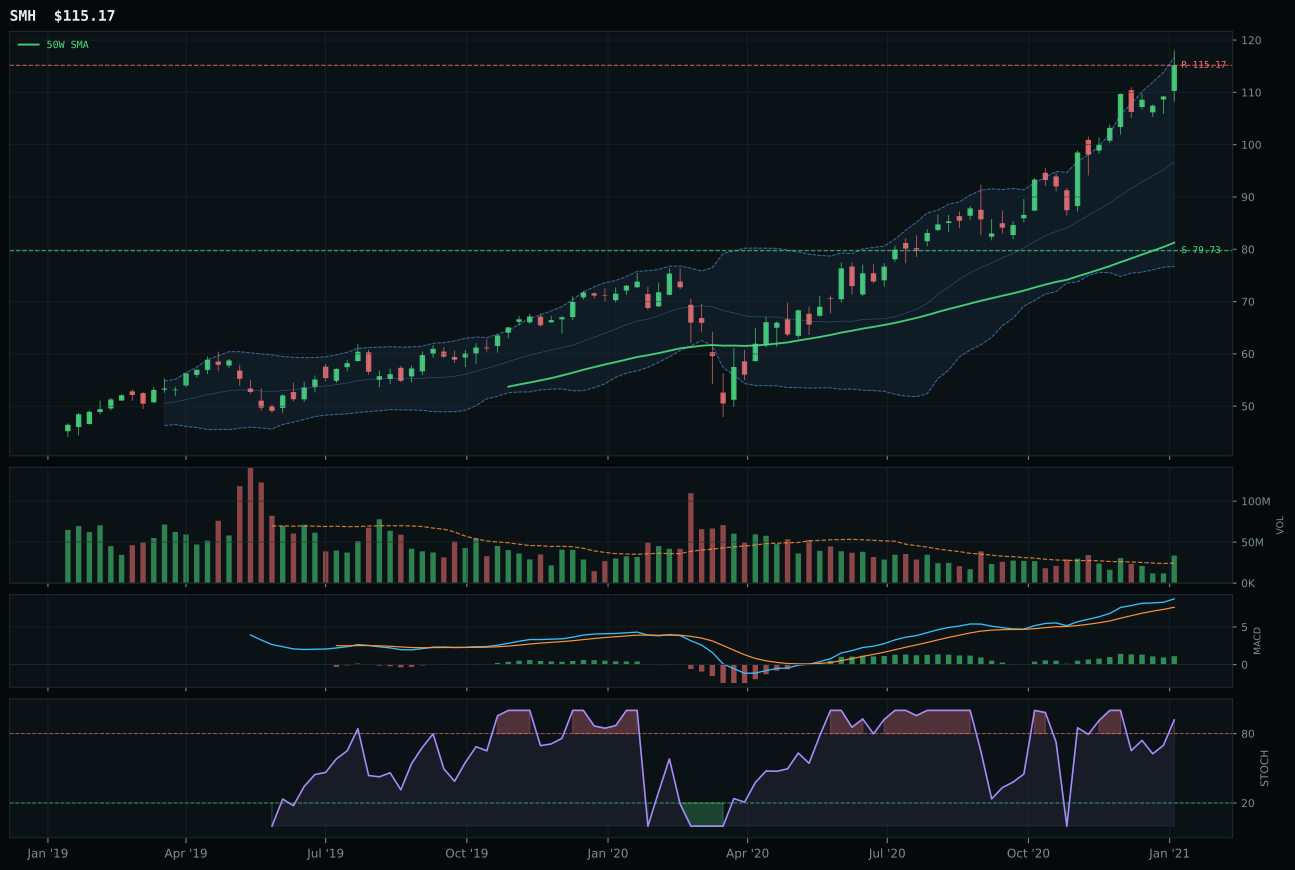
SMH has a vertical extension profile with 13.5% 13-week relative strength versus SPY.
A failed hold above support would weaken the setup.
Actionable but governed by invalidation levels.
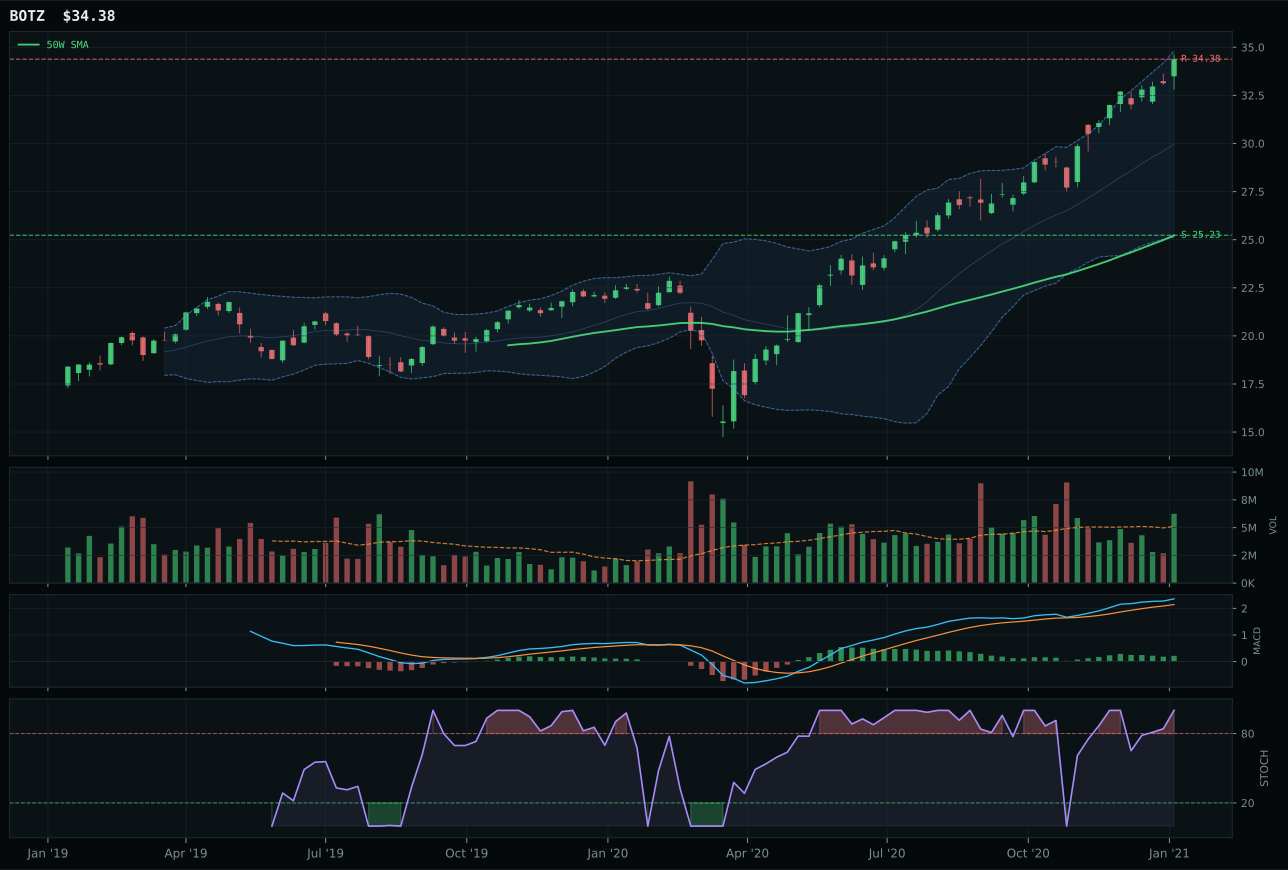
BOTZ has a vertical extension profile with 8.5% 13-week relative strength versus SPY.
A failed hold above support would weaken the setup.
Actionable but governed by invalidation levels.
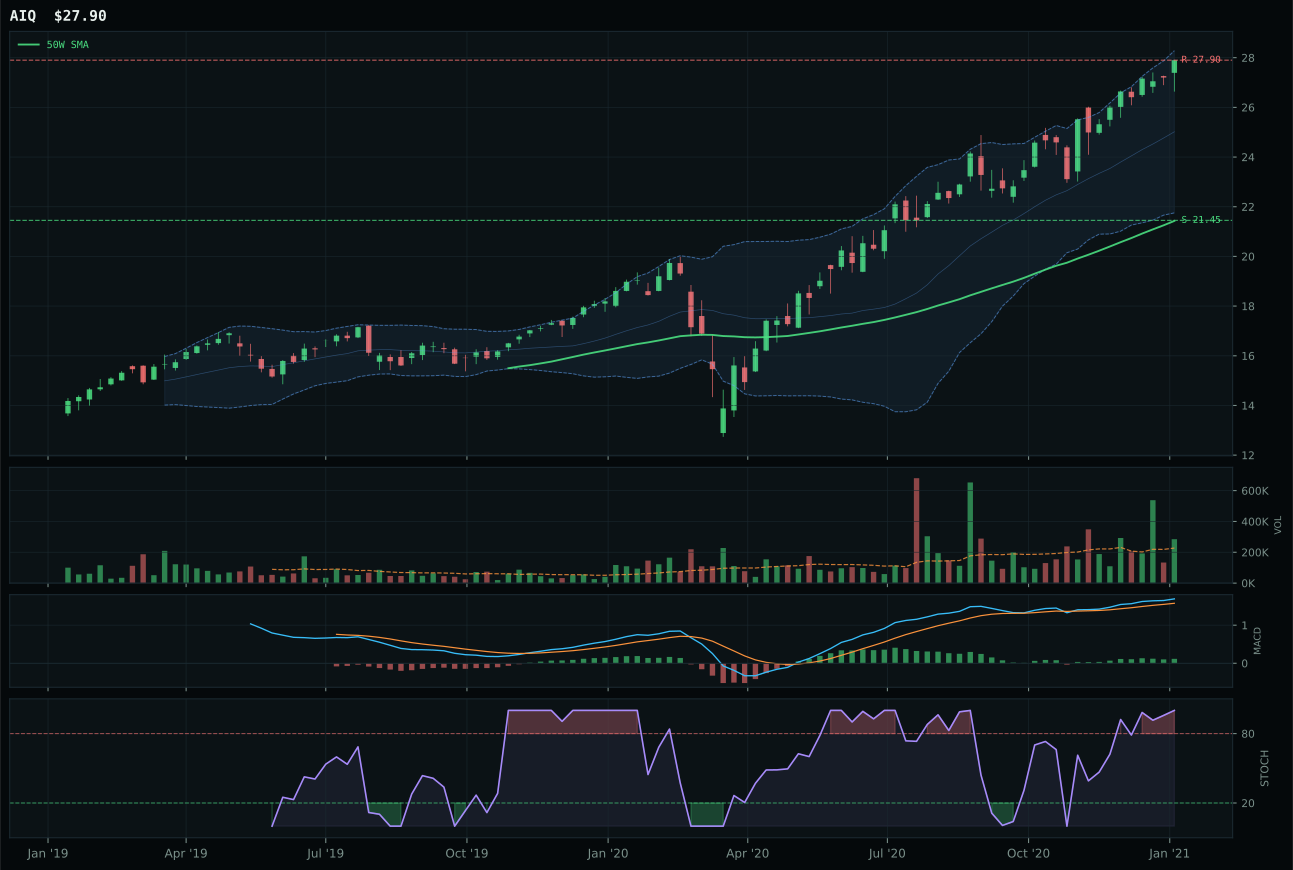
AIQ has a vertical extension profile with 3.6% 13-week relative strength versus SPY.
A failed hold above support would weaken the setup.
Tracked, but not top-2 eligible because: .
SMH captures the category with a 70.0 reasoned score, narrowly defeating BOTZ by category-relative strength of 5.0% versus 0.0%. The semiconductor and AI compute leader sports a 100/100 trend score from price above both moving averages and 13.5% SPY-relative outperformance, yet the setup itself tells a cautionary tale: extended 41.7% above the 50-week with MACD bullish but flattening and stochastic RSI rolling over from overbought momentum at 0.92. At 23.4% over thirteen weeks, every new buyer from here enters late in the rally. Volume participation of 1.37x the 20-week average is merely above-average, not the accumulation/confirmation that would signal fresh institutional conviction. BOTZ lost ground solely because its category-relative strength lagged at 0.0%, despite matching SMH's trend score and timing profile — this is a marginal victory on peer leadership, not setup quality.
AI receives 5% as a tier-2 holding, missing the top-2 by virtue of lower absolute score. The category macro fit is strong at 66.0/100, driven by active AI growth sponsorship (+14) and risk appetite positive (+10), which together push the reasoned ETF order to place SMH ahead of BOTZ and AIQ. However, the technical evidence of 71.3/100 for the winner and the macro tailwind are insufficient to overcome the positioning problem: all three ETFs sit in vertical extension with overbought technicals, meaning the risk/reward favors taking profits rather than fresh exposure. In an AltSeason environment with 50% overlay active, the 5% tier-2 slot acknowledges AI's macro importance while respecting the reality that entry timing has deteriorated materially week-over-week.
Technology — CIBR
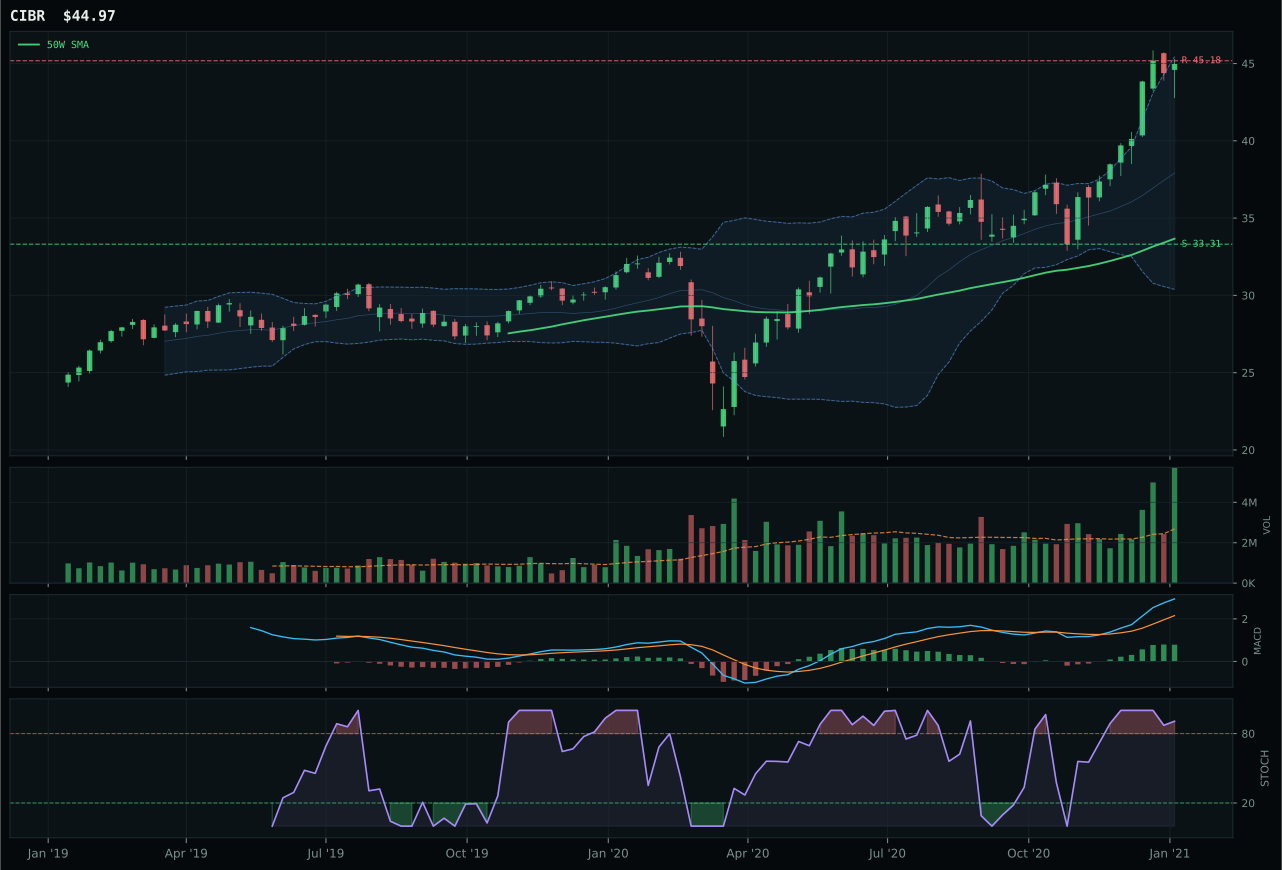
CIBR has a vertical extension profile with 12.7% 13-week relative strength versus SPY.
A failed hold above support would weaken the setup.
Actionable but governed by invalidation levels.
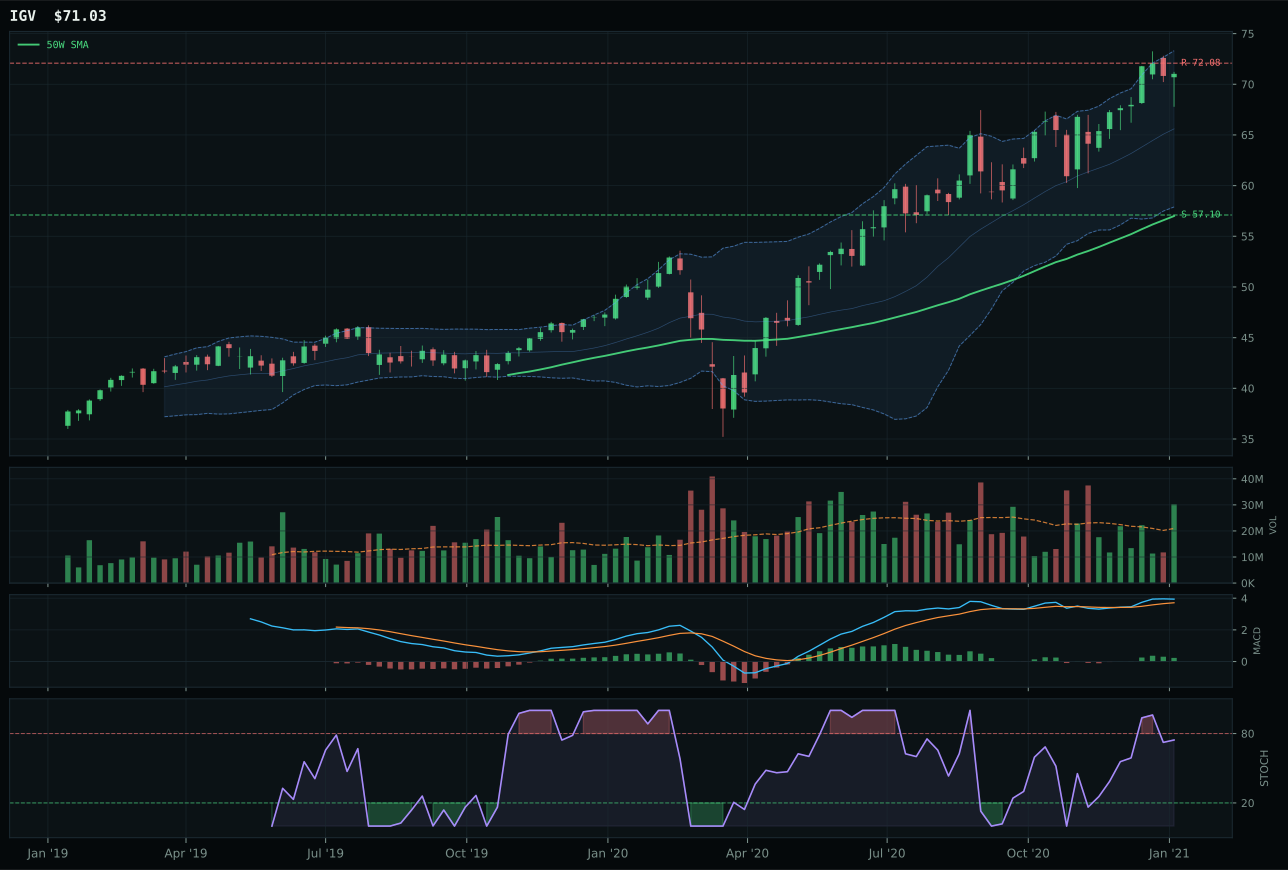
IGV has a vertical extension profile with -1.2% 13-week relative strength versus SPY.
A failed hold above support would weaken the setup.
Actionable but governed by invalidation levels.
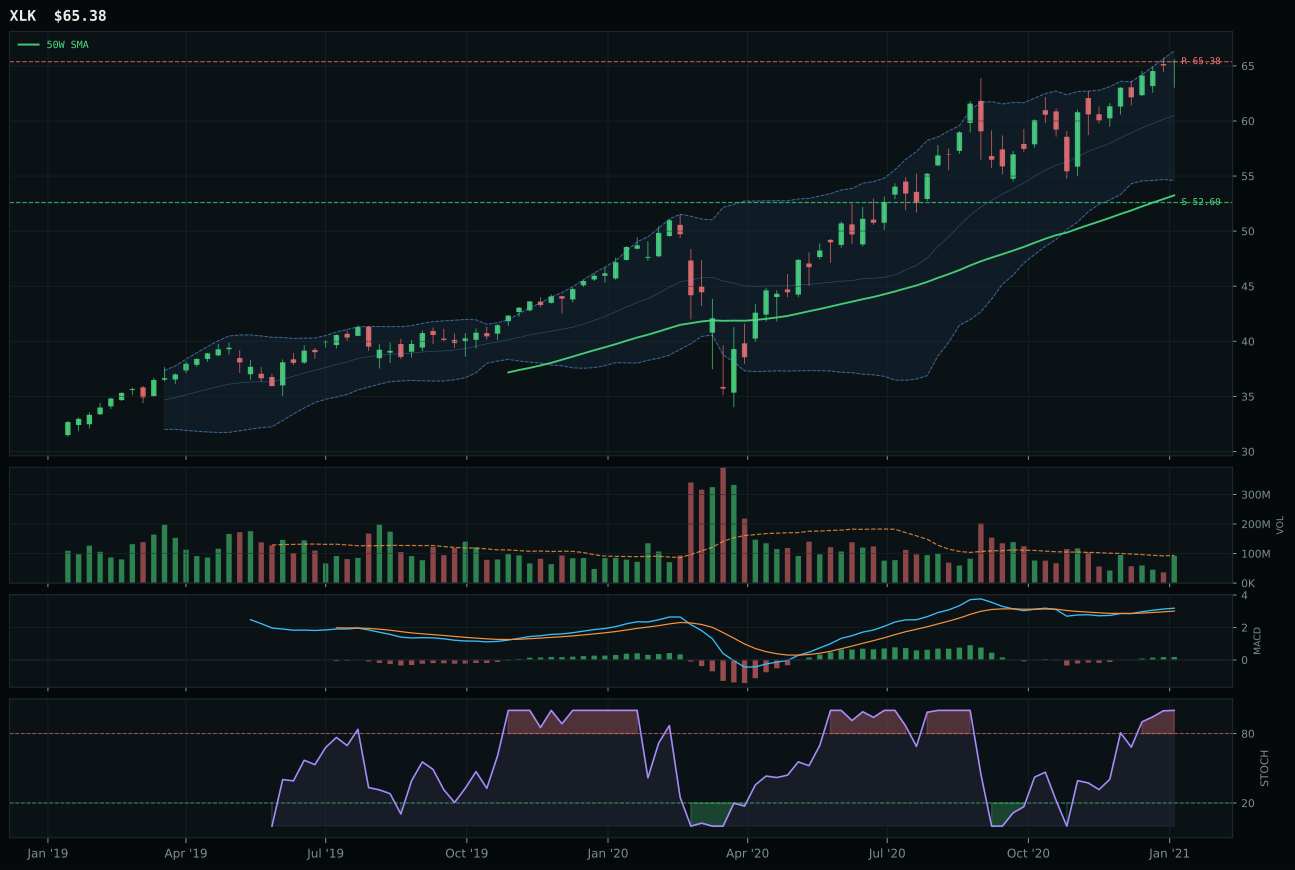
XLK has a vertical extension profile with -1.1% 13-week relative strength versus SPY.
A failed hold above support would weaken the setup.
Actionable but governed by invalidation levels.
CIBR wins the category with a 73.6 reasoned score, edging IGV by 4.0 points through superior relative strength and cleaner structure. The cybersecurity ETF sits 33.6% above its 50-week moving average with a 0.8% positive slope, meaning buyers are still actively accumulating at elevated prices — volume confirmation at 2.45x the 20-week average proves the move is sponsored, not merely reactive. Its 22.6% 13-week return and 12.7% outperformance versus SPY speak to genuine leadership, while the 13.8% category-relative strength differentiates it from IGV's flat peer positioning. The real risk here is timing: stochastic RSI is overbought and rolling over at 0.91, and upside to the Fib 0.236 resistance at 39.94 has vanished. IGV lost primarily because its 13-week return of 8.8% and -1.2% SPY-relative return signaled weakness in the same macro environment, and its stochastic RSI fell into neutral territory rather than confirming momentum.
Technology earns 5% allocation as a tier-2 category, ranked outside the top two despite posting a 63.6 final score. The category is caught between conflicting signals: its technical evidence scores 82.4/100 from the trend, momentum, and volume confirmation, yet the macro fit of just 52.0/100 drags it lower because credit stress is active and inflation pressure is bleeding duration-sensitive growth. In a Transition/Mixed regime with AI growth sponsorship (+6) fighting against credit stress (-7), cybersecurity provides some defensive flavor, but the extended nature of all three category members means entry risk is severe. Two higher-ranked categories claimed the top-2 slots, and Technology's macro headwinds in a tightening credit environment make it a hold rather than an outright buy at current levels.
Defense & Aerospace — ITA
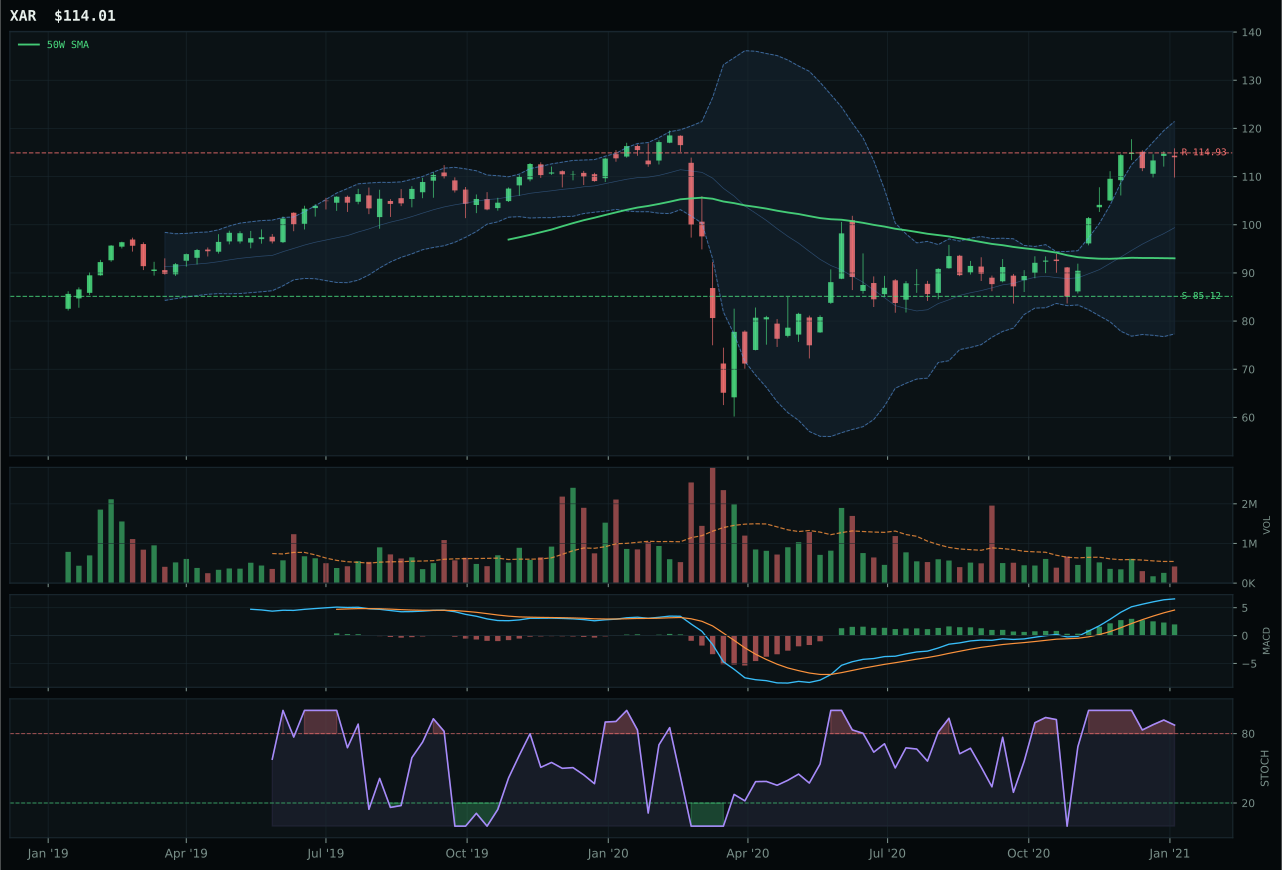
XAR has a vertical extension profile with 13.9% 13-week relative strength versus SPY.
A failed hold above support would weaken the setup.
Actionable but governed by invalidation levels.
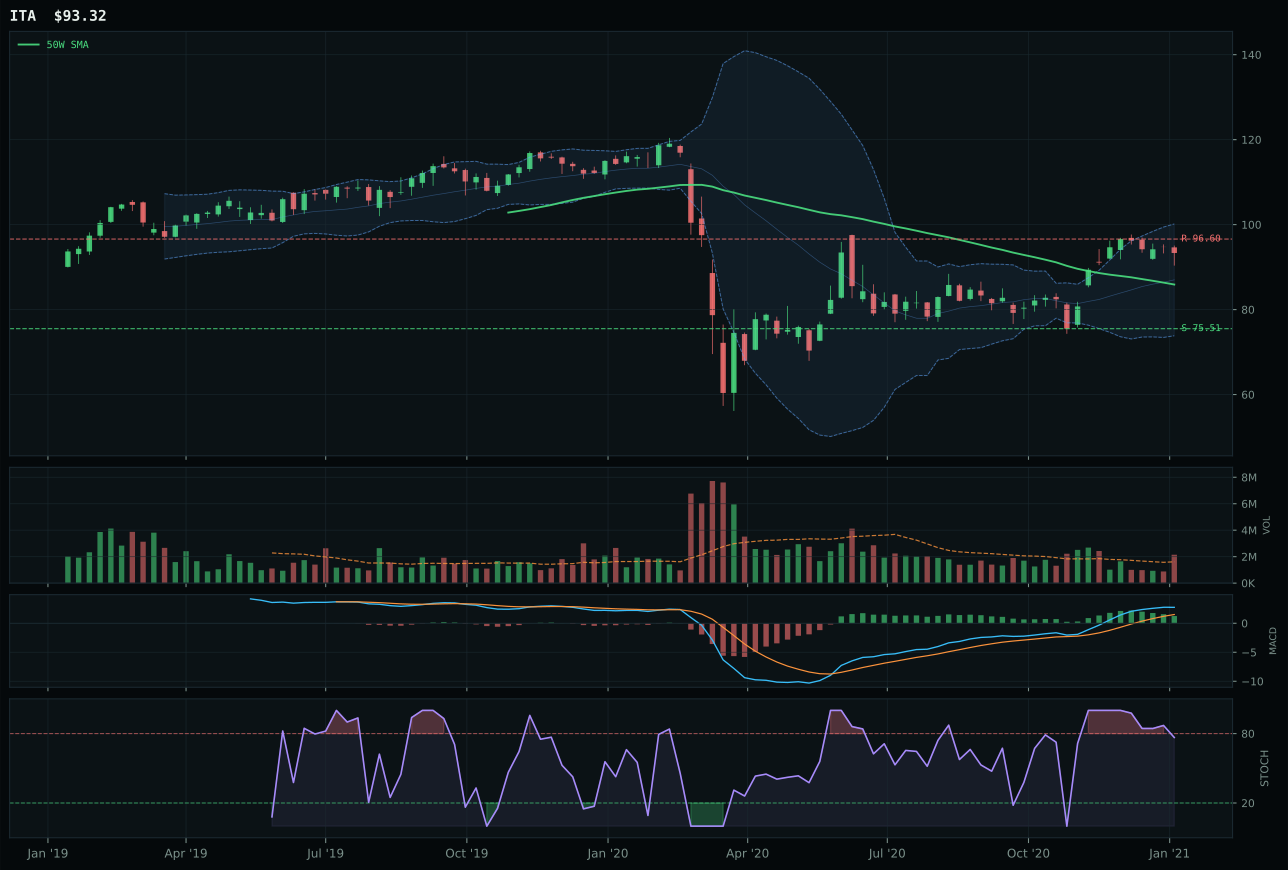
ITA has a neutral structure profile with 3.7% 13-week relative strength versus SPY.
A failed hold above support would weaken the setup.
Actionable but governed by invalidation levels.
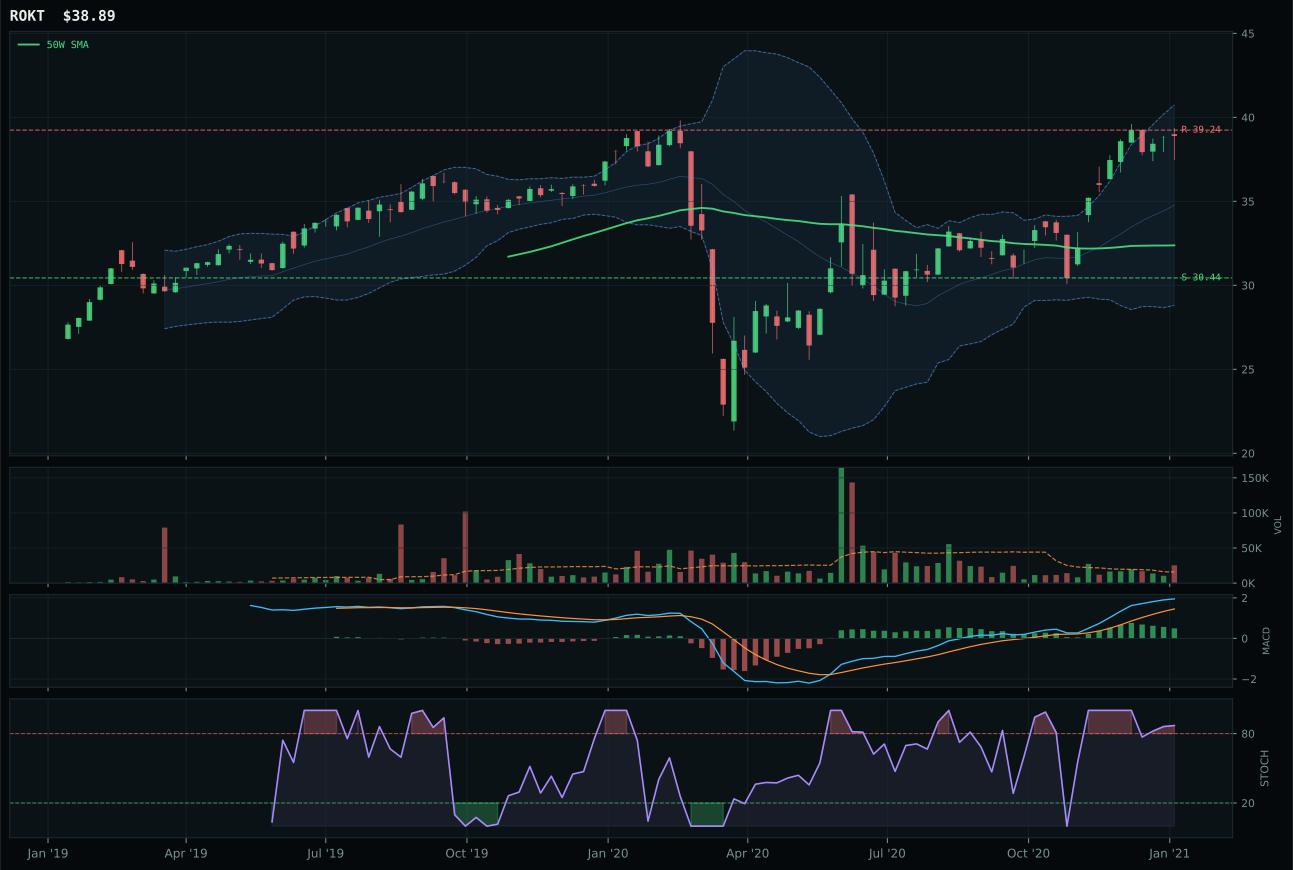
ROKT has a vertical extension profile with 6.9% 13-week relative strength versus SPY.
A failed hold above support would weaken the setup.
Tracked, but not top-2 eligible because: .
ITA wins with a 59.4 reasoned score, a 2.6-point clear win over XAR despite being price-below-200-day with a negative 50-week slope of -0.5%. This counterintuitive victory hinges on timing: ITA sits only 8.6% above its 50-week, placing it in the middle retracement decision zone near Fib 0.382, while XAR has stretched to 22.6% above the 50-week in full vertical extension. ITA's stochastic RSI is falling into neutral (0.77), providing cleaner risk/reward of -3.4% upside to resistance versus 23.6% downside to support. XAR's overbought momentum and neutral volume cannot offset the late entry risk created by its 23.8% 13-week return and 13.9% SPY-relative strength. Defense-prime durability beats defensively-priced momentum when both carry balanced macro weight — ITA's 69.3% momentum confirmation, despite lagging XAR's 100%, reflects honest assessment of entry condition rather than trend weakness.
Defense & Aerospace claims 5% as a tier-2 category, ranked well below the top two despite its 55.0 final category score. The macro environment provides mild support: Transition/Mixed regime adds 3 points and credit stress adds 2, yielding a 55.0/100 macro fit. Yet the category-level technical evidence is only 62.3/100, hampered by the fact that every member is either overbought or struggling with volume confirmation. ITA's positioning in the decision zone offers a lower-risk entry than XAR's extended profile, but neither setup is compelling enough to justify top-tier allocation in an environment where real assets and cyclicals are outperforming. The 5% tier-2 slot acknowledges geopolitical bid support without committing capital at unfavorable risk/reward.
Utilities & Infrastructure — PAVE
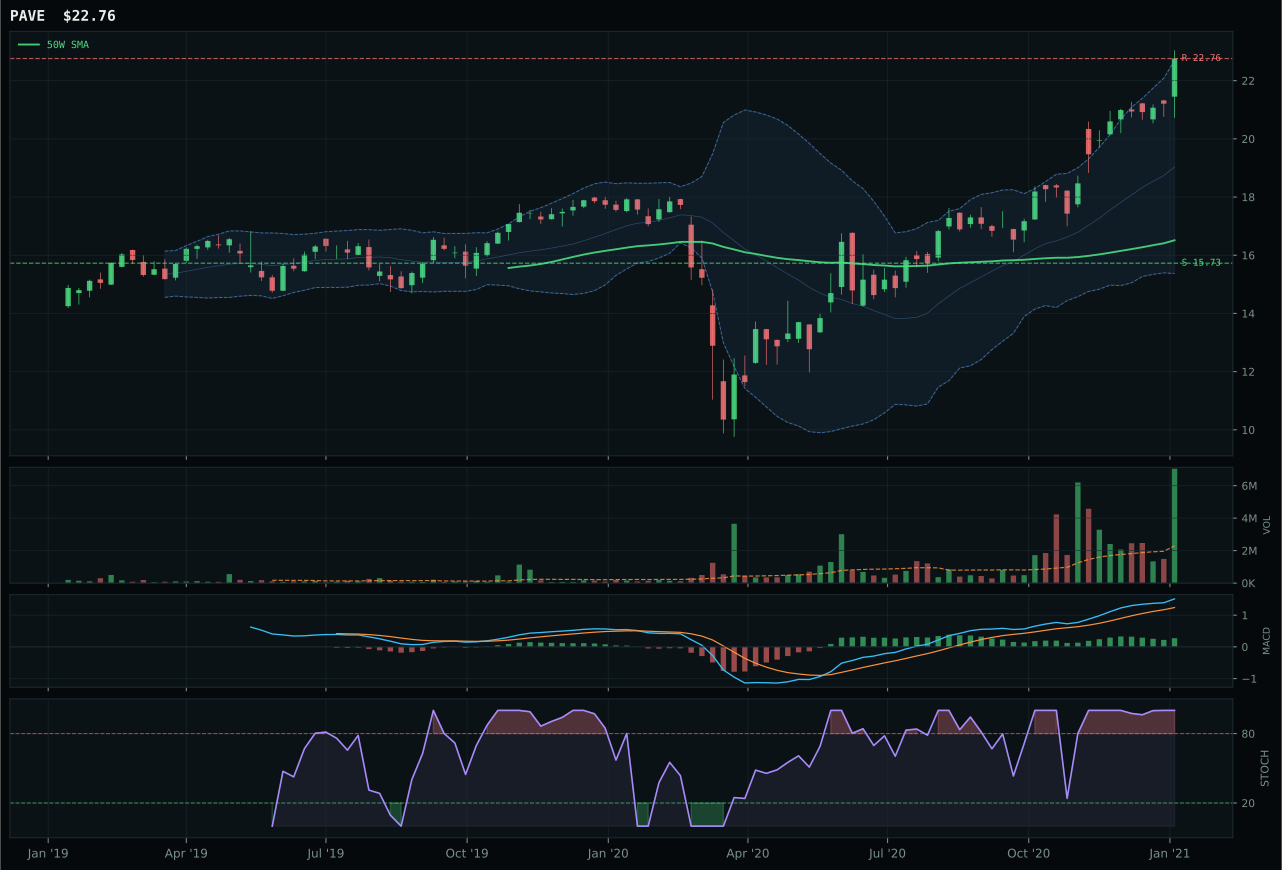
PAVE has a vertical extension profile with 15.2% 13-week relative strength versus SPY.
A failed hold above support would weaken the setup.
Actionable but governed by invalidation levels.
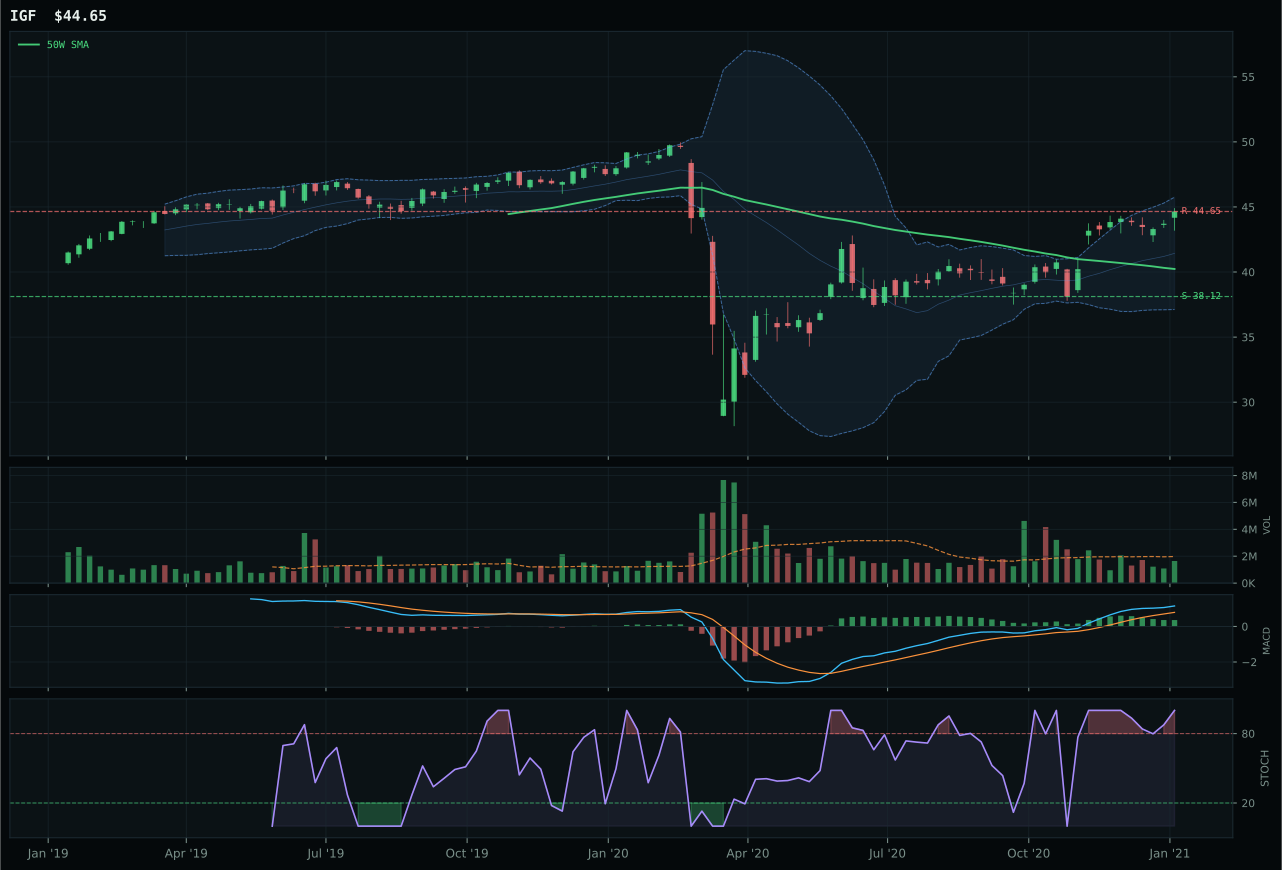
IGF has a neutral structure profile with 0.7% 13-week relative strength versus SPY.
A failed hold above support would weaken the setup.
Actionable but governed by invalidation levels.
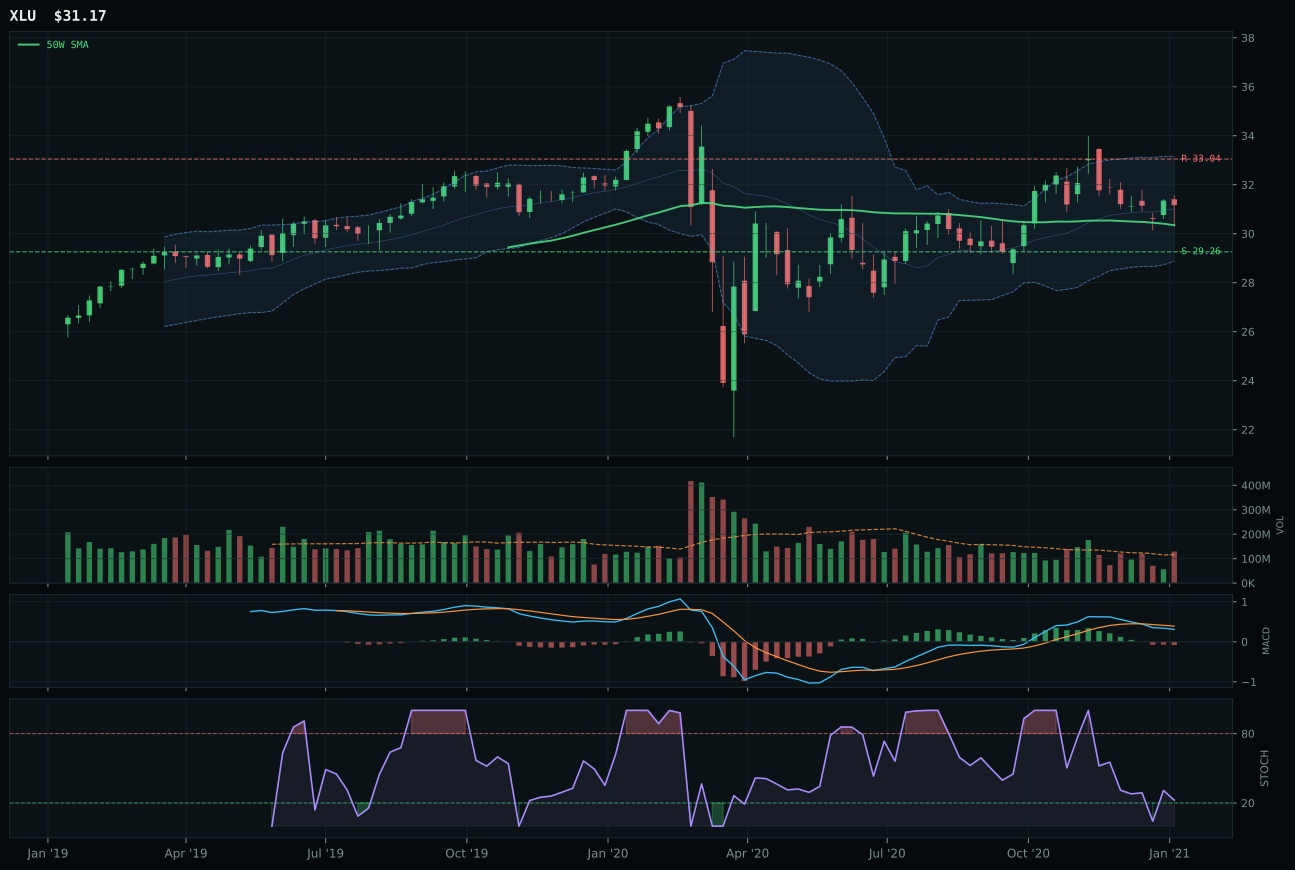
XLU has a compression near 50W profile with -11.7% 13-week relative strength versus SPY.
A failed hold above support would weaken the setup.
Actionable but governed by invalidation levels.
PAVE captures the category with a 77.2 reasoned score, a 16.1-point win over IGF that reflects unmatched volume sponsorship and category-relative strength leadership. The domestic infrastructure and capex beta play posts a 100/100 trend score from price above both moving averages with a 0.6% positive 50-week slope, and critically, it boasts 3.07x the 20-week volume average at accumulation/confirmation — the second-strongest volume in the entire portfolio behind REMX. Its 25.1% 13-week return and 15.2% SPY-relative outperformance, paired with 14.5% category-relative strength, prove institutional commitment. Stochastic RSI is overbought momentum at 1.00, but the 94.0/100 volume-price confirmation and 100/100 persistence scores indicate the move is being continuously accumulated, not bounced. IGF's neutral structure with neutral volume and only 0.7% SPY-relative return cannot compete with PAVE's 85.0 structure score and accumulation pressure. The risk is obvious: 37.8% extended above the 50-week leaves minimal upside to the 22.76 resistance, but the volume profile suggests institutional buyers are willing to commit at levels many traders view as dangerous.
Utilities & Infrastructure receives 5% as tier-2, reflecting exceptional technical evidence of 89.2/100 for PAVE against modest 53.0/100 macro fit. The macro environment is mixed for utilities: commodity breadth positive (+4) and risk appetite positive (+4) help, but inflation pressure (-6) and credit stress (-5) hurt. Utilities typically lose in rising-rate environments, yet PAVE's capex and infrastructure focus (bridges, roads, broadband) provides cyclical leverage that pure utility exposure lacks. The category-level 46.0/100 macro fit is poor — inflation pressure actively penalizes rate-sensitive infrastructure exposure. However, PAVE's 100/100 trend and 94/100 volume-price confirmation argue for a small allocation on technical conviction. The 5% tier-2 slot respects that this is a powerful technical move (25.1% 13-week with accumulation) in a category facing macro headwinds. Risk is clear: if yields rise further or inflation deflates, PAVE's extended technicals and negative macro fit would trigger rapid deleveraging. Allocation is held for now but would be exited immediately if credit stress descriptor intensifies or volume-price confirmation rolls over.
Nuclear Energy — URA
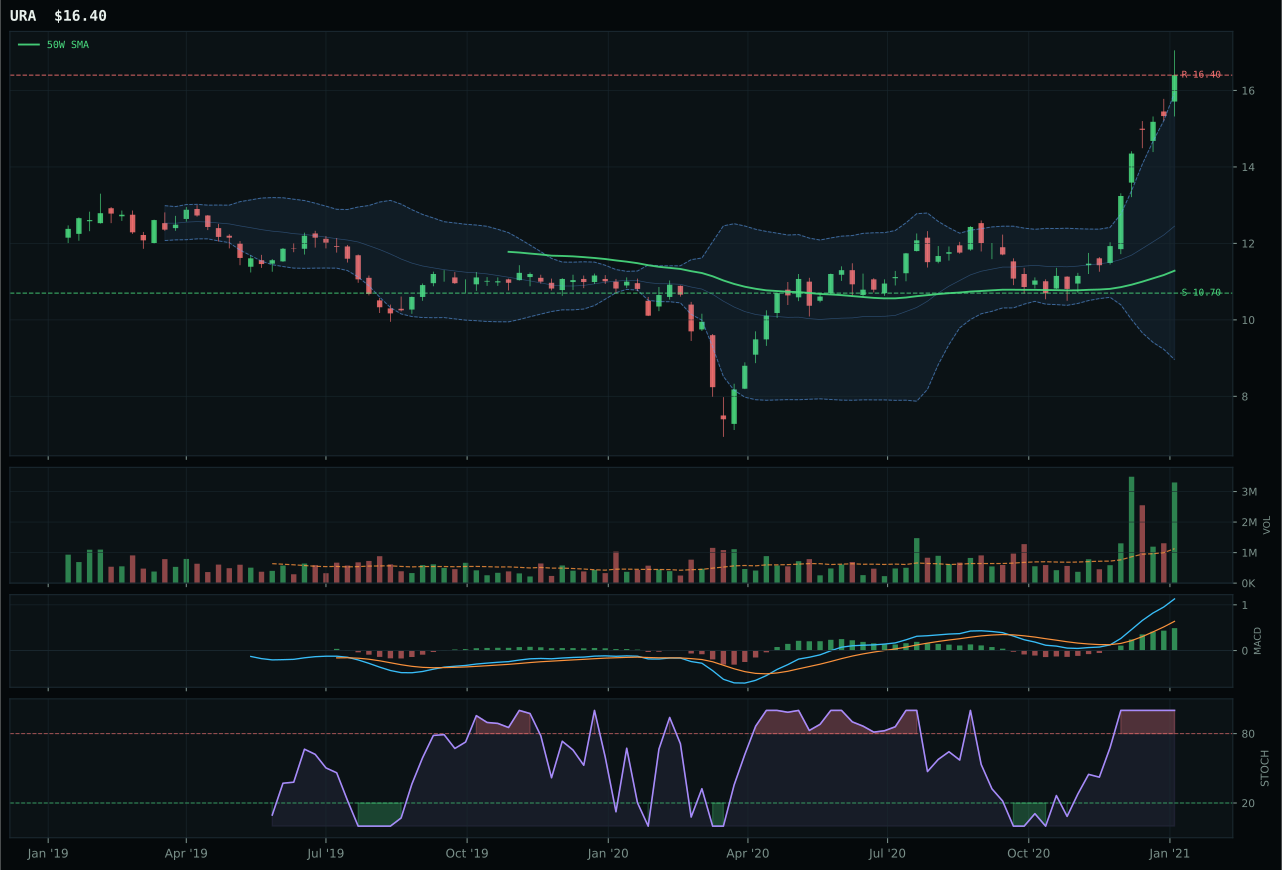
URA has a vertical extension profile with 38.8% 13-week relative strength versus SPY.
A failed hold above support would weaken the setup.
Actionable but governed by invalidation levels.
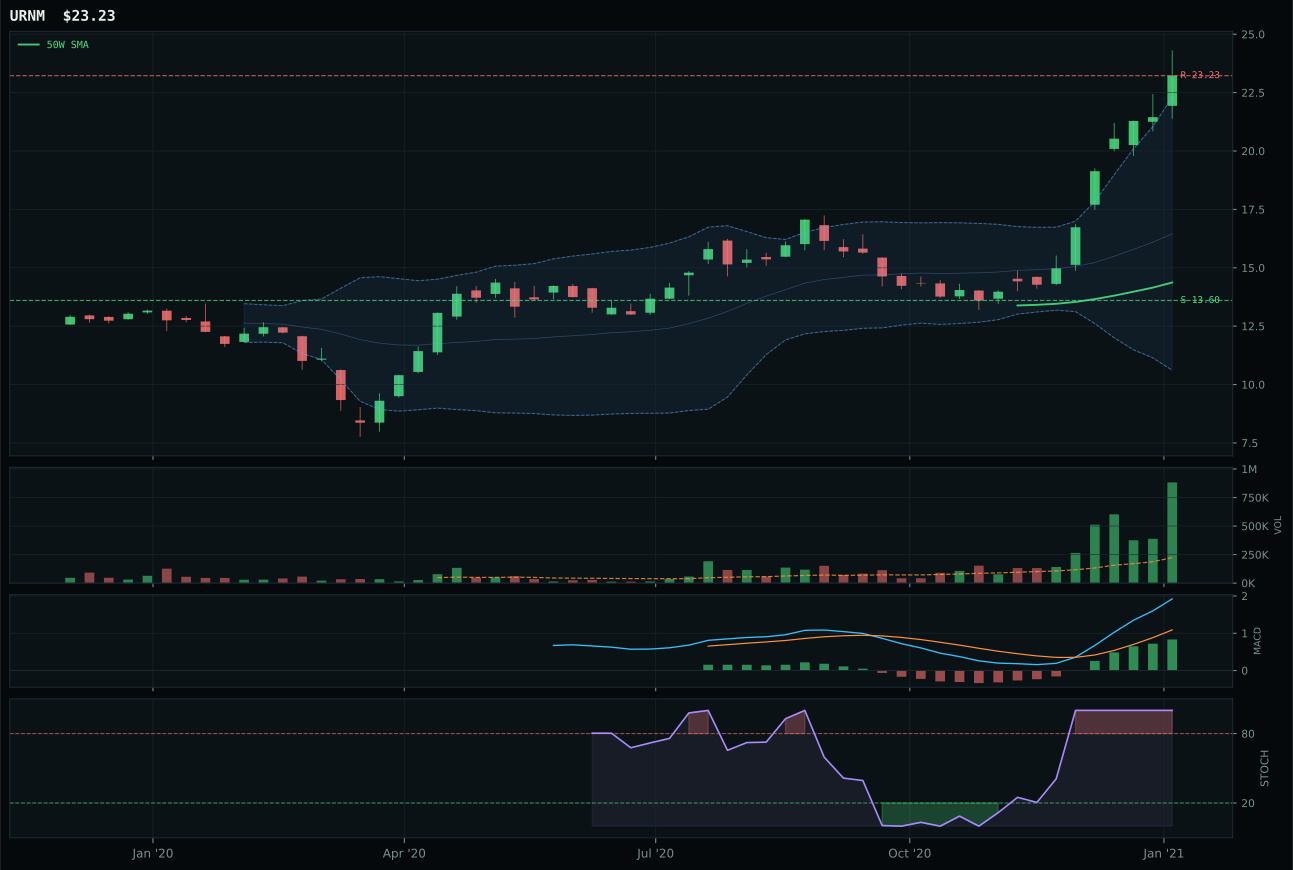
URNM has a vertical extension profile with 52.2% 13-week relative strength versus SPY.
A failed hold above support would weaken the setup.
Tracked, but not top-2 eligible because: .
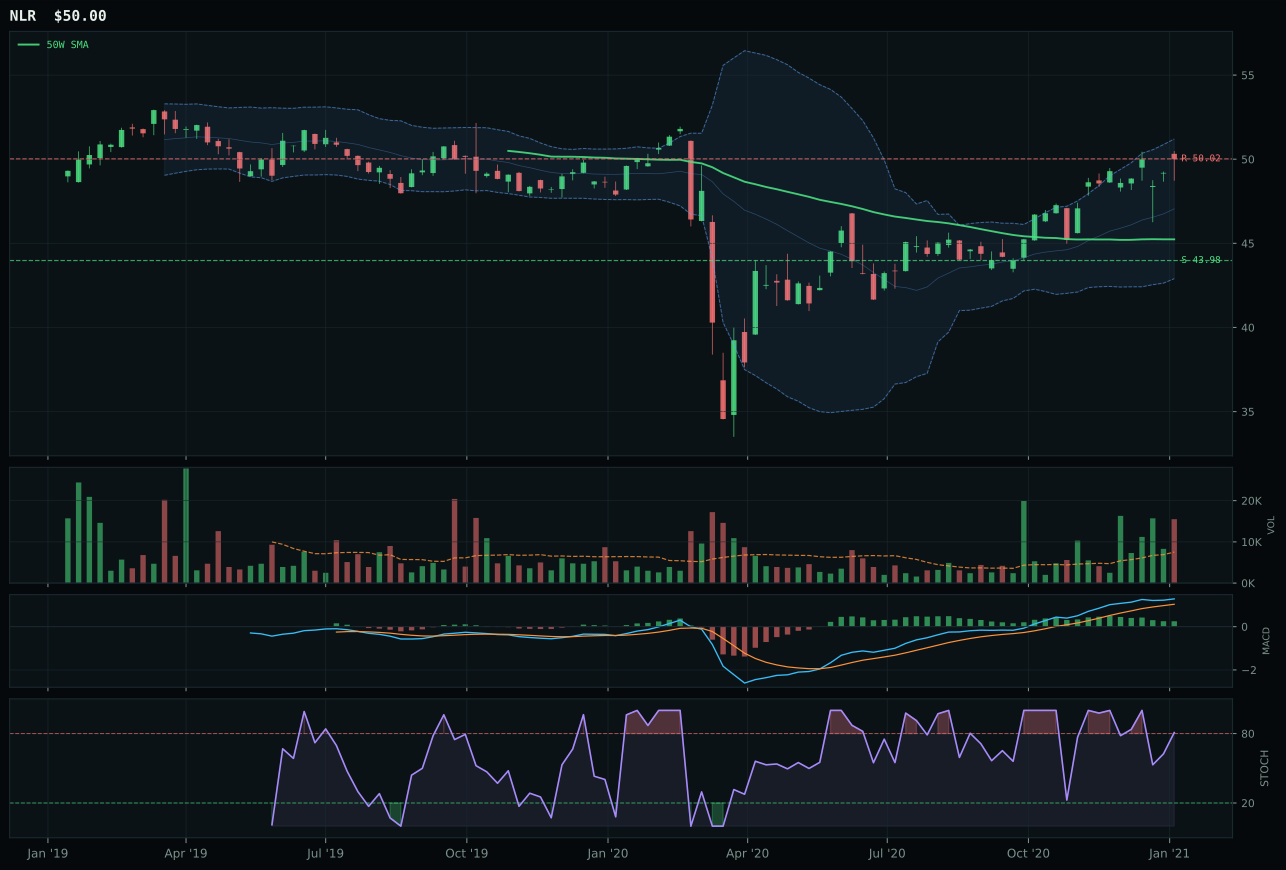
NLR has a neutral structure profile with -2.9% 13-week relative strength versus SPY.
A failed hold above support would weaken the setup.
Tracked, but not top-2 eligible because: .
URA wins with an 83.3 reasoned score, a 38.3-point demolition of URNM that reveals a critical flaw in mining-beta structures. The uranium ETF posts a clean 100/100 trend score and 93.1/100 technical evidence, with price 45.3% above the 50-week, 1.0% positive slope, and 38.8% SPY-relative outperformance. Volume confirmation at 2.92x the 20-week and 100/100 persistence confirms accumulation. The 48.7% 13-week return is explosive but coherent with AI/datacenter power demand narratives. URNM's -37.5-point technical deficit is stunning: its 45.0/100 technical score reflects better absolute momentum (62.1% 13-week, 52.2% SPY-relative) but catastrophically worse risk/reward and timing structure. URNM sits 61.6% above its 50-week, far more extended than URA's 45.3%, forcing investors to chase after 75% of the move is complete. The scoring system penalizes URNM's reckless extension regardless of bullish narrative because entry risk is fundamentally asymmetric. URA's proximity to momentum inflection offers better risk-adjusted return despite lower absolute outperformance.
Nuclear Energy receives 0% allocation, excluded from the portfolio despite URA's powerful 83.3 technical score and 69.0/100 macro fit. The category's 44.1 final score is poisoned by macro uncertainty: while energy scarcity (+9) and real asset sponsorship (+7) support uranium fundamentals, the category has no active descriptor like "nuclear capacity expansion" to reflect policy tailwinds. The macro fit of 50.0/100 for the broader category fails to justify allocation in AltSeason when crypto is dominant and traditional commodities are orphaned. URA's extended 45.3% position above the 50-week also makes new entry risky; the category would rank higher if URA were coiled closer to the 50-week rather than extended into resistance. Reallocation would occur if either (1) macro descriptors explicitly shifted to nuclear expansion, or (2) URA broke below the 50-week and reset into a cleaner accumulation zone. For now, 0% respects that this is an excellent technical move that happened before allocation rules made it eligible.
Precious Metals — GDX
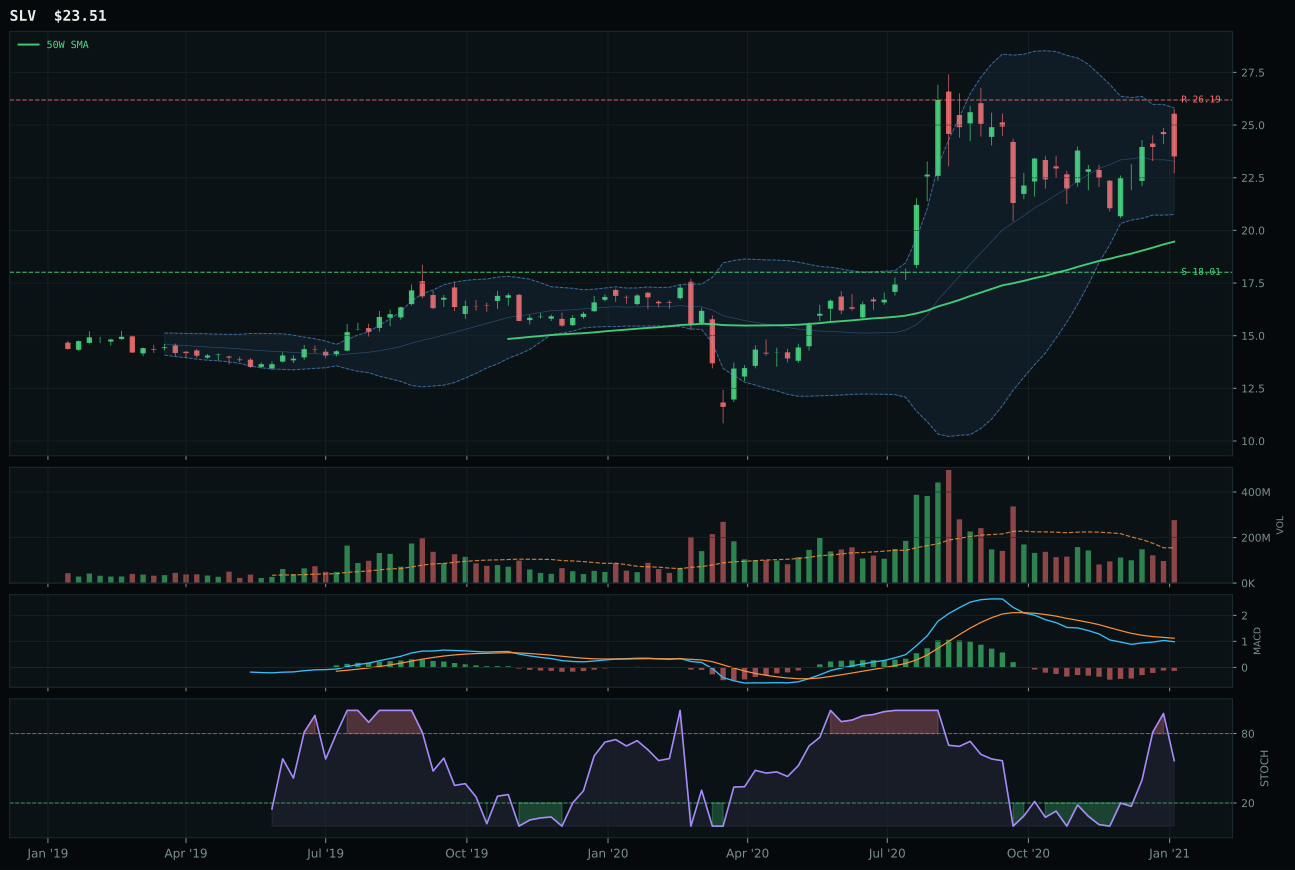
SLV has a vertical extension profile with -9.5% 13-week relative strength versus SPY.
A failed hold above support would weaken the setup.
Actionable but governed by invalidation levels.
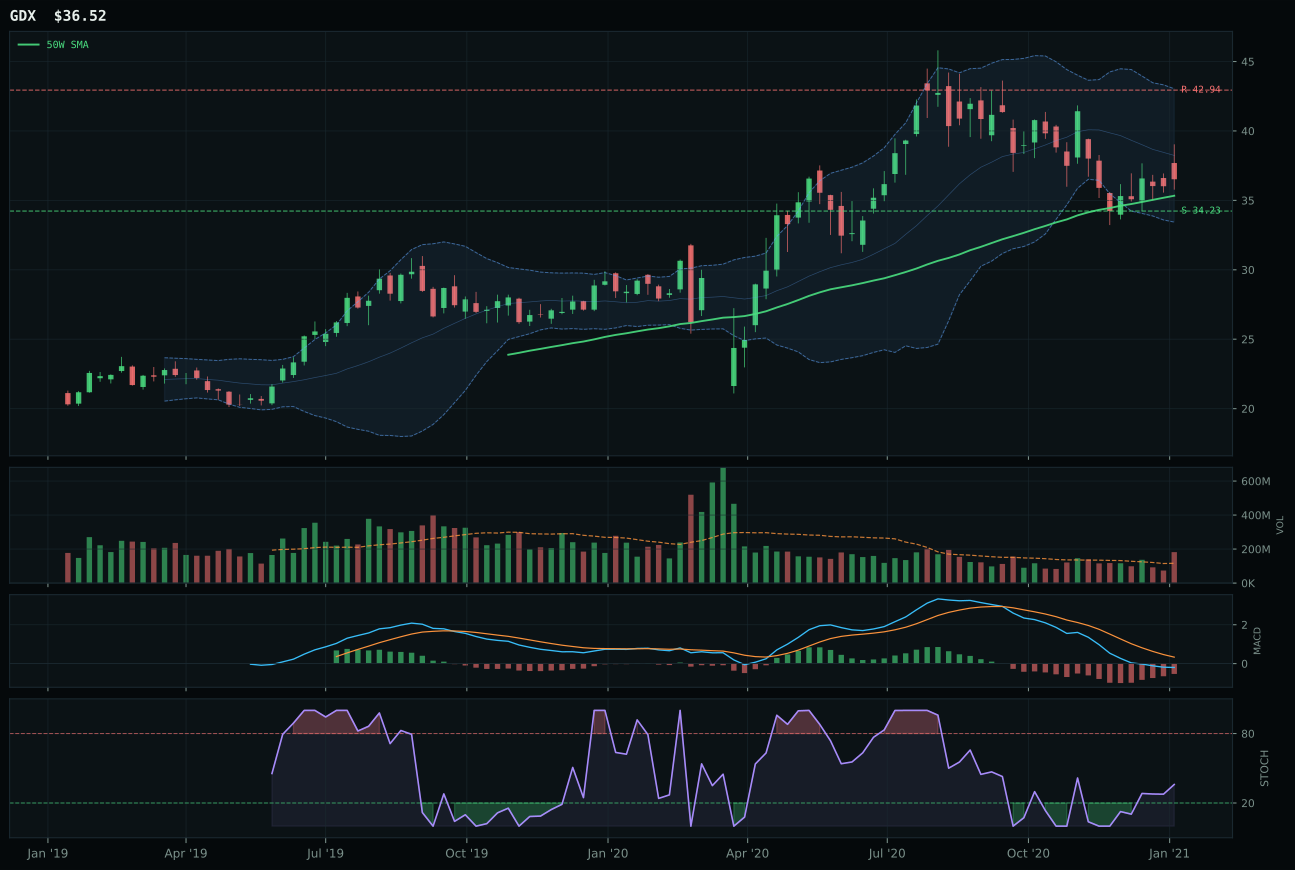
GDX has a neutral structure profile with -20.4% 13-week relative strength versus SPY.
A failed hold above support would weaken the setup.
Actionable but governed by invalidation levels.
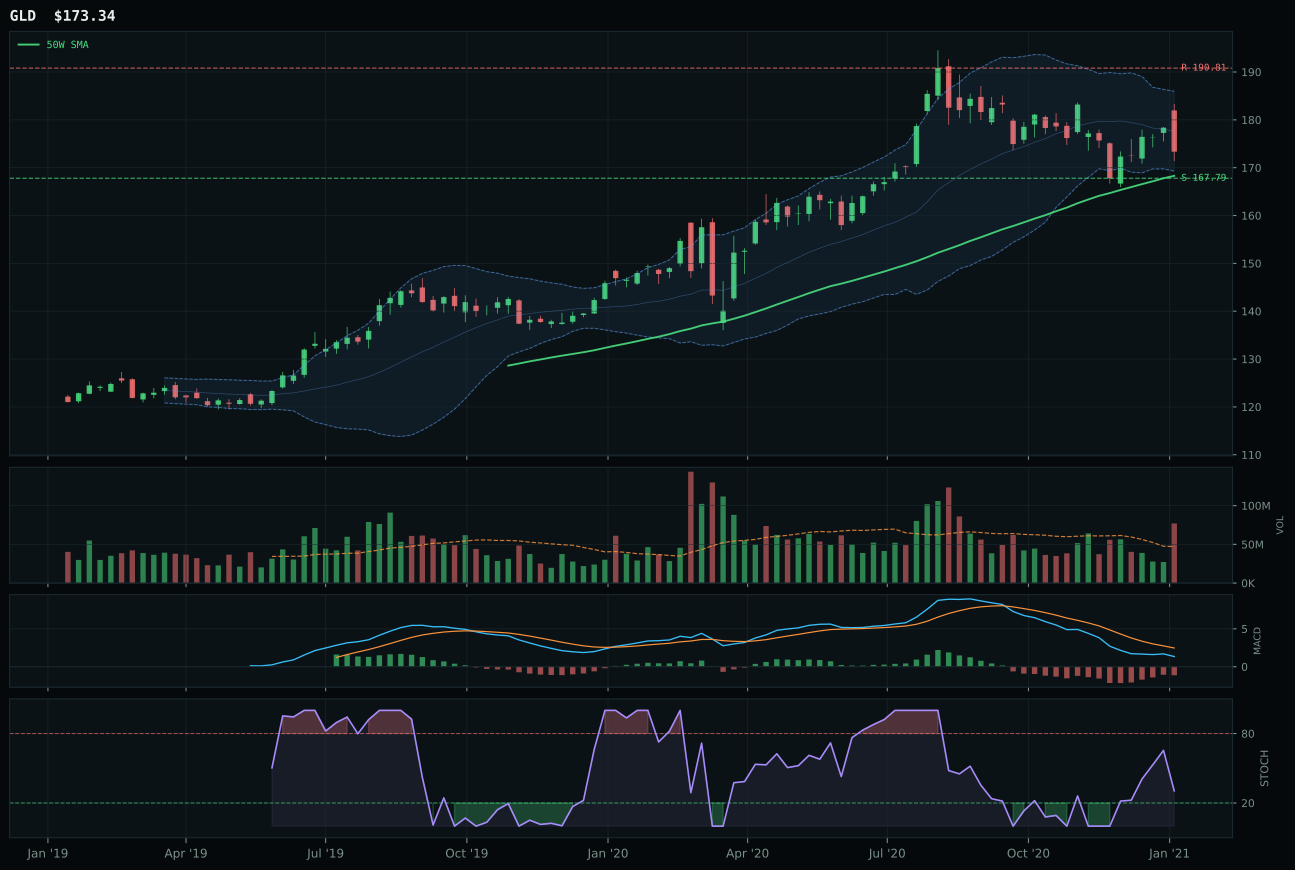
GLD has a pullback into support profile with -14.2% 13-week relative strength versus SPY.
A failed hold above support would weaken the setup.
Actionable but governed by invalidation levels.
GDX wins by default in a losing category, posting a 61.5 reasoned score but seeing its category collapse to 39.8 after testing against persistence and breadth filters. The gold miners ETF exhibits exceptional timing: its 98.0/100 timing score reflects placement only 4.4% above the 50-week in the upper retracement zone, with MACD bearish but improving and stochastic RSI rising from oversold mid-zone at 0.36. The risk/reward is asymmetric at 90.2/100: downside to support of 6.7% versus -15.0% upside room. This is a classic coiled setup in a beaten-down category. However, the -10.4% 13-week return and -20.4% SPY-relative underperformance expose the fundamental problem: momentum confirmation scores only 14.1/100, and volume-price persistence of just 49.0/100 signals rejection of the bounce, not institutional accumulation. SLV lost because it's stretched at 20.8% above the 50-week with distribution pressure; GDX at least offers a reasonably-timed entry for a brave reversal trade.
Precious Metals receives 0% allocation, excluded entirely from the portfolio as the lowest-ranked category. The 39.8 final score reflects a 67.9/100 technical reading overwhelmed by just 47.0/100 macro fit in a Transition/Mixed regime where risk appetite positive (+4) is overwhelmed by credit stress (-7). In an AltSeason environment, traditional precious metals have no bid: they offer neither growth (like equities) nor yield enhancement (like fixed income) nor innovation leverage (like crypto). The category's macro fit is constrained by the absence of a gold-specific descriptor profile; general inflation pressure arguments are insufficient when real rates are rising and dollar strength persists. GDX's 98/100 timing score would ordinarily suggest a tier-2 buy, but the momentum collapse and volume-price rejection make this a setup to watch rather than deploy. Allocation returns to zero until either the technical bounce confirms with volume participation or macro descriptor weight shifts materially.