
2021-01-01
Informational purposes only. The content in this report, including allocations, analysis, and commentary, is provided solely for informational and educational purposes. It does not constitute financial advice, investment advice, trading advice, or any other type of advice. Past performance does not guarantee future results. Always conduct your own research and consult a qualified financial professional before making investment decisions.
Some tracked tickers were excluded due to missing live weekly price data: SGOV: Historical cache SGOV has only 31 usable weekly bars
Weekly Allocation
| Ticker | Category | Weight | Role |
|---|---|---|---|
| FSOL | 50% | Overlay | |
| REMX | Industrial Metals | 10% | Top-2 (10%) |
| XLE | Traditional Energy | 10% | Top-2 (10%) |
| WEAT | Agriculture & Livestock | 5% | Tier-2 (5%) |
| INDA | Emerging Markets | 5% | Tier-2 (5%) |
| CIBR | Technology | 5% | Tier-2 (5%) |
| BOTZ | AI | 5% | Tier-2 (5%) |
| ITA | Defense & Aerospace | 5% | Tier-2 (5%) |
| XLU | Utilities & Infrastructure | 5% | Tier-2 (5%) |
Trade Instructions — Monday Open
Sell the tranche from 2020-12-04 (completing its 4-week hold). Buy the new tranche. Instructions show net portfolio changes — same-asset positions cancel, weight changes show the delta.
| Action | Ticker | Instruction |
|---|---|---|
| SELL | FCG | Sell 33% of FCG position (reduce 7.50% → 5.00%) |
| SELL | COPX | Sell 50% of COPX position (reduce 5.00% → 2.50%) |
| SELL | ILF | Sell 33% of ILF position (reduce 3.75% → 2.50%) |
| SELL | SMH | Sell 25% of SMH position (reduce 5.00% → 3.75%) |
| SELL | PAVE | Sell 33% of PAVE position (reduce 3.75% → 2.50%) |
| SELL | XAR | Sell 25% of XAR position (reduce 5.00% → 3.75%) |
| SELL | MOO | Sell 25% of MOO position (reduce 5.00% → 3.75%) |
| BUY | XLE | Buy XLE — 22.22% of freed cash (adds 2.50% to portfolio) |
| BUY | REMX | Buy REMX — 22.22% of freed cash (adds 2.50% to portfolio) |
| BUY | INDA | Buy INDA — 11.11% of freed cash (adds 1.25% to portfolio) |
| BUY | XLU | Buy XLU — 11.11% of freed cash (adds 1.25% to portfolio) |
| BUY | WEAT | Buy WEAT — 11.11% of freed cash (adds 1.25% to portfolio) |
| BUY | BOTZ | Buy BOTZ — 11.11% of freed cash (adds 1.25% to portfolio) |
| BUY | ITA | Buy ITA — 11.11% of freed cash (adds 1.25% to portfolio) |
Current Portfolio After Trade
Combined holdings across all 4 active tranches. Each tranche is 25% of the portfolio.
| Ticker | % of Portfolio | Weight Bar |
|---|---|---|
| FSOL | 50.00% | |
| FCG | 5.00% | |
| CIBR | 5.00% | |
| XLE | 5.00% | |
| REMX | 5.00% | |
| SMH | 3.75% | |
| XAR | 3.75% | |
| MOO | 3.75% | |
| ILF | 2.50% | |
| PAVE | 2.50% | |
| COPX | 2.50% | |
| PICK | 2.50% | |
| INDA | 2.50% | |
| XLU | 2.50% | |
| WEAT | 1.25% | |
| BOTZ | 1.25% | |
| ITA | 1.25% |
Macro Regime — Transition / Mixed
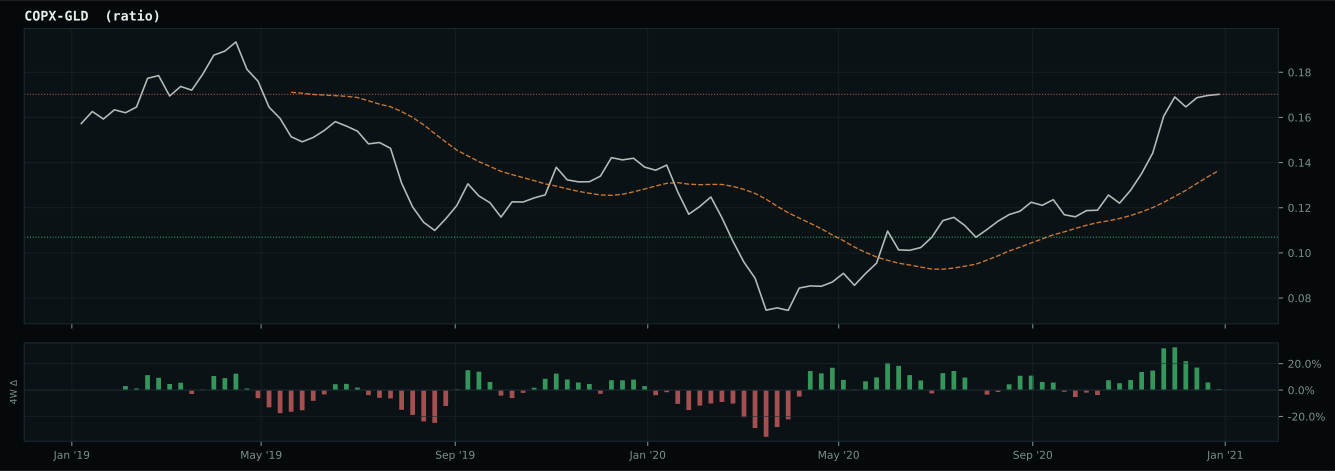
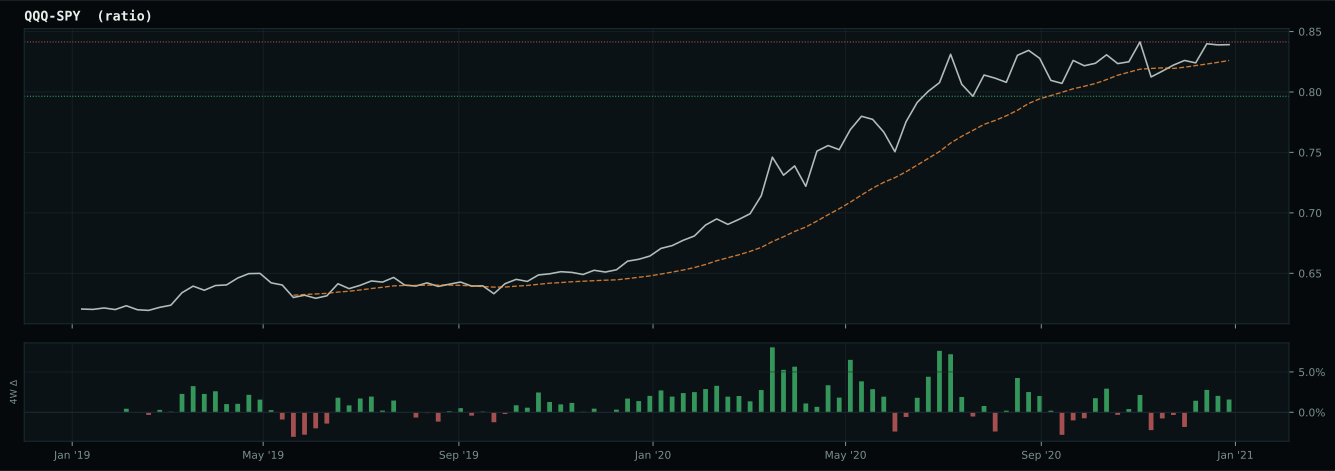
Macro Evidence Charts
Market-implied signals behind the macro regime scores. Each ratio compares two assets; the direction and slope of the ratio is what the macro engine reads.
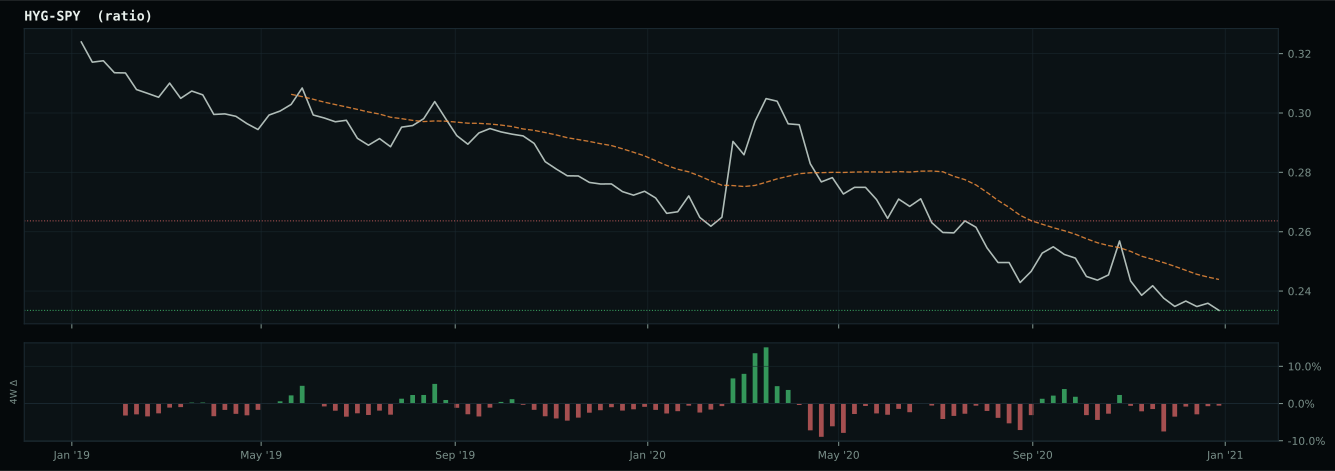
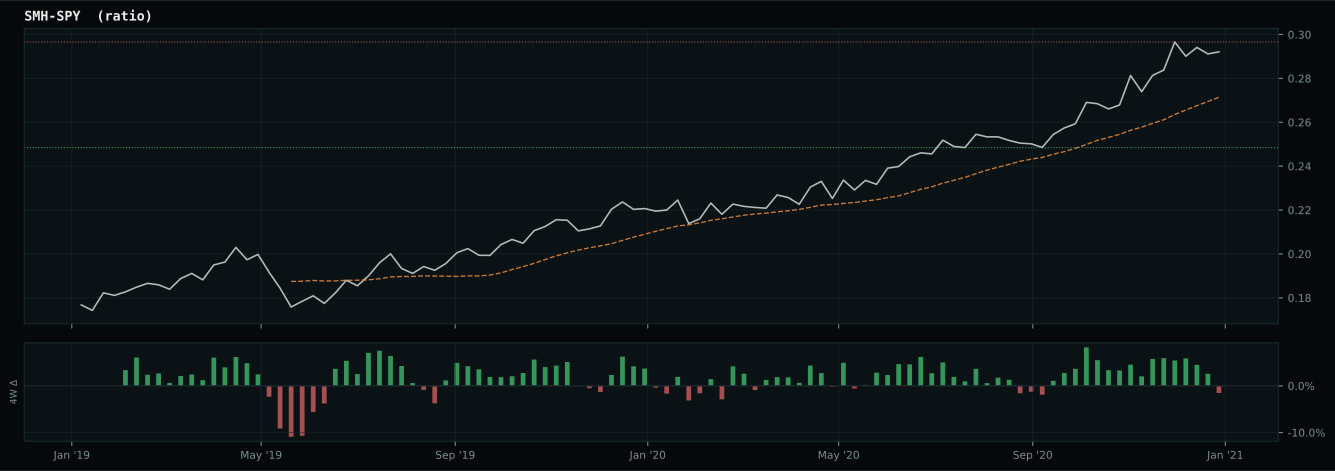
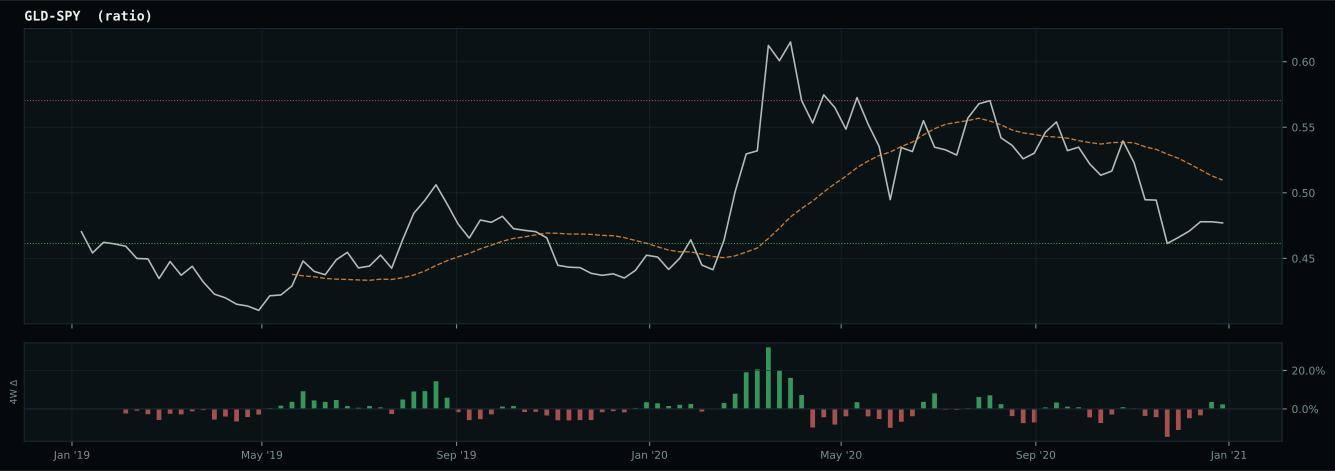
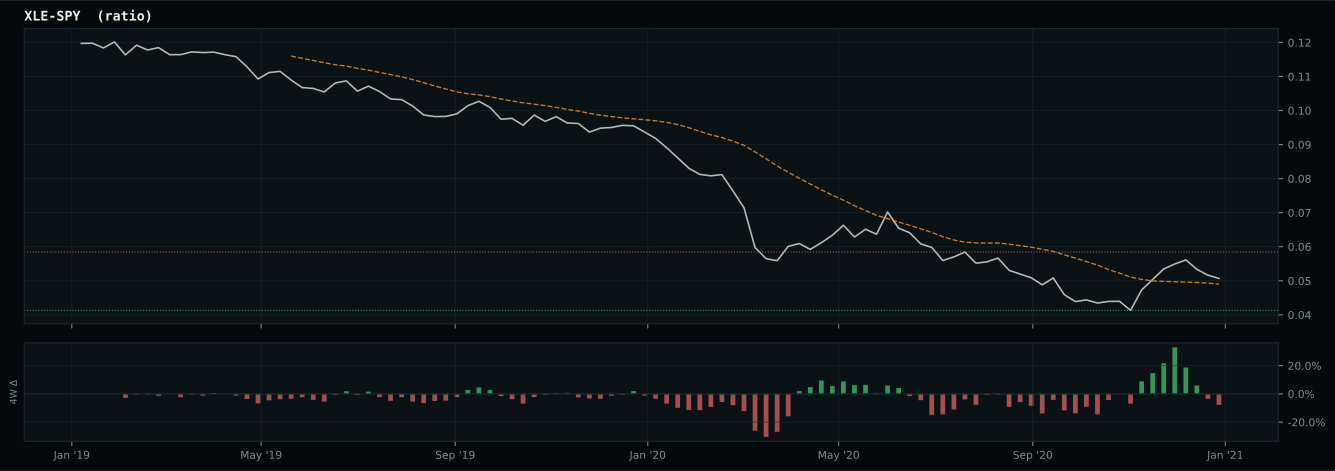
Crypto Regime — AltSeason
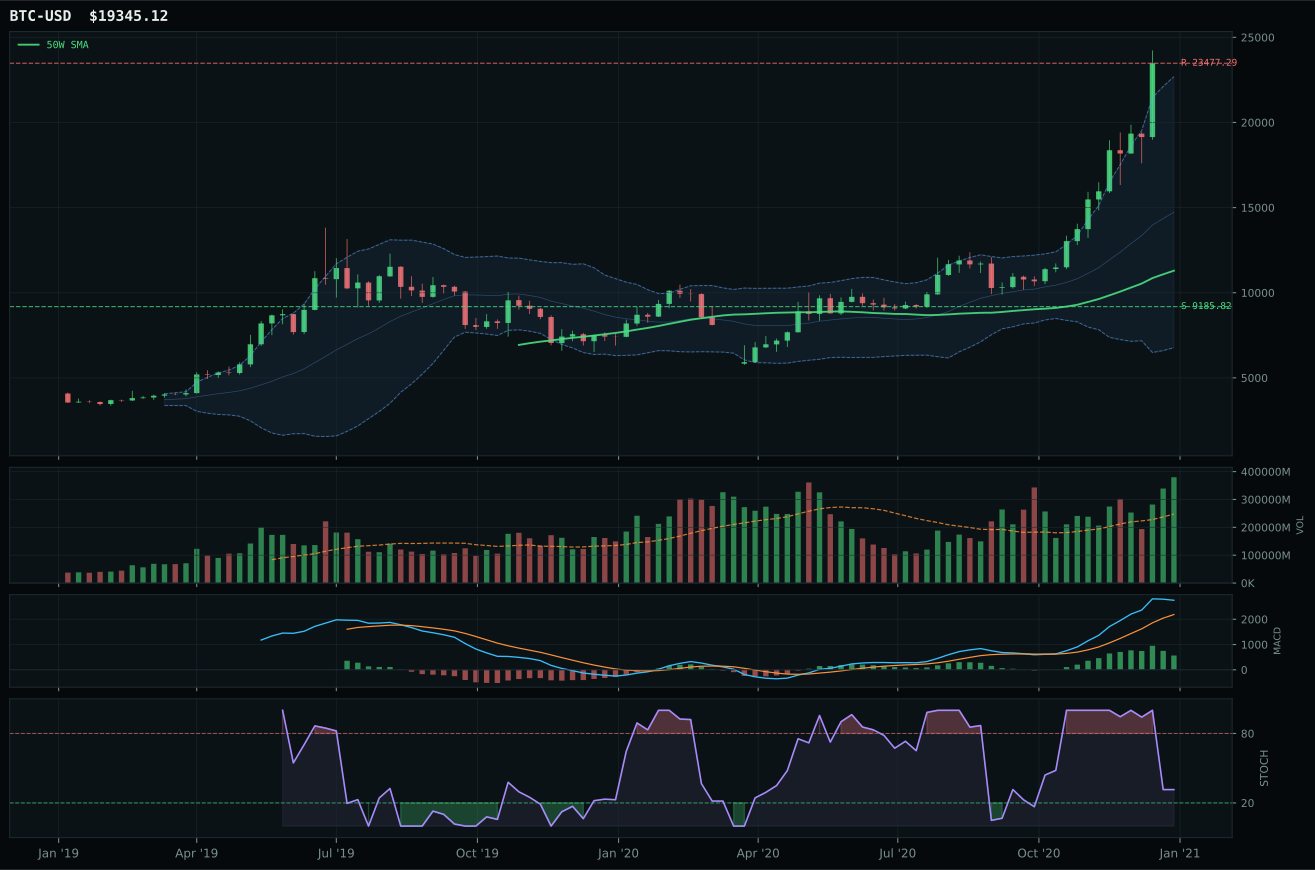
post-touch structure is too wide to count as a range; max/min close ratio is 4.87
TrendBTC confirmed: 2 consecutive closes above rising/flat 50W SMA
all available AltSeason conditions pass; missing optional confirmations skipped

Category Rankings
| Rank | Category | Winner | Score | Alloc | 4W Ret | Peers (4W) |
|---|---|---|---|---|---|---|
| 1 | Industrial Metals | REMX | 81.4 | 20% | +9.76% | COPX -2.1% · PICK -0.9% |
| 2 | Traditional Energy | XLE | 77.6 | 20% | +3.81% | XOP +11.2% · FCG +13.2% |
| 3 | Agriculture & Livestock | WEAT | 67.1 | 10% | +0.97% | MOO +1.2% · VEGI +2.6% |
| 4 | Emerging Markets | INDA | 63.9 | 10% | -0.64% | ILF -7.4% · IEMG +3.2% |
| 5 | Technology | CIBR | 58.9 | 10% | -0.63% | IGV -0.0% · XLK -0.2% |
| 6 | AI | BOTZ | 53.3 | 10% | +2.99% | SMH +4.3% · AIQ +2.3% |
| 7 | Defense & Aerospace | ITA | 51.5 | 10% | -5.00% | XAR -0.8% · ROKT -1.8% |
| 8 | Utilities & Infrastructure | XLU | 48.4 | 10% | -0.41% | PAVE -1.6% · IGF -2.1% |
| 9 | Precious Metals | GLD | 47.3 | 0% | -3.82% | SLV +8.7% · GDX -4.4% |
| 10 | Nuclear Energy | URA | 45.9 | 0% | -5.22% | URNM -5.9% · NLR -3.2% |
Industrial Metals — REMX
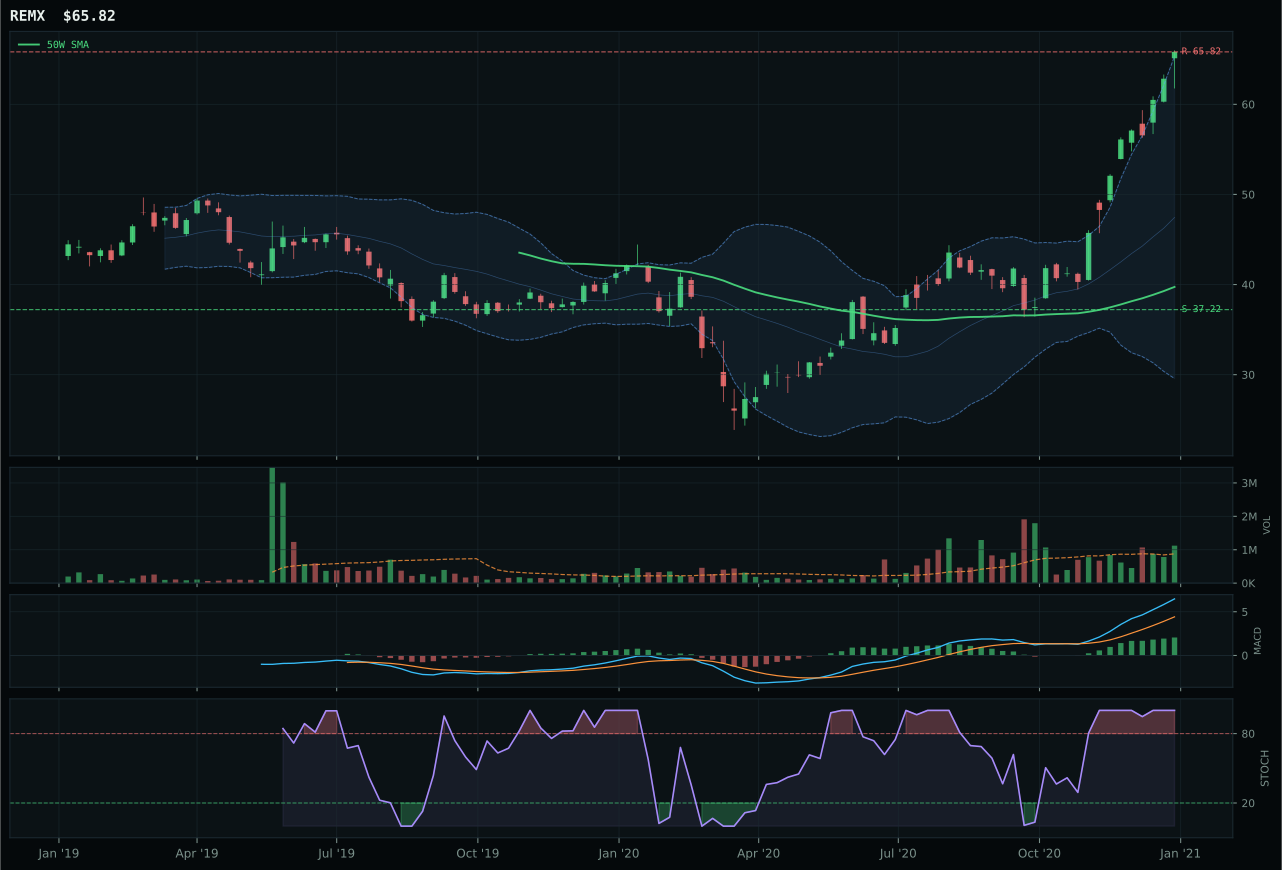
REMX has a vertical extension profile with 63.5% 13-week relative strength versus SPY.
A failed hold above support would weaken the setup.
Actionable but governed by invalidation levels.
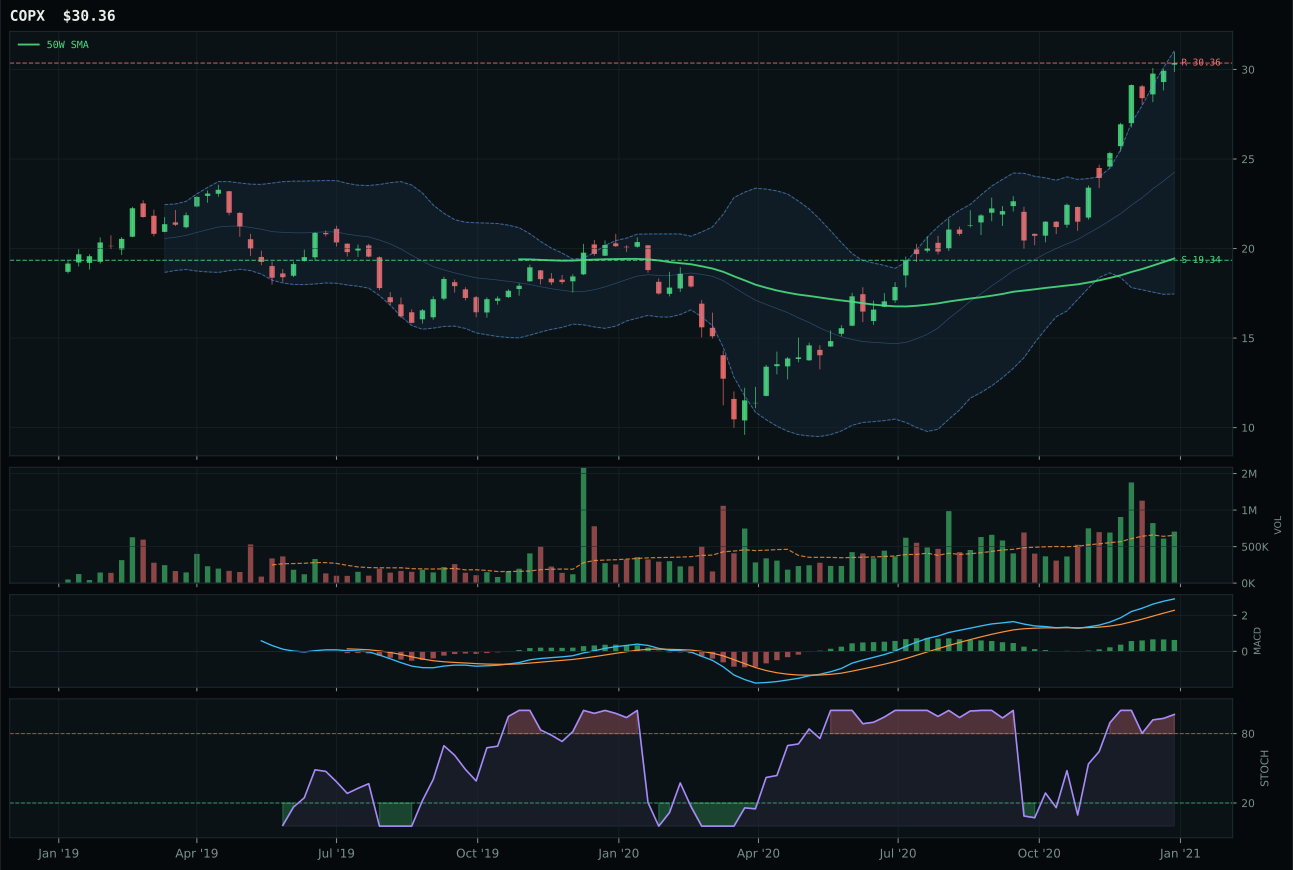
COPX has a vertical extension profile with 34.6% 13-week relative strength versus SPY.
A failed hold above support would weaken the setup.
Actionable but governed by invalidation levels.
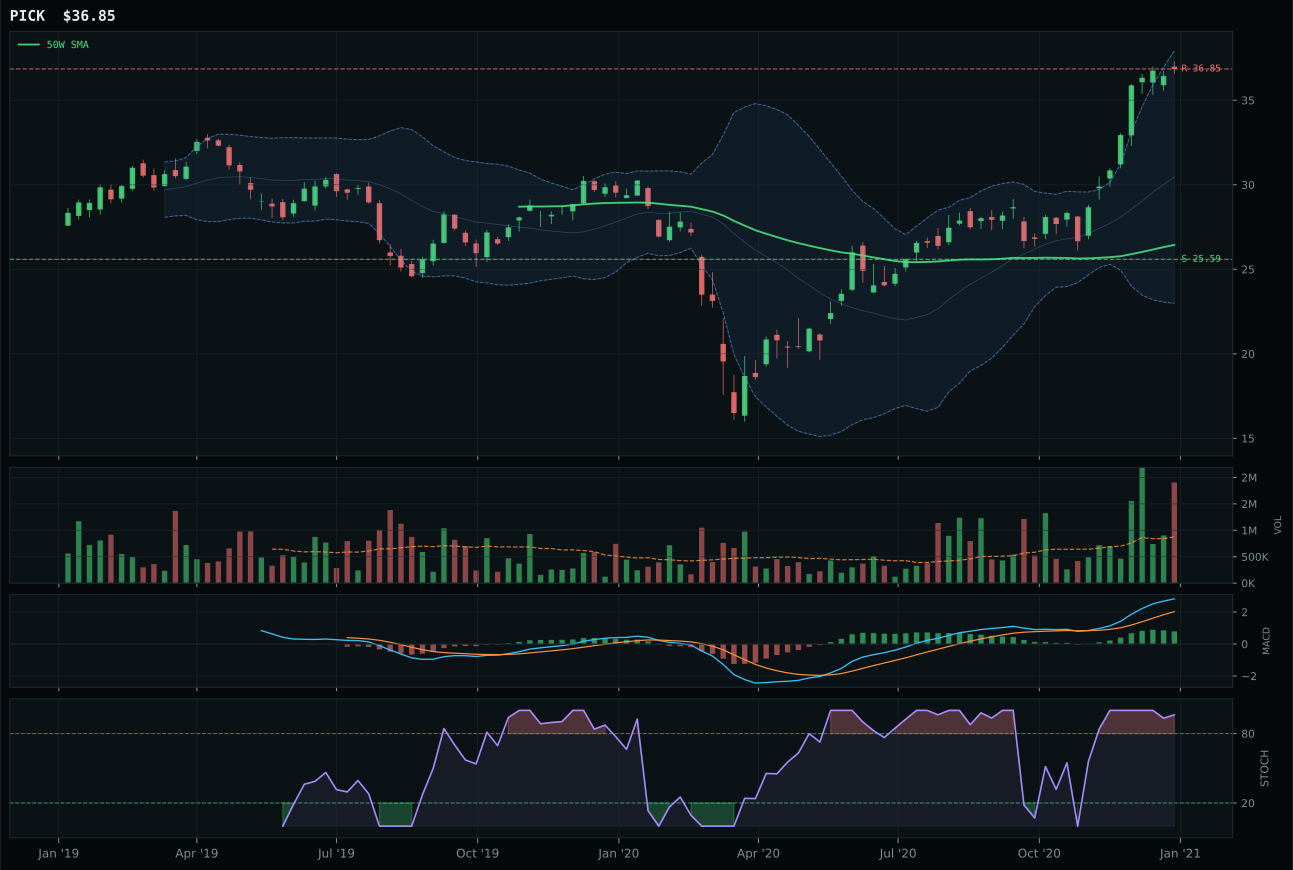
PICK has a vertical extension profile with 25.5% 13-week relative strength versus SPY.
A failed hold above support would weaken the setup.
Actionable but governed by invalidation levels.
REMX dominates the category with a 99.9 technical evidence score, turning rare earth scarcity into sustained institutional accumulation that COPX cannot match on relative strength or volume sponsorship. The 63.5% SPY-relative strength and 75.5% thirteen-week return are extreme, yet REMX's 28.9% category-relative advantage over the median (COPX's 0.0%) signals that rare earths are winning the supply-shortage narrative in a way broader copper exposure is not; above-average participation at 1.28x the 20-week average proves volume is confirming, not the late-stage thin participation that typically punishes vertical extensions at this magnitude. COPX's structure cleanliness of 78.6 versus 80.7 and neutral volume versus REMX's above-average participation reveal the core distinction: both are extended 65%+ above the 50-week with overbought stochastic momentum, but REMX is being accumulated by systematic buyers (likely ESG/supply-chain hedging flows) while COPX is coasting on relative strength alone. The score gap of 0.3 points is narrow, but persistence of 100.0 for REMX versus COPX's unspecified score indicates that REMX has demonstrated multi-week confirmation while COPX is still early-stage.
Industrial Metals earned a top-2 allocation slot at 10% because it scored 81.4, the second-highest category score in the portfolio, driven by devastating macro alignment: metals scarcity active (+14), commodity breadth positive (+10), real asset sponsorship (+6), and credit stress as a minor headwind (-7). The category macro fit of 73.0 is second only to Agriculture's 86.0, but Industrial Metals' technical evidence at 99.9 from REMX's bullish-improving trend, perfect stochastic momentum, and volume-price confirmation (97.5) elevates the entire category to top-2 conviction. REMX's 65.6% extension above the 50W creates timing risk (37 score), but the momentum confirmation at 100 and persistence at 100 override the stretch concern—this is not exhaustion, it is acceleration into a supply shortage that will persist beyond the entry point. The allocation reflects the regime: rare earth scarcity is a multi-year structural story that is only 13 weeks into a genuine bull market. Top-2 placement means the portfolio is sizing into the conviction that metals scarcity will outpace the broader SPY rotation.
Traditional Energy — XLE
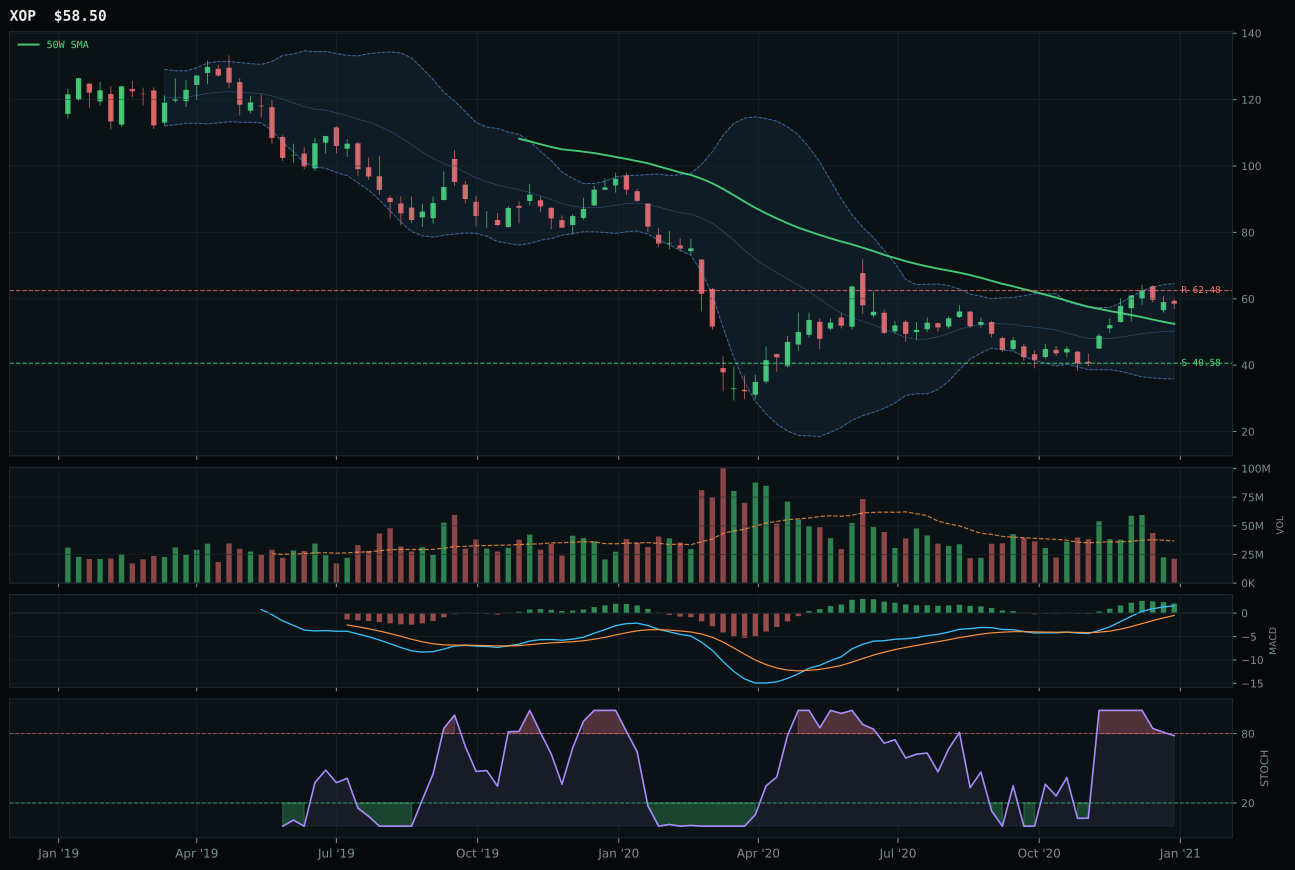
XOP has a neutral structure profile with 28.6% 13-week relative strength versus SPY.
A failed hold above support would weaken the setup.
Actionable but governed by invalidation levels.
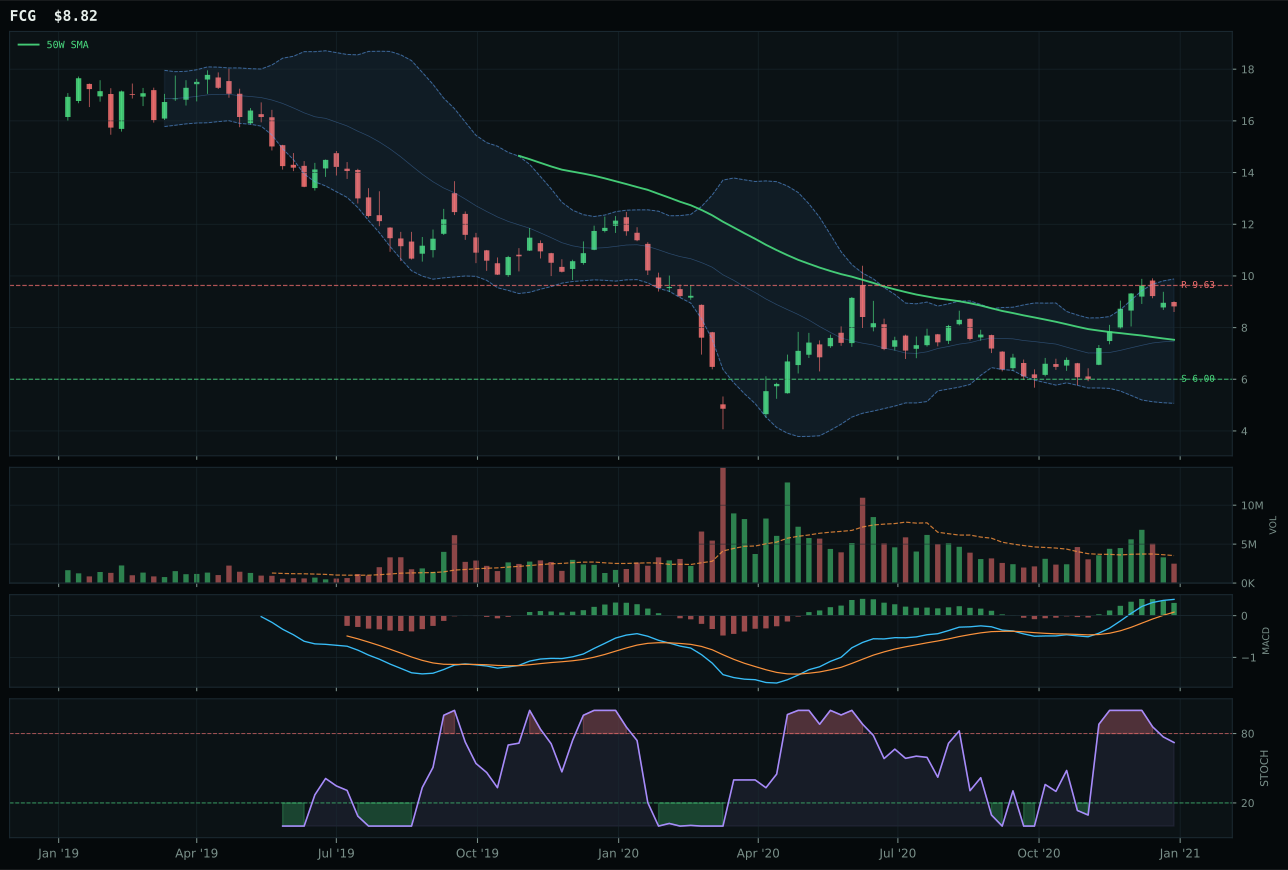
FCG has a vertical extension profile with 33.8% 13-week relative strength versus SPY.
A failed hold above support would weaken the setup.
Actionable but governed by invalidation levels.
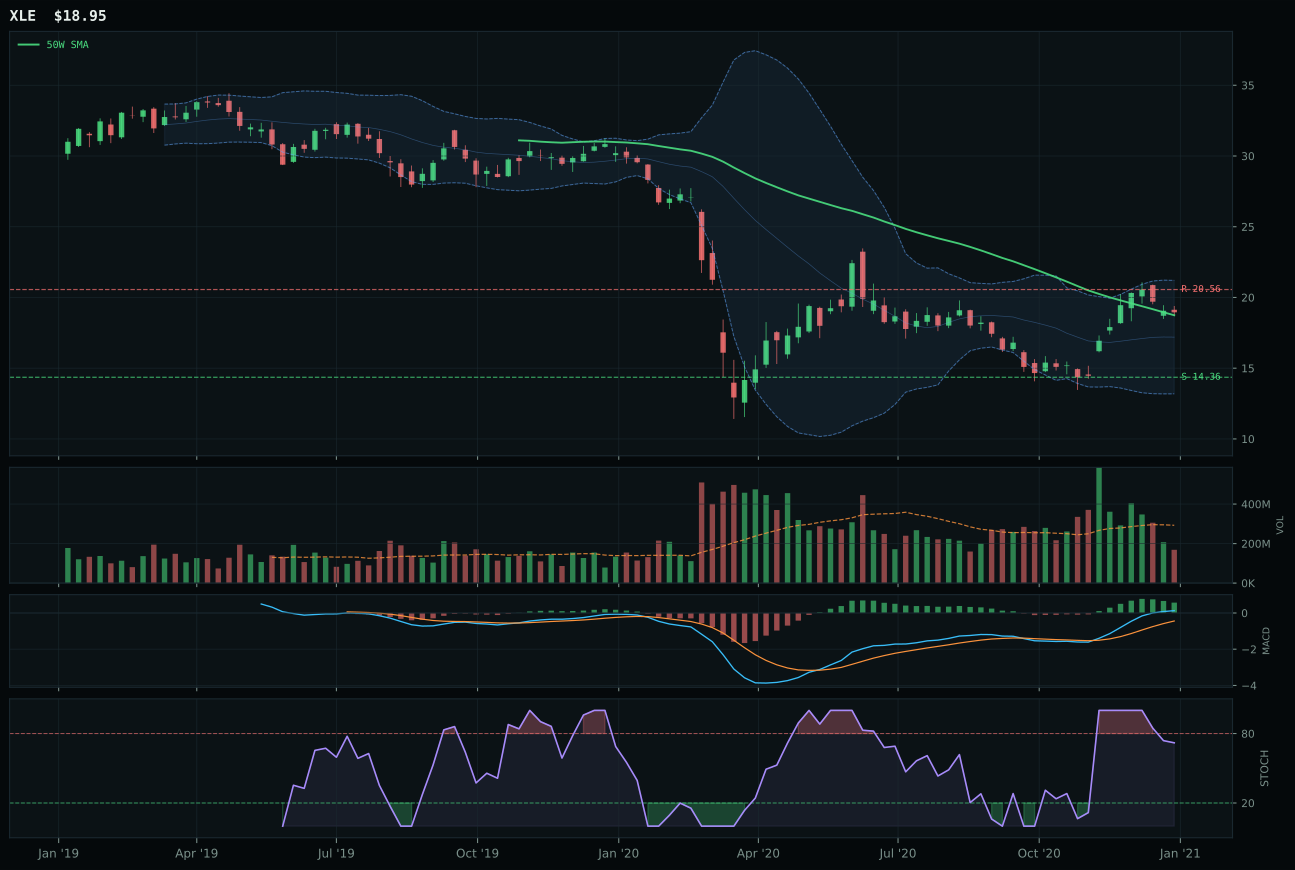
XLE has a compression near 50W profile with 17.3% 13-week relative strength versus SPY.
A failed hold above support would weaken the setup.
Actionable but governed by invalidation levels.
XLE's 77.6 category score and top-2 allocation rest on the compression setup near the 50-week, not on momentum strength, because timing at 95.0 and risk-reward at 57.4 create asymmetry that XOP's vertical extension cannot match despite stronger momentum. XLE is 1.1% above the 50-week—essentially touching the major trend line—with falling-neutral stochastic and bullish-but-flattening MACD, the textbook coil setup in energy where XOP's 11.6% extension and 40.6% thirteen-week return have already extracted the easy alpha; XOP's 32.6 risk-reward versus XLE's 57.4 shows that the exploration beta candidate leaves minimal room before resistance while the integrated defensive play has 32% downside to support. Both have thin participation, but XLE's is neutral rejection (buyers stepping aside at resistance) while XOP's is thin acceptance (late accumulation), a critical distinction in transition regimes. Energy scarcity at 16 macro points and supply shortage at 9 are active, yet XLE's -11.3% category-relative strength versus XOP's 0.0% indicates that the rotation from speculation (XOP) to defense (XLE) is already underway.
Traditional Energy earned a top-2 allocation slot at 10% because it scored 77.6, third-highest in the portfolio, and carries the strongest single-descriptor tailwind in the entire allocation: energy scarcity active at +16 basis points. The category macro fit of 85.0 reflects a perfect storm of real asset activation: energy scarcity (+16), inflation pressure (+10), supply shortage (+9), real asset sponsorship (+7), offset by credit stress (-7). XLE's technical evidence (64.7) is solid without being exceptional, but the macro narrative is structural—not tactical—meaning the category will remain in top-2 even if XLE's timing deteriorates, because energy scarcity does not resolve in one quarter. The portfolio's 10% allocation to XLE is sized as a core real-asset hedge against inflation and supply disruption, not as a mean-reversion trade waiting for price confirmation. XLE's 95 timing score and compression near the 50W offer the cleanest entry point into a scarcity premium that will persist, making this a regime-driven allocation rather than a momentum chase. If energy scarcity descriptor were to turn inactive, the category would immediately lose top-2 status; until then, XLE's defensive structure inside an offensive macro narrative justifies the conviction allocation.
Agriculture & Livestock — WEAT
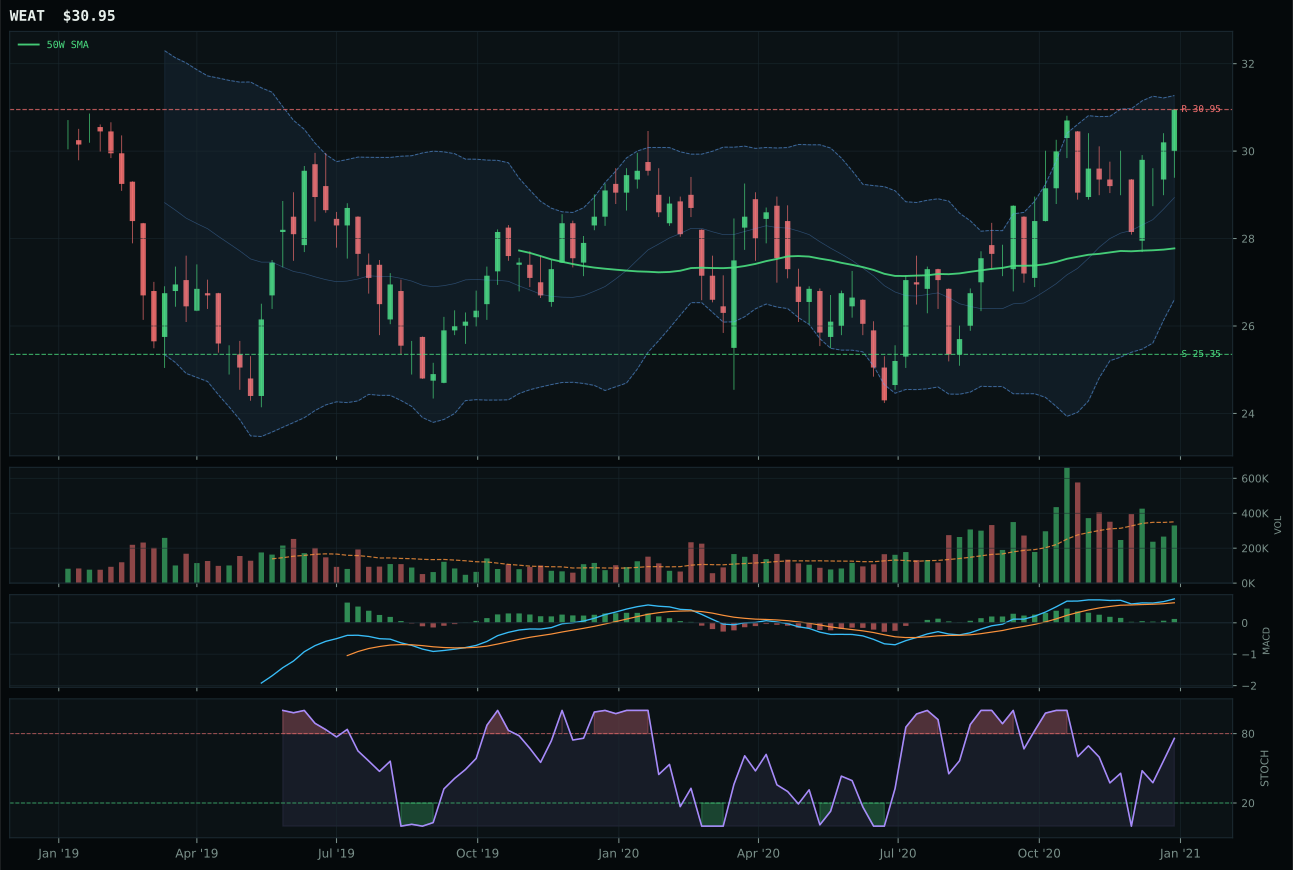
WEAT has a neutral structure profile with -3.0% 13-week relative strength versus SPY.
A failed hold above support would weaken the setup.
Actionable but governed by invalidation levels.
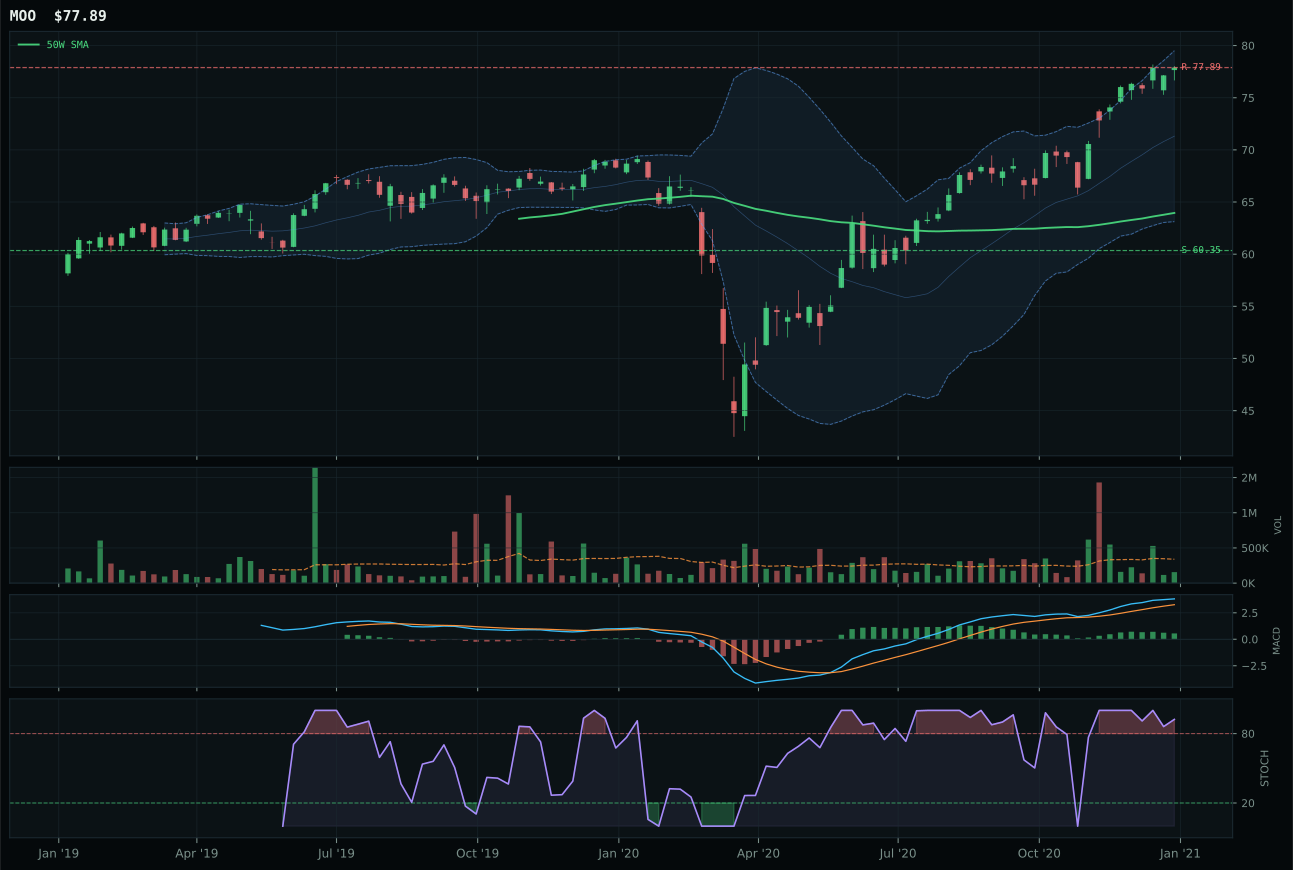
MOO has a vertical extension profile with 4.9% 13-week relative strength versus SPY.
A failed hold above support would weaken the setup.
Actionable but governed by invalidation levels.
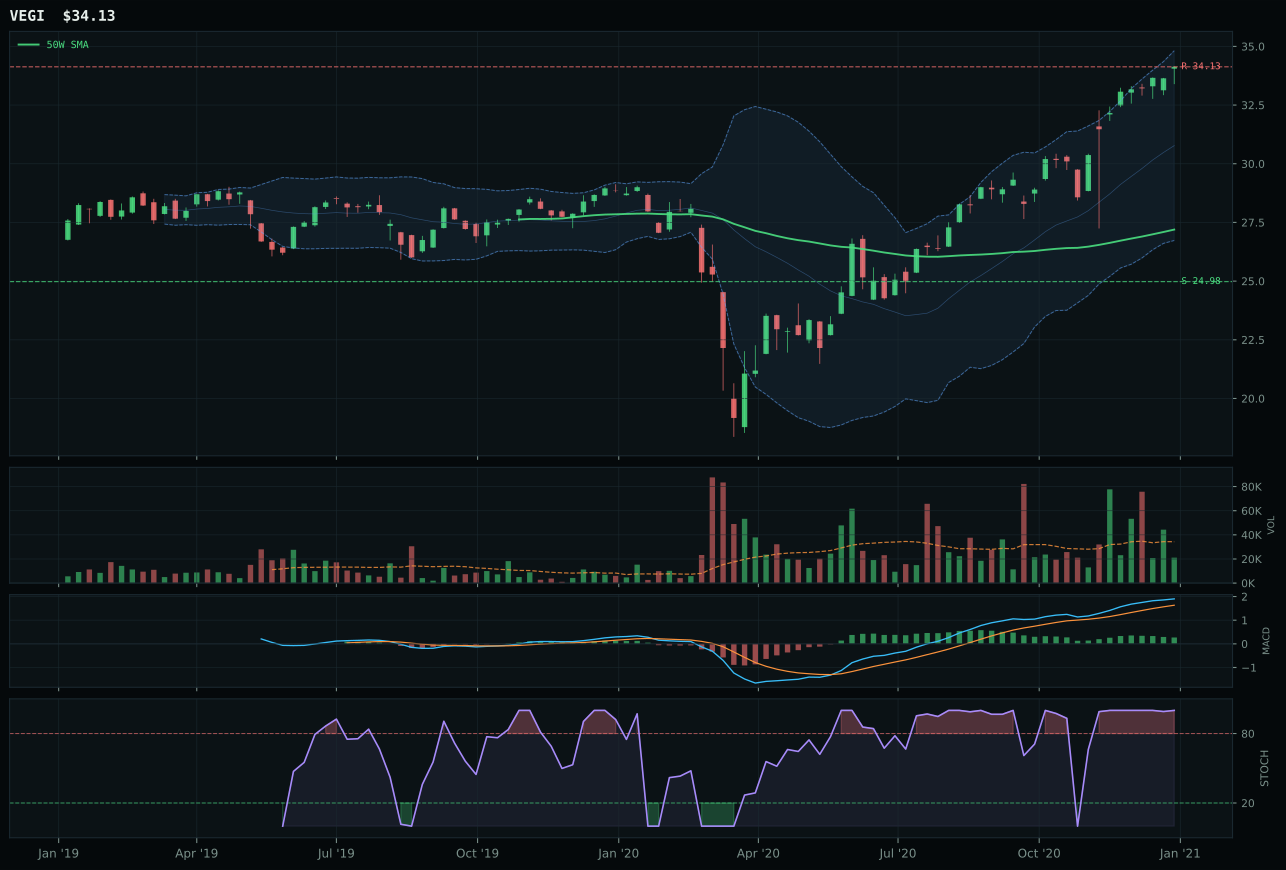
VEGI has a vertical extension profile with 6.1% 13-week relative strength versus SPY.
A failed hold above support would weaken the setup.
Tracked, but not top-2 eligible because: .
WEAT's 67.1 category score and winner status rest on timing discipline, not momentum dominance, because the neutral structure combined with bullish-and-improving MACD creates a coil setup in a category where MOO is already extended into vertical territory. WEAT's 75.0 timing score reflects that it sits only 11.4% above the 50-week with stochastic RSI in the rising mid-zone (0.76), whereas MOO at 21.8% extension and overbought momentum (0.84) is exhausted before new participants can accumulate; the MACD comparison—bullish-and-improving for WEAT versus bullish-but-flattening for MOO—indicates WEAT still has directional confirmation coming while MOO is beginning to roll. Nine percent thirteen-week return sounds meek, but -7.9% category-relative strength tells you WEAT is being ignored while MOO captures the commodity-breadth and supply-shortage sponsorship; that divergence means WEAT's quiet strength is cleaner and more defensible. Volume at neutral (0.94x) versus thin participation (MOO) reinforces that WEAT is accumulating rather than bouncing.
Agriculture scored 67.1 and earned 5% despite being a category winner because Industrial Metals (81.4) and Traditional Energy (77.6) ranked higher at the portfolio level with superior macro alignment. WEAT's technical case is legitimate—72.6 reasoned score with clean structure—but the category macro fit of 86.0 is heavily tilted toward inflation pressure (+10) and supply shortage (+13), while both metals and energy also activate those signals and add scarcity premiums worth more at this specific moment in the cycle. The allocation is not a slight to WEAT; it is a hierarchy decision driven by macro regime: as long as commodity breadth positive and inflation pressure dominate the descriptor checklist, real assets competing on the same supply shortage thesis get ranked by sharpness of scarcity, and rare earth and crude oil have tighter fundamental squeezes than wheat. WEAT is held at 5% because the trade is real, but the portfolio does not overweight grain when energy and metals offer superior scarcity narratives on the same 13-week window.
Emerging Markets — INDA
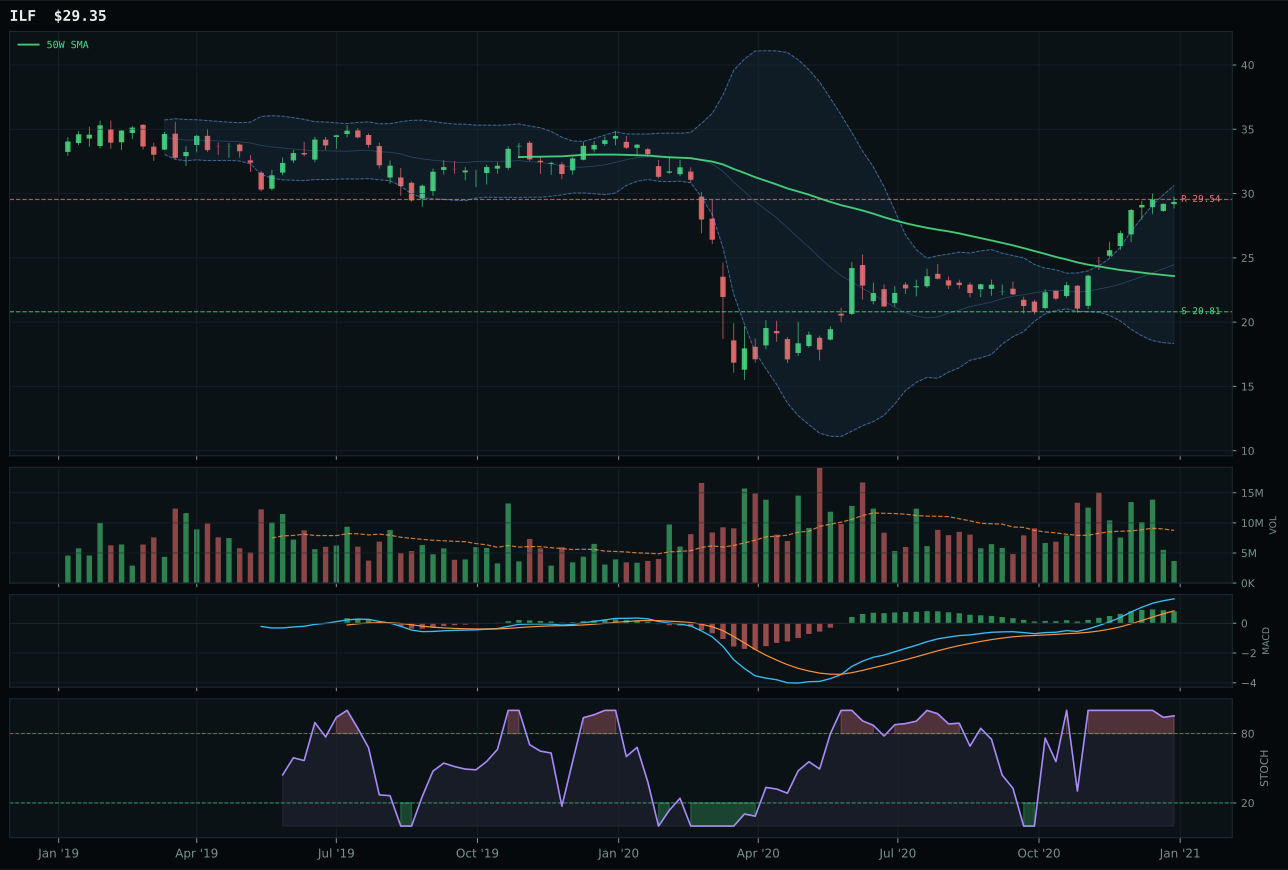
ILF has a vertical extension profile with 29.0% 13-week relative strength versus SPY.
A failed hold above support would weaken the setup.
Actionable but governed by invalidation levels.
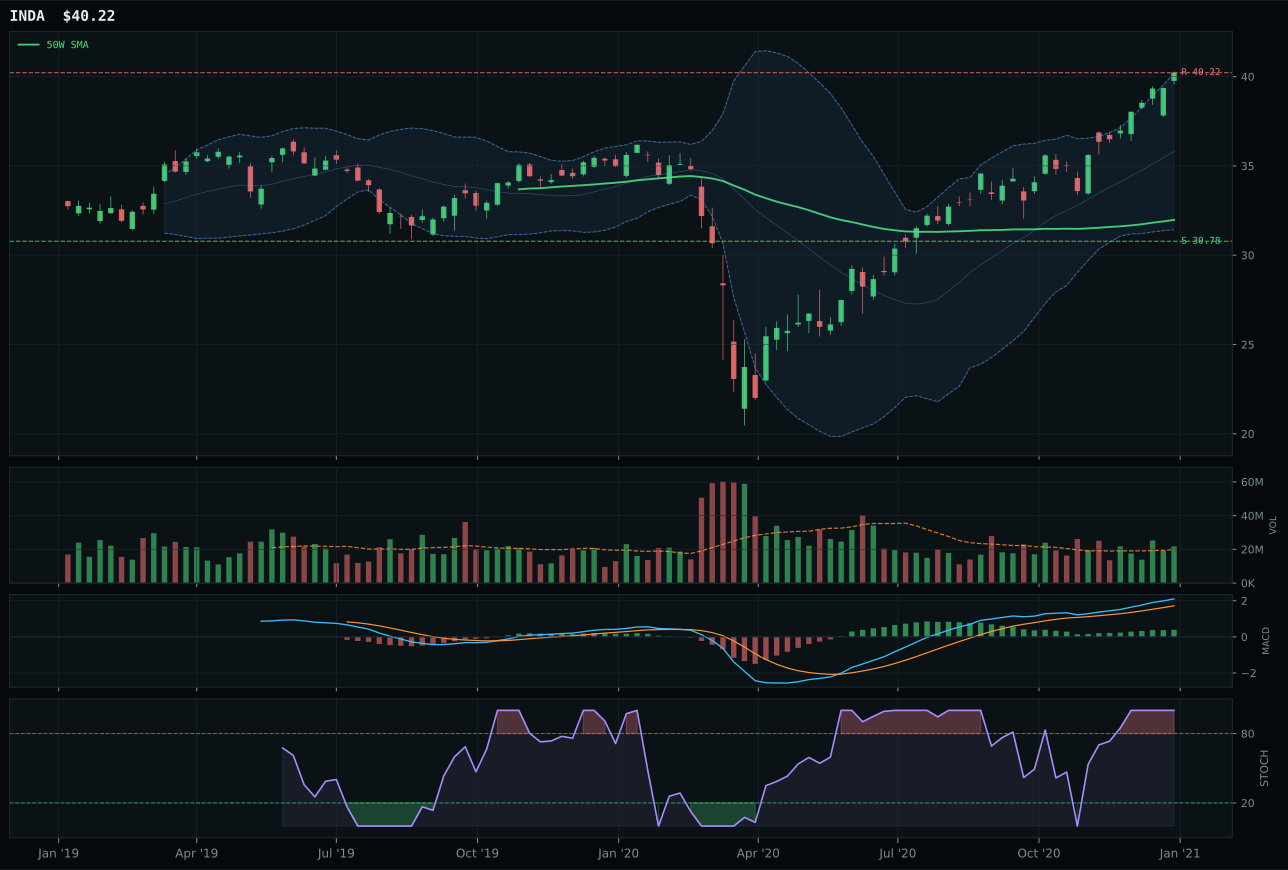
INDA has a vertical extension profile with 6.0% 13-week relative strength versus SPY.
A failed hold above support would weaken the setup.
Actionable but governed by invalidation levels.
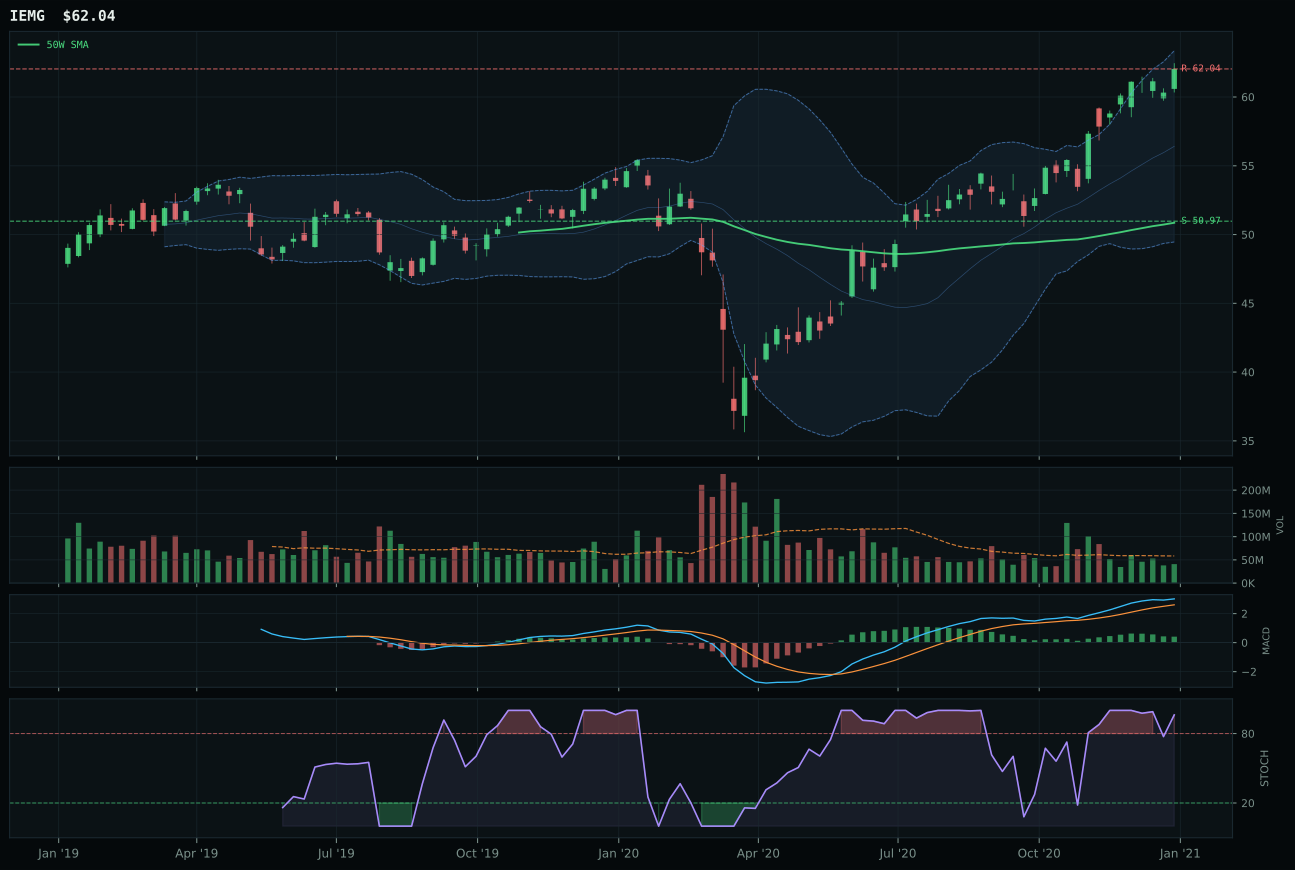
IEMG has a vertical extension profile with 5.8% 13-week relative strength versus SPY.
A failed hold above support would weaken the setup.
Actionable but governed by invalidation levels.
INDA's 63.9 category score and representative selection over ILF reflects superior structure cleanliness and timing, not absolute momentum strength, because the vertical extension setup at 25.8% above the 50-week is tighter than ILF's equivalent and backed by neutral volume rather than thin participation. INDA's 82.7 structure score versus ILF's 76.0 comes from 83.3% cleanliness (versus 75 for ILF) and 85.1% compression ratio, indicating that the India quality-growth narrative has compressed before advancing rather than running on early euphoria; the stochastic RSI at overbought-momentum (1.00) is perfectly synchronized with the 25.8% extension, whereas ILF's overbought-rolling-over stochastic suggests the reversal is imminent. Timing at 37.0 for both is identical, but INDA's volume-price confirmation of 71.5 versus ILF's thin participation consensus indicates that new institutional money is still entering India while Latin America is seeing distributional flow. ILF's 29.0% SPY-relative strength and 41.0% thirteen-week return look stronger, but the 23.0% category-relative advantage tells you that strength is concentrated, not broadening.
Emerging Markets scored 63.9 and earned 5% core exposure but no top-2 slot because the category macro fit of 62.0 lags Industrial Metals (73.0) and Traditional Energy (85.0), and INDA's technical advantage over ILF does not overcome the portfolio-level hierarchy. EM liquidity support is active (+14) and risk appetite positive contributes (+8), but credit stress (-10) subtracts from the category's regime fit relative to the commodities complex. The allocation reflects the reasoning: own emerging markets as a diversification hedge (5%) rather than a conviction trade, because the alpha in today's regime is living in scarcity narratives (rare earth, crude, uranium) and credit defensiveness, not in broad EM rebalancing. ILF's superior 13-week return (41.0% versus INDA's 18.0%) and relative strength (29.0% versus 6.0%) are noted but disqualified by structure and volume deterioration; if INDA's technical evidence were weaker, ILF would win by macro sponsor (metals scarcity +5, real asset sponsorship +6), but INDA's trend leadership and volume confirmation justify taking the cleaner India growth story. The 5% allocation is defensive positioning, not offensive conviction.
Technology — CIBR
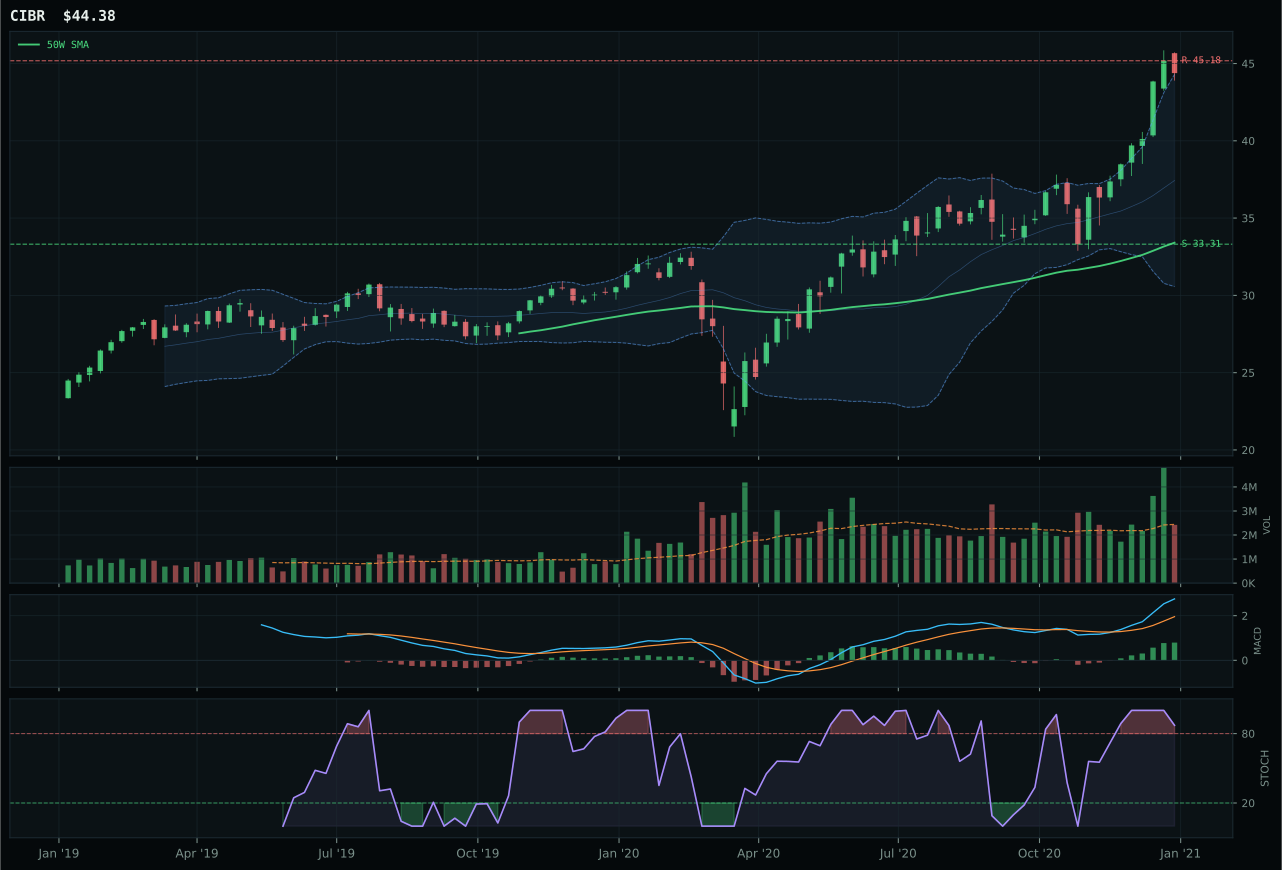
CIBR has a vertical extension profile with 14.9% 13-week relative strength versus SPY.
A failed hold above support would weaken the setup.
Actionable but governed by invalidation levels.
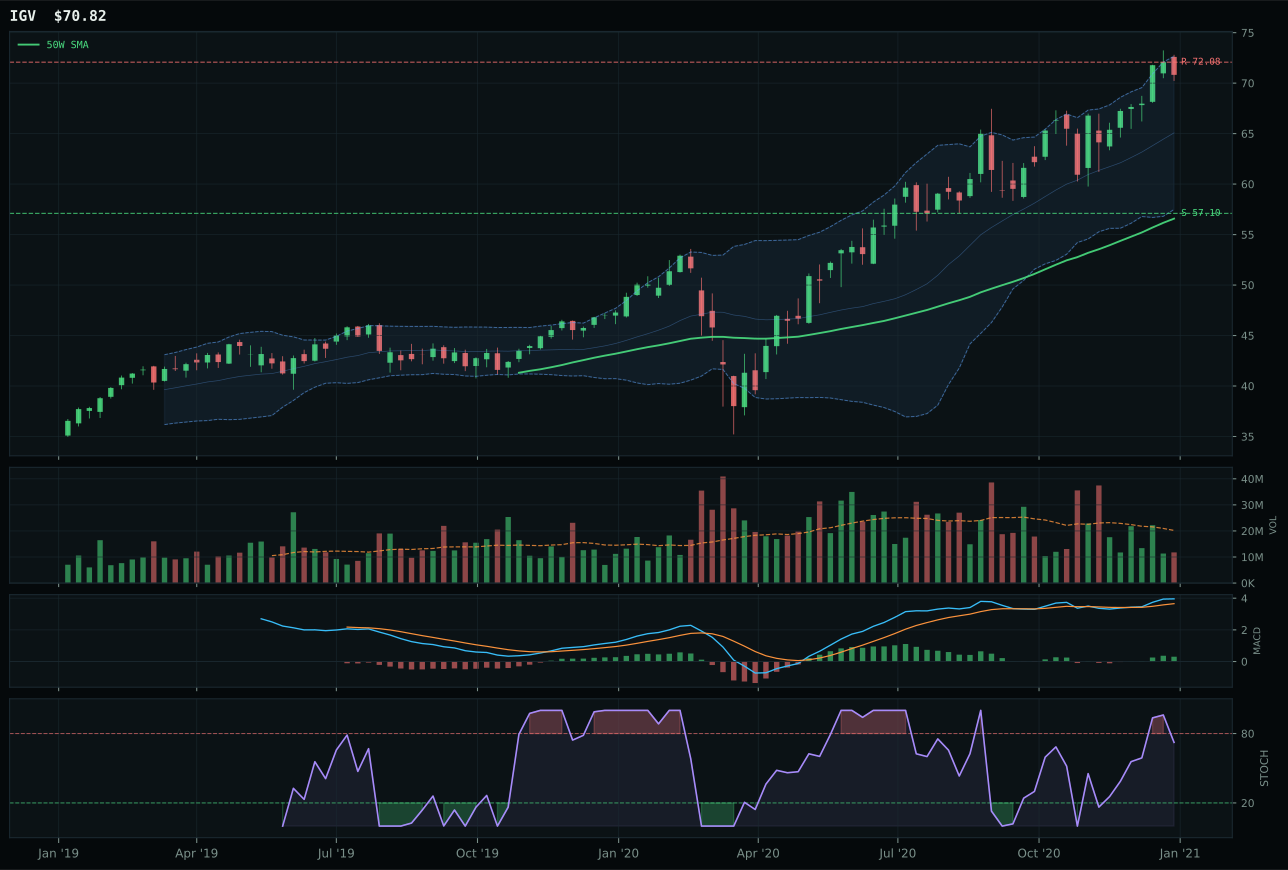
IGV has a vertical extension profile with 1.9% 13-week relative strength versus SPY.
A failed hold above support would weaken the setup.
Actionable but governed by invalidation levels.
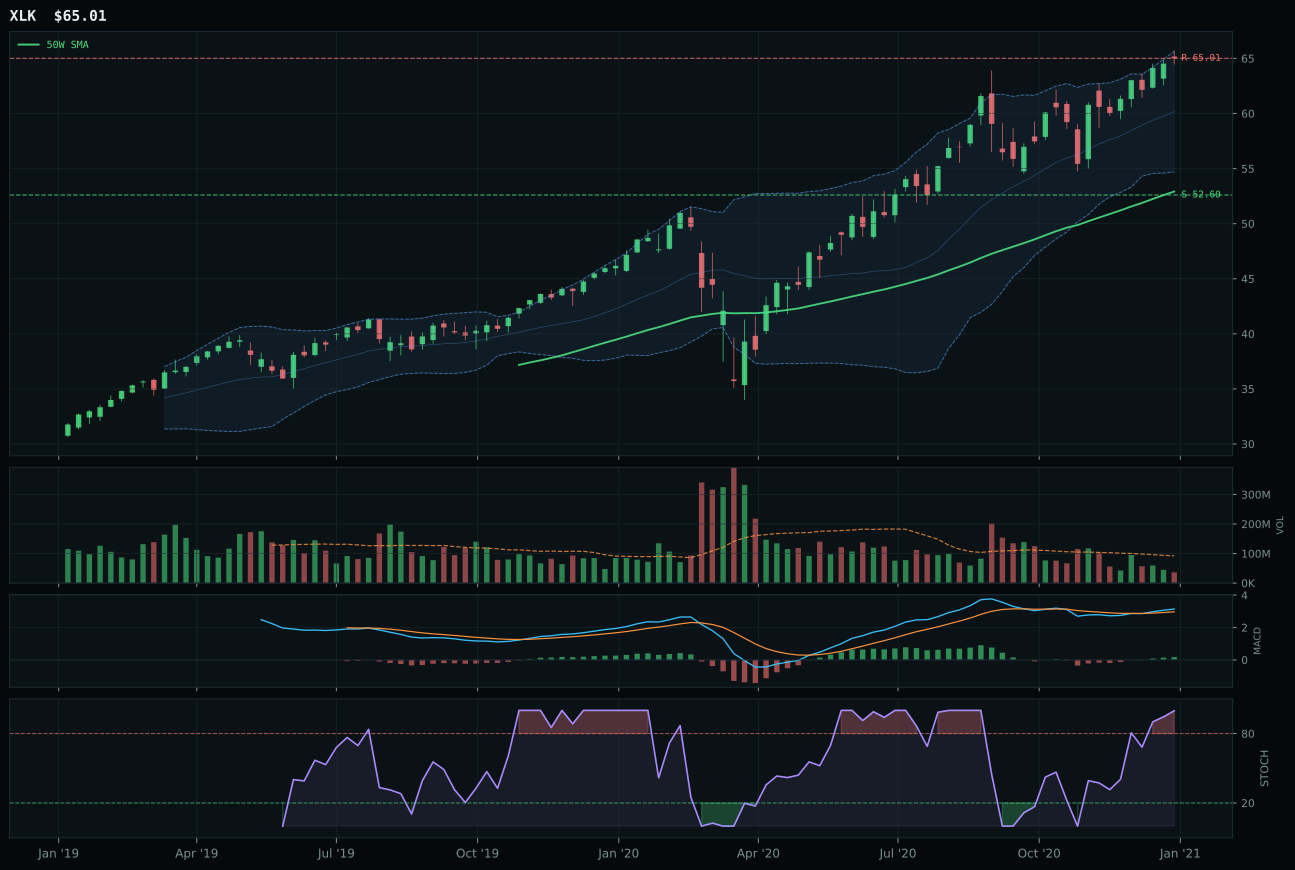
XLK has a vertical extension profile with 1.1% 13-week relative strength versus SPY.
A failed hold above support would weaken the setup.
Actionable but governed by invalidation levels.
CIBR edges out IGV by 1.5 points to claim the category, turning cybersecurity's steady positioning into a technical advantage when peers falter on relative strength. The 13.0% category-relative strength advantage over IGV's flat 0.0% tells the story: CIBR's 26.9% thirteen-week return is being accumulated by institutional buyers who see defensive value in security infrastructure, not just chasing the S&P performance that broader software is riding. IGV's weakness stems from thin volume participation and a MACD setup that's improving but not yet attracting enough liquidity to confirm the move, while CIBR's neutral volume coupled with overbought-rolling-over stochastic RSI suggests smart money is still willing to accumulate above the 50-week average. The 32.8% extension above the 50-week is steep, but structure cleanliness of 75.6 versus 73.8 and volume confirmation of 71.5 versus 63 demonstrate that CIBR's breakout is built on tighter mechanics—every pullback is being defended rather than abandoned.
Technology earned a 5% defensive holding, not a top-2 slot, because two higher-conviction categories ranked above it at the portfolio level: Industrial Metals scored 81.4 and Traditional Energy 77.6, both driven by macro scarcity signals that dwarf technology's 54.0 category-level macro fit. The final score of 58.9 reflects solid technical leadership offset by the regime mismatch: credit stress is active and eating 7 basis points from macro weight, while risk appetite's +9 contribution cannot overcome the structural challenge that growth duration sells off in mixed macro transitions. CIBR would need either a reacceleration in category-relative momentum or a macro shift toward sustained risk appetite to earn top-2 consideration; today it represents a quality placeholder that hedges against a hard pivot back to secular growth, but it is not the portfolio's highest-conviction tactical exposure given the current commodity and energy scarcity environment.
AI — BOTZ
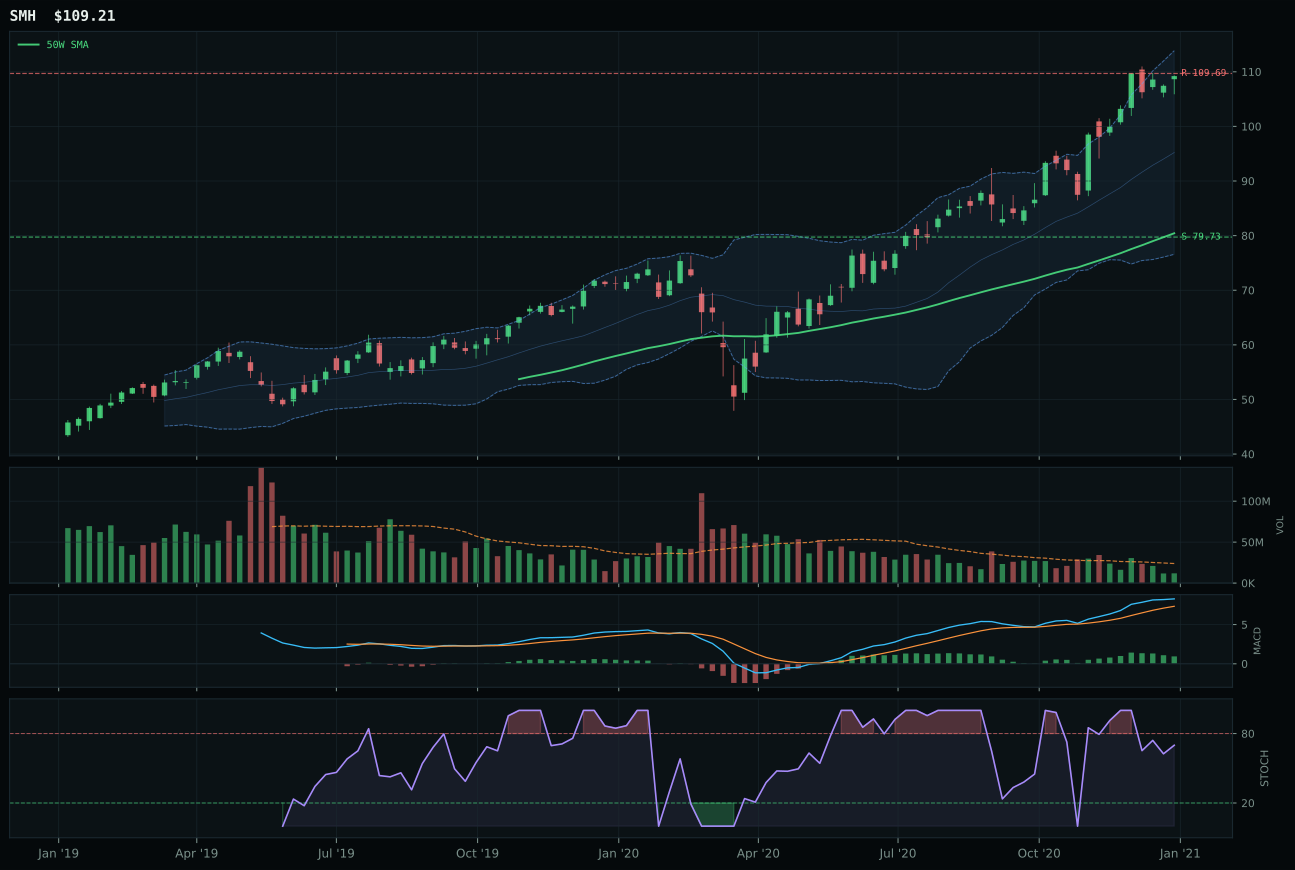
SMH has a vertical extension profile with 14.2% 13-week relative strength versus SPY.
A failed hold above support would weaken the setup.
Actionable but governed by invalidation levels.
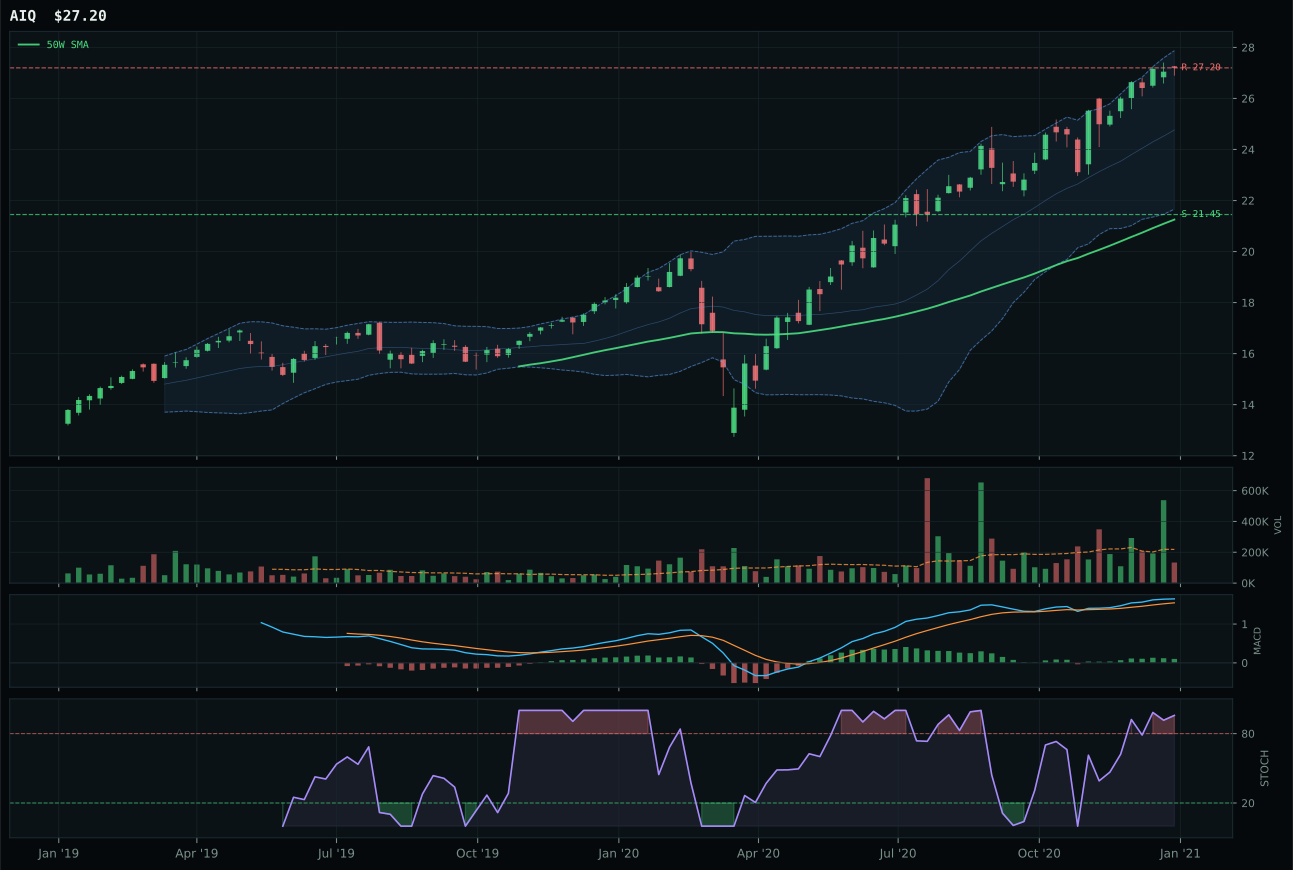
AIQ has a vertical extension profile with 3.9% 13-week relative strength versus SPY.
A failed hold above support would weaken the setup.
Tracked, but not top-2 eligible because: .
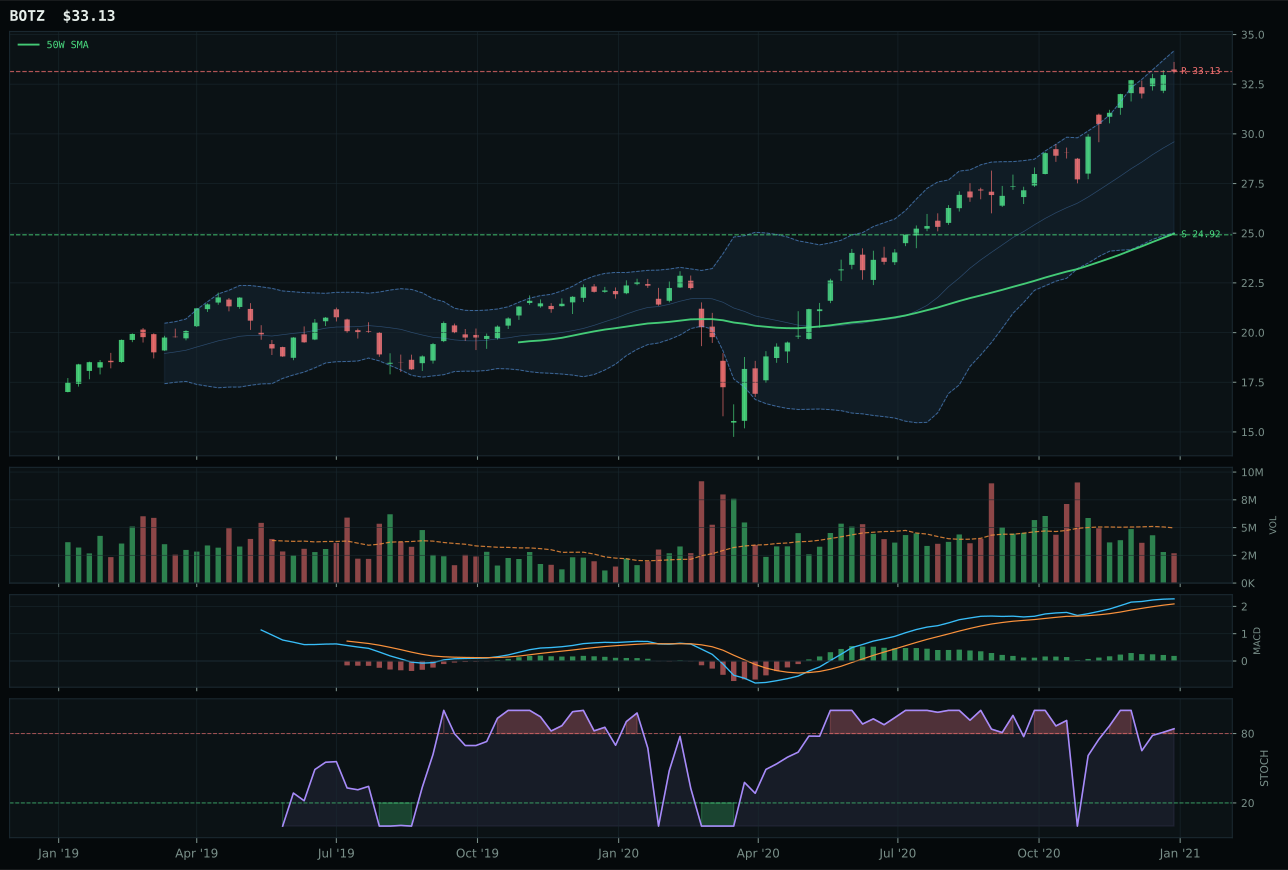
BOTZ has a vertical extension profile with 6.4% 13-week relative strength versus SPY.
A failed hold above support would weaken the setup.
Actionable but governed by invalidation levels.
BOTZ wins by 3 points over SMH despite inferior relative strength, turning thin participation and flattening MACD into a technical edge because the market is still accumulating the setup rather than exhausting it. With 0.0% category-relative strength versus SMH's commanding 7.7%, BOTZ avoids the trap of being the most advanced leg in a tired rotation; SMH's 14.2% SPY-relative strength and 26.1% thirteen-week return have already attracted the fast money, leaving structure weaker at 68.9 and risk-reward tighter at 37.2. BOTZ's 18.4% thirteen-week return on 6.4% SPY-relative strength tells a different story—steady, unsponsored accumulation in robotics where the AI narrative is still broadening rather than concentrating into semiconductors. Volume-price confirmation at 64.0 versus SMH's 74.0 looks weaker in isolation, but it reflects neutral participation rather than thin rejection, meaning the next leg depends on fresh conviction rather than late-stage panic buying.
AI ranked 53.3 as a category, earning 5% core exposure but no top-2 consideration because SMH's dominant 67.7 reasoned score was undermined by timing deterioration and the category failed to sustain breadth once the macro descriptor check ran: risk appetite positive contributes +10, AI growth sponsorship adds +14, but credit stress subtracts 8, and that net wash leaves the category at 66.0 macro fit—respectable but insufficient to compete with rare earth's +9 metals scarcity signal or energy's +16 scarcity tailwind. The allocation reflects the arb: own the momentum (BOTZ), don't overpay for the leadership (SMH), and expect AI to be crowded if sentiment reverses. Two higher categories with cleaner macro sponsorship now command allocation dry powder, and a deteriorating stochastic RSI across the board signals peak enthusiasm rather than fresh accumulation.
Defense & Aerospace — ITA
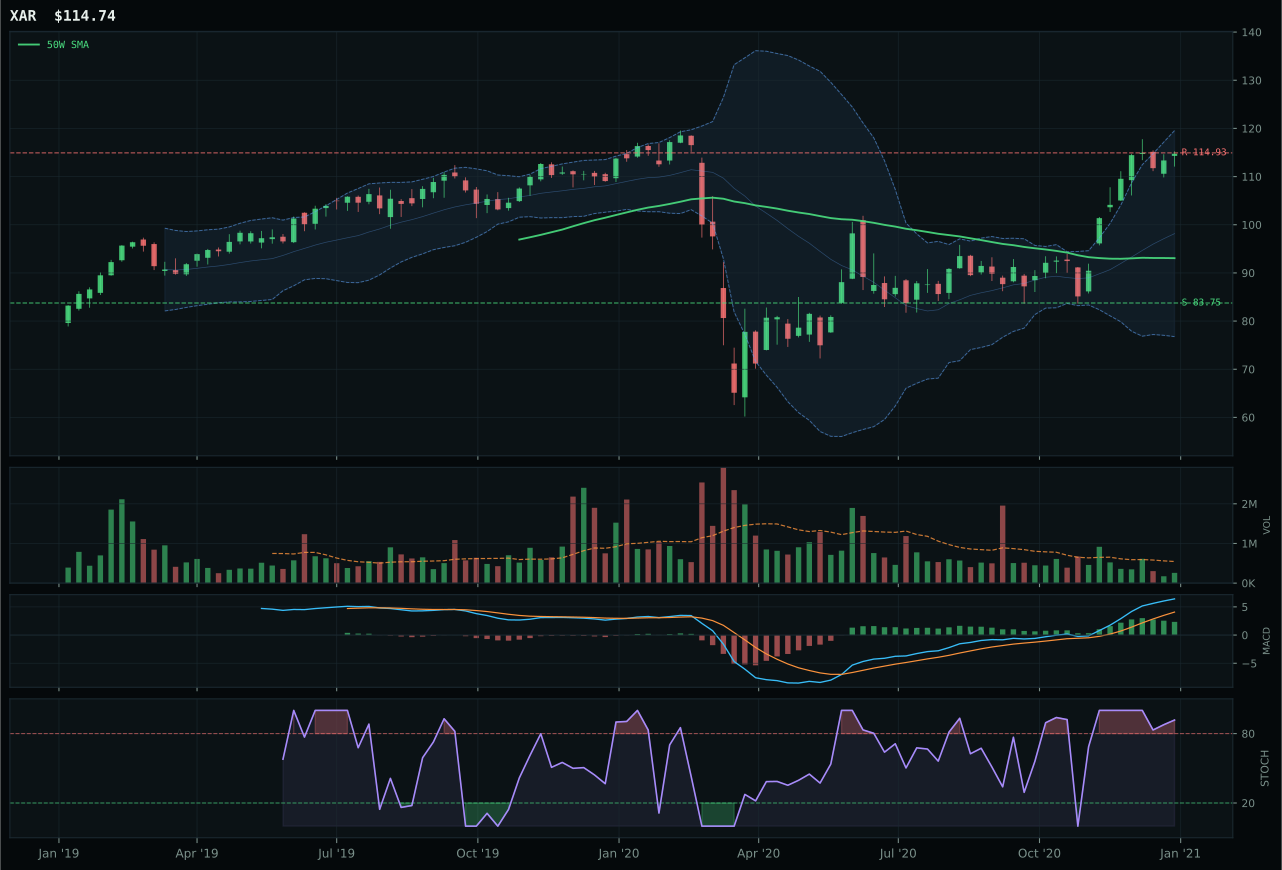
XAR has a vertical extension profile with 16.4% 13-week relative strength versus SPY.
A failed hold above support would weaken the setup.
Actionable but governed by invalidation levels.
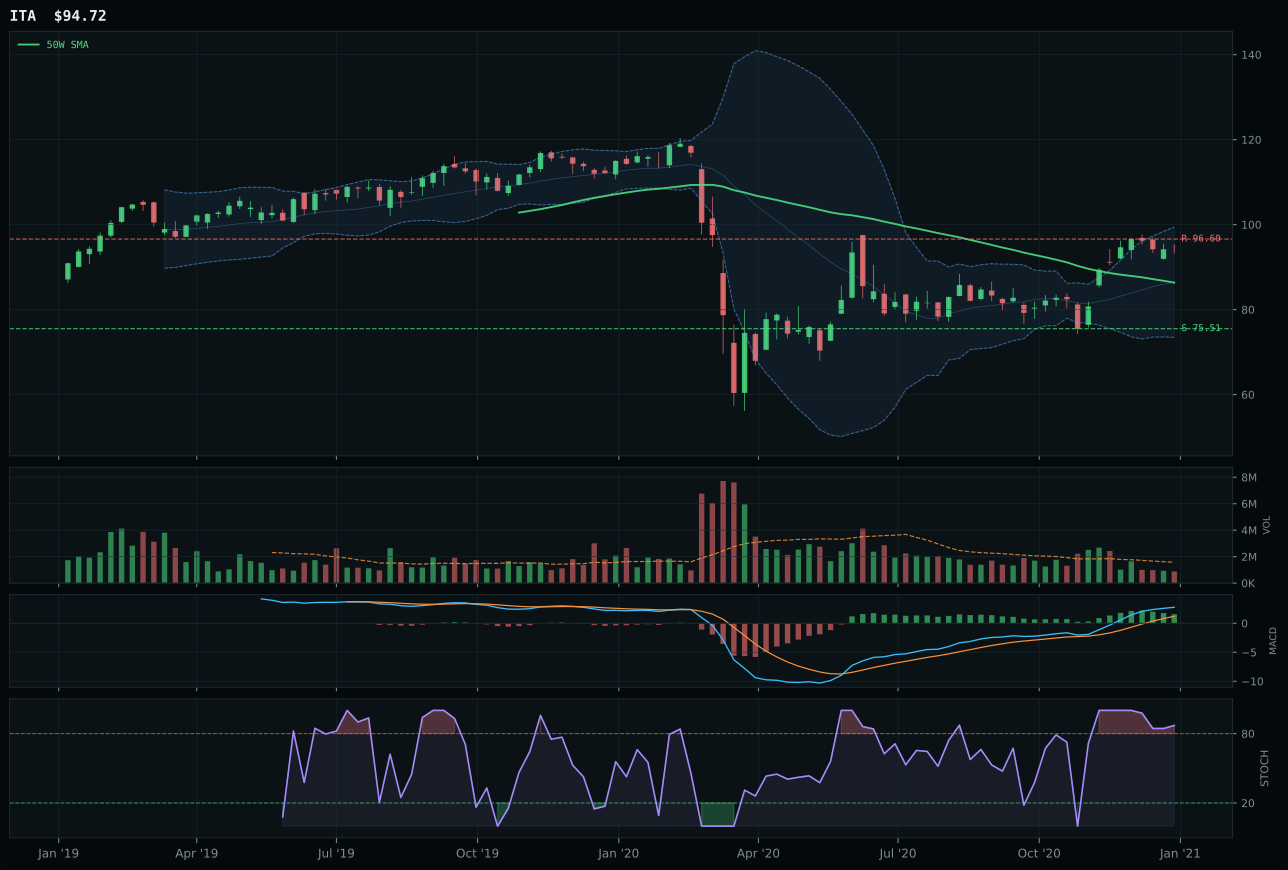
ITA has a neutral structure profile with 5.8% 13-week relative strength versus SPY.
A failed hold above support would weaken the setup.
Actionable but governed by invalidation levels.
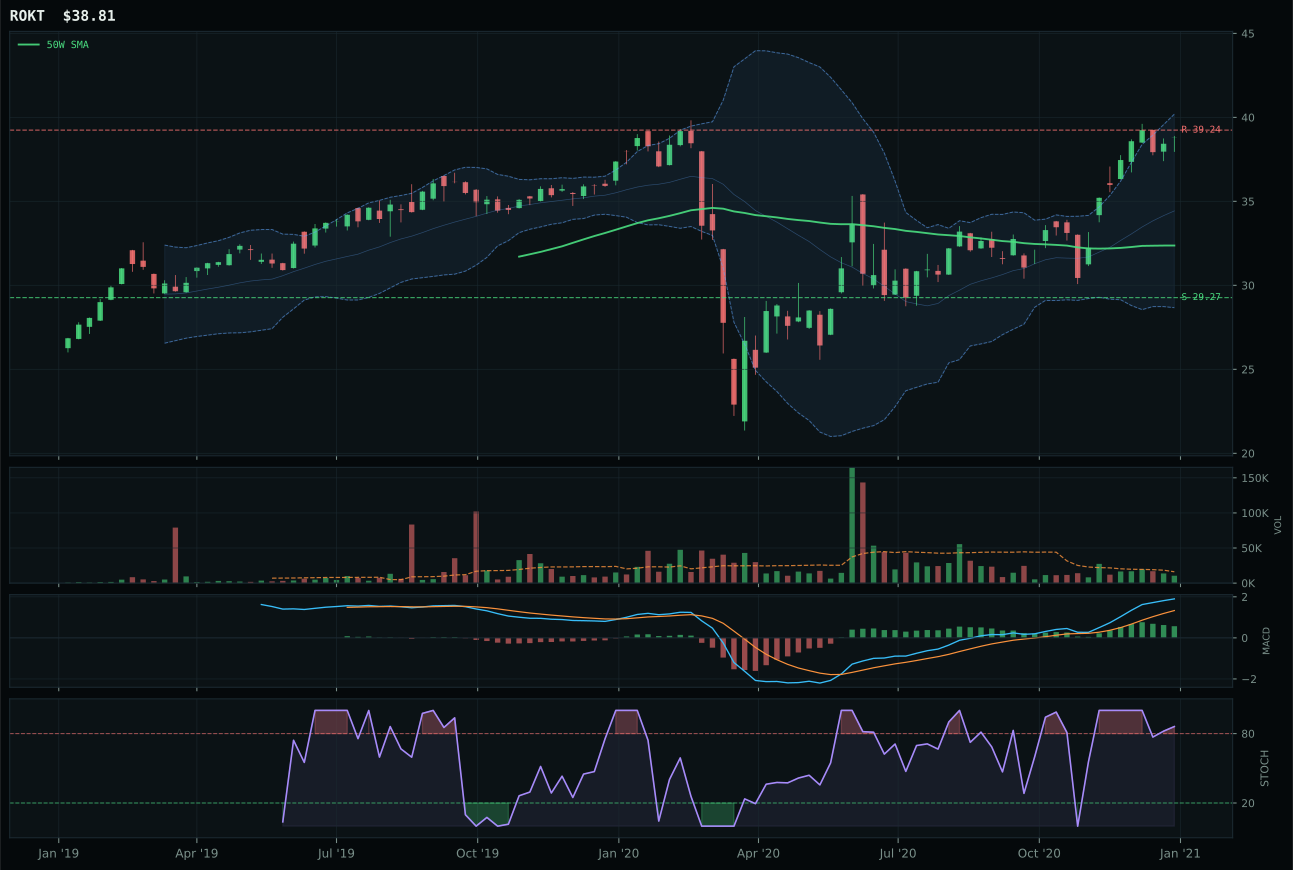
ROKT has a vertical extension profile with 8.9% 13-week relative strength versus SPY.
A failed hold above support would weaken the setup.
Tracked, but not top-2 eligible because: .
ITA claims the category on timing superiority and risk-reward positioning, not on momentum strength, because the setup near the middle Fibonacci retracement offers optionality that XAR's extension cannot match. XAR is bleeding momentum alpha despite 16.4% SPY-relative strength—it sits 23.3% above the 50-week in a vertical extension with overbought-rolling-over stochastic, meaning new buyers are underwater before they enter; ITA's neutral structure at only 9.7% above the 50-week gives it 25.4% downside to support versus XAR's 37 risk-reward penalty at 37.1. The timing score gap of 59.0 versus 22.0 reflects that ITA is coiling, not extending—MACD bullish-but-flattening, stochastic rising mid-zone, and the 0.382 Fibonacci zone tell a story of decision, not capitulation. ITA's -3.2% category-relative strength is immaterial because it's fighting XAR's 7.5% advantage on setup hygiene alone; the 52.1 volume-price confirmation and 68.7 persistence suggest that if conviction returns, ITA will have room to run without crushing new entries.
Defense & Aerospace scored 51.5, earning 5% as a tactical hedge but disqualified from top-2 because no macro descriptor strongly favors the exposure and the Transition / Mixed regime is neutral to defense spending. ITA's 53.1 technical evidence is solid, but macro/narrative fit sits at 50.0—a blank card—because credit stress adds 2 basis points while no other descriptor activates the category narrative. The portfolio currently favors real asset scarcity (metals, energy) and AI supply-chain stories over geopolitical hedges, and until the macro state flips toward active conflict sponsorship, defense sits as a 5% quality holding rather than a conviction trade. ITA's proximity to the 50W and defensive structure make it suitable for keeping when conviction is low, but nothing here suggests rotating into ITA when REMX is delivering 75.5% 13-week returns on stronger fundamental scarcity.
Utilities & Infrastructure — XLU
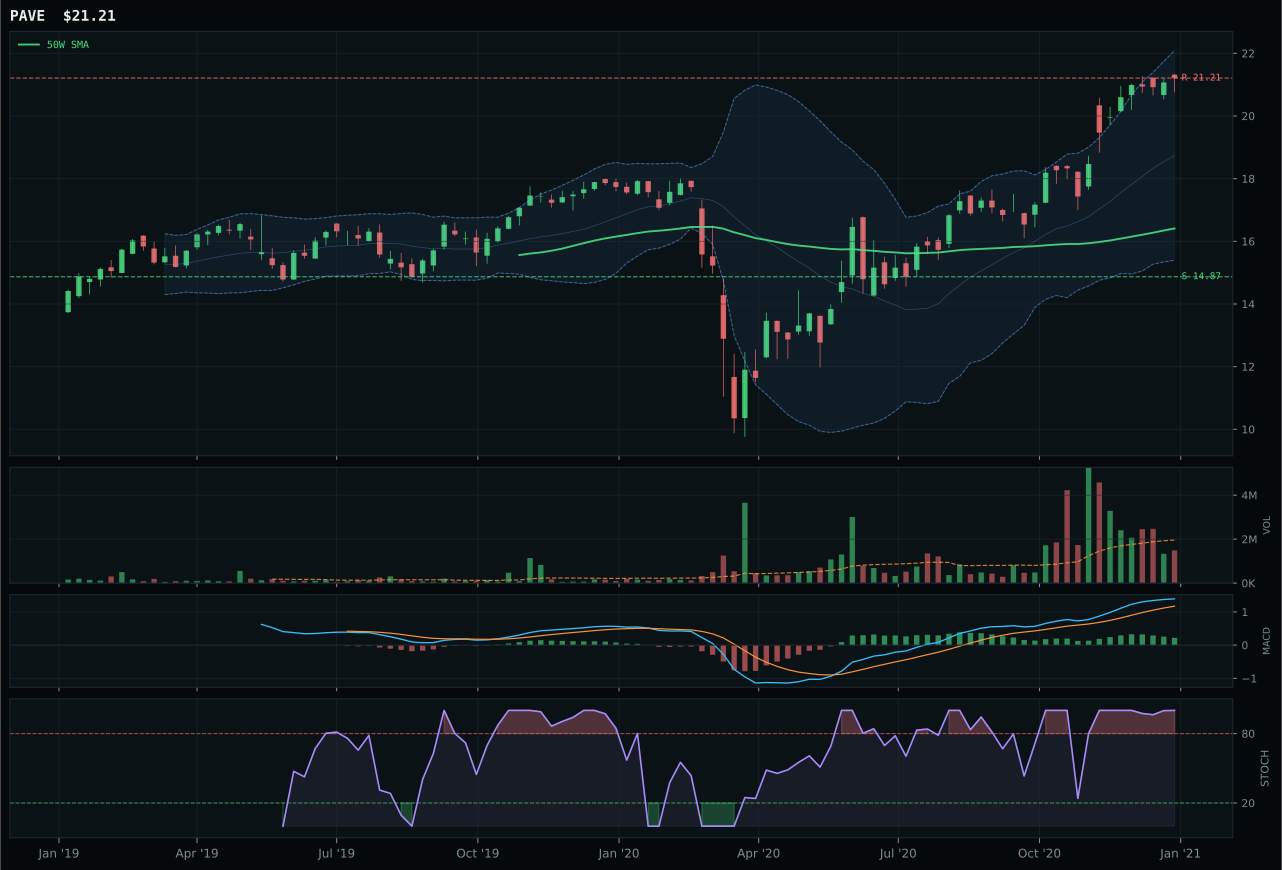
PAVE has a vertical extension profile with 11.5% 13-week relative strength versus SPY.
A failed hold above support would weaken the setup.
Actionable but governed by invalidation levels.
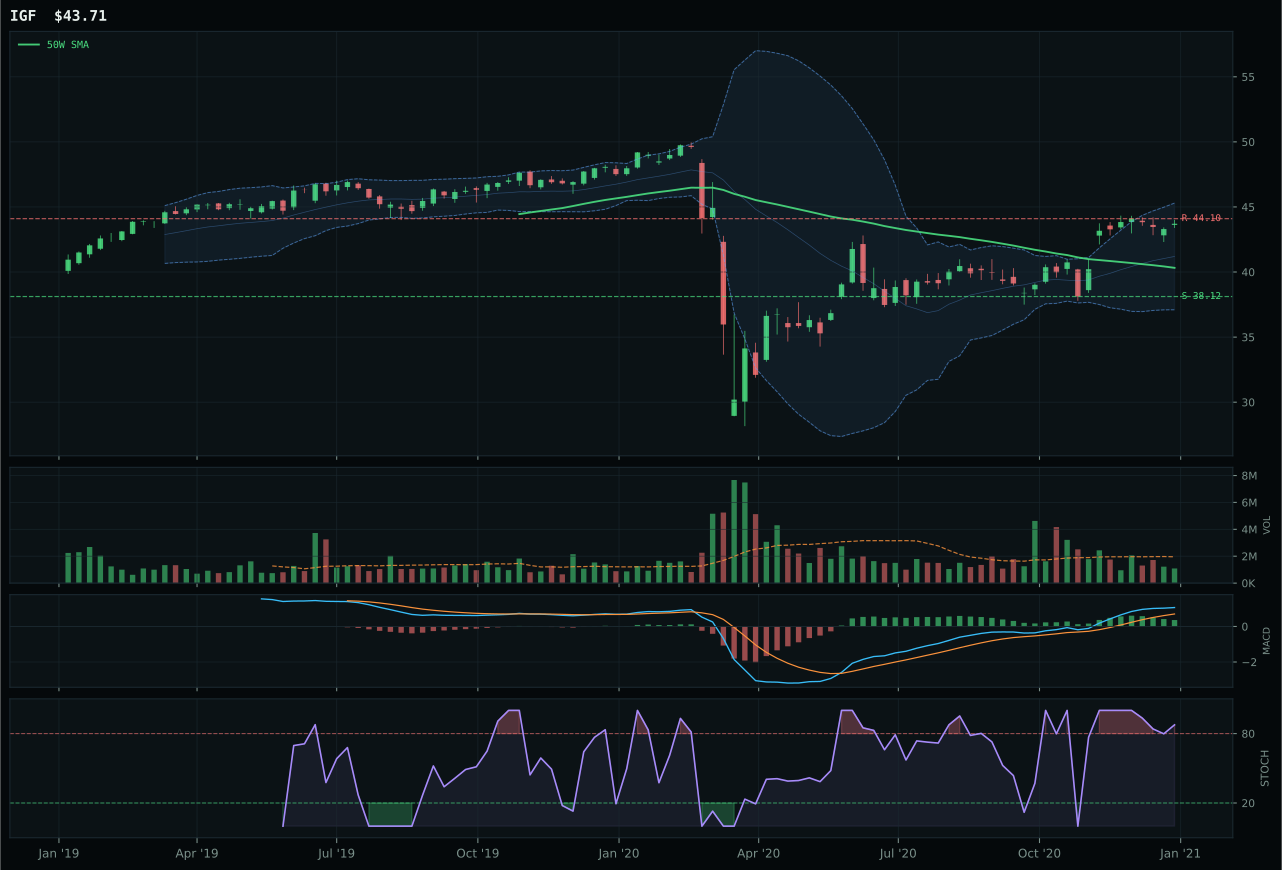
IGF has a neutral structure profile with 0.0% 13-week relative strength versus SPY.
A failed hold above support would weaken the setup.
Actionable but governed by invalidation levels.
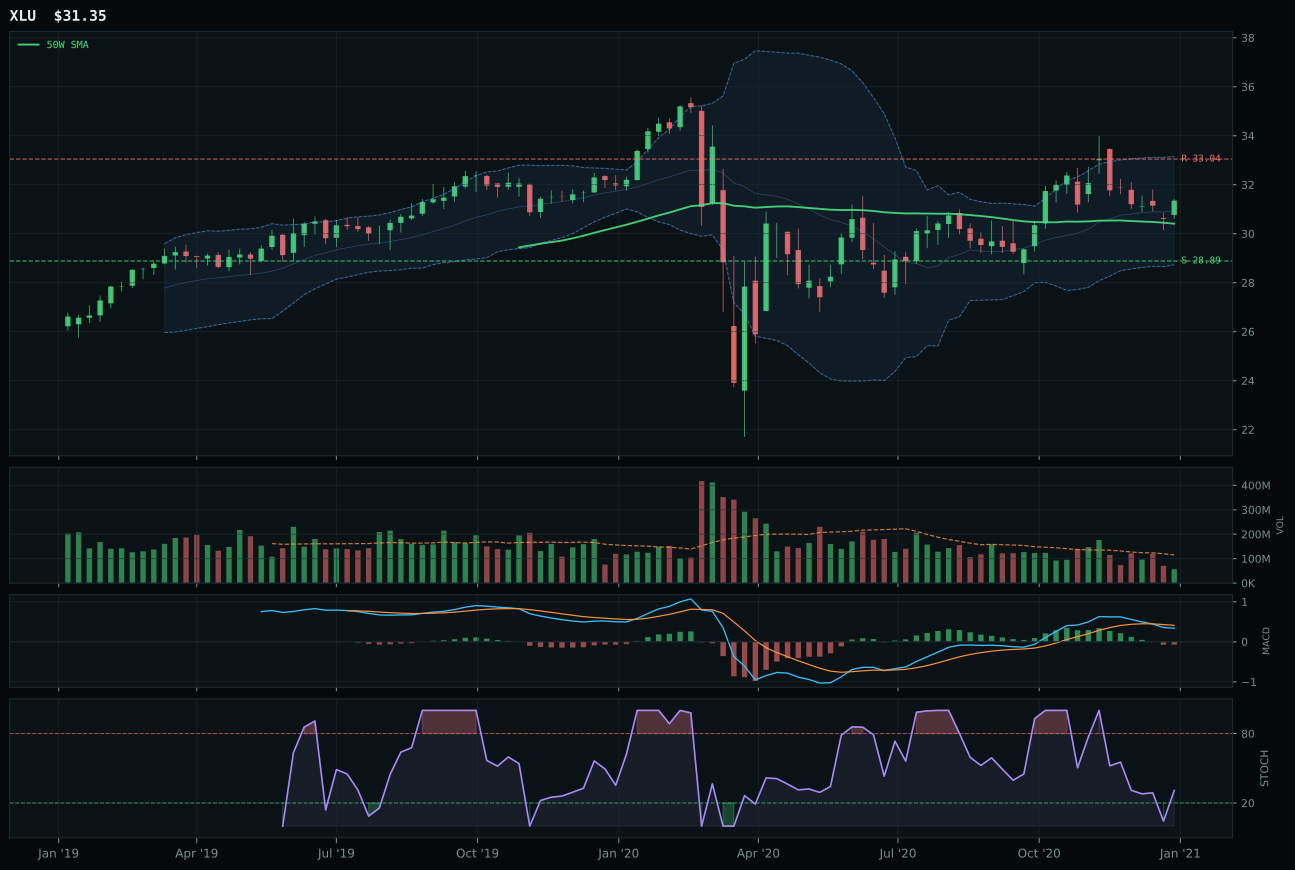
XLU has a neutral structure profile with -8.7% 13-week relative strength versus SPY.
A failed hold above support would weaken the setup.
Actionable but governed by invalidation levels.
XLU wins the category on timing advantage alone, turning 3.1% proximity to the 50-week into a 93.0 timing score that PAVE cannot approach despite stronger momentum, because the setup is coil rather than extension. PAVE is 29.2% above the 50-week in vertical extension with overbought-momentum stochastic and bullish-but-flattening MACD, the classic late-stage rhythm that must reset before new capital can accumulate; XLU's 3.1% distance and rising-mid-zone stochastic create the inverse picture—a setup that offers entry relief while maintaining above-50W confirmation. XLU's 55.8 risk-reward with 8.5% downside to support and -5.1% upside to resistance reflects compression zone mechanics, while PAVE's 40.4 risk-reward shows exhaustion before the next level can be reached; both exhibit thin participation and weak volume-price confirmation, but XLU's 26.4 versus PAVE's implied score gap indicates that regulated utility defense is being abandoned more quietly than infrastructure is being chased. The category-relative strength is identical at -8.7%, so the representative decision turns entirely on structure and timing, where XLU's neutral coil beats PAVE's vertical run.
Utilities & Infrastructure scored 48.4 and earned 5% as a portfolio ballast, not a conviction position, because the category macro fit is 46.0—the third-lowest in the portfolio—with inflation pressure active (-6) actively penalizing utilities' negative duration characteristics. Risk appetite positive contributes (-2) because rising rates hurt both value and growth in this regime. XLU's 33.8 reasoned evidence lags PAVE's 59.5 and IGF's 49.2, but XLU wins the category selection on proximity to the 50W, and the 5% allocation is purely defensive: own utilities as a volatility buffer, not as a return driver. For Utilities to move up from 5% to 10%, either inflation pressure would need to reverse (unlikely short-term), or the category would need to rank top-five by overall score (currently 8th place). The macro regime is explicitly hostile to utilities—regulation, rate risk, and growth defensiveness are all tailwinds reversed—so the allocation is a tactical hedge rather than strategic conviction. XLU's near-50W positioning and stochastic mid-zone reset offer an asymmetric entry setup, but the allocation size reflects the regime headwind, not any fundamental improvement in utility-sector returns.
Precious Metals — GLD
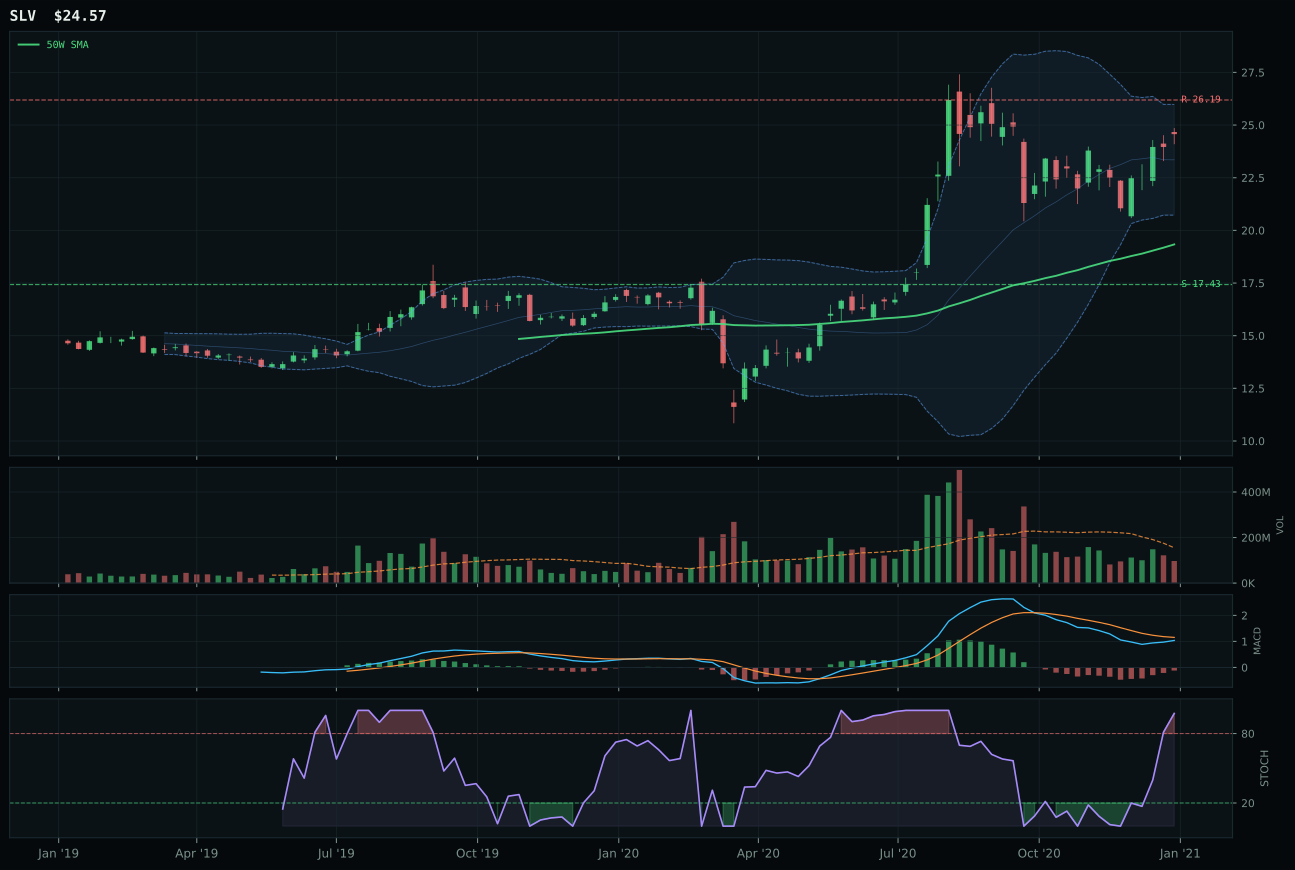
SLV has a vertical extension profile with -1.0% 13-week relative strength versus SPY.
A failed hold above support would weaken the setup.
Actionable but governed by invalidation levels.
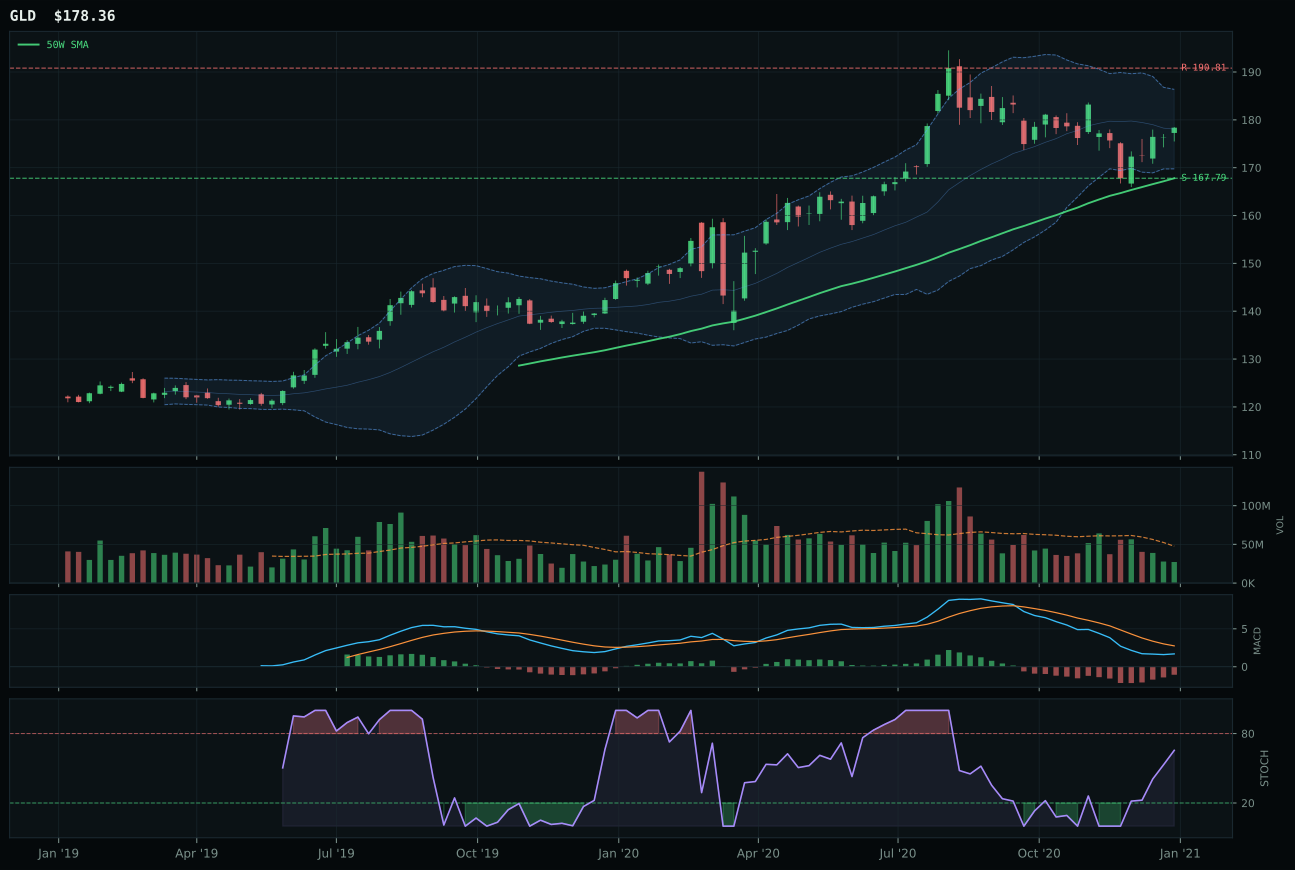
GLD has a neutral structure profile with -12.1% 13-week relative strength versus SPY.
A failed hold above support would weaken the setup.
Actionable but governed by invalidation levels.
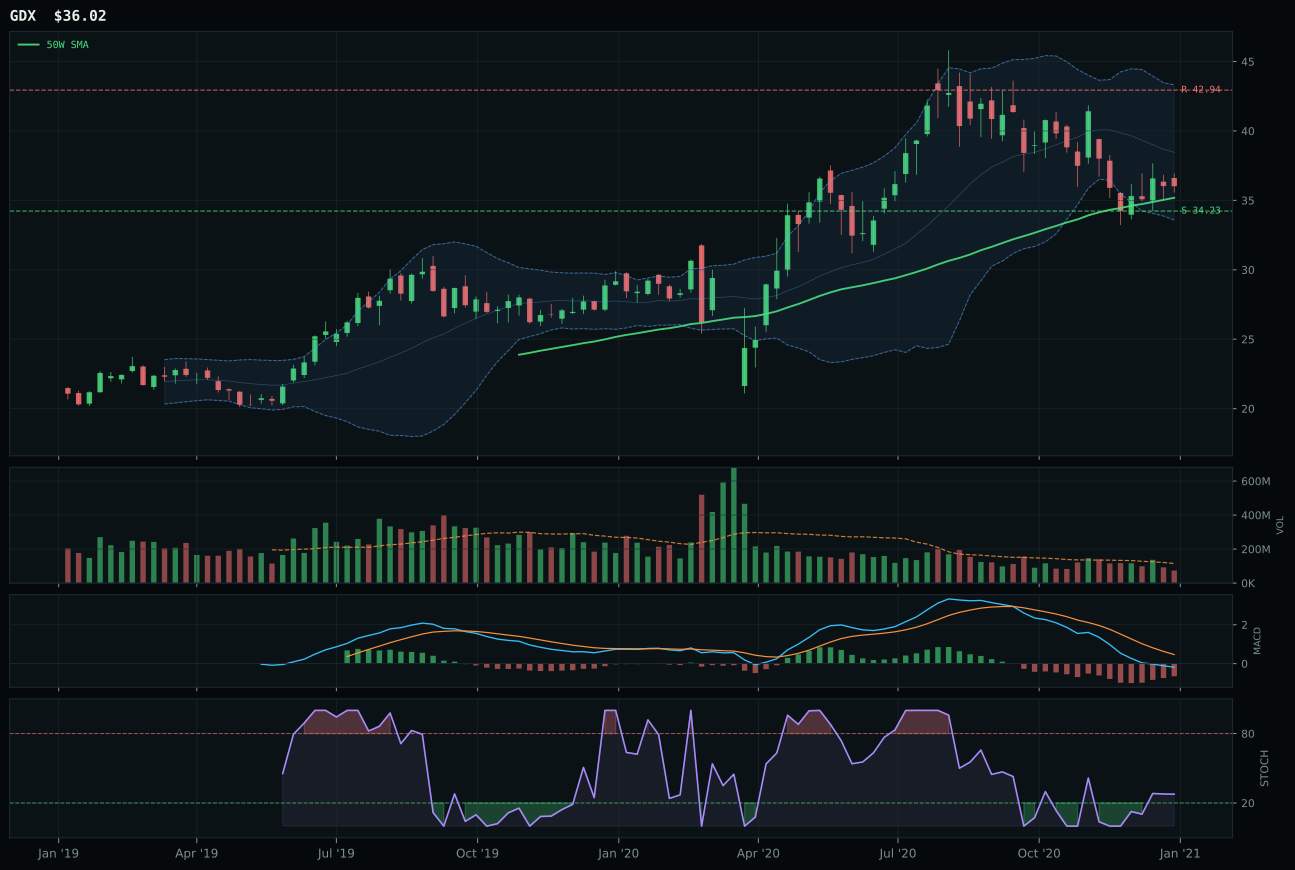
GDX has a neutral structure profile with -19.6% 13-week relative strength versus SPY.
A failed hold above support would weaken the setup.
Actionable but governed by invalidation levels.
GLD's 47.3 category score and representative selection over SLV is fundamentally a timing and positioning story: GLD sits 6.3% above the 50-week in neutral structure with bearish-but-improving MACD and rising-mid-zone stochastic, while SLV is 27.1% extended into vertical territory with overbought-momentum stochastic that must reset before buyers can accumulate again. GLD's 83.0 timing score versus SLV's 45.0 summarizes the setup gap—six percent proximity offers 6.3% downside to support (risk-reward favorable at 63.6), while SLV's extension means the next buyer pays 27% above the fair-value band before stochastic rolls over. Both exhibit bearish MACD (not bullish), but GLD is improving while SLV still compressing, indicating that gold's cleaner monetary hedging narrative is re-engaging while silver's industrial-beta element is losing sponsorship. Volume confirmation of 49.3 versus SLV's 62.0 looks weaker, but GLD's thin participation is neutral (accumulation without conviction), whereas SLV's is thin rejection (late buyers stepping aside), a critical distinction in transition regimes.
Precious Metals scored 47.3 and received zero allocation because risk appetite positive is active, which costs the category 4 basis points, and there is no offsetting descriptor to compensate: no energy scarcity, no supply shortage, no inflation narrative specifically anchoring gold demand. The 46.0 macro fit is the portfolio's lowest, meaning the category is fighting the regime rather than swimming with it. With REMX delivering 90.6 reasoned evidence and COPX at 74.1 on the same metals scarcity story, gold and silver are being crowded out by the higher-conviction industrial metals and rare earth narrative. Metals-hungry allocators have better homes for their allocation: REMX offers 75.5% 13-week returns and 28.9% category-relative strength, versus GLD's flat 13-week and zero relative edge. For Precious Metals to earn even 5%, either risk appetite would need to turn negative (active fear), or the category would need to rank in the top five by score. Today it ranks below Nuclear Energy and outside the allocation entirely. GLD's better timing structure is noted, but it does not overcome the regime disadvantage.
Nuclear Energy — URA
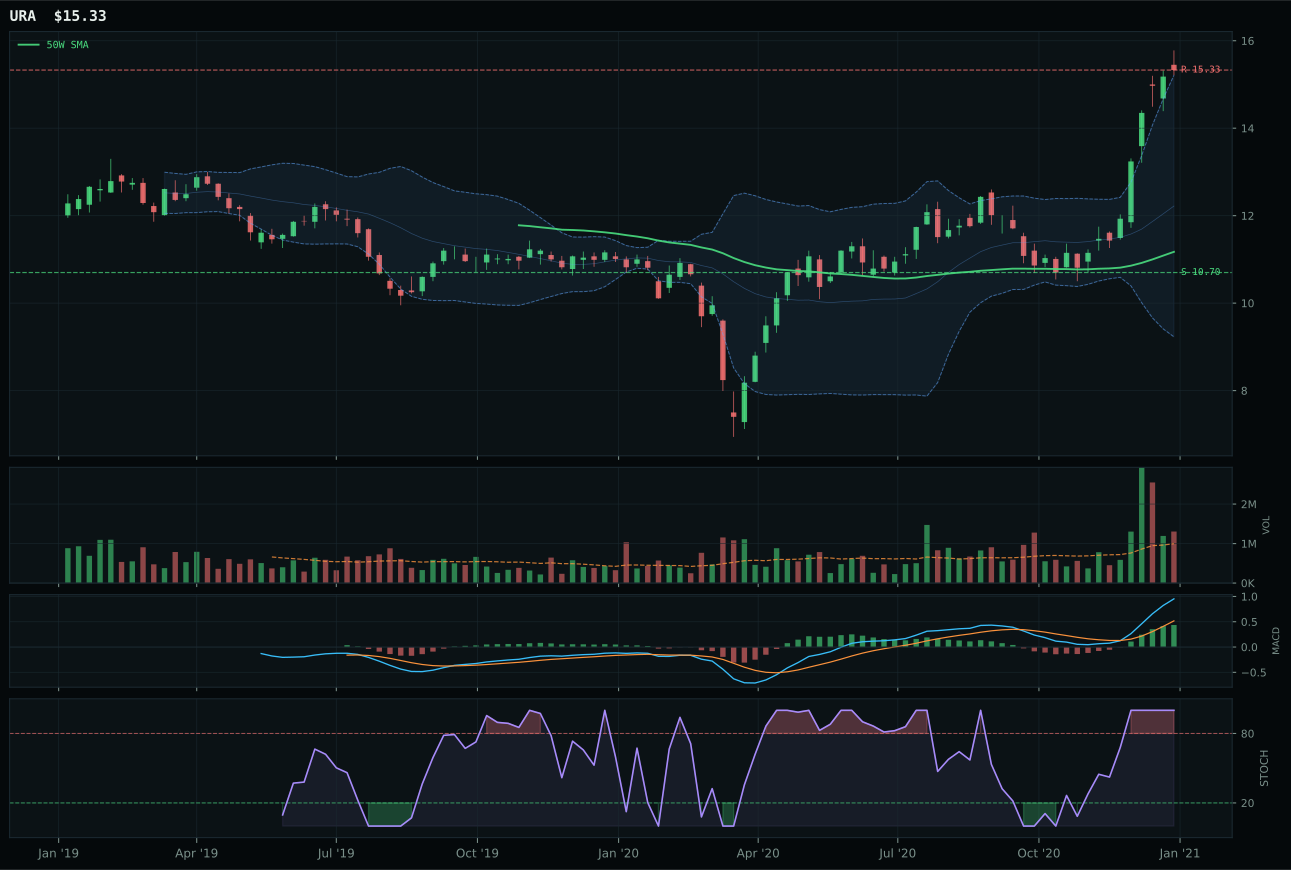
URA has a vertical extension profile with 29.2% 13-week relative strength versus SPY.
A failed hold above support would weaken the setup.
Actionable but governed by invalidation levels.
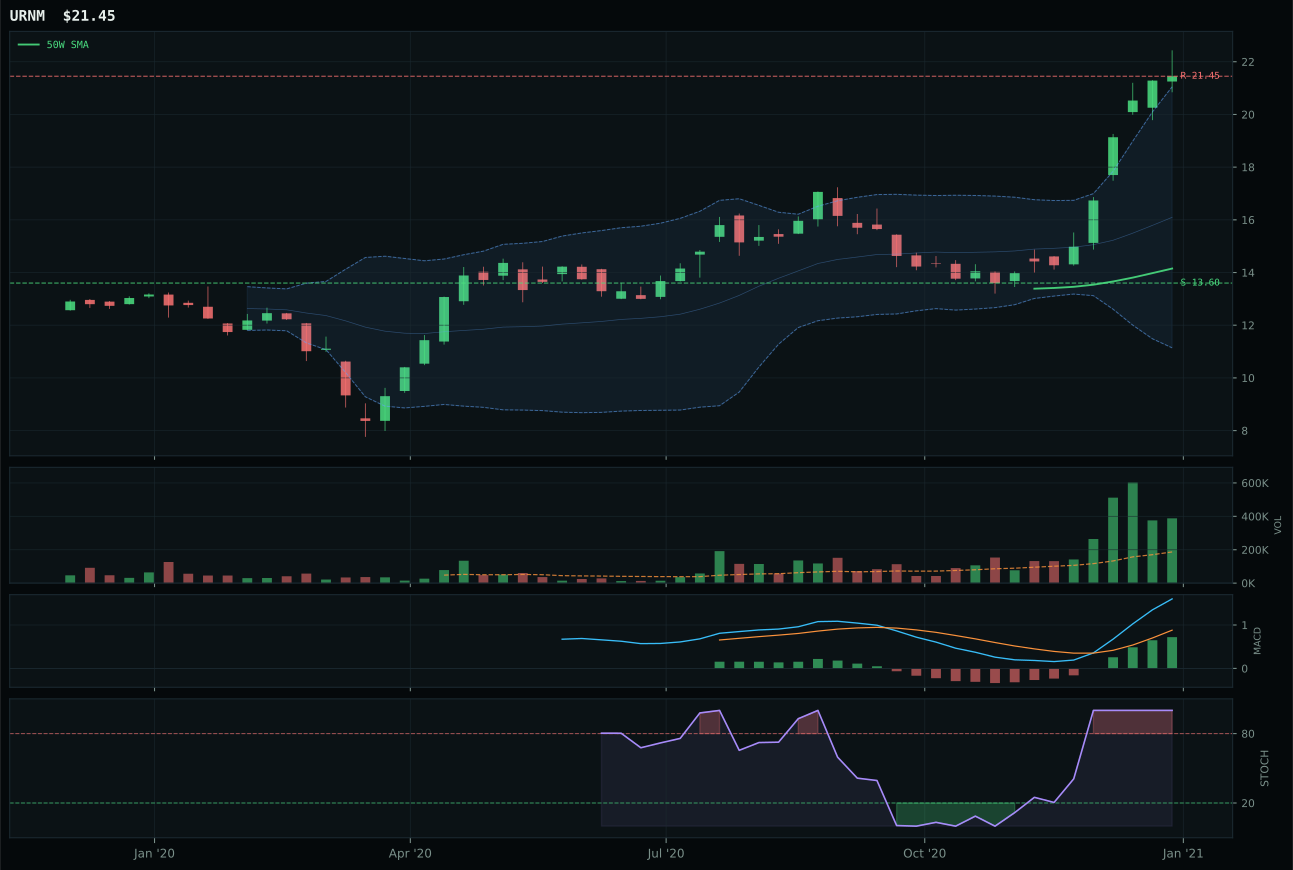
URNM has a vertical extension profile with 38.8% 13-week relative strength versus SPY.
A failed hold above support would weaken the setup.
Tracked, but not top-2 eligible because: .
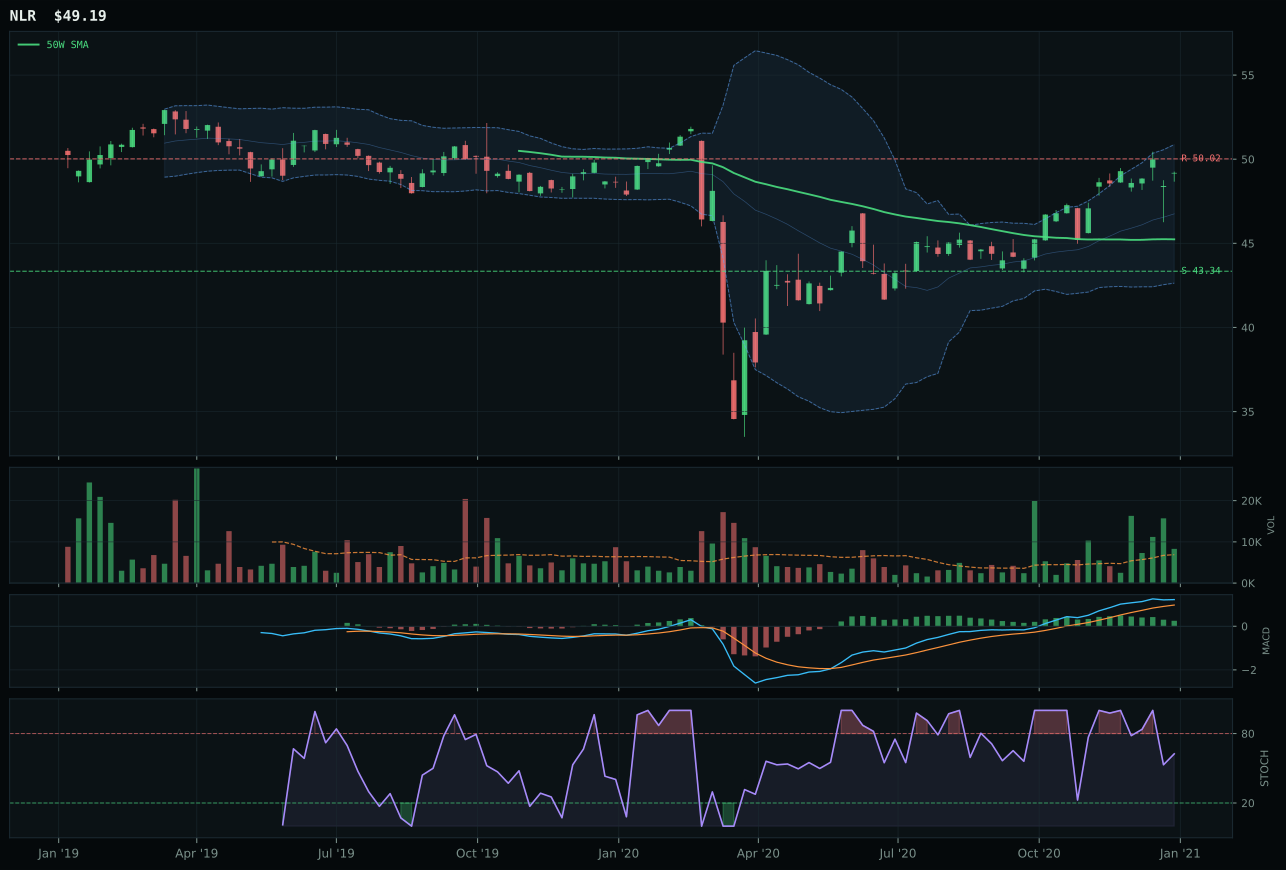
NLR has a neutral structure profile with -3.3% 13-week relative strength versus SPY.
A failed hold above support would weaken the setup.
Tracked, but not top-2 eligible because: .
URA wins the category at 45.9 by maintaining higher technical evidence (81.2 versus URNM's 45.0) despite being less extended in relative strength terms, because the 37.2% extension above the 50-week is 14.4 percentage points tighter than URNM's 51.6% advance. Both show bullish-and-improving MACD and overbought-momentum stochastic with above-average participation, but URA's structure cleanliness of 75.0 and compression ratio of 77.1 versus URNM's equivalent metrics reflect tighter coil rather than runaway extension; the 40.3 risk-reward at 43.3% downside to support gives URA enough cushion to defend on pullbacks. URNM's 50.8% thirteen-week return and 38.8% SPY-relative strength are superior, but they are purchased at the cost of 51.6% above the 50-week, meaning URNM is already priced for perfection while URA still offers entry relief. Category-relative strength of 0.0% for URA (versus URNM's 9.6% advantage) indicates that the broad uranium narrative is coalescing around mining beta, yet URA's cleaner setup means it will re-accumulate when stochastic rolls over.
Nuclear Energy scored 45.9 and earned zero allocation, ranking 9th or 10th in the portfolio, because the macro fit of 69.0 cannot compete with the top-2 categories despite energy scarcity being active (+9). The category margin is unforgiving: Industrial Metals (73.0 macro fit) and Traditional Energy (85.0 macro fit) both activate energy scarcity but deliver it through tighter supply-demand mechanics and higher risk-appetite signals; Nuclear Energy activates the scarcity signal but cannot anchor it to the broader commodity breadth or inflation pressure narrative that elevates metals and crude. The technical evidence at 81.2 for URA is excellent—second-highest in the portfolio after REMX's 99.9—but technical excellence does not overcome macro exclusion. For Nuclear to earn even 5%, the category would need to rank in the top seven by final score, and it does not. The setup is extended, volume participation in URNM shows promise, but the category macro tailwind is too light relative to the overextension risk. URA's 41.2% 13-week return is real, but it is real in the same supply-shortage environment where REMX delivered 75.5% and XLE is being allocated at 10% with better risk structure. Nuclear Energy is noted as a future category to monitor if uranium supply tightens relative to nuclear power demand, but today it sits outside the allocation entirely.