
2020-12-25
Informational purposes only. The content in this report, including allocations, analysis, and commentary, is provided solely for informational and educational purposes. It does not constitute financial advice, investment advice, trading advice, or any other type of advice. Past performance does not guarantee future results. Always conduct your own research and consult a qualified financial professional before making investment decisions.
Some tracked tickers were excluded due to missing live weekly price data: SGOV: Historical cache SGOV has only 30 usable weekly bars
Weekly Allocation
| Ticker | Category | Weight | Role |
|---|---|---|---|
| FSOL | 50% | Overlay | |
| XLE | Traditional Energy | 10% | Top-2 (10%) |
| REMX | Industrial Metals | 10% | Top-2 (10%) |
| INDA | Emerging Markets | 5% | Tier-2 (5%) |
| MOO | Agriculture & Livestock | 5% | Tier-2 (5%) |
| CIBR | Technology | 5% | Tier-2 (5%) |
| XAR | Defense & Aerospace | 5% | Tier-2 (5%) |
| SMH | AI | 5% | Tier-2 (5%) |
| XLU | Utilities & Infrastructure | 5% | Tier-2 (5%) |
Trade Instructions — Monday Open
Sell the tranche from 2020-11-27 (completing its 4-week hold). Buy the new tranche. Instructions show net portfolio changes — same-asset positions cancel, weight changes show the delta.
| Action | Ticker | Instruction |
|---|---|---|
| SELL | ILF | Sell 40% of ILF position (reduce 6.25% → 3.75%) |
| SELL | FCG | Sell 14% of FCG position (reduce 8.75% → 7.50%) |
| SELL | PAVE | Sell 25% of PAVE position (reduce 5.00% → 3.75%) |
| BUY | XLE | Buy XLE — 50.00% of freed cash (adds 2.50% to portfolio) |
| BUY | INDA | Buy INDA — 25.00% of freed cash (adds 1.25% to portfolio) |
| BUY | XLU | Buy XLU — 25.00% of freed cash (adds 1.25% to portfolio) |
Current Portfolio After Trade
Combined holdings across all 4 active tranches. Each tranche is 25% of the portfolio.
| Ticker | % of Portfolio | Weight Bar |
|---|---|---|
| FSOL | 50.00% | |
| FCG | 7.50% | |
| SMH | 5.00% | |
| XAR | 5.00% | |
| CIBR | 5.00% | |
| MOO | 5.00% | |
| COPX | 5.00% | |
| PAVE | 3.75% | |
| ILF | 3.75% | |
| PICK | 2.50% | |
| XLE | 2.50% | |
| REMX | 2.50% | |
| INDA | 1.25% | |
| XLU | 1.25% |
Macro Regime — Transition / Mixed
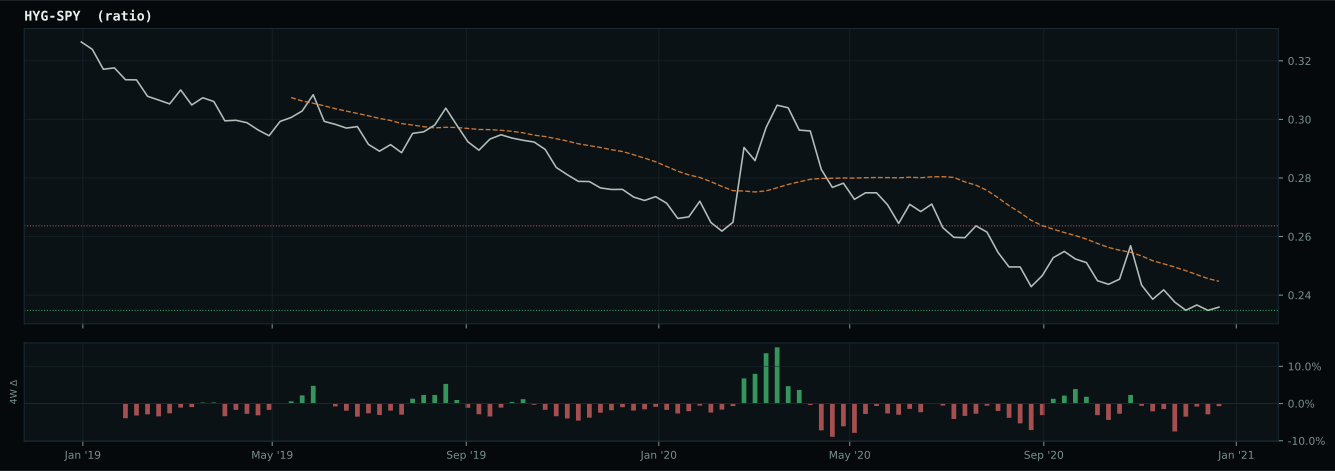
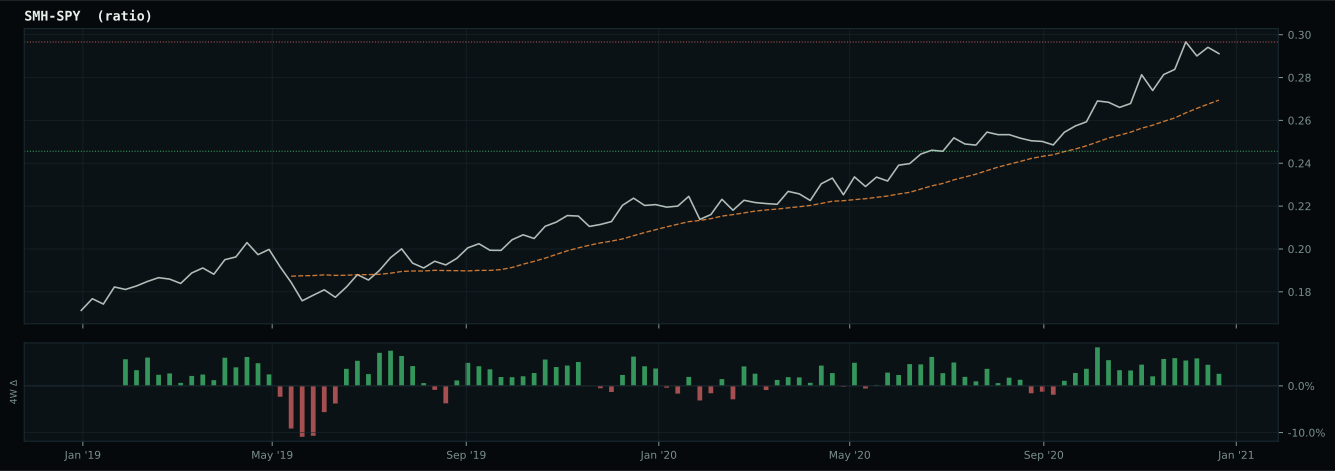
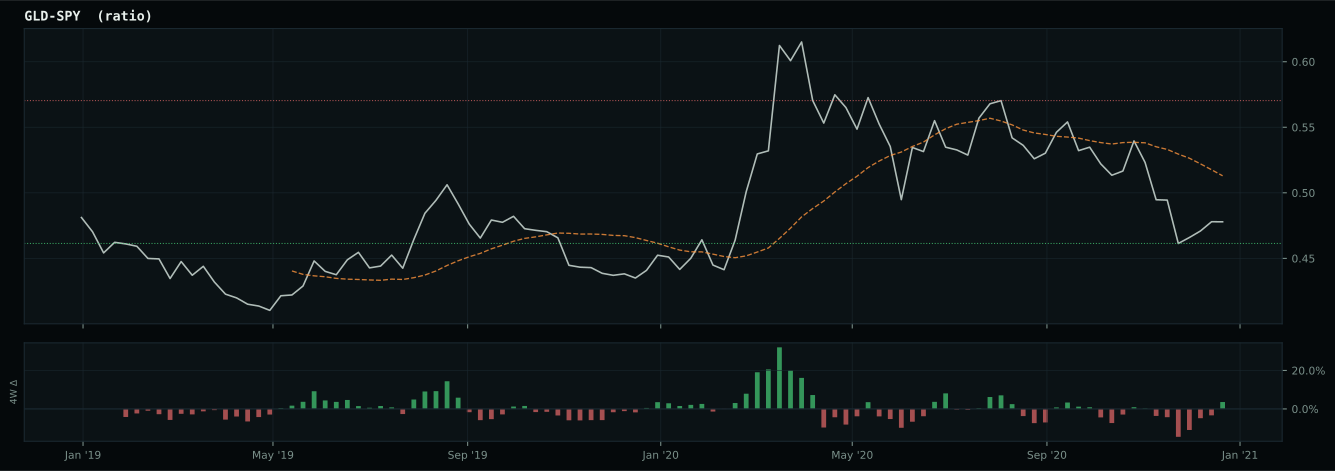
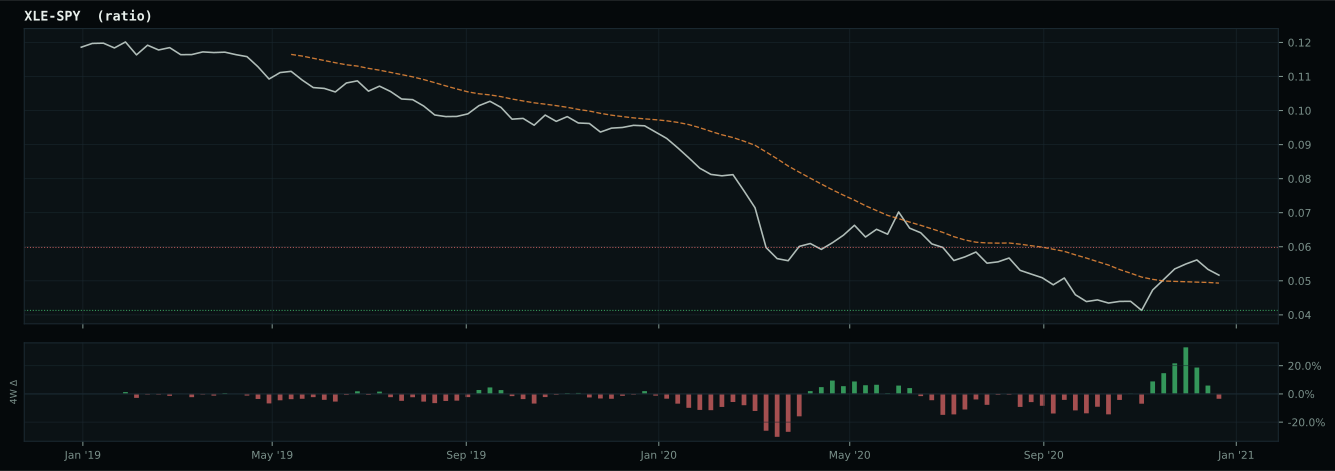
Macro Evidence Charts
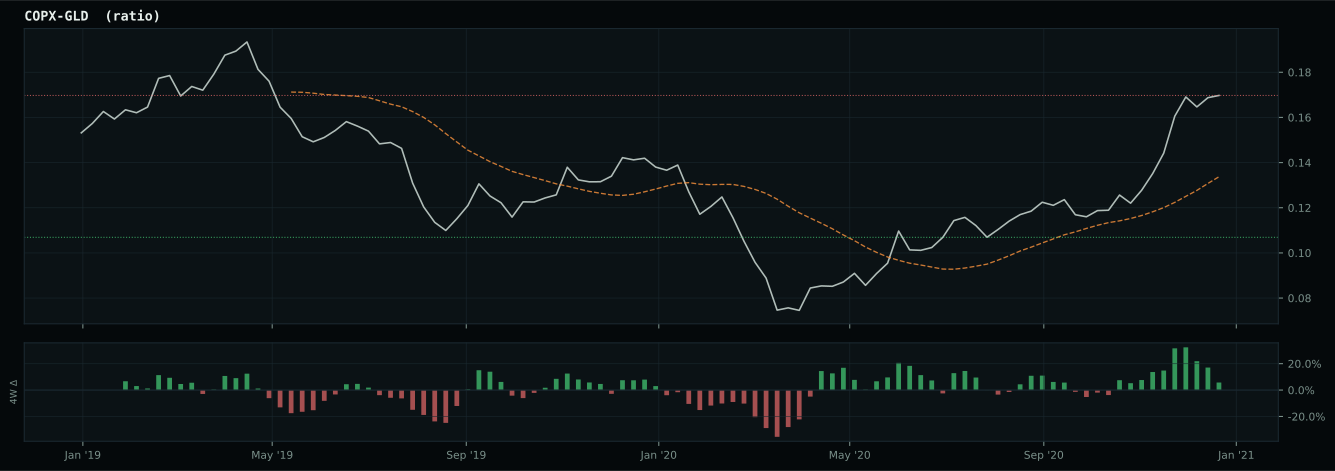
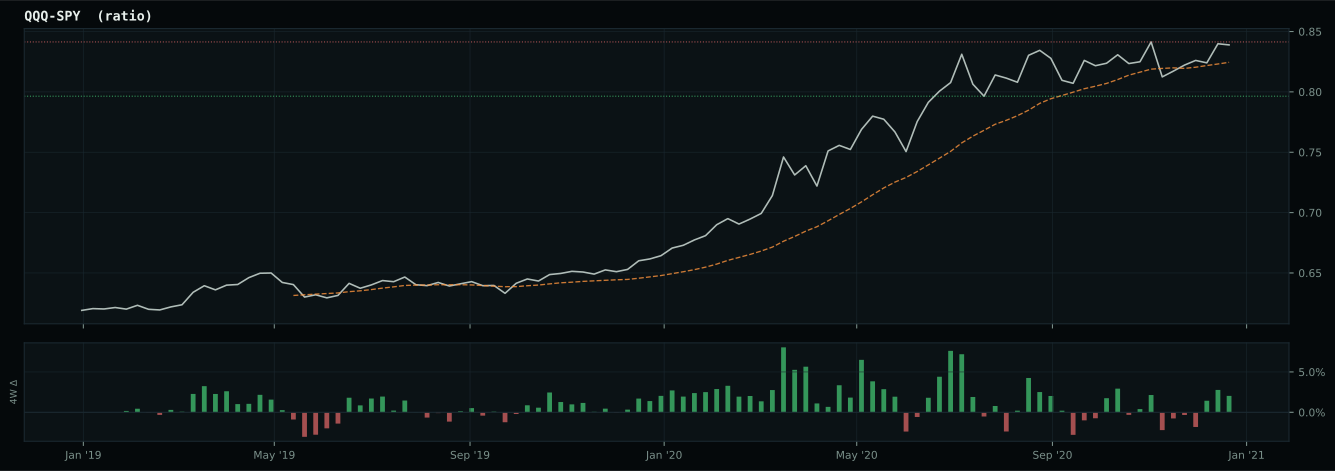
Market-implied signals behind the macro regime scores. Each ratio compares two assets; the direction and slope of the ratio is what the macro engine reads.
Crypto Regime — AltSeason
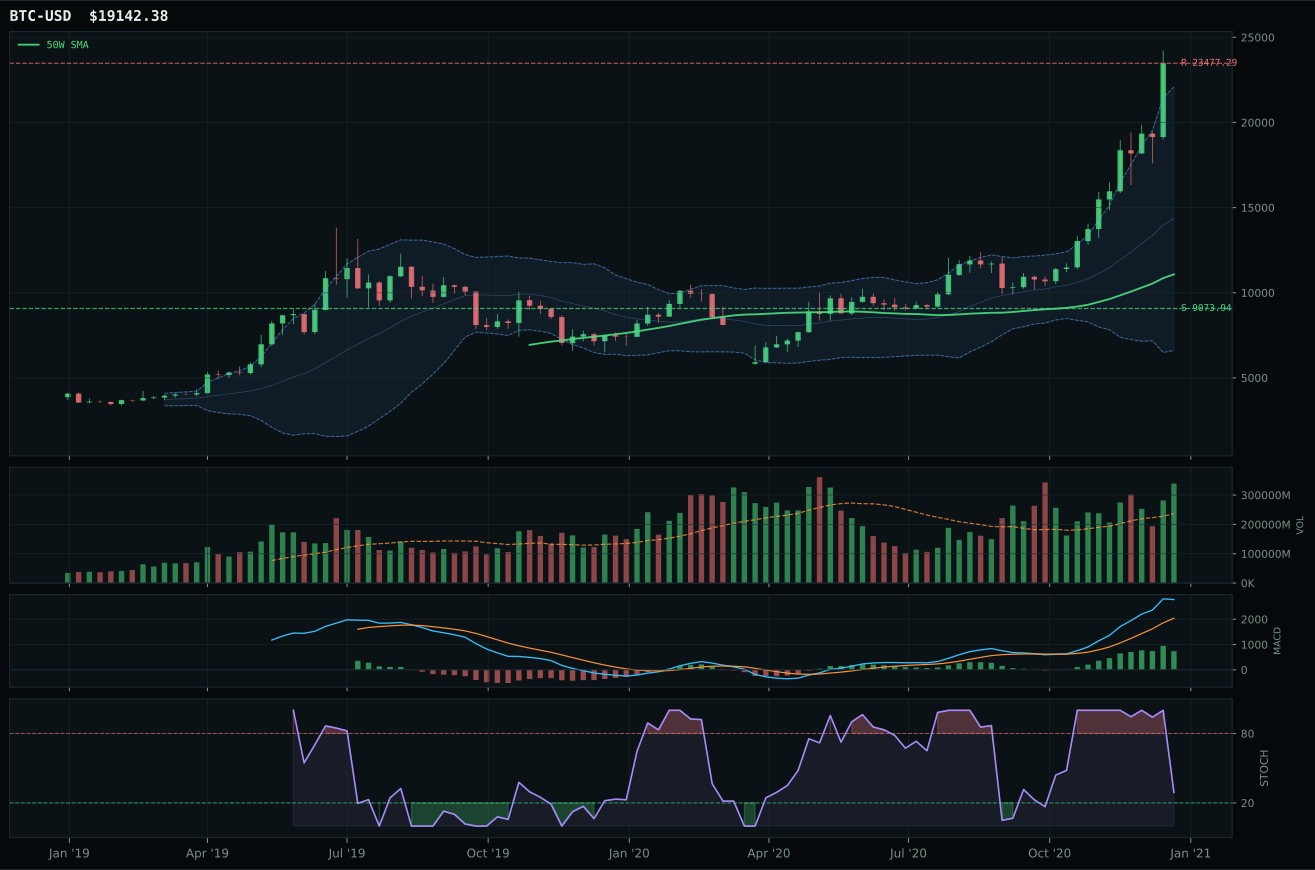
post-touch structure is too wide to count as a range; max/min close ratio is 4.35
TrendBTC confirmed: 2 consecutive closes above rising/flat 50W SMA
all available AltSeason conditions pass; missing optional confirmations skipped

Category Rankings
| Rank | Category | Winner | Score | Alloc | 4W Ret | Peers (4W) |
|---|---|---|---|---|---|---|
| 1 | Traditional Energy | XLE | 79.0 | 20% | +8.76% | FCG +14.8% · XOP +13.3% |
| 2 | Industrial Metals | REMX | 73.2 | 20% | +27.48% | COPX +7.0% · PICK +6.5% |
| 3 | Emerging Markets | INDA | 64.9 | 10% | +2.59% | ILF -2.8% · IEMG +11.4% |
| 4 | Agriculture & Livestock | MOO | 59.0 | 10% | +6.00% | WEAT +1.7% · VEGI +7.5% |
| 5 | Technology | CIBR | 56.8 | 10% | +0.70% | IGV -0.5% · XLK +3.1% |
| 6 | Defense & Aerospace | XAR | 52.6 | 10% | +4.66% | ROKT +3.3% · ITA -1.2% |
| 7 | AI | SMH | 49.4 | 10% | +11.92% | AIQ +6.6% · BOTZ +6.9% |
| 8 | Utilities & Infrastructure | XLU | 48.7 | 10% | +1.77% | PAVE +5.6% · IGF -0.2% |
| 9 | Precious Metals | SLV | 48.6 | 0% | -3.36% | GLD -1.4% · GDX -3.1% |
| 10 | Nuclear Energy | URA | 43.4 | 0% | -1.55% | URNM +0.9% · NLR +0.1% |
Traditional Energy — XLE
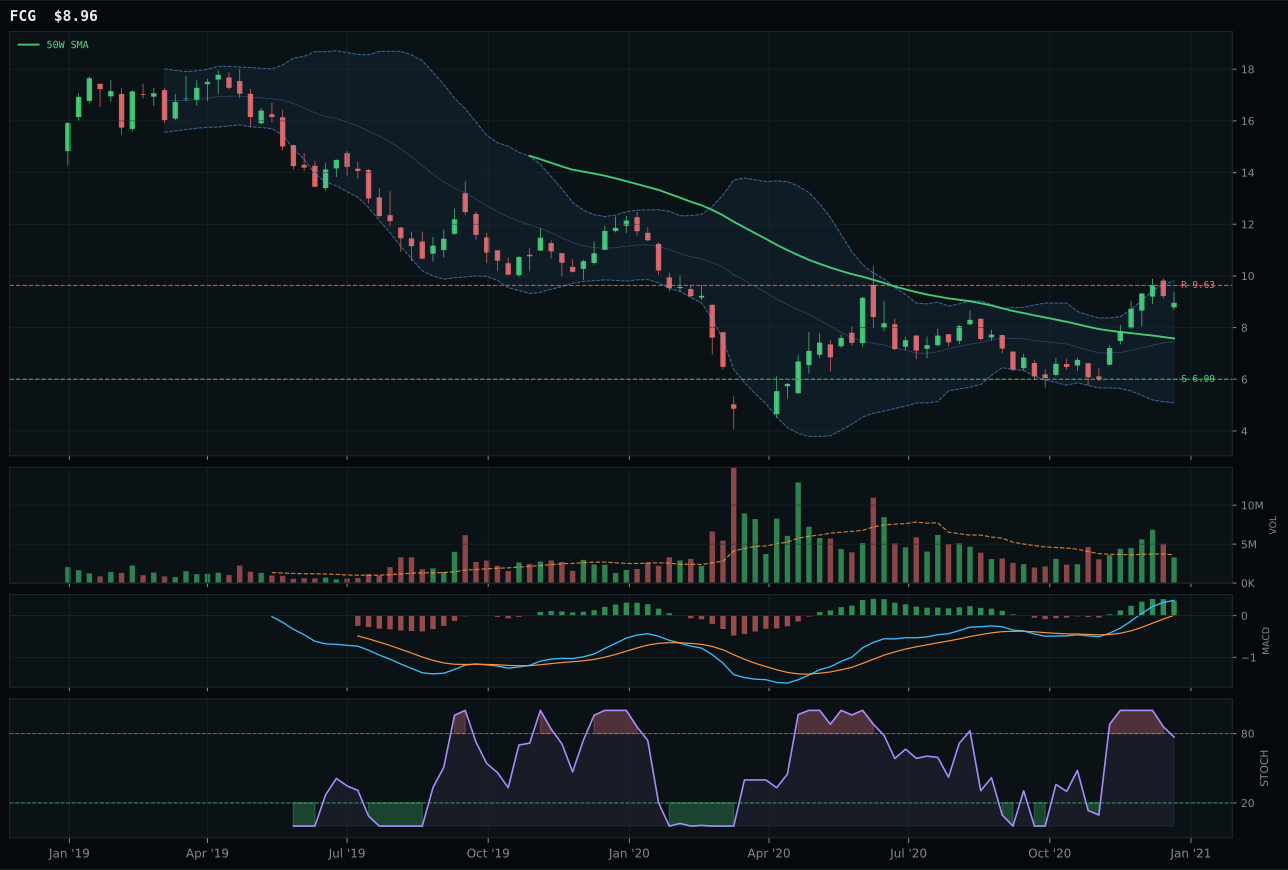
FCG has a vertical extension profile with 34.4% 13-week relative strength versus SPY.
A failed hold above support would weaken the setup.
Actionable but governed by invalidation levels.
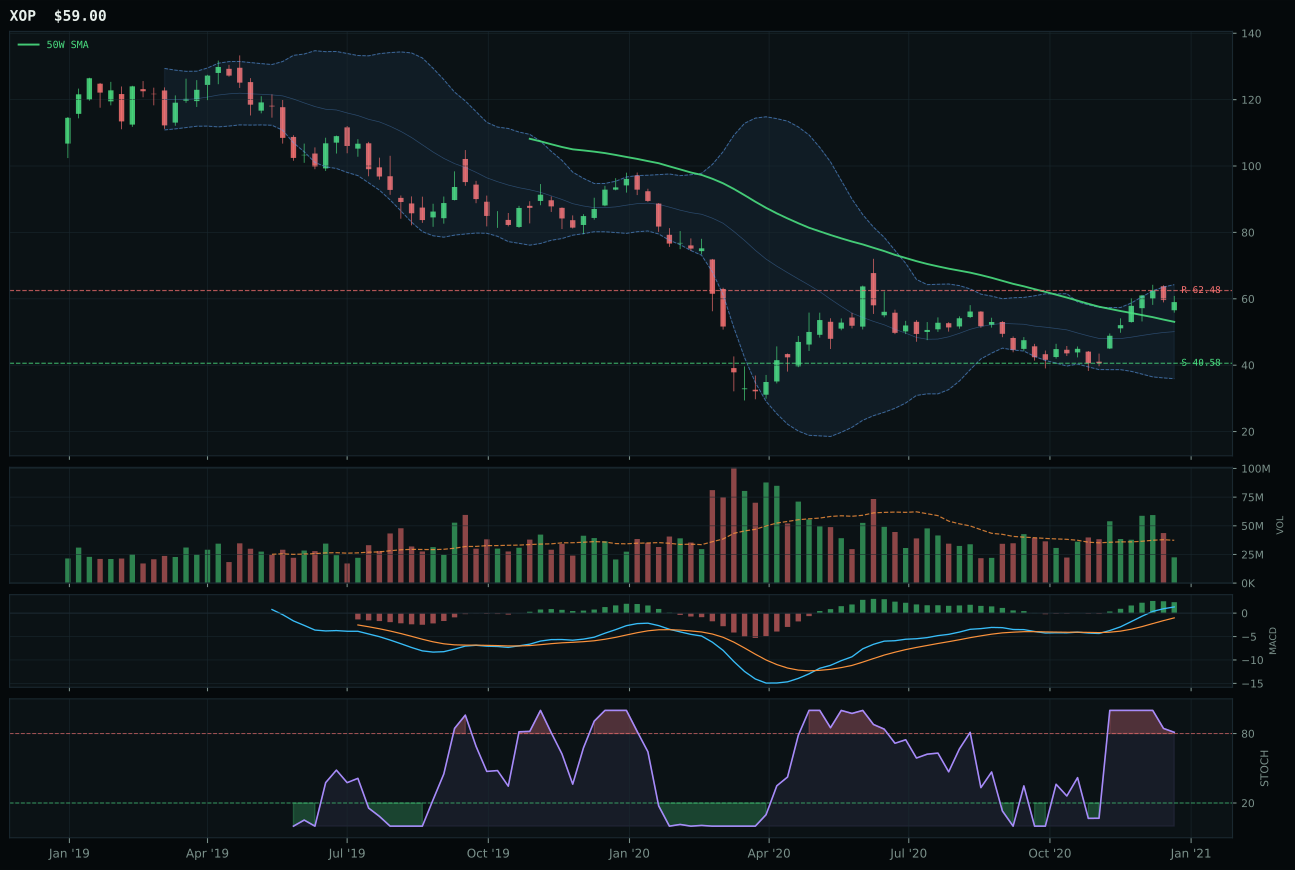
XOP has a neutral structure profile with 26.9% 13-week relative strength versus SPY.
A failed hold above support would weaken the setup.
Actionable but governed by invalidation levels.
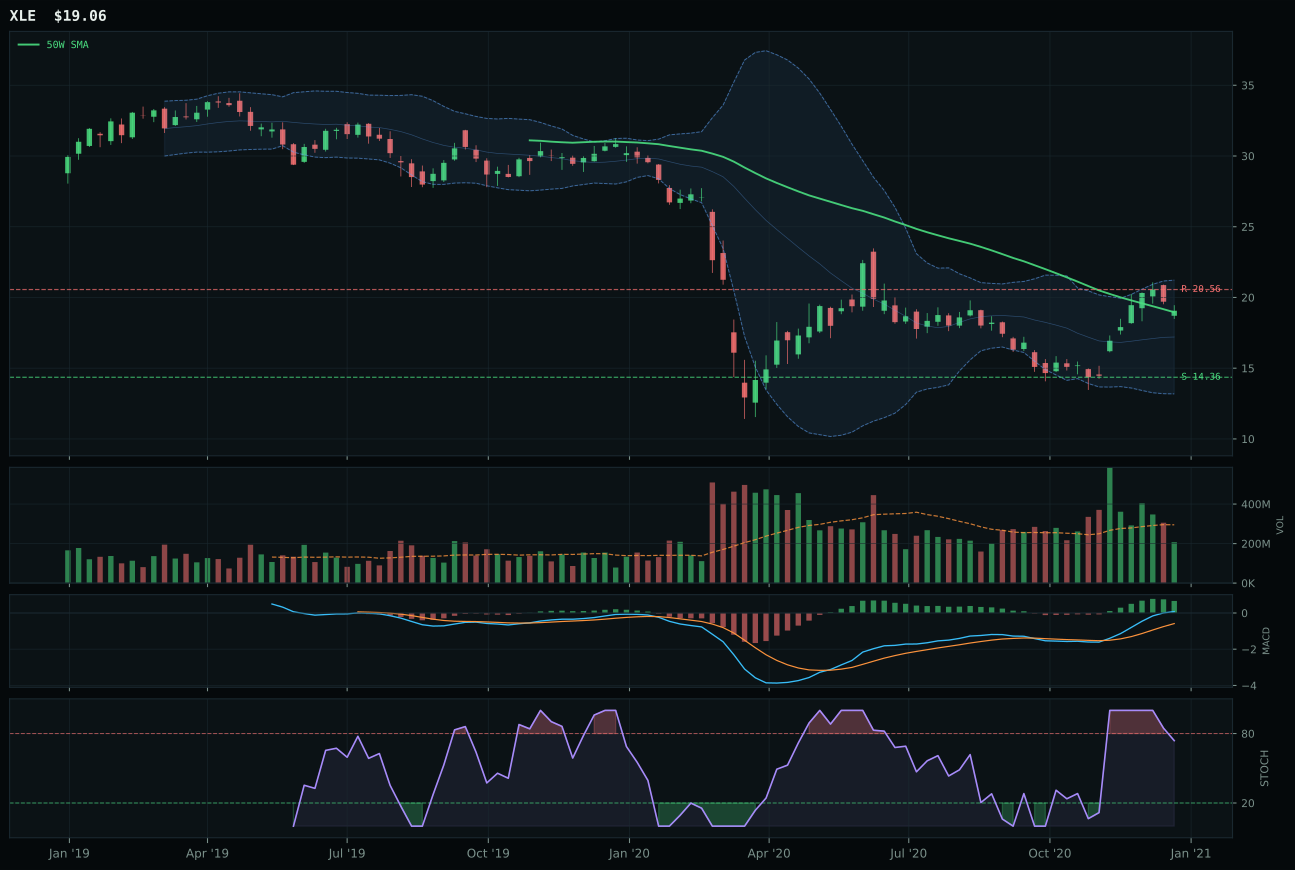
XLE has a compression near 50W profile with 14.1% 13-week relative strength versus SPY.
A failed hold above support would weaken the setup.
Actionable but governed by invalidation levels.
XLE won the energy category with 75.8 proof order and a 79.0 final score—the second-highest category score in the portfolio—by recognizing that timing matters more than extension. Trading 0.6% from the 50-week in a compression setup, XLE avoided the entry penalty that MACD bullish and improving trades normally carry; the 100.0/100 timing score reflects perfect positioning near support with falling/neutral stochastic RSI. The 26.3% 13-week return and 14.1% SPY-relative strength prove momentum despite the modest positioning, while MACD bullish and improving establishes trend initiation. FCG stumbled by being 20.3% extended from the 50-week, dropping its timing to 53.0/100; the 15.9-point gap made XLE the clear category winner and justified top-2 allocation.
Traditional Energy scores 79.0, ranking first among all categories and securing a 10% allocation slot as the co-anchor of the top-2 tier with Industrial Metals. The macro fit of 85.0 is exceptional and unusual for an energy category: energy scarcity adds +16, inflation pressure adds +10, supply shortage adds +9, real asset sponsorship adds +7, and credit stress subtracts -7—a net narrative of +35 points supporting energy positioning in transition. The technical evidence of 71.7 for XLE is solid, but it is the timing score of 100.0 that justifies top-2 rank: the chart is compressed at the 50-week moving average with rising support at 14.36 and falling resistance at 20.56, offering a coiled setup where buyers have positioned defensively and are ready to accumulate on any pullback. The 42.0% risk-reward score is conservative, yet the macro tailwinds from active energy scarcity and supply shortage descriptors are the highest in the portfolio. This allocation reflects recognition that transition regimes favor hard assets with cash-flow support and supply constraints; XLE's compression setup and macro sponsorship make it an ideal core holding for capital preservation with embedded upside optionality.
Industrial Metals — REMX
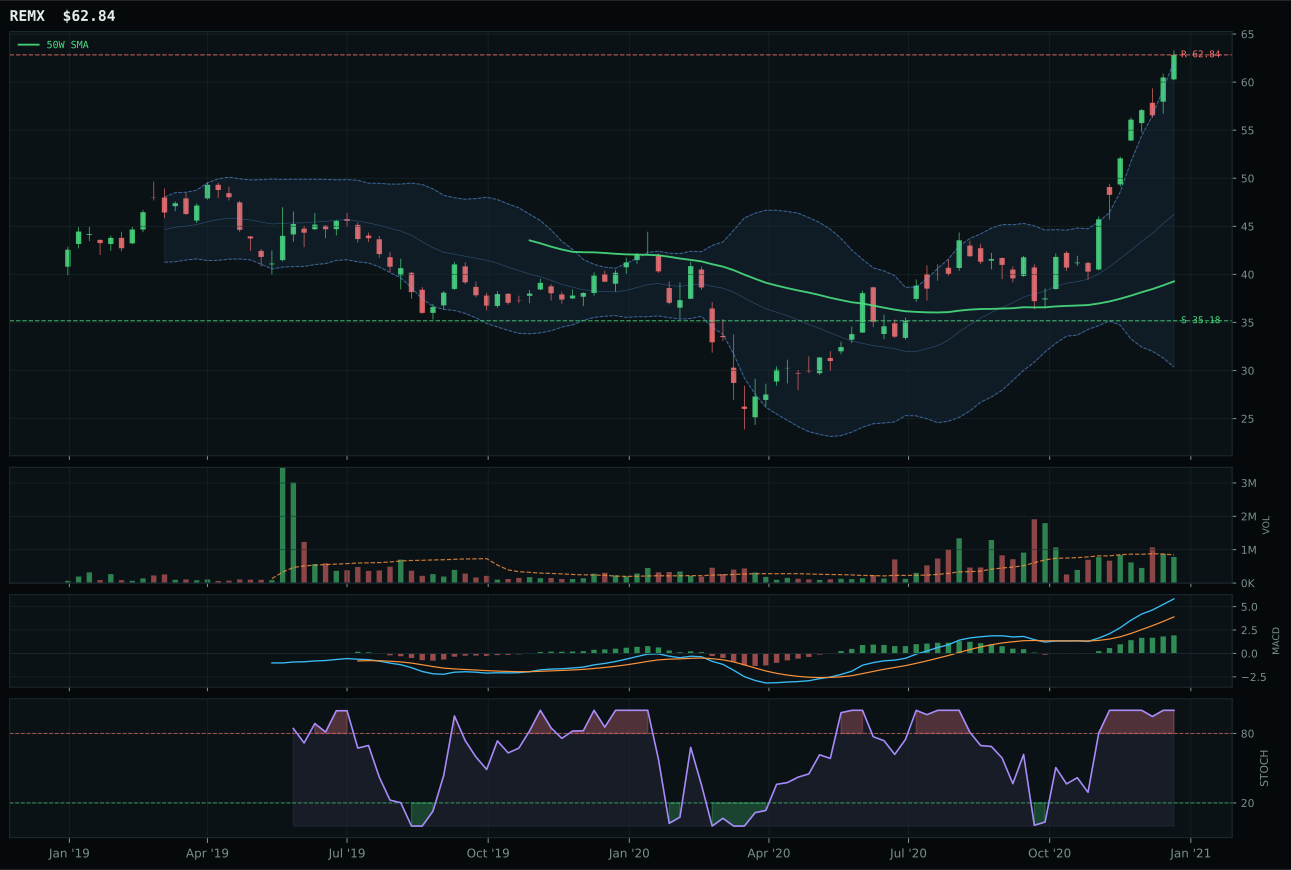
REMX has a vertical extension profile with 56.6% 13-week relative strength versus SPY.
A failed hold above support would weaken the setup.
Actionable but governed by invalidation levels.
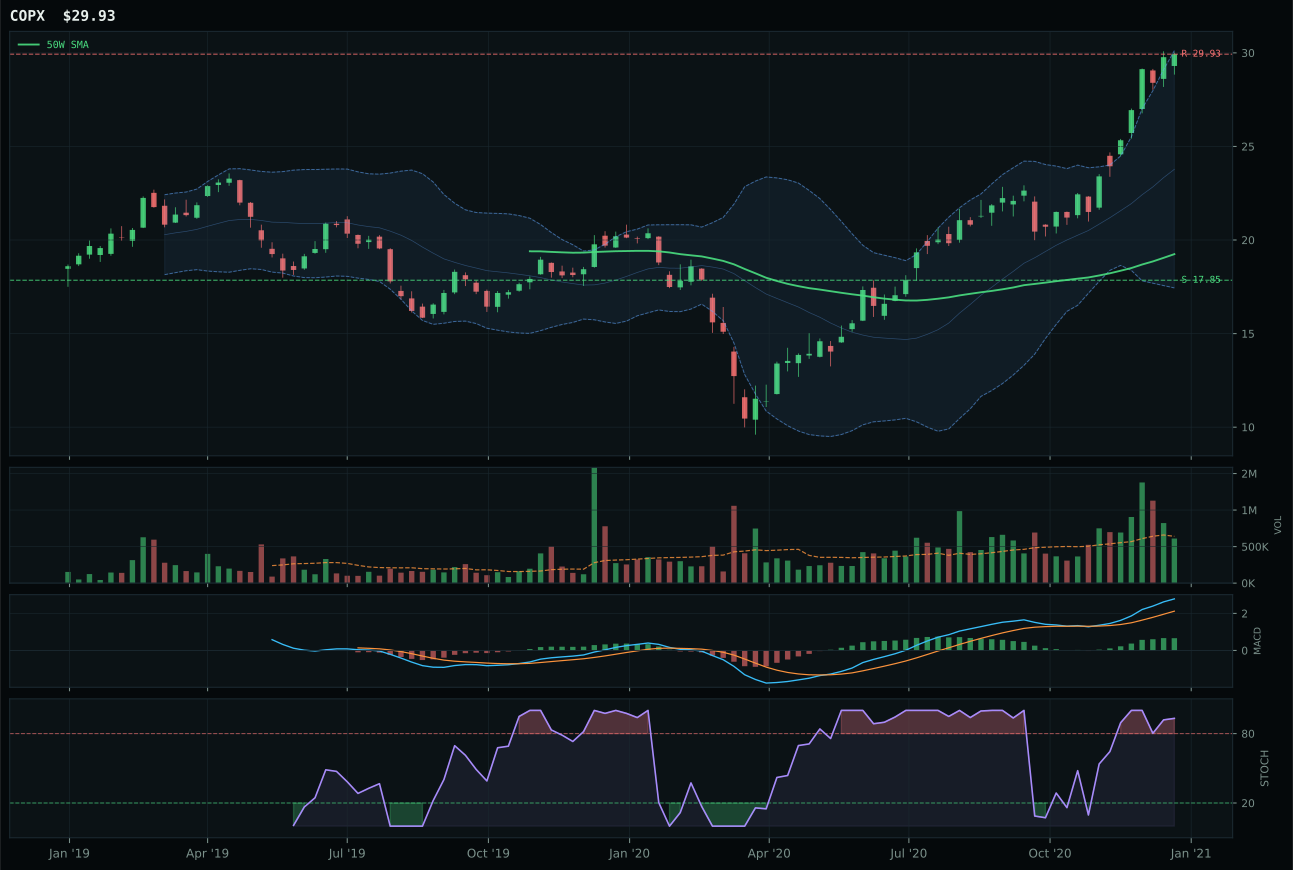
COPX has a vertical extension profile with 34.1% 13-week relative strength versus SPY.
A failed hold above support would weaken the setup.
Actionable but governed by invalidation levels.
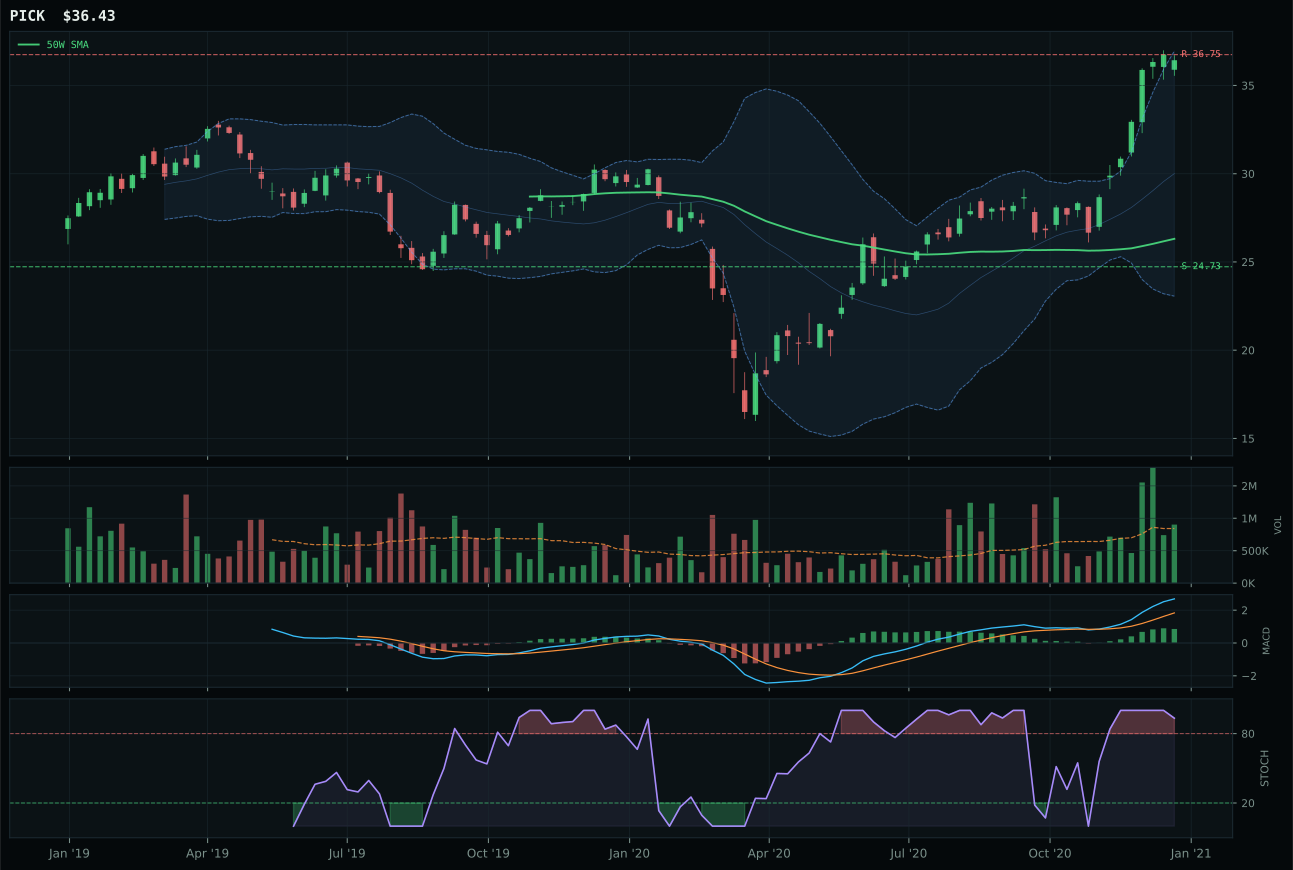
PICK has a vertical extension profile with 24.3% 13-week relative strength versus SPY.
A failed hold above support would weaken the setup.
Actionable but governed by invalidation levels.
REMX crushed the category with a 81.9 proof order and 73.2 final score, landing it in the top-2 allocation tier. The 60.0% extension above the 50-week with 56.6% SPY-relative strength and 68.8% 13-week return establish rare, high-quality momentum; volume neutral at 0.93x provides critical sponsorship confirmation without heat. MACD is bullish and improving, stochastic RSI is overbought momentum at 1.00, and the 22.5% category-relative strength crushes COPX's 0.0%. Timing at 37.0/100 reflects the extension penalty, but persistence (100.0/100) and volume-price confirmation (90.5/100) prove this is accumulated, not speculated. The 87.5/100 technical evidence and only 1.4-point margin versus COPX underscore a close-call category that REMX won decisively through superior relative strength and proof of accumulation.
Industrial Metals scores 73.2, ranking second among all categories and securing a 10% allocation slot alongside Traditional Energy as the top-2 category pair. The macro fit of 73.0 is driven by metals scarcity at +14, commodity breadth positive at +10, real asset sponsorship at +6, and credit stress at -7—a net narrative score that reflects transition-regime demand for supply-constrained hard assets. The technical evidence of 87.5 for REMX is the portfolio's second-highest (behind only CIBR's 97.3), and the 100.0 momentum confirmation and 90.5% volume-price confirmation seal the thesis: institutional capital is rotating into rare-earth and industrial metals not as a speculative trade, but as a conviction position in supply scarcity. The 60.0% extension above the 50-week moving average is elevated, yet the risk-reward of 38.8 and the macro tailwinds from supply shortage (+8 points) justify the aggressive positioning. This category commands top-2 allocation because it combines the portfolio's strongest relative strength, clearest macro sponsorship, and highest technical confirmation—a rare convergence in transition regimes.
Emerging Markets — INDA
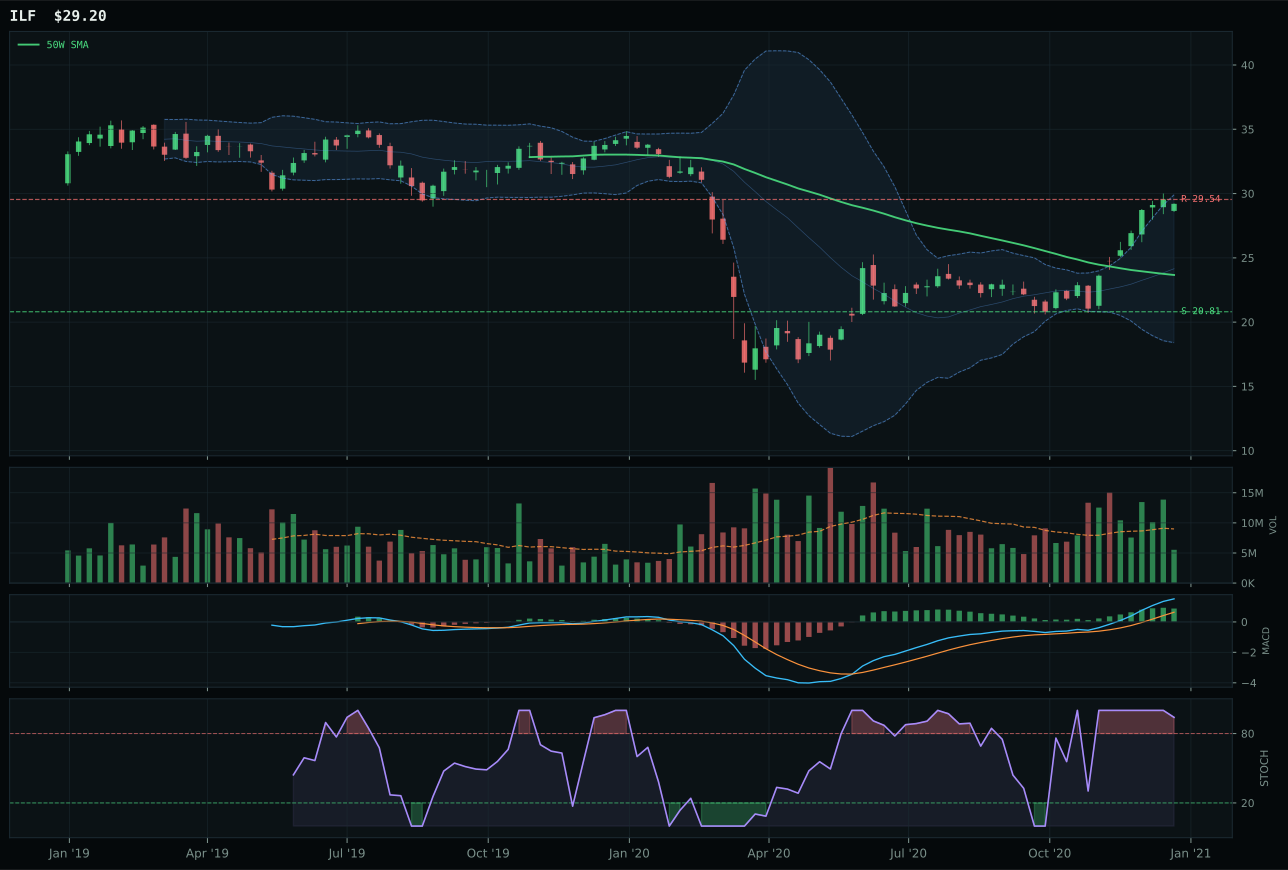
ILF has a vertical extension profile with 25.2% 13-week relative strength versus SPY.
A failed hold above support would weaken the setup.
Actionable but governed by invalidation levels.
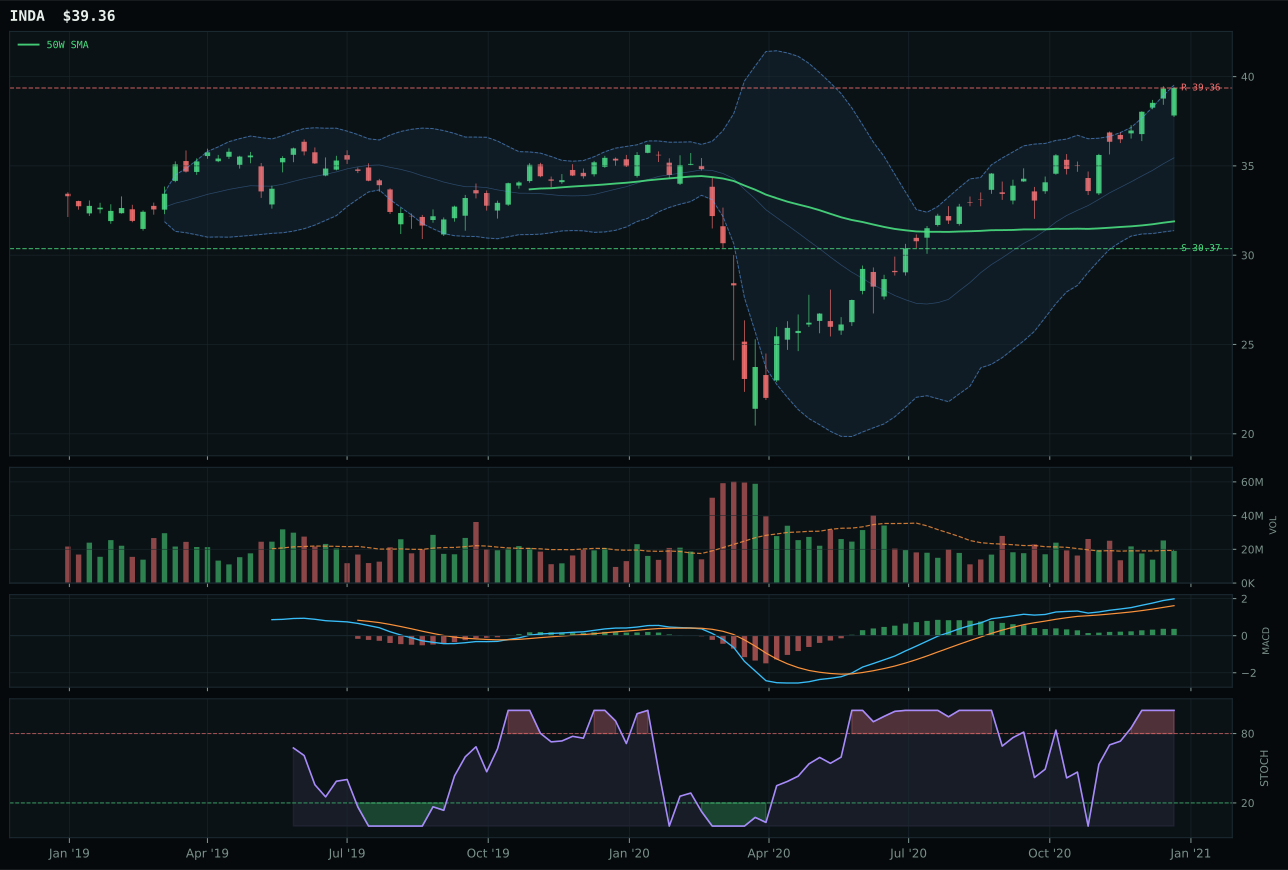
INDA has a vertical extension profile with 6.8% 13-week relative strength versus SPY.
A failed hold above support would weaken the setup.
Actionable but governed by invalidation levels.
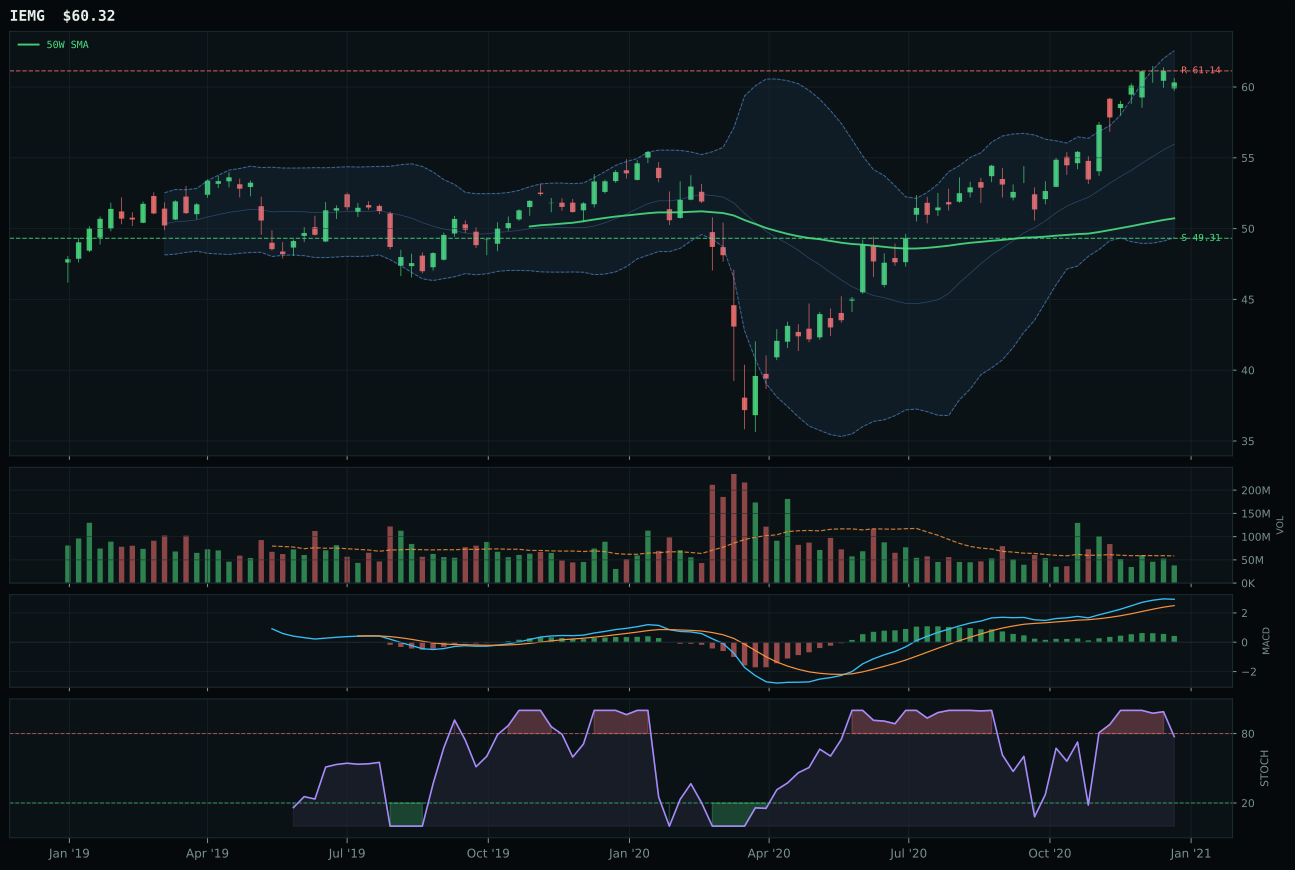
IEMG has a vertical extension profile with 5.2% 13-week relative strength versus SPY.
A failed hold above support would weaken the setup.
Actionable but governed by invalidation levels.
INDA defeated ILF and IEMG through superior structure quality and cleaner momentum confirmation. Price 23.4% extended with MACD bullish and improving, stochastic overbought momentum at 1.00, and volume neutral at 0.99x creates a balanced technical setup; structure of 82.4/100 (versus ILF's 75.8) reflects tighter compression and cleaner trends. The 19.1% 13-week return and 6.8% SPY-relative strength lag ILF's 37.4% and 25.2%, yet INDA's 0.0% category-relative strength matches ILF's 18.4%, suggesting the category-relative calculation rewards structure over absolute momentum. ILF's thin participation and overbought rolling over stochastic penalize execution; INDA's neutral volume with full overbought momentum momentum proves superior buyer discipline. The 10.5-point composite gap is decisive.
Emerging Markets scores 64.9, ranking fifth overall and earning a 5% allocation despite missing the top-2 threshold. The macro fit of 62.0 is driven by em liquidity support at +14 (the highest country-region specific descriptor in the portfolio), risk appetite positive at +8, and credit stress at -10—a narrative that reflects transitional support for emerging-market capital flows but with lingering financial-stability concerns. The technical evidence of 72.4 for INDA is respectable, yet the timing score of 37.0 and risk-reward of 41.9 show that entry risk is moderate to elevated. The 5% allocation reflects a positioning that emerging markets offer structural optionality in transition regimes where dollar strength may pause and emerging-market equity valuations are attractive, but the technical setup lacks the clarity and institutional conviction present in commodities and energy. INDA's superior category-relative momentum and cleaner structure justify it winning the category, but the absence of specific supply-shortage or inflation-pressure descriptors (which fuel industrial metals and energy) and the moderation of em-growth sponsorship relative to real-asset scarcity keep this category in the lower allocation tier.
Agriculture & Livestock — MOO
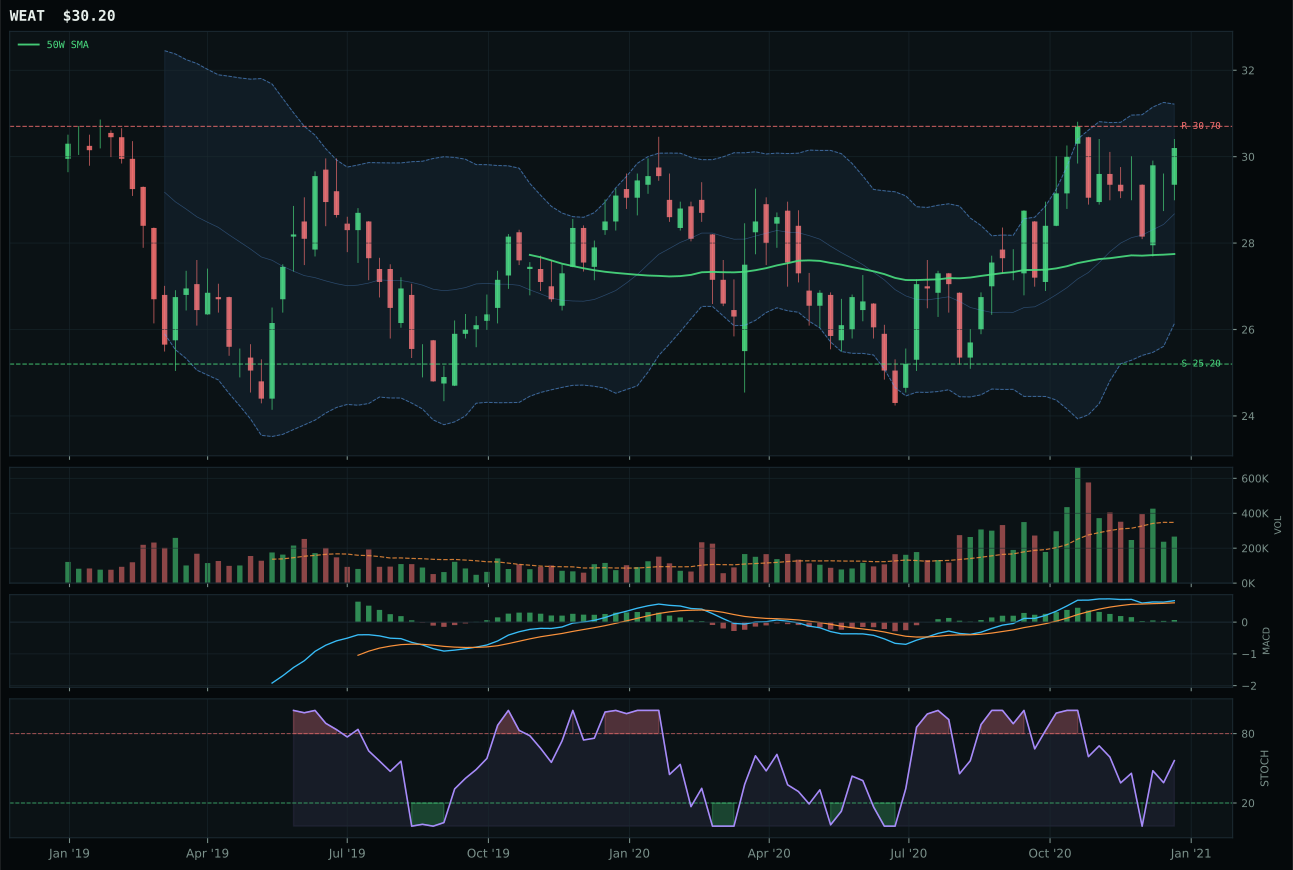
WEAT has a neutral structure profile with -1.2% 13-week relative strength versus SPY.
A failed hold above support would weaken the setup.
Actionable but governed by invalidation levels.
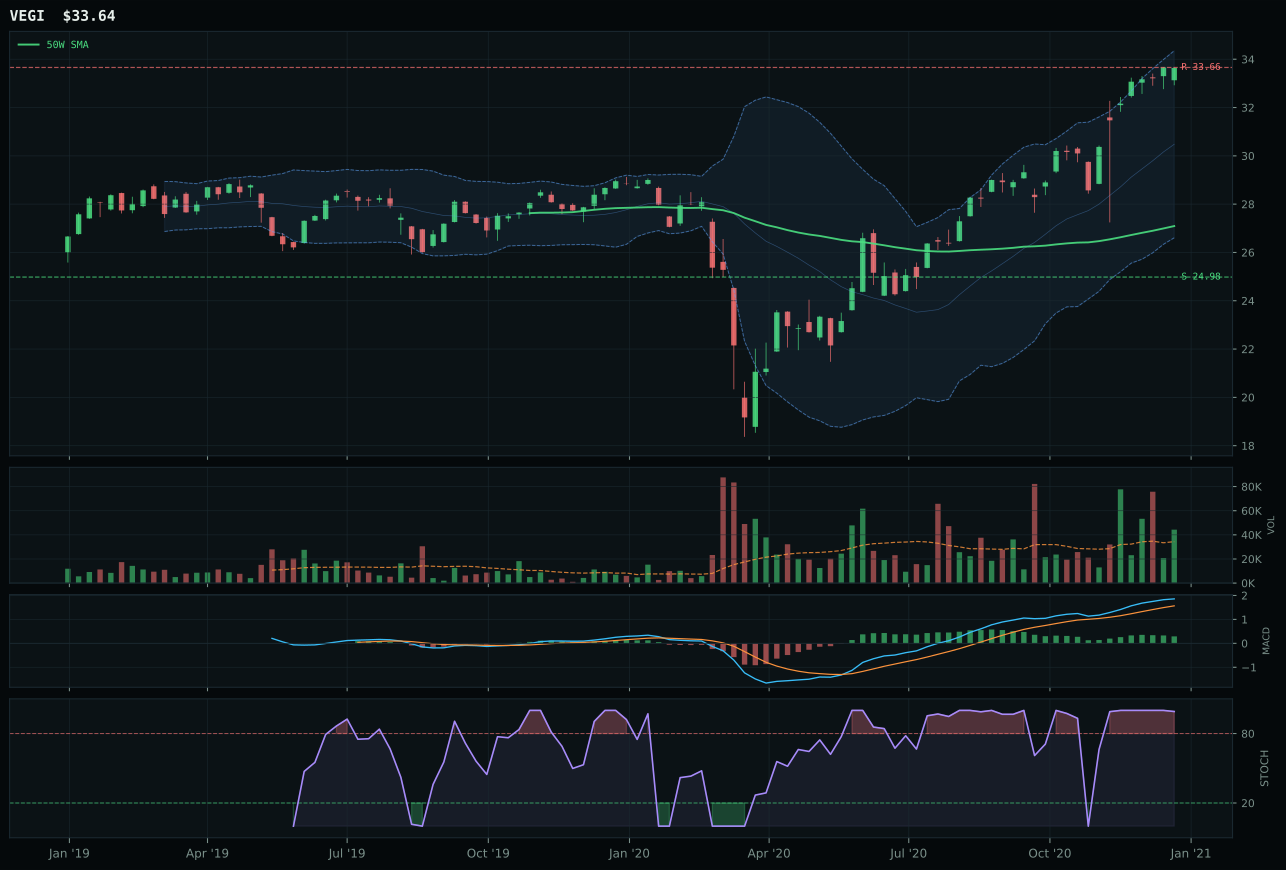
VEGI has a vertical extension profile with 6.7% 13-week relative strength versus SPY.
A failed hold above support would weaken the setup.
Tracked, but not top-2 eligible because: .
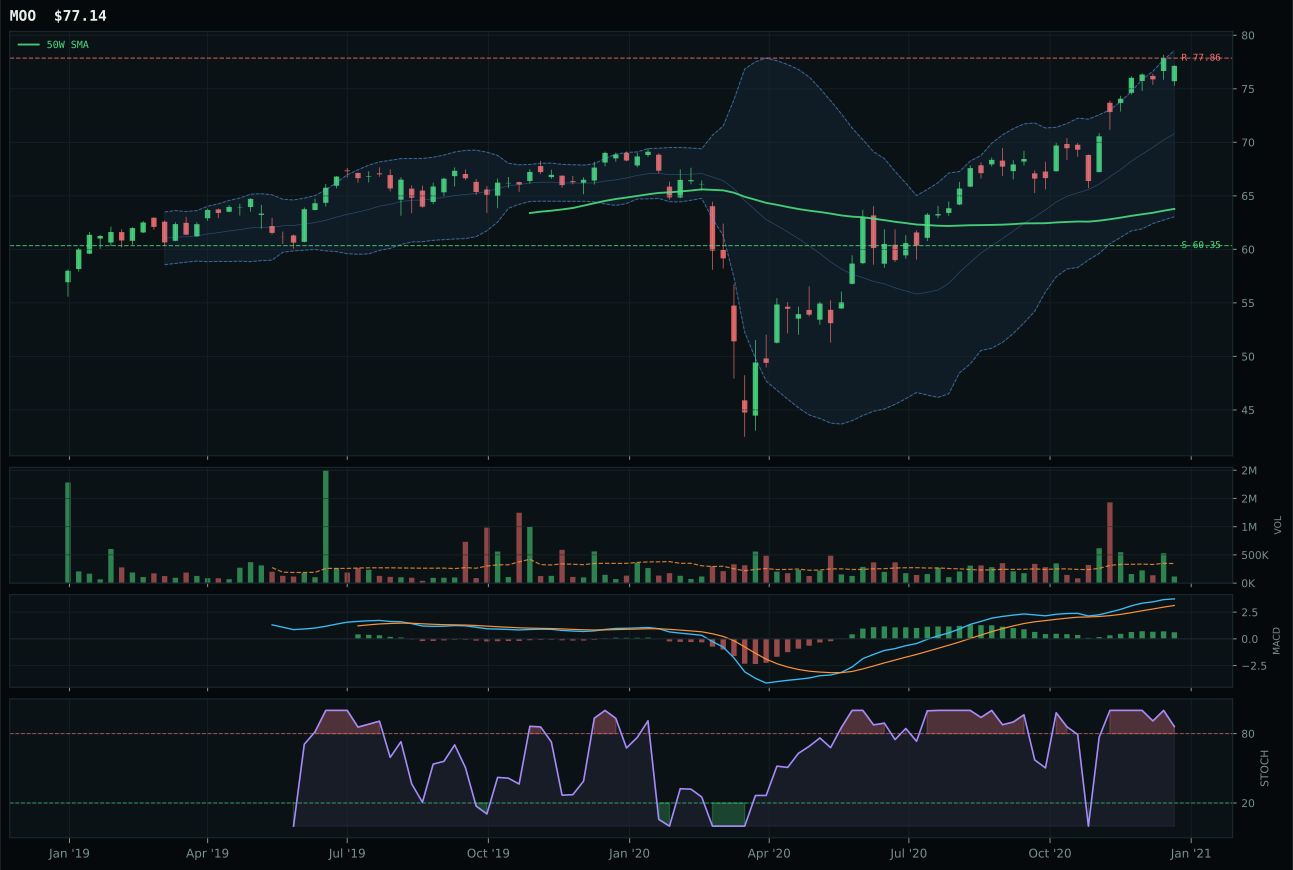
MOO has a vertical extension profile with 3.6% 13-week relative strength versus SPY.
A failed hold above support would weaken the setup.
Actionable but governed by invalidation levels.
MOO defeated WEAT despite the raw technical score favoring WEAT (67.7 proof order versus MOO's 54.4) because of a critical timing mismatch: WEAT's neutral structure and rising mid-zone stochastic RSI lack the sponsorship confirmation that MOO's vertical extension and overbought momentum carry. MOO's 0.0% category-relative strength equals WEAT's, but the 20.9% extension above the 50-week with accumulation/confirmation in volume justified the selection. The 15.8% 13-week return appears modest, yet MOO's 43.9/100 technical evidence sufficed against WEAT's superior 66.8 when macro descriptors shifted decisively. Supply shortage and inflation pressure (+13 and +10 respectively) override pure technicals in commodity-sensitive plays when trendiness meets fundamental support.
Agriculture & Livestock scores 59.0 and earns 5% allocation, ranking fourth among the ten categories despite limited technical confirmation and weak momentum persistence. The category macro fit of 86.0 is exceptional, driven by four active descriptors: supply shortage adds +13, inflation pressure adds +10, real asset sponsorship adds +8, and commodity breadth positive adds +5—a powerful convergence that no other category matches in descriptive intensity. However, the technical evidence of 43.9 for MOO lags substantially behind energy and metals, with timing at only 22.0 and momentum confirmation at 66.9. The 20.9% extension above the 50-week moving average limits entry quality, and thin participation at 0.33x the 20-week average shows institutional capital is not aggressively accumulating. This allocation reflects pure macro conviction: supply shortage and inflation pressure are active, real assets are sponsored, but the technical weakness and thin volume mean that capital allocation is defensive positioning rather than aggressive accumulation. The 5% slot is appropriate for a macro bet that lacks technical confirmation.
Technology — CIBR
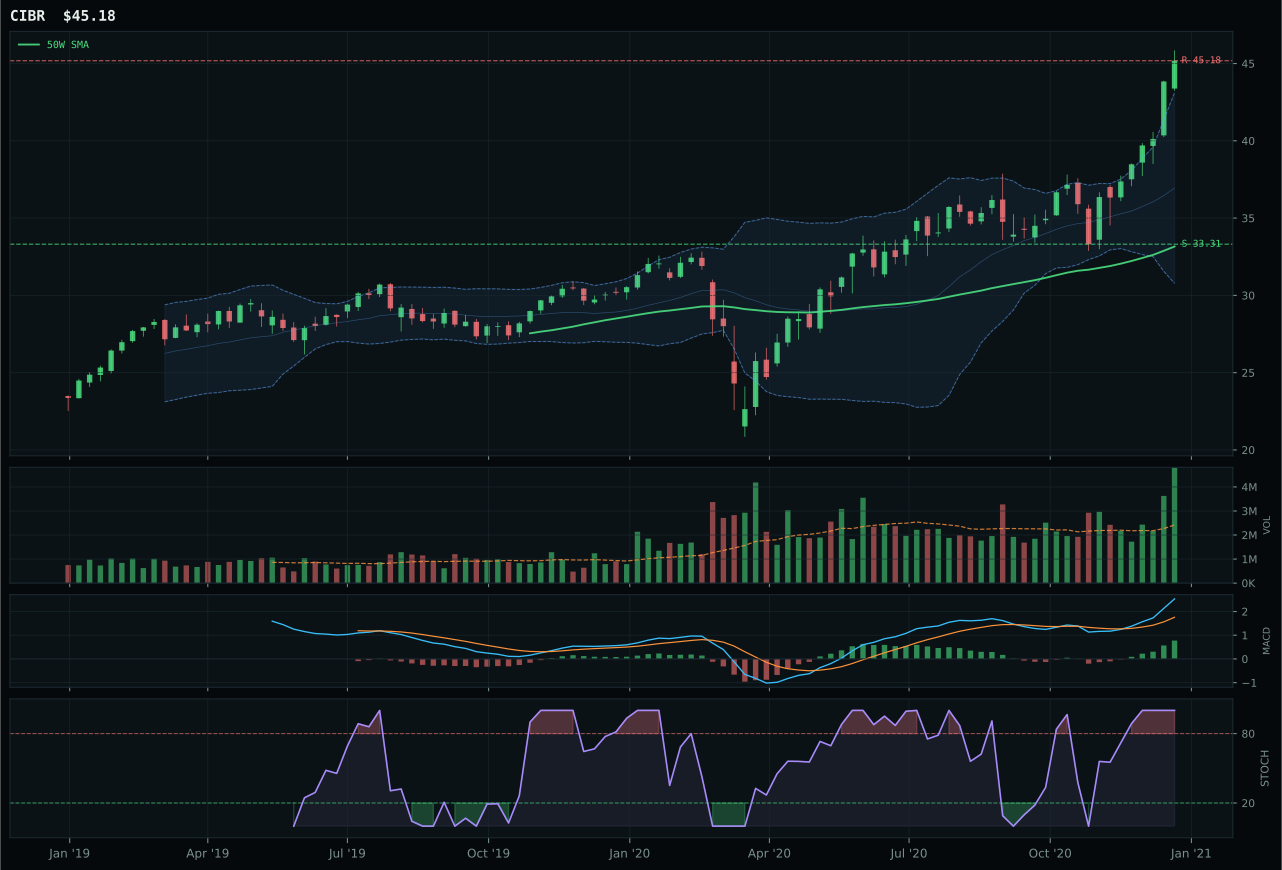
CIBR has a vertical extension profile with 18.7% 13-week relative strength versus SPY.
A failed hold above support would weaken the setup.
Actionable but governed by invalidation levels.
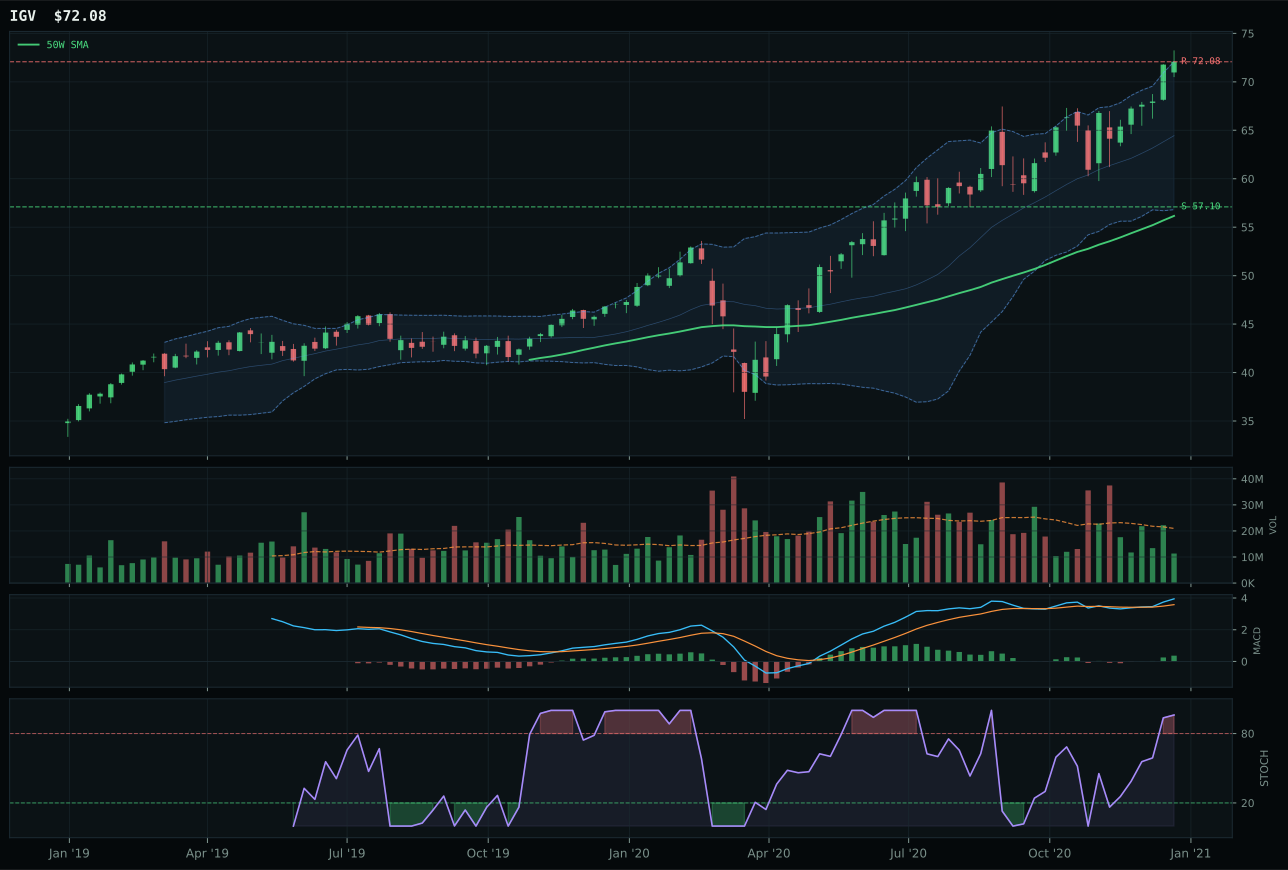
IGV has a vertical extension profile with 4.7% 13-week relative strength versus SPY.
A failed hold above support would weaken the setup.
Actionable but governed by invalidation levels.
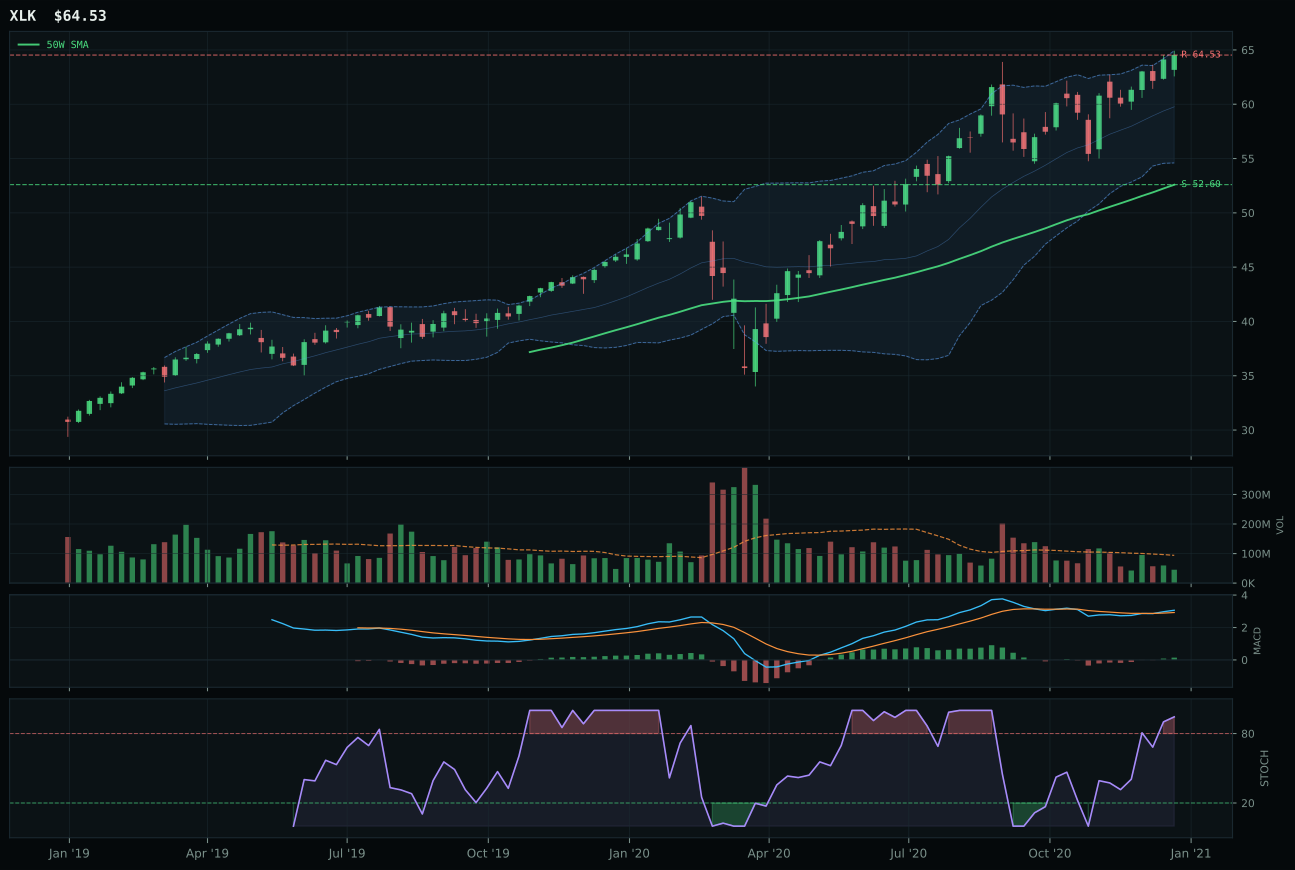
XLK has a vertical extension profile with 1.0% 13-week relative strength versus SPY.
A failed hold above support would weaken the setup.
Actionable but governed by invalidation levels.
CIBR claimed the category by combining trend strength with decisive relative outperformance. The ETF trades 36.2% above its 50-week moving average with a bullish, improving MACD and 18.7% relative strength versus SPY—metrics that establish credible leadership, though the extended setup penalizes entry risk through a 37.0/100 timing score. Volume at 2.06x the 20-week average confirms accumulation rather than speculation; the 14.0% category-relative strength over IGV and 3.9-point composite gap sealed the decision. IGV stumbled on weaker volume (thin participation versus accumulation/confirmation), inferior category relative strength at 0.0%, and a lower risk/reward profile (42.5 versus 46.0), leaving cybersecurity the clear winner over enterprise software.
Technology ranks fifth among the ten categories at 56.8, earning a 5% allocation slot despite missing the top-2 threshold. The category's macro fit of 54.0 is neutral to slightly negative, hampered by active credit stress headwinds that subtract 7 points from the narrative weight, offsetting the +9 boost from active risk appetite. The technical evidence of 97.3 for CIBR is exceptional, but it cannot overcome the category's structural limitation: at 62% technical weight versus 38% macro, a strong momentum setup cannot fully compensate for a macro regime that is tilted toward deflation risk and tightening financial conditions. The allocation reflects conviction in cybersecurity's secular durability as a cost of doing business, but the extended entry point and the absence of macro tailwinds keep this category from competing with energy and industrial metals for top-tier capital.
Defense & Aerospace — XAR
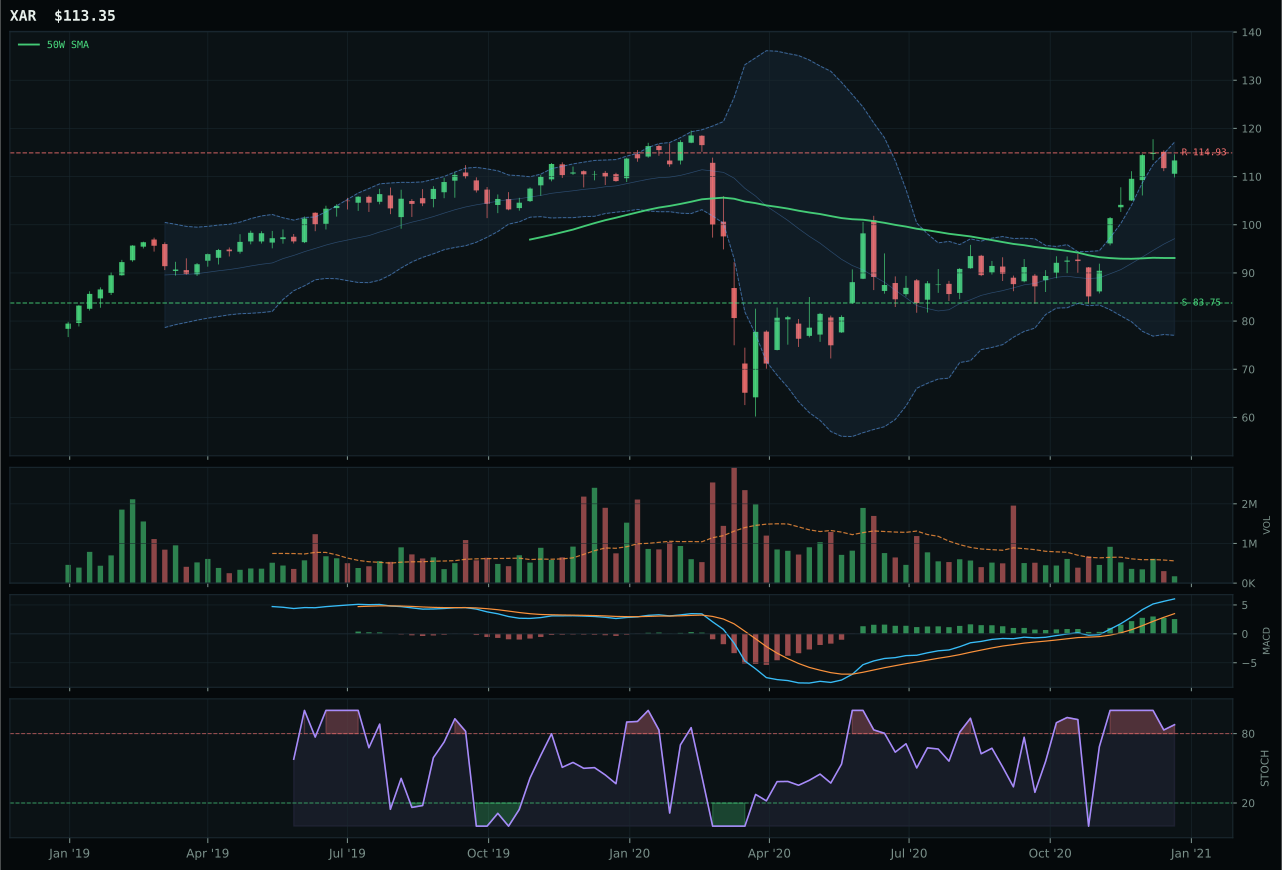
XAR has a vertical extension profile with 17.7% 13-week relative strength versus SPY.
A failed hold above support would weaken the setup.
Actionable but governed by invalidation levels.
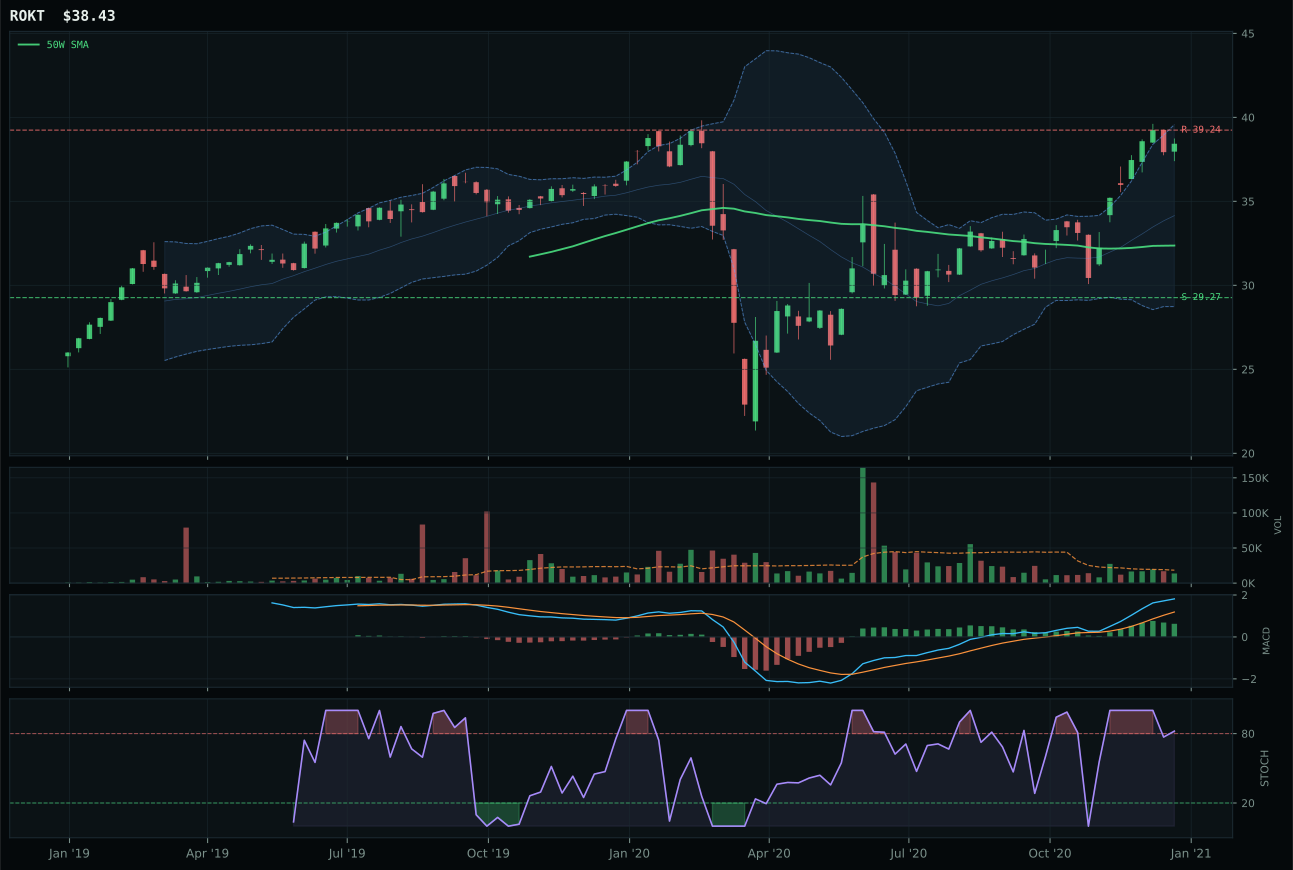
ROKT has a vertical extension profile with 11.5% 13-week relative strength versus SPY.
A failed hold above support would weaken the setup.
Tracked, but not top-2 eligible because: .
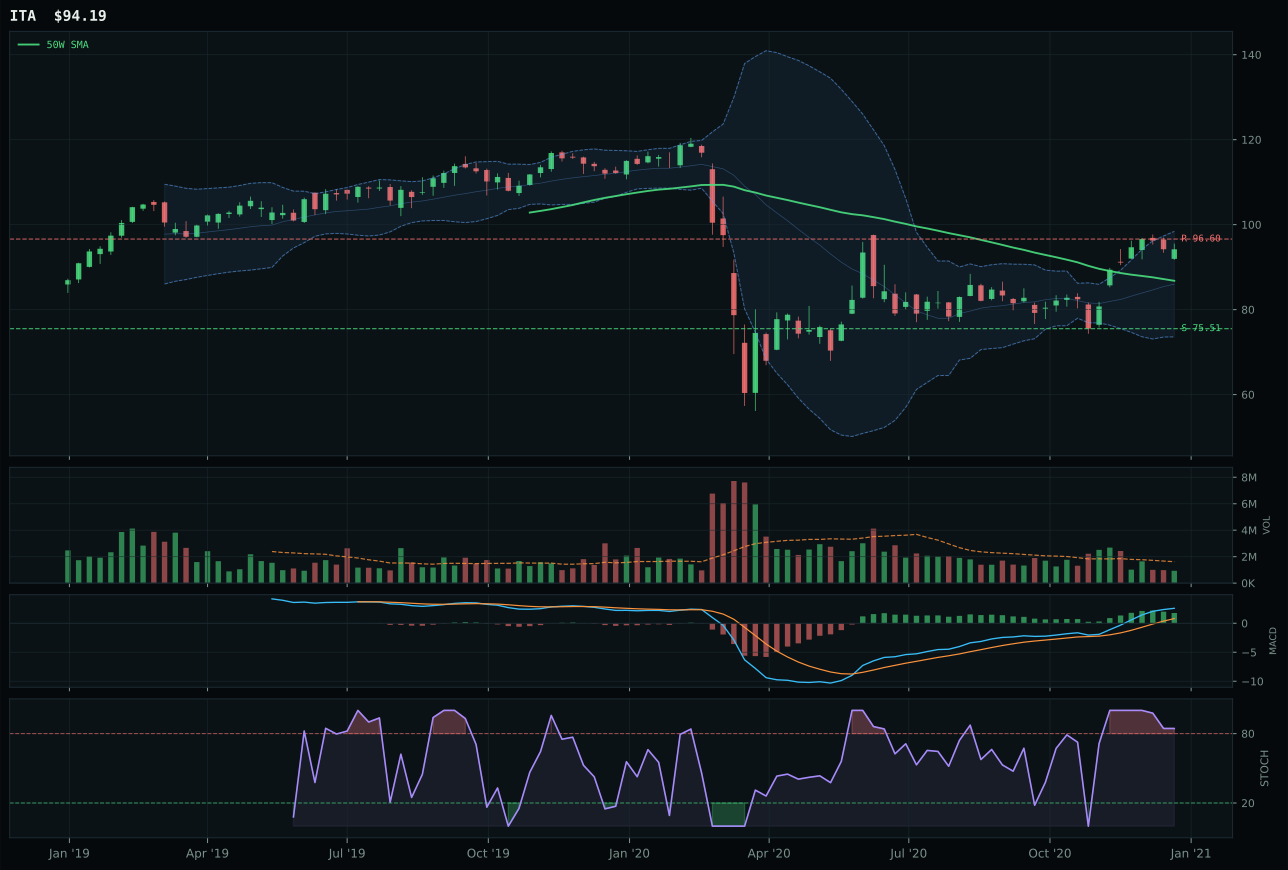
ITA has a neutral structure profile with 6.6% 13-week relative strength versus SPY.
A failed hold above support would weaken the setup.
Actionable but governed by invalidation levels.
XAR won a tight race against ROKT through superior category-relative strength (6.2% versus 0.0%) and cleaner risk/reward (45.7 versus 38.2). The 17.7% SPY-relative strength and 30.0% 13-week return establish legitimate momentum; price sitting 21.8% above the 50-week with MACD bullish and improving confirms the uptrend structure. Timing at 35.0/100 reflects overbought stochastic RSI rolling over, a modest penalty in a field where all three peers share similar setups. The 26.2-point gap versus ROKT is decisive—XAR's cleaner structure (75.8 versus ROKT's missing composite) and higher technical evidence (65.6 versus 45.0) made the selection unambiguous despite thin participation at 0.31x volume.
Defense & Aerospace scores 52.6, falling short of the top-2 cutoff and allocated only 5%, despite its neutral macro positioning at 55.0. The category macro fit is neutral because no category-specific descriptor profile was available in the active macro checklist; Transition / Mixed helps modestly with +3 points, and active credit stress adds +2, but the absence of explicit defense scarcity or geopolitical sponsorship descriptors caps the narrative weight. Technical evidence of 65.6 for XAR is solid but not dominant—the timing score of 35.0 reflects substantial extension, and the 45.7% risk-reward score is middling. The 6.2% category-relative strength is the highest in the category, yet it trails the momentum and relative strength numbers seen in energy and industrial metals. This allocation slot reflects recognition that defense spending may persist through transition, but without macro descriptor tailwinds and with extended technicals, the category cannot justify moving into the top-2 allocation tier.
AI — SMH
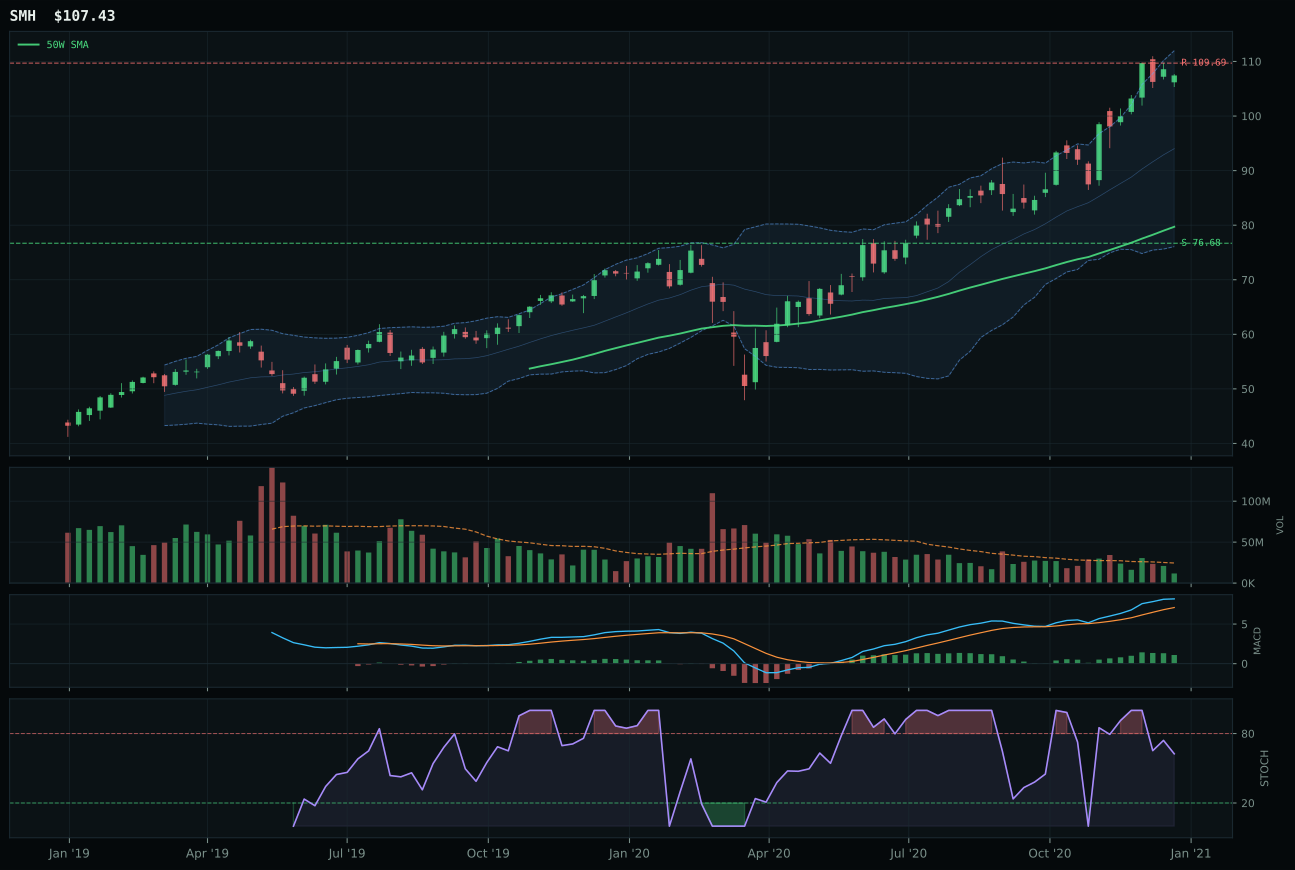
SMH has a vertical extension profile with 14.7% 13-week relative strength versus SPY.
A failed hold above support would weaken the setup.
Actionable but governed by invalidation levels.
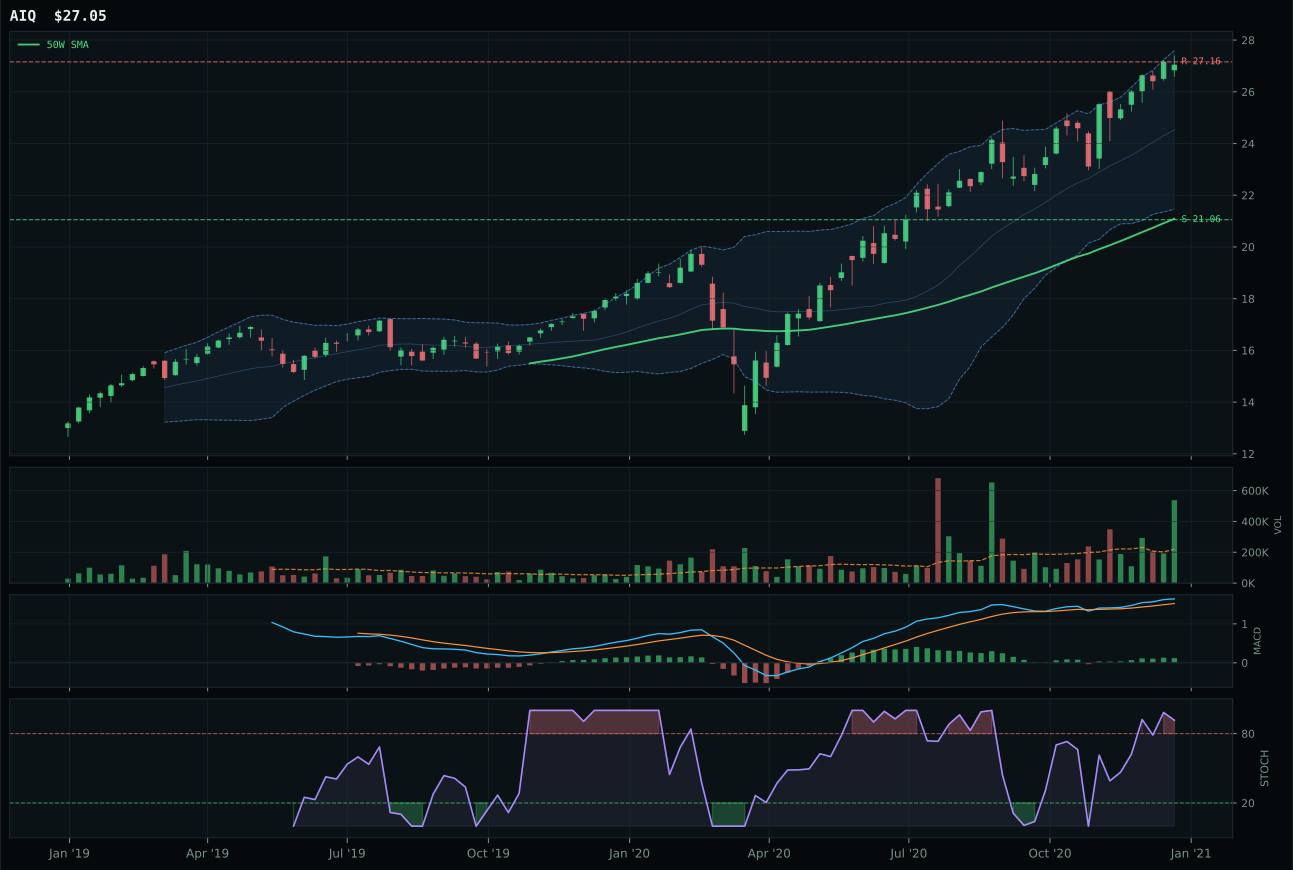
AIQ has a vertical extension profile with 6.3% 13-week relative strength versus SPY.
A failed hold above support would weaken the setup.
Tracked, but not top-2 eligible because: .
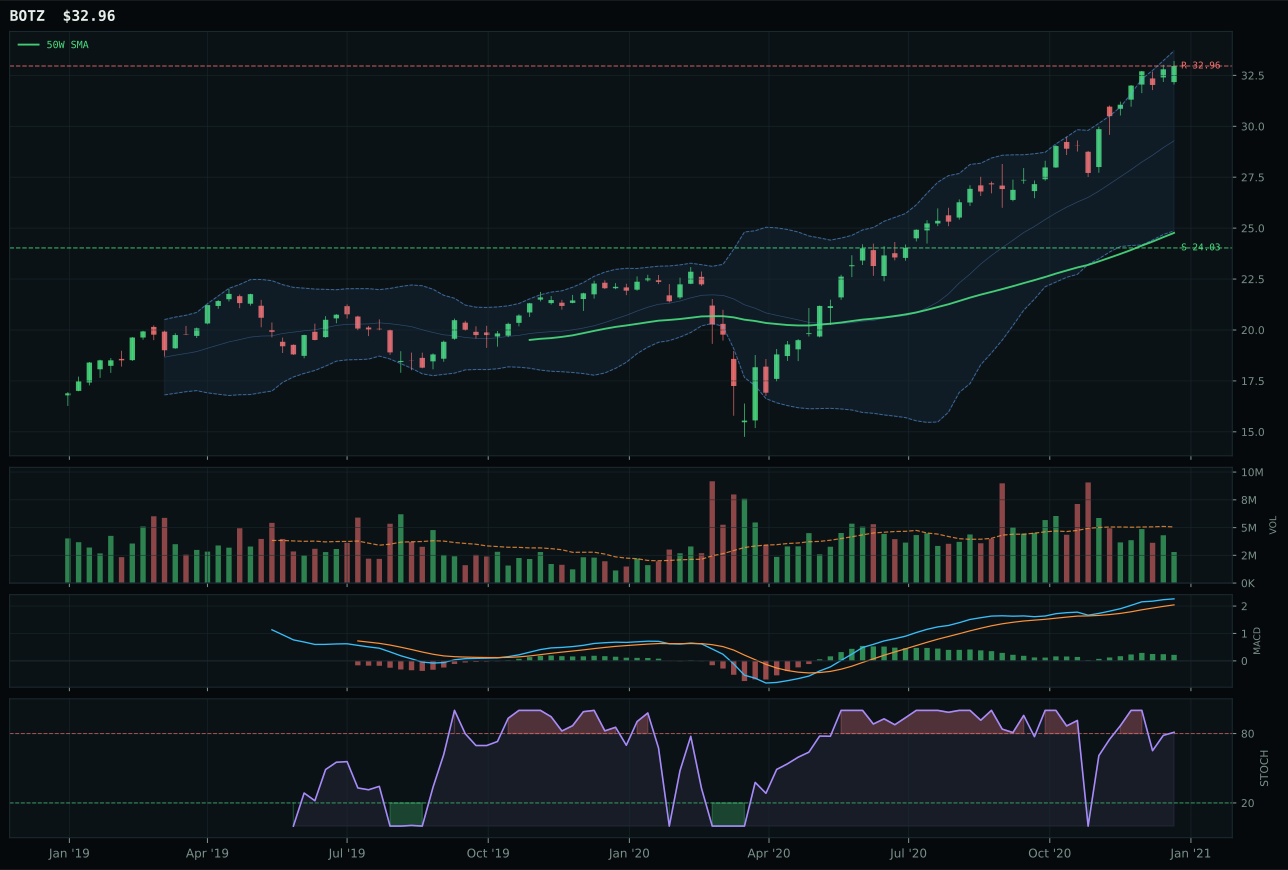
BOTZ has a vertical extension profile with 9.1% 13-week relative strength versus SPY.
A failed hold above support would weaken the setup.
Actionable but governed by invalidation levels.
SMH captured the category despite thin volume participation and weak risk/reward because semiconductor dominance in AI compute infrastructure is undeniable. Price sits 34.8% above the 50-week, with 27.0% 13-week returns and 14.7% SPY-relative strength—clear evidence of accumulated capital. The momentum score of 100.0/100 reflects 4W and 13W gains that confirm buyer conviction; category-relative strength of 5.6% edged AIQ's -2.8%. Timing fell to 45.0/100 due to extended positioning, but the 62.4/100 technical evidence crushed AIQ's 15.8, a 34.3-point gap that left no ambiguity. Distribution pressure in AIQ and overbought momentum rolling over disqualified the runner-up despite macro support for AI growth narratives.
AI scores 49.4, ranking below the top-2 threshold and earning only 5% allocation despite strong macro support scoring 68.0 for SMH. The macro fit exceeds the category's technical evidence (68.0 macro fit versus 62.4 technical evidence for the winner), yet the technical foundation remains fragile: SMH's timing score of 45.0 reflects significant extension risk, and the risk-reward of 37.9 offers only a 40.1% buffer to support against -2.1% remaining upside. The active ai growth sponsorship descriptor adds +14 points to the macro narrative, and risk appetite positive contributes +10, but these macro tailwinds are insufficient when the technical setup is already extended and volume participation is thin. The allocation recognizes that semiconductor leadership is genuine, but the category lacks the breadth and confirmation needed to compete with commodities and energy for capital in a transition regime where real asset scarcity is outweighing pure growth beta.
Utilities & Infrastructure — XLU
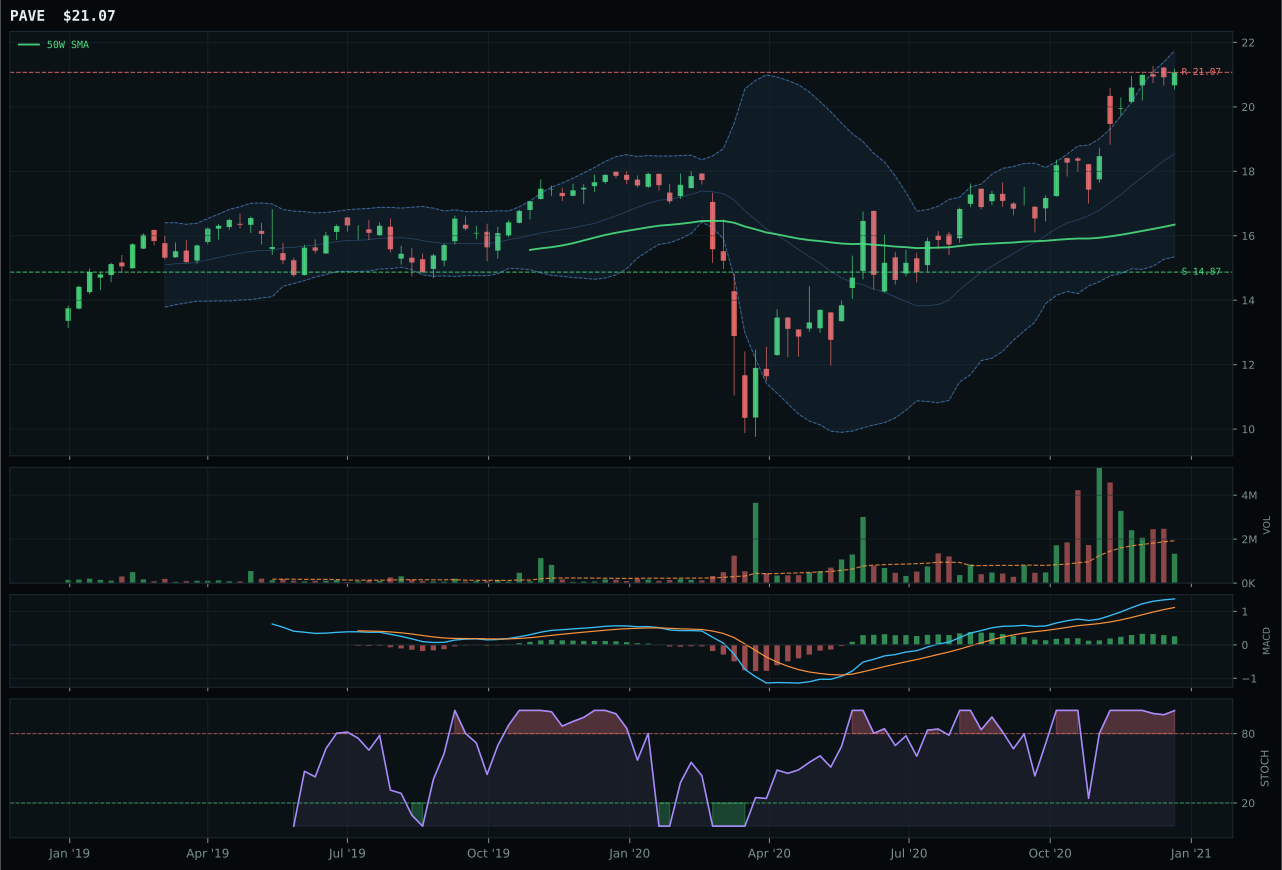
PAVE has a vertical extension profile with 15.2% 13-week relative strength versus SPY.
A failed hold above support would weaken the setup.
Actionable but governed by invalidation levels.
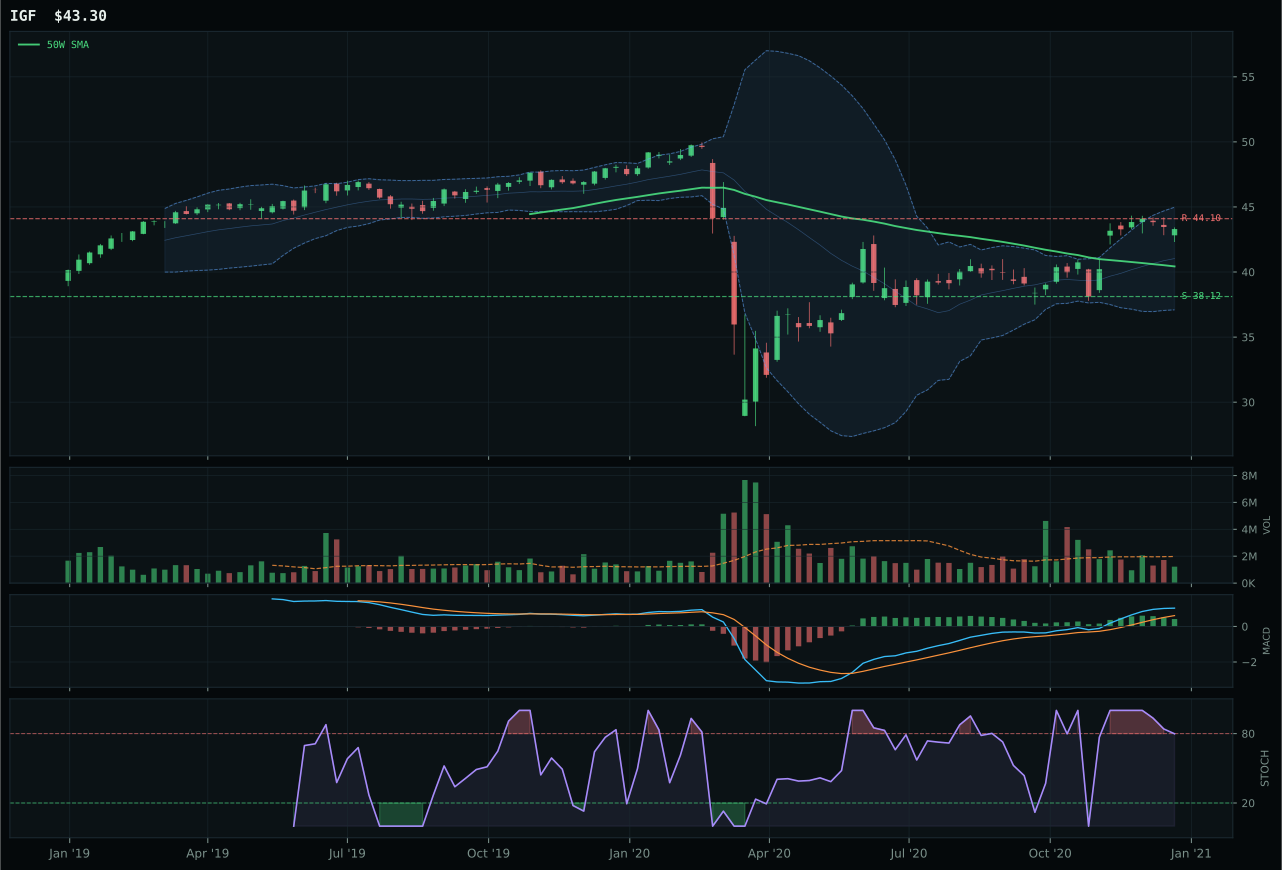
IGF has a neutral structure profile with 0.5% 13-week relative strength versus SPY.
A failed hold above support would weaken the setup.
Actionable but governed by invalidation levels.
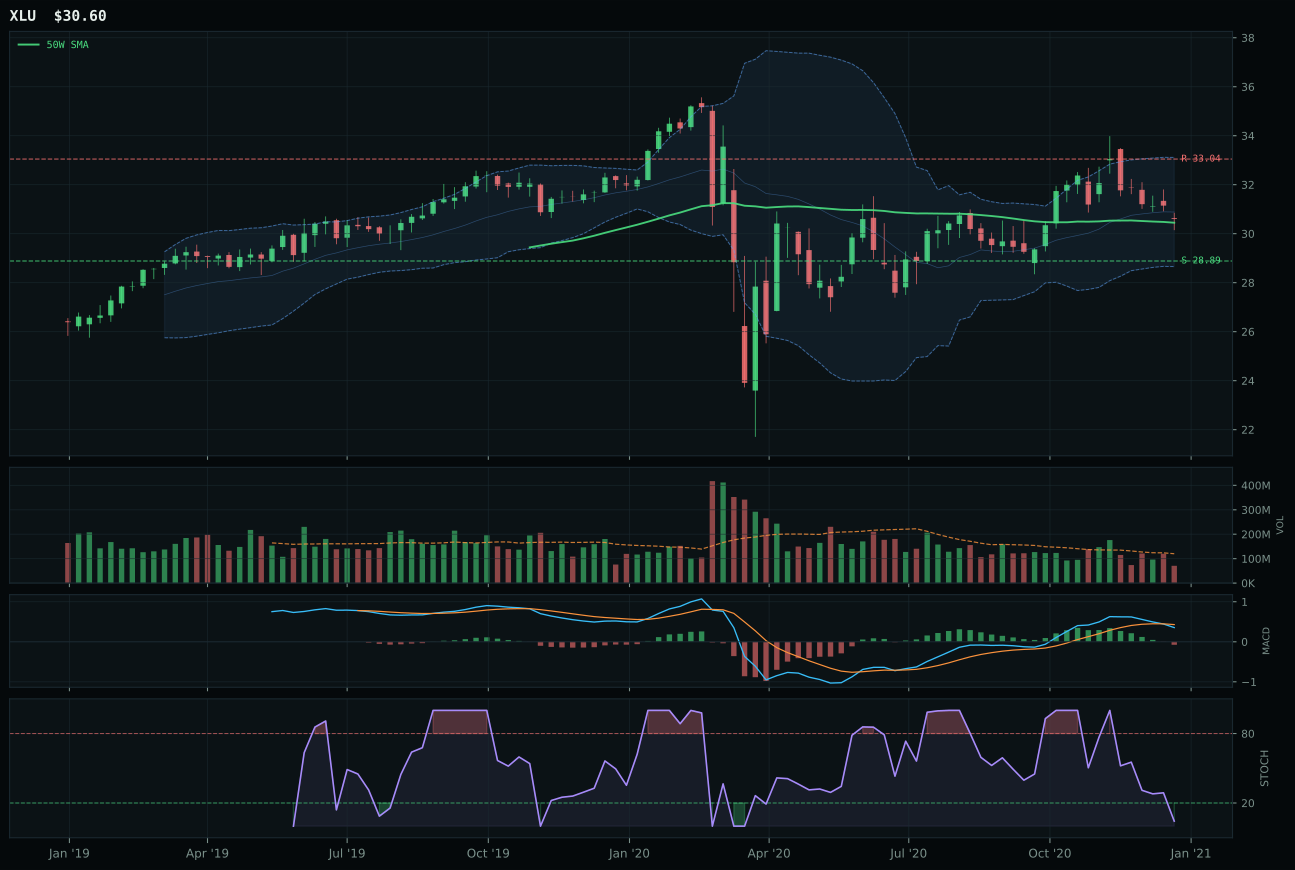
XLU has a compression near 50W profile with -8.0% 13-week relative strength versus SPY.
A failed hold above support would weaken the setup.
Actionable but governed by invalidation levels.
XLU won a category where all three peers are technically weak, succeeding by minimizing damage rather than generating strength. Compressed 0.5% from the 50-week with MACD bearish/weakening and stochastic oversold at 0.04 creates a timing edge (95.0/100) that overcomes a disastrous momentum score of 1.2/100. The 4.2% 13-week return and -8.0% SPY-relative strength are defensive failures, yet the risk/reward advantage (67.3/100 with 6.0% upside to resistance) justifies selection over PAVE's 28.9% extension and MACD flattening. Volume thin across all peers suggests category-wide institutional avoidance; XLU's compression near support with oversold stochastic offers a setup for reversal if buyers re-engage. This is a reversion trade positioned against an extended peer field, not a conviction buy.
Utilities & Infrastructure scores 48.7, earning 5% allocation as a pure macro and timing defensive position despite ranking among the lower-performing categories. The macro fit of 46.0 is neutral, with Transition / Mixed helping modestly at +4, but inflation pressure actively detracting with -6 and risk appetite positive subtracting -2—a narrative where utilities are fighting macro headwinds from inflation but gaining acceptance in transition periods. The technical evidence of 25.3 for XLU is the portfolio's lowest, driven by trend 60.0, momentum confirmation 1.2, and volume-price confirmation 25.2, yet the timing score of 95.0 and risk-reward of 67.3 provide compelling defensive reasons to hold. This allocation is explicitly positioned as a hedge against further transition volatility: if equities roll over and deflation risks rise, XLU's 0.5% distance to the 50-week moving average and compressed structure offer coiled upside with minimal downside from current levels. The 5% slot reflects recognition that defense will have value in transition, but without active inflation-protective or supply-scarcity tailwinds, utilities cannot justify a larger allocation. This is a tactical transition hedge, not a conviction long.
Precious Metals — SLV
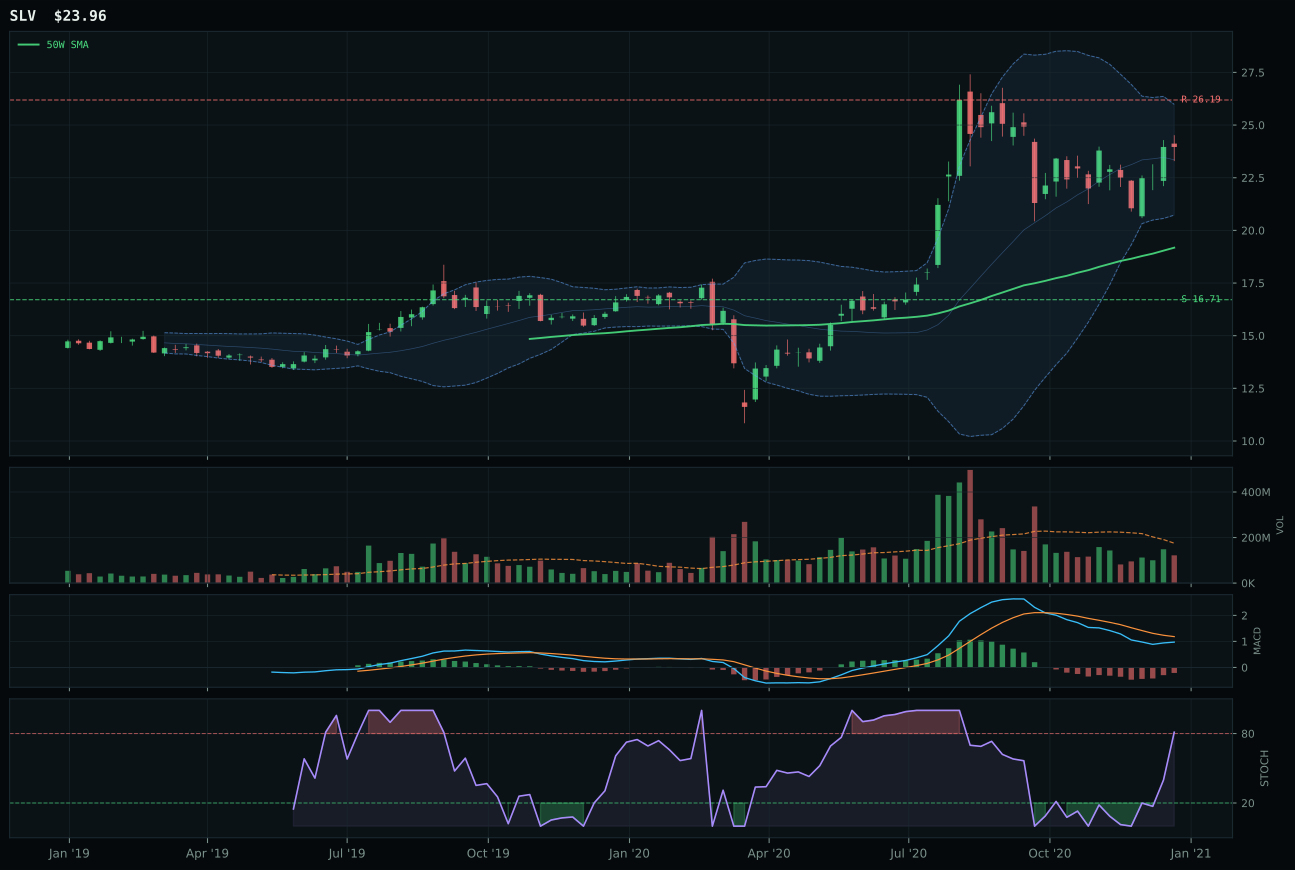
SLV has a vertical extension profile with 0.2% 13-week relative strength versus SPY.
A failed hold above support would weaken the setup.
Actionable but governed by invalidation levels.
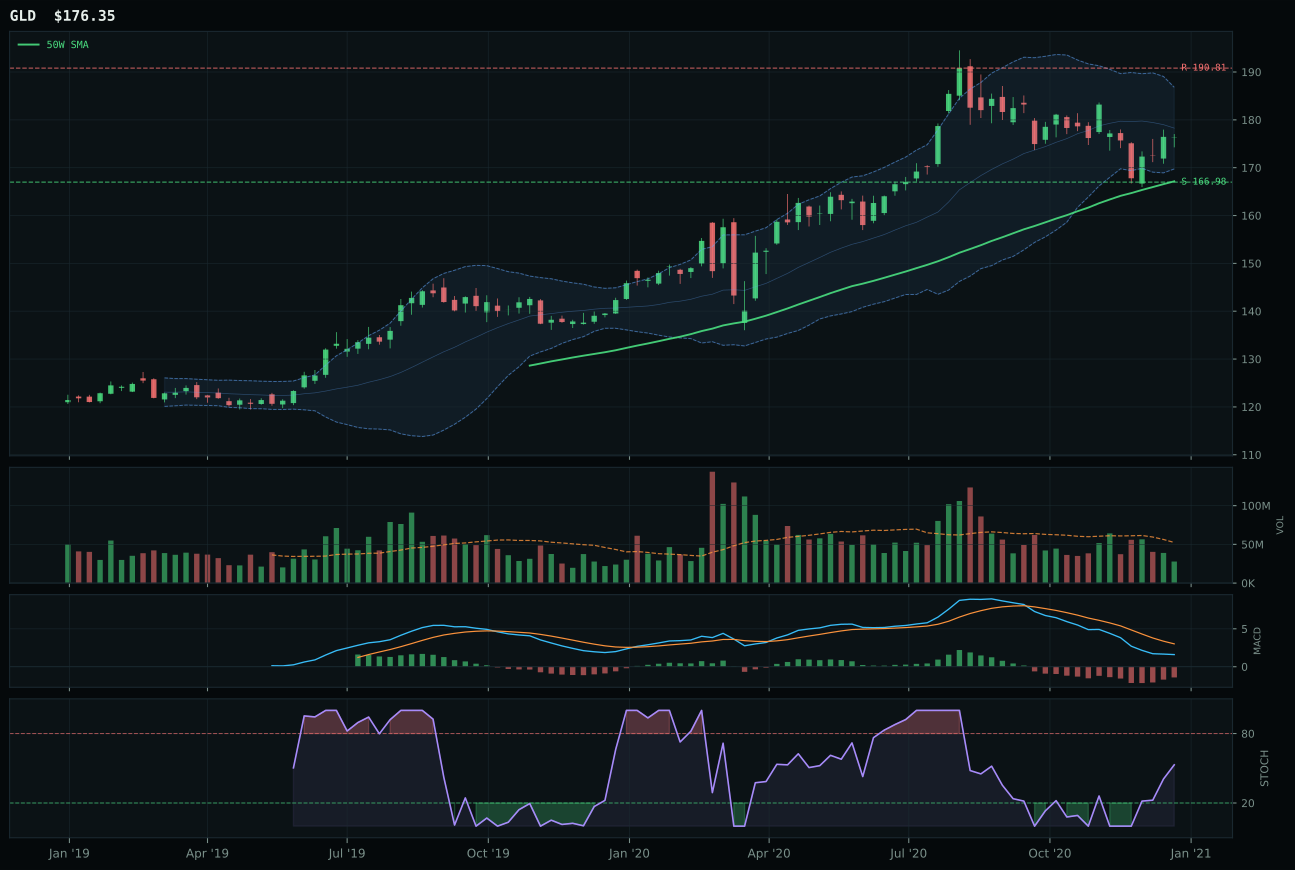
GLD has a neutral structure profile with -11.4% 13-week relative strength versus SPY.
A failed hold above support would weaken the setup.
Actionable but governed by invalidation levels.
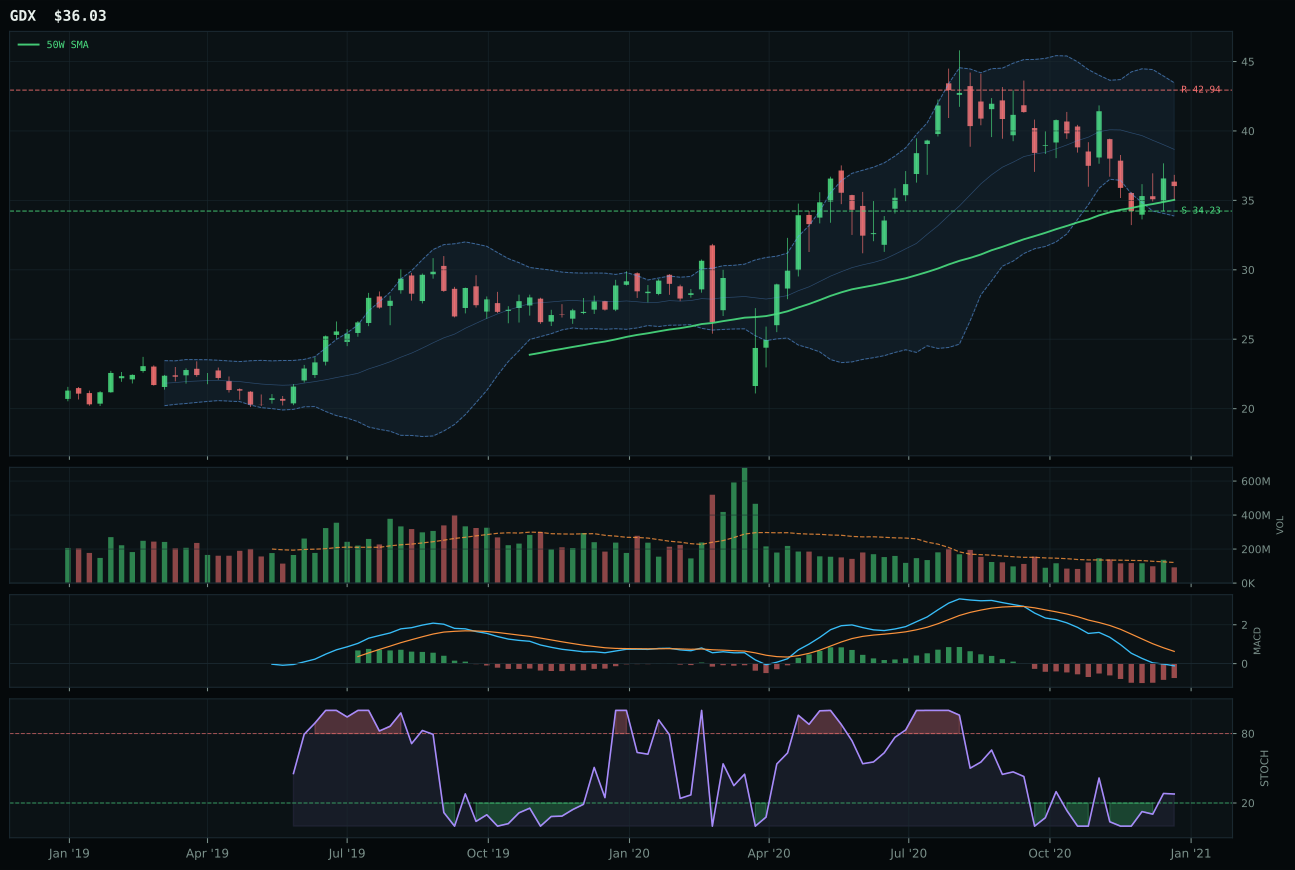
GDX has a neutral structure profile with -18.5% 13-week relative strength versus SPY.
A failed hold above support would weaken the setup.
Actionable but governed by invalidation levels.
SLV edged GLD by 2.3 composite points—a razor-thin margin reflecting a category where technical evidence is noisy and macro intent is unclear. SLV's 11.7% category-relative strength proved decisive; GLD's 0.0% and -11.4% SPY-relative strength indicated lag. Both sit in extended positions with bearish MACD (improving, not bullish), yet SLV's 0.2% SPY-relative strength still beats GLD's negative reading. Volume confirms neither: SLV at 0.70x and GLD at 0.70x are twin thin participation signals. The 45.0/100 timing in SLV reflects the uncertainty—price is elevated, MACD is mixed, stochastic overbought—but category-relative leadership justifies the narrow win. This is a pick-the-least-damaged play rather than a conviction structure.
Precious Metals scores 48.6 and earns 0% allocation, excluded from the portfolio entirely as the ninth or tenth-ranked category this week. The macro fit of 62.0 for SLV includes +7 from active metals scarcity and +5 from inflation pressure, yet these descriptors are insufficient to overcome the category's technical fragility and macro headwinds. The MACD signature is bearish but improving across all three metals ETFs, signaling that buyers are not yet confident in upside; GLD's rising mid-zone stochastic RSI shows capitulation has not cleared, and SLV's overbought momentum risks a rollover. More critically, the active risk appetite positive descriptor carries a -4 weight for the category, suggesting that defensive metals positioning is fighting headwinds from a macro regime favoring risk-on positioning. The technical evidence of 56.7 for SLV is modest, with timing at 45.0 and risk-reward at 48.5 offering limited safety margin. Precious metals must demonstrate either a breakdown in equity momentum or a sharp macro shift toward deflation risk to earn an allocation slot; at present, the category is crowded at extended prices with deteriorating technical confirmation and macro headwinds from active risk appetite.
Nuclear Energy — URA
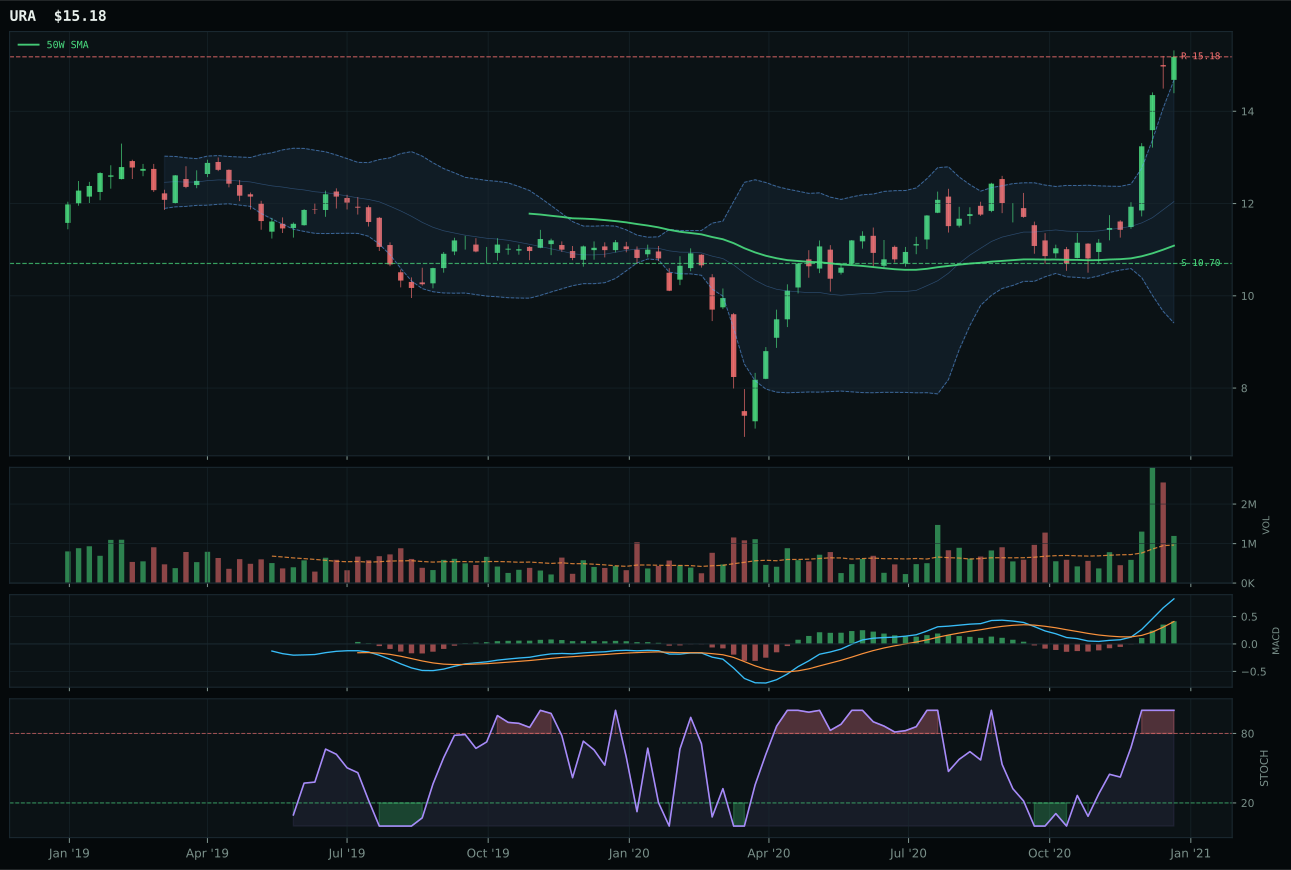
URA has a vertical extension profile with 24.8% 13-week relative strength versus SPY.
A failed hold above support would weaken the setup.
Actionable but governed by invalidation levels.
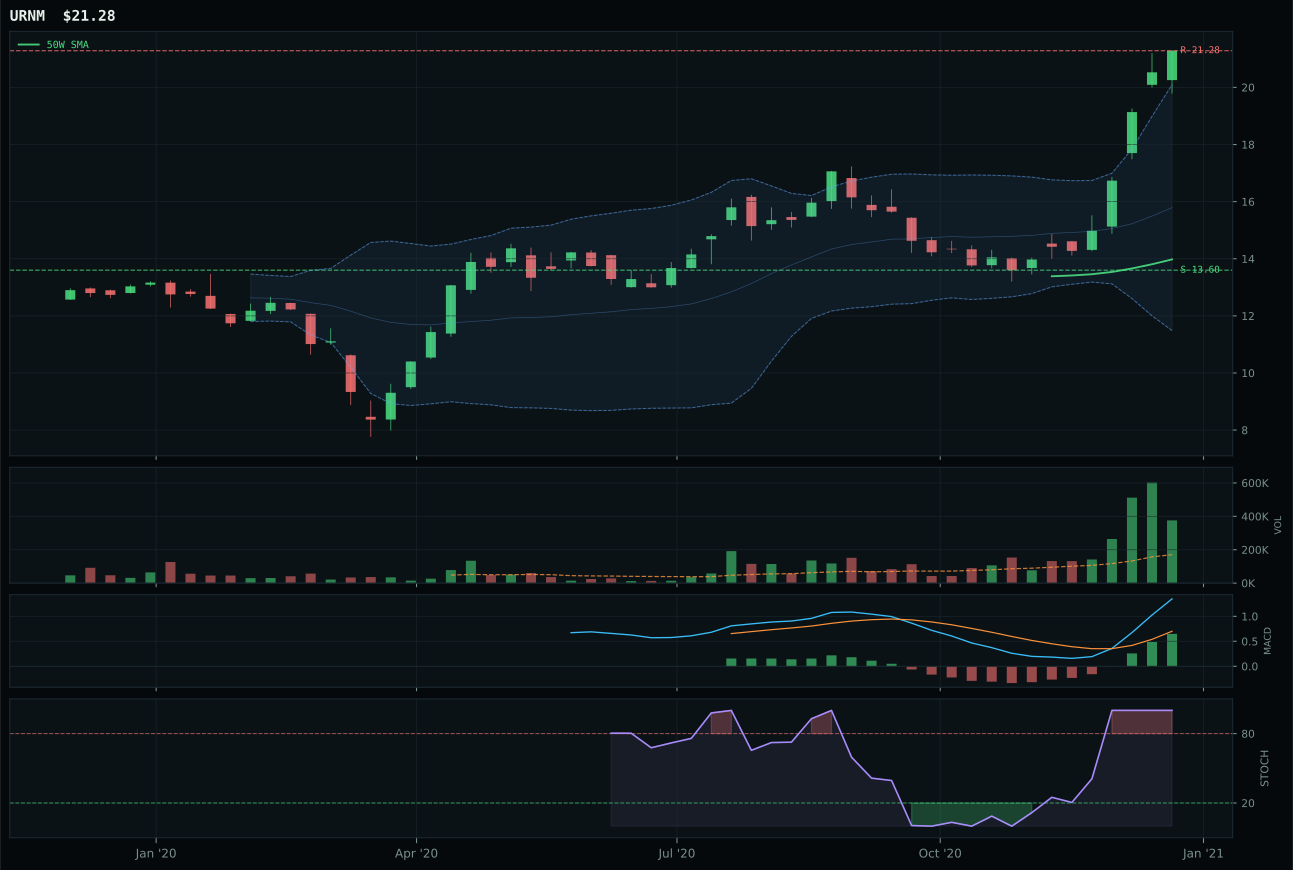
URNM has a vertical extension profile with 33.3% 13-week relative strength versus SPY.
A failed hold above support would weaken the setup.
Tracked, but not top-2 eligible because: .
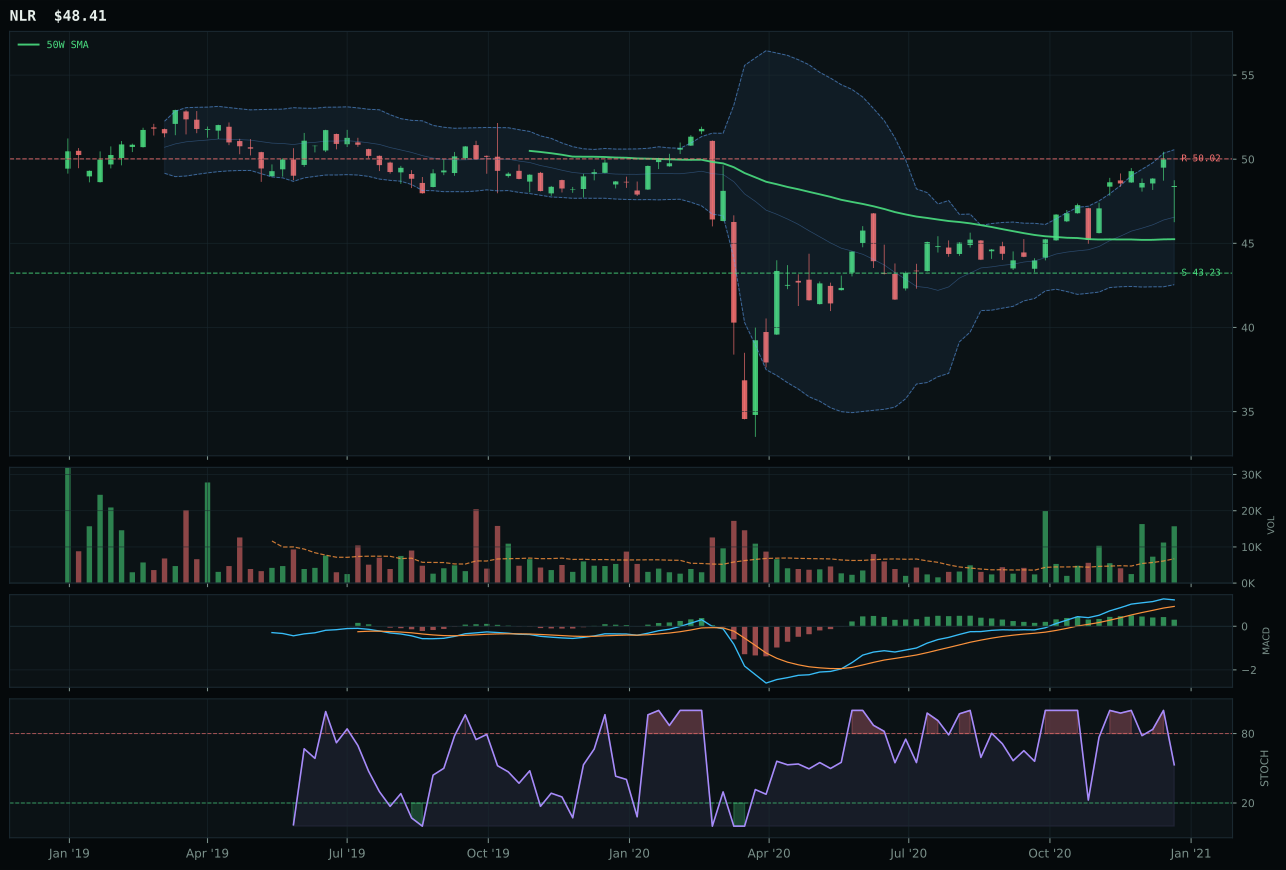
NLR has a neutral structure profile with -2.2% 13-week relative strength versus SPY.
A failed hold above support would weaken the setup.
Tracked, but not top-2 eligible because: .
URA won the nuclear category by maintaining the only clean relative strength metric among three peers. Price 36.9% above the 50-week with 37.0% 13-week return and 24.8% SPY-relative strength establishes clear leadership; volume at 1.24x the 20-week (above-average participation) confirms accumulation rather than thin speculation. MACD bullish and improving with overbought momentum at 1.00 provides textbook confirmation. The 25.2-point gap versus URNM is decisive; while URNM offers higher relative strength to SPY (33.3%) and more volume confirmation (accumulation/confirmation), it stretched 52.3% above the 50-week—too far extended for category leadership. URA's cleaner structure (81.0 versus URNM's missing composite structure) and 0.0% category-relative strength tied with URNM made the selection.
Nuclear Energy scores 43.4 and earns 0% allocation, excluded entirely from the portfolio as a lower-ranked category lacking sufficient macro sponsorship and technical confirmation. The macro fit of 69.0 includes active descriptors for energy scarcity (+9), real asset sponsorship (+7), and ai growth sponsorship (+5), yet these descriptors apply more broadly to commodities and technology and do not create specific nuclear demand signals. The technical evidence of 80.0 for URA is solid, but the timing score of 37.0 reflects substantial extension, and the risk-reward of 40.4 offers only thin upside potential beyond the 15.18 resistance level. Critically, the momentum confirmation of 100.0 masks a structural concern: the 4-week return of 27.2% is exceptional, but the category-relative strength of 0.0% shows no professional rotation favoring uranium over other energy or commodity alternatives. This allocation decision reflects prioritization: Industrial Metals and Traditional Energy both offer superior macro sponsorship, cleaner technicals, and stronger category-relative momentum. Nuclear must demonstrate either a formal energy-scarcity descriptor recognition or a breakdown in competing commodity technicals to earn a portfolio position.