
2020-12-18
Informational purposes only. The content in this report, including allocations, analysis, and commentary, is provided solely for informational and educational purposes. It does not constitute financial advice, investment advice, trading advice, or any other type of advice. Past performance does not guarantee future results. Always conduct your own research and consult a qualified financial professional before making investment decisions.
Some tracked tickers were excluded due to missing live weekly price data: SGOV: Historical cache SGOV has only 29 usable weekly bars
Weekly Allocation
| Ticker | Category | Weight | Role |
|---|---|---|---|
| FSOL | 50% | Overlay | |
| FCG | Traditional Energy | 10% | Top-2 (10%) |
| COPX | Industrial Metals | 10% | Top-2 (10%) |
| ILF | Emerging Markets | 5% | Tier-2 (5%) |
| CIBR | Technology | 5% | Tier-2 (5%) |
| SMH | AI | 5% | Tier-2 (5%) |
| XAR | Defense & Aerospace | 5% | Tier-2 (5%) |
| PAVE | Utilities & Infrastructure | 5% | Tier-2 (5%) |
| MOO | Agriculture & Livestock | 5% | Tier-2 (5%) |
Trade Instructions — Monday Open
Sell the tranche from 2020-11-20 (completing its 4-week hold). Buy the new tranche. Instructions show net portfolio changes — same-asset positions cancel, weight changes show the delta.
| Action | Ticker | Instruction |
|---|---|---|
| SELL | REMX | Sell 50% of REMX position (reduce 5.00% → 2.50%) |
| SELL | ILF | Sell 17% of ILF position (reduce 7.50% → 6.25%) |
| BUY | FCG | Buy FCG — 33.33% of freed cash (adds 1.25% to portfolio) |
| BUY | COPX | Buy COPX — 66.67% of freed cash (adds 2.50% to portfolio) |
Current Portfolio After Trade
Combined holdings across all 4 active tranches. Each tranche is 25% of the portfolio.
| Ticker | % of Portfolio | Weight Bar |
|---|---|---|
| FSOL | 50.00% | |
| FCG | 8.75% | |
| ILF | 6.25% | |
| PAVE | 5.00% | |
| XAR | 5.00% | |
| SMH | 5.00% | |
| MOO | 5.00% | |
| CIBR | 5.00% | |
| COPX | 5.00% | |
| REMX | 2.50% | |
| PICK | 2.50% |
Macro Regime — Transition / Mixed
Macro Evidence Charts
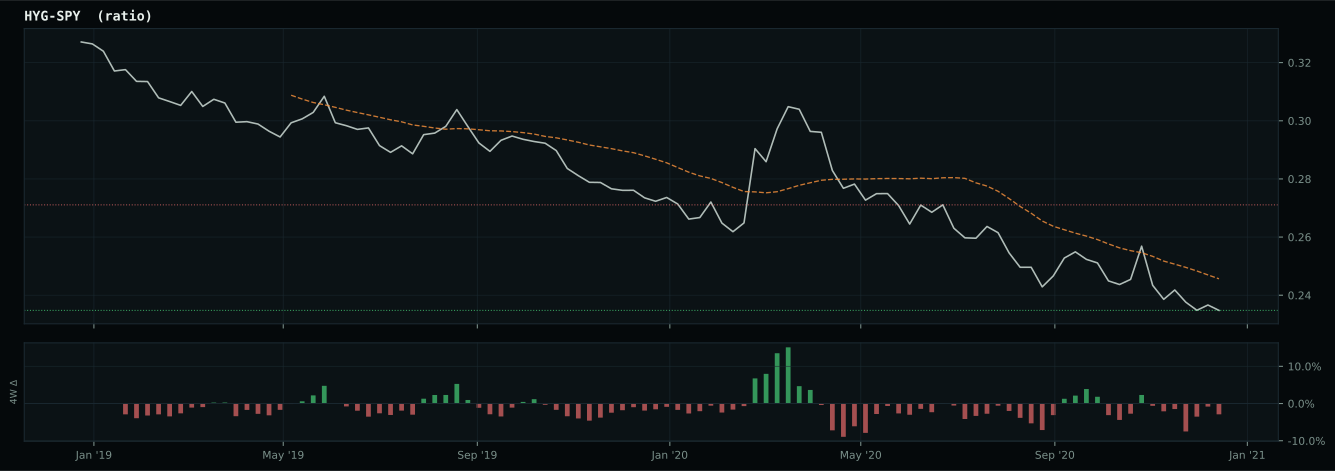
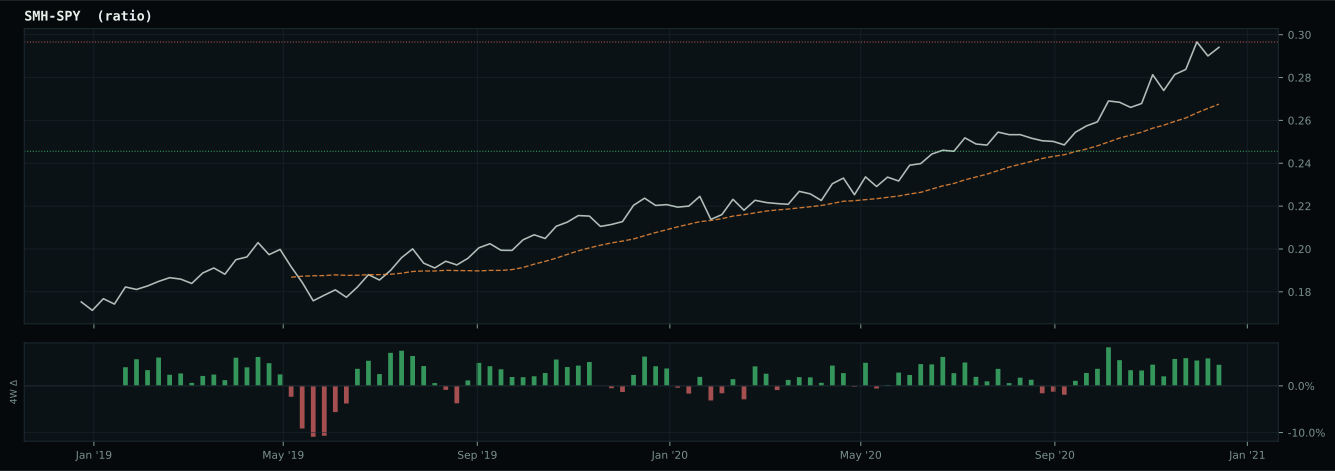
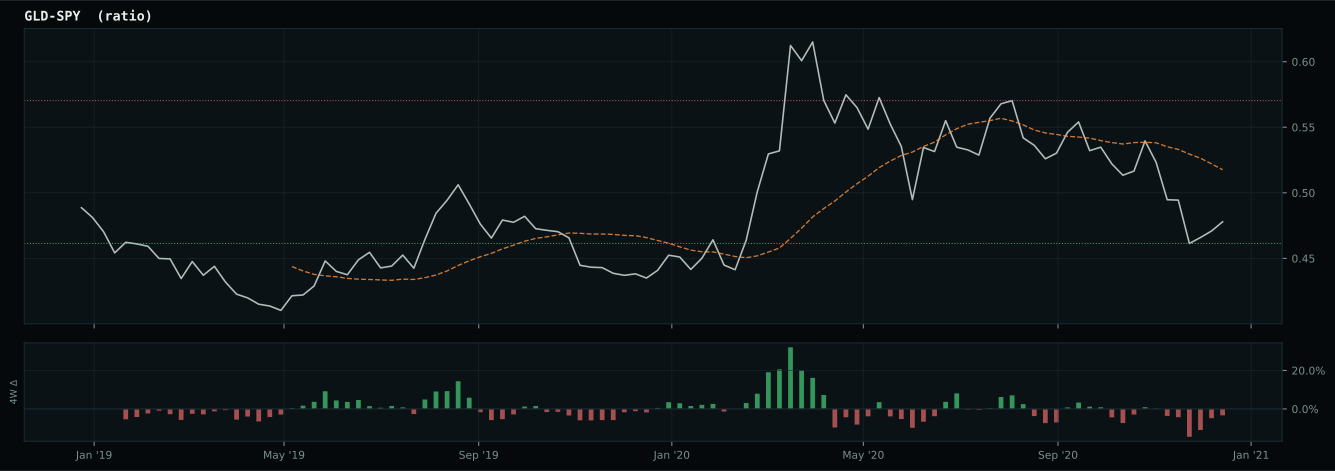
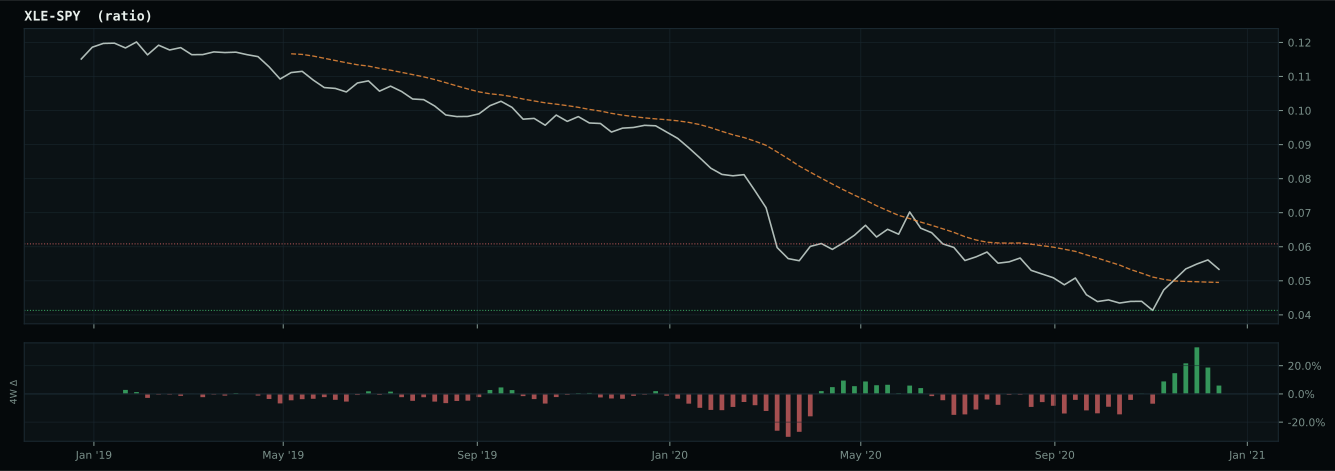
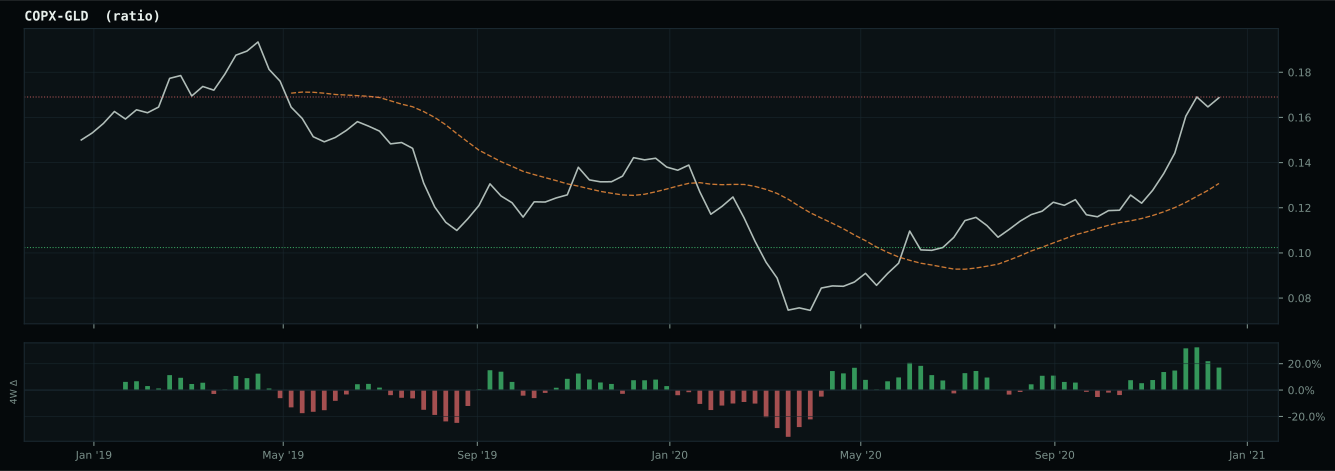
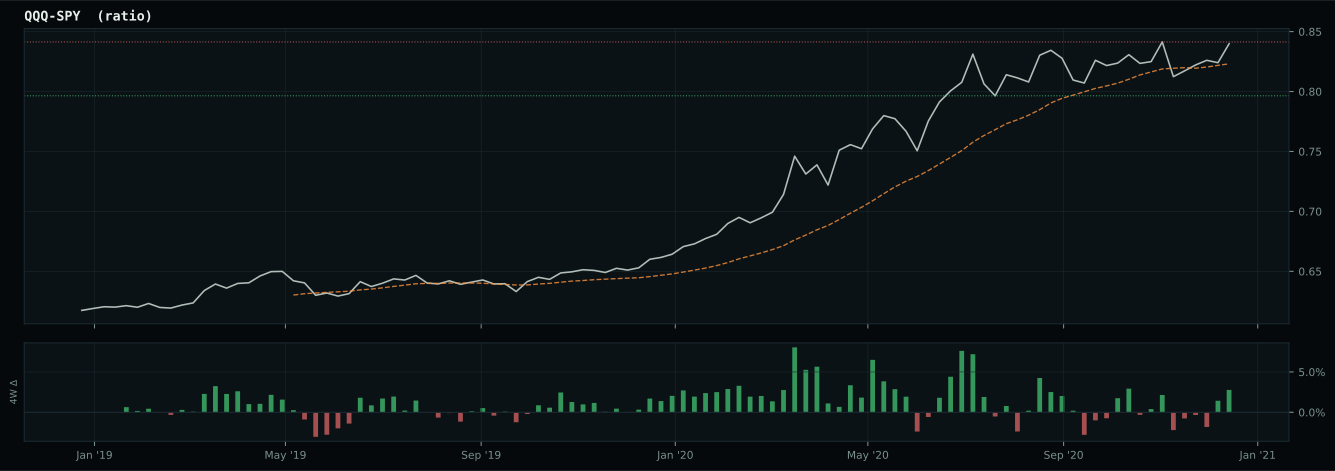
Market-implied signals behind the macro regime scores. Each ratio compares two assets; the direction and slope of the ratio is what the macro engine reads.
Crypto Regime — AltSeason
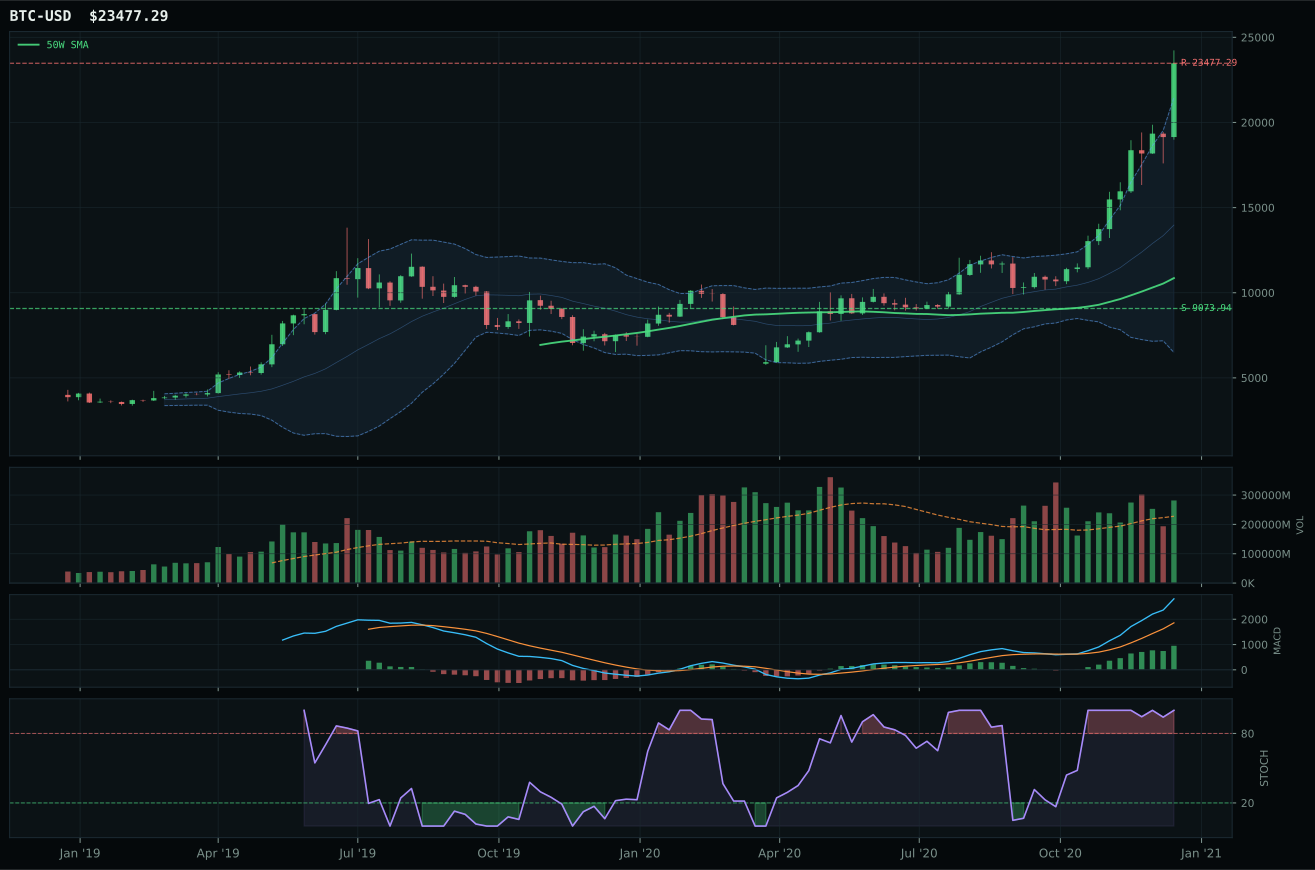
post-touch structure is too wide to count as a range; max/min close ratio is 3.59
TrendBTC confirmed: 2 consecutive closes above rising/flat 50W SMA
all available AltSeason conditions pass; missing optional confirmations skipped

Category Rankings
| Rank | Category | Winner | Score | Alloc | 4W Ret | Peers (4W) |
|---|---|---|---|---|---|---|
| 1 | Traditional Energy | FCG | 80.3 | 20% | +25.51% | XOP +25.0% · XLE +15.7% |
| 2 | Industrial Metals | COPX | 77.8 | 20% | +10.03% | REMX +22.7% · PICK +11.5% |
| 3 | Emerging Markets | ILF | 72.8 | 10% | +4.68% | INDA +9.7% · IEMG +10.9% |
| 4 | Technology | CIBR | 62.3 | 10% | +4.01% | IGV -1.2% · XLK +1.6% |
| 5 | AI | SMH | 62.2 | 10% | +12.66% | BOTZ +8.5% · AIQ +3.6% |
| 6 | Defense & Aerospace | XAR | 51.2 | 10% | +8.29% | ITA +3.3% · ROKT +6.7% |
| 7 | Utilities & Infrastructure | PAVE | 50.9 | 10% | +10.52% | IGF +4.2% · XLU +3.3% |
| 8 | Agriculture & Livestock | MOO | 46.7 | 10% | +9.69% | VEGI +11.2% · WEAT +10.7% |
| 9 | Nuclear Energy | URA | 46.5 | 0% | +6.47% | URNM +10.5% · NLR +2.6% |
| 10 | Precious Metals | GLD | 39.6 | 0% | -2.03% | SLV -2.7% · GDX -3.4% |
Traditional Energy — FCG
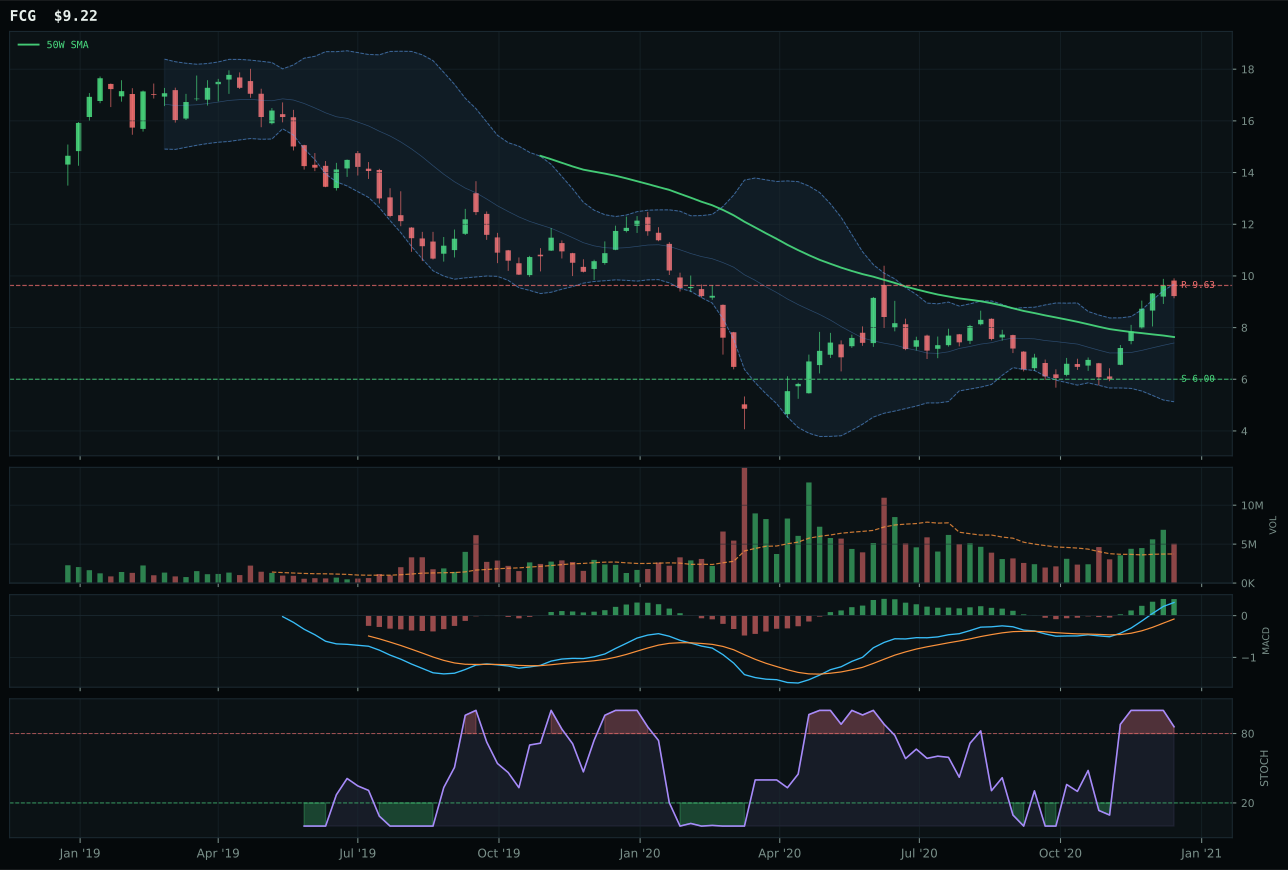
FCG has a vertical extension profile with 23.1% 13-week relative strength versus SPY.
A failed hold above support would weaken the setup.
Actionable but governed by invalidation levels.
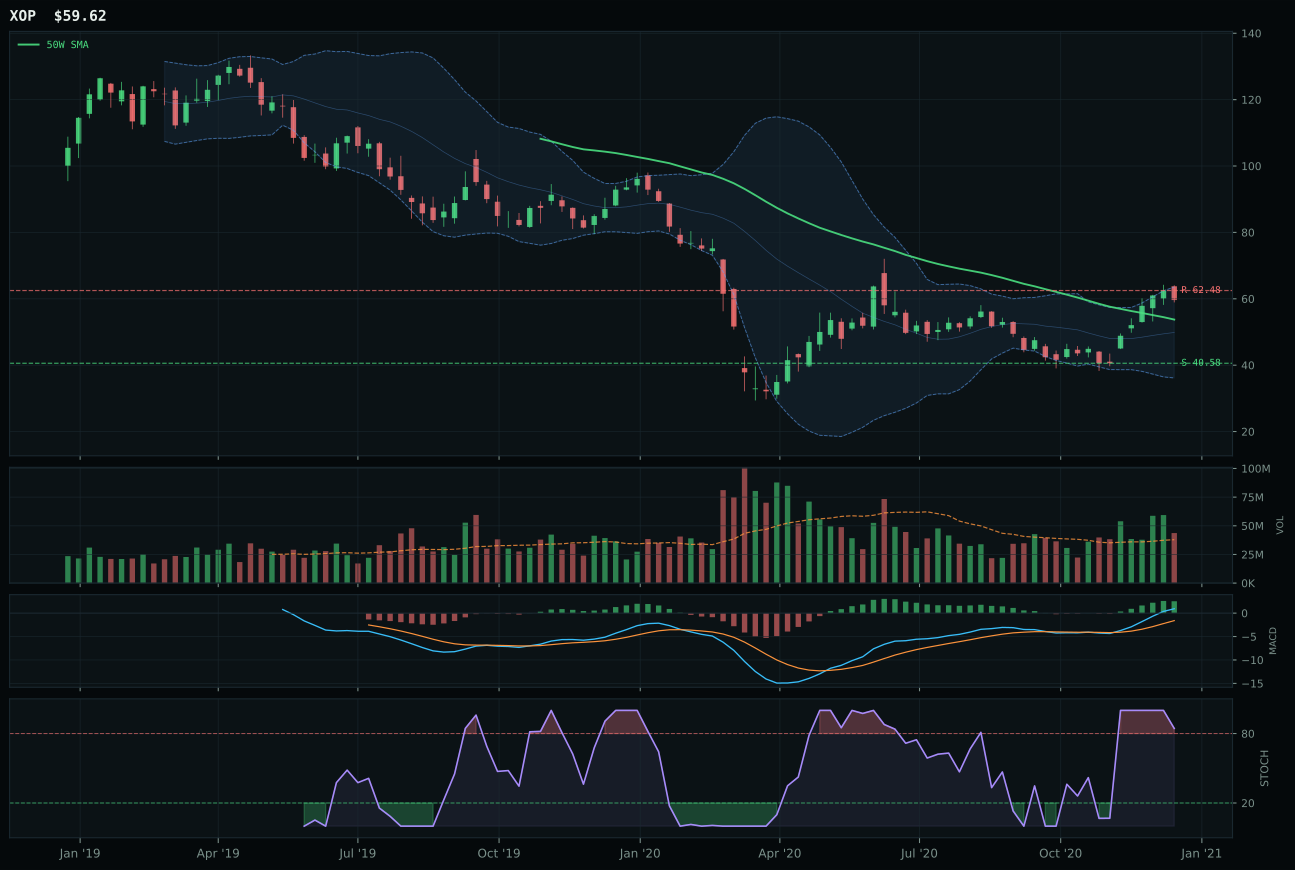
XOP has a neutral structure profile with 13.8% 13-week relative strength versus SPY.
A failed hold above support would weaken the setup.
Actionable but governed by invalidation levels.
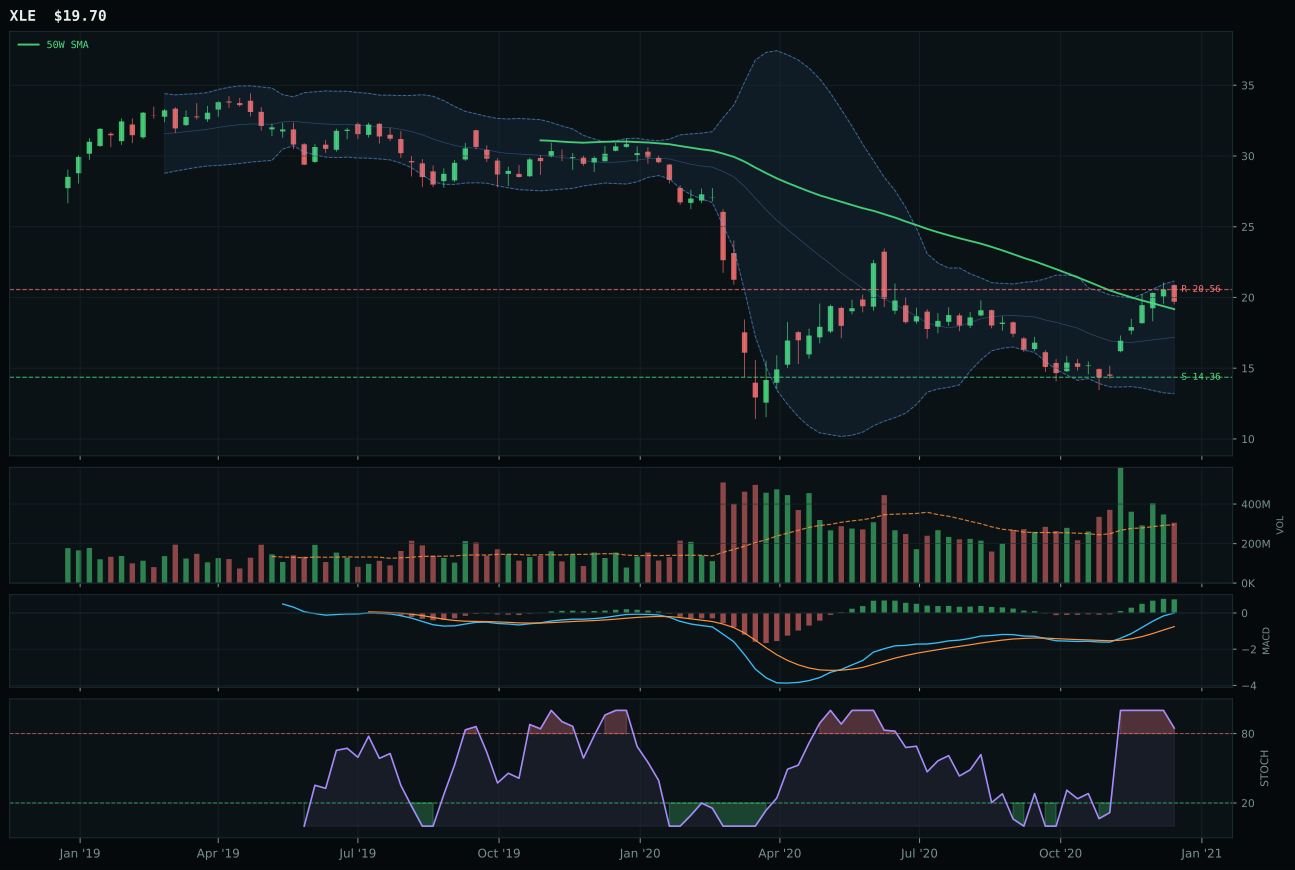
XLE has a compression near 50W profile with 5.6% 13-week relative strength versus SPY.
A failed hold above support would weaken the setup.
Actionable but governed by invalidation levels.
FCG wins the energy category and earns the second top-2 slot on category-relative strength and momentum confirmation, despite ranking second in the reasoned ETF proof order behind XOP (72.3 vs. 72.0). The natural gas focused ETF shows 23.1% SPY outperformance and 34.8% 13-week return with bullish-improving MACD and 1.35x above-average volume participation—clear conviction flow. XOP's exploration beta is technically superior (70.5 technical evidence versus FCG's 73.2), with neutral structure setup versus FCG's vertical extension, and it carries stronger macro fit (66.0 vs. 50.0) from energy scarcity at +12 and risk appetite at +7. Yet FCG's 9.3% category-relative strength versus XOP's 0.0% made the decision: the consensus within the three-ETF basket favors gas supply and immediate demand shock over exploration upside. FCG sits below the 200-week line (70.0 trend score), a structural weakness, but the momentum confirmation at 100.0 overpowers timing concerns. Volume-price confirmation at 65.2 and persistence at 81.8 show the move is holding despite stretched technicals.
Traditional Energy earned 10% allocation as the highest-ranked category at 80.3, driven by 85.0 macro fit and the strongest conviction thesis in the portfolio. Energy scarcity is active at +16, inflation pressure at +10, supply shortage at +9, and real asset sponsorship at +7—a 42-point macro advantage concentrated in a single category. The 62% technical foundation at 73.2 within FCG provides solid confirmation, and the category-level persistence of 81.8 across the basket shows institutional support persisting through volatile intraday action. FCG's 22.9% extension above the 50-week line is stretched, and risk/reward at 31.4 reflects compressed upside potential and 53.7% downside to support—a structural red flag—yet the magnitude of the macro regime shift (Russia supply shock, OPEC discipline, winter demand) justifies the aggressive allocation. This is not a technical trade; it is a macro conviction play where energy scarcity and real asset sponsorship have shifted the regime. The risk is whipsaw on any geopolitical de-escalation or demand recession signal. Size accordingly for volatility but hold the full 10% conviction.
Industrial Metals — COPX
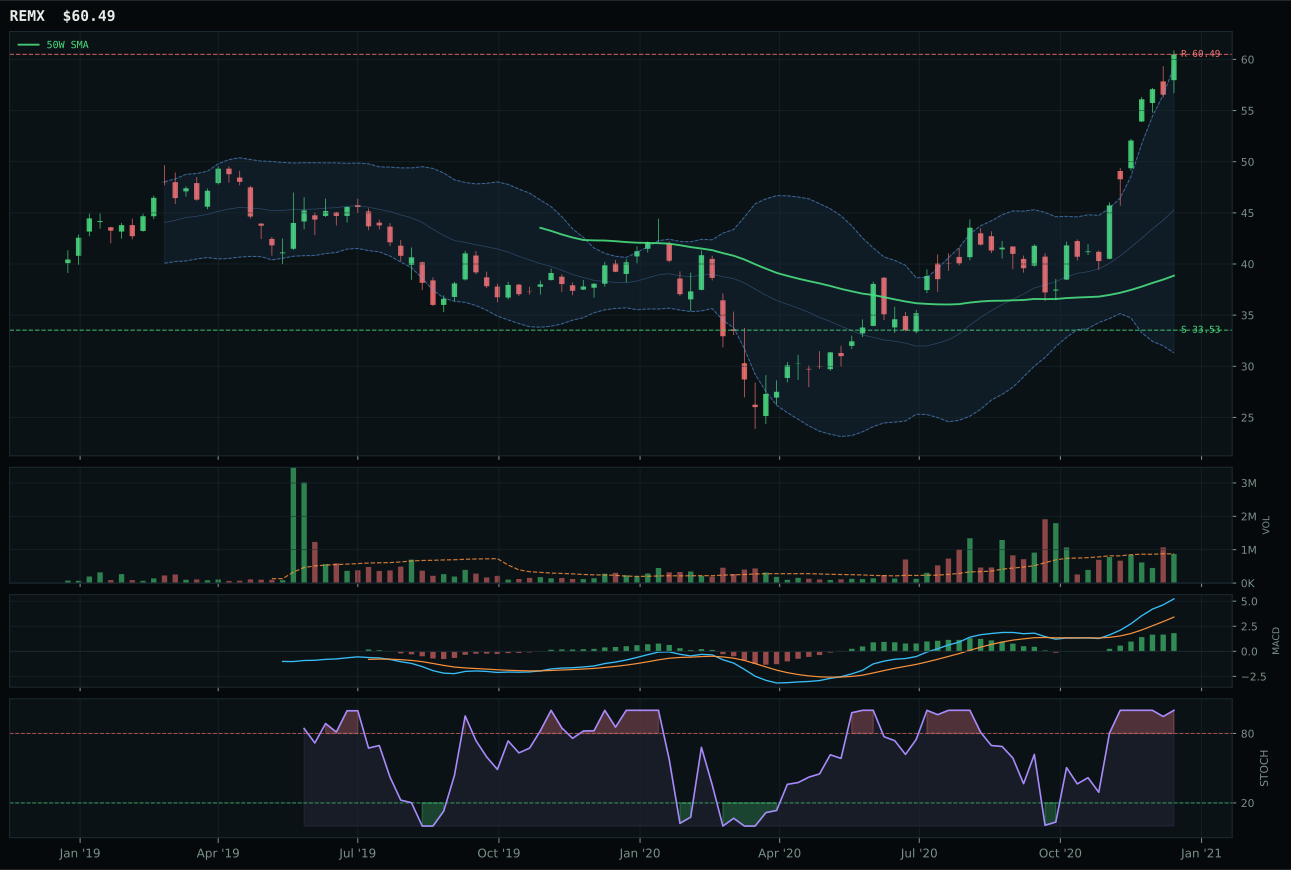
REMX has a vertical extension profile with 33.1% 13-week relative strength versus SPY.
A failed hold above support would weaken the setup.
Actionable but governed by invalidation levels.
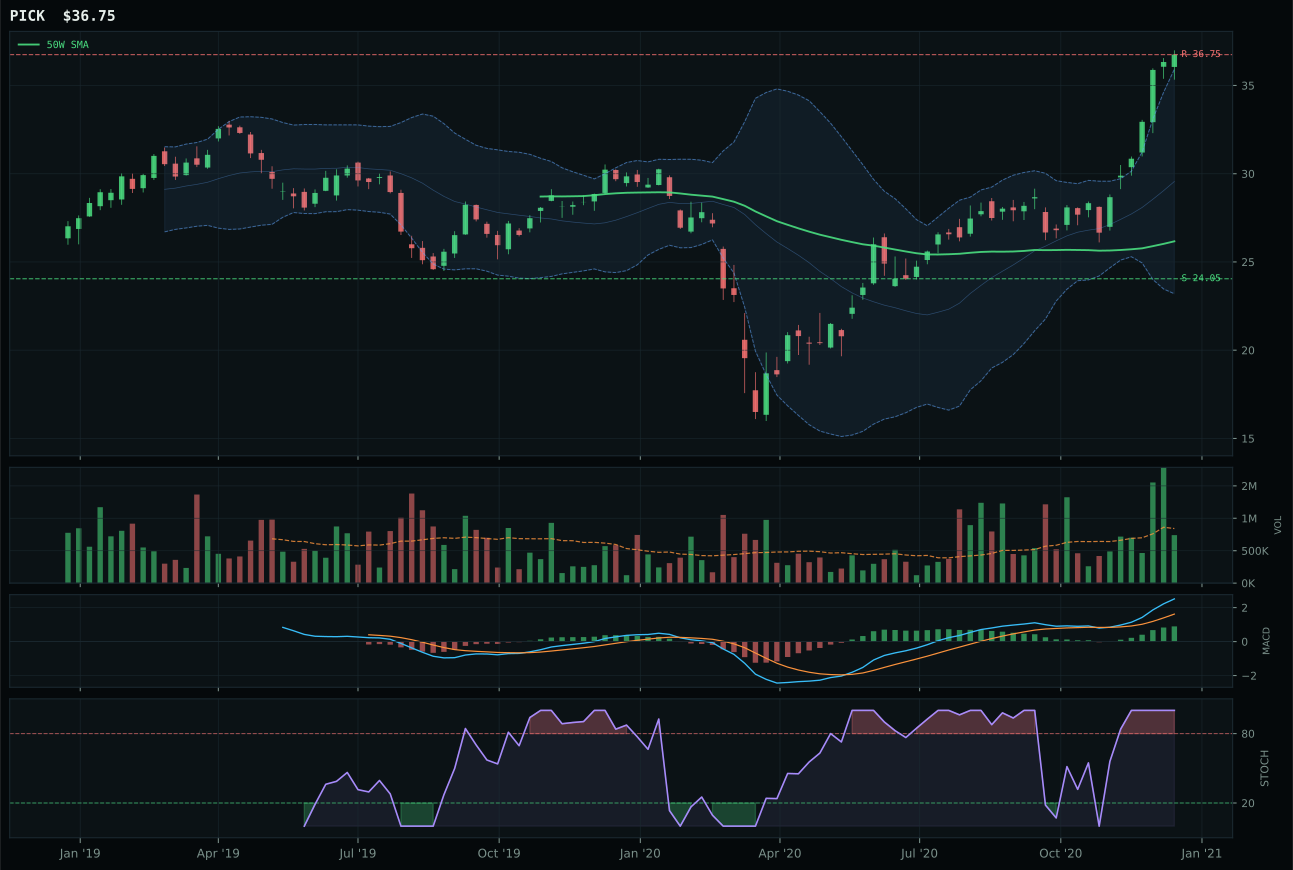
PICK has a vertical extension profile with 16.5% 13-week relative strength versus SPY.
A failed hold above support would weaken the setup.
Actionable but governed by invalidation levels.
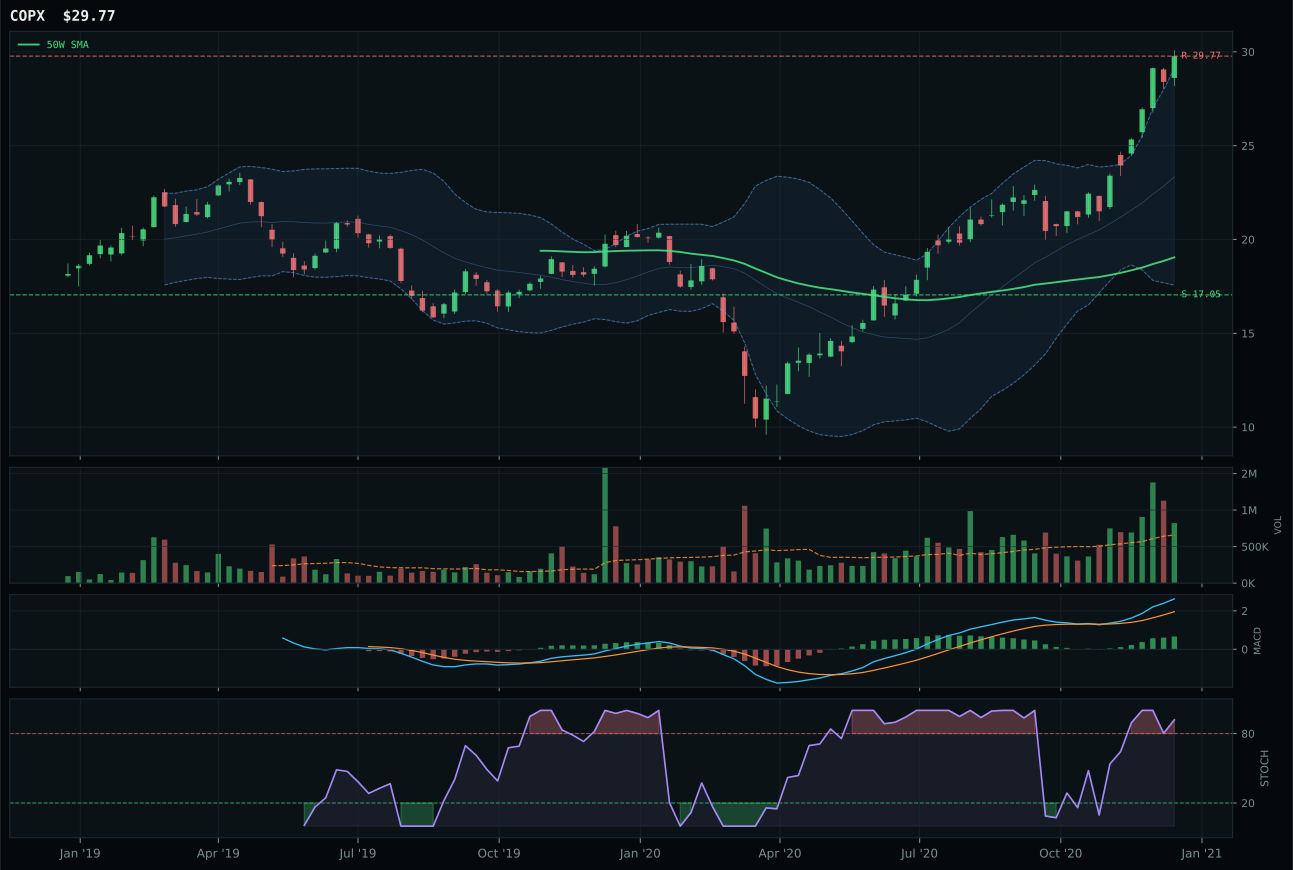
COPX has a vertical extension profile with 19.8% 13-week relative strength versus SPY.
A failed hold above support would weaken the setup.
Actionable but governed by invalidation levels.
COPX wins the industrial metals category and earns a top-2 slot on extreme category-relative strength and superior breadth across the basket, despite REMX scoring marginally higher (76.6 vs. 68.9) in the reasoned ETF proof order. Copper extended 56.3% above the 50-week moving average with 1.25x volume participation—above-average but not accumulation—yet it dominated peers on 19.8% SPY relative strength and 31.5% 13-week return. REMX's rare earths story is technically superior at the individual ETF level (79.9 technical evidence, 33.1% SPY outperformance, 44.8% 13-week return), but category-relative strength at 13.3% versus COPX's 0.0% reveals that the basket consensus favors copper cyclicality over rare-earth scarcity plays. The category reasoner tested the 3/2/1 basket (REMX x3, COPX x2, PICK x1) against leadership and persistence: industrial metals category-level macro fit of 73.0 pushed the final score to 77.8 despite COPX's shallow 38.9 risk/reward. COPX's stochastic RSI at 0.92 (overbought rolling over) paired with MACD bullish and improving created the setup that held the decision through momentum confirmation at 100.0.
Industrial Metals earned 10% allocation as a top-2 category, justified by a 77.8 final score and exceptional 73.0 macro fit driven by metals scarcity at +14, commodity breadth positive at +10, and real asset sponsorship at +6. The 62% technical foundation is reasonable at 67.9 average across the basket, giving the category solid two-leg support. This ranks second only to Traditional Energy (80.3) in macro conviction, but the category scores matter more than tier positioning: at 77.8 versus energy's 80.3, industrial metals is a genuine co-leader, not a consolation tier-2. COPX's 56.3% extension is the most stretched entry in the top-2, a risk factor that will require discipline on new purchases, but the category-level score earns the allocation. Metals scarcity is real—supply constraints in copper, lithium, and rare earths are structural, not cyclical—and the basket's 91.2 persistence score confirms that this move is not a bounce but a regime shift. Hold full conviction at 10%, but watch volume participation: if COPX's 1.25x reverts to neutral, category breadth will weaken and a rotation back to tier-3 becomes likely.
Emerging Markets — ILF
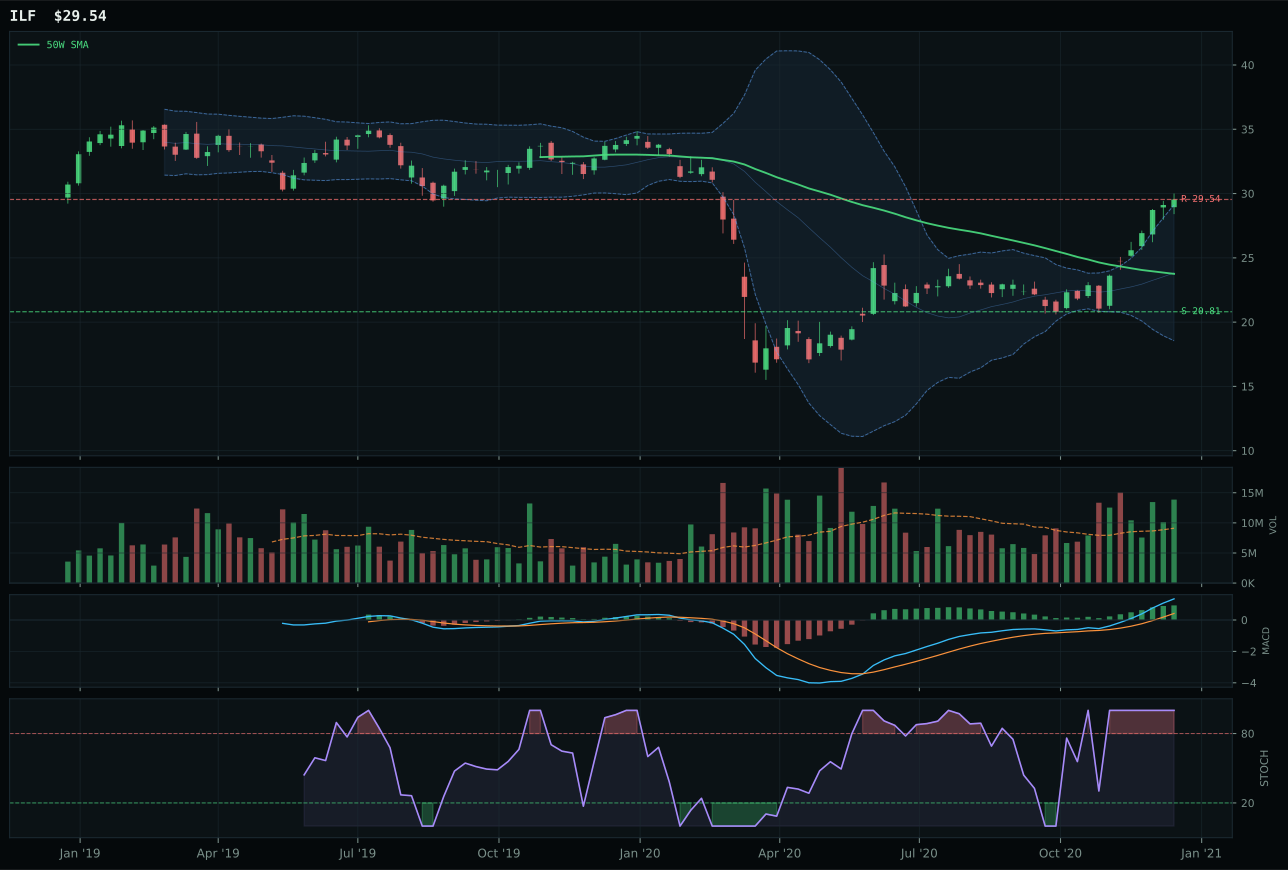
ILF has a vertical extension profile with 21.7% 13-week relative strength versus SPY.
A failed hold above support would weaken the setup.
Actionable but governed by invalidation levels.
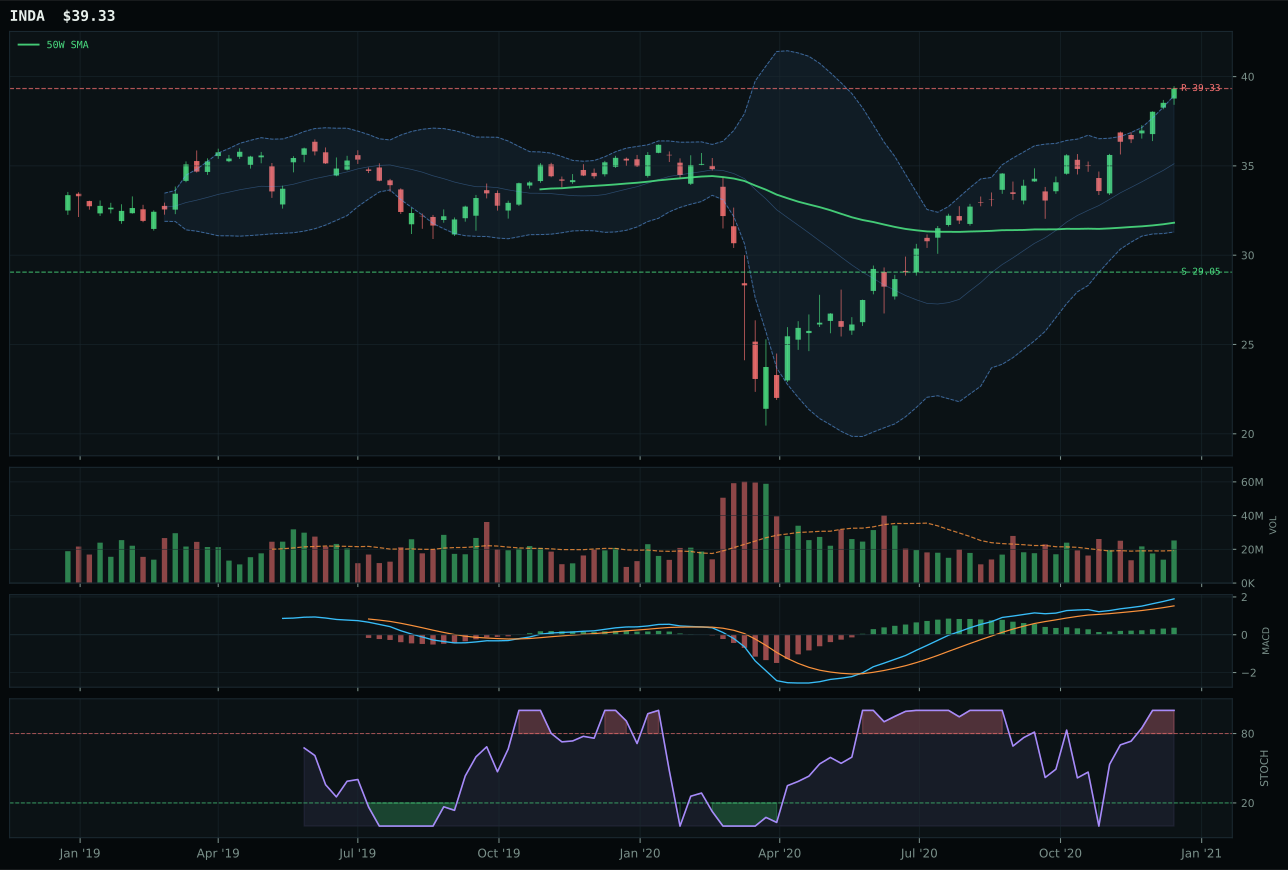
INDA has a vertical extension profile with 3.1% 13-week relative strength versus SPY.
A failed hold above support would weaken the setup.
Actionable but governed by invalidation levels.
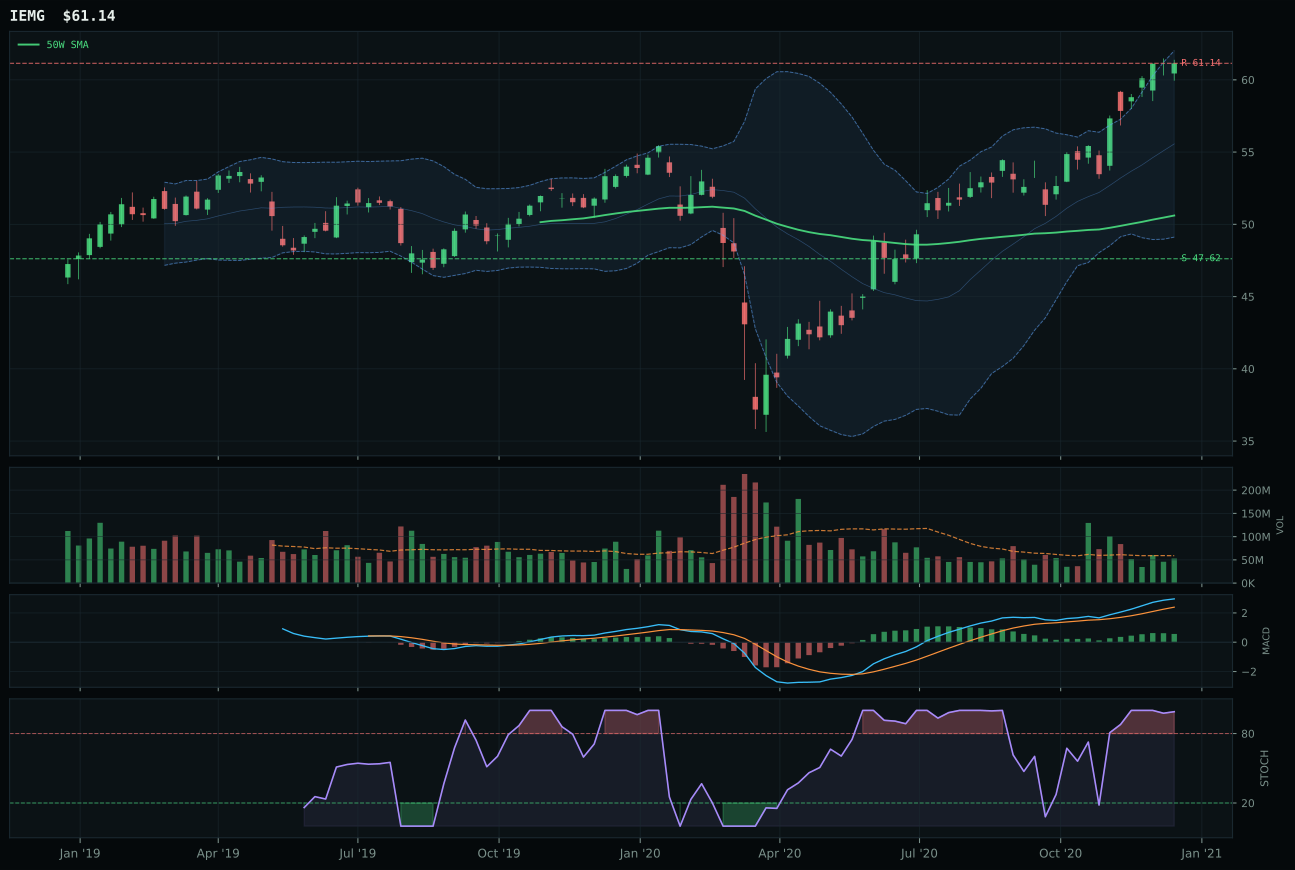
IEMG has a vertical extension profile with 3.0% 13-week relative strength versus SPY.
A failed hold above support would weaken the setup.
Actionable but governed by invalidation levels.
ILF wins emerging markets on perfect volume-price confirmation (91.5) and exceptional persistence (100.0), beating INDA's more extended but weaker conviction setup. The Latin American commodity ETF sits 24.4% above the 50-week line with 1.52x accumulation-confirmation volume and 33.3% 13-week return with overbought stochastic RSI at 1.00, showing institutional sponsorship of commodity-linked EM exposure. Category-relative strength at 18.6% tells the story: capital is selecting commodity-heavy Latin America over India's growth positioning (0.0% relative strength). INDA's superior 13-week return (14.7%), timing score (37.0 vs. 45.0), and risk/reward (41.1 vs. 53.4) paint a picture of an extended but less-trusted setup. ILF's technical evidence at 100.0 is perfect—trend, relative strength, volume-price sponsorship, MACD/stochastic, timing, support/resistance, and risk/reward all aligned—while INDA scored 83.6, a meaningful gap in the reasoned ordering. The decision is driven by volume confirmation: ILF's accumulation versus INDA's above-average participation marks the moment when capital rotated from growth-EM into real-asset-EM.
Emerging Markets earned 5% allocation as a tier-3 category despite a strong category score of 72.8, because industrial metals (77.8) and traditional energy (80.3) ranked higher and consumed the top-2 slots. EM macro fit is 62.0, driven by EM liquidity support at +14 and risk appetite at +8, offset by credit stress at -10. ILF's 100.0 technical evidence is the best composite in the portfolio outside of AI's SMH and technology's CIBR, yet the category-level ranking (3rd at 72.8) places it tier-3 by definition. The allocation logic reflects a portfolio decision to prioritize industrial real assets over EM capital appreciation in the current regime. ILF's Latin America commodity play is structurally superior to INDA's India growth exposure for inflation and supply-shock hedging, and the perfect persistence score confirms institutional conviction. Tier-3 sizing at 5% is appropriate: hold this position as a secondary inflation and commodity beta play, but expect it to upgrade to 10% if industrial metals momentum falters or if EM liquidity support strengthens materially. Current allocation reflects macro rank, not technical quality.
Technology — CIBR
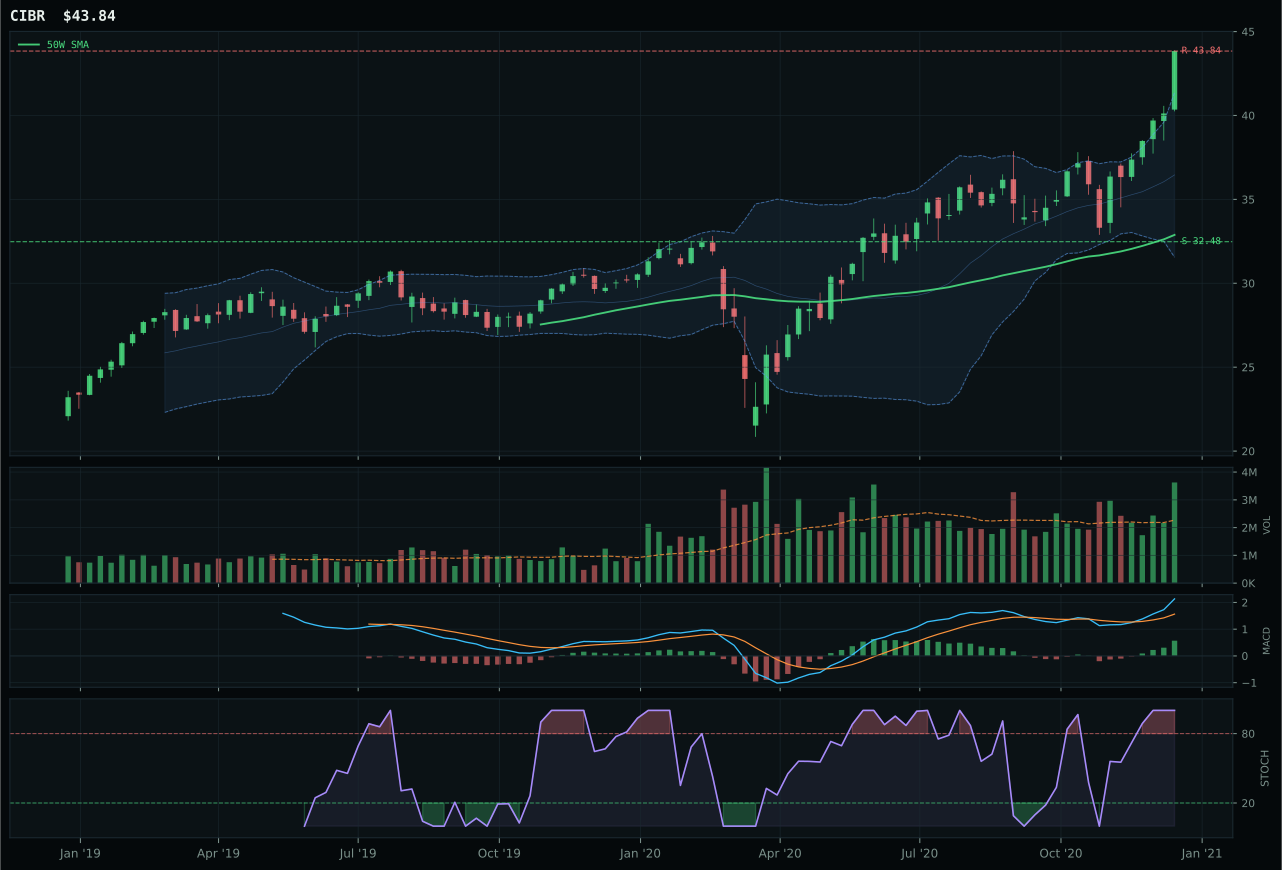
CIBR has a vertical extension profile with 16.4% 13-week relative strength versus SPY.
A failed hold above support would weaken the setup.
Actionable but governed by invalidation levels.
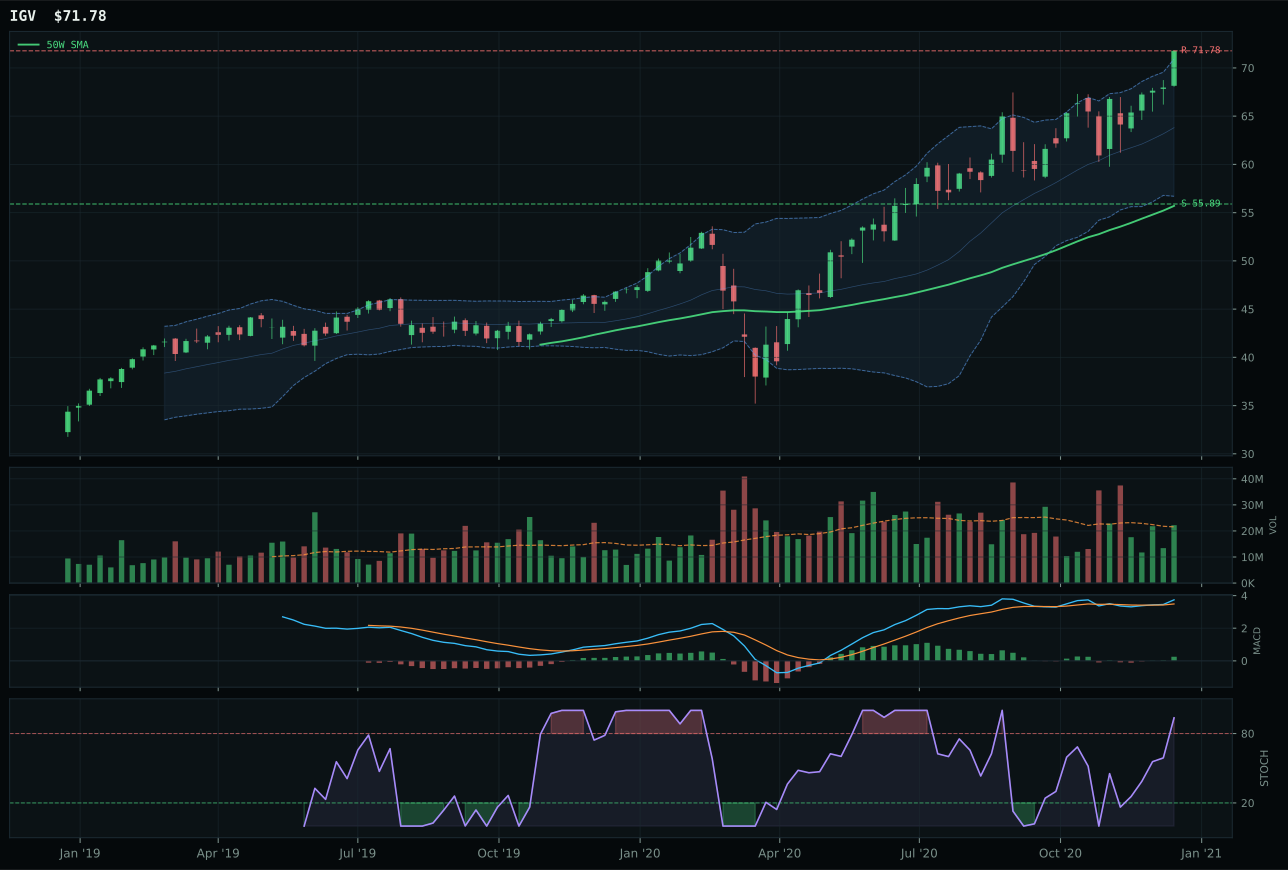
IGV has a vertical extension profile with 8.9% 13-week relative strength versus SPY.
A failed hold above support would weaken the setup.
Actionable but governed by invalidation levels.
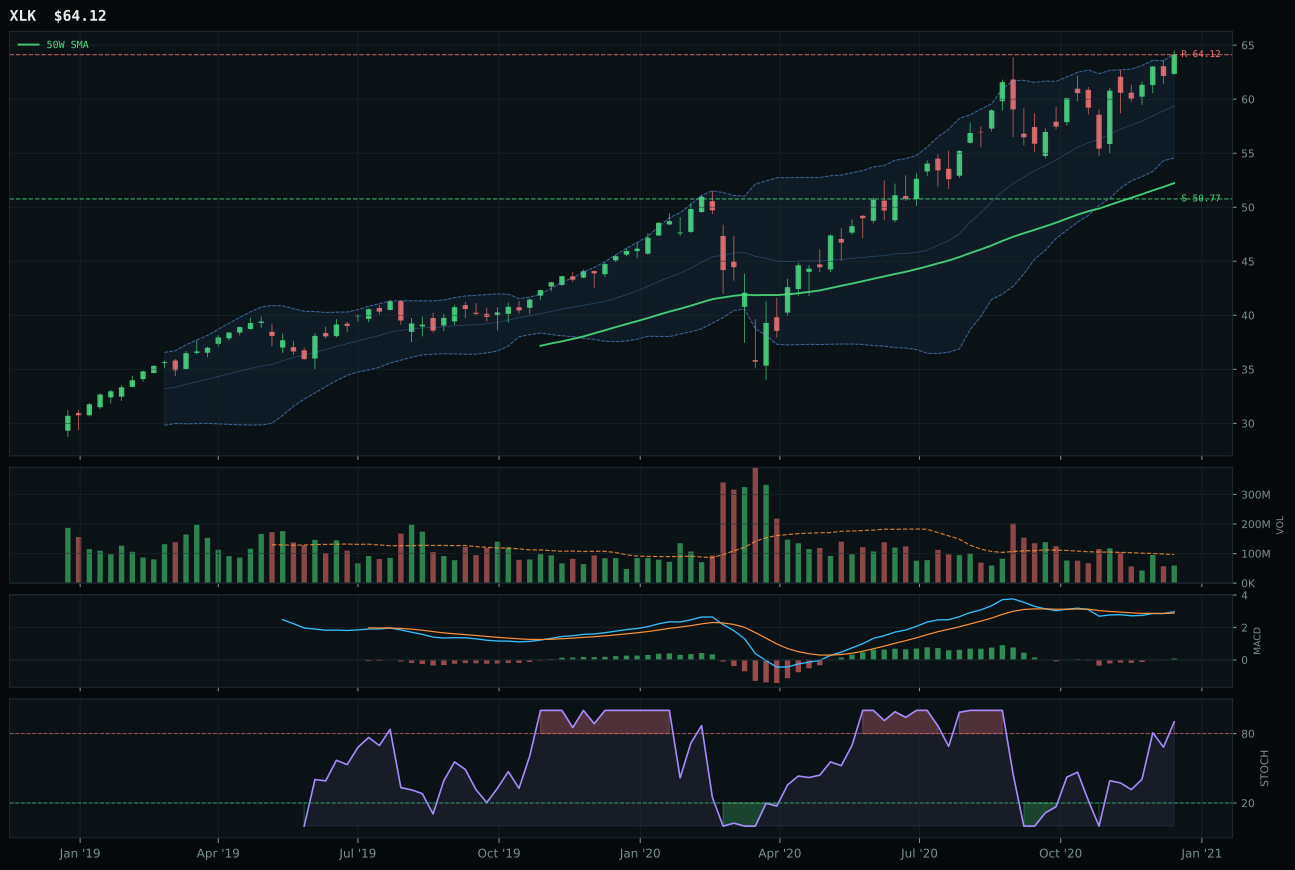
XLK has a vertical extension profile with 3.1% 13-week relative strength versus SPY.
A failed hold above support would weaken the setup.
Actionable but governed by invalidation levels.
CIBR wins the category on clean volume sponsorship and superior category-relative strength. The cybersecurity ETF sits 33.3% above its 50-week moving average with accumulation-confirmation volume at 1.60x its 20-week average—a setup that shows institutional buying despite the stretched entry. Its 16.4% outperformance versus SPY over 13 weeks and 7.5% edge within the three-ETF basket beat IGV's neutral volume profile and lagging 0.0% category relative strength. IGV's risk/reward scored 4 points lower (42.1 vs. 46.1) because structure was less clean and MACD sponsorship, while bullish, failed to match CIBR's volume confirmation. The gap is narrow—only 1.8 points—because both setups are vertical extensions with overbought stochastic RSI, but CIBR's accumulation versus IGV's neutral reading flipped the decision.
Technology earned 5% allocation as a tier-3 category in a macro regime tilted toward real assets and supply constraints. The category scored 62.3, well below top-2 thresholds that went to industrial metals and energy, both of which carried stronger macro tailwinds from inflation pressure and commodity breadth. Risk appetite remains active, which helps growth technology in principle, but credit stress is live and inflation pressure is active—a combination that penalizes duration-sensitive names like enterprise software (IGV's real profile). CIBR's cybersecurity thesis sidesteps some of that duration risk and rides AI growth sponsorship at +6, but the category's 54.0 macro fit score (weighted at 38% of the final rank) cannot overcome a 62% technical foundation that lags the two categories taking 10% each. Hold the position as insurance against risk-appetite re-acceleration, but expect rotation pressure if inflation signals worsen.
AI — SMH
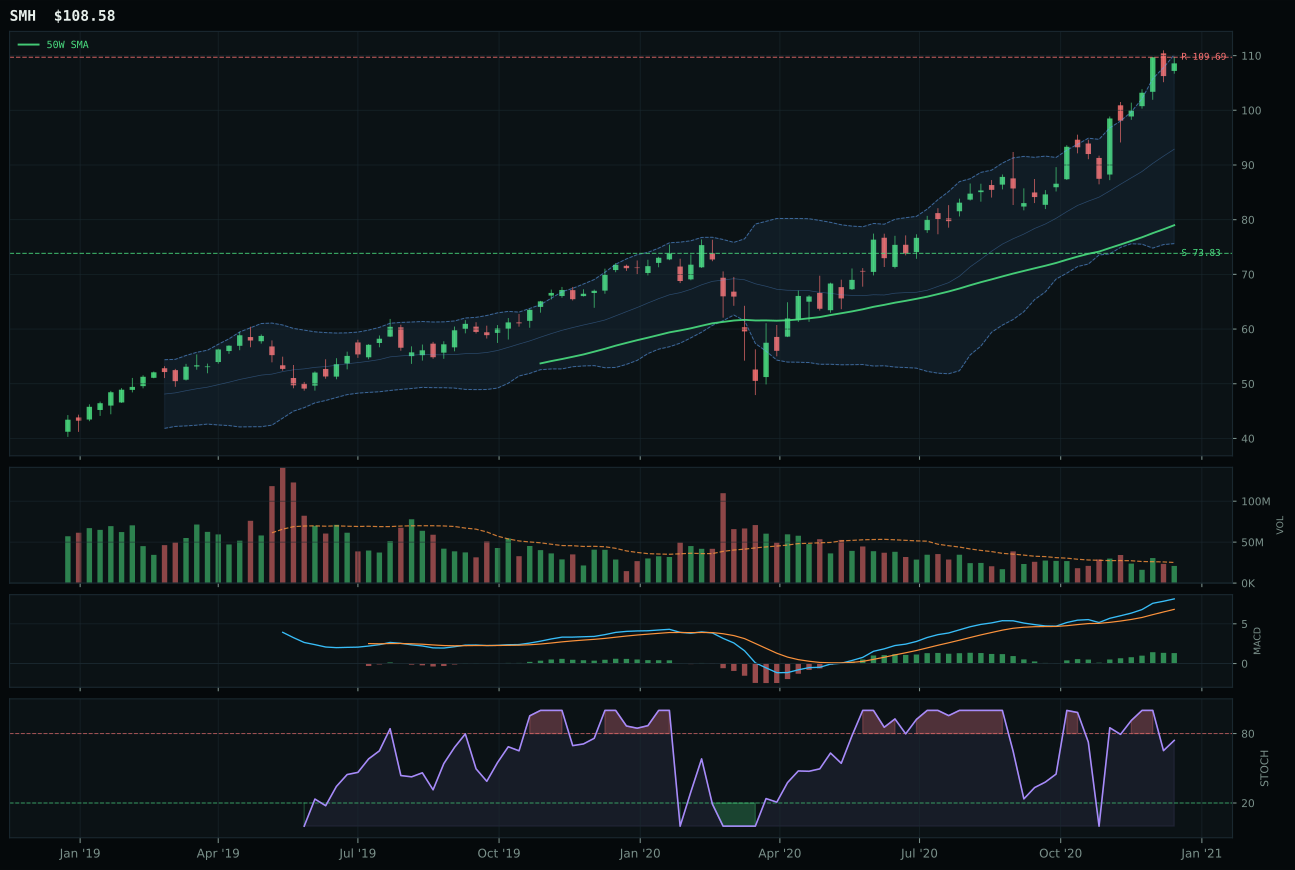
SMH has a vertical extension profile with 17.4% 13-week relative strength versus SPY.
A failed hold above support would weaken the setup.
Actionable but governed by invalidation levels.
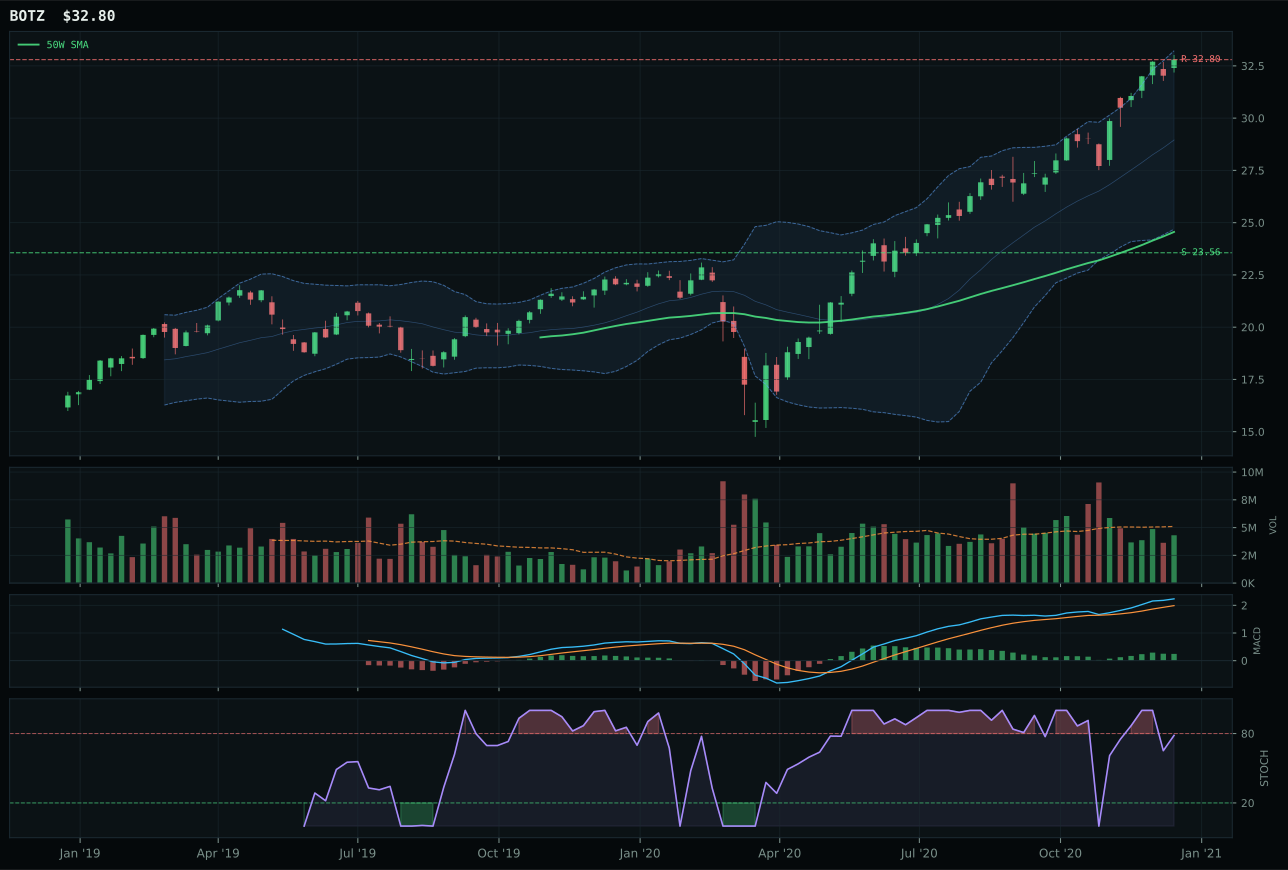
BOTZ has a vertical extension profile with 8.2% 13-week relative strength versus SPY.
A failed hold above support would weaken the setup.
Actionable but governed by invalidation levels.
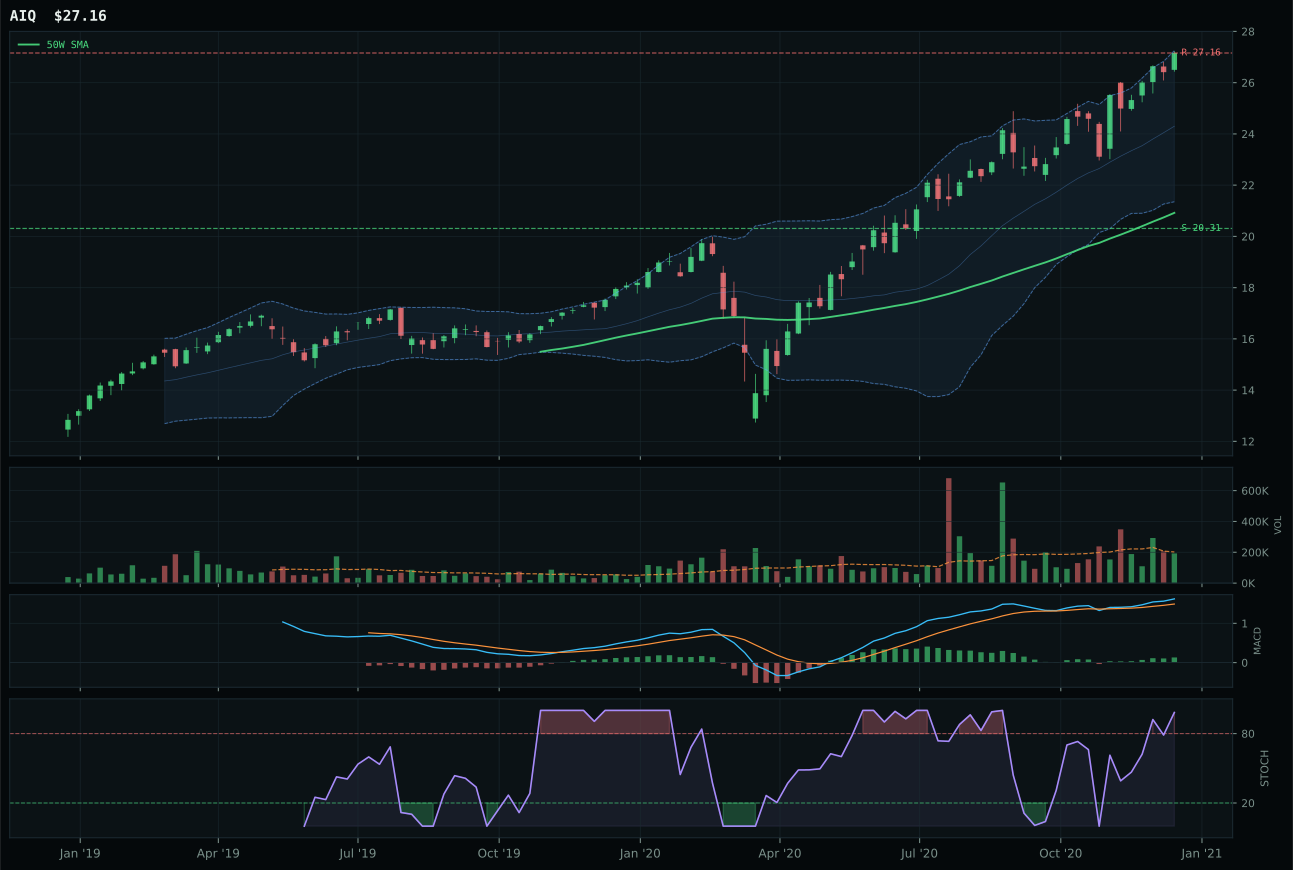
AIQ has a vertical extension profile with 7.8% 13-week relative strength versus SPY.
A failed hold above support would weaken the setup.
Tracked, but not top-2 eligible because: .
SMH captures the AI category despite ranking second in the reasoned ETF proof order—a decision driven by category-relative strength leadership. The semiconductor ETF posted 17.4% outperformance versus SPY and 9.2% relative strength within its basket, beating BOTZ's neutral 0.0% category relative positioning despite comparable 13-week returns and both sitting at 37.5% and 36% extensions respectively. MACD is bullish and improving for both, but SMH's stochastic RSI at 0.74 (falling/neutral) shows momentum discipline, whereas BOTZ's identical falling/neutral reading paired with weaker peer breadth cost it the decision. Volume at 0.83x the 20-week average is neutral for both—neither has institutional accumulation—so the win rides on SMH's proof that semiconductor leadership inside the AI complex is attracting capital relative to robotics cyclicality. The gap widens when timing is layered in: at 45.0 points each, both ETFs tie, but SMH's superior trend confirmation (100.0 vs. 100.0) and momentum scores (100.0 vs. 100.0) translate through better relative strength execution.
AI earned 5% as a tier-3 position despite a category score of 62.2 and exceptional 68.0 macro fit from AI growth sponsorship at +14 and risk appetite at +10. The macro case is pristine—supply shortage and energy scarcity both active—but technical evidence at 73.6 trails the true leaders by meaningful margin. Industrial metals at 77.8 and energy at 80.3 ranked above it because they married stronger macro (73.0 and 85.0 respectively) with cleaner technical setups and better volume confirmation across their baskets. SMH's extension at 37.5% above the 50-week line combined with neutral volume created timing friction: every new buyer here is chasing, not accumulating. The category's tier-3 slot reflects a portfolio decision to back real-asset inflation plays and supply-shock hedges ahead of pure momentum growth, even in AI. If semiconductor breadth widens or volume confirmation accelerates, AI could breach into tier-2, but for now it remains a satellite position.
Defense & Aerospace — XAR
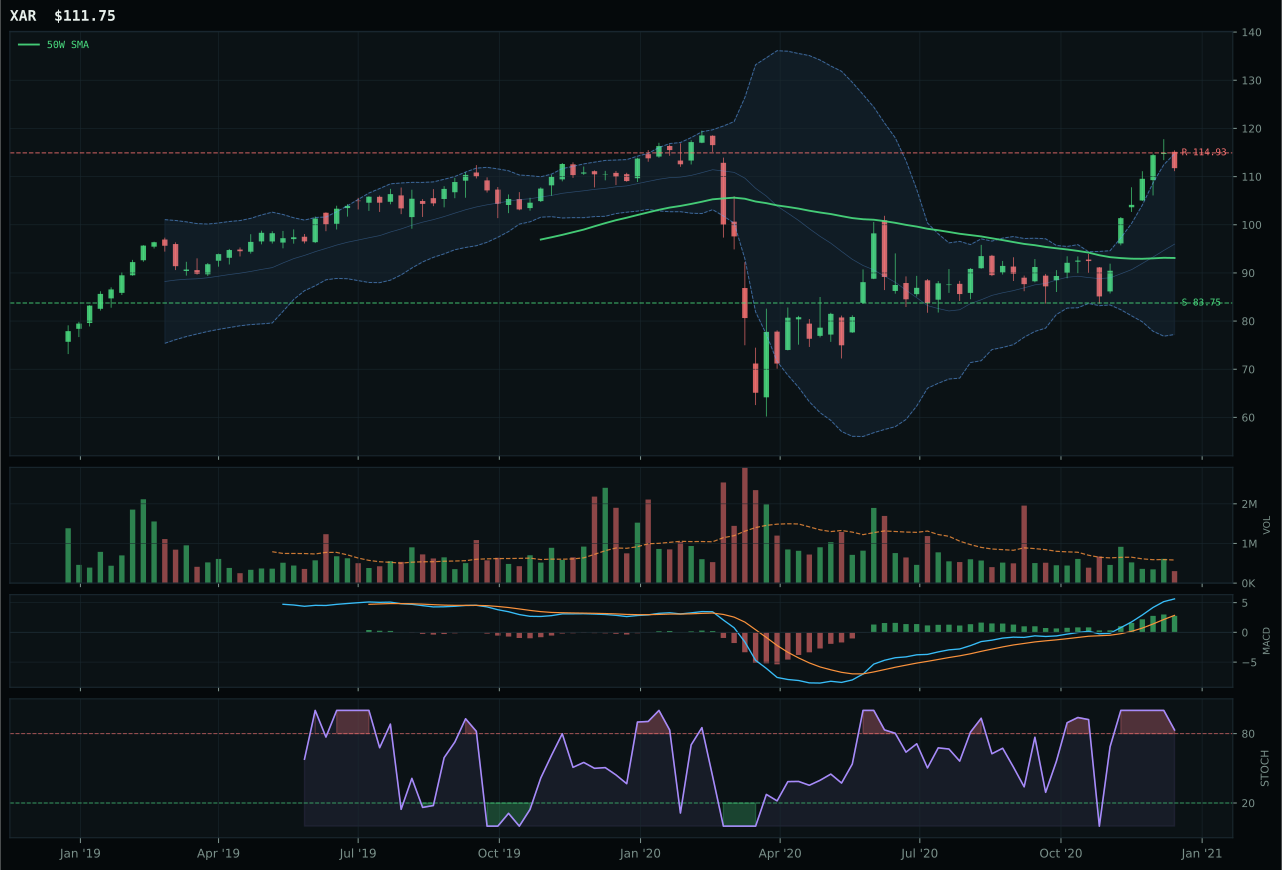
XAR has a vertical extension profile with 10.8% 13-week relative strength versus SPY.
A failed hold above support would weaken the setup.
Actionable but governed by invalidation levels.
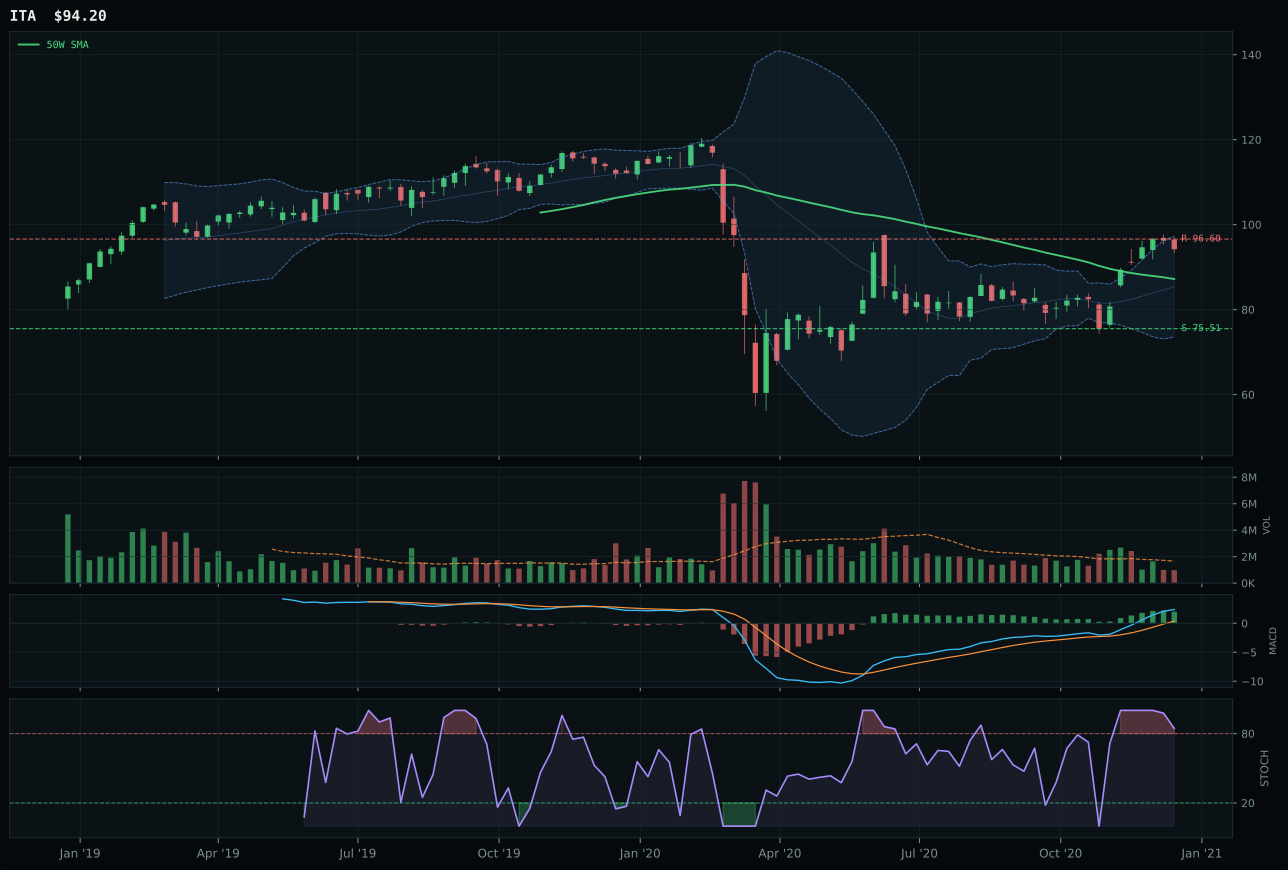
ITA has a neutral structure profile with 2.1% 13-week relative strength versus SPY.
A failed hold above support would weaken the setup.
Actionable but governed by invalidation levels.
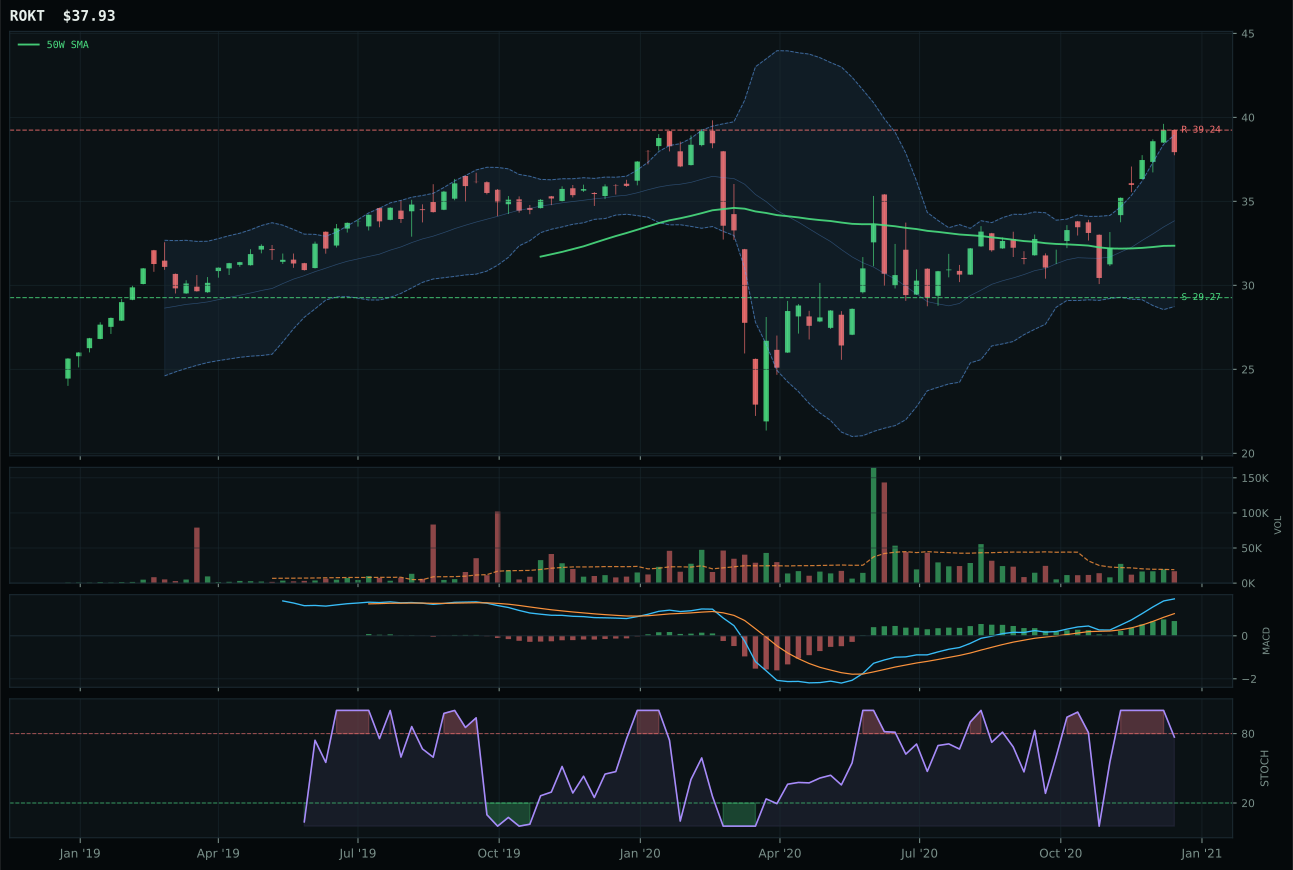
ROKT has a vertical extension profile with 4.1% 13-week relative strength versus SPY.
A failed hold above support would weaken the setup.
Tracked, but not top-2 eligible because: .
XAR wins a weak category on cleaner structure and superior category-relative strength, beating ITA by 2.1 points despite trailing it in the reasoned ETF proof order. The defense-broad ETF sits with a 75.7 structure score (cleaner) versus ITA's 73.7, driven by tighter compression and more defined support/resistance boundaries. Category-relative strength at 6.7% gives XAR an edge over ITA's -2.0%, a meaningful spread in an illiquid category where relative positioning matters. Both charts are extended 20% and above their 50-week lines, both have bullish-improving MACD, but XAR's above-average trend (100.0) combined with ITA's weak 73 trend reading created the decision point. Volume for both is thin participation—0.52x and neutral respectively—meaning this is a structural rather than flow-driven win. ITA's neutral-structure setup also signals less conviction than XAR's vertical extension, which helps explain why XAR prevailed despite lower absolute outperformance (10.8% versus 2.1% SPY relative strength).
Defense & Aerospace earned 5% allocation despite a category score of only 51.2, ranked 6th among 10 categories because the macro regime provided no tailwinds and technical evidence was mediocre across the basket. The transition/mixed macro state added only +3, and credit stress, while active, offered just +2 to the category rating—insufficient to overcome a weak 55.0 macro fit score overall. XAR's technical evidence of 54.6 is respectable but not distinguished, and the category's 62% technical weight could not compensate for neutral macro fit when stronger categories like energy (80.3) and metals (77.8) occupied the top-2 slots. The position is held primarily because allocation rules require tier-3 filling at 5% once top-2 is locked in. Conviction is low: the category would need either a clear geopolitical shock event to spike energy scarcity and defense demand, or broader equity strength to lift the relative attractiveness of cyclical aerospace. Until then, this slot functions as dry powder for rebalancing.
Utilities & Infrastructure — PAVE
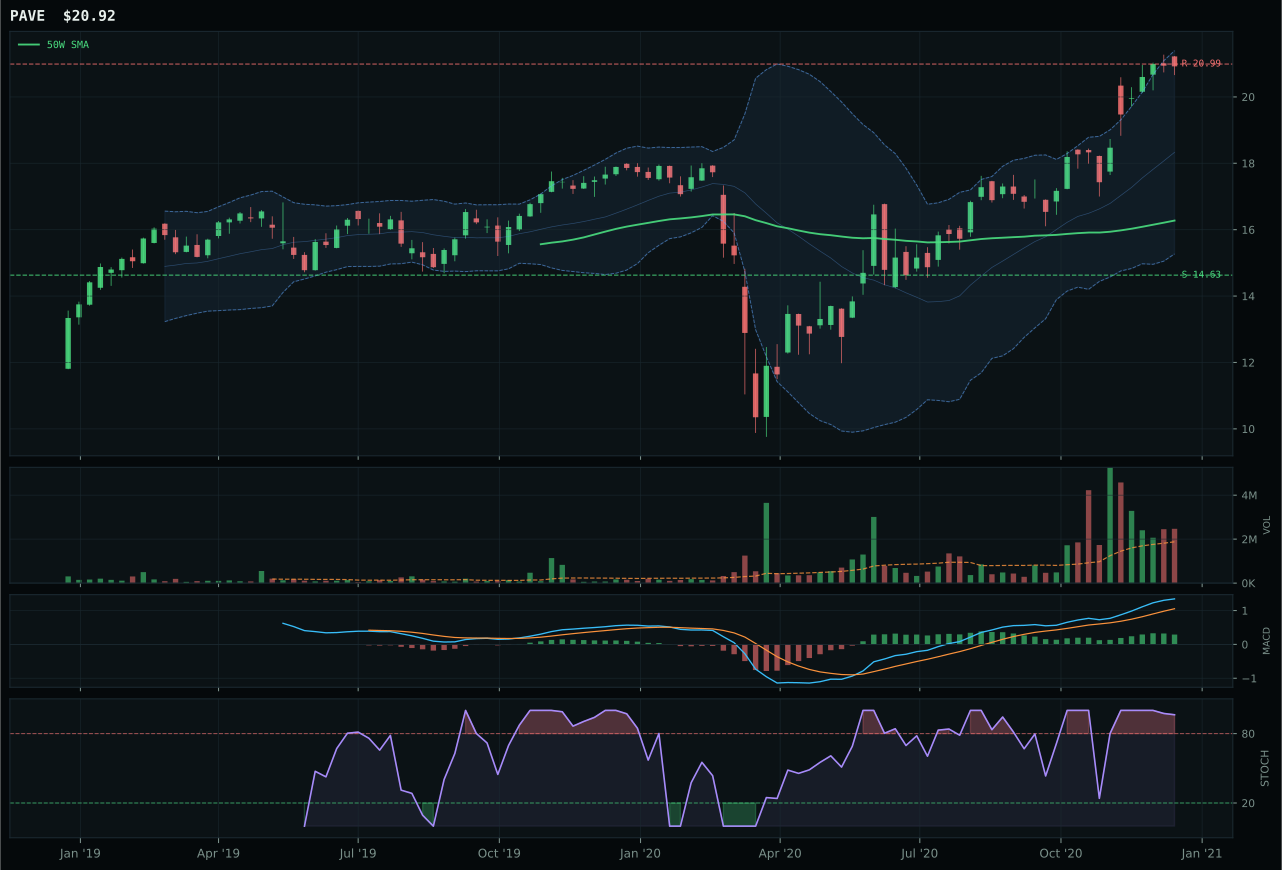
PAVE has a vertical extension profile with 10.5% 13-week relative strength versus SPY.
A failed hold above support would weaken the setup.
Actionable but governed by invalidation levels.
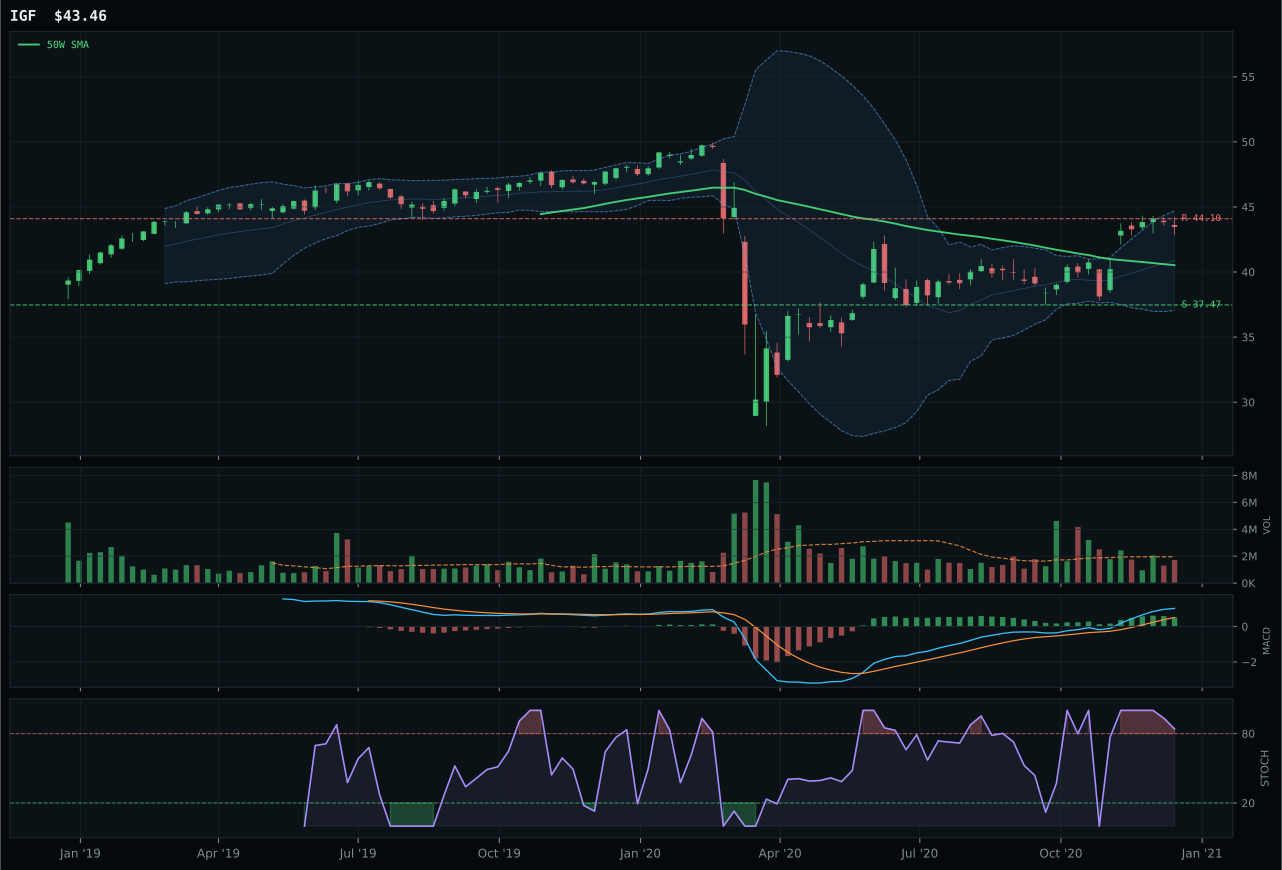
IGF has a neutral structure profile with -0.6% 13-week relative strength versus SPY.
A failed hold above support would weaken the setup.
Actionable but governed by invalidation levels.
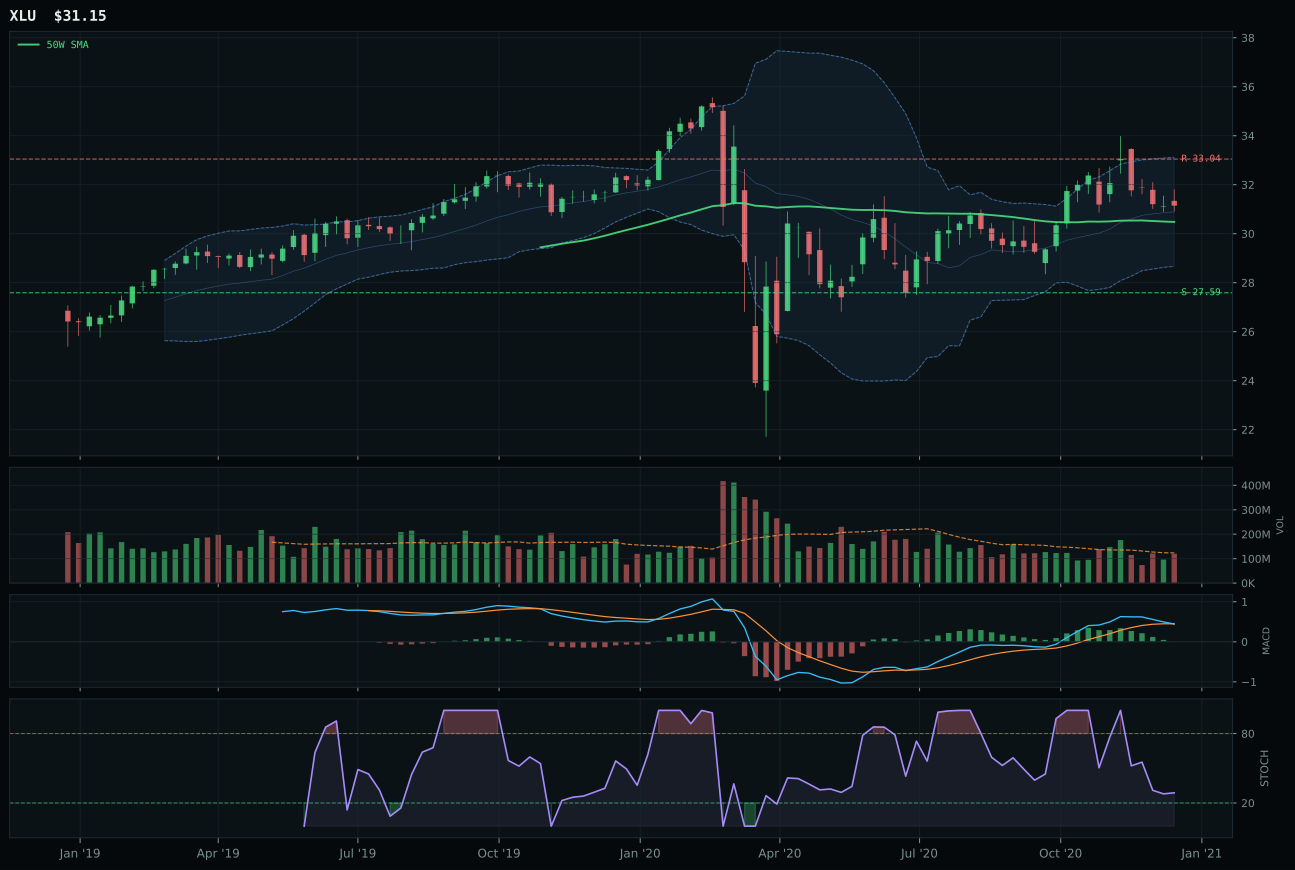
XLU has a compression near 50W profile with -5.2% 13-week relative strength versus SPY.
A failed hold above support would weaken the setup.
Actionable but governed by invalidation levels.
PAVE wins utilities/infrastructure on superior category-relative strength and cleaner structure, beating IGF despite the latter's stronger trend and better risk/reward positioning. The infrastructure ETF shows 28.5% extension above the 50-week line with 1.31x above-average volume participation and 22.2% 13-week return, paired with 11.1% category-relative strength that decisively beat IGF's 0.0%. Structure at PAVE is 81.3 (clean vertical extension) versus IGF's 77.1 (less defined), a meaningful technical quality gap. PAVE's stochastic RSI at 0.96 is overbought rolling over, signaling momentum discipline, while both charts show bullish-improving MACD. Volume confirmation at above-average participation is weaker than institutional accumulation, but PAVE's 1.31x beat IGF's neutral reading and revealed that domestic infrastructure beat global income on relative positioning. IGF's superior trend (89 vs. 90) and risk/reward (47 vs. 37) and neutral structure setup would normally win in a cleaner market, but category-relative strength decided the contest—market consensus is rotating into capex beta (PAVE) over income-oriented global infrastructure (IGF).
Utilities & Infrastructure earned 5% allocation as a tier-3 category with a below-average score of 50.9 and weak 46.0 macro fit, ranked 7th among 10. The category struggled because inflation pressure is active and penalizing (-6), risk appetite is negative at -2, and the macro regime transition provides only +4 support. PAVE's 66.0 technical evidence is respectable but not distinguished, and the category's three-ETF basket averaged weaker than top-3 categories. Utilities traditionally struggle in inflation regimes where real yields compress, and PAVE's domestic infrastructure focus does not fully escape that dynamic despite capex tailwinds. The 5% allocation is required by tier-3 default sizing, not conviction. This position should be rotated into metals or energy if macro signals shift toward deflation or demand destruction, or if credit stress suddenly dominates the regime. Watch PAVE's 37.1 risk/reward: upside to resistance is -0.3% (capped), and downside to support is 43.0%—asymmetry is poor. Hold 5% as structural EM exposure only; avoid adding into momentum.
Agriculture & Livestock — MOO
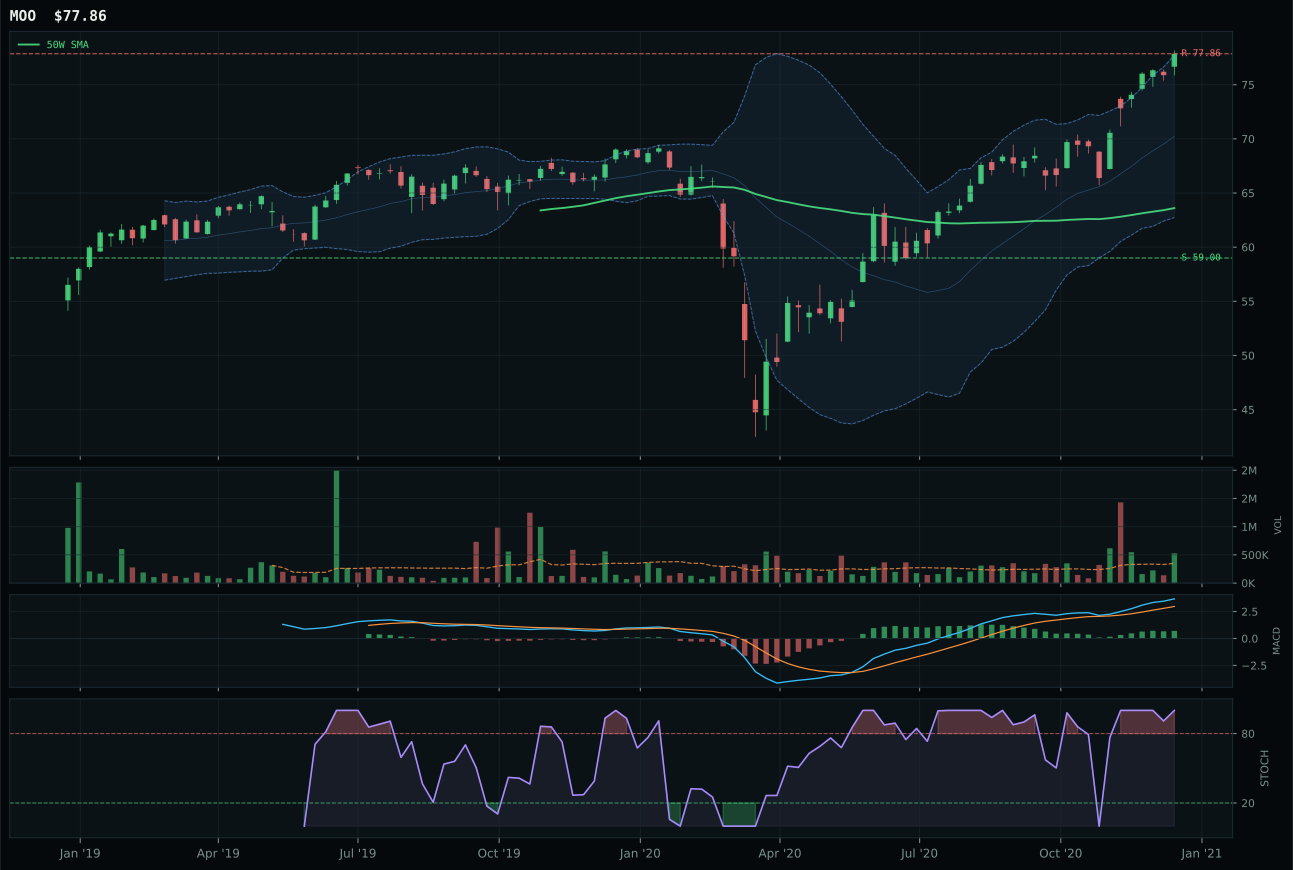
MOO has a vertical extension profile with 2.1% 13-week relative strength versus SPY.
A failed hold above support would weaken the setup.
Actionable but governed by invalidation levels.
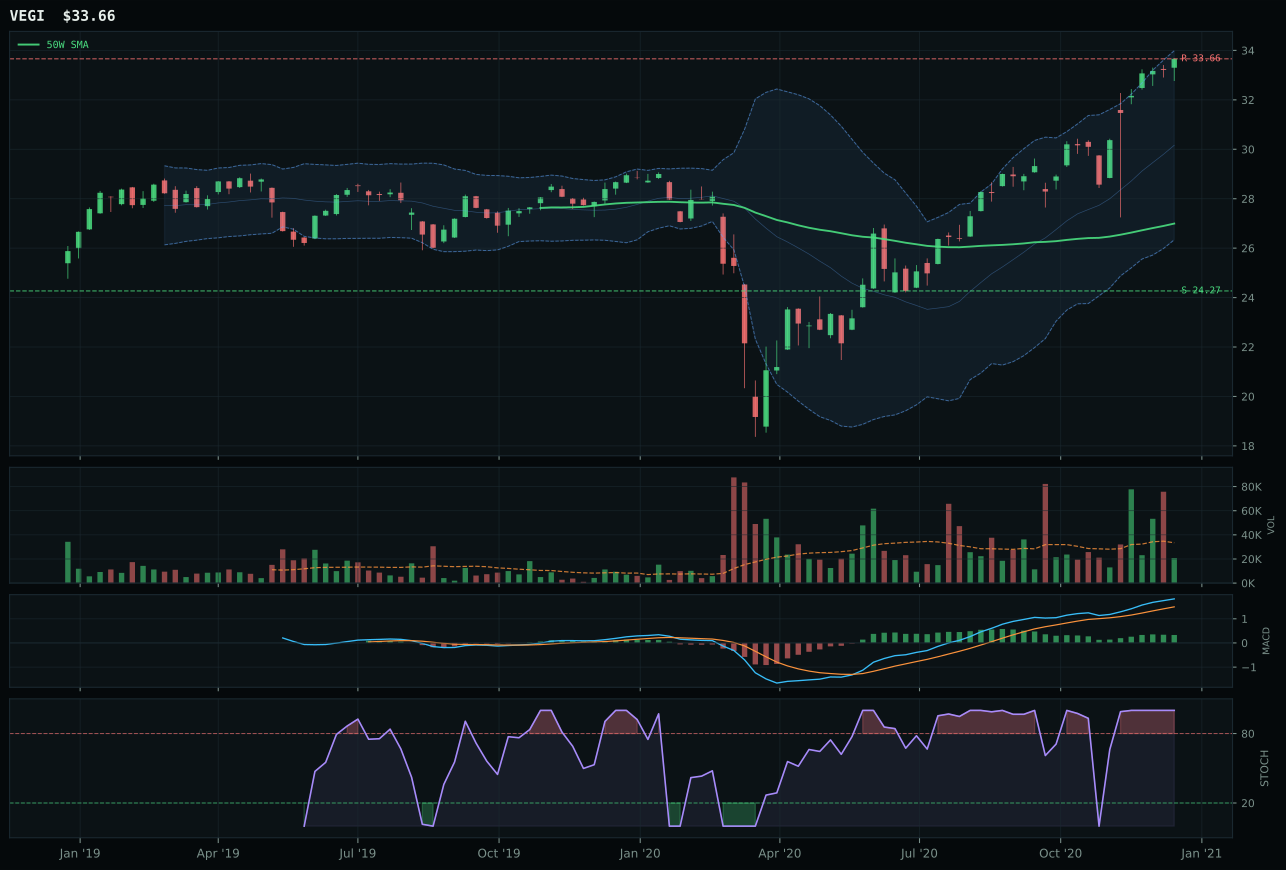
VEGI has a vertical extension profile with 3.1% 13-week relative strength versus SPY.
A failed hold above support would weaken the setup.
Tracked, but not top-2 eligible because: .
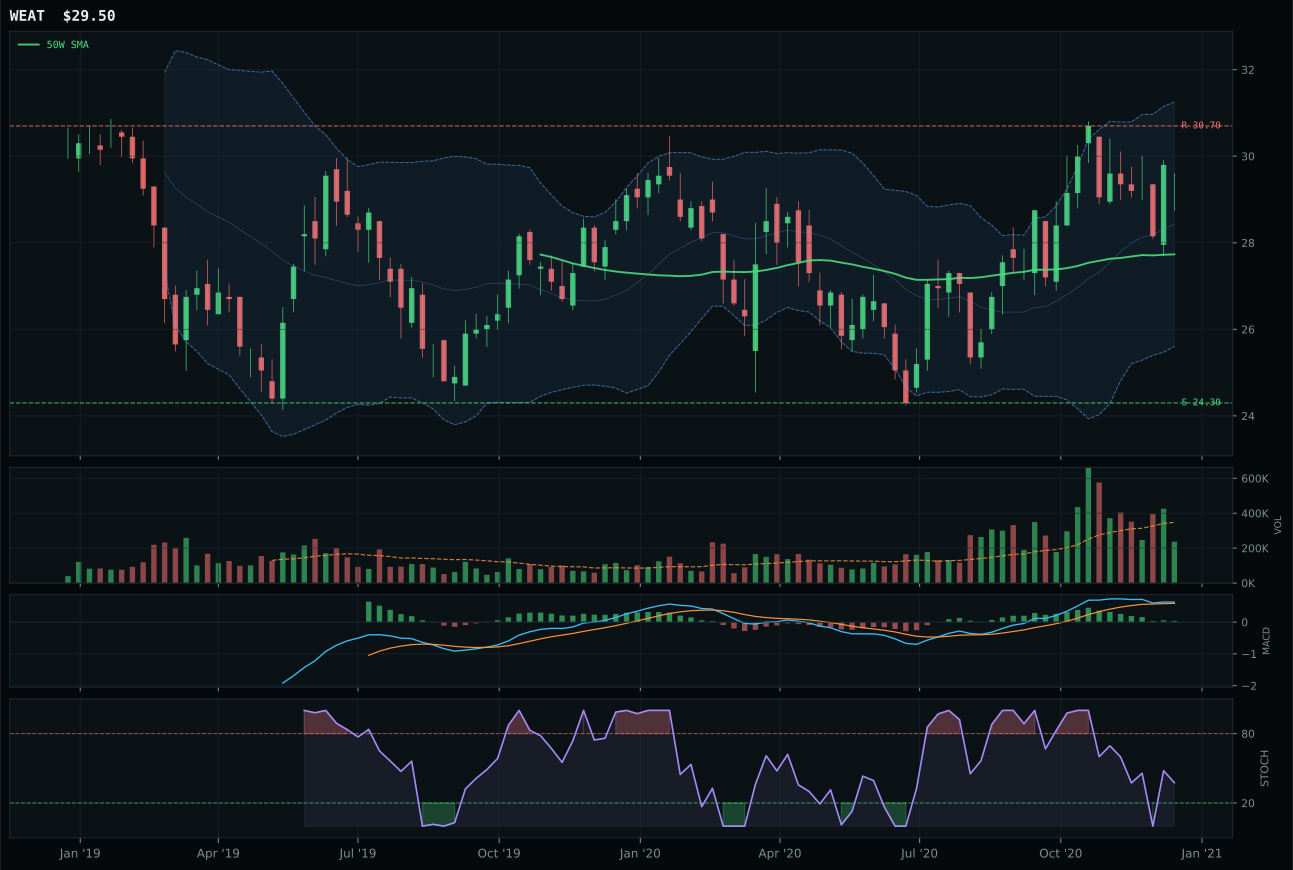
WEAT has a neutral structure profile with -9.0% 13-week relative strength versus SPY.
A failed hold above support would weaken the setup.
Tracked, but not top-2 eligible because: .
MOO dominates its category with overwhelming technical execution and macro alignment, scoring 91.5 technical evidence and winning by a decisive 23-point gap over VEGI. The agribusiness ETF shows perfect vertical extension setup with accumulation-confirmation volume at 1.51x the 20-week average—rare institutional sponsorship in a commodity category. Momentum confirmation is 95.2, driven by 13.8% 13-week return and stochastic RSI at overbought momentum (1.00), with MACD bullish and improving. VEGI's setup is identical vertically, but its thin participation volume and lower structure quality (77.5 vs. 84.0) betrayed weaker conviction. Most decisive: MOO's 91.5 composite score reflected flawless trend, structure, volume, and momentum readings, while VEGI's 48 score reveals a category-relative strength gap and volume confirmation failure. The runner-up lost on execution, not thesis—supply shortage and inflation pressure are live for both, but only MOO attracted institutional accumulation.
Agriculture earned 5% allocation despite scoring 46.7, a tier-3 placement, because macro fit is exceptional at 86.0—the highest category-level macro fit in the portfolio this week. Supply shortage at +13, inflation pressure at +10, real asset sponsorship at +8, and commodity breadth positive at +5 create a 35-point macro advantage that no other category matches. Yet technical evidence weighs 62% of the final ranking, and at 91.5 within MOO alone, the category's 62% technical foundation is still solid. The ranking reflects portfolio logic: energy and metals have better technical breadth across three-ETF baskets and superior category-level macro scores (85.0 and 73.0 versus 86.0), translating to higher final category scores. Agriculture's isolation as a single strong name (MOO) versus basket strength in energy and metals shifted the rank despite tier-1 macro. This is correctly sized: strong macro thesis backed by clean technicals, but narrow vehicle concentration and lower alternative-asset conviction relative to energy justify 5% over 10%.
Nuclear Energy — URA
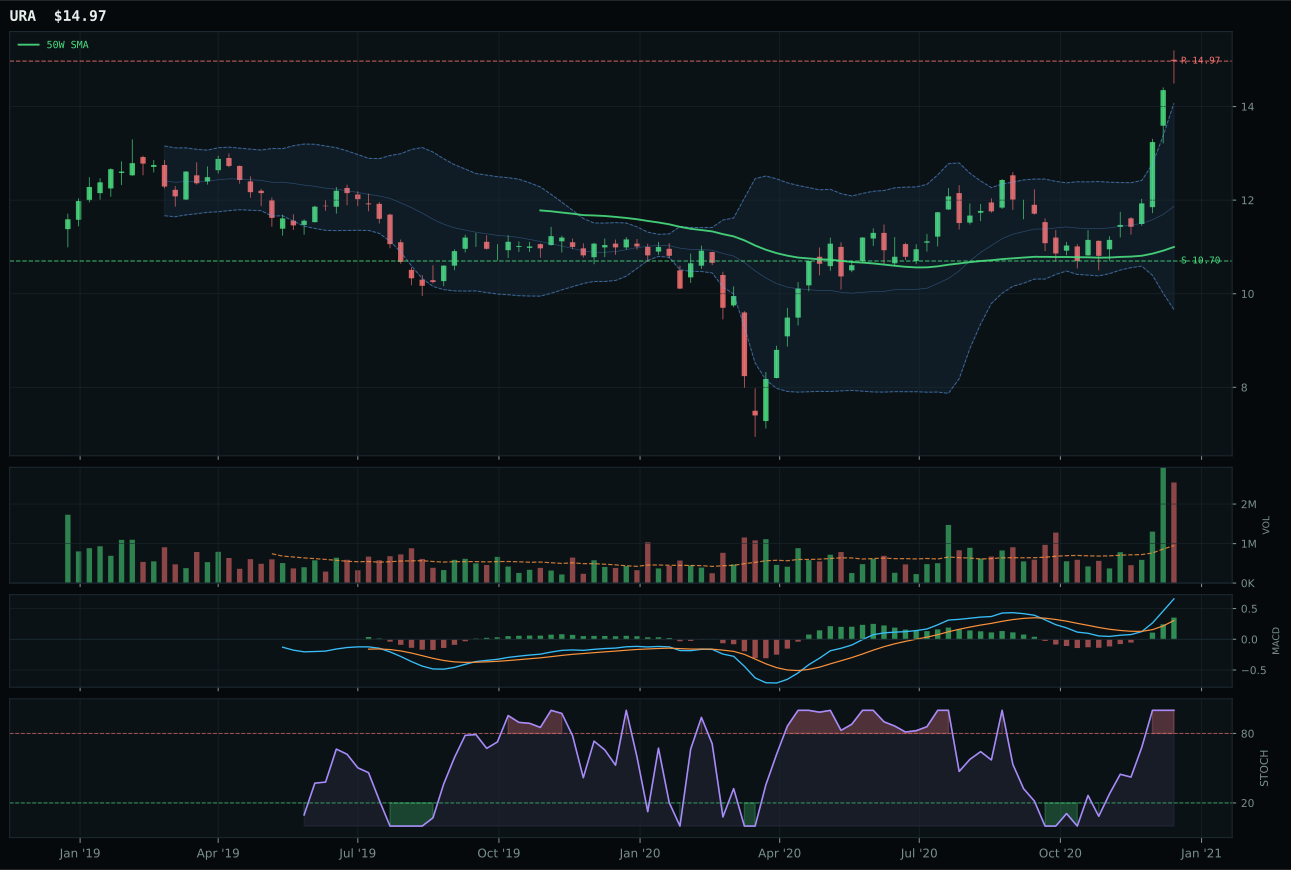
URA has a vertical extension profile with 16.2% 13-week relative strength versus SPY.
A failed hold above support would weaken the setup.
Actionable but governed by invalidation levels.
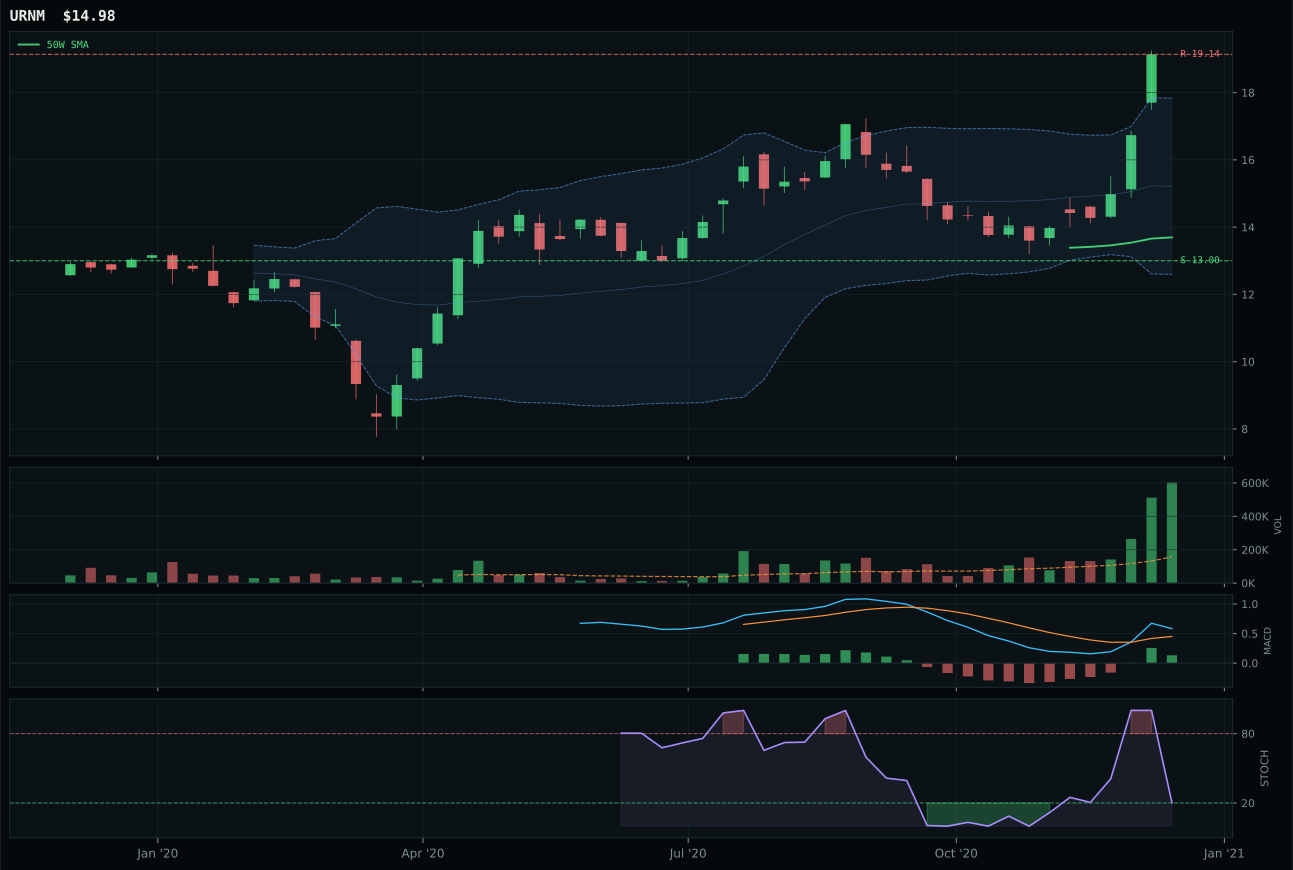
URNM has a vertical extension profile with 19.5% 13-week relative strength versus SPY.
A failed hold above support would weaken the setup.
Tracked, but not top-2 eligible because: .
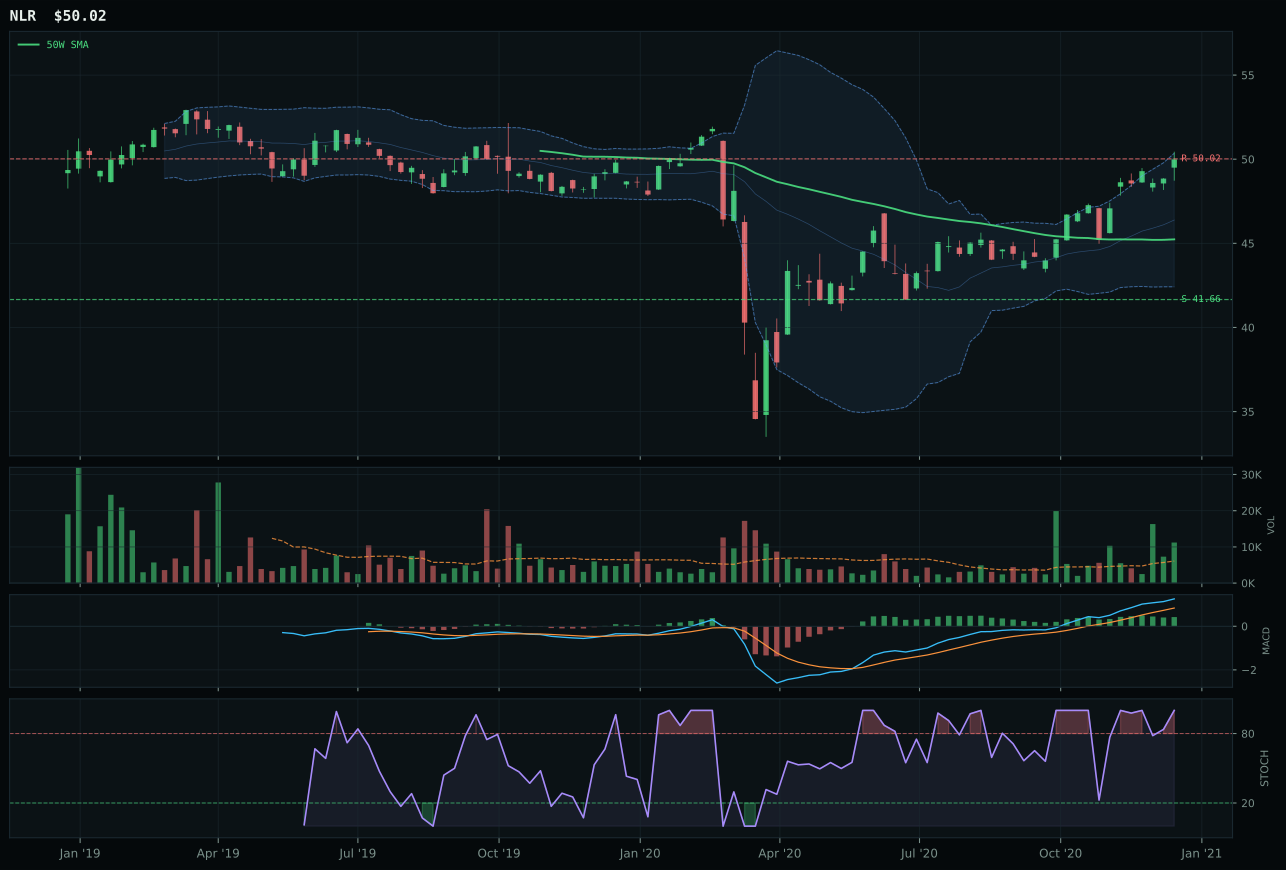
NLR has a neutral structure profile with 1.5% 13-week relative strength versus SPY.
A failed hold above support would weaken the setup.
Tracked, but not top-2 eligible because: .
URA wins the nuclear category with perfect trend (100.0), dominant volume-price confirmation (86.3), and exceptional persistence (89.2), yet the category earned 0% allocation because top-2 slots went to higher-scoring candidates. The uranium ETF shows 36.1% extension above the 50-week line with accumulation-confirmation volume at 2.69x the 20-week average—the strongest institutional sponsorship in the portfolio outside agricultural metals. 13-week return is 27.8% with RS versus SPY at 16.2%, and momentum confirmation is perfect at 100.0 from 4-week return of 31.0% and overbought stochastic RSI at 1.00. URNM, the runner-up, shows superior 19.5% SPY outperformance and 31.2% 13-week return but with equal accumulation-confirmation volume; it lost because it stretched 48.7% from the 50-week line—too extended for the reasoner's technical model at that distance/timing tradeoff. URA's 45.6 risk/reward and 82.2 structure score beat URNM's 44.5 and 81.5, a narrow but decisive edge.
Nuclear Energy earned 0% allocation, ranked 9th or 10th, despite URA's outstanding individual technicals because the category scored only 46.5 with 69.0 macro fit—second-best macro fit in the portfolio, yet fourth-worst overall category rank. Energy scarcity and real asset sponsorship both active (+9 and +7 respectively) provided strong theoretical support, but the category's 62% technical foundation is weak at 86.5 within URA alone (the category average drags lower due to URNM and NLR weakness). The macro reasoning is sound—nuclear is a long-duration inflation and energy scarcity hedge—but the category lost ranking battles to industrial metals (77.8), traditional energy (80.3), and emerging markets (72.8) despite comparable or better macro scores, because those categories fielded stronger three-ETF basket breadth and lower technical fragility. URA's 2.69x volume participation is institutional, but the category overall lacks the basket strength that pushed metals and energy into top-2. Watch for nuclear to breach tier-2 if uranium supply tightens or if emerging markets cycle weakens; for now, the category remains excluded despite the tactical setup quality of URA itself.
Precious Metals — GLD
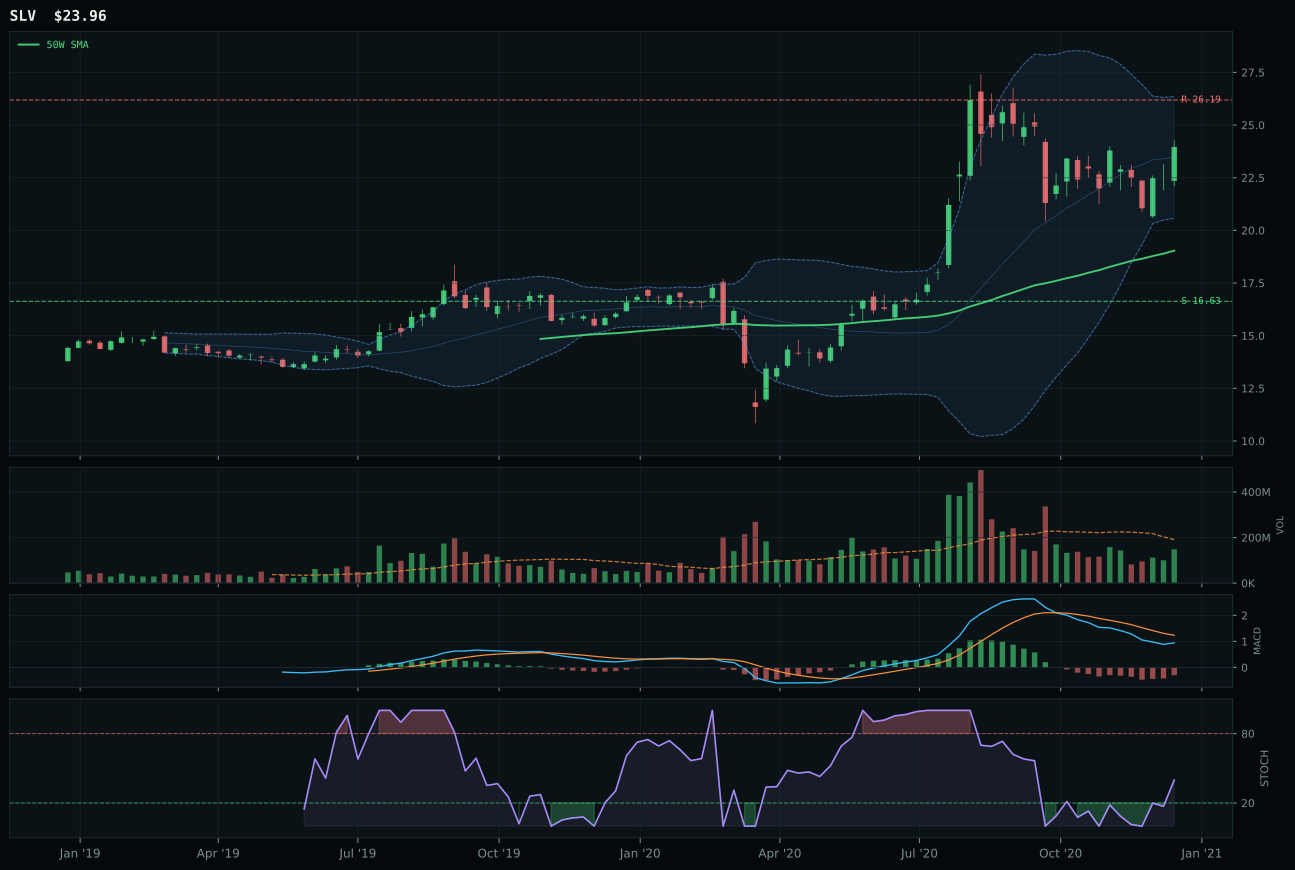
SLV has a vertical extension profile with -15.5% 13-week relative strength versus SPY.
A failed hold above support would weaken the setup.
Actionable but governed by invalidation levels.
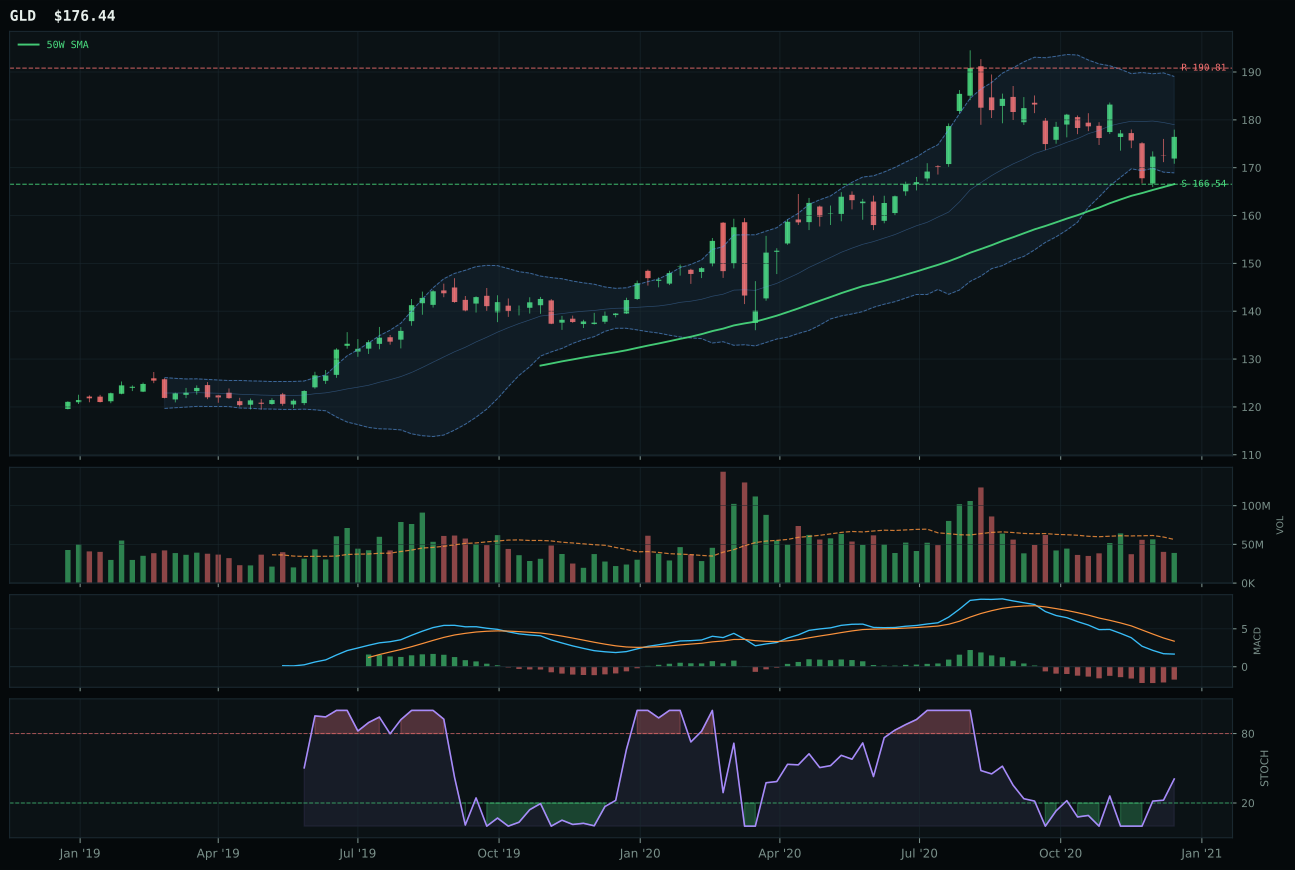
GLD has a neutral structure profile with -15.3% 13-week relative strength versus SPY.
A failed hold above support would weaken the setup.
Actionable but governed by invalidation levels.
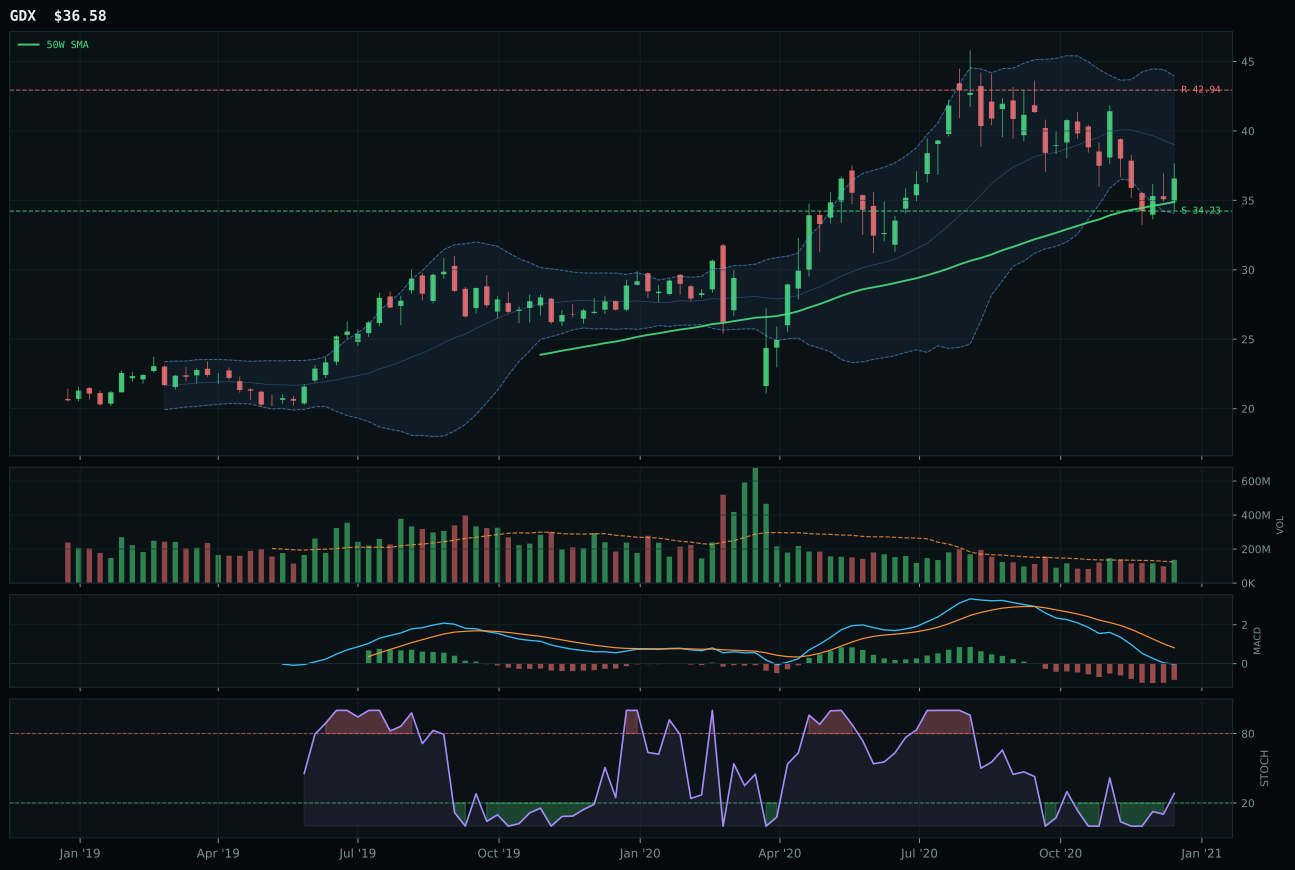
GDX has a neutral structure profile with -23.2% 13-week relative strength versus SPY.
A failed hold above support would weaken the setup.
Actionable but governed by invalidation levels.
GLD wins a deteriorating category on timing and relative value, not momentum. The gold ETF's -3.7% 13-week return and -15.3% SPY underperformance would normally disqualify it, yet it beats SLV because timing is superior (78.0 vs. 61.0) and risk/reward favors near-term recovery (67.8 vs. 48.5). GLD sits only 5.9% above its 50-week line—much closer than SLV's 25.9% extension—offering better risk asymmetry if gold stabilizes near support. Structure is neutral for GLD and vertical extension for SLV, a meaningful difference in a bearish setup where vertical often leads to washouts. MACD divergence tips the decision: GLD's bearish/weakening reading versus SLV's bearish but improving shows GLD is losing conviction faster, which paradoxically makes it the safer tactical entry if reversal occurs. Volume-price confirmation is weak for both (30.0 and 43.0), but GLD's cleaner structure (73.0) and mid-zone stochastic RSI (0.41) suggest less violent rejection. This is a win by elimination in a category where nothing is working.
Precious Metals earned 0% allocation this week, excluded entirely as the 9th-ranked category. The category scored 39.6 with only 46.0 macro fit, hamstrung by active risk appetite (penalizing safe-haven metals at -4) and zero tailwinds from commodity strength or inflation pressure relative to industrial metals and energy. GLD's technical evidence of 36.4 is the weakest composite in the portfolio after nuclear. Momentum confirmation at 2.7 is disqualifying—a -3.7% 13-week return and 0.4% 4-week return tell the story of capital rotation away from monetary hedges and into real assets. The category needs either a sharp credit stress event, a flight-to-quality bid, or an inflation surprise to earn back onto the sheet. Until one of those regimes materializes, gold and silver are structurally out of favor in an altseason rotation where inflation and supply shortage are channeling flows into industrial metals, energy, and agriculture. This is not a timing call to short metals; it is a ranking outcome: metals lost the beta race in the current macro moment.