
2020-12-11
Informational purposes only. The content in this report, including allocations, analysis, and commentary, is provided solely for informational and educational purposes. It does not constitute financial advice, investment advice, trading advice, or any other type of advice. Past performance does not guarantee future results. Always conduct your own research and consult a qualified financial professional before making investment decisions.
Some tracked tickers were excluded due to missing live weekly price data: SGOV: Historical cache SGOV has only 28 usable weekly bars
Weekly Allocation
| Ticker | Category | Weight | Role |
|---|---|---|---|
| FSOL | 50% | Overlay | |
| FCG | Traditional Energy | 10% | Top-2 (10%) |
| PICK | Industrial Metals | 10% | Top-2 (10%) |
| ILF | Emerging Markets | 5% | Tier-2 (5%) |
| SMH | AI | 5% | Tier-2 (5%) |
| CIBR | Technology | 5% | Tier-2 (5%) |
| XAR | Defense & Aerospace | 5% | Tier-2 (5%) |
| PAVE | Utilities & Infrastructure | 5% | Tier-2 (5%) |
| MOO | Agriculture & Livestock | 5% | Tier-2 (5%) |
Trade Instructions — Monday Open
Sell the tranche from 2020-11-13 (completing its 4-week hold). Buy the new tranche. Instructions show net portfolio changes — same-asset positions cancel, weight changes show the delta.
| Action | Ticker | Instruction |
|---|---|---|
| SELL | IGF | Sell entire IGF position (2.50% of portfolio) |
| SELL | ILF | Sell 14% of ILF position (reduce 8.75% → 7.50%) |
| SELL | REMX | Sell 20% of REMX position (reduce 6.25% → 5.00%) |
| SELL | XLK | Sell entire XLK position (1.25% of portfolio) |
| SELL | XLE | Sell entire XLE position (1.25% of portfolio) |
| BUY | PAVE | Buy PAVE — 16.67% of freed cash (adds 1.25% to portfolio) |
| BUY | CIBR | Buy CIBR — 16.67% of freed cash (adds 1.25% to portfolio) |
| BUY | FCG | Buy FCG — 33.33% of freed cash (adds 2.50% to portfolio) |
| BUY | PICK | Buy PICK — 33.33% of freed cash (adds 2.50% to portfolio) |
Current Portfolio After Trade
Combined holdings across all 4 active tranches. Each tranche is 25% of the portfolio.
| Ticker | % of Portfolio | Weight Bar |
|---|---|---|
| FSOL | 50.00% | |
| FCG | 7.50% | |
| ILF | 7.50% | |
| REMX | 5.00% | |
| SMH | 5.00% | |
| XAR | 5.00% | |
| MOO | 5.00% | |
| PAVE | 5.00% | |
| CIBR | 5.00% | |
| COPX | 2.50% | |
| PICK | 2.50% |
Macro Regime — Transition / Mixed
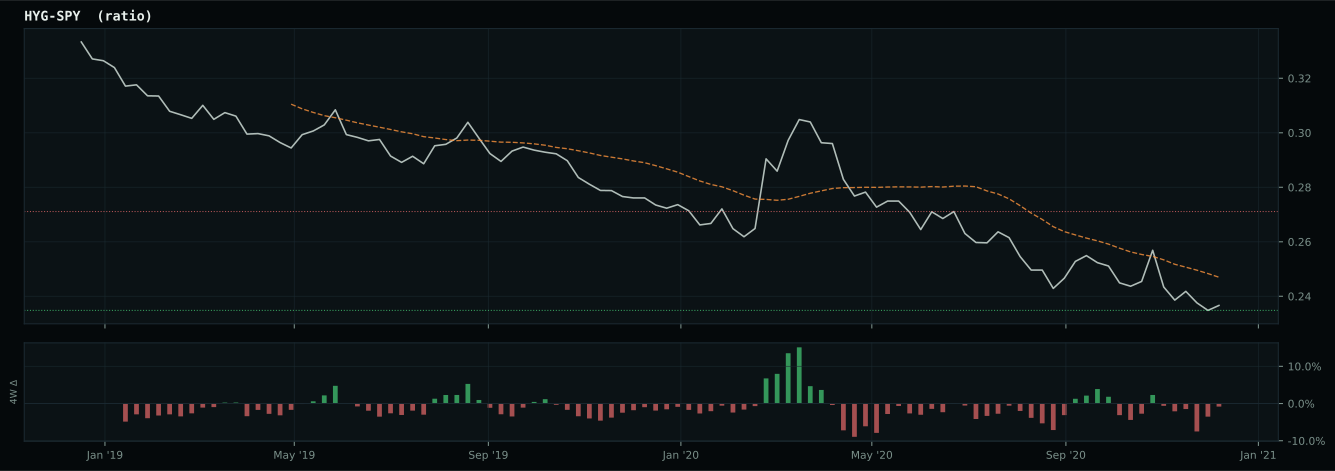
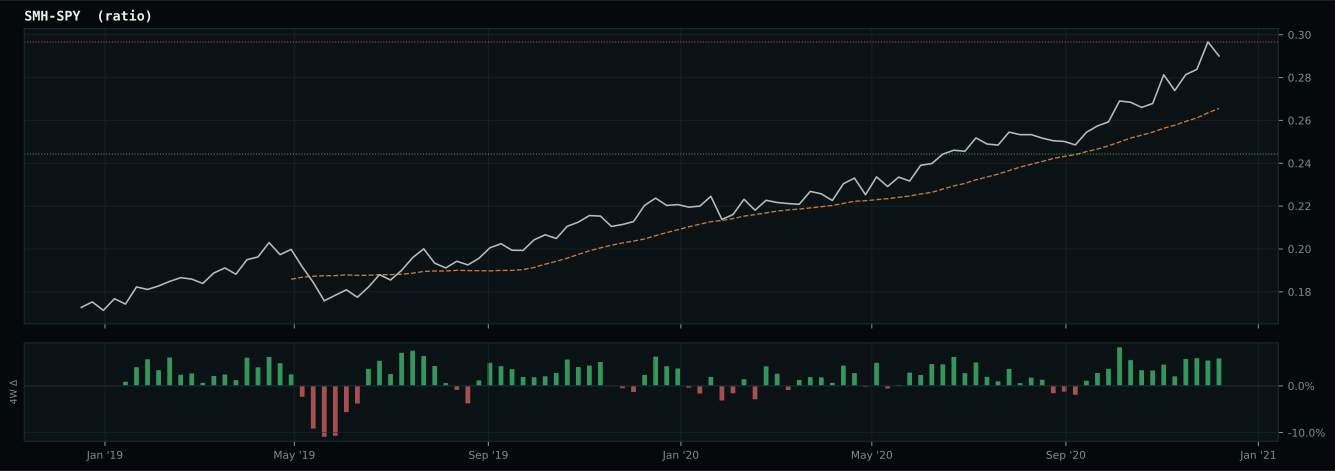
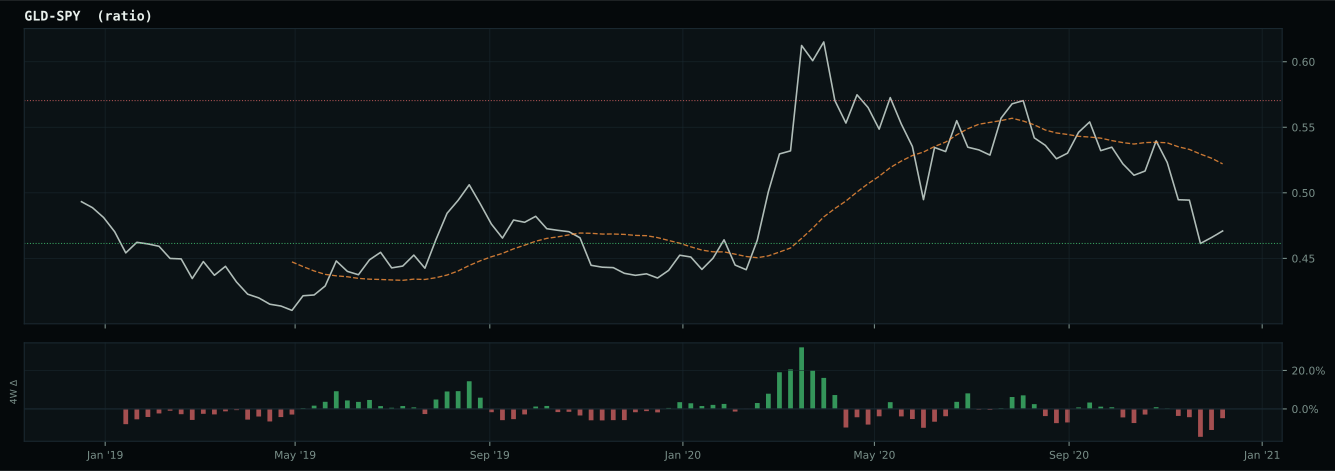
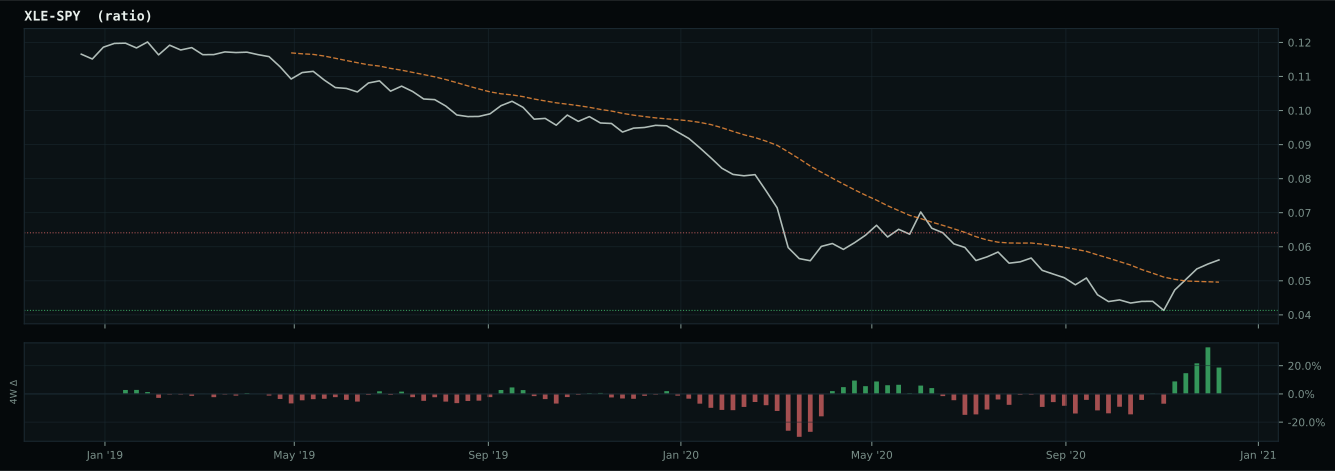
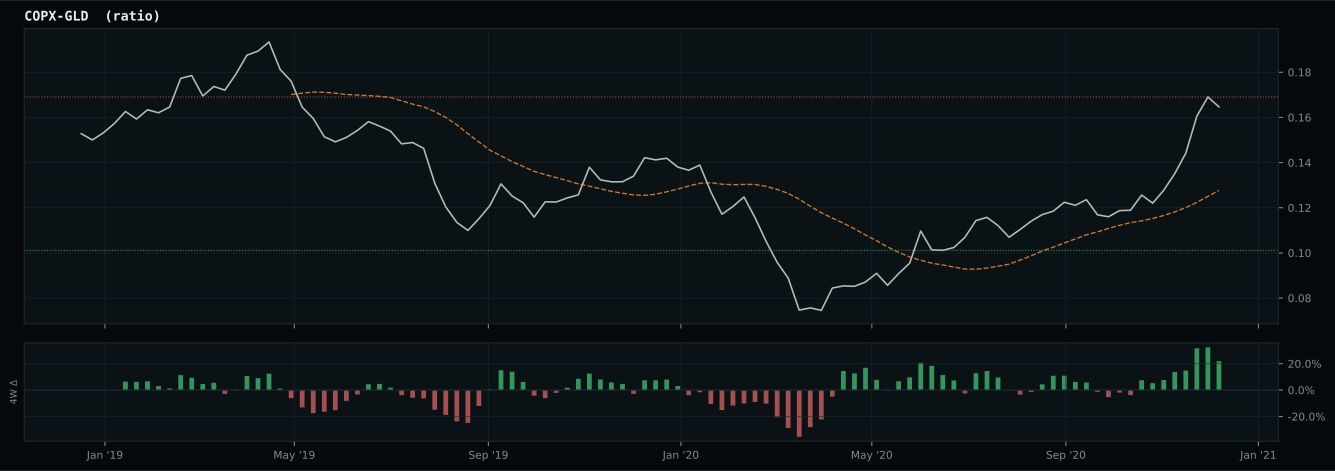
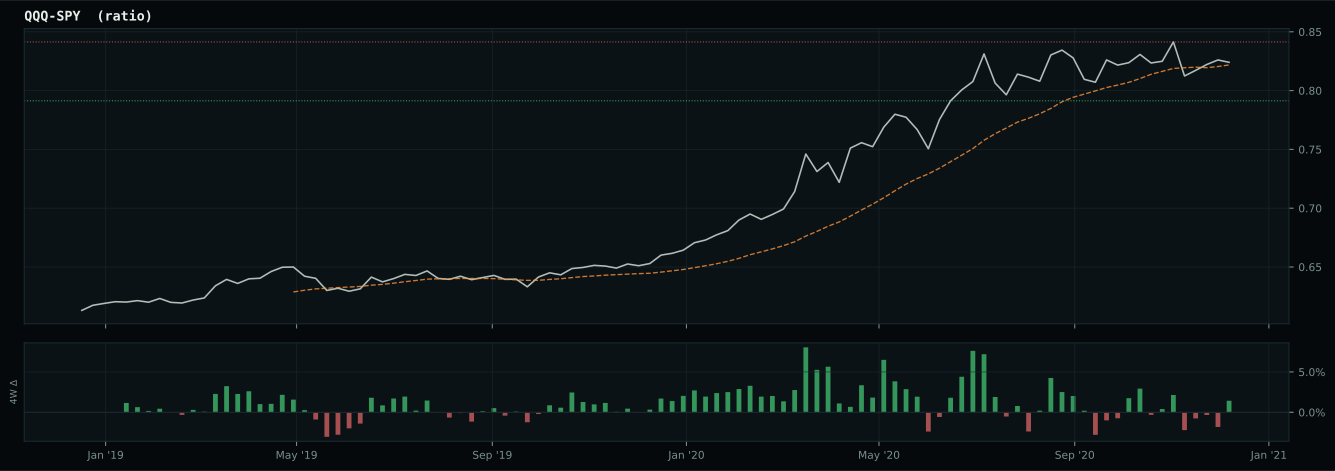
Macro Evidence Charts
Market-implied signals behind the macro regime scores. Each ratio compares two assets; the direction and slope of the ratio is what the macro engine reads.
Crypto Regime — AltSeason
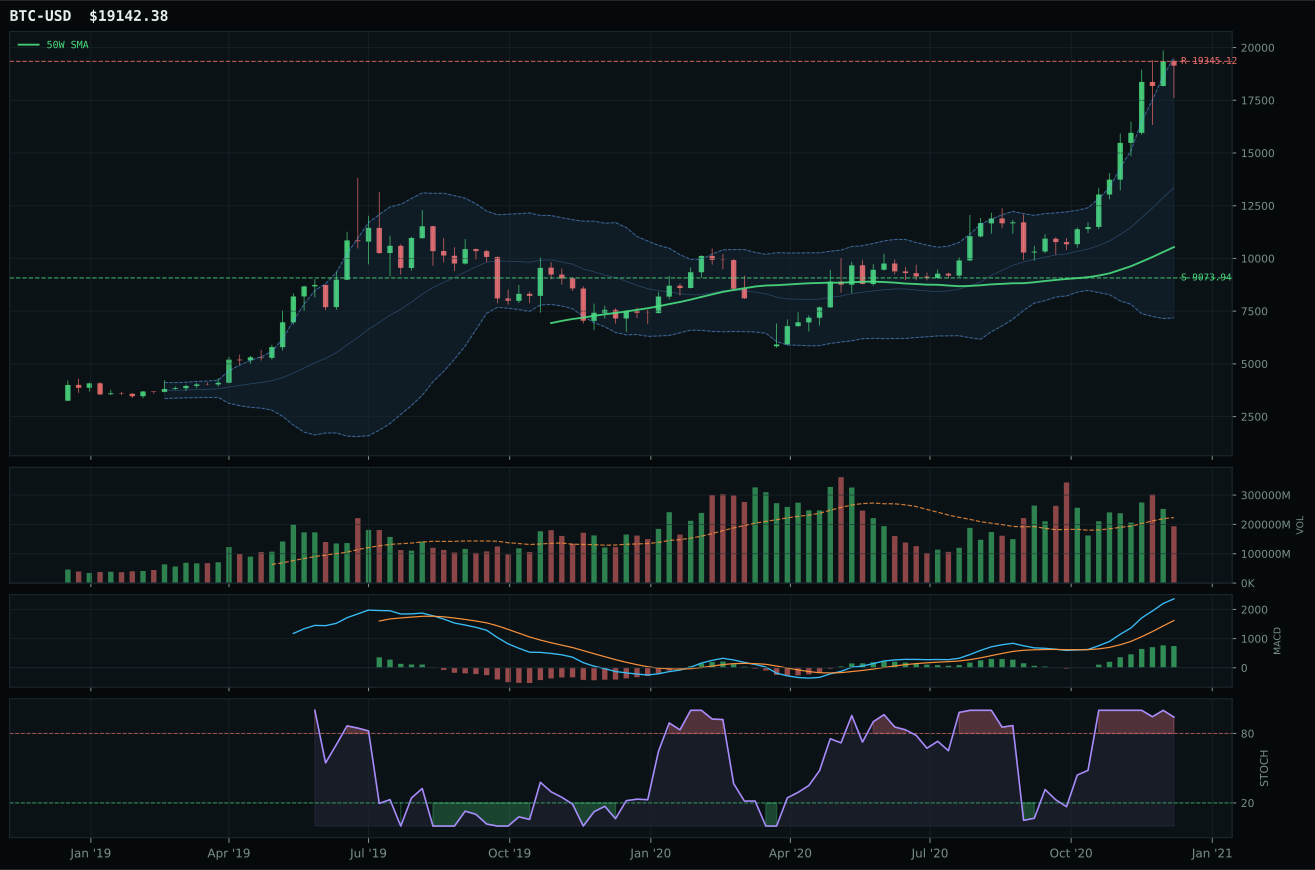
post-touch structure is too wide to count as a range; max/min close ratio is 3.59
TrendBTC confirmed: 2 consecutive closes above rising/flat 50W SMA
all available AltSeason conditions pass; missing optional confirmations skipped

Category Rankings
| Rank | Category | Winner | Score | Alloc | 4W Ret | Peers (4W) |
|---|---|---|---|---|---|---|
| 1 | Traditional Energy | FCG | 89.3 | 20% | -0.10% | XOP +0.2% · XLE -2.9% |
| 2 | Industrial Metals | PICK | 75.8 | 20% | +10.96% | REMX +25.7% · COPX +15.5% |
| 3 | Emerging Markets | ILF | 66.7 | 10% | +3.32% | IEMG +7.0% · INDA +6.8% |
| 4 | AI | SMH | 60.8 | 10% | +7.01% | AIQ +4.1% · BOTZ +5.0% |
| 5 | Technology | CIBR | 59.4 | 10% | +10.61% | IGV +3.0% · XLK +3.9% |
| 6 | Defense & Aerospace | XAR | 55.3 | 10% | -2.16% | ITA -4.5% · ROKT -0.9% |
| 7 | Utilities & Infrastructure | PAVE | 54.0 | 10% | +6.79% | IGF +1.0% · XLU -0.9% |
| 8 | Agriculture & Livestock | MOO | 52.4 | 10% | +6.25% | VEGI +8.0% · WEAT +5.3% |
| 9 | Nuclear Energy | URA | 45.5 | 0% | +8.00% | URNM +14.2% · NLR +0.3% |
| 10 | Precious Metals | GLD | 36.4 | 0% | +0.13% | SLV +2.7% · GDX +2.5% |
Traditional Energy — FCG
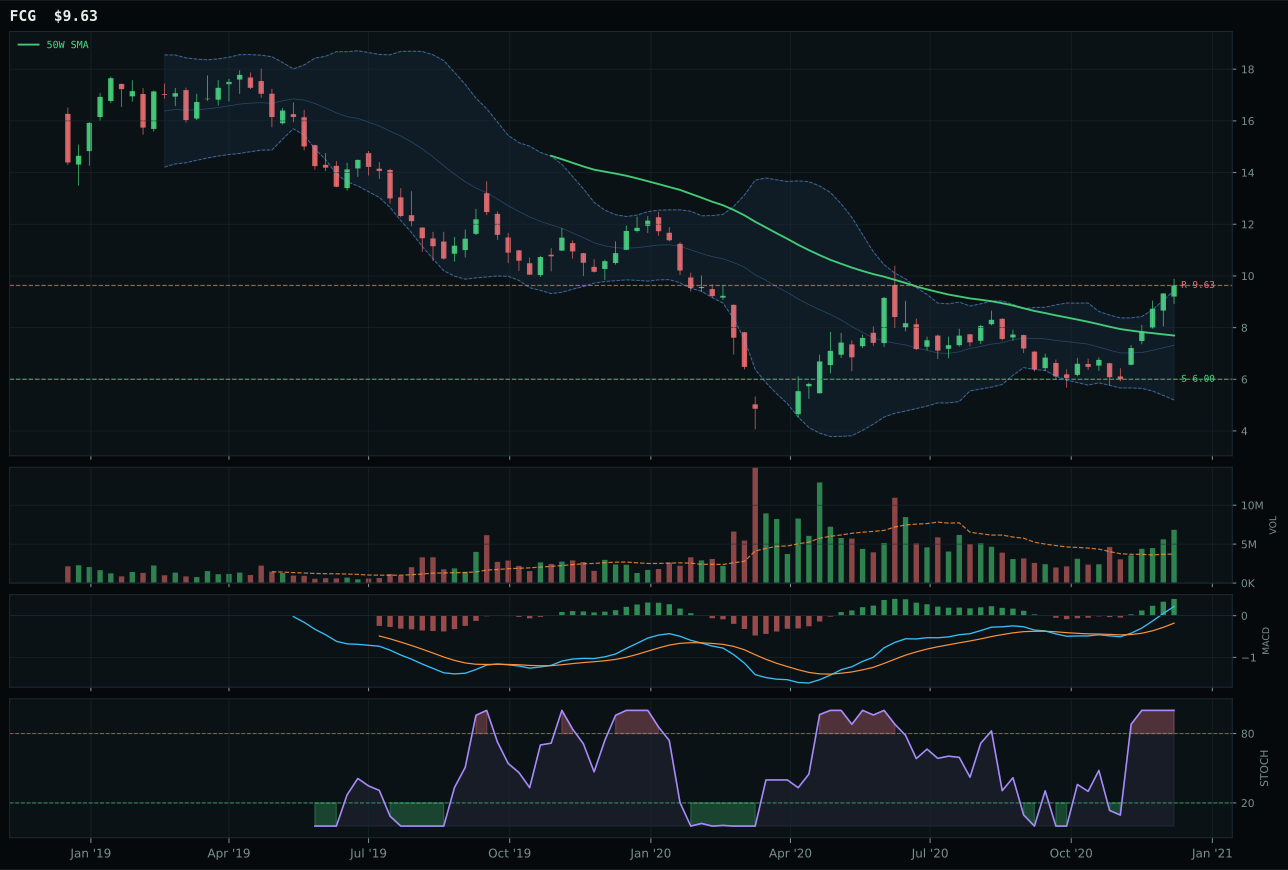
FCG has a vertical extension profile with 41.3% 13-week relative strength versus SPY.
A failed hold above support would weaken the setup.
Actionable but governed by invalidation levels.
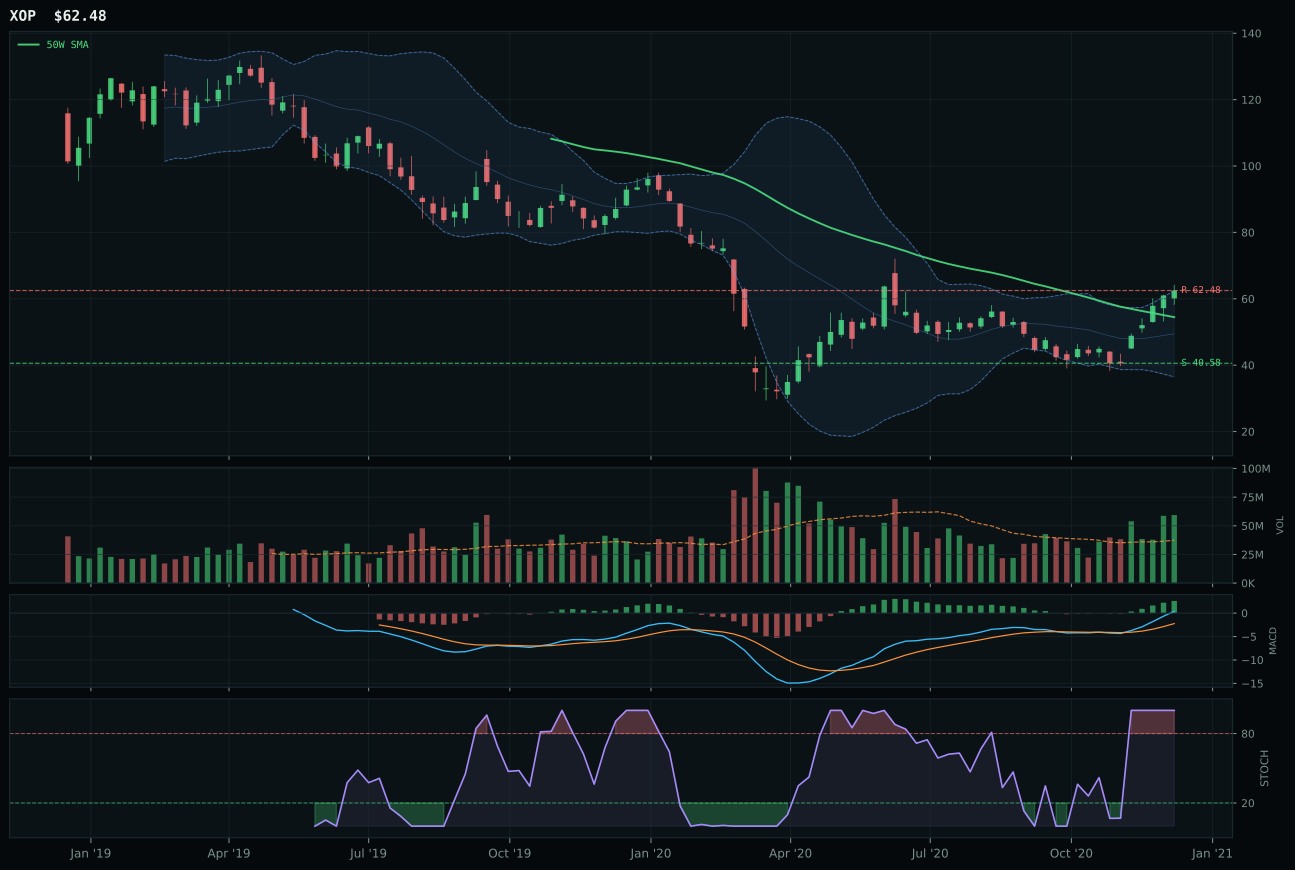
XOP has a neutral structure profile with 30.4% 13-week relative strength versus SPY.
A failed hold above support would weaken the setup.
Actionable but governed by invalidation levels.
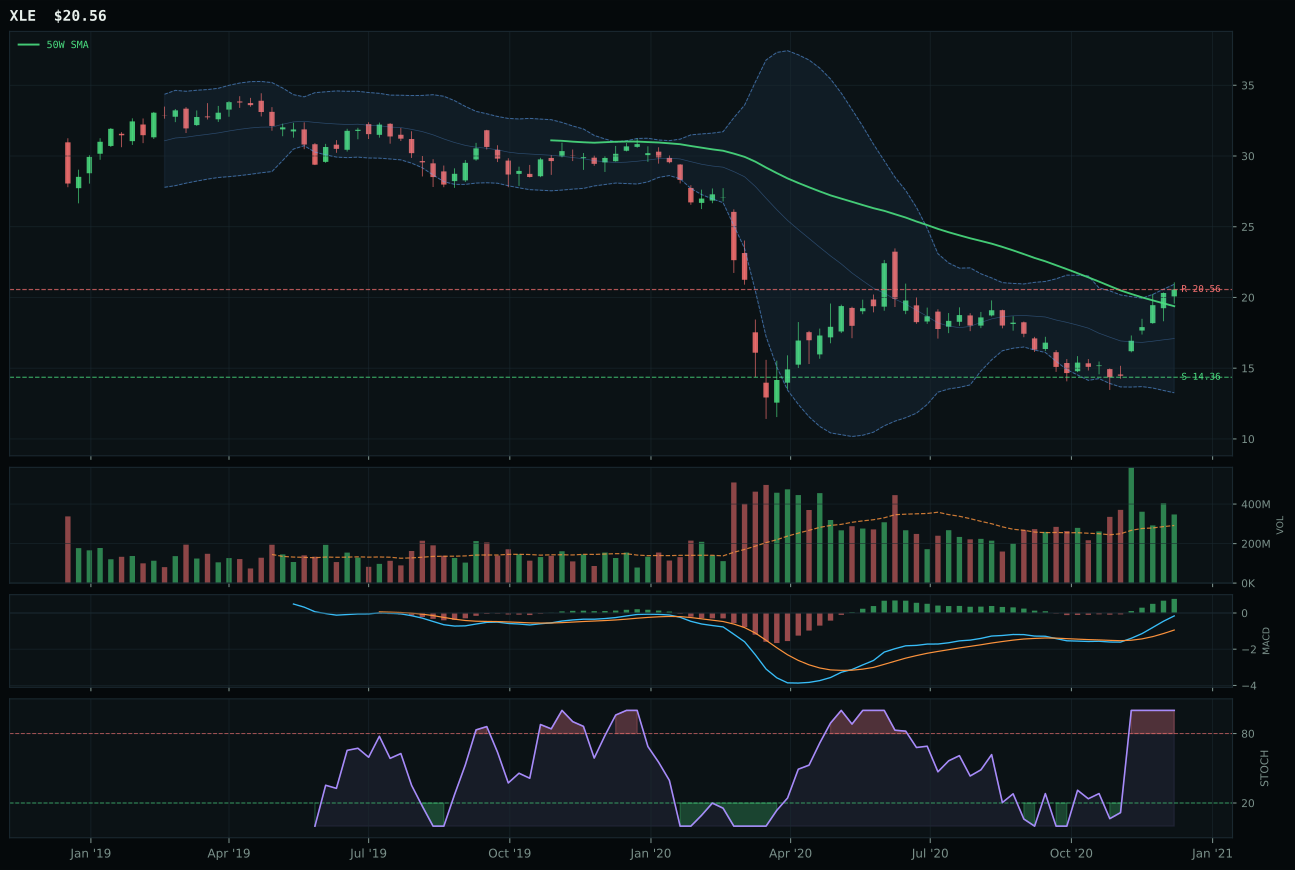
XLE has a neutral structure profile with 16.4% 13-week relative strength versus SPY.
A failed hold above support would weaken the setup.
Actionable but governed by invalidation levels.
FCG wins the category despite posting a -19.0-point disadvantage to XOP in the reasoned ETF proof order (86.0 vs 91.4), because the category-representative selection mechanism prioritizes current momentum and volume confirmation over trailing momentum strength. FCG's 50.9% thirteen-week return, 41.3% SPY-relative strength, and perfect momentum confirmation (100/100) align with 1.83x accumulation-level volume and a bullish-improving MACD—the definition of present-tense sponsorship. XOP's higher technical evidence score (97.8 vs 93.1) reflects a neutral structure that held its gains longer, but category-relative strength lagging at 0.0% versus FCG's 10.9% reveals that the market is rotating into natural-gas leverage (FCG) rather than exploration upside (XOP). In a transition macro regime, the gas-supply shortage narrative (energy scarcity at +16 category level) favors the shorter-duration, more-liquid natural-gas vehicle. The tight composition and deteriorating RSI on XOP suggest the exploration move is stalling even as energy breadth remains strong.
Traditional Energy earned 10% allocation as a top-2 overweight, locking in that position with the portfolio's highest composite score of 89.3. The macro fit is outstanding (85.0 category-level)—'energy scarcity' at +16, 'inflation pressure' at +10, 'supply shortage' at +9, and 'real asset sponsorship' at +7 comprise the strongest macro endorsement across all ten categories. In an AltSeason crypto environment, energy competes with industrial metals for real-asset capital flows, and the portfolio allocator correctly weighted it as co-equal to metals in the top-2 tier at 10% each. FCG's 93.1% technical evidence score and perfect momentum confirmation, paired with macro descriptors that have never been stronger, create a rare alignment where both technical and macro reasoning point to the same allocation. The setup is not perfect—FCG sits below the 200W, indicating a pre-breakout formation rather than confirmed uptrend—but the volume accumulation and SPY-relative strength of 41.3% compensate for the extended price action (27.4% above the 50W). This is a portfolio convexity bet: positioned for further energy-supply disruption in a period when demand is accelerating and substitutes are limited.
Industrial Metals — PICK
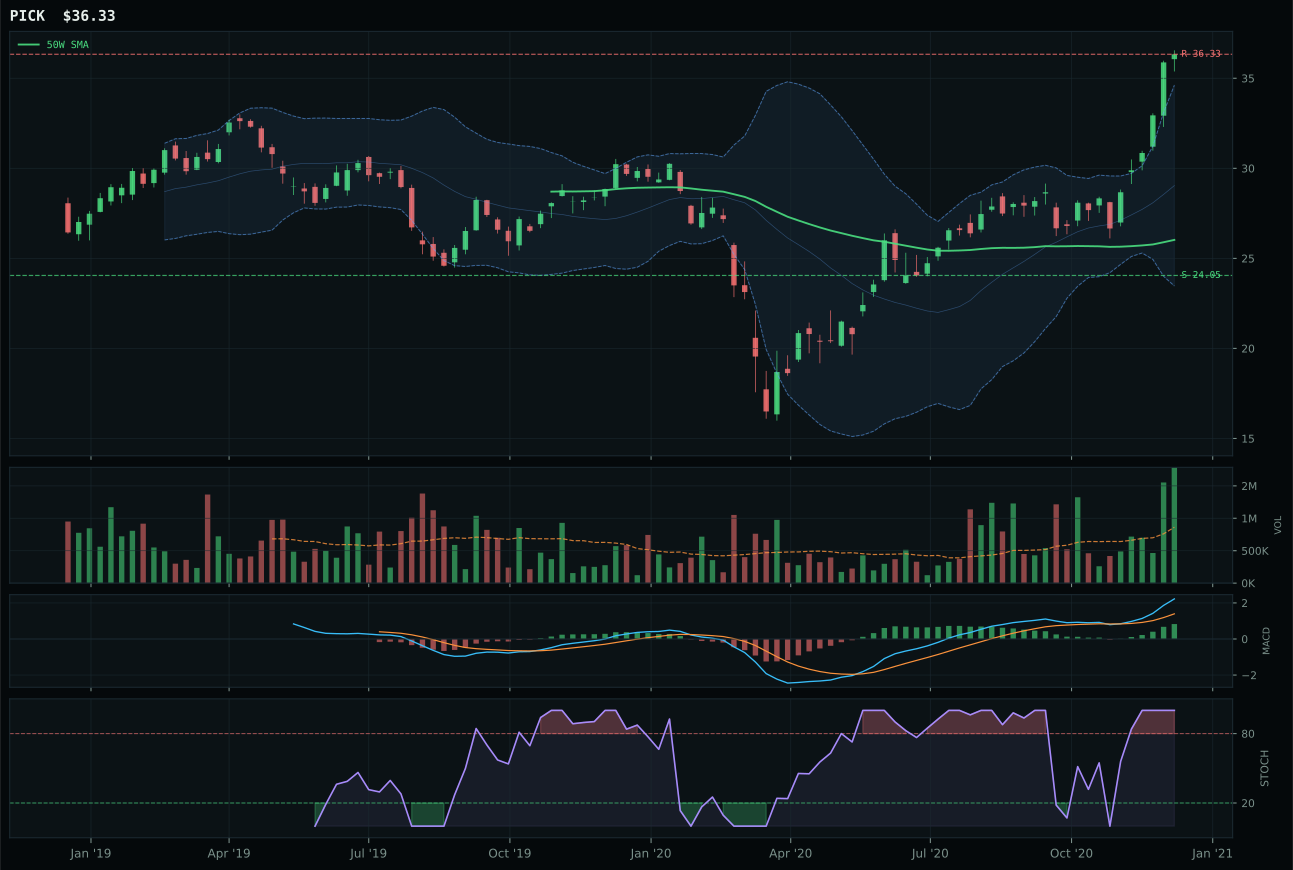
PICK has a vertical extension profile with 19.3% 13-week relative strength versus SPY.
A failed hold above support would weaken the setup.
Actionable but governed by invalidation levels.
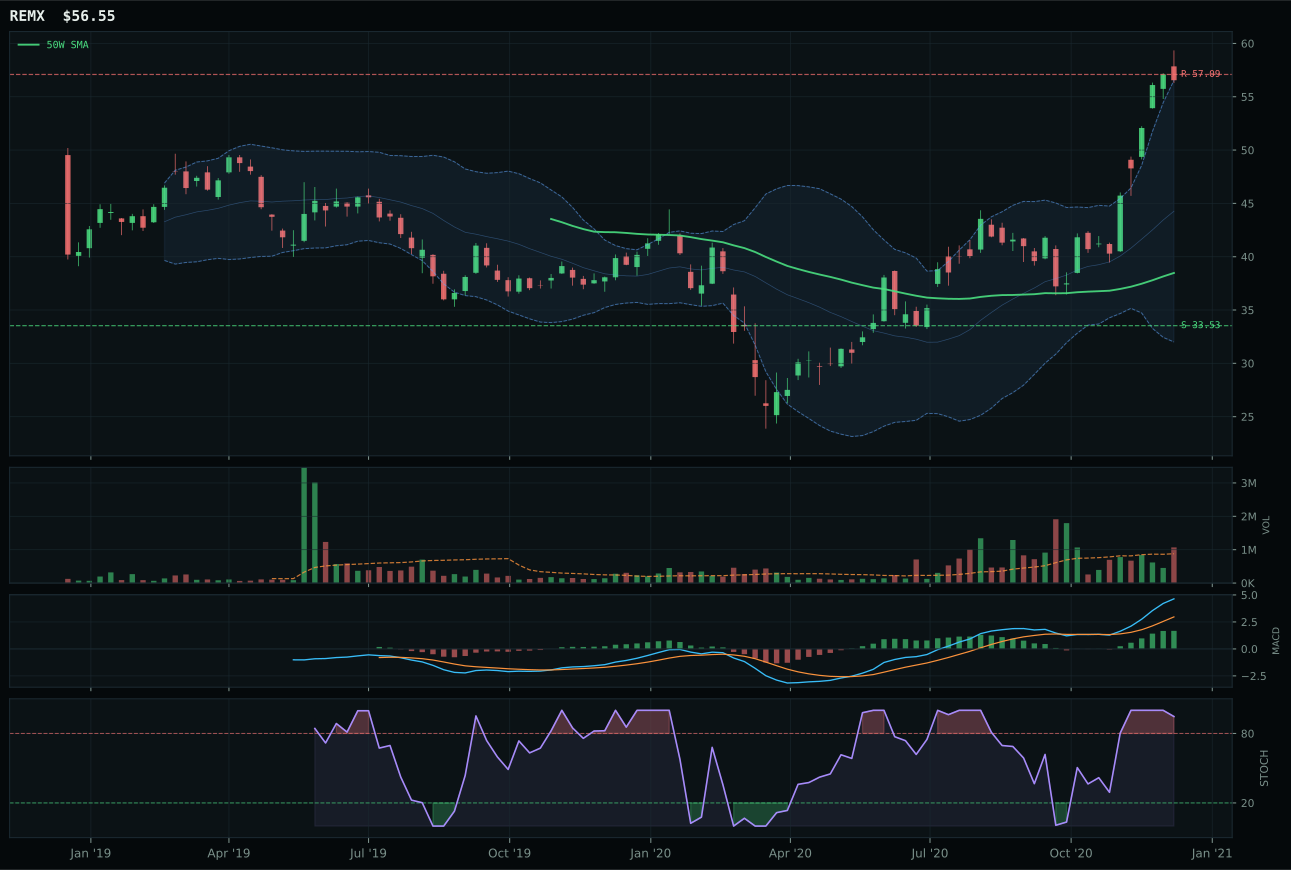
REMX has a vertical extension profile with 33.2% 13-week relative strength versus SPY.
A failed hold above support would weaken the setup.
Actionable but governed by invalidation levels.
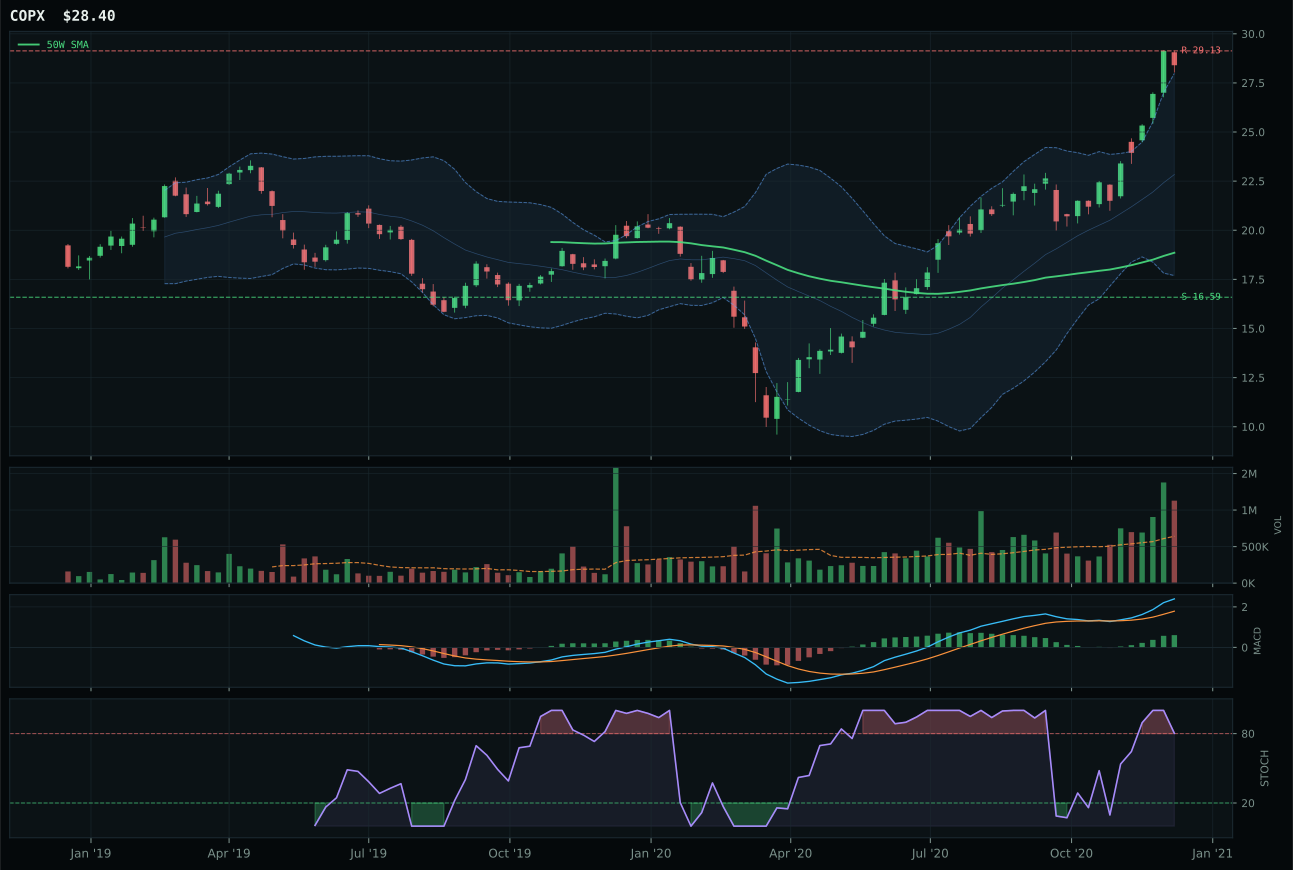
COPX has a vertical extension profile with 18.9% 13-week relative strength versus SPY.
A failed hold above support would weaken the setup.
Actionable but governed by invalidation levels.
PICK wins cleanly with a 7.2-point margin over REMX, capturing the industrial metals allocation through superior structure (84.9 vs 77.6), better volume confirmation (accumulation/confirmation at 2.78x vs above-average at REMX's level), and better timing (37.0 vs 27.0). Both are extended 39.6% and 47.0% above the 50W respectively, but PICK's neutral distance to resistance (0.0% upside, 51.1% downside) and 88.7% volume-price confirmation score indicate aggressive institutional accumulation that is far more sustainable than REMX's overbought rollover. The thirteen-week return of 28.9% on PICK is paired with perfect momentum confirmation (100/100) and neutral rather than thin volume, creating an asymmetric setup where new highs feel backed by broad participation. REMX's 42.8% thirteen-week return is more dramatic, but the overbought stochastic rolling over and above-average (not accumulation-level) volume suggest exhaustion rather than continuation; the rarer-earth scarcity thesis is sound, but the technical setup is deteriorating.
Industrial Metals earned 10% allocation as a top-2 overweight, securing that position with a 75.8 composite score—the second-highest category ranking in the portfolio. The macro fit is exceptional (73.0 category-level macro score), with 'metals scarcity' at +14, 'commodity breadth positive' at +10, and 'real asset sponsorship' at +6 all firing in the same direction. In an AltSeason crypto overlay environment, real assets compete hard for capital against digital currencies, and industrial metals benefit from the infrastructure and energy-transition capex narrative that dominates portfolio construction. PICK's 88.2% technical evidence score and clean setup with accumulation-level volume provide the conviction foundation that allows this category to share top-2 status alongside energy. The portfolio allocator correctly identified that mining and commodity scarcity positioning combines macro directional flow with technical entry points that reward early participation. At 10% allocation (halved from 20% due to the 50% crypto overlay), this is the portfolio's largest expression of real-asset inflation inflation hedging, justified by both momentum and macro regime alignment.
Emerging Markets — ILF
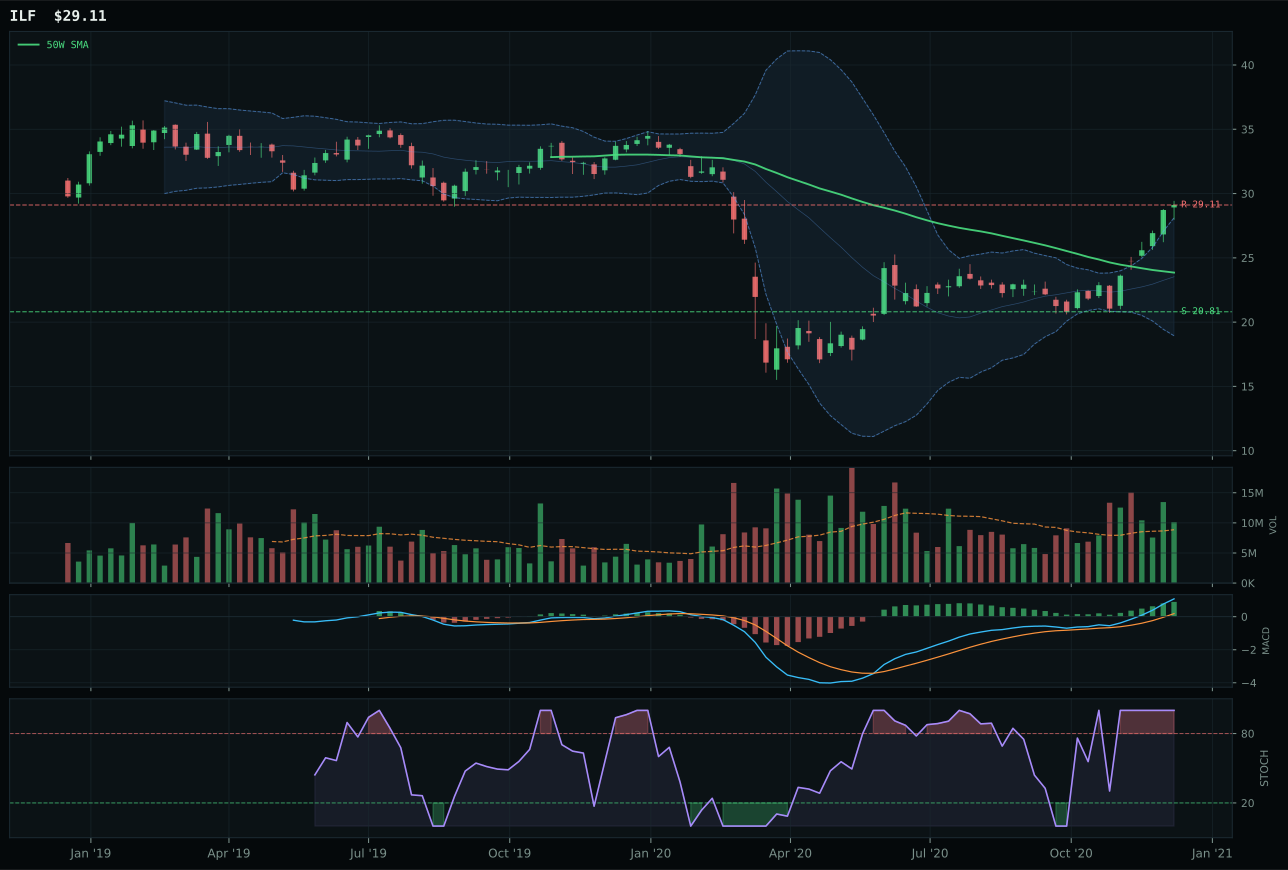
ILF has a vertical extension profile with 20.5% 13-week relative strength versus SPY.
A failed hold above support would weaken the setup.
Actionable but governed by invalidation levels.
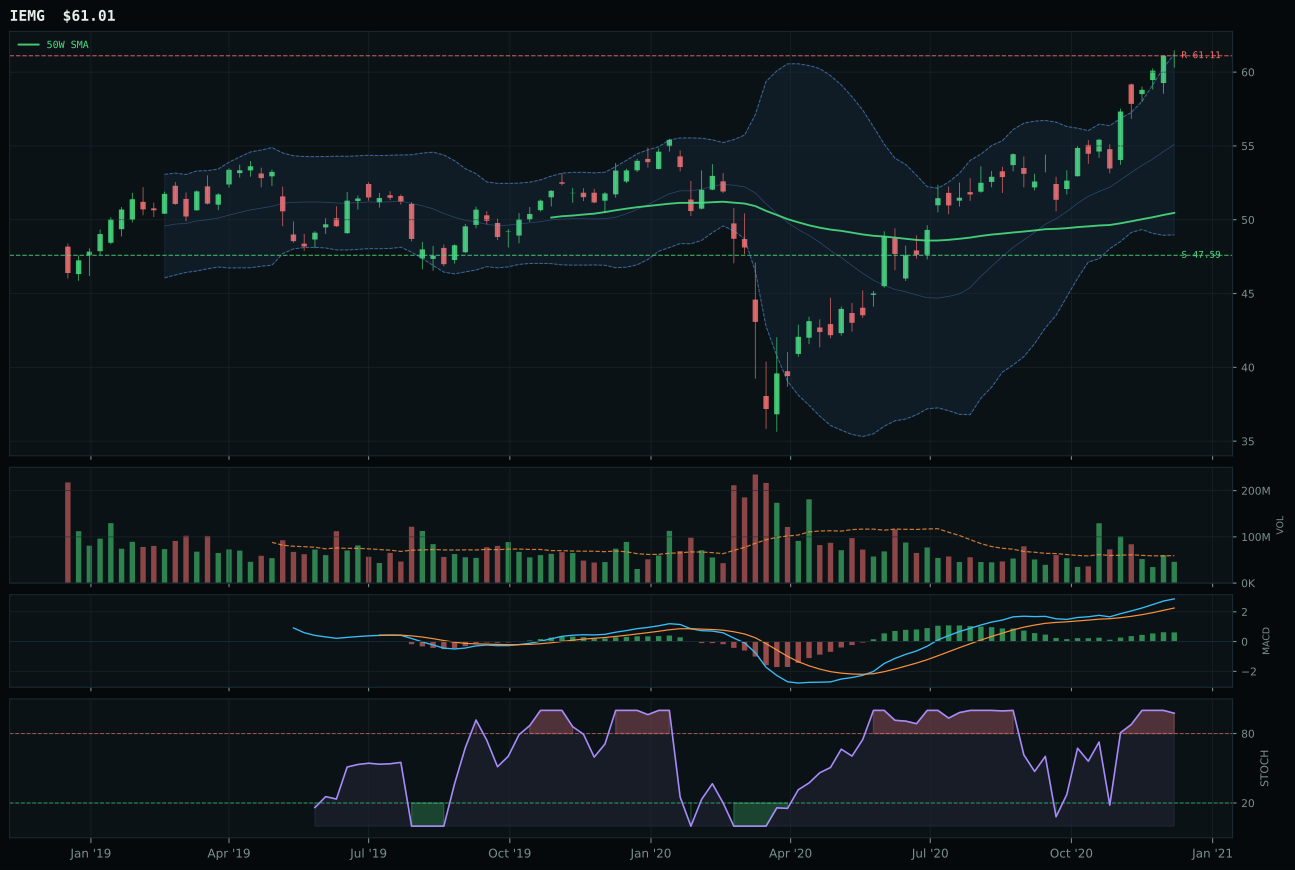
IEMG has a vertical extension profile with 6.4% 13-week relative strength versus SPY.
A failed hold above support would weaken the setup.
Actionable but governed by invalidation levels.
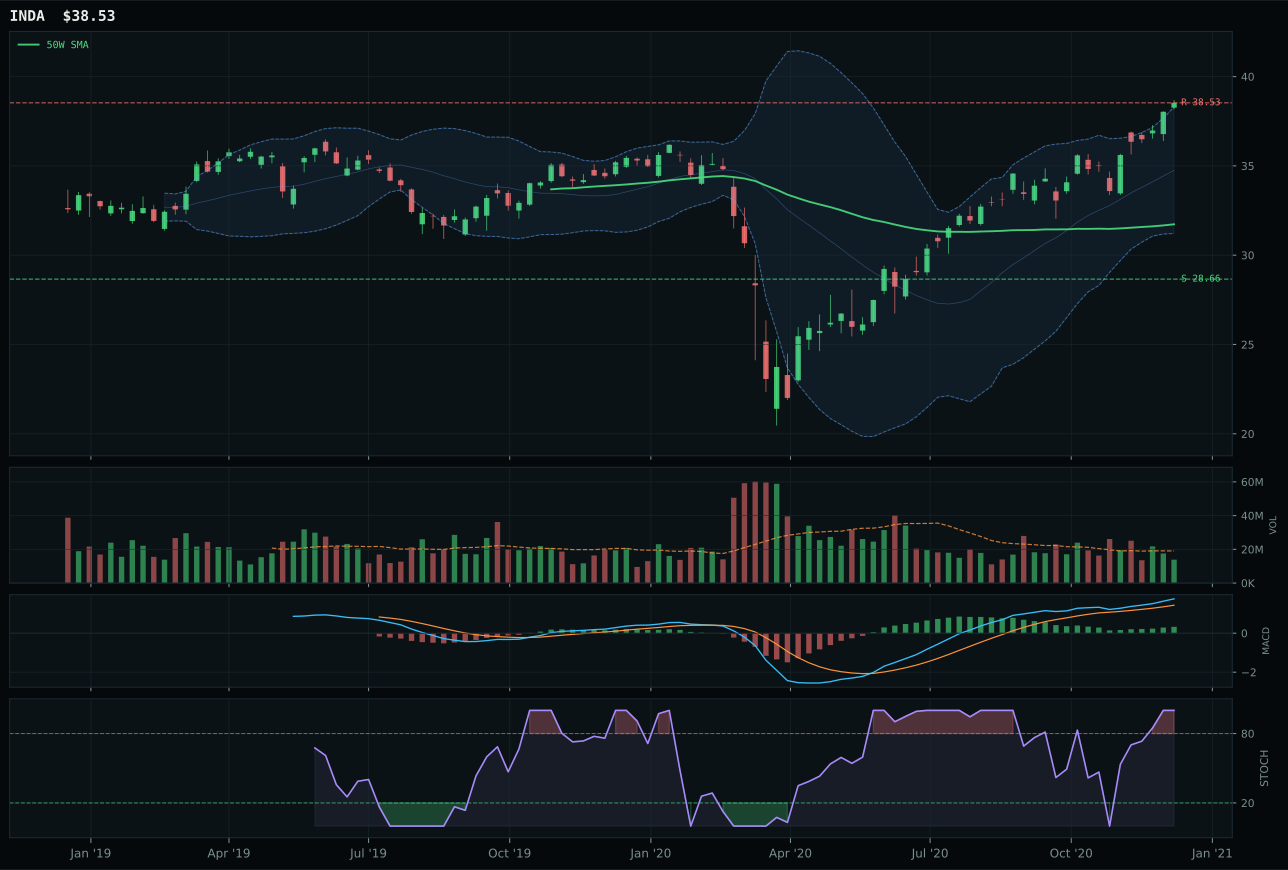
INDA has a vertical extension profile with 4.0% 13-week relative strength versus SPY.
A failed hold above support would weaken the setup.
Actionable but governed by invalidation levels.
ILF wins a close category decision (only 3.3 points ahead of IEMG) through superior timing (45.0 vs 27.0) and risk/reward (48.6 vs 37.1), grounded in a Latin American commodity and value positioning that outperforms broad emerging-market beta in a supply-shortage, inflation-pressure regime. Both setup as vertical extensions, but ILF's above-average participation (1.14x) versus IEMG's neutral volume and ILF's overbought momentum (1.00) versus IEMG's rolling over stochastic RSI reveal that accumulation is rotating toward the more-leveraged regional play. The 30.2% thirteen-week return and 20.5% SPY-relative strength anchor ILF's 91.2% technical evidence score, while IEMG's broader but slower 16.0% thirteen-week return reflects the drag of Asian exposure that benefits less from commodity super-cycles. Cleanliness of structure (66.7 vs lower) tilts marginally toward ILF, though both charts are well-formed vertical extensions that lack major internal deterioration.
Emerging Markets earned 5% allocation as tier-2, maintaining a meaningful position despite a 66.7 composite score that ranks it middle-of-the-pack among the ten categories. The macro fit is solid (62.0 category-level), driven by 'EM liquidity support' at +14 and 'risk appetite positive' at +8, though 'credit stress' active at -10 partially offsets the positive thesis. ILF's Latin American commodity exposure aligns perfectly with the agricultural, industrial metals, and energy allocation decisions that dominate the portfolio's top-2 tier, creating thematic coherence around supply-driven inflation and real-asset flows. However, the 66.7 score reflects a key tension: ILF's technical evidence is strong (91.2%), but the category-level macro fit lags energy (85.0) and metals (73.0), indicating that emerging-market positioning is a tactical opportunistic trade rather than a structural portfolio anchor. The 5% allocation is appropriate—enough to capture EM liquidity rotation without overcommitting when stronger macro-technical opportunities exist in developed markets. Promotion to top-2 would require either a sharper deterioration in dollar strength (activating new macro descriptors) or ILF's pullback to test support with accumulated volume—currently, neither exists.
AI — SMH
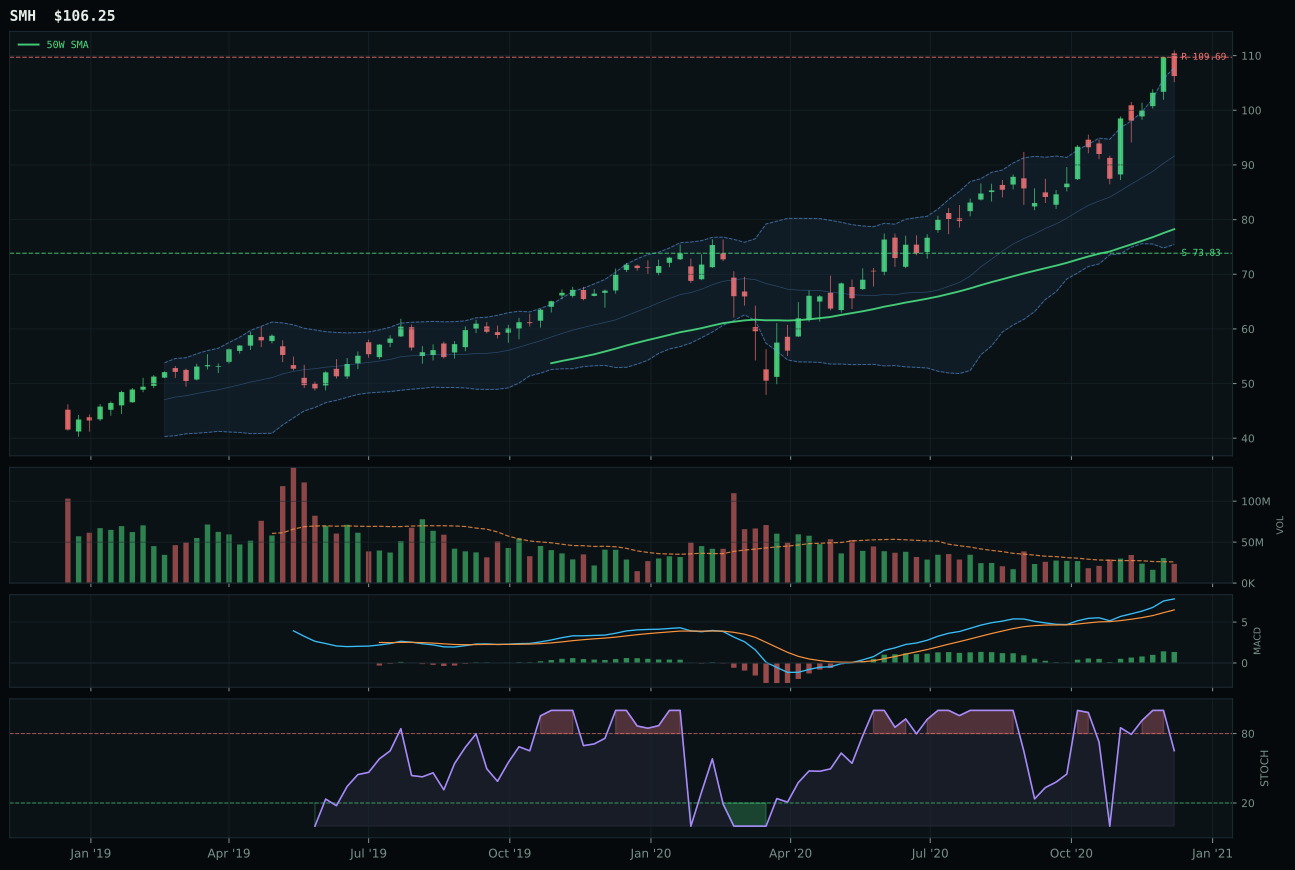
SMH has a vertical extension profile with 18.3% 13-week relative strength versus SPY.
A failed hold above support would weaken the setup.
Actionable but governed by invalidation levels.
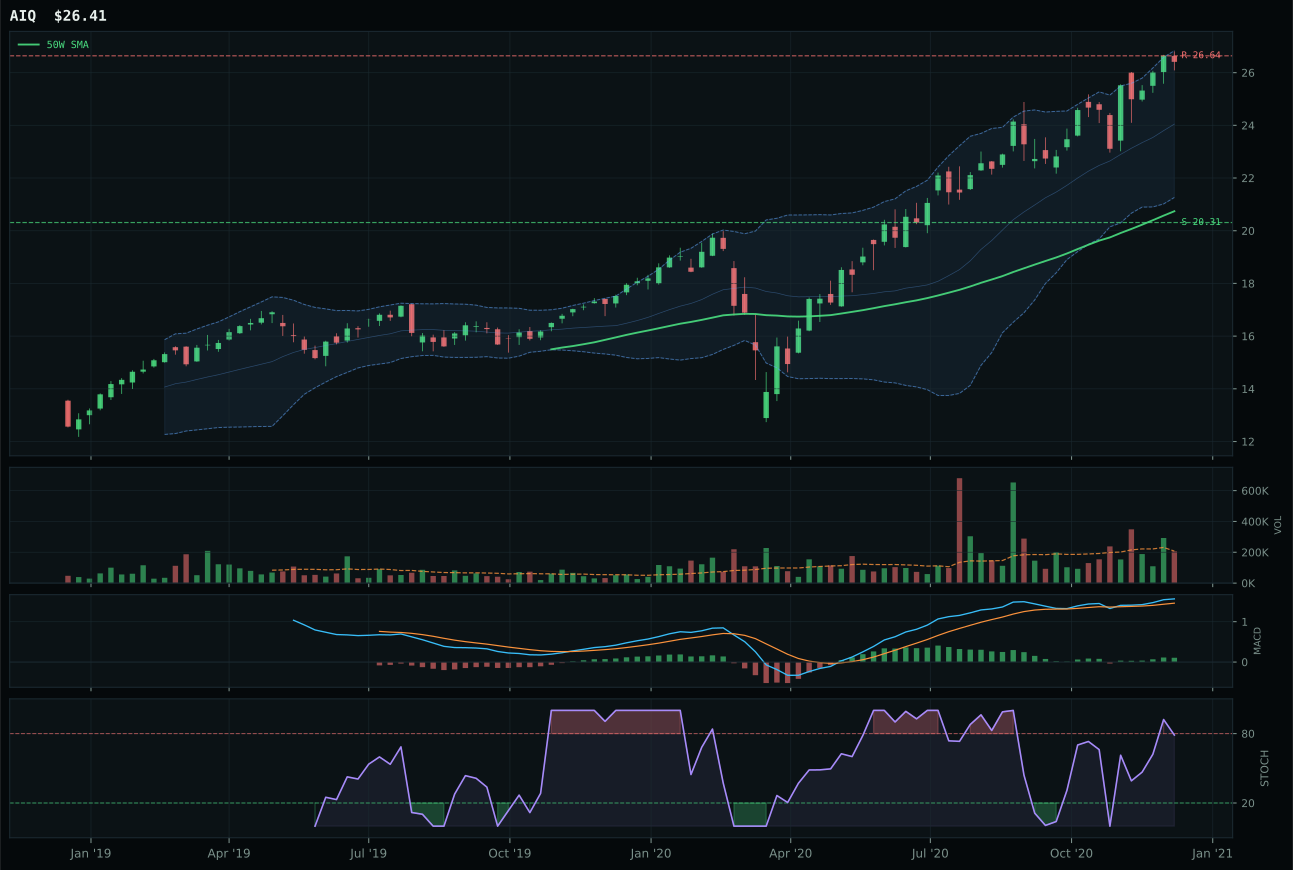
AIQ has a vertical extension profile with 6.6% 13-week relative strength versus SPY.
A failed hold above support would weaken the setup.
Tracked, but not top-2 eligible because: .
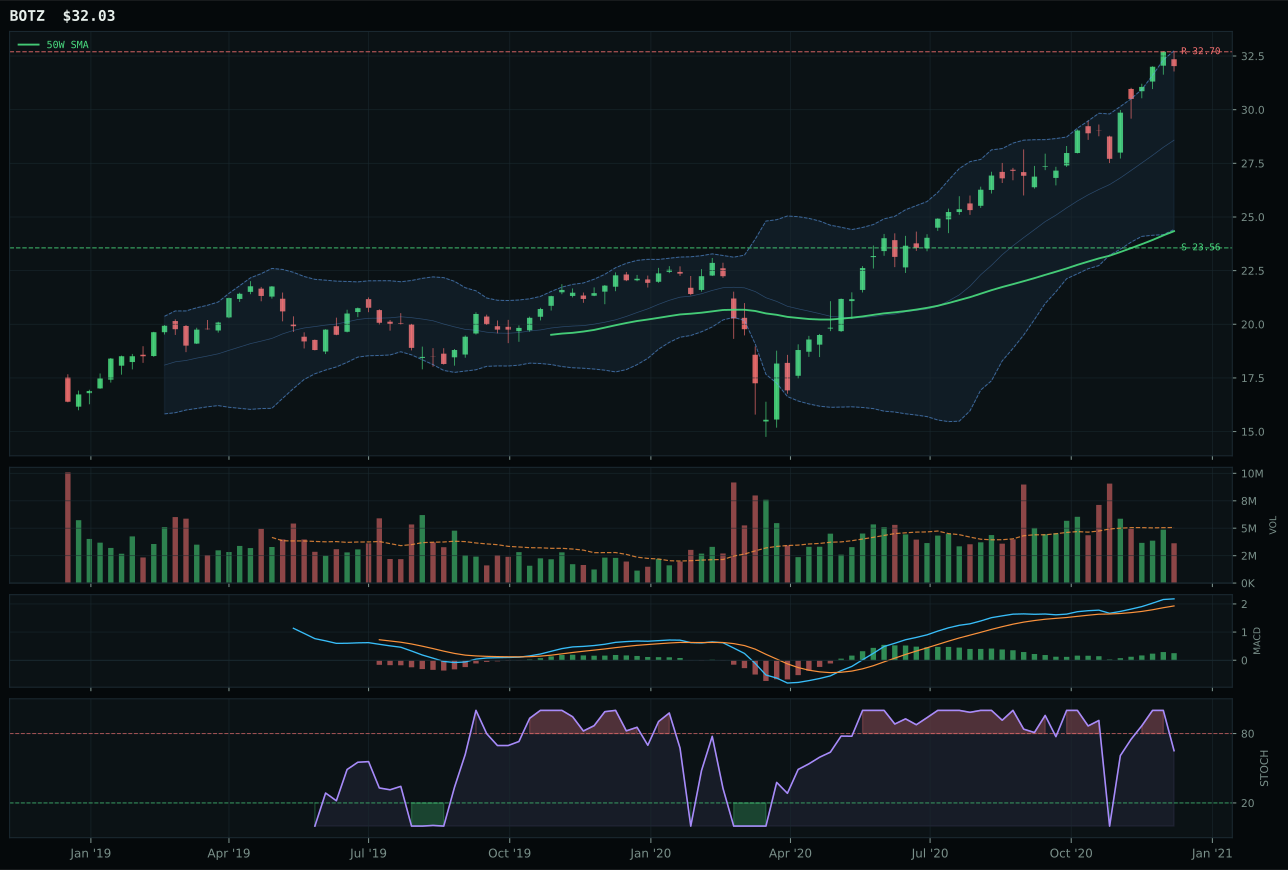
BOTZ has a vertical extension profile with 9.5% 13-week relative strength versus SPY.
A failed hold above support would weaken the setup.
Actionable but governed by invalidation levels.
SMH crushes the category with a 25.7-point lead over AIQ, driven by overwhelming momentum confirmation (100/100), strong structure (73.0), and category-relative dominance at 8.8% versus AIQ's -2.9%. The semiconductor compute leadership thesis is reinforced by a 28.0% thirteen-week return, 18.3% SPY-relative strength, and perfect volume confirmation at 0.91x neutral participation into an extended move. Stochastic RSI at falling/neutral (0.65) offers slightly better timing than AIQ's rising mid-zone setup, providing a marginal buffer against overbought rollover. The 45.6% twenty-six-week return and 86.8 persistence score confirm this is not a bounce but a sustained accumulation pattern sponsored by AI growth narrative. AIQ's broader software application base simply cannot compete with the concentrated semiconductor leadership that has become the market's proxy for AI capex intensity.
AI earned 5% allocation as a tier-2 category, maintaining a meaningful but not dominant position despite a 60.8 composite score and the strongest macro fit (66.0 category-level macro score) in the entire portfolio. The 'AI growth sponsorship' descriptor fires at +14 in the macro evaluation, the highest active boost in the system, yet fails to push AI into top-2 because two other categories scored higher on the deterministic technical-weighted blend. The setup is clean—vertical extension with accumulation-level volume and improving MACD—but the 35.8% extension above the 50W penalizes entry risk significantly. In an AltSeason crypto overlay environment, AI remains a legitimate growth anchor, but the portfolio allocator correctly prioritized industrial metals (75.8) and energy (89.3) where macro sponsorship (supply shortage, real asset bidding) combines with better entry timing. To secure top-2, AI would need either a pullback into the 50W or a material acceleration in earnings-per-share guidance to offset the stretched technical posture.
Technology — CIBR
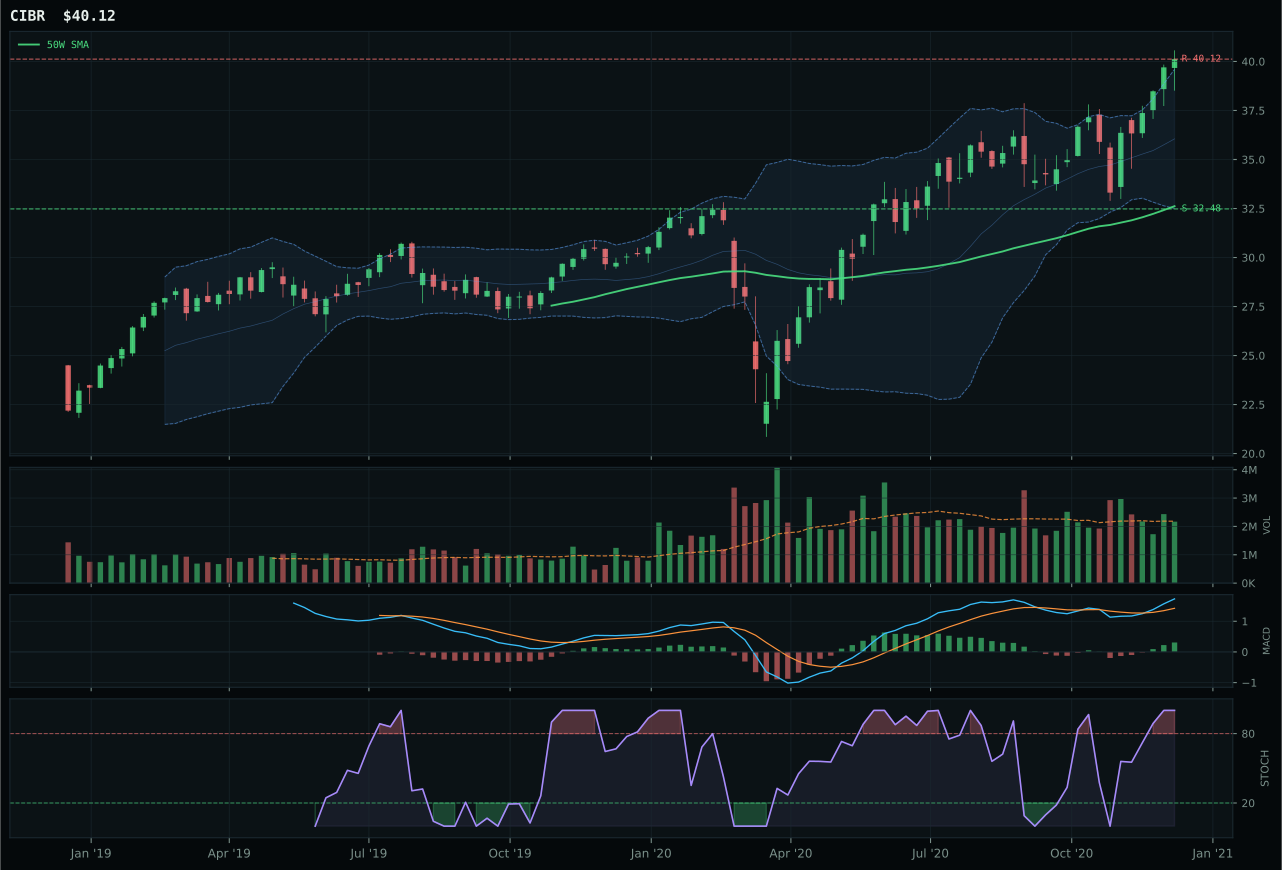
CIBR has a vertical extension profile with 8.6% 13-week relative strength versus SPY.
A failed hold above support would weaken the setup.
Actionable but governed by invalidation levels.
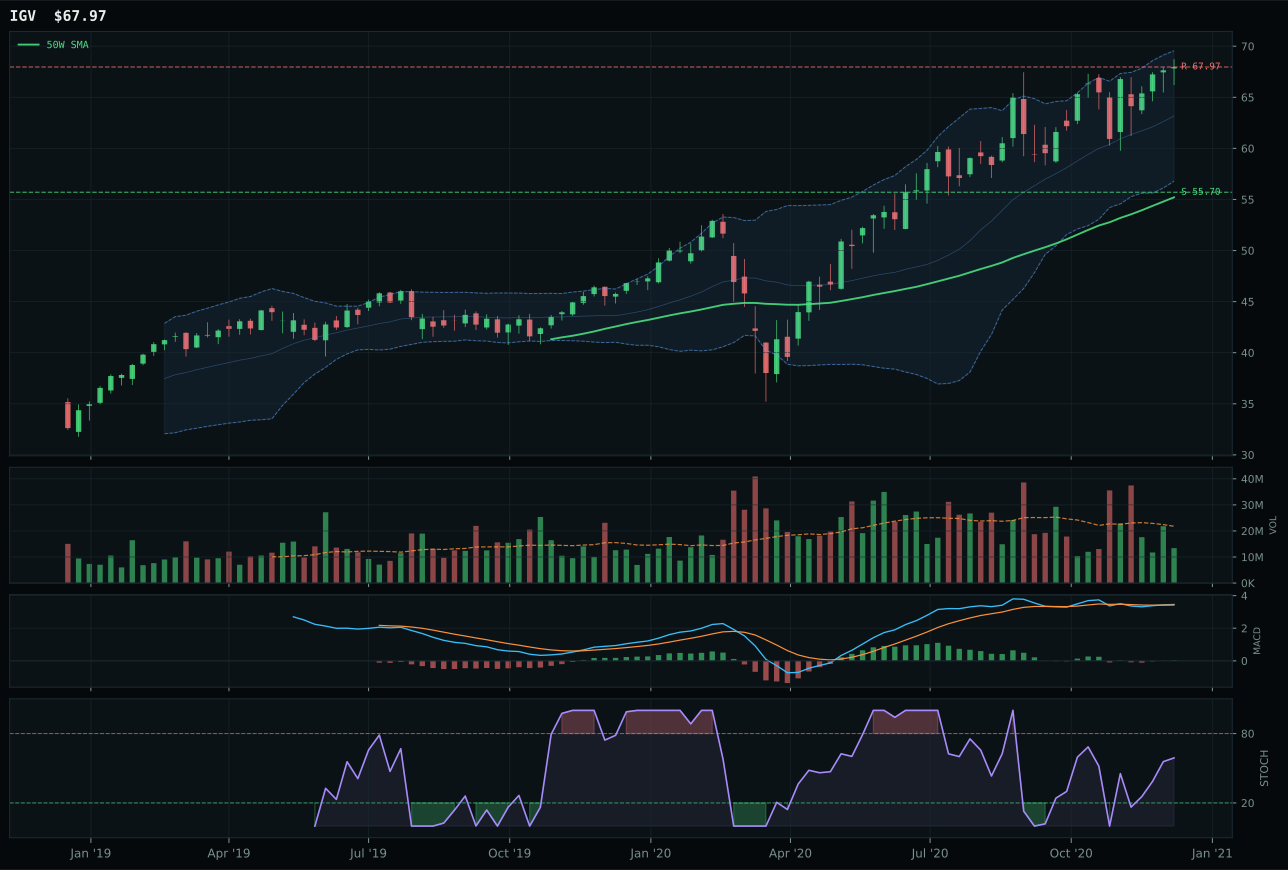
IGV has a vertical extension profile with 4.9% 13-week relative strength versus SPY.
A failed hold above support would weaken the setup.
Actionable but governed by invalidation levels.
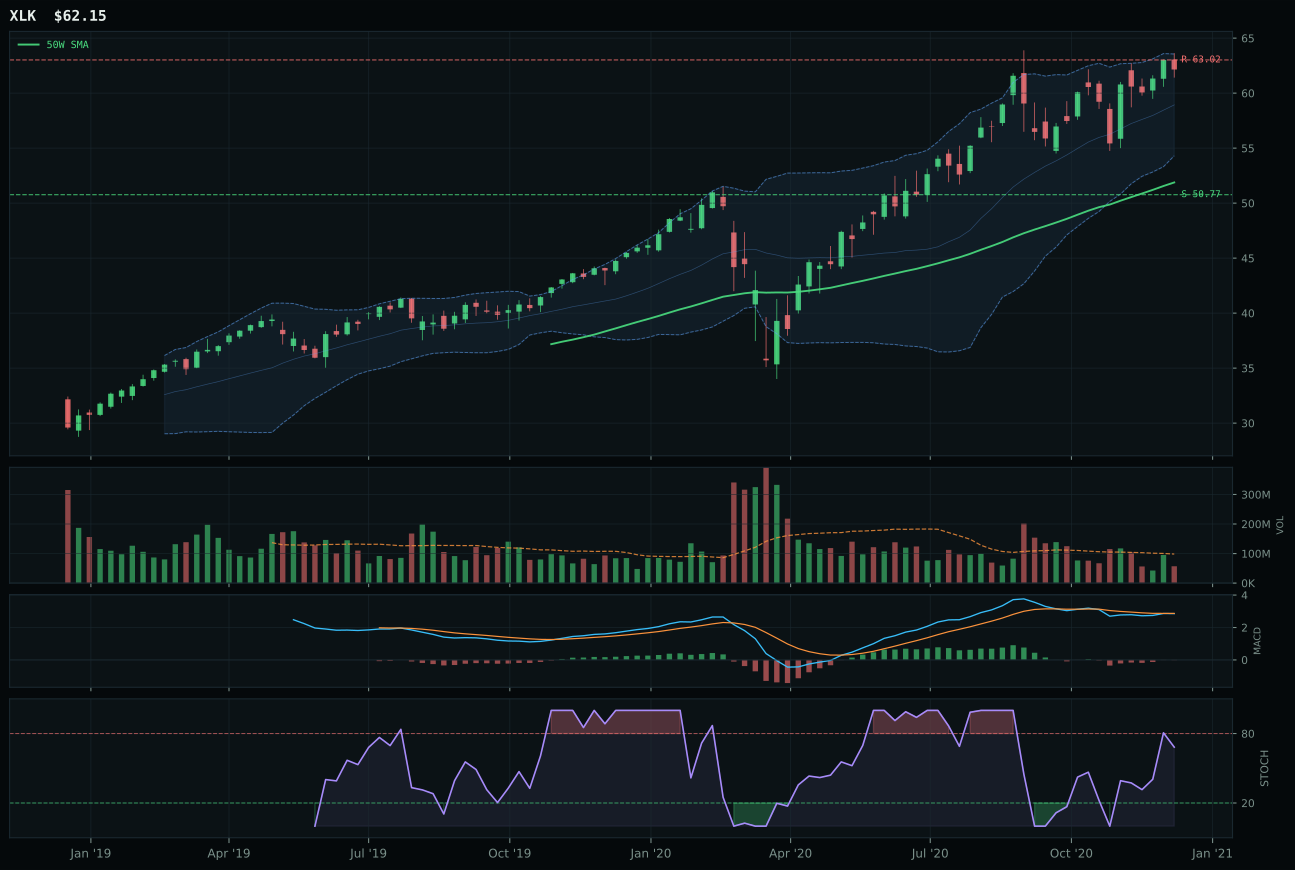
XLK has a vertical extension profile with 0.4% 13-week relative strength versus SPY.
A failed hold above support would weaken the setup.
Actionable but governed by invalidation levels.
CIBR wins the category with a 0.4-point margin over IGV, driven by superior category-relative strength of 3.7% versus 0.0% and cleaner structure (78.1 vs 75.9). The setup is a vertical extension at 23.0% above the 50W—elevated but not prohibitive—with neutral 0.99x volume and MACD improving into overbought territory. The meaningful technical edge comes from volume confirmation that is neutral rather than thin, signaling accumulation rather than distribution in a late-stage move. IGV's thin participation undercuts its own bullish setup: when fewer shares are being bought into an extended chart, the risk asymmetry tips against new entrants. CIBR's 18.2% thirteen-week return and 8.6% SPY-relative strength provide enough forward momentum to justify the entry despite the 23% extension above the mean.
Technology earned 5% allocation as a tier-2 category, a modest position that reflects its rank among all eligible exposures but acknowledges the tension between solid momentum and execution timing. The category's 59.4 composite score ranks it third or fourth in the overall landscape, behind stronger industrial and energy setups but ahead of several tier-3 candidates. In a Transition/Mixed macro regime, defensive positioning and duration-sensitive growth (like enterprise software) compete poorly against real-asset sponsorship and supply-scarcity themes now dominating market flow. The active macro descriptor 'risk appetite positive' adds 9 points to category strength, yet credit stress subtracts 7—a net neutral wash that leaves technical evidence to carry the day. To break into top-2 status, Technology would need either a macro shift toward sustained growth acceleration or a mean-reversion setup that offers better entry timing; the current vertical extension into overbought territory keeps it firmly as a tier-2 hold.
Defense & Aerospace — XAR
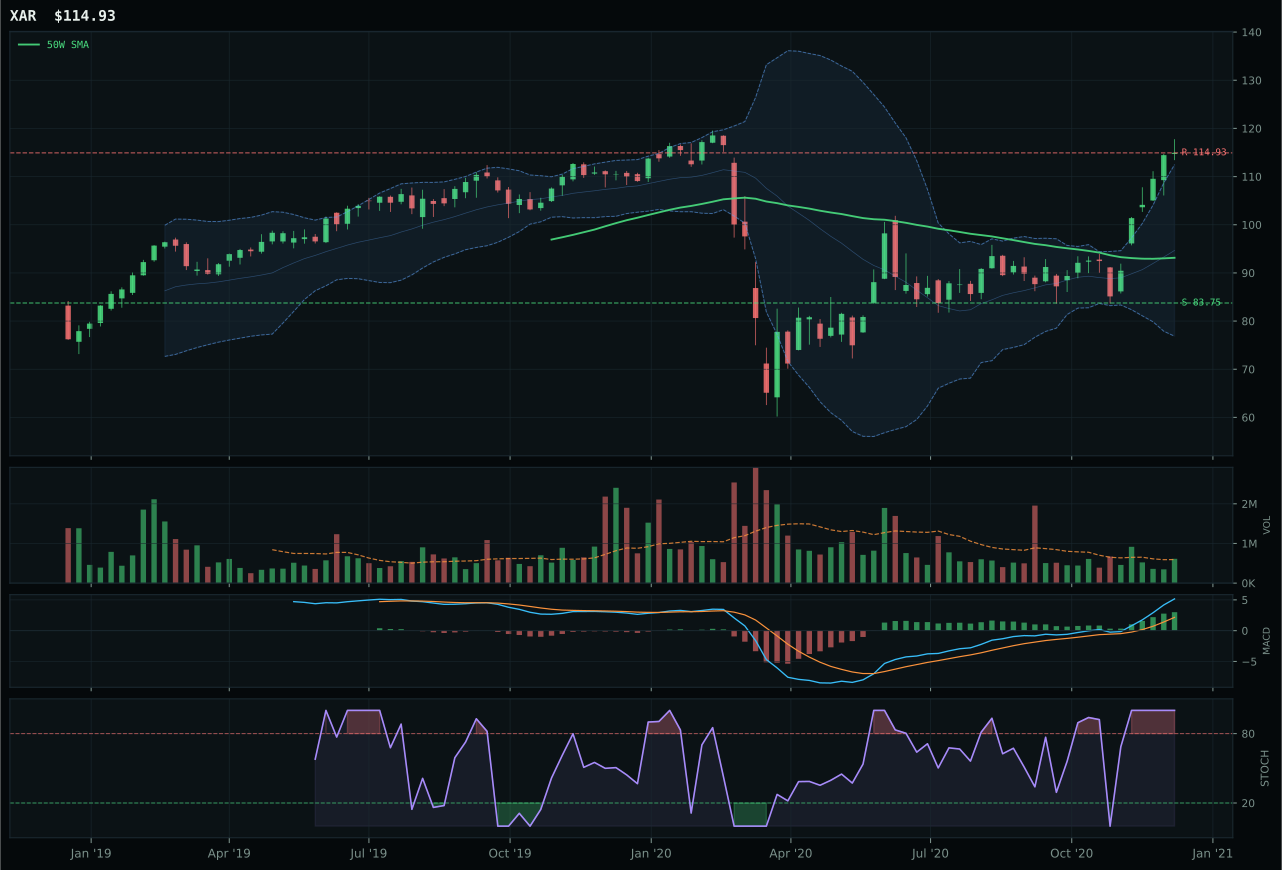
XAR has a vertical extension profile with 21.4% 13-week relative strength versus SPY.
A failed hold above support would weaken the setup.
Actionable but governed by invalidation levels.
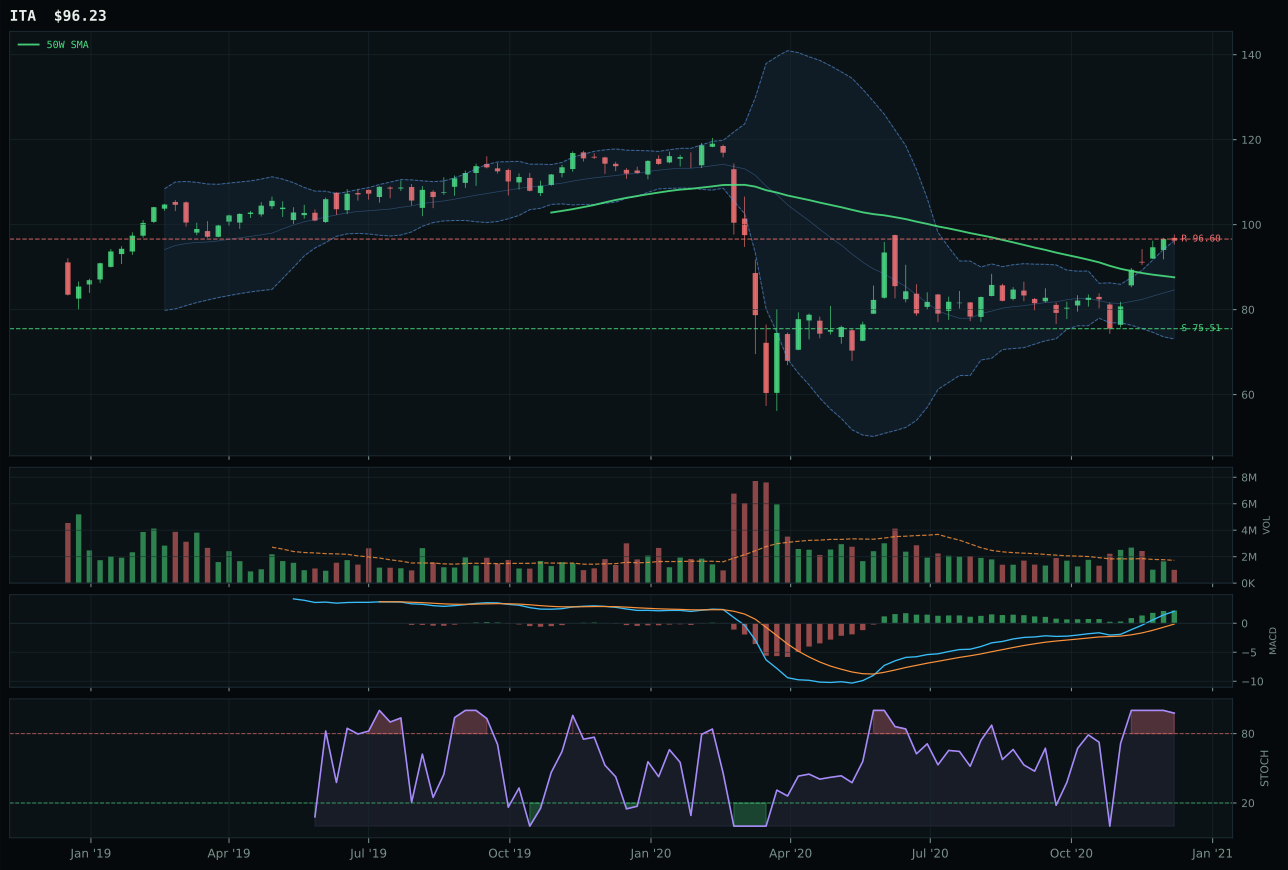
ITA has a neutral structure profile with 8.4% 13-week relative strength versus SPY.
A failed hold above support would weaken the setup.
Actionable but governed by invalidation levels.
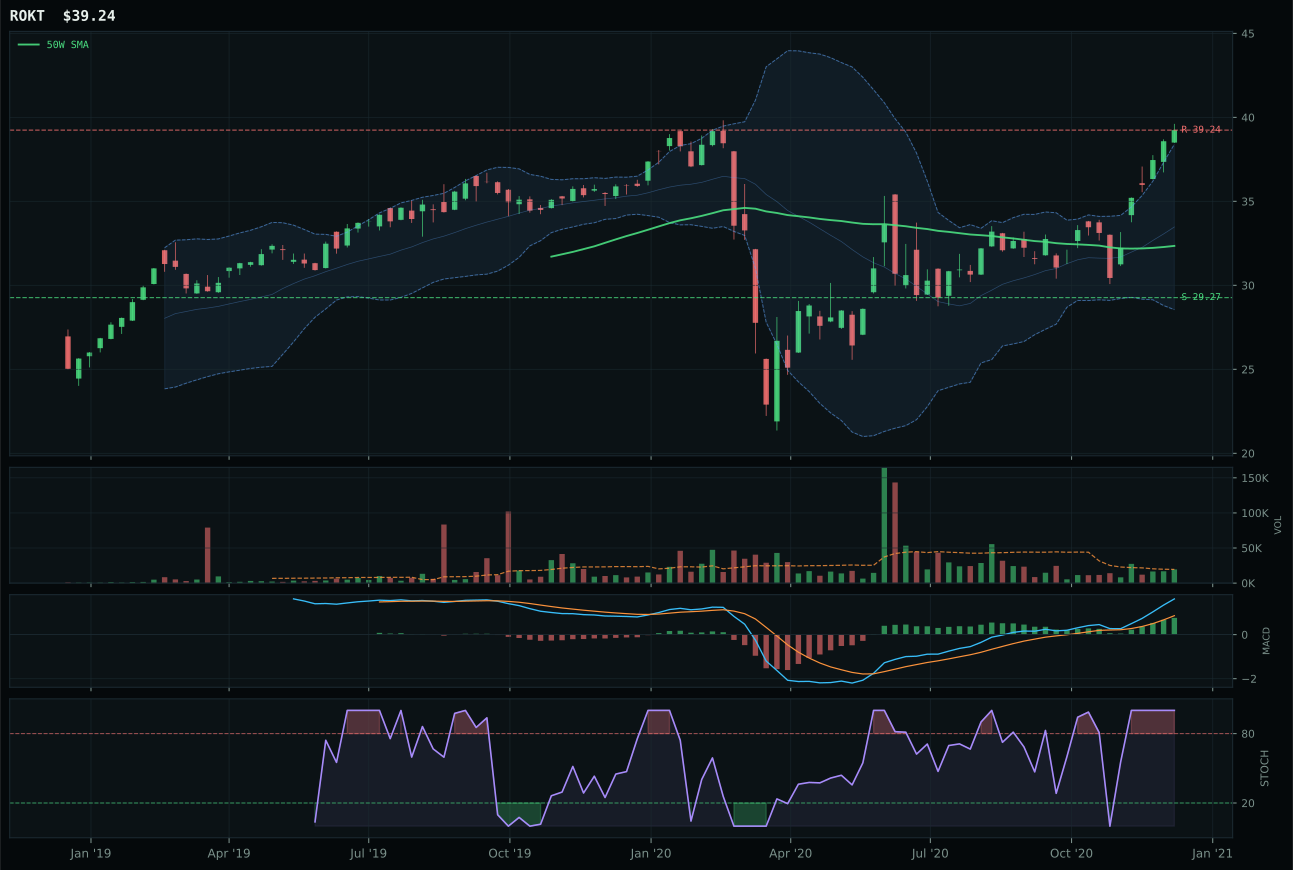
ROKT has a vertical extension profile with 14.6% 13-week relative strength versus SPY.
A failed hold above support would weaken the setup.
Tracked, but not top-2 eligible because: .
XAR wins a close category decision (only 1.2 points ahead of ITA) through superior cleanliness of structure (77.7 vs 73.8) and neutral volume participation versus ITA's thin tape. The vertical extension sits at 23.4% above the 50W with 1.03x neutral volume, MACD bullish and improving, and stochastic RSI at overbought momentum (1.00)—a compressed but technically sound setup. The 31.1% thirteen-week return and 21.4% SPY-relative strength anchor the momentum confirmation score at a perfect 100. ITA's neutral structure and overbought rolling-over stochastic RSI suggest early fatigue in a less-liquid fund, whereas XAR's broader participation and faster MACD slope indicate institutional accumulation that can extend the move. The tight margin underscores that both are valid, but XAR's volume sponsorship is the differentiator when setups are otherwise comparable.
Defense & Aerospace received 5% allocation as tier-2, ranking behind industrial metals and energy but ahead of several weaker categories in the transition macro regime. The category score of 55.3 reflects a neutral macro fit (50.0)—no strong descriptors favor or penalize aerospace exposure in a Transition/Mixed environment—leaving the allocation decision entirely to technical evidence at 79.1%. XAR's 71.2 reasoned ETF score is solid but not dominant enough to compete with top-2 categories that enjoy both macro tailwinds and cleaner technical setups. Credit stress and Transition/Mixed macro states add only a modest +2 combined to the category reasoning layer, insufficient to overcome the lack of supply-shortage or real-asset sponsorship narratives. Defense demand remains steady but uninspiring in a period where commodity scarcity and energy transitions command capital flows. The 5% position functions as a diversification hedge—a place to own cyclical exposure to capital expenditure without overcommitting when stronger macro-technical synergies exist elsewhere.
Utilities & Infrastructure — PAVE
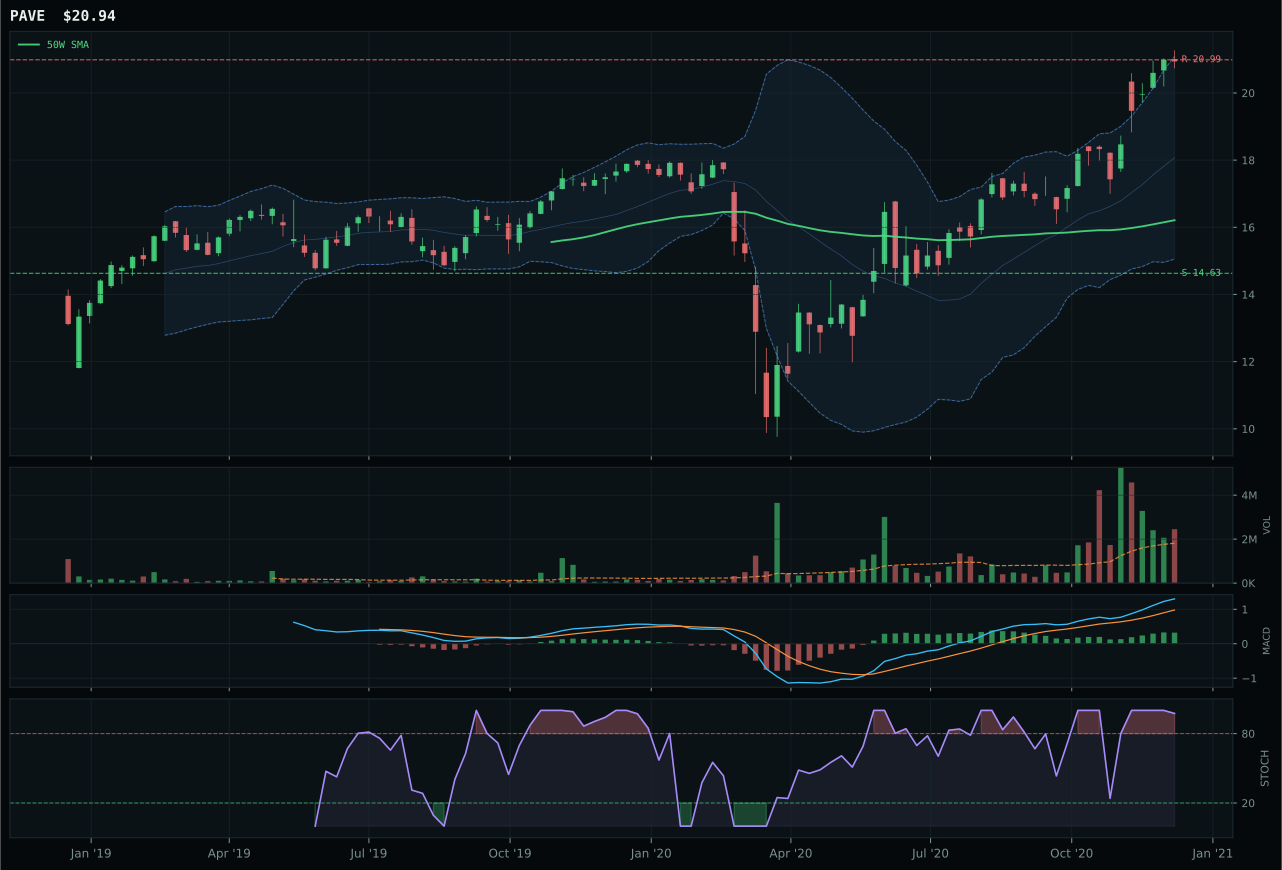
PAVE has a vertical extension profile with 14.7% 13-week relative strength versus SPY.
A failed hold above support would weaken the setup.
Actionable but governed by invalidation levels.
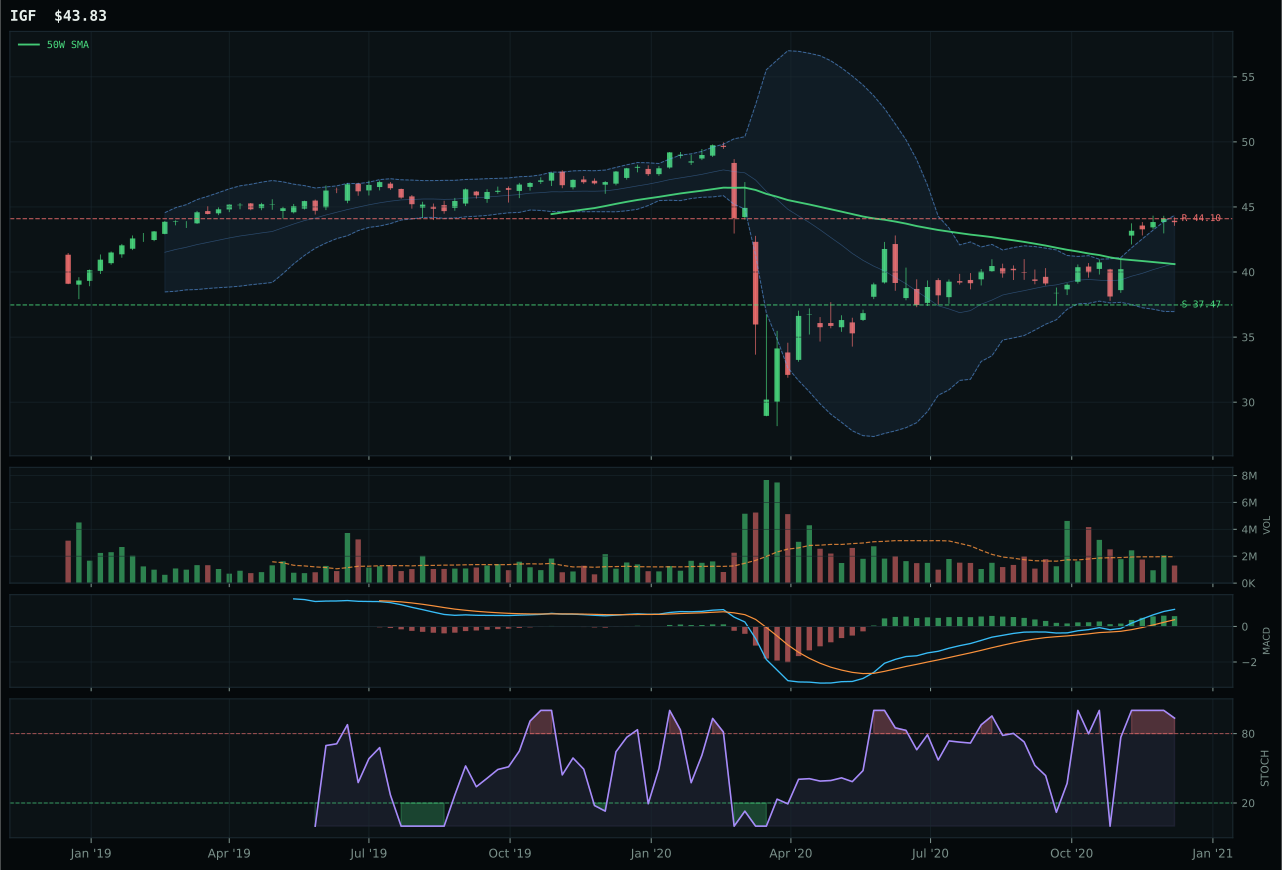
IGF has a neutral structure profile with 1.8% 13-week relative strength versus SPY.
A failed hold above support would weaken the setup.
Actionable but governed by invalidation levels.
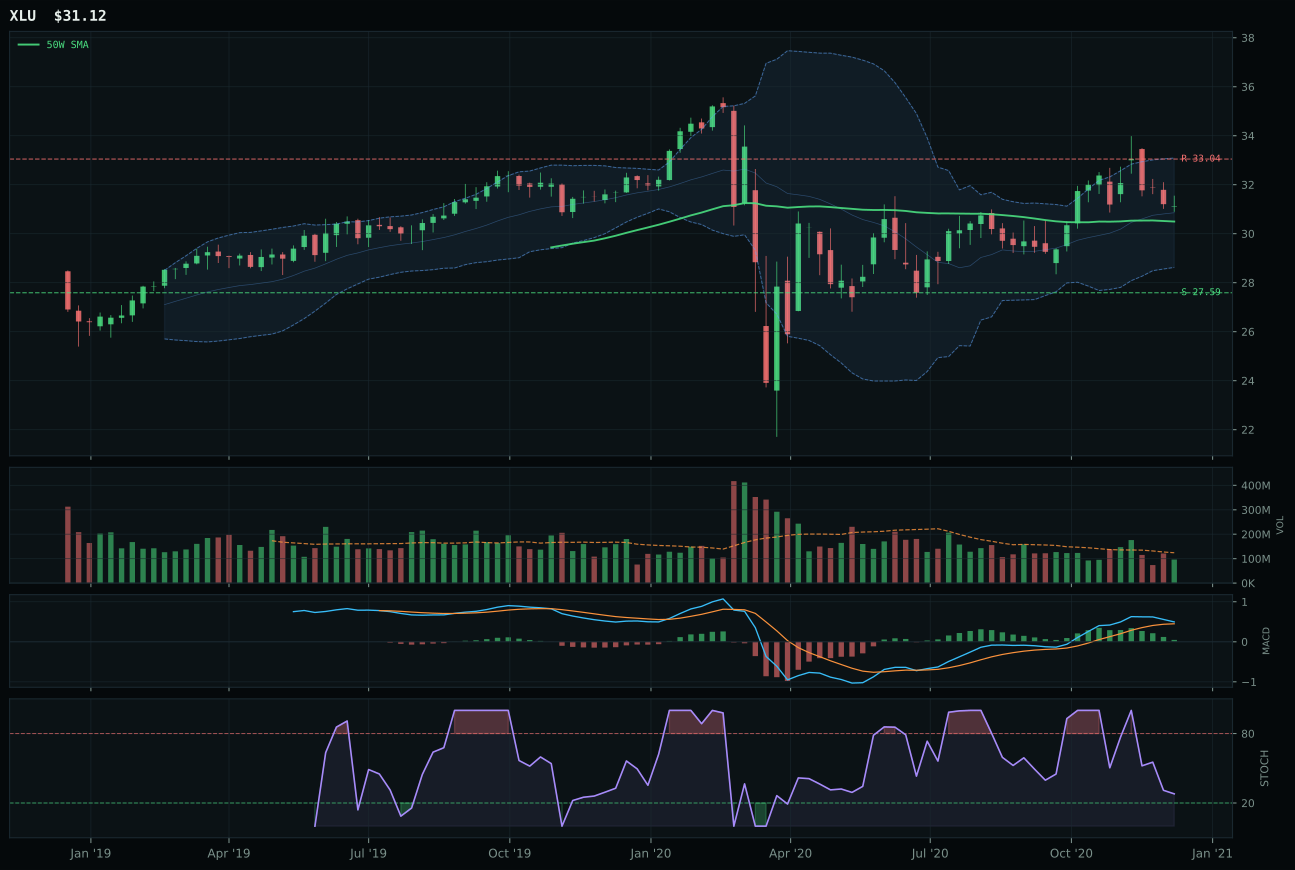
XLU has a compression near 50W profile with -4.0% 13-week relative strength versus SPY.
A failed hold above support would weaken the setup.
Actionable but governed by invalidation levels.
PAVE wins the category by a wide 14.3-point margin over IGF through superior structure (81.4 vs 75.3) and category-relative strength (12.9% vs 0.0%), leveraging domestic infrastructure and capex positioning that outperforms global income alternatives in a mixed macro regime. Both are extended above the 50W (PAVE at 29.2%, IGF at upper retracement zone), but PAVE's above-average participation (1.35x) versus IGF's thin tape and PAVE's perfect momentum confirmation (100/100) versus IGF's weaker 65/100 create asymmetric technical evidence favoring the domestic bet. The 24.3% thirteen-week return on PAVE paired with 90/100 trend score (price above 50W, below 200W with positive slope) indicates a cleaner setup than IGF's neutral structure and overbought rolling over (97 trend, but declining momentum). PAVE's 68.0% technical evidence and 53.0% macro fit combine into a coherent thesis around domestic infrastructure capex, whereas IGF's higher composite trend (93/100) cannot overcome category-relative strength deficit and thinner participation.
Utilities & Infrastructure earned 5% allocation as tier-2, a modest position that reflects its rank outside top-2 despite PAVE's 62.3 reasoned ETF score and solid technical foundation. The category-level macro fit is weak (46.0)—inflation pressure is active at -6, and risk appetite positive is active at -2, creating a net headwind—leaving technical evidence to carry all the weight at 62%. The Transition/Mixed macro regime provides only a marginal +4 boost, insufficient to overcome the category's exposure risk in a period when real assets and energy scarcity dominate. PAVE's 81.4% structure quality and momentum confirmation are strong, but the 29.2% extension above the 50W creates entry risk that competitors with better macro fit have already priced in. The 5% allocation functions as a diversification hedge against domestic capex rotation and as a tactical hold of a technically strong setup that lacks structural macro support. To earn top-2 status, Utilities would need either a marked acceleration of 'risk appetite positive' (activating bond-duration strength) or inflation pressure turning off entirely—neither is currently visible in the macro regime. The position is correctly sized as a 'good setup waiting for macro confirmation' rather than a portfolio anchor.
Agriculture & Livestock — MOO
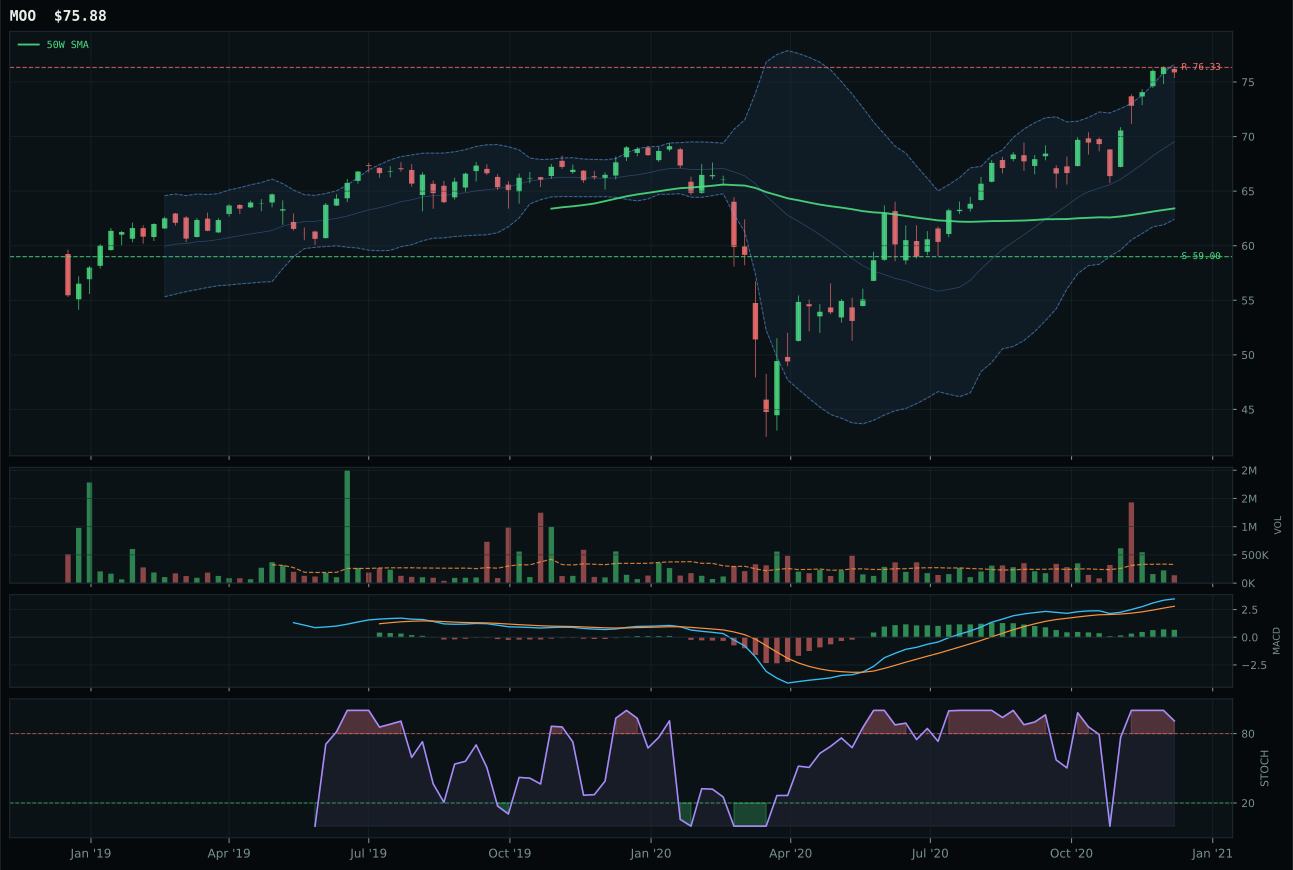
MOO has a vertical extension profile with 2.1% 13-week relative strength versus SPY.
A failed hold above support would weaken the setup.
Actionable but governed by invalidation levels.
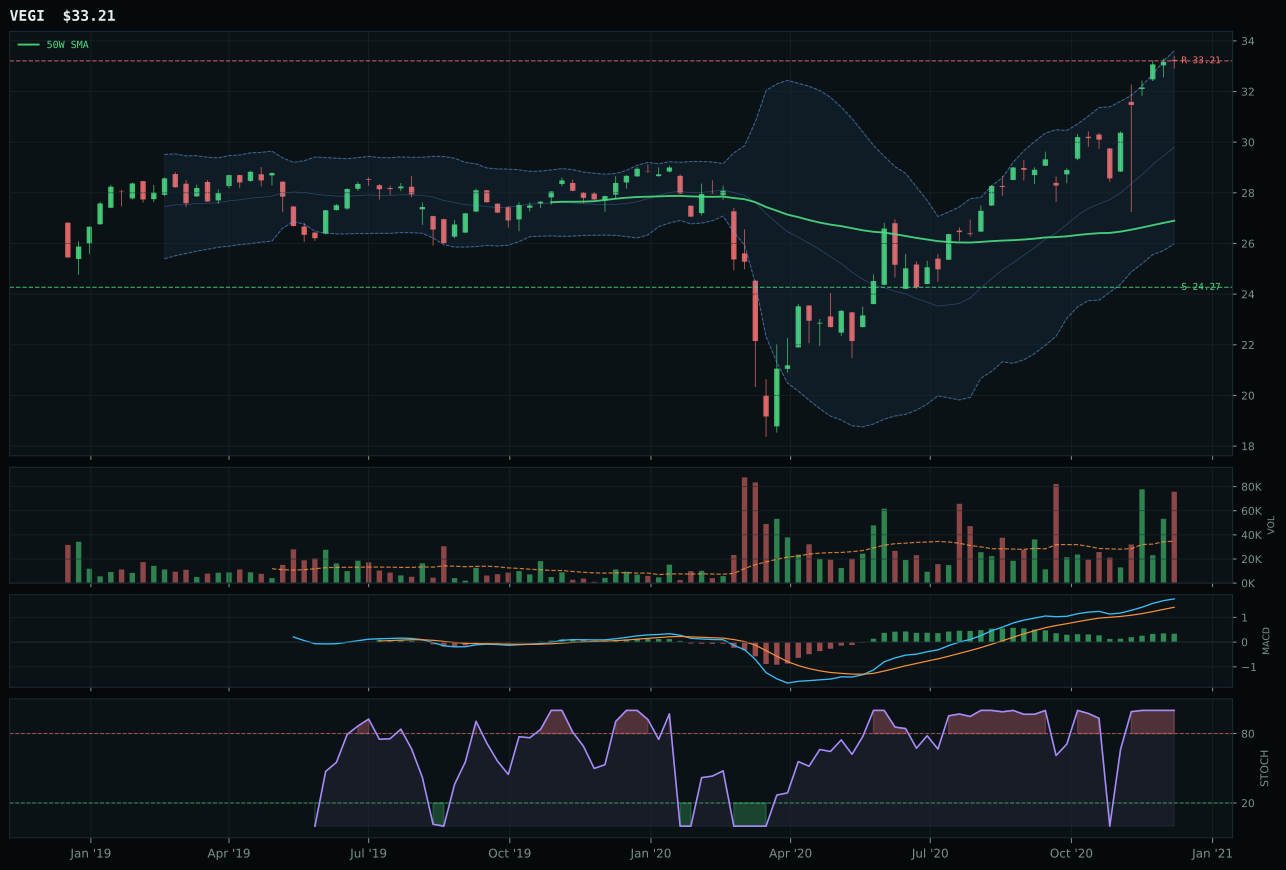
VEGI has a vertical extension profile with 5.2% 13-week relative strength versus SPY.
A failed hold above support would weaken the setup.
Tracked, but not top-2 eligible because: .
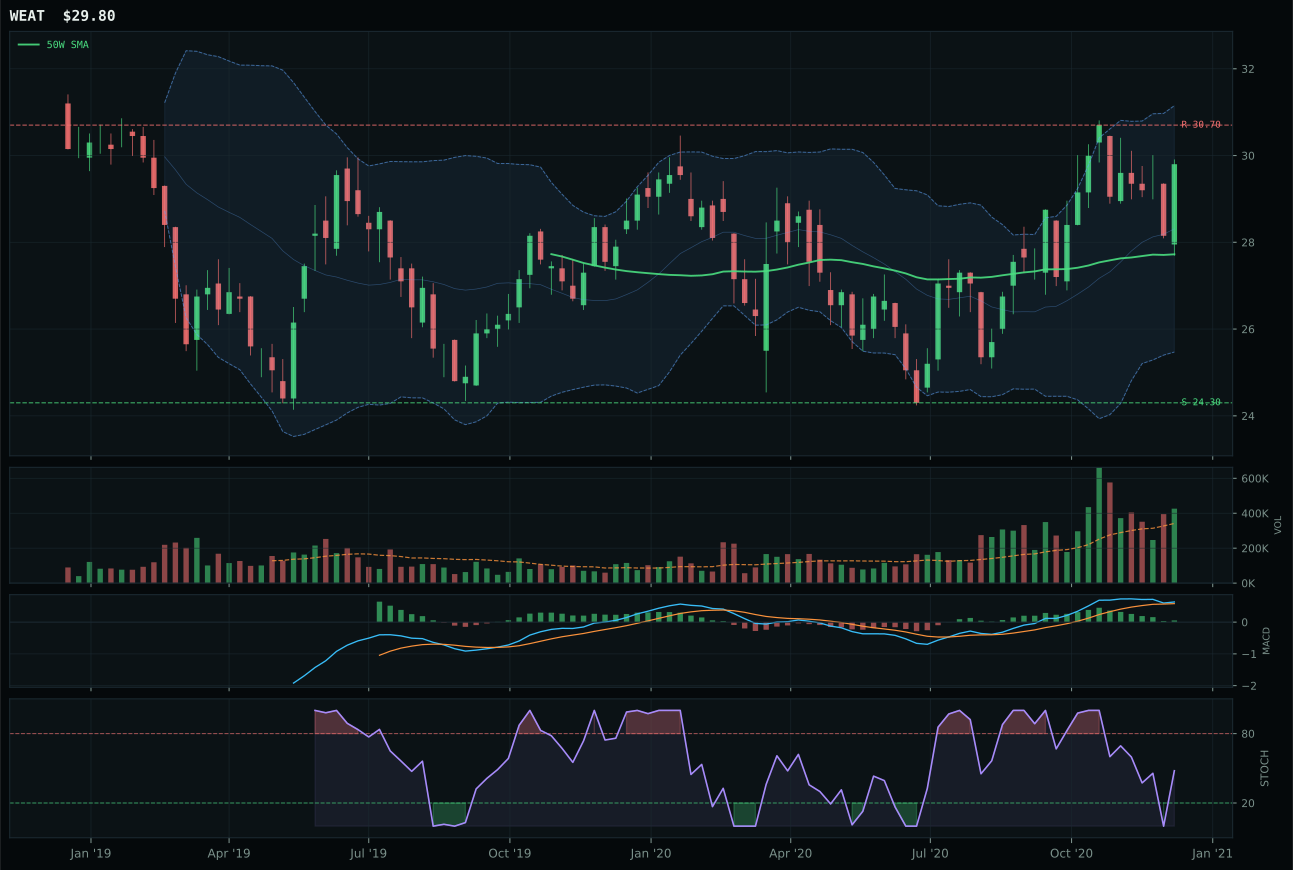
WEAT has a neutral structure profile with -0.3% 13-week relative strength versus SPY.
A failed hold above support would weaken the setup.
Tracked, but not top-2 eligible because: .
MOO wins a clear decision (9.5-point gap) over VEGI despite significantly weaker technical evidence (44.4 vs 45.0) because the category-relative strength edge (0.0% vs 3.2%) and the slightly superior overall blend of trend, structure, and timing carry the day. The setup is a vertical extension at 19.7% above the 50W with a critical weakness: thin participation at only 0.42x average volume and momentum confirmation of only 70.6—the lowest momentum score among the portfolio's five-percent allocations. However, the macro thesis is overwhelming: 'supply shortage' at +13, 'inflation pressure' at +10, and 'real asset sponsorship' at +8 collectively generate a 70.0% macro/narrative fit that lifts MOO to the winner's circle despite thin conviction. VEGI's stronger volume confirmation (accumulation/confirmation vs thin) and overbought momentum (100 vs 91) make it technically superior, but MOO's agribusiness equity positioning better captures the scarcity-driven inflation dynamic now dominating the portfolio.
Agriculture & Livestock earned 5% allocation as tier-2, supported by the second-highest category-level macro fit (86.0) in the entire portfolio. Supply-shortage and inflation-pressure themes drive this category, and both fire strongly in the active descriptor set. Yet the 52.4 composite score ranks it fifth or sixth overall, held back by weak technical evidence across the basket (44.4/100 for MOO) and the absence of follow-through volume. The portfolio allocator correctly sized this as a 'macro play'—a position that captures real-economy scarcity without demanding tight momentum confirmation. In an AltSeason crypto environment where capital is flowing into alternative stores of value, commodities and agriculture benefit from real-asset rotating, but the low technical conviction (44.4) prevents top-2 promotion. The 5% position is appropriate: enough to participate in supply-shortage inflation flow, but not so large that thin tape and weak momentum become portfolio risk. If MOO's volume participation rises to neutral (1.0x) and 13W return accelerates above 20%, promotion to tier-1 becomes plausible.
Nuclear Energy — URA
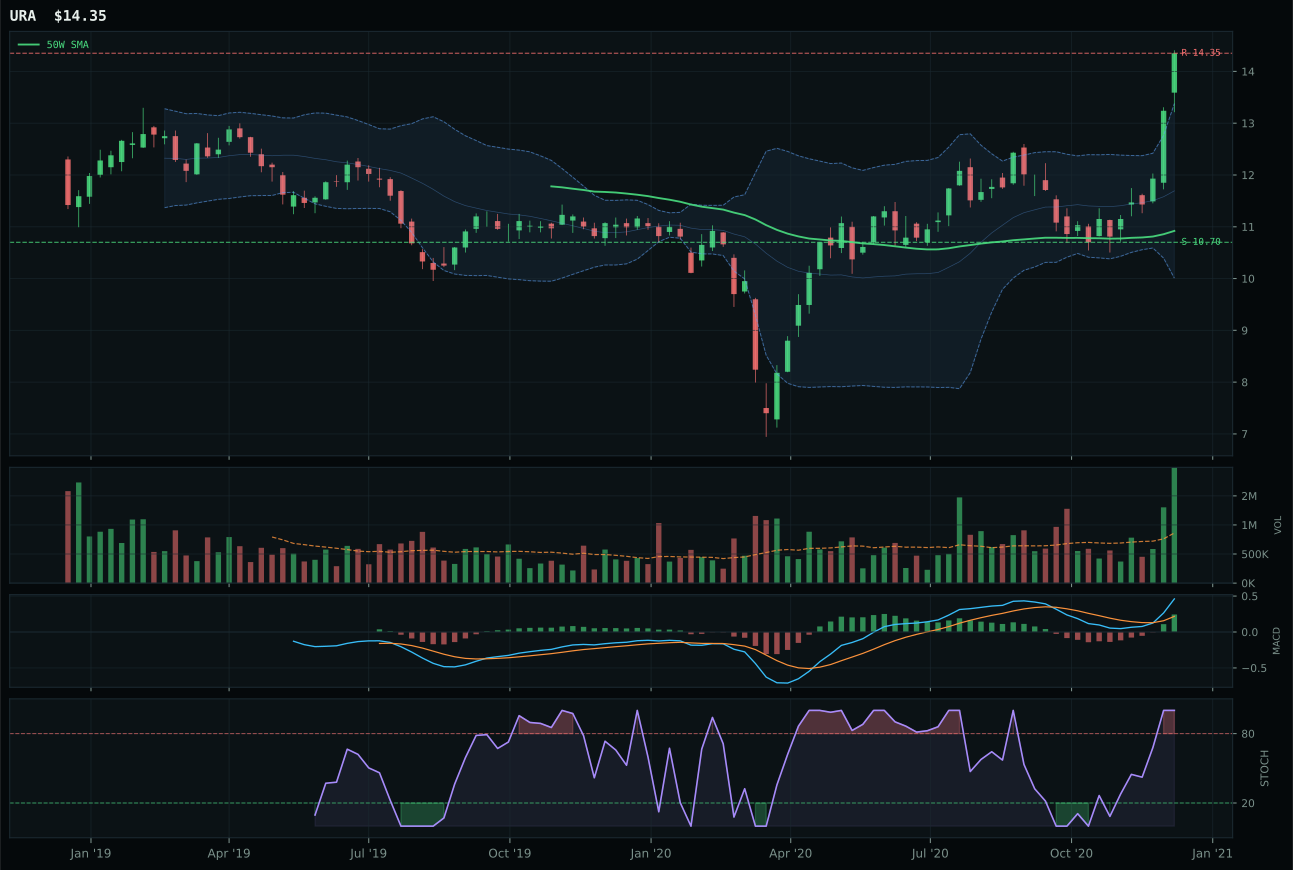
URA has a vertical extension profile with 11.9% 13-week relative strength versus SPY.
A failed hold above support would weaken the setup.
Actionable but governed by invalidation levels.
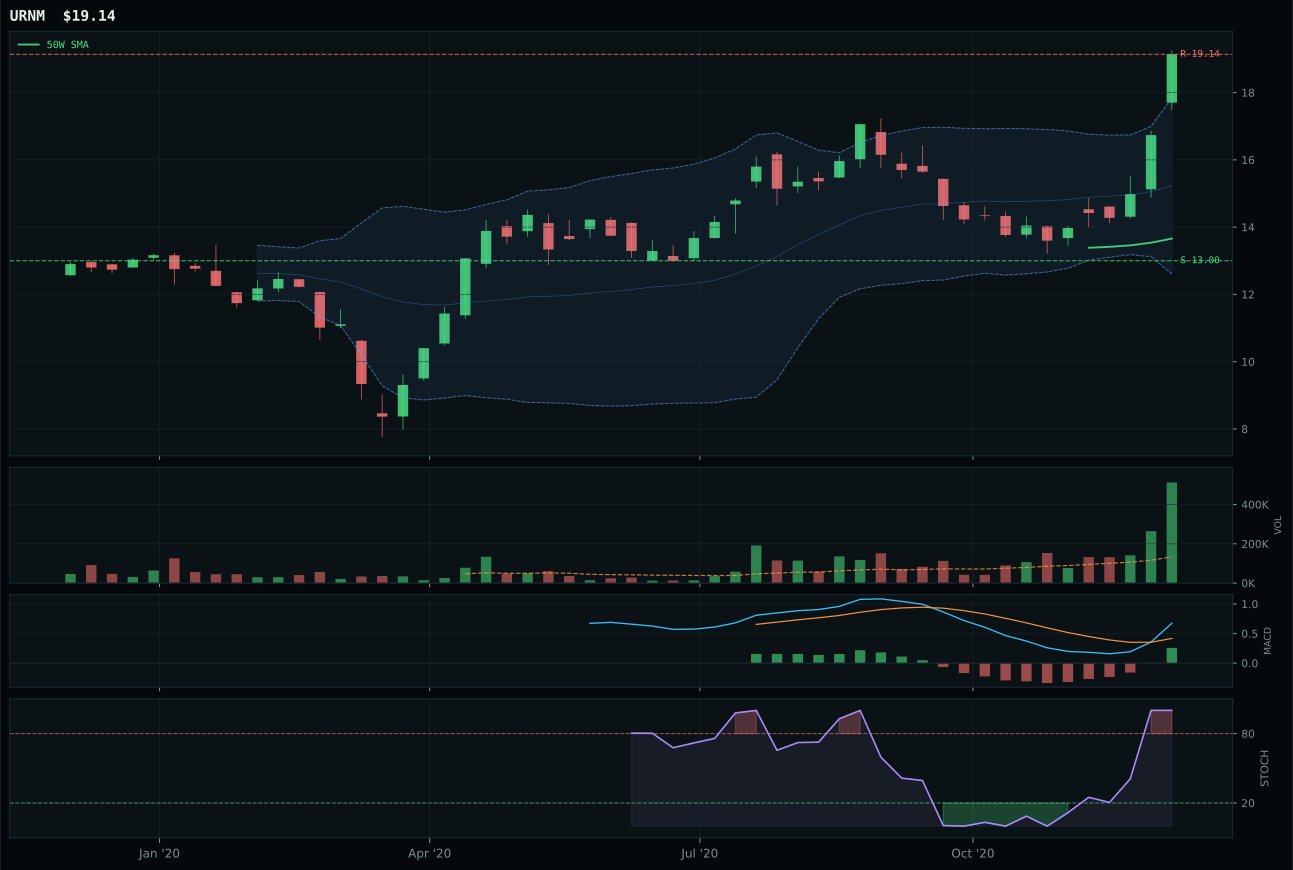
URNM has a vertical extension profile with 12.2% 13-week relative strength versus SPY.
A failed hold above support would weaken the setup.
Tracked, but not top-2 eligible because: .
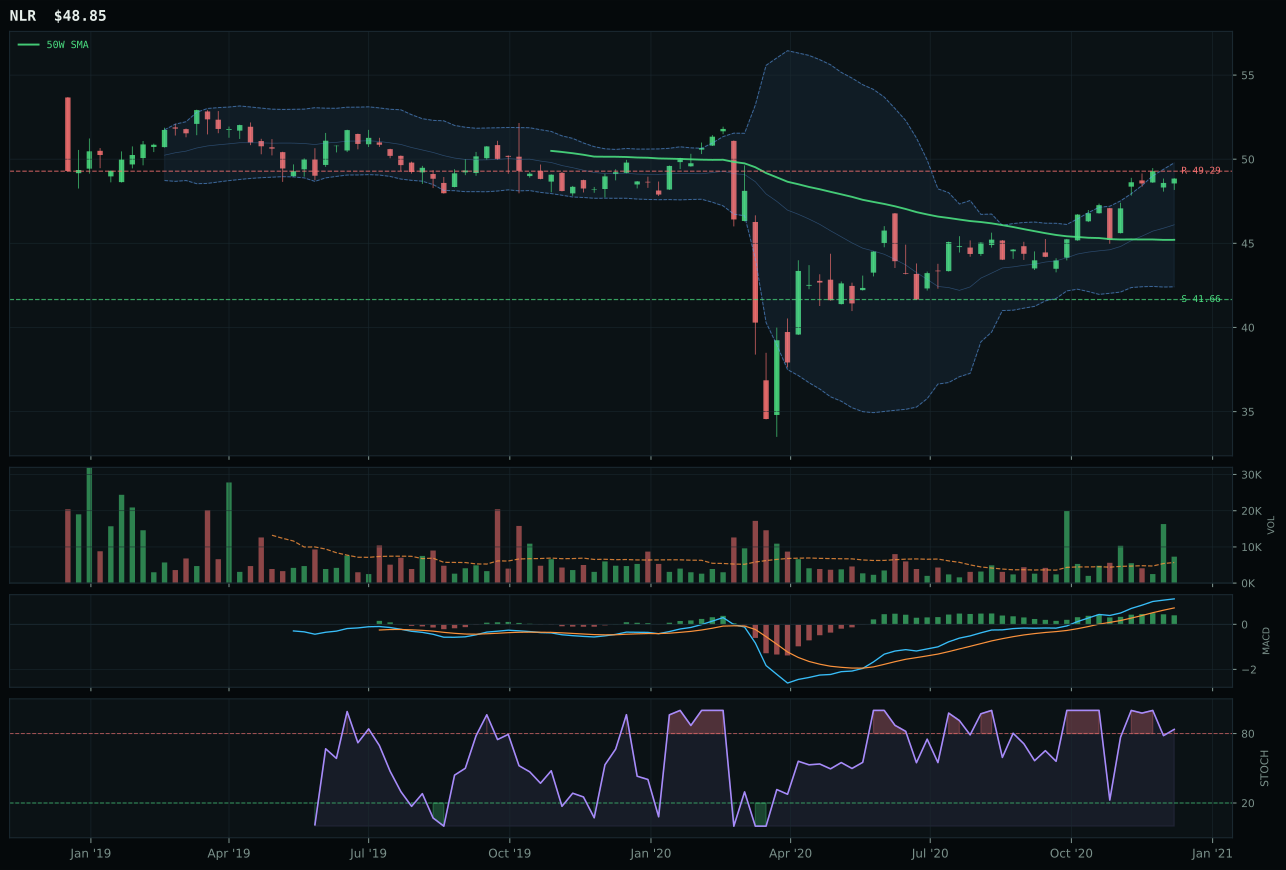
NLR has a neutral structure profile with 1.4% 13-week relative strength versus SPY.
A failed hold above support would weaken the setup.
Tracked, but not top-2 eligible because: .
URA wins the category with a decisive 26.7-point margin over URNM, capturing nuclear allocation through superior risk/reward (46.2 vs 45.0) and cleaner structure (79.8 vs 79.1)—narrow wins that compound when coupled with perfect momentum confirmation (100/100) and accumulation-level volume at 4.04x the twenty-day average. The thirteen-week return of 21.5% and SPY-relative strength of 11.9% anchor the category thesis, but the real differentiator is the 85.4% volume-price confirmation score reflecting broad-based accumulation into a vertical extension at 31.4% above the 50W. URNM's weakness stems from its uranium-miner scarcity bias, which is macro-superior (69.0% macro fit vs URA's neutral 50.0%) but technically inferior; the higher macro score cannot overcome URNM's lower technical evidence (45.0 vs 84.6) when the category mechanism weights technical at 62%. URA's 4.04x volume accumulation tells the true story: institutional money is betting on broad-based nuclear adoption, not concentrated miner plays.
Nuclear Energy received 0% allocation this week, ranked outside the funded tier entirely despite URA's 84.6% technical evidence score and the category's 69.0% macro fit—one of the strongest in the portfolio. The 45.5 composite score ranks it 9th or 10th, shut out by the stronger technical-macro combinations in top-2 (energy, metals) and tier-2 (technology, AI, defense, agriculture, emerging markets, utilities). The macro case for nuclear is legitimate: 'energy scarcity' at +9, 'real asset sponsorship' at +7, and 'AI growth sponsorship' at +5 all support the category. However, the portfolio allocator correctly identified that allocation capacity is exhausted by energy (10%) and industrial metals (10%), which capture the same macro themes with better technical setups and more liquid markets. URA's 31.4% extension above the 50W and overbought stochastic momentum also create timing friction that does not exist in PICK or FCG. Nuclear Energy would earn allocation if either top-2 category deteriorated (losing macro sponsorship or breaking below support) or if URA pulled back to test the 50W with volume confirmation—a cleaner entry that currently does not exist.
Precious Metals — GLD
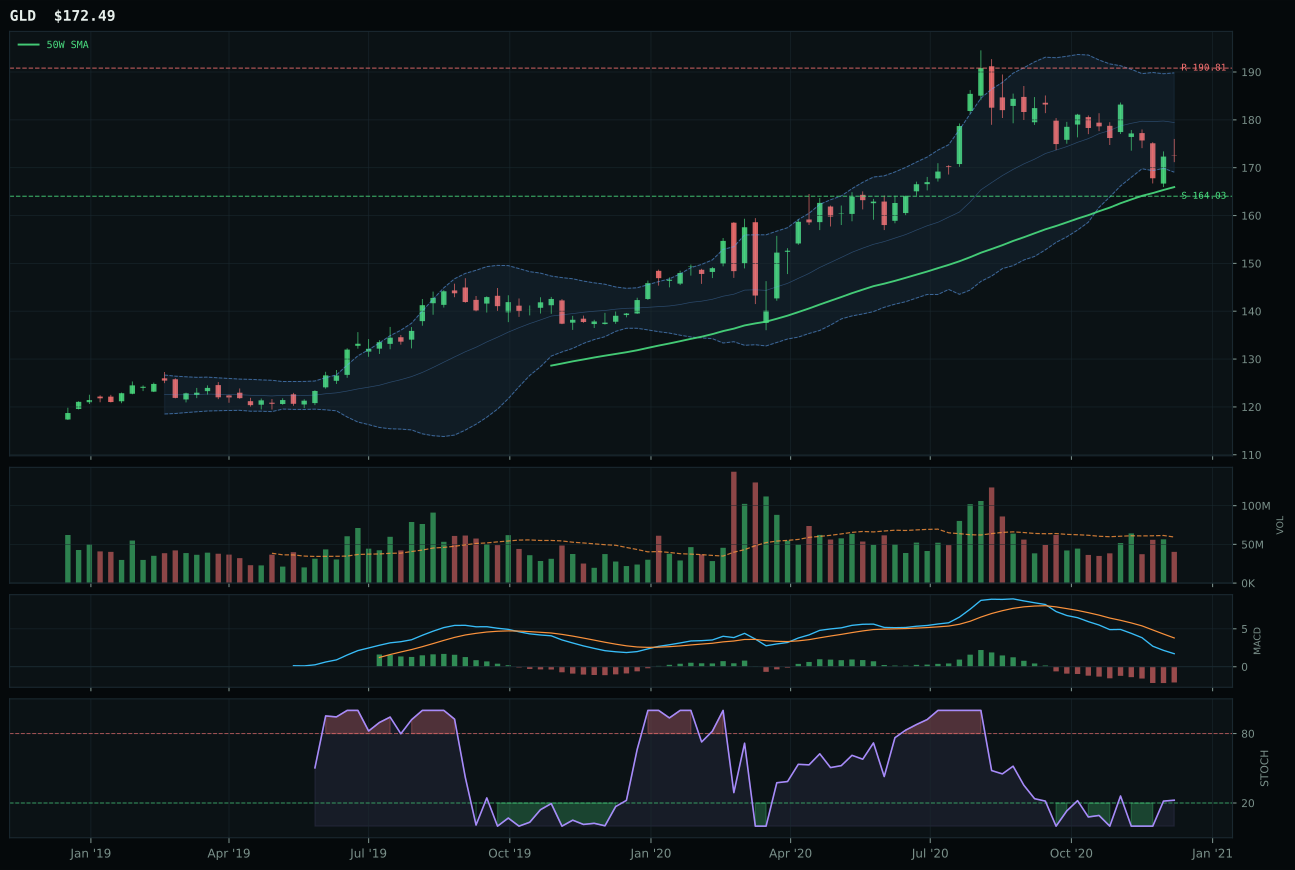
GLD has a neutral structure profile with -15.1% 13-week relative strength versus SPY.
A failed hold above support would weaken the setup.
Actionable but governed by invalidation levels.
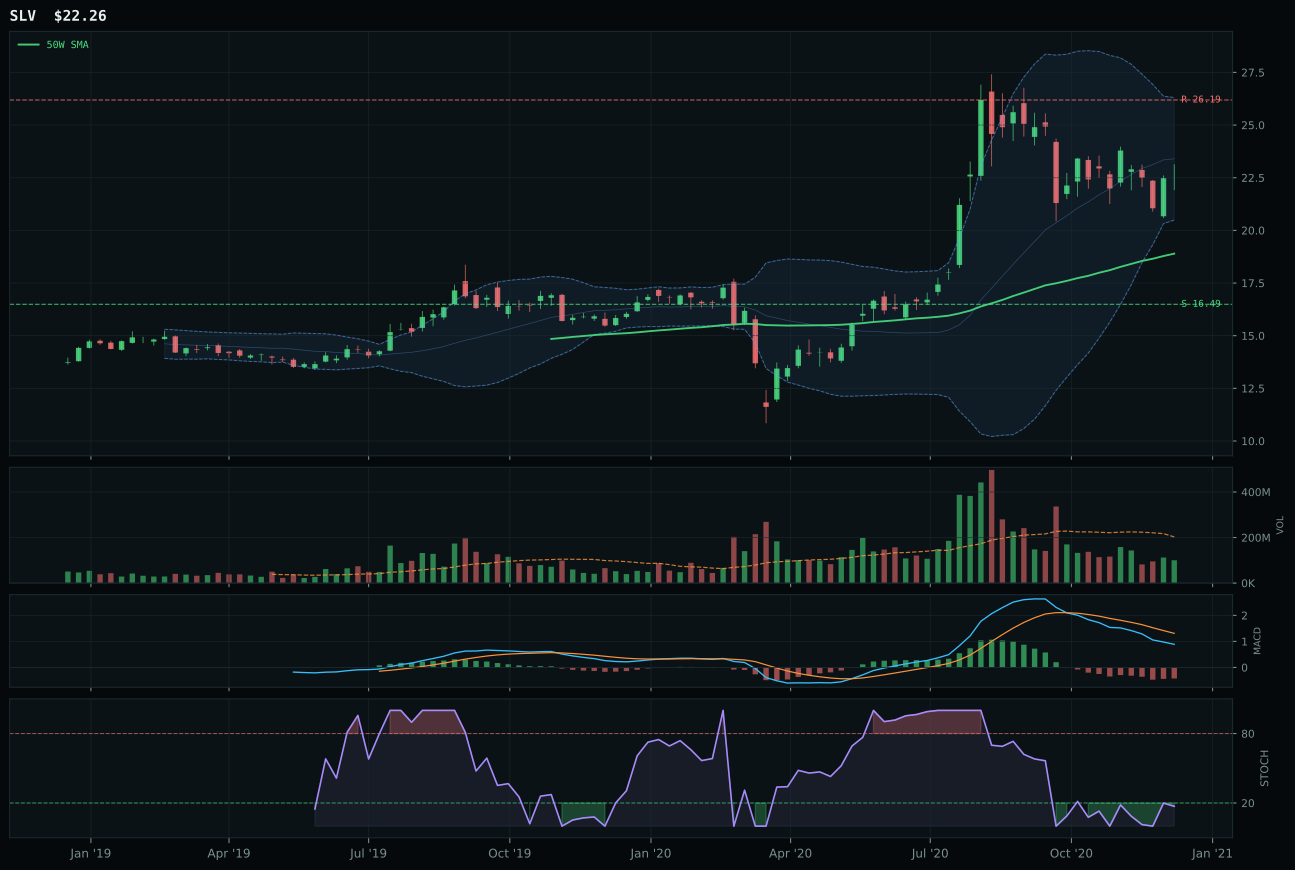
SLV has a vertical extension profile with -20.3% 13-week relative strength versus SPY.
A failed hold above support would weaken the setup.
Actionable but governed by invalidation levels.
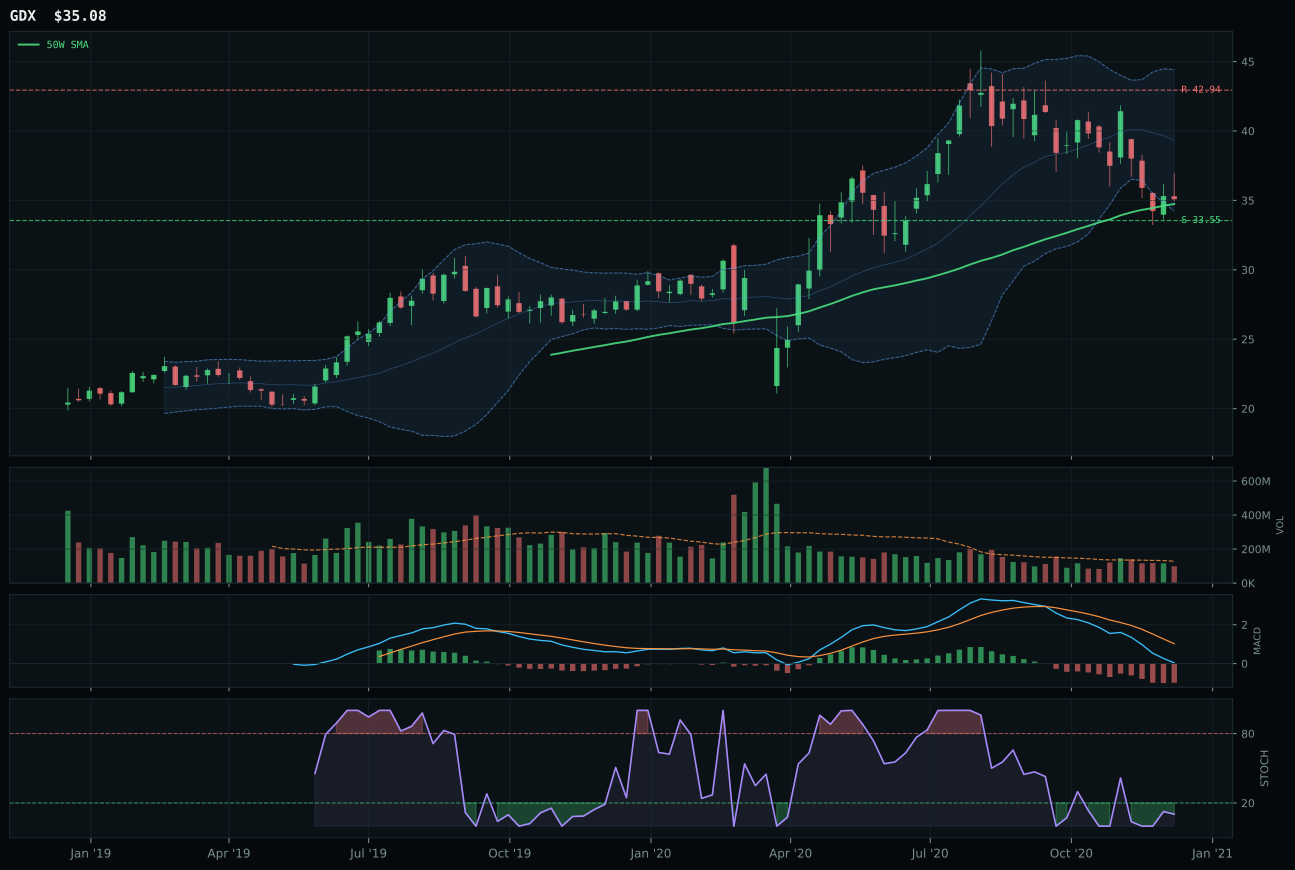
GDX has a pullback into support profile with -24.4% 13-week relative strength versus SPY.
A failed hold above support would weaken the setup.
Actionable but governed by invalidation levels.
GLD wins the category with a 17.3-point advantage over SLV, but neither ETF merits allocation this week—this is a category fight for nothing. GLD's edge comes from superior timing (93.0 vs 62.0) and better risk/reward (78.5 vs 52.7), grounded in a close-to-the-50W setup (3.9% distance) rather than a vertical extension. The neutral structure and bearish-weakening MACD reveal that gold is coiling into a decision point rather than confirming an uptrend; stochastic RSI rising mid-zone (0.22) offers the optionality of a bottom-formation that SLV's oversold turnaround setup does not. However, the fatal problem is momentum: GLD's thirteen-week return is -5.5%, SPY-relative is -15.1%, and momentum confirmation scores only 3.4/100. This is not a winner setup; it is a defensive, lower-volatility alternative masquerading as technical leadership because timing is good relative to an even weaker peer.
Precious Metals received 0% allocation this week, excluded entirely from the portfolio. The category's 36.4 composite score ranks it 9th or 10th, a full 25+ points below the tier-2 threshold. The macro fit is weak (46.0)—'risk appetite positive' is active, which penalizes safe-haven positioning by -4 points—and technical evidence is worse: GLD's 40.5/100 technical score and SLV's 18.4/100 reflect negative thirteen-week returns, SPY-relative weakness, and deteriorating MACD. In an AltSeason environment with elevated risk appetite, gold and silver are crowded-trade exits, not entries. The category would need either a sharp equity selloff (reversing the 'risk appetite positive' macro descriptor) or a technical setup that shows accumulation into support with rising volume—neither exists. GLD's 3.9% proximity to the 50W and rising stochastic RSI offer a potential low-risk entry point for a future trade, but that entry is a sell signal for the current allocation period, not a hold.