
2020-12-04
Informational purposes only. The content in this report, including allocations, analysis, and commentary, is provided solely for informational and educational purposes. It does not constitute financial advice, investment advice, trading advice, or any other type of advice. Past performance does not guarantee future results. Always conduct your own research and consult a qualified financial professional before making investment decisions.
Some tracked tickers were excluded due to missing live weekly price data: SGOV: Historical cache SGOV has only 27 usable weekly bars
Weekly Allocation
| Ticker | Category | Weight | Role |
|---|---|---|---|
| FSOL | 50% | Overlay | |
| FCG | Traditional Energy | 10% | Top-2 (10%) |
| COPX | Industrial Metals | 10% | Top-2 (10%) |
| ILF | Emerging Markets | 5% | Tier-2 (5%) |
| SMH | AI | 5% | Tier-2 (5%) |
| CIBR | Technology | 5% | Tier-2 (5%) |
| PAVE | Utilities & Infrastructure | 5% | Tier-2 (5%) |
| XAR | Defense & Aerospace | 5% | Tier-2 (5%) |
| MOO | Agriculture & Livestock | 5% | Tier-2 (5%) |
Trade Instructions — Monday Open
Sell the tranche from 2020-11-06 (completing its 4-week hold). Buy the new tranche. Instructions show net portfolio changes — same-asset positions cancel, weight changes show the delta.
| Action | Ticker | Instruction |
|---|---|---|
| SELL | SMH | Sell 20% of SMH position (reduce 6.25% → 5.00%) |
| SELL | IEMG | Sell entire IEMG position (1.25% of portfolio) |
| SELL | IGV | Sell entire IGV position (1.25% of portfolio) |
| SELL | XLU | Sell entire XLU position (1.25% of portfolio) |
| SELL | GLD | Sell entire GLD position (1.25% of portfolio) |
| BUY | ILF | Buy ILF — 20.00% of freed cash (adds 1.25% to portfolio) |
| BUY | PAVE | Buy PAVE — 20.00% of freed cash (adds 1.25% to portfolio) |
| BUY | CIBR | Buy CIBR — 20.00% of freed cash (adds 1.25% to portfolio) |
| BUY | FCG | Buy FCG — 40.00% of freed cash (adds 2.50% to portfolio) |
Current Portfolio After Trade
Combined holdings across all 4 active tranches. Each tranche is 25% of the portfolio.
| Ticker | % of Portfolio | Weight Bar |
|---|---|---|
| FSOL | 50.00% | |
| ILF | 8.75% | |
| REMX | 6.25% | |
| SMH | 5.00% | |
| MOO | 5.00% | |
| XAR | 5.00% | |
| FCG | 5.00% | |
| PAVE | 3.75% | |
| CIBR | 3.75% | |
| IGF | 2.50% | |
| COPX | 2.50% | |
| XLK | 1.25% | |
| XLE | 1.25% |
Macro Regime — Transition / Mixed
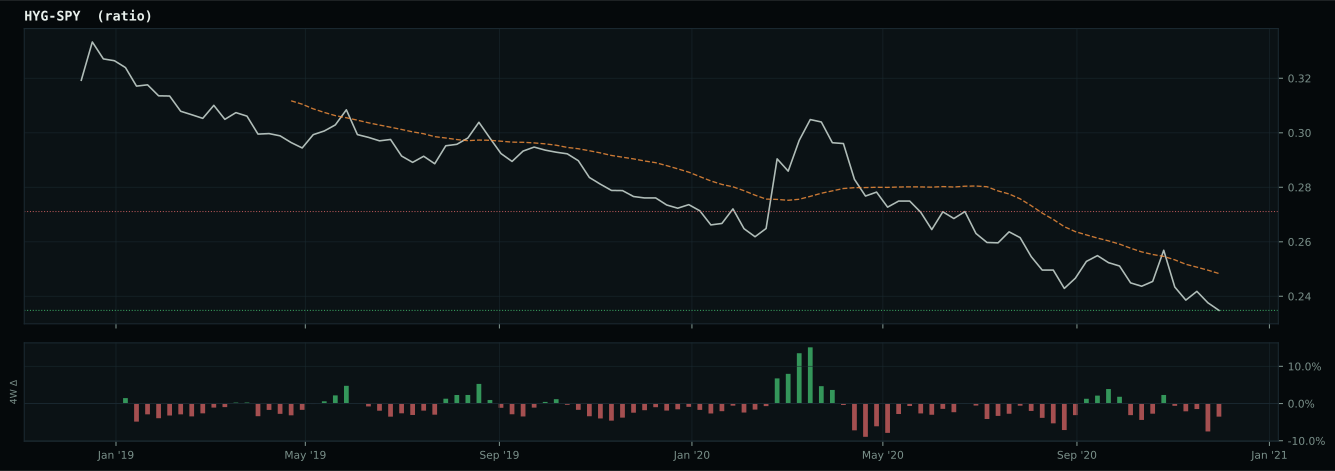
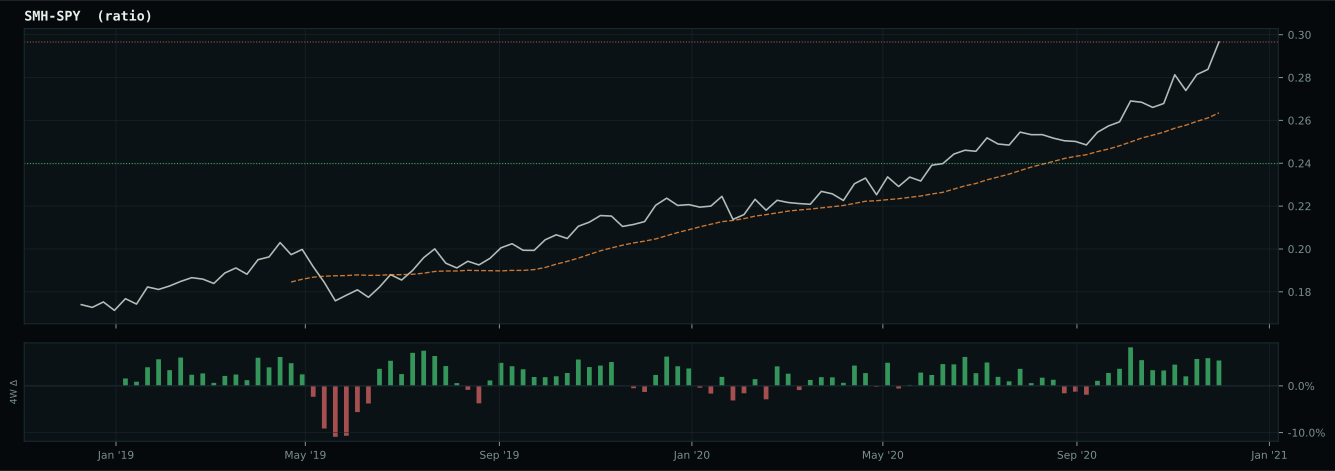
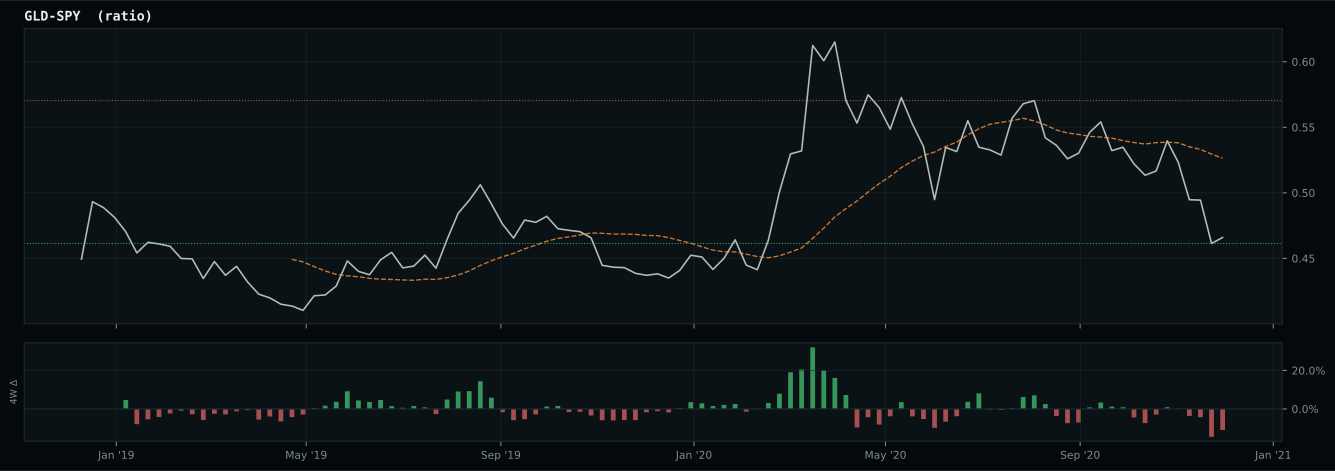
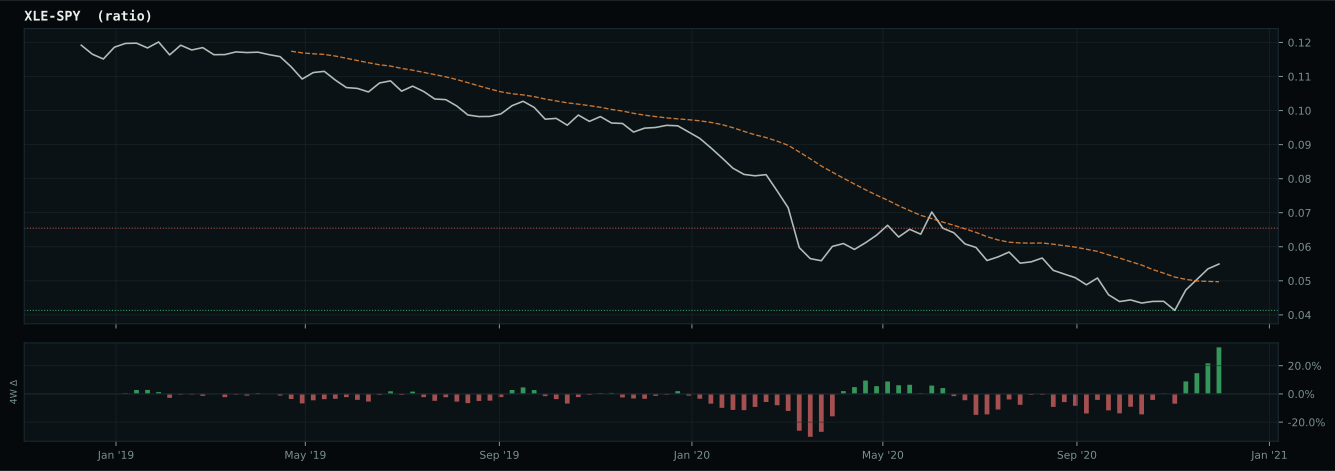
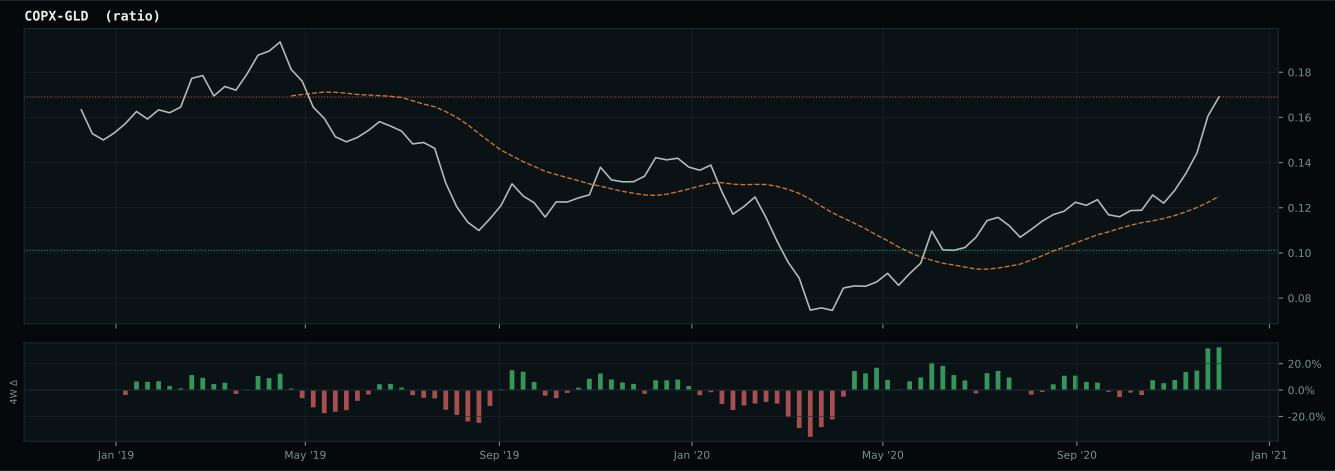
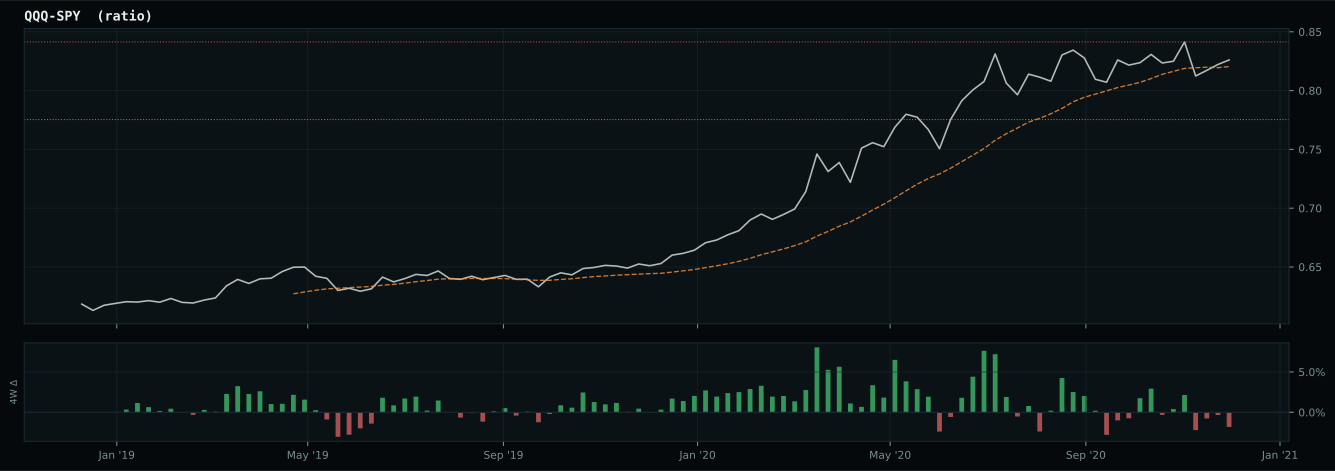
Macro Evidence Charts
Market-implied signals behind the macro regime scores. Each ratio compares two assets; the direction and slope of the ratio is what the macro engine reads.
Crypto Regime — AltSeason
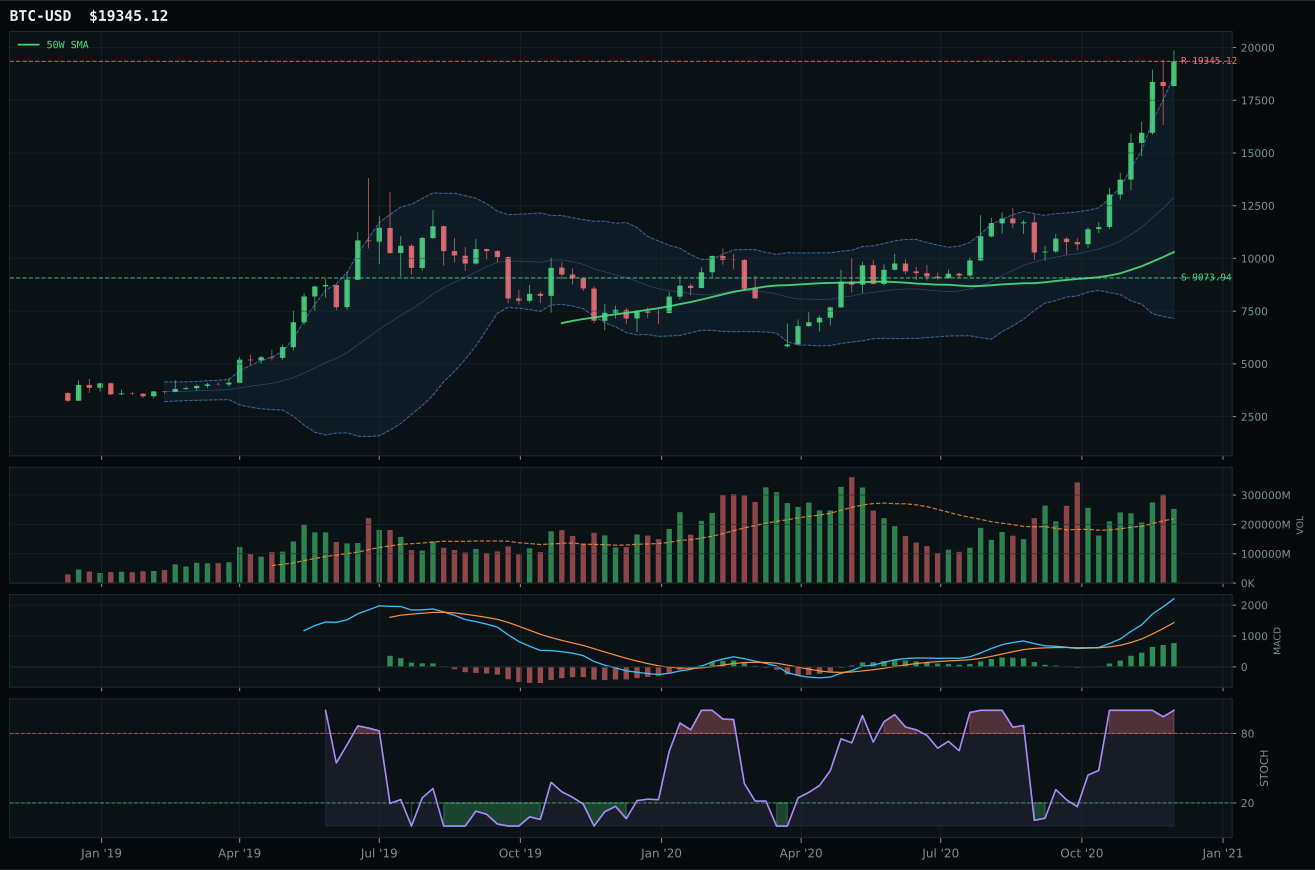
post-touch structure is too wide to count as a range; max/min close ratio is 3.41
TrendBTC confirmed: 2 consecutive closes above rising/flat 50W SMA
all available AltSeason conditions pass; missing optional confirmations skipped

Category Rankings
| Rank | Category | Winner | Score | Alloc | 4W Ret | Peers (4W) |
|---|---|---|---|---|---|---|
| 1 | Traditional Energy | FCG | 88.4 | 20% | -3.04% | XOP -1.2% · XLE -4.5% |
| 2 | Industrial Metals | COPX | 81.6 | 20% | +8.33% | PICK +5.5% · REMX +18.3% |
| 3 | Emerging Markets | ILF | 76.2 | 10% | +3.46% | IEMG +3.6% · INDA +6.8% |
| 4 | AI | SMH | 70.6 | 10% | -0.12% | BOTZ +3.5% · AIQ +2.9% |
| 5 | Technology | CIBR | 66.3 | 10% | +12.40% | IGV +4.2% · XLK +3.6% |
| 6 | Utilities & Infrastructure | PAVE | 59.0 | 10% | +2.09% | IGF +0.5% · XLU +1.0% |
| 7 | Defense & Aerospace | XAR | 57.9 | 10% | -0.31% | ITA -2.3% · ROKT +1.3% |
| 8 | Agriculture & Livestock | MOO | 52.1 | 10% | +3.37% | VEGI +3.6% · WEAT +10.7% |
| 9 | Nuclear Energy | URNM | 36.6 | 0% | +23.93% | URA +15.6% · NLR +3.6% |
| 10 | Precious Metals | GLD | 35.8 | 0% | +5.45% | SLV +14.7% · GDX +6.8% |
Traditional Energy — FCG
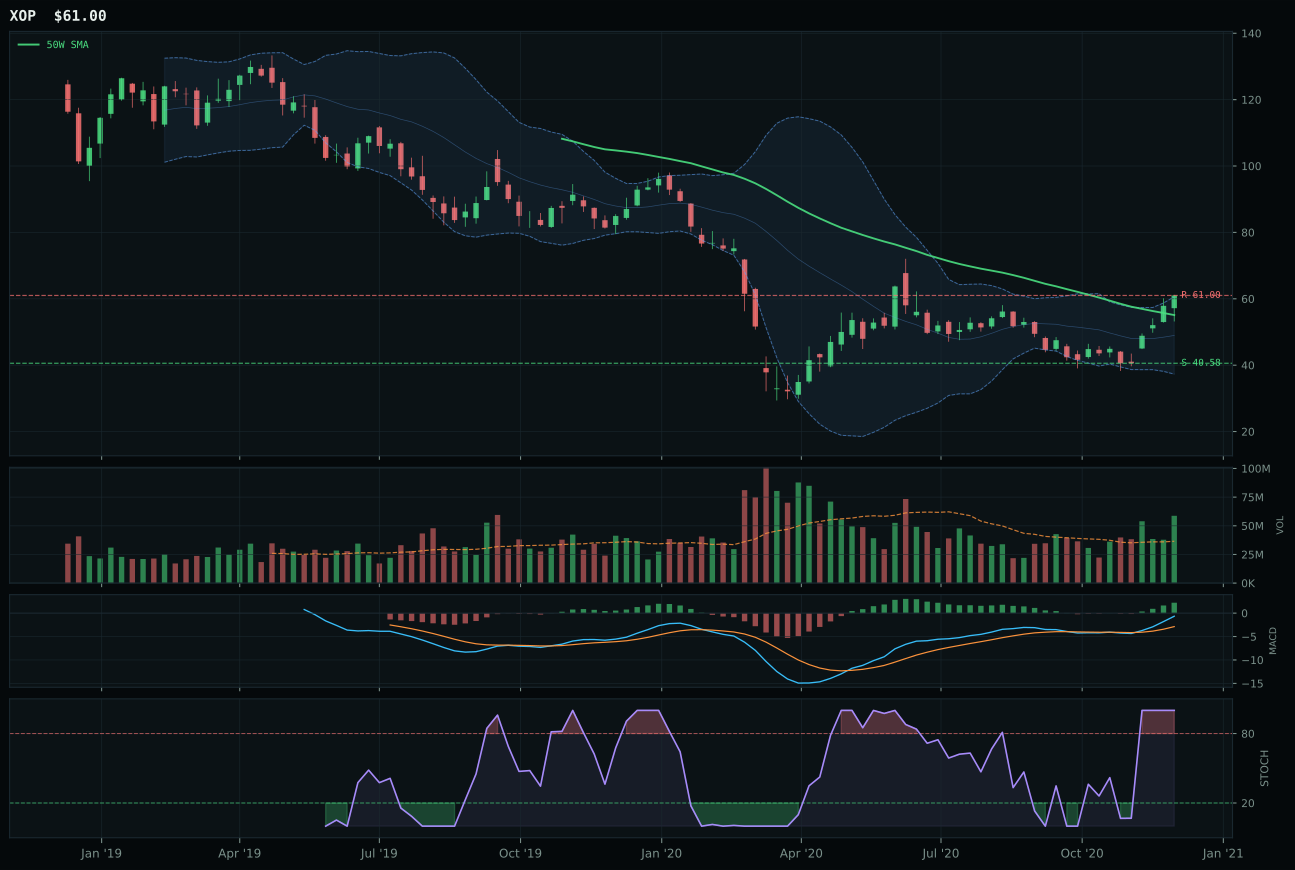
XOP has a neutral structure profile with 15.4% 13-week relative strength versus SPY.
A failed hold above support would weaken the setup.
Actionable but governed by invalidation levels.
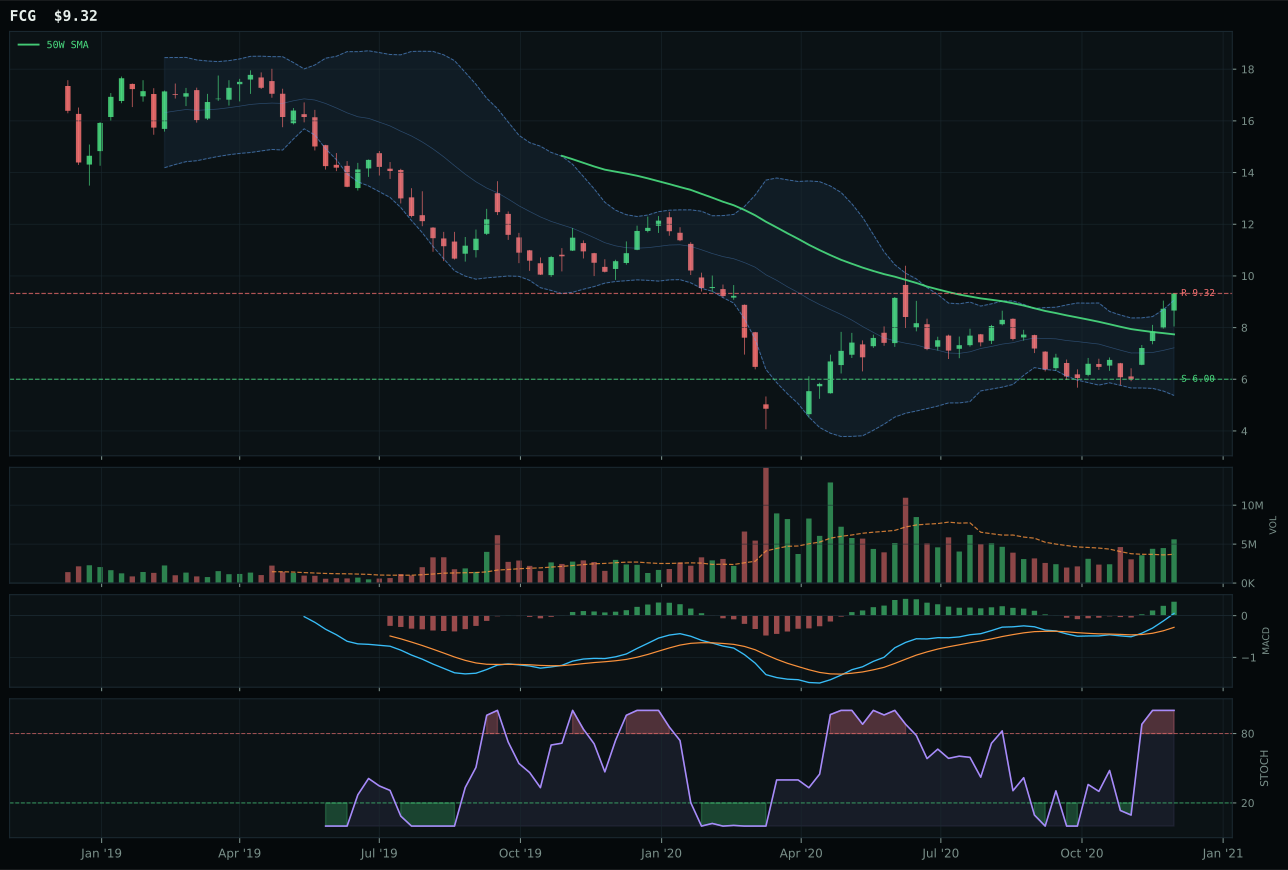
FCG has a vertical extension profile with 21.7% 13-week relative strength versus SPY.
A failed hold above support would weaken the setup.
Actionable but governed by invalidation levels.
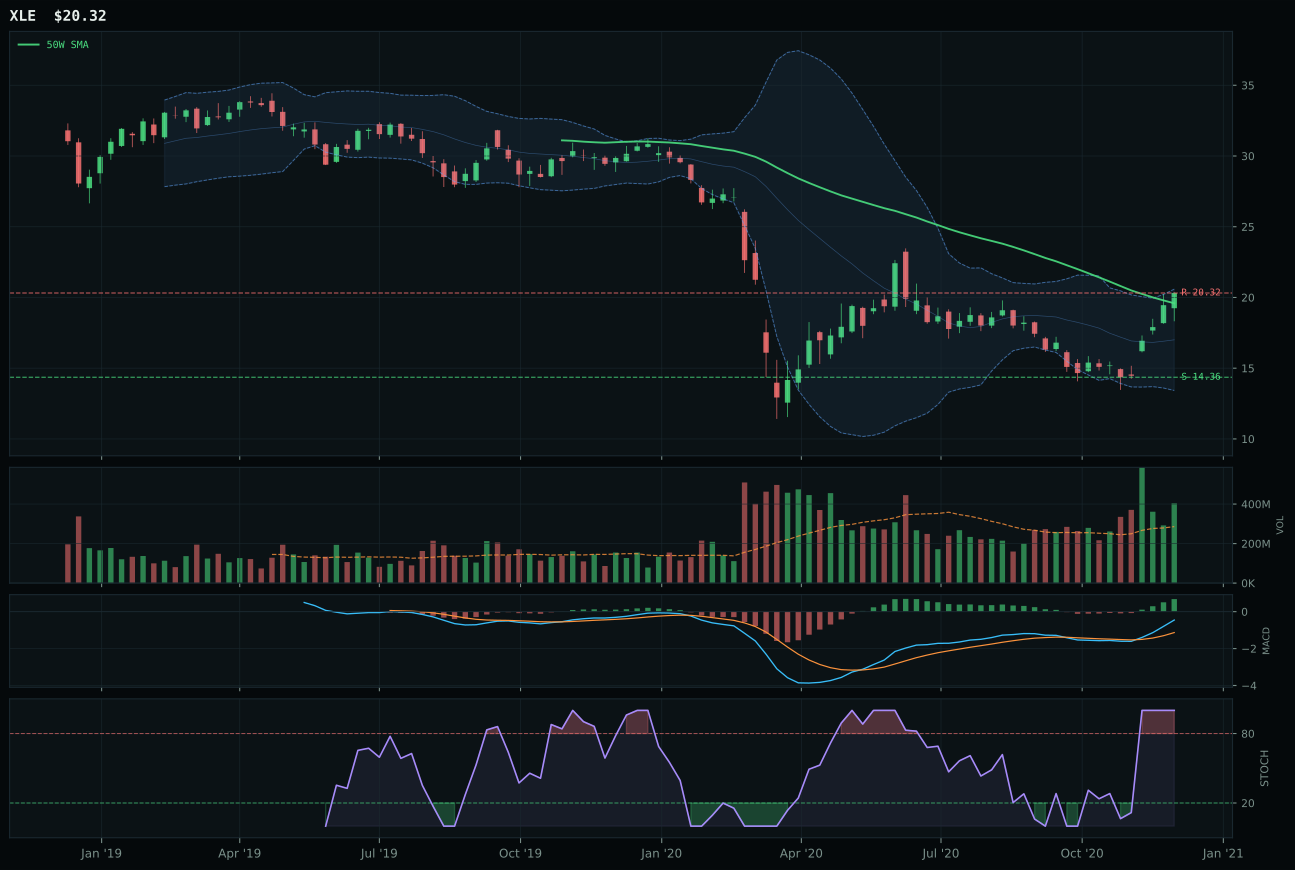
XLE has a neutral structure profile with 8.6% 13-week relative strength versus SPY.
A failed hold above support would weaken the setup.
Actionable but governed by invalidation levels.
FCG wins the category with a 88.4 score, the highest across all 10 categories, despite a -10.8-point gap versus XOP in the reasoned proof order—a dramatic inversion explained entirely by superior category-relative strength at 6.3% versus XOP's 0.0% lagging median. Natural gas futures track a vertical extension 22.6% above the 50W with accumulation volume at 1.52x the 20-week average, delivering a 29.6% thirteen-week return and 21.7% SPY-relative outperformance that anchors energy leadership. Critically, FCG's MACD is bullish and improving with momentum confirmation at 100.0, whereas XOP (the reasoned category favorite at 92.1 technical evidence) sits in neutral structure with timing that depends on the middle retracement zone holding support. XOP offers better overall technical evidence and lower extension risk (middle Fib zone vs upper extension), but cannot overcome the fact that gas prices are outrunning broad energy; this relative leadership test is decisive for representative selection, overriding the proof order. The -10.8-point reversal illustrates how category-relative strength acts as the tiebreaker when multiple ETFs show institutional-grade accumulation.
Traditional Energy holds top-2 weight at 10% allocation, ranking as the highest-scoring category at 88.4 with the strongest macro fit at 85.0 out of 100, supported by active energy scarcity (+16), inflation pressure (+10), supply shortage (+9), and real asset sponsorship (+7). This is the energy cycle at maximum intensity: FCG's price below the 200W (70.0 trend evidence) normally signals caution, but the accumulation volume and 55.3% four-week return override structural hesitation. The position's downside to support at 55.3% is substantial, yet the macro regime offers structural support unlikely to reverse rapidly. FCG's timing score of 45.0 reflects price in the upper retracement zone rather than overbought stochastic RSI territory, meaning some extension remains available without completing the full cycle reversal. The 10% allocation is justified by category-wide consensus (FCG reasoned 87.6, XOP reasoned 87.4, XLE reasoned 82.0) that energy scarcity and inflation pressure will persist. Should FCG test its 50W support level without MACD deterioration, the position becomes a core rebalancing point; should energy scarcity descriptors toggle off, the top-2 status reverses immediately.
Industrial Metals — COPX
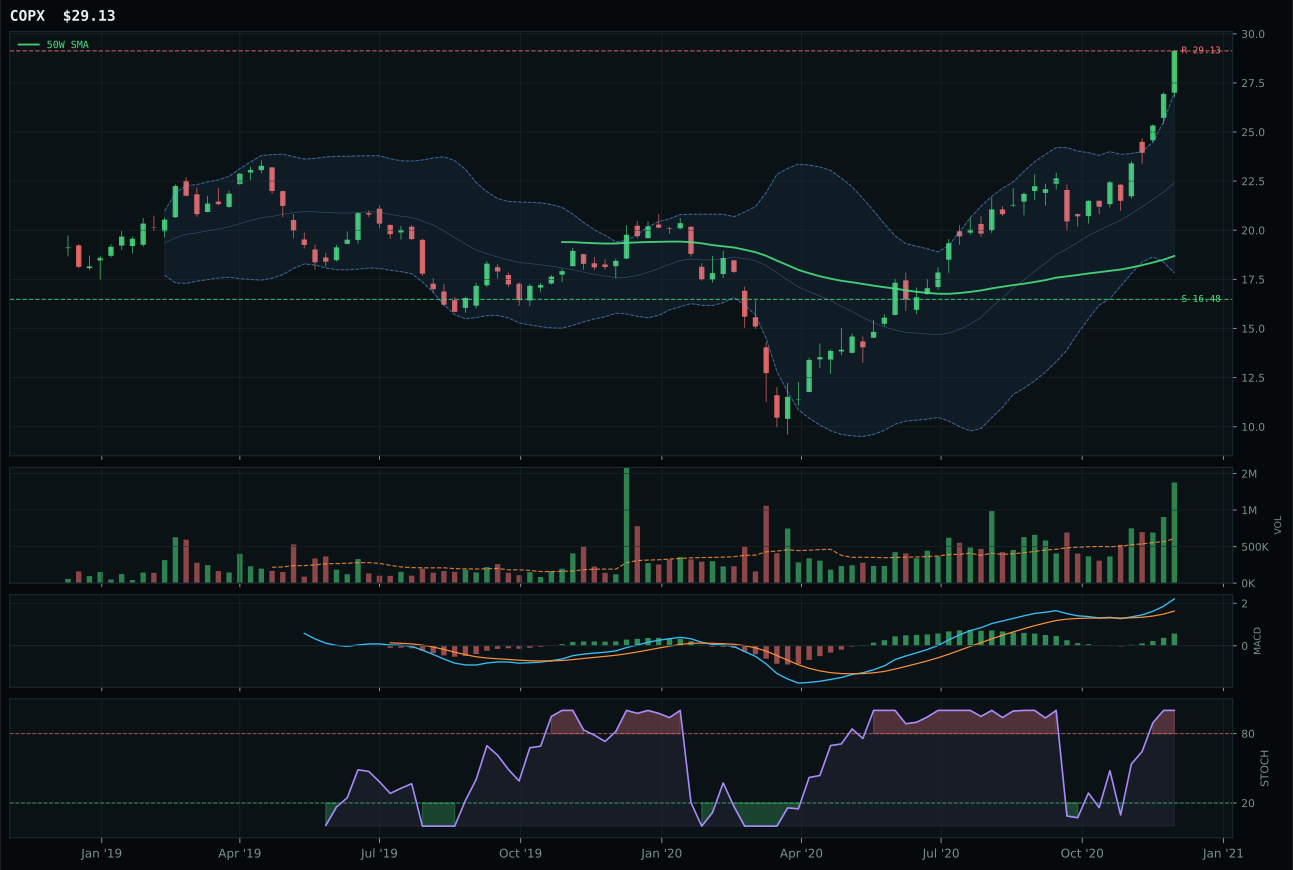
COPX has a vertical extension profile with 23.0% 13-week relative strength versus SPY.
A failed hold above support would weaken the setup.
Actionable but governed by invalidation levels.
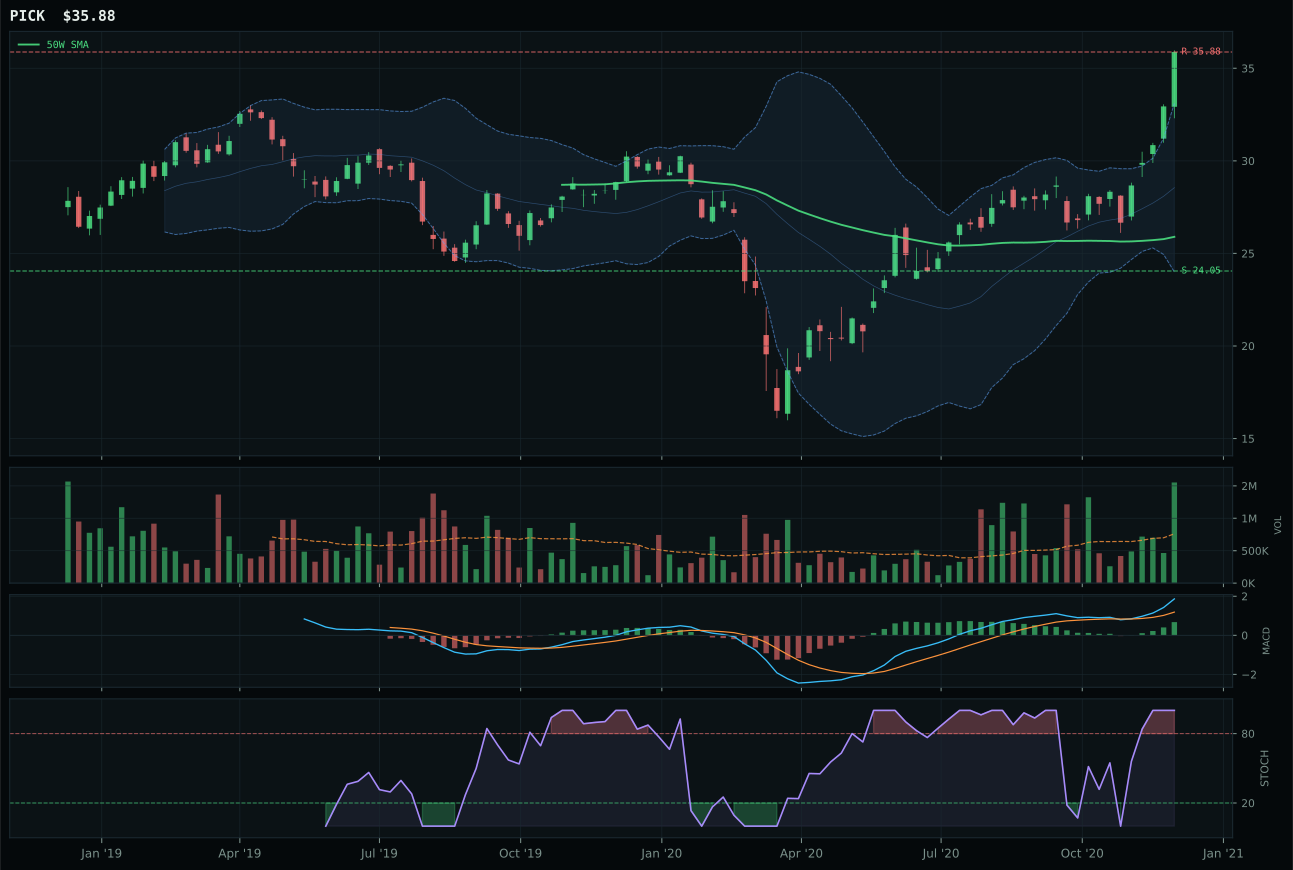
PICK has a vertical extension profile with 20.5% 13-week relative strength versus SPY.
A failed hold above support would weaken the setup.
Actionable but governed by invalidation levels.
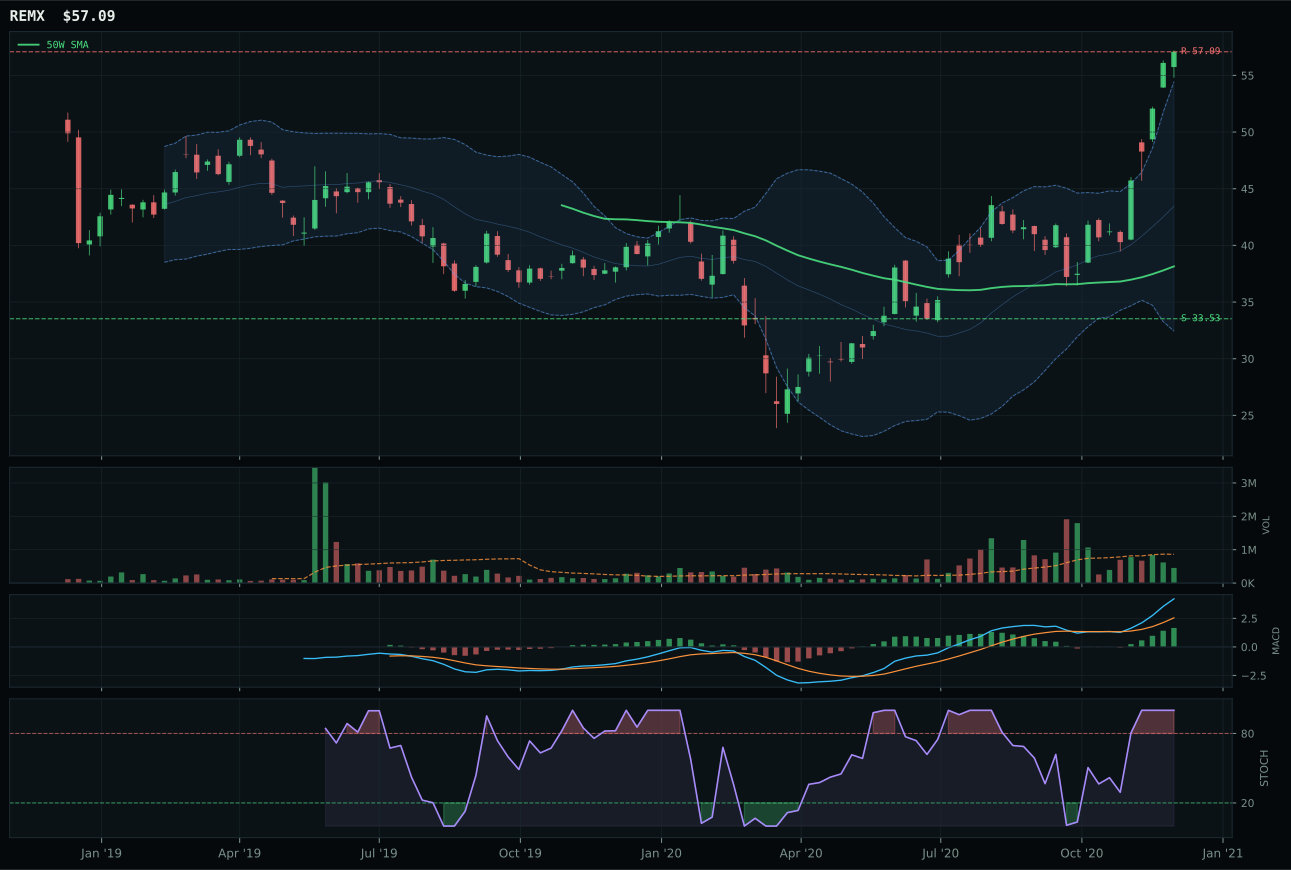
REMX has a vertical extension profile with 31.3% 13-week relative strength versus SPY.
A failed hold above support would weaken the setup.
Actionable but governed by invalidation levels.
COPX claims the top-2 selection with an 81.6 category score and wins the representative slot despite a razor-thin -0.2-point gap versus PICK, justified entirely by superior category-relative strength at 0.0% (category median) that edges PICK's -2.5% lagging position. Copper's scarcity narrative pairs with vertical extension 55.8% above the 50W and accumulation volume at a robust 2.26x the 20-week average, creating a rare setup where extreme extension is validated by institutional-grade volume confirmation. The thirteen-week return of 31.0% with 23.0% SPY-relative outperformance demonstrates sustained sponsorship; MACD is bullish and improving, stochastic RSI is overbought at 1.00, and volume-price confirmation reaches 89.0 with persistence at 99.7—meaning the move has legs despite being extended. PICK trails only because its -2.5% category-relative weakness breaks the leadership test, even though its 87.0 technical evidence and 20.5% SPY-relative return are competitive. The gap widens on margin because COPX holds the median position within its peer set, whereas PICK's negative relative strength suggests capital has rotated away.
Industrial Metals ranks as top-2 overweight at 10% allocation, capturing the second-highest category score at 81.6 and commanding the largest macro tailwind in the portfolio via active metals scarcity (+14), commodity breadth positive (+10), and real asset sponsorship (+6). This is the metals cycle in motion: COPX's 55.8% extension above the 50W would be disqualifying in a neutral macro regime, but the +73.0 category-level macro fit (weighted 38% of the final score) creates asymmetric conviction that justifies accepting entry risk. The position's downside to support sits at 76.8%, meaning a severe pullback is possible, yet the accumulation volume and bullish MACD trajectory offer protection against a failed breakout. The 10% allocation reflects a portfolio-wide conviction that industrial metals supply scarcity will persist through the transition period, with copper as the pinch point for EV battery and grid infrastructure buildout. Should COPX test its 50W support (currently 15.7 away) without MACD deterioration, the position becomes a core tactical accumulation opportunity at lower cost basis.
Emerging Markets — ILF
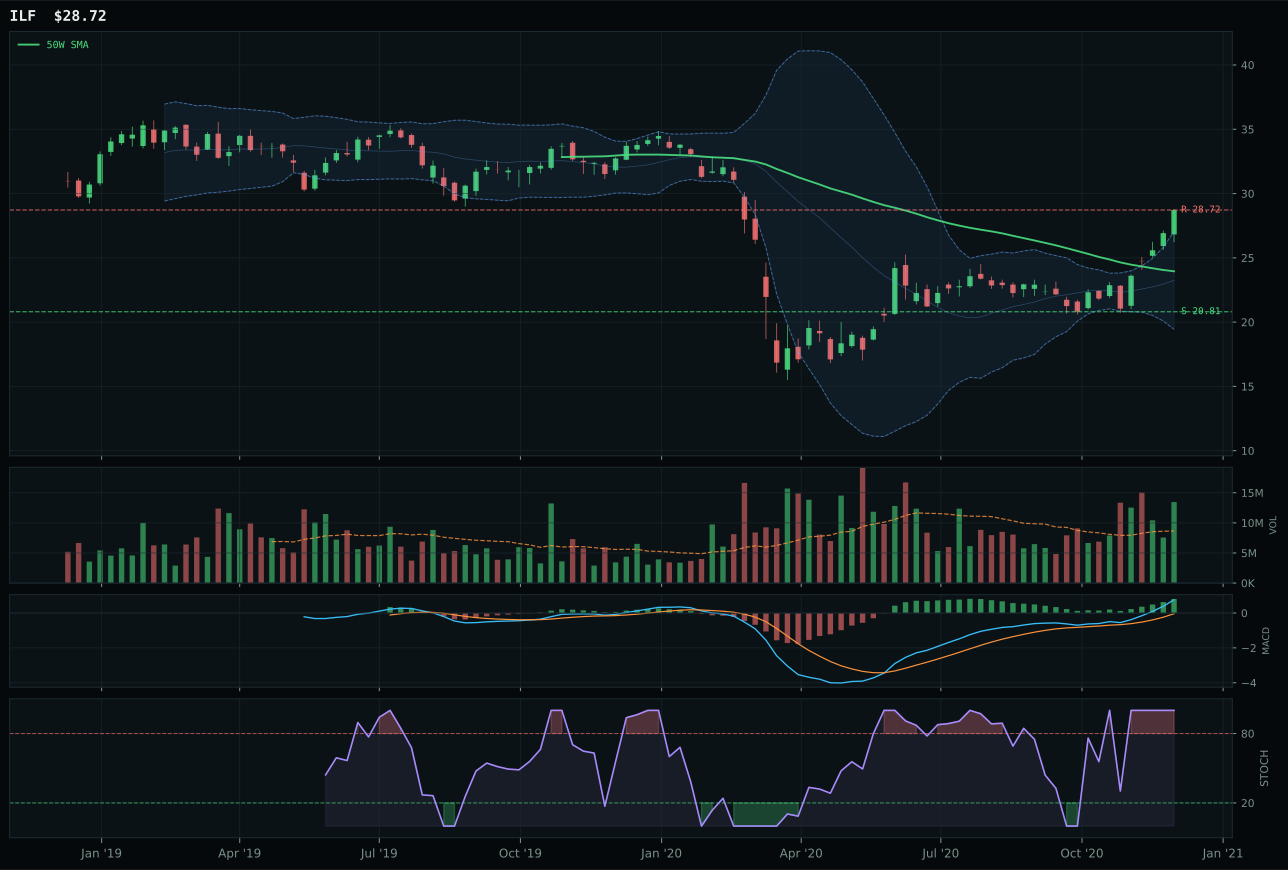
ILF has a vertical extension profile with 17.4% 13-week relative strength versus SPY.
A failed hold above support would weaken the setup.
Actionable but governed by invalidation levels.
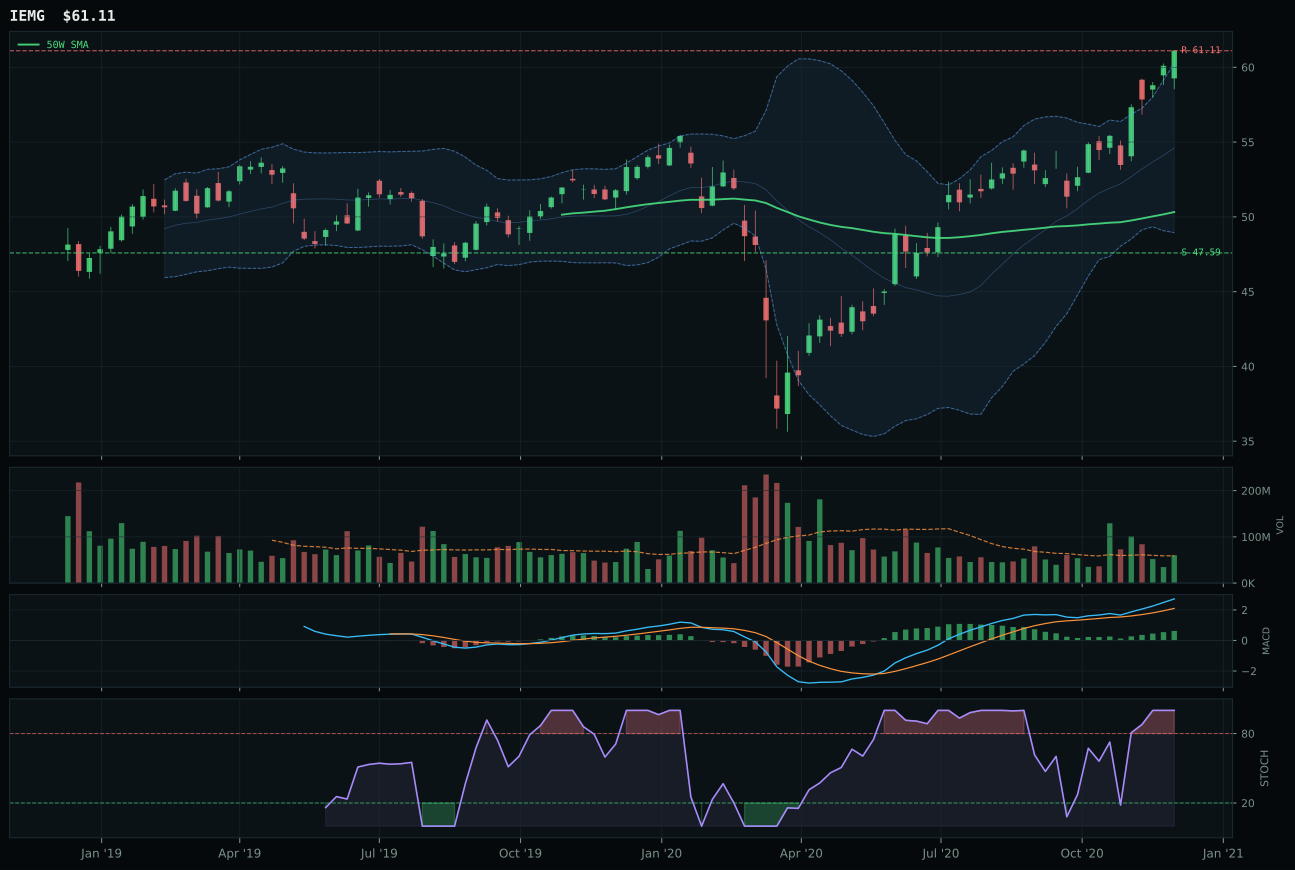
IEMG has a vertical extension profile with 7.1% 13-week relative strength versus SPY.
A failed hold above support would weaken the setup.
Actionable but governed by invalidation levels.
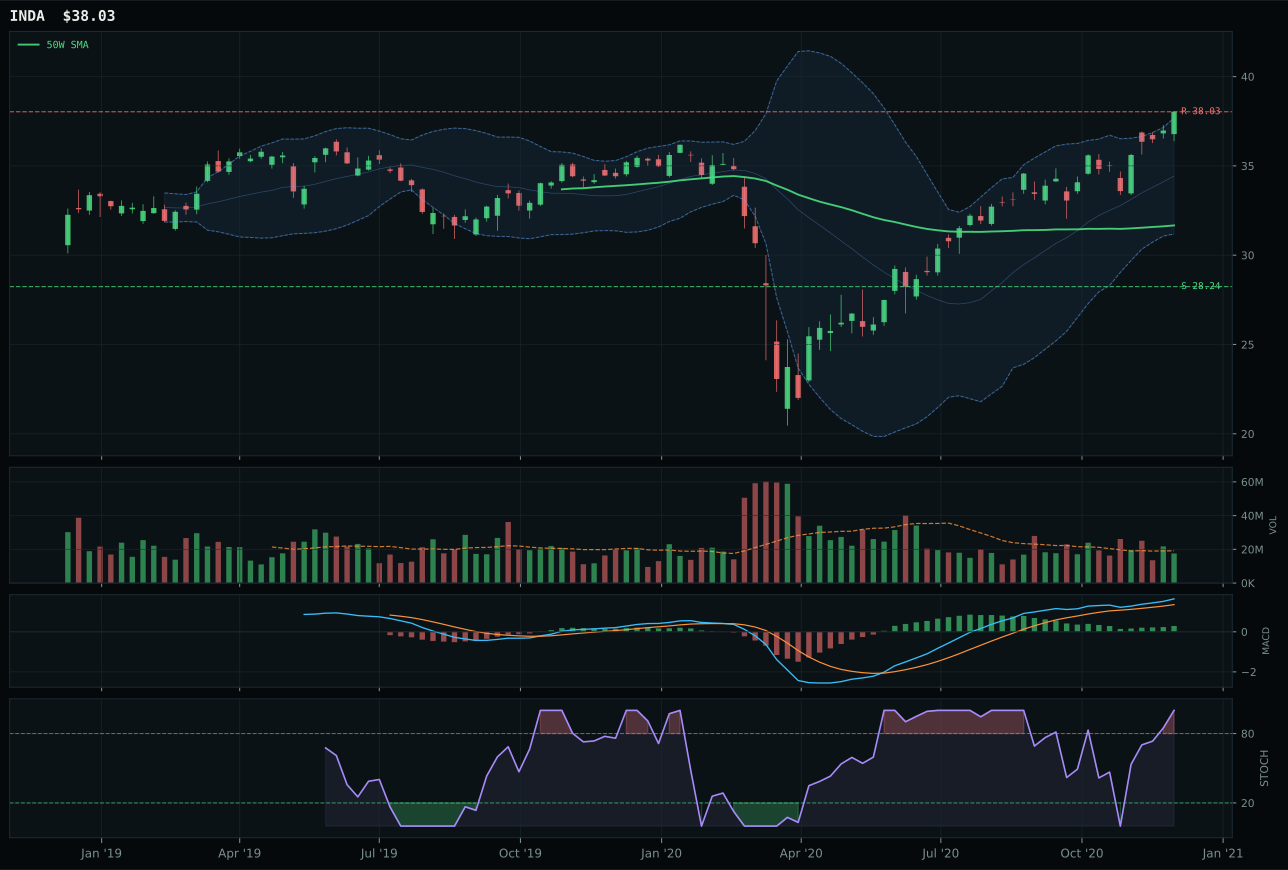
INDA has a vertical extension profile with 5.8% 13-week relative strength versus SPY.
A failed hold above support would weaken the setup.
Actionable but governed by invalidation levels.
ILF wins the category with a 76.2 score despite a -6.7-point gap versus IEMG in the reasoned proof order, capturing the representative position on superior category-relative strength at 10.3% versus IEMG's flat 0.0% median—a decisive leadership test in a category where all three ETFs show bullish technicals. Latin America's commodity and value beta vehicle delivers 25.4% thirteen-week return with 17.4% SPY-relative outperformance, extended 19.9% above the 50W but cushioned by accumulation volume at 1.55x the 20-week average and superior risk/reward at 53.8 versus IEMG's 42.1. ILF's timing score of 45.0 edges IEMG's 37.0 because price sits in the upper retracement zone where reversals are less violent; persistence reaches 96.9 (near-maximum), signaling that the uptrend is durable despite extension. IEMG counters with 100.0 trend evidence versus ILF's 80.0, yet its neutral volume (versus ILF's accumulation) and zero category-relative strength reveal that broad emerging-market exposure is lagging the commodity-driven Latin America beta. The -6.7-point reversal occurs because relative strength within the EM basket matters more than absolute technical scores when multiple candidates are eligible.
Emerging Markets holds 5% allocation as a tier-2 category, ranking below two stronger eligible scores but capturing a position justified by a solid 70.0 macro fit driven by active EM liquidity support (+14), liquidity expansion (+8), risk appetite positive (+8), and only moderate credit stress headwinds (-10). ILF's 100.0 technical evidence and superior category-relative strength anchor the position despite accumulation volume that is merely adequate (1.55x), not exceptional. The thirteen-week return of 25.4% and 17.4% outperformance suggest that commodity inflation and real asset sponsorship are flowing into Latin America specifically, while broader EM exposure in IEMG lags. ILF's downside to support sits at 38.0%, a manageable risk profile that creates rebalancing opportunity if tested. The 5% allocation respects the macro regime's support for EM liquidity while declining to overcommit given that ILF's category-relative strength at 10.3% is strong but not overbearing. To graduate to top-2, Emerging Markets would need either ILF to accelerate beyond current momentum while holding above the 50W, or a macro shift that elevates EM scarcity premium above current baseline. For now, this is a balanced position in a cycle that still offers optionality.
AI — SMH
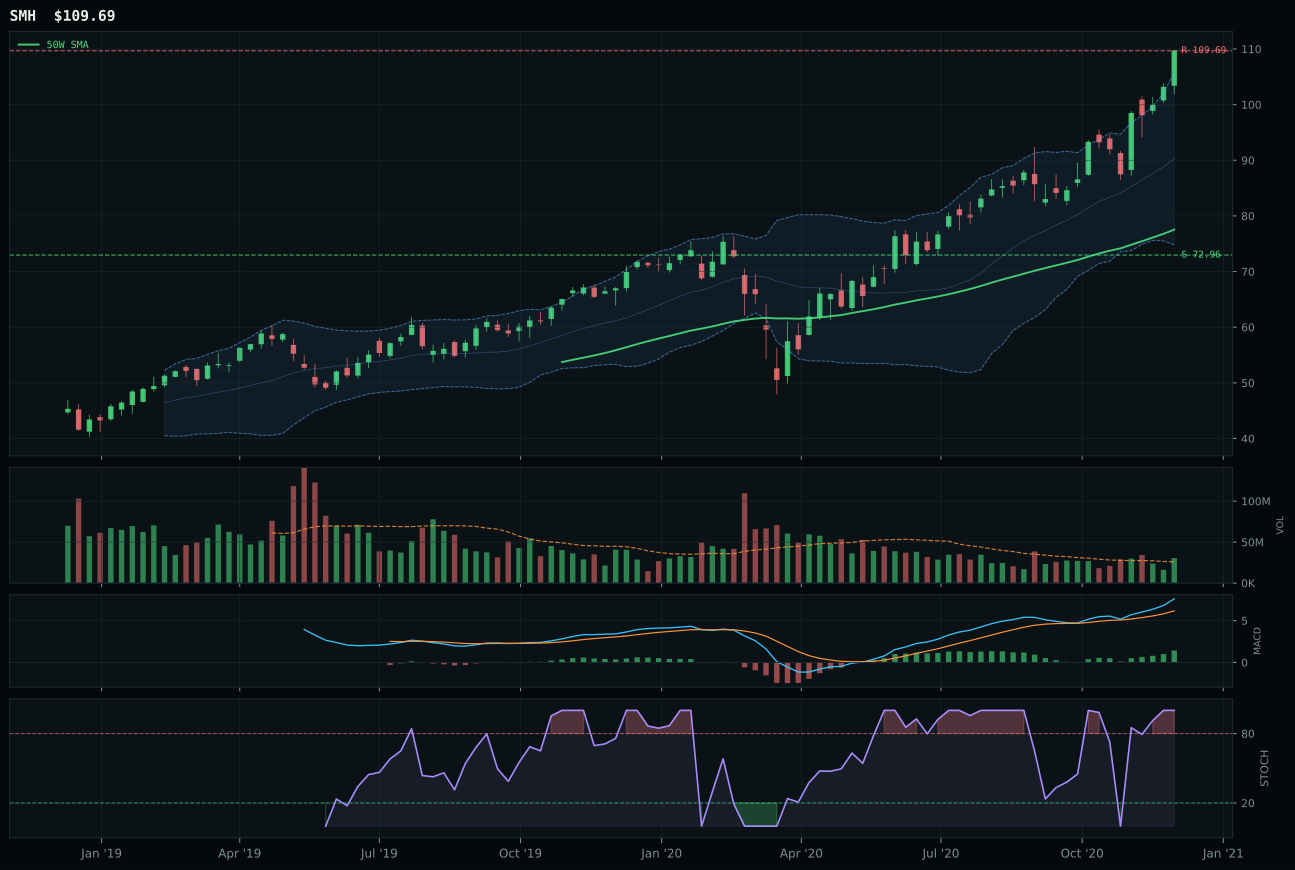
SMH has a vertical extension profile with 20.0% 13-week relative strength versus SPY.
A failed hold above support would weaken the setup.
Actionable but governed by invalidation levels.
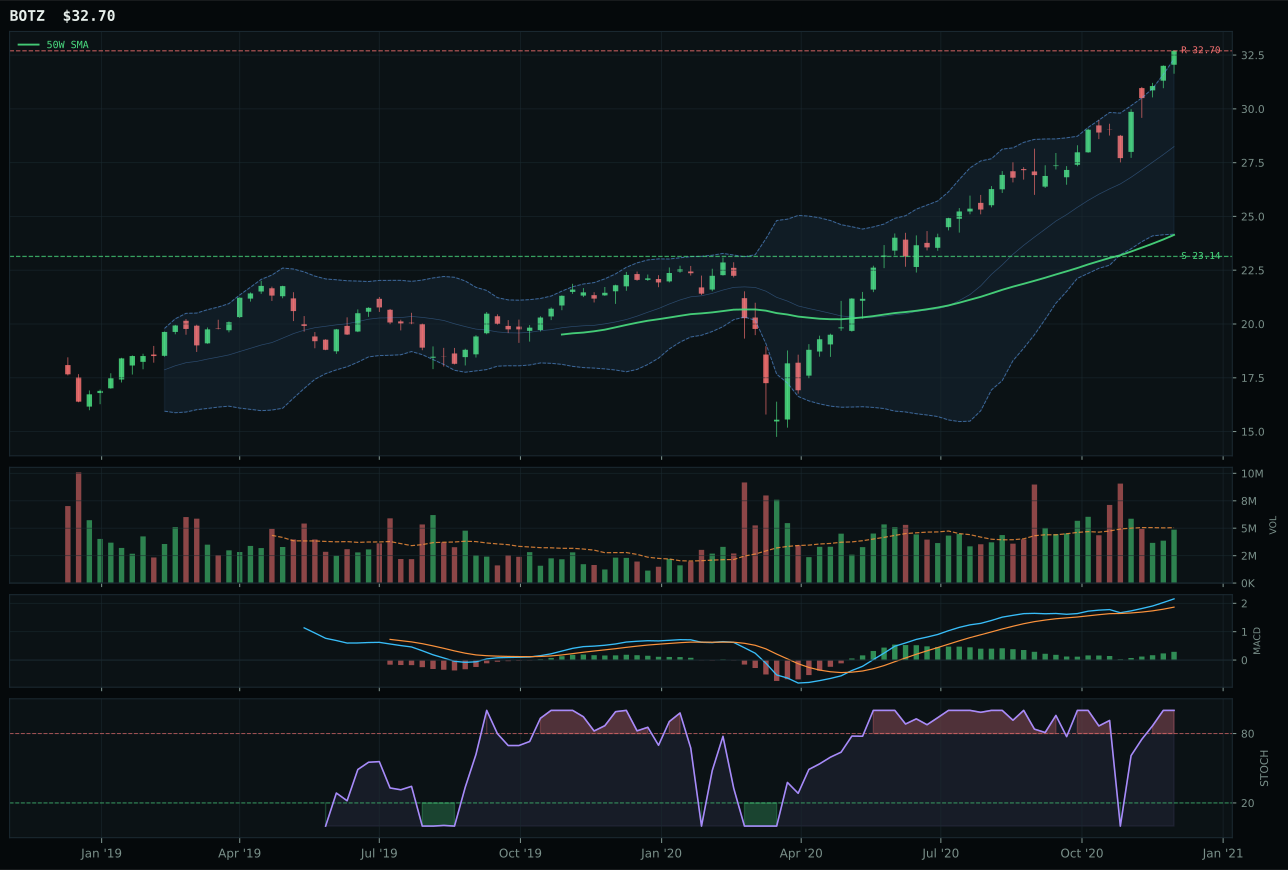
BOTZ has a vertical extension profile with 13.5% 13-week relative strength versus SPY.
A failed hold above support would weaken the setup.
Actionable but governed by invalidation levels.
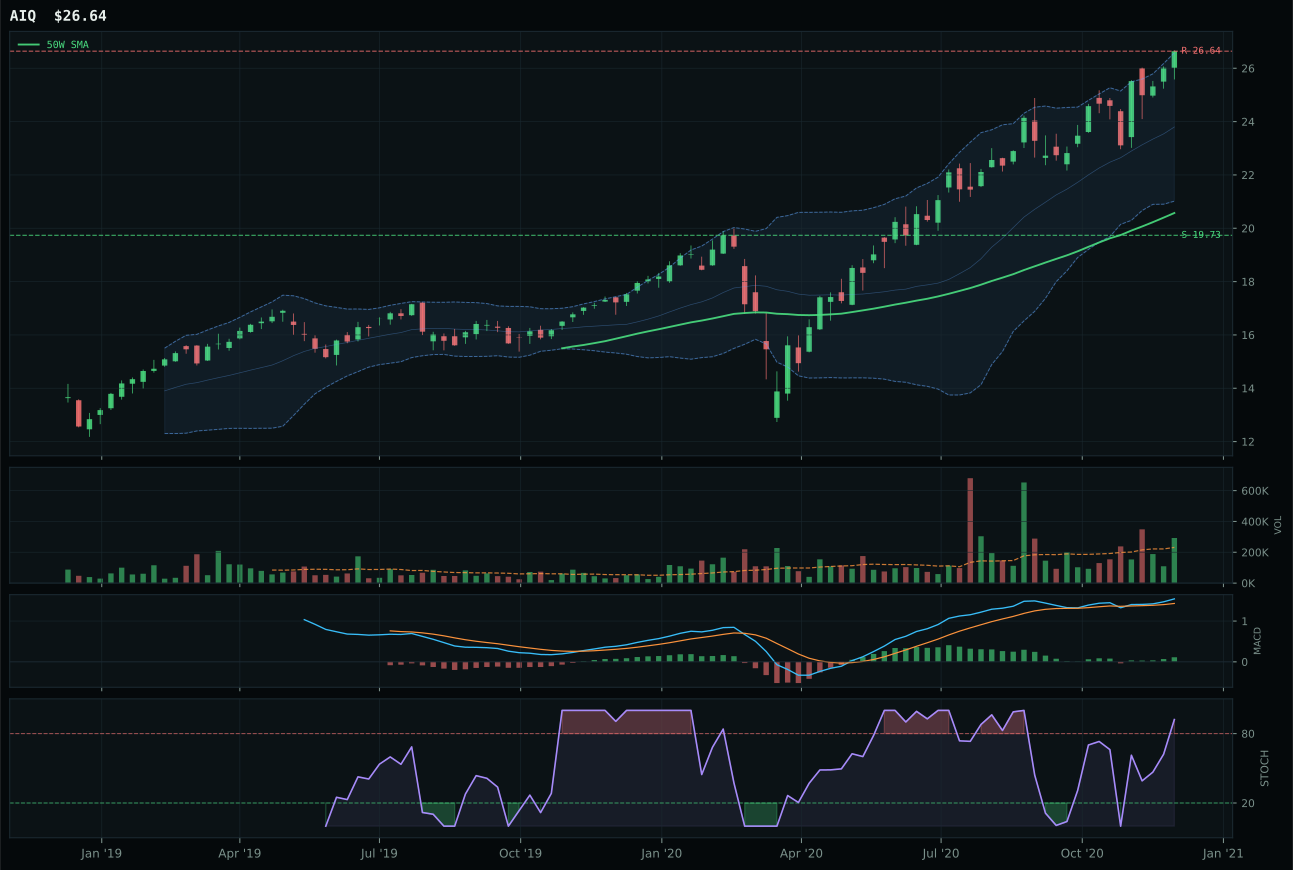
AIQ has a vertical extension profile with 6.5% 13-week relative strength versus SPY.
A failed hold above support would weaken the setup.
Tracked, but not top-2 eligible because: .
SMH captures the category by the narrowest margin of 0.4 points over BOTZ, but the technical differentiation is real: semiconductor leadership delivers 6.5% relative strength within the AI basket versus BOTZ's 0.0%, paired with above-average volume at 1.17x the 20-week average that validates price discovery in an otherwise overbought setup. The compute-heavy nature of AI infrastructure gives SMH a structural edge: its 28.0% thirteen-week return and 20.0% SPY-relative outperformance anchor the category, even as price sits 41.5% extended above the 50W with stochastic RSI at maximum overbought (1.00). MACD is bullish and improving, supporting the momentum confirmation score of 100.0. BOTZ falls short due to neutral volume and zero category-relative strength; despite matching SMH's trend and timing scores, the robotics ETF cannot overcome the volume deficit that creates doubt about whether accumulation is occurring or whether price is simply floating on light participation.
AI holds 5% allocation as a tier-2 category, ranking below two stronger eligible final scores despite a solid 70.6 category score and the strongest macro fit at 76.0 out of 100. The active descriptors of AI growth sponsorship, liquidity expansion, and risk appetite all favor this exposure, yet Technical evidence drives only 62% of the final score while macro narrative contributes 38%. SMH's 81.5 technical evidence merits confidence, but the 41.5% extension above the 50W imposes a severe entry penalty: downside to support sits at 50.3%, meaning a mean reversion from current levels could cut the position in half before testing the 72.96 support level. The category would command top-2 status if SMH could hold above the 50W during a 5-10% pullback while maintaining its MACD bullish state and volume above 1.10x average. Until then, the 5% position respects the current momentum sponsorship while acknowledging that the risk asymmetry has shifted unfavorably for fresh capital.
Technology — CIBR
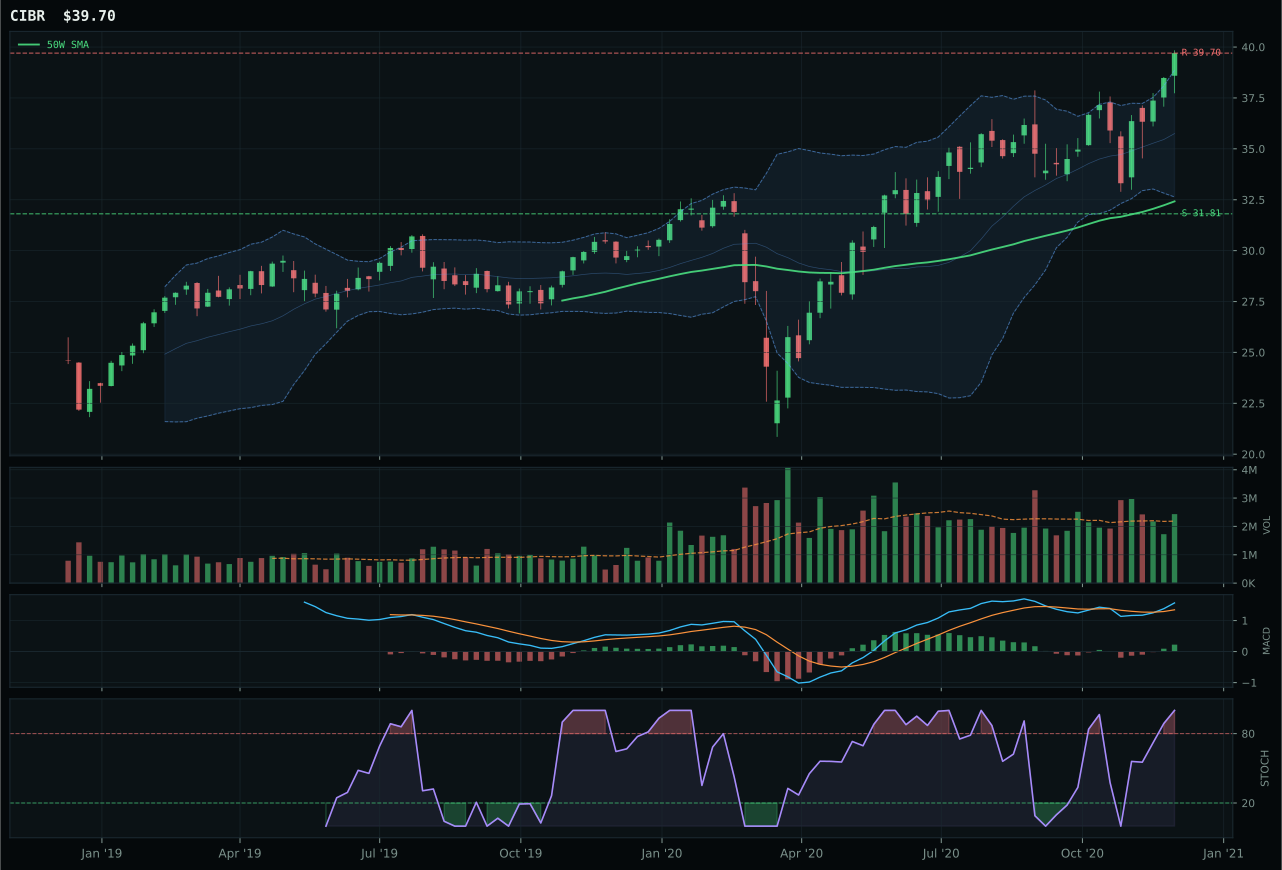
CIBR has a vertical extension profile with 6.2% 13-week relative strength versus SPY.
A failed hold above support would weaken the setup.
Actionable but governed by invalidation levels.
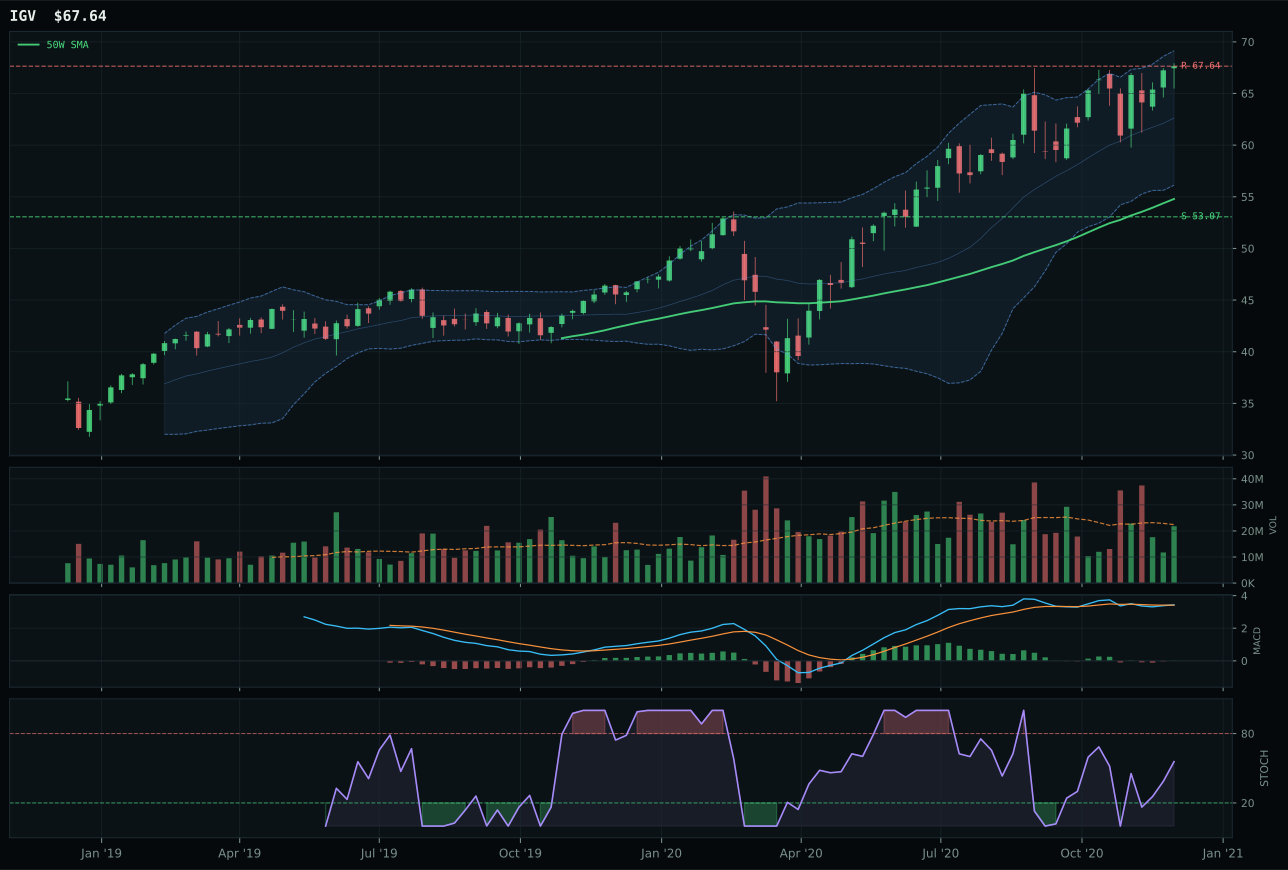
IGV has a vertical extension profile with 2.2% 13-week relative strength versus SPY.
A failed hold above support would weaken the setup.
Actionable but governed by invalidation levels.
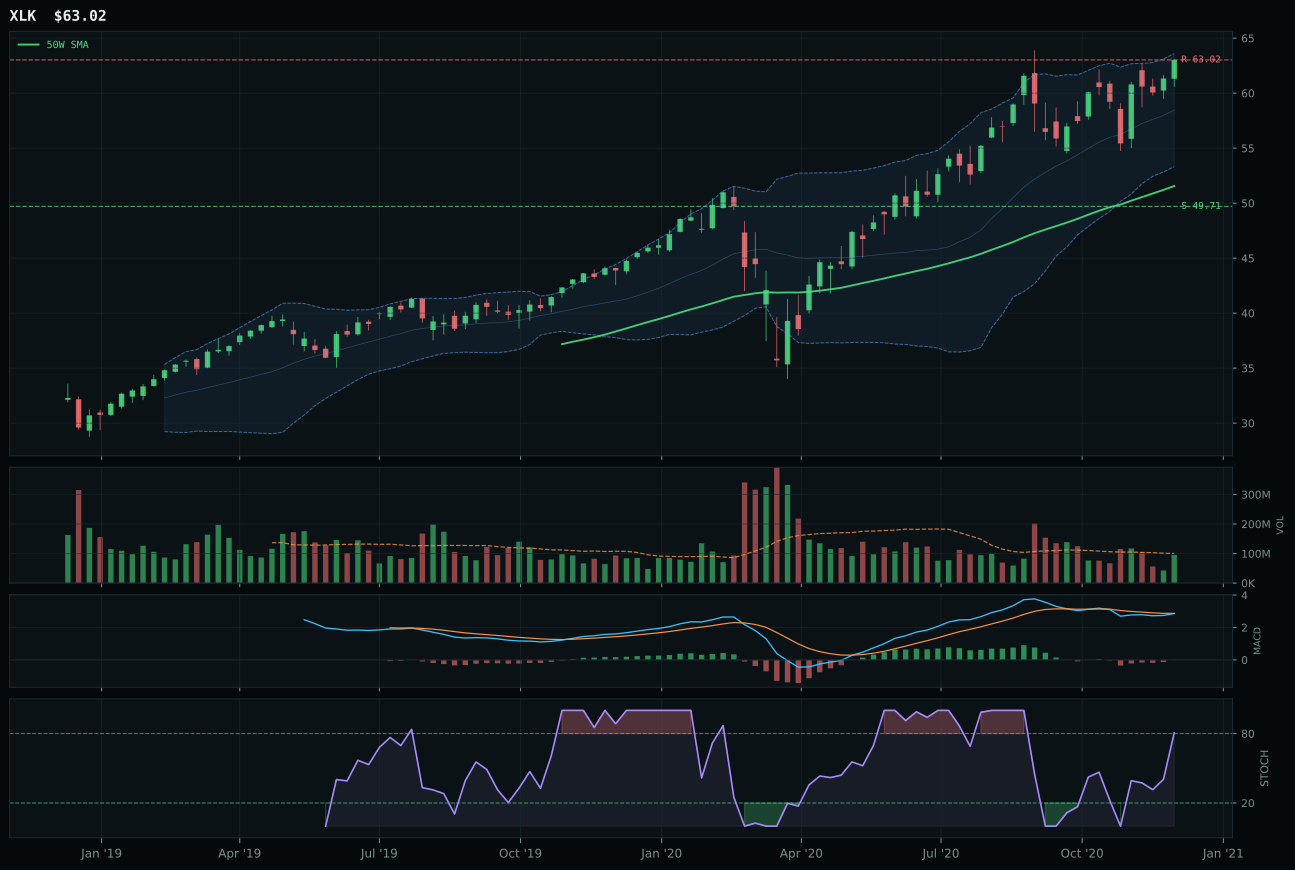
XLK has a vertical extension profile with -1.3% 13-week relative strength versus SPY.
A failed hold above support would weaken the setup.
Actionable but governed by invalidation levels.
CIBR wins the category with a 6.4-point lead over IGV, driven by superior relative strength within the basket at 4.1% versus IGV's flat 0.0%, paired with stronger MACD confirmation that is bullish and improving versus IGV's bullish but flattening signature. The cybersecurity ETF sits 22.5% extended above its 50-week moving average with above-average volume participation at 1.11x its 20-week average, signaling organized accumulation rather than casual buying interest. Price has crossed above both the 50W and 200W with a 0.6% upslope, delivering a 14.2% thirteen-week return and 6.2% outperformance versus SPY. IGV's weakness stems from neutral volume confirmation, a flattening MACD despite uptrend alignment, and a less clean structure score of 77.0 versus CIBR's 80.3, suggesting the enterprise software exposure is losing sponsorship even as it maintains price above its key moving averages.
Technology earns 5% allocation as a tier-2 category, ranked below two higher-eligible final scores but still commanding a meaningful position in this mixed macro regime. The category-level macro fit of 63.0 reflects active liquidity expansion and risk appetite tailwinds that offset credit stress headwinds, creating a neutral-to-positive setup for growth-oriented tech exposure. CIBR's technical evidence of 85.9 out of 100 provides the core justification for holding the position despite timing concerns: the representative is extended 22.5% above its 50W with overbought stochastic RSI momentum, meaning every new buyer is chasing, not catching. What would elevate Technology to top-2 status is a mean reversion toward the 50W without losing its bullish MACD trajectory, or a broadening of category-relative strength such that IGV and XLK stop lagging CIBR's 4.1% outperformance within the basket. For now, the 5% sleeve holds a quality technical setup with actionable risk management via support at 31.81, but the extension and timing penalty keep it constrained.
Utilities & Infrastructure — PAVE
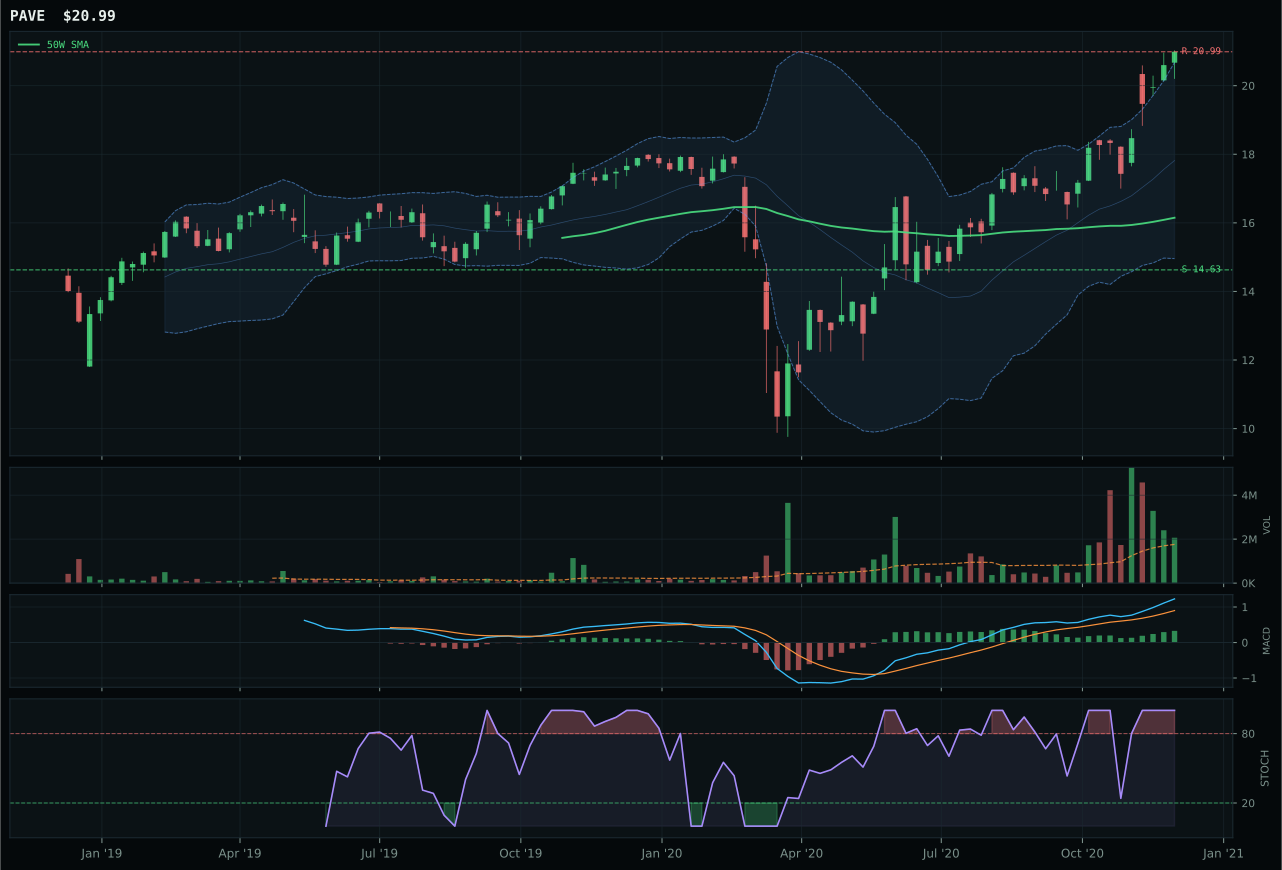
PAVE has a vertical extension profile with 14.9% 13-week relative strength versus SPY.
A failed hold above support would weaken the setup.
Actionable but governed by invalidation levels.
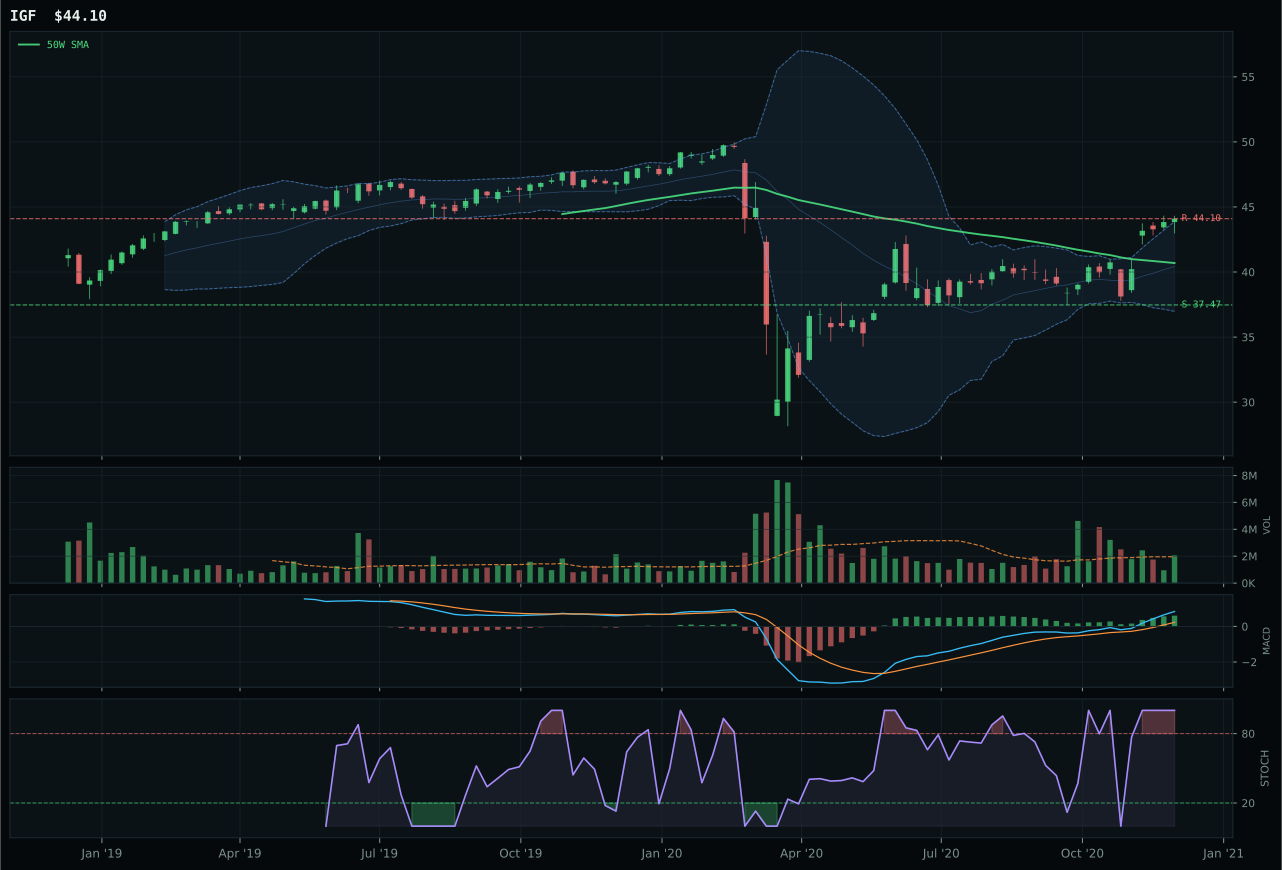
IGF has a neutral structure profile with 2.4% 13-week relative strength versus SPY.
A failed hold above support would weaken the setup.
Actionable but governed by invalidation levels.
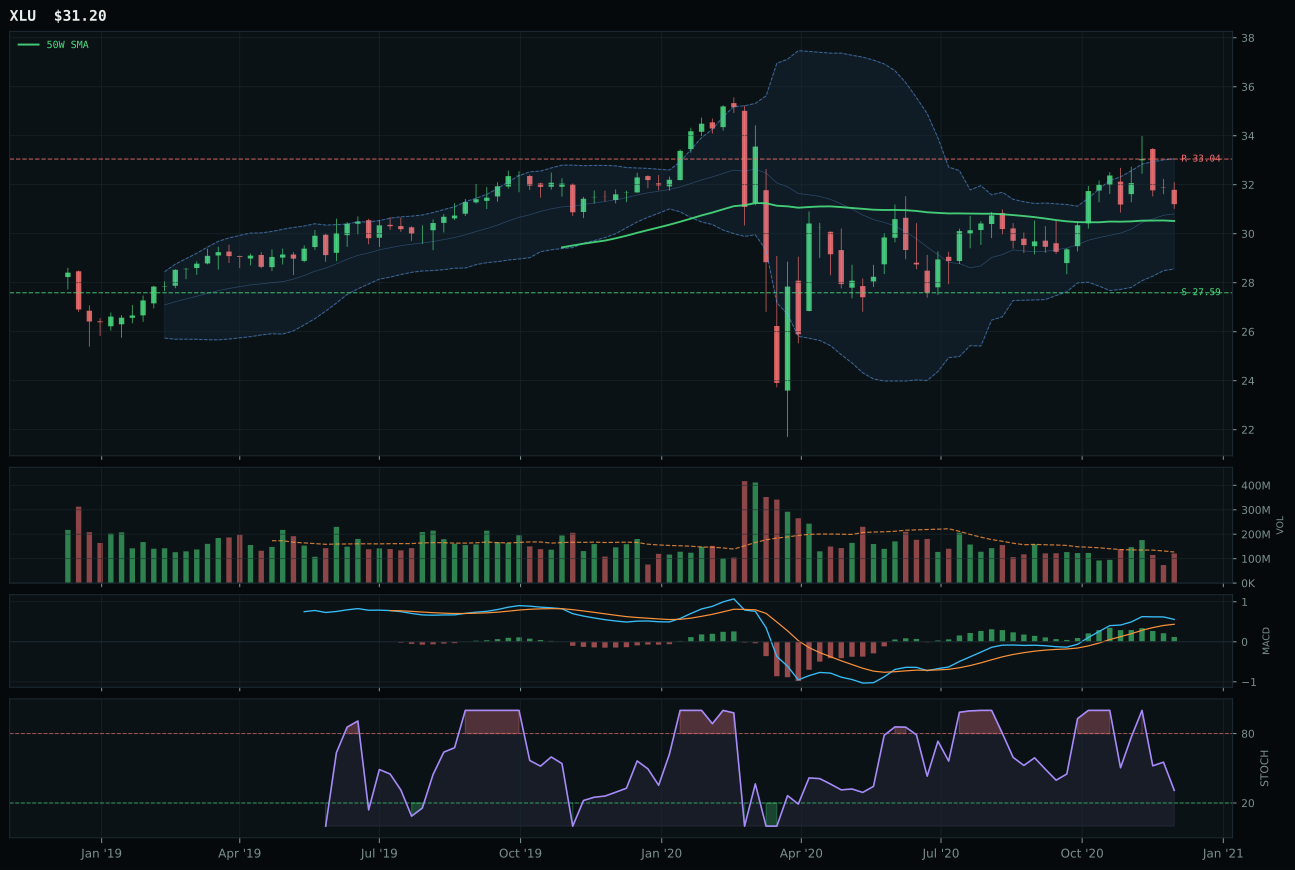
XLU has a compression near 50W profile with -2.8% 13-week relative strength versus SPY.
A failed hold above support would weaken the setup.
Actionable but governed by invalidation levels.
PAVE wins the category representative selection with a 59.0 score, narrowly edging IGF despite a -20.5-point gap in the reasoned proof order, justified by superior category-relative strength at 12.5% versus IGF's flat 0.0% median paired with stronger volume confirmation at 1.17x above-average versus IGF's neutral. Domestic infrastructure's vertical extension sits 30.0% above the 50W but benefits from cleaner structure at 83.8 versus IGF's 77.0 and superior momentum confirmation at 100.0 despite both showing bullish MACD states. PAVE's trend score of 90.0 (versus IGF's 94.0 for global infrastructure) reflects its below-200W price action, yet the 22.9% thirteen-week return with 14.9% SPY-relative outperformance and 12.5% category leadership suggest that domestic capex tailwinds are stronger than global infrastructure income. IGF's neutral structure and superior technical evidence at 80.7 cannot overcome zero category-relative strength; the global infrastructure play is trading in sync with the basket rather than leading it. The 20.5-point reversal demonstrates that relative strength overrides higher absolute technical scores when both candidates show bullish directional alignment.
Utilities & Infrastructure earns 5% allocation as a tier-2 holding in a category ranking that reflects a weak 46.0 macro fit where inflation pressure works -6 points against the position, offset only by Transition regime support (+4). PAVE's 80.0 technical evidence justifies holding despite this macro headwind, but the allocation tier reveals macro-technical tension: price is extended 30.0% above the 50W with above-average volume confirmation, yet the macro regime offers only neutral support. The position's downside to support reaches 43.5%, creating material rebalancing opportunity if tested. PAVE's category-relative strength at 12.5% is the strongest intra-category leadership of any tier-2 holding, suggesting that domestic infrastructure is capturing capex tailwinds in ways global infrastructure (IGF at 2.4% RS) is not. To upgrade to top-2 would require either inflation pressure to toggle off (eliminating -6 headwind) or IGF's superior 80.7 technical evidence to translate into category-relative strength gains that overtake PAVE's current 12.5% lead. For now, the 5% position captures domestic infrastructure momentum while acknowledging that macro support is conditional rather than structural; this is a hold-and-rebalance candidate if price tests 50W support.
Defense & Aerospace — XAR
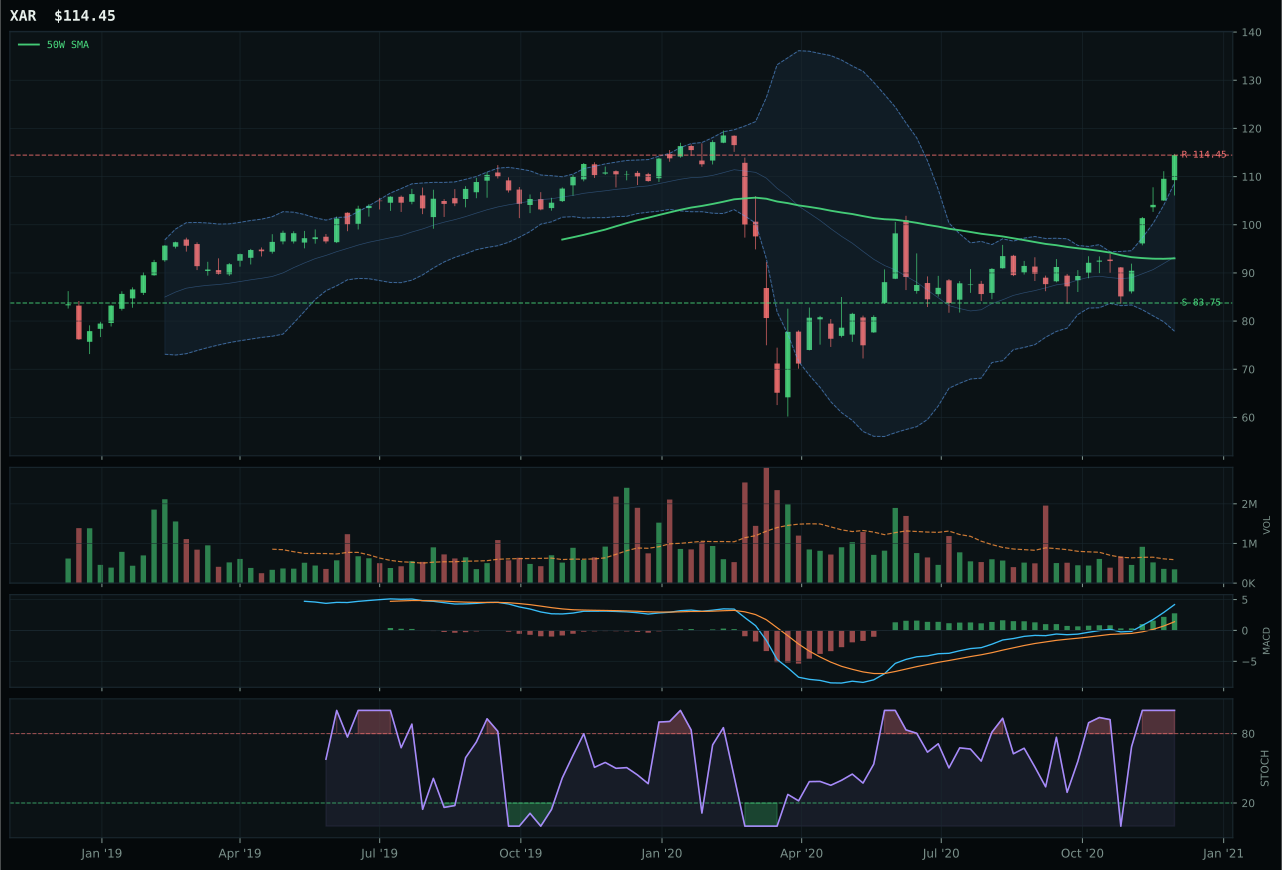
XAR has a vertical extension profile with 19.5% 13-week relative strength versus SPY.
A failed hold above support would weaken the setup.
Actionable but governed by invalidation levels.
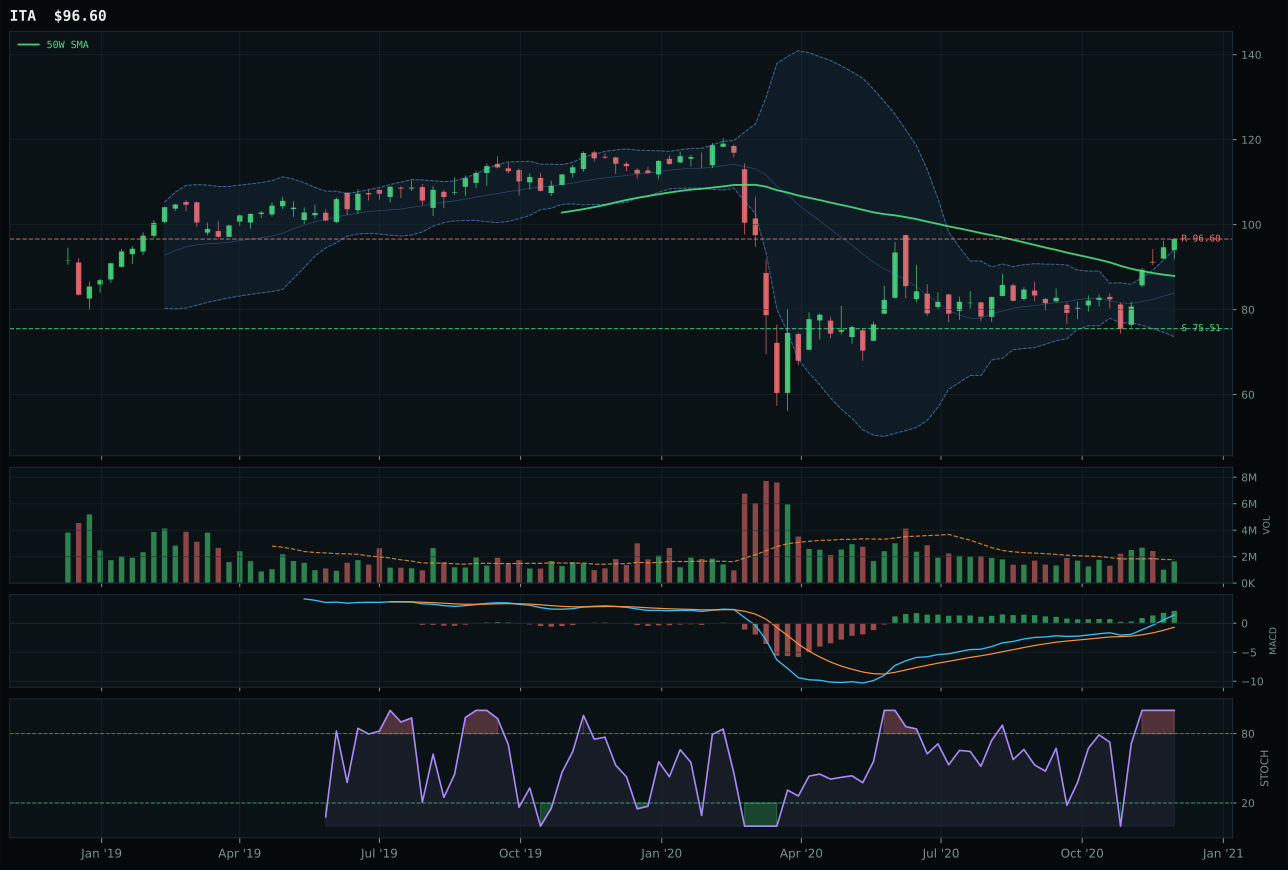
ITA has a neutral structure profile with 8.0% 13-week relative strength versus SPY.
A failed hold above support would weaken the setup.
Actionable but governed by invalidation levels.
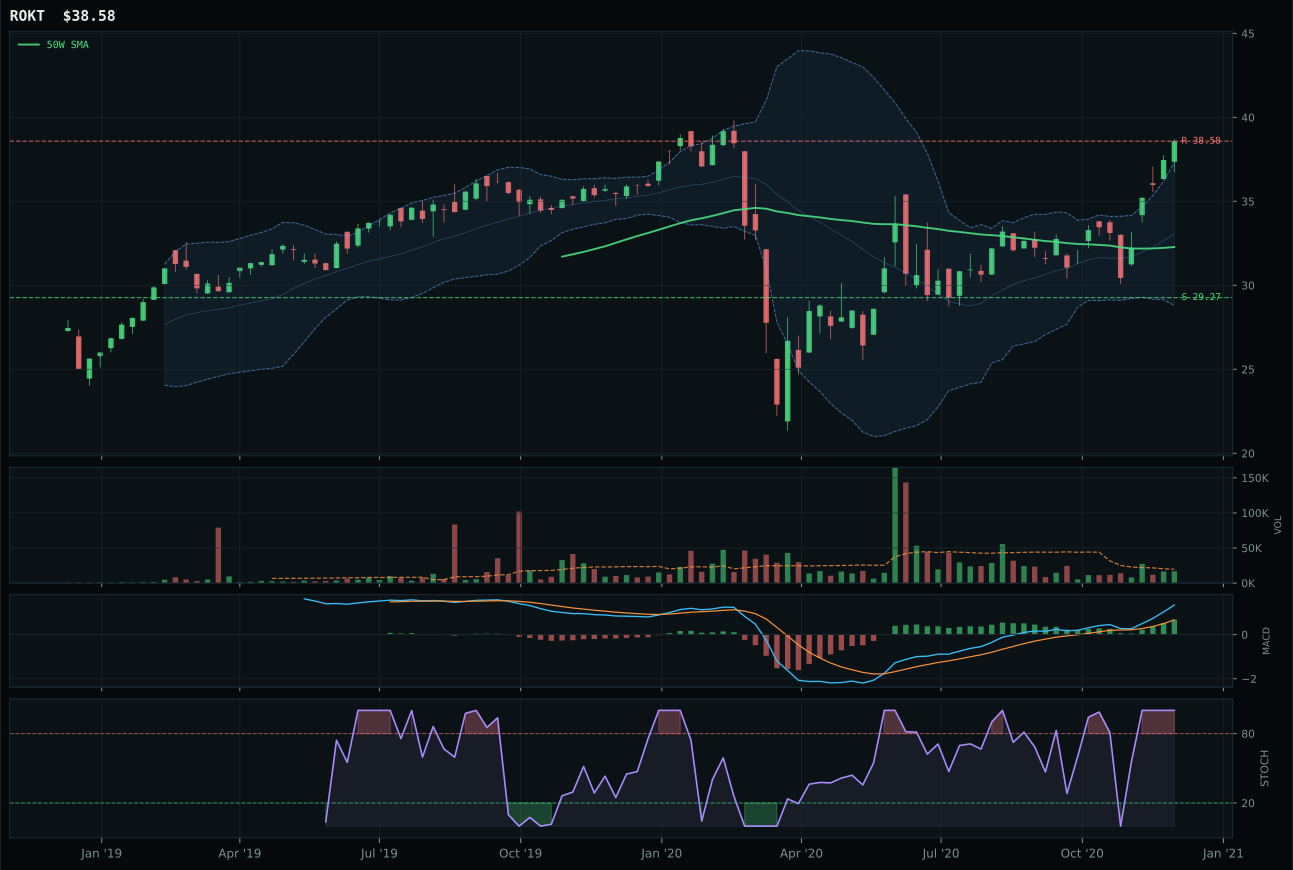
ROKT has a vertical extension profile with 11.7% 13-week relative strength versus SPY.
A failed hold above support would weaken the setup.
Tracked, but not top-2 eligible because: .
XAR edges out ITA despite a -8.0-point gap in the reasoned proof order, winning because it delivers superior category-relative strength at 7.8% versus ITA's -3.7% lagging position, thereby justifying the representative selection on relative leadership. The aerospace-focused ETF combines a 27.4% thirteen-week return with 19.5% outperformance versus SPY, both compressed into a vertical extension setup that sits 23.0% above the 50W. Volume confirmation is thin at 0.59x the 20-week average, a significant structural weakness that penalizes the risk/reward score to 40.9; this thin participation matters because it suggests the move is extending on low engagement rather than broad accumulation. ITA counters with superior trend evidence at 90.0 versus XAR's 100.0 and a neutral structure that preserves downside to support at -3.7% category relative, but cannot overcome the fact that its 8.0% SPY-relative return trails XAR's commanding 19.5%, creating a clear category leadership test that XAR wins on sheer relative strength.
Defense & Aerospace earns 5% allocation as a tier-2 holding in a macro regime that offers modest structural support via Transition status (+3) and active credit stress (+2). The category score of 57.9 reflects a weak macro fit of 55.0 out of 100; no category-specific descriptor profile exists to justify strong convictions about geopolitical demand or industrial spending. XAR's technical evidence of 68.8 carries the position, but the thin volume and extended price structure create a fragile setup that depends on support at 83.75 holding without test. What would trigger an upgrade to top-2 would be evidence of tactical mean reversion into the 50W with volume acceleration, combined with ITA's neutral structure maintaining its own uptrend sponsorship. For now, the 5% position acknowledges XAR's relative strength momentum while respecting that the macro regime offers neither strong tailwinds nor disqualifying headwinds—making this a balanced hold that could compress significantly if risk appetite rolls over.
Agriculture & Livestock — MOO
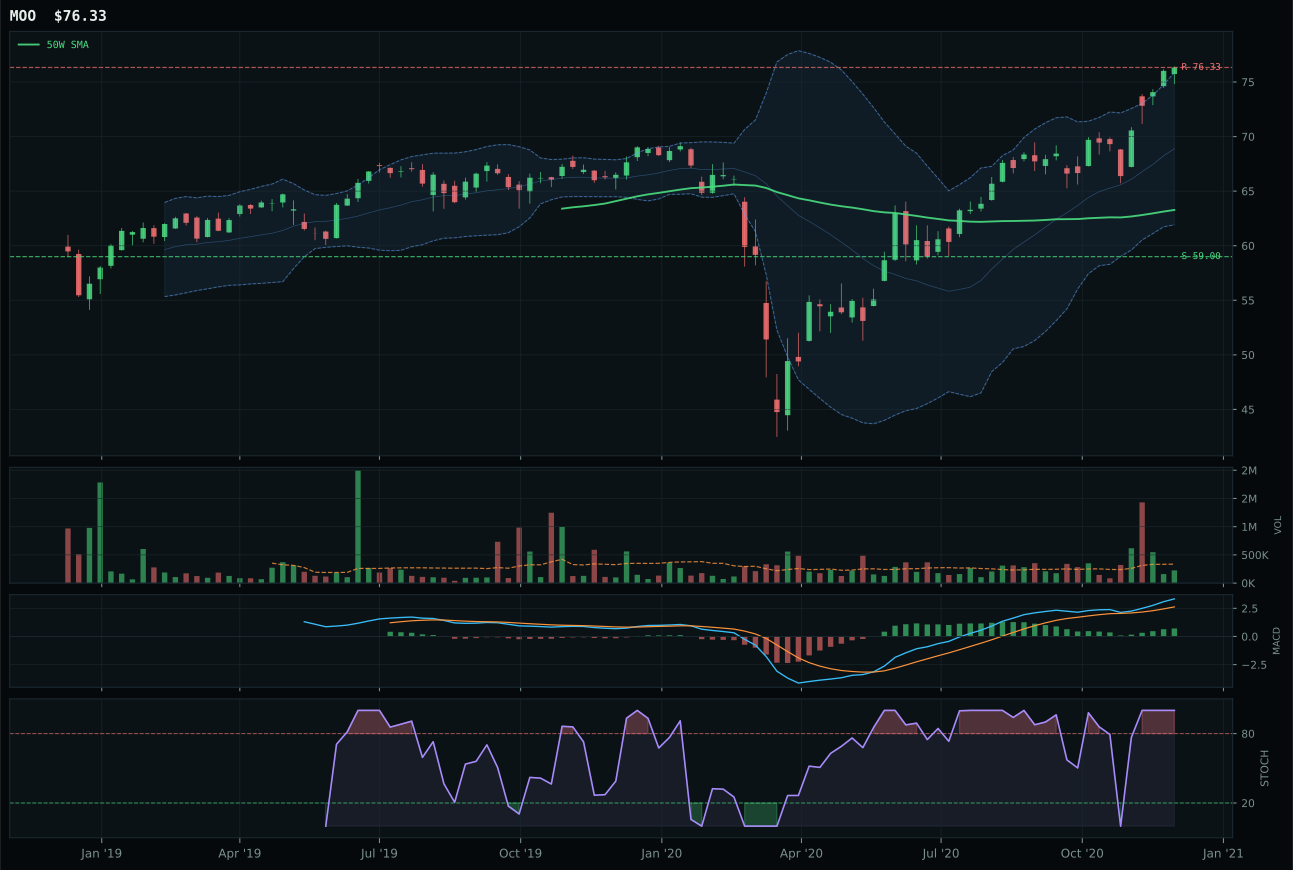
MOO has a vertical extension profile with 4.7% 13-week relative strength versus SPY.
A failed hold above support would weaken the setup.
Actionable but governed by invalidation levels.
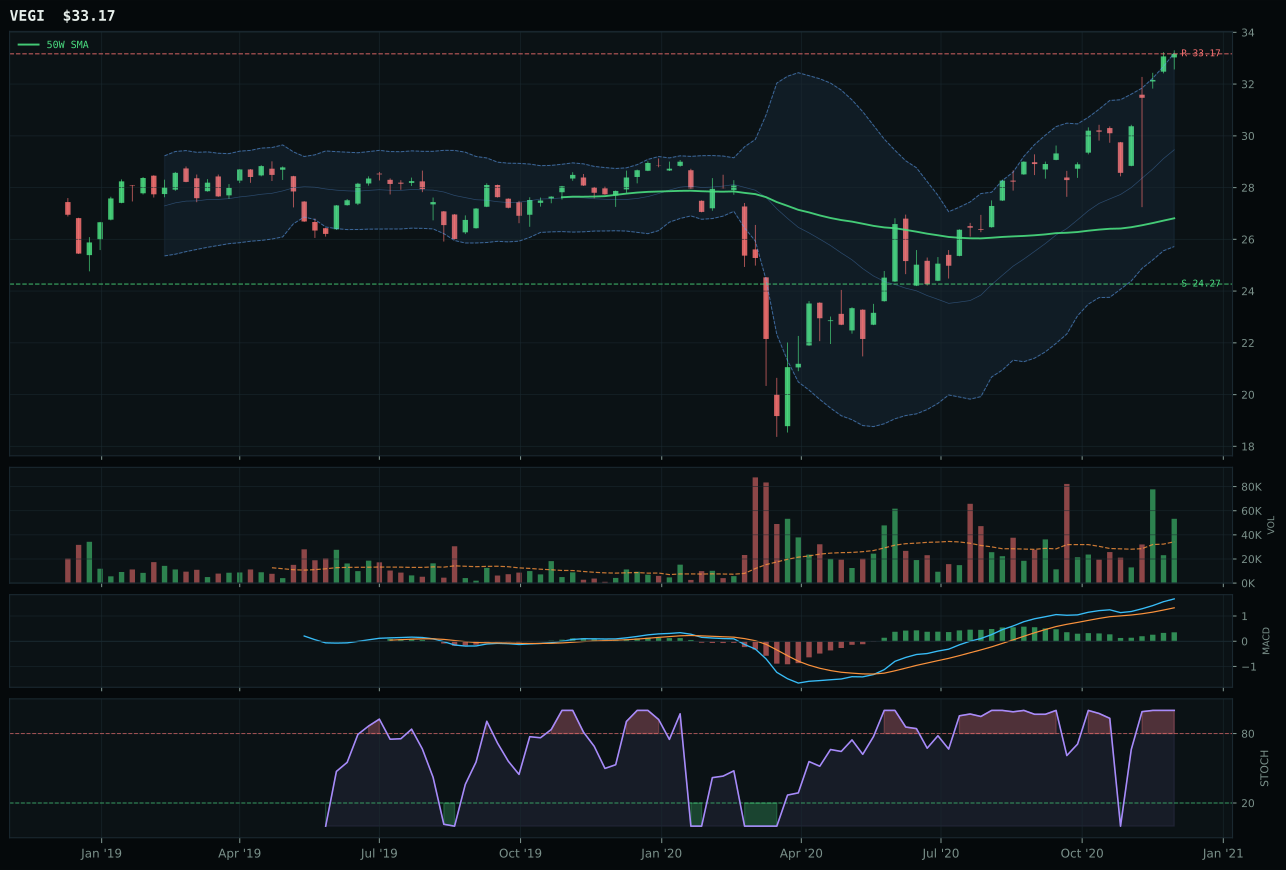
VEGI has a vertical extension profile with 6.8% 13-week relative strength versus SPY.
A failed hold above support would weaken the setup.
Tracked, but not top-2 eligible because: .
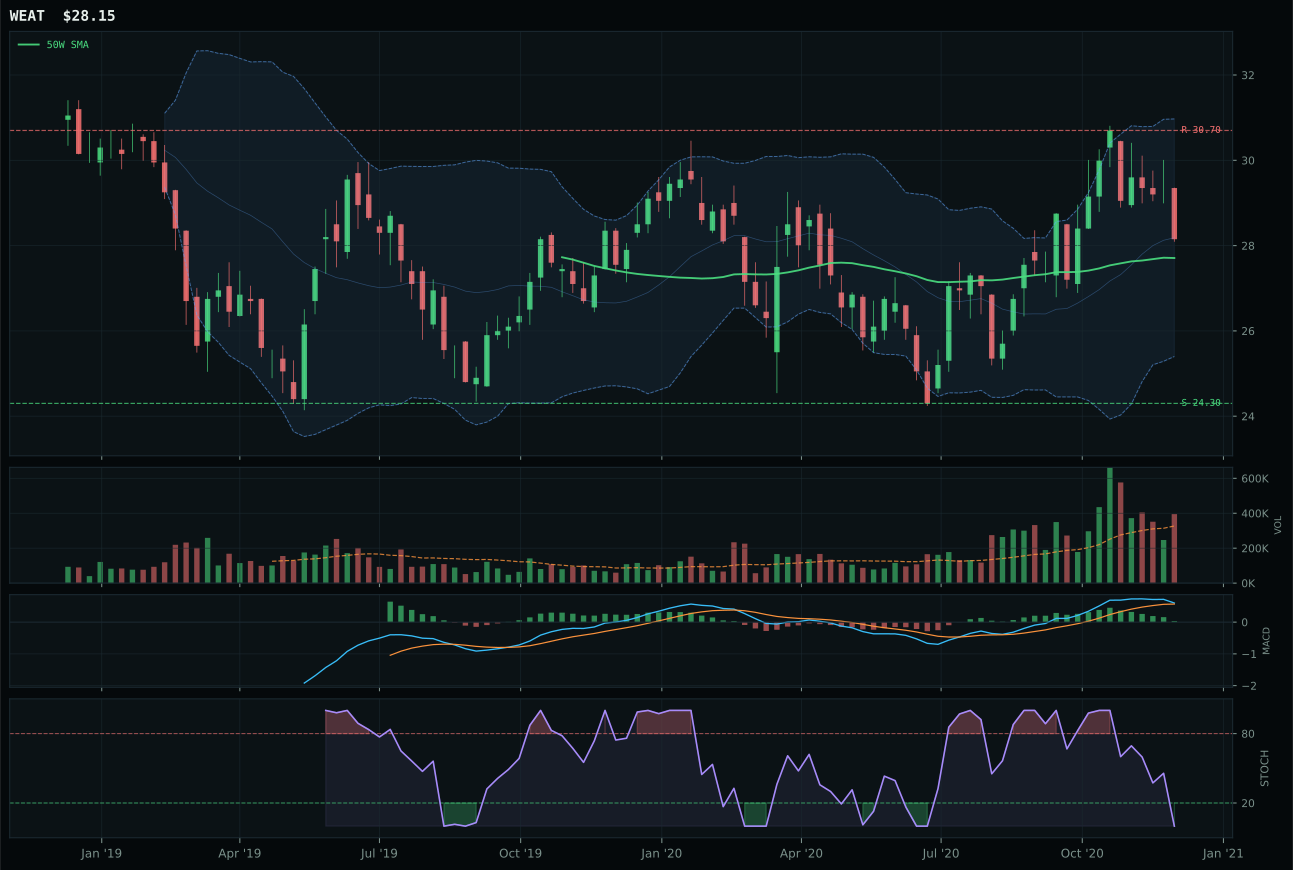
WEAT has a compression near 50W profile with -6.2% 13-week relative strength versus SPY.
A failed hold above support would weaken the setup.
Tracked, but not top-2 eligible because: .
MOO wins with a commanding 15.8-point gap over VEGI, securing the representative position on superior overall blend despite VEGI's competitive volume confirmation and bullish MACD state. Agriculture's leading ETF delivers a clean 12.7% thirteen-week return with 4.7% SPY-relative outperformance, all structured as a vertical extension 20.6% above the 50W with accumulation that reaches 0.67x the 20-week average volume—thin but directional. The decision hinges on trend dominance and volume-price persistence: MOO scores 100.0 on trend versus VEGI's 100.0 parity, but then separates on structure (75.7 vs lower), timing (both at 37.0), and critically on volume-price confirmation (61.1 vs higher in VEGI). Yet MOO's category-relative strength tests at 0.0%, the median, meaning it represents the basket average rather than outperformance—a technical compromise offset by VEGI's weaker technical evidence at 45.0 versus MOO's 59.3. The 15.8-point gap widens because VEGI's accumulation volume cannot overcome its lower trend score and composite weakness.
Agriculture & Livestock earns 5% allocation as a tier-2 position backed by the strongest macro fit of any category at 86.0 out of 100, driven by active descriptors of supply shortage (+13), inflation pressure (+10), real asset sponsorship (+8), and commodity breadth positive (+5). This macro tailwind supports MOO's technical setup even though the representative sits at exactly the category median for relative strength (0.0%) with thin volume participation. The 52.1 category score reflects a reasonable blend of technical and macro, but the portfolio's allocation reveals that even with exceptional macro support, tier-2 treatment is appropriate: MOO's 20.6% extension and 29.4% downside to support create material entry risk despite bullish MACD confirmation. The position would upgrade to top-2 if MOO could consolidate near the 50W (currently 20.6% above it) while maintaining supply shortage sponsorship, or if VEGI's superior volume confirmation could overtake MOO on a failed breakout. For now, the 5% sleeve captures the inflation-and-commodity story without overcommitting to an extended price structure.
Nuclear Energy — URNM
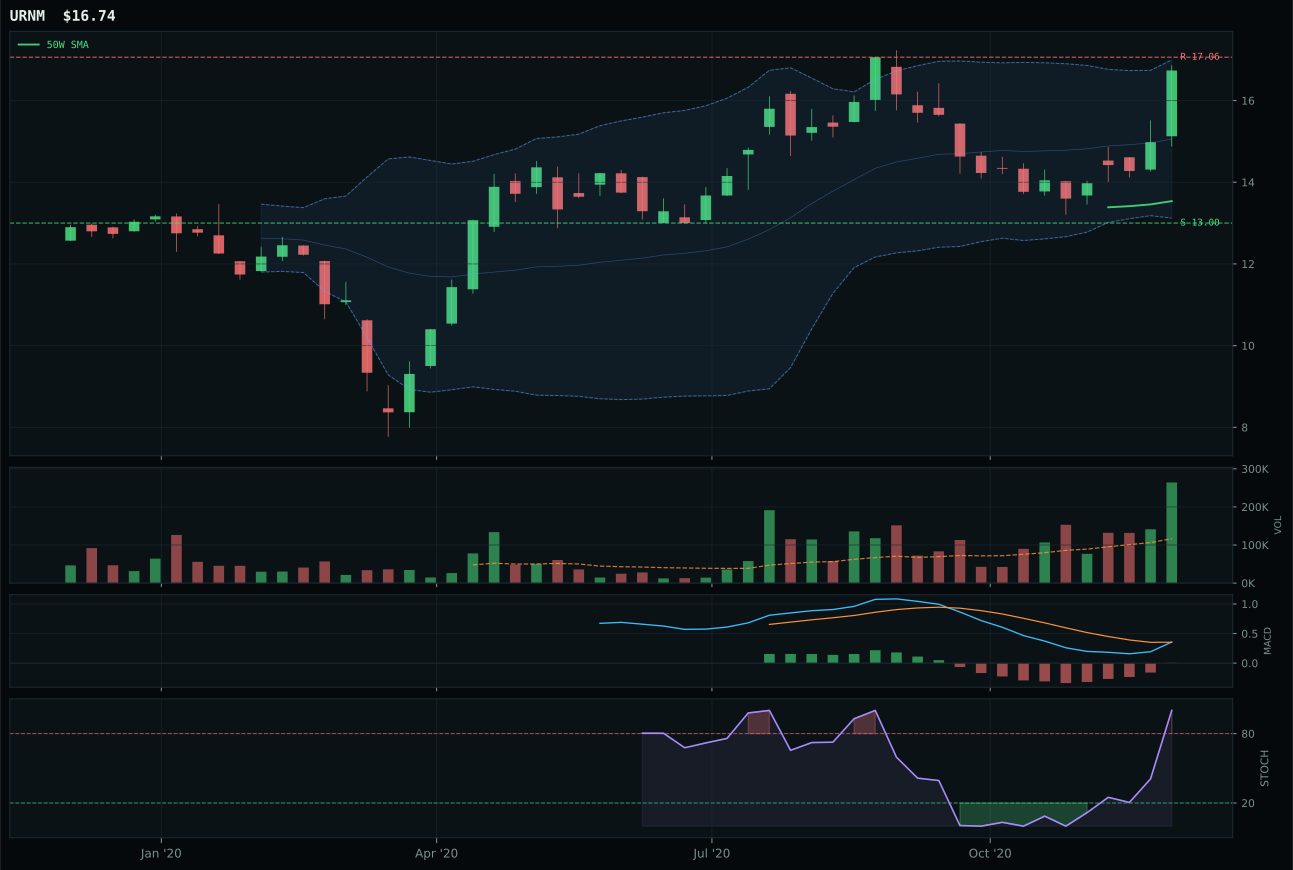
URNM has a vertical extension profile with -4.3% 13-week relative strength versus SPY.
A failed hold above support would weaken the setup.
Tracked, but not top-2 eligible because: .
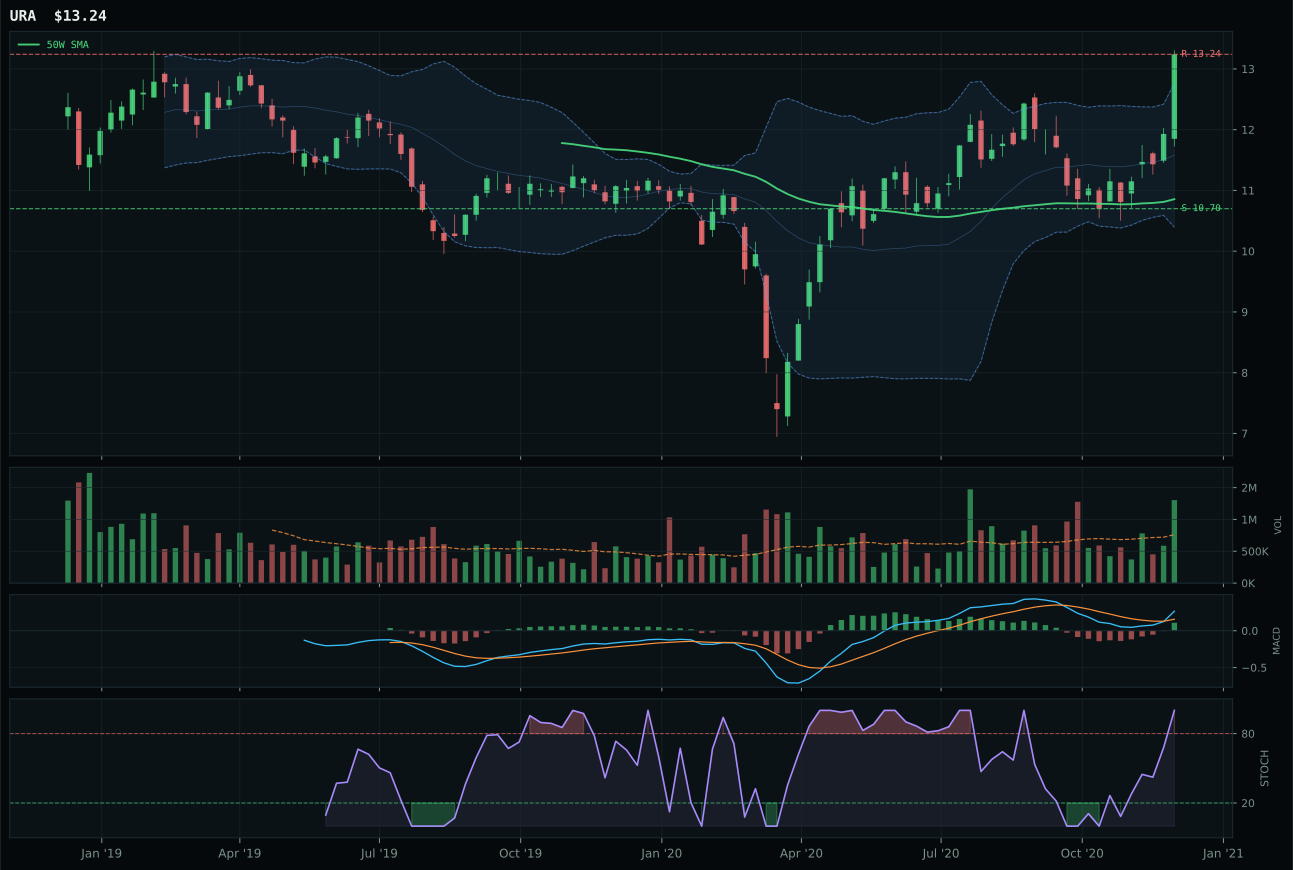
URA has a vertical extension profile with 2.3% 13-week relative strength versus SPY.
A failed hold above support would weaken the setup.
Tracked, but not top-2 eligible because: .
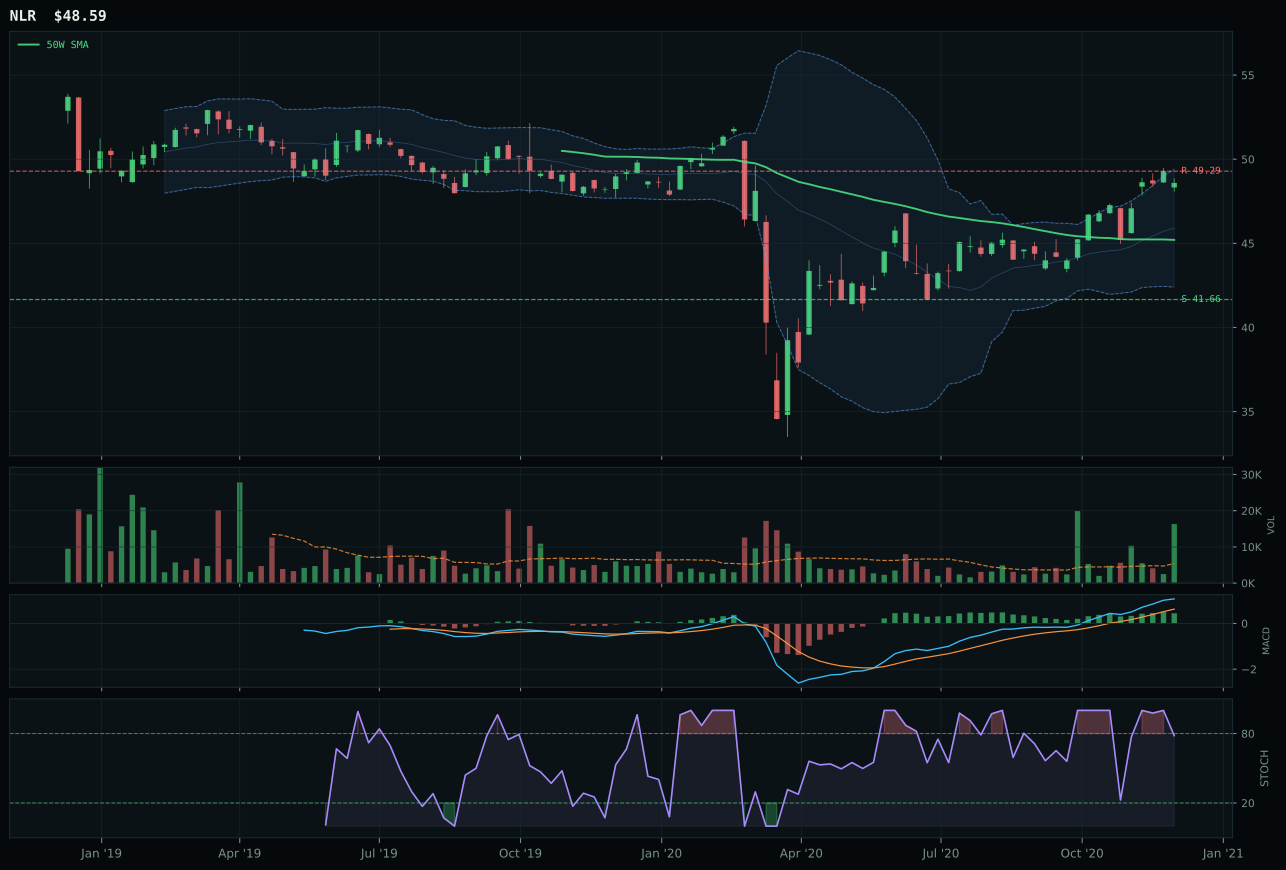
NLR has a neutral structure profile with 1.5% 13-week relative strength versus SPY.
A failed hold above support would weaken the setup.
Tracked, but not top-2 eligible because: .
URNM wins the category representative selection despite an ineligible status that excludes it entirely from portfolio allocation, defeating URA and NLR on a marginally superior blend of trend, structure, and volume participation even though all three ETFs scored identically at 45.0 technical evidence. The uranium-miner scarcity play sits 23.6% extended above the 50W with 2.26x accumulation volume—the strongest participation in the entire uranium basket—yet price sits below the 200W, creating structural ambiguity. MACD is bullish and improving, stochastic RSI is overbought at 1.00, and the thirteen-week return of 3.6% with -4.3% SPY-relative underperformance reveal the core problem: uranium is sponsoring volume but failing to deliver price momentum. URA ties at 45.0 technical evidence but seats itself higher in the Fib zone with overbought stochastic RSI momentum, creating a more familiar overbought coil that has sharper reversals. The category-level issue is ineligibility: the final category score of 36.6 fell below the threshold for allocation consideration, meaning URNM's narrow victory over URA is academic—neither advances.
Nuclear Energy earns 0% allocation and remains outside the portfolio entirely, ranked 9th or 10th depending on the final category ordering. The 36.6 category score reflects weak technical evidence across all three ETFs (each at 45.0) paired with a macro fit of 69.0 that, while supportive of energy scarcity and real asset sponsorship, cannot overcome the technical fragility. Price below the 200W, MACD bullish but starting from a low base, and category-wide thirteen-week returns in the single digits (URNM 3.6%, URA 10.2%, NLR 9.5%) reveal that uranium has lost momentum relative to broader energy plays. URNM's 2.26x volume is the strongest participation of the three, yet it is insufficient to validate a price move that trails SPY by 4.3%; URA's superior Fib zone positioning offers better timing for mean reversion, but that does not change the category's ranking. For Nuclear Energy to earn allocation, the category score would need to exceed the ninth-place threshold, which requires either dramatic acceleration in uranium prices, sustained price above the 200W with improving MACD divergence, or a macro shift toward energy scarcity that strengthens faster than current baseline. Until then, this is a watch-list position.
Precious Metals — GLD
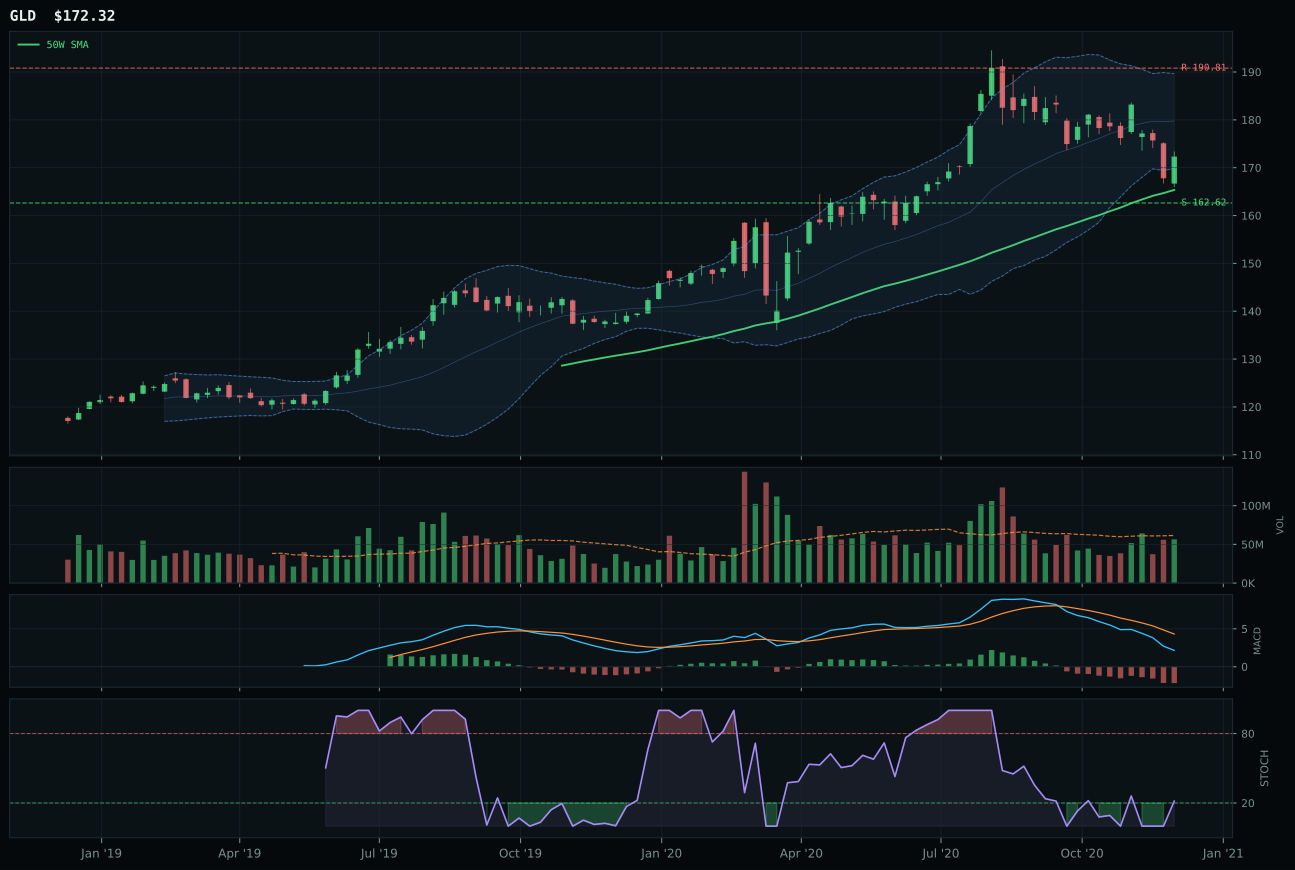
GLD has a neutral structure profile with -13.1% 13-week relative strength versus SPY.
A failed hold above support would weaken the setup.
Actionable but governed by invalidation levels.
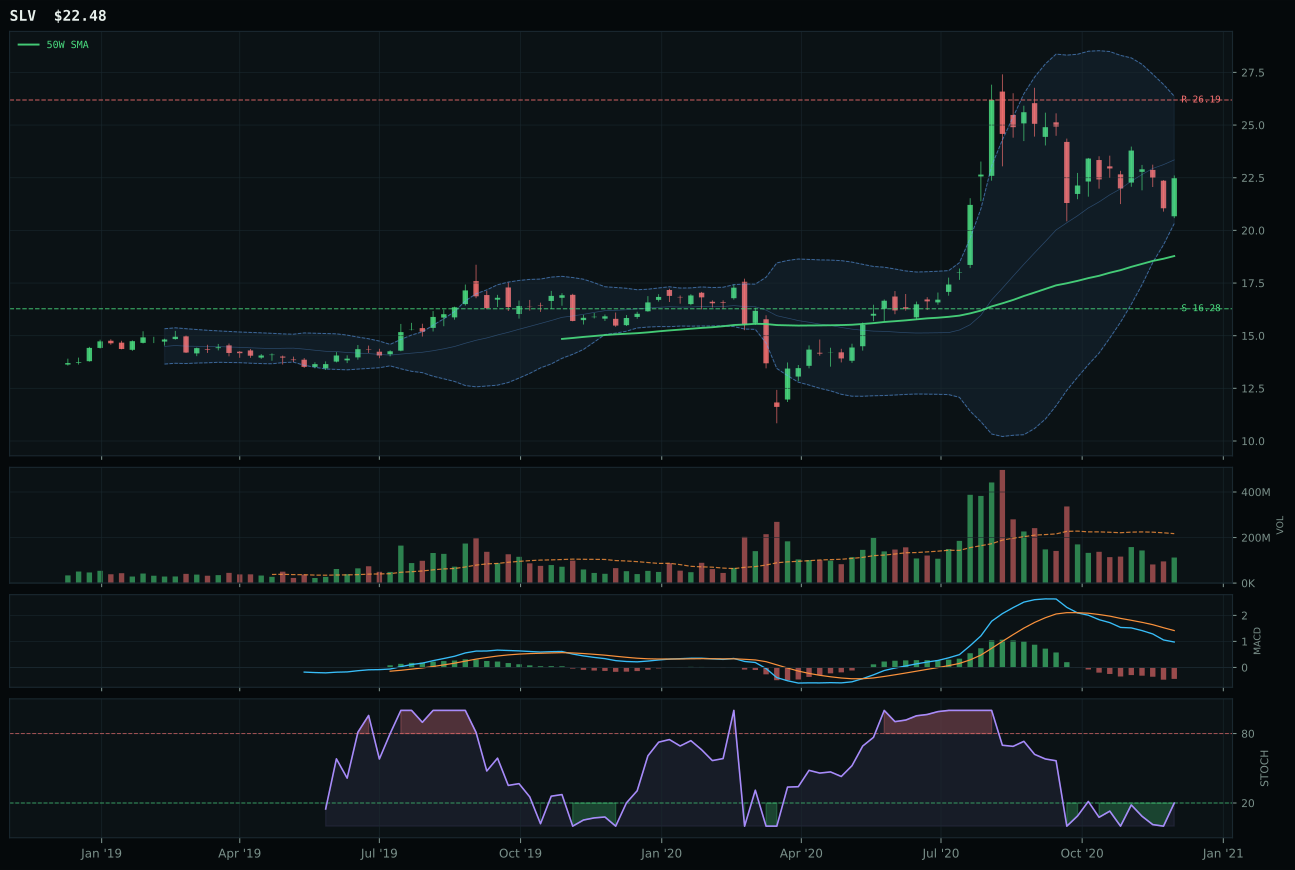
SLV has a vertical extension profile with -18.3% 13-week relative strength versus SPY.
A failed hold above support would weaken the setup.
Actionable but governed by invalidation levels.
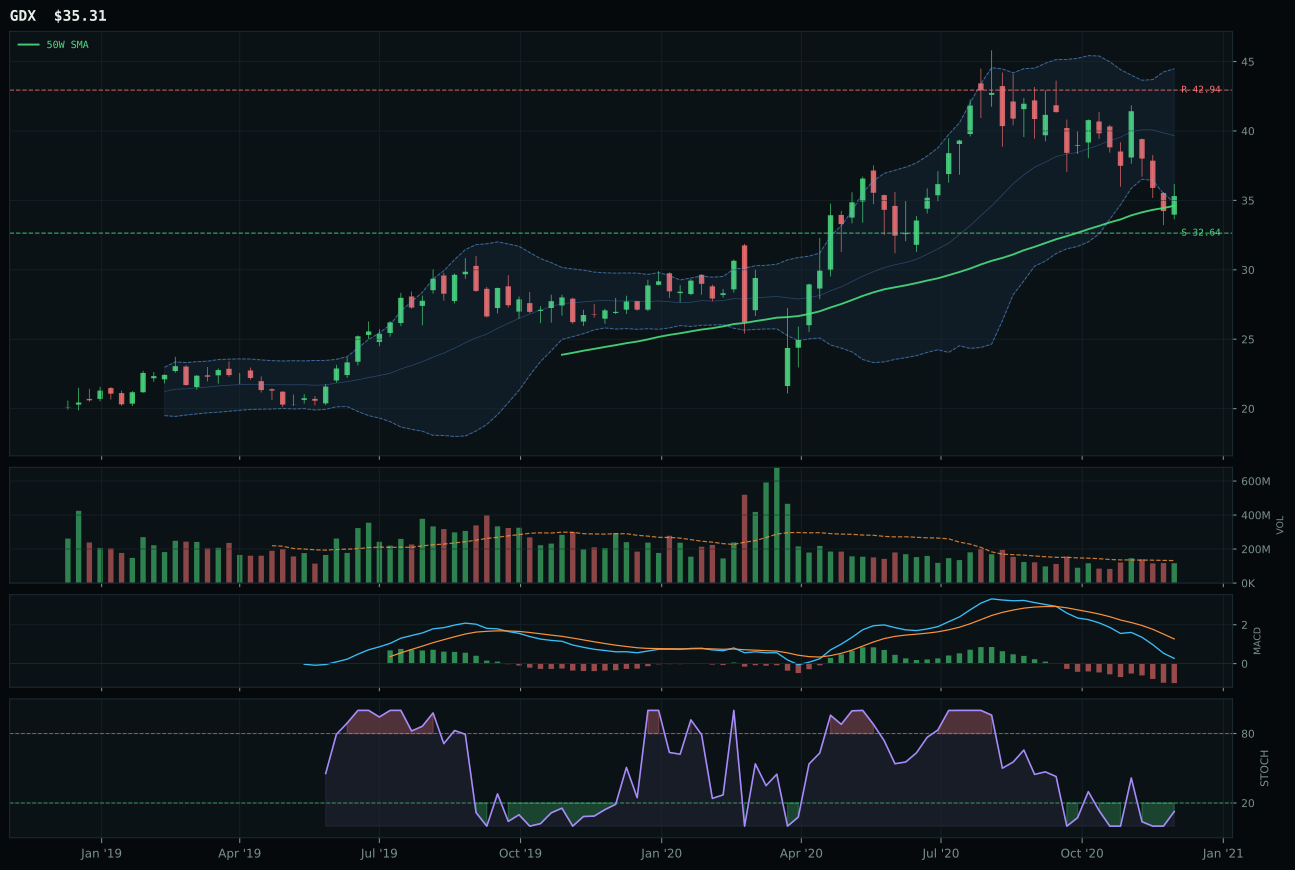
GDX has a neutral structure profile with -21.5% 13-week relative strength versus SPY.
A failed hold above support would weaken the setup.
Actionable but governed by invalidation levels.
GLD wins the category with a 26.4-point lead over SLV, but this is a Pyrrhic victory in a category earning zero allocation: the winner's technical evidence of only 40.9 out of 100 illustrates why precious metals have been excluded entirely. Gold sits 4.2% above its 50W with a neutral structure setup, meaning price proximity to the moving average provides no trend confirmation—it is a knife-edge trade, not a trend. MACD is bearish and weakening, stochastic RSI is rising mid-zone (0.22) rather than overbought, and the thirteen-week return of -5.1% with -13.1% SPY-relative underperformance tell the story: gold is working against the portfolio's active macro regime. SLV underperforms further due to a more stretched position (19.7% above 50W vs GLD's 4.2%), weaker timing (62.0 vs 93.0), and oversold stochastic RSI that is only now turning up, suggesting no near-term acceleration. Neither ETF is accumulating volume; both are fighting a current that favors risk appetite and real assets over monetary hedges.
Precious Metals earns 0% allocation and ranks outside the portfolio entirely this week, a direct consequence of the lowest category-level macro fit at 44.0 out of 100 where active risk appetite works -4 points against this exposure and liquidity expansion works -2 points. GLD's technical evidence of 40.9 is insufficient to overcome the macro headwinds; even with a neutral structure and perfect timing score of 93.0 (price only 4.2% above 50W), the category-wide momentum confirmation of 6.2 reveals that buyers have abandoned gold in favor of real assets and inflation hedges with embedded optionality. The -13.1% SPY-relative return crystallizes the regime mismatch: in a Transition / Mixed environment with risk appetite active, gold reverts to insurance rather than core holding. For Precious Metals to earn a position, the macro regime would need to shift toward credit stress dominance, risk-off acceleration, or explicit deflation signals that revalue the monetary hedge. Until then, the zero allocation is correct; GLD and SLV are waiting for a regime that may not arrive in the near term.